Embed Size (px)
Citation preview
2012 ANNUALREPORT & ACCOUNTS

aaan.0051INSIGHT
Page 32012 ANNUALREPORT & ACCOUNTS
1. Mission Statement 4
2. Corporate Information 6
3. Company Profile 7
4. Notice Of Annual General Meeting 8
5. About Mondelēz International 9
6. Financial Highlights 10
7. Chairman’s Statement 12
8. Board Of Directors And Company Secretary 17
9. 2012 At A Glance 21
10. Directors’ Report 25
11. Report Of The Audit Committee 34
12. Independent Auditor’s Report 35
13. Consolidated And Separate Statements Of Financial Position 38
14. Consolidated And Separate Statements Of Comprehensive Income 40
15. Consolidated Statement Of Changes In Equity 41
16. Separate Statement Of Changes In Equity 43
17. Consolidated And Separate Statements Of Cash Flows 45
18. Notes To The Consolidated And Separate Financial Statements 47
19. Value Added Statements 116
20. Group – Three-Year Financial Summary 117
21. Company – Three-Year Financial Summary 118
22. Distributors’ List 119
23. Shareholders’ Information 120
24. E-Bonus/E-Dividend Form 123
25. Proxy Form 127

Page 4 2012 ANNUALREPORT & ACCOUNTS
OUR MISSION IN CADBURY NIGERIA PLC IS TO
SERVE THE CONSUMER WITH PRODUCTS OF
CONSISTENTLY HIGH QUALITY, MADE READILY
AVAILABLE AT PRICES WHICH OFFER REAL VALUE
FOR THE MONEY SPENT.
IN ITS RELATIONS WITH STAKEHOLDERS AND
BUSINESS ASSOCIATES, THE COMPANY IS
GUIDED BY AN UNWAVERING COMMITMENT TO
THE PURSUIT OF EXCELLENCE AS THE BASIS FOR
CURRENT SUCCESS AND FUTURE GROWTH.

2012 ANNUALREPORT & ACCOUNTS
Page 6 2012 ANNUALREPORT & ACCOUNTS
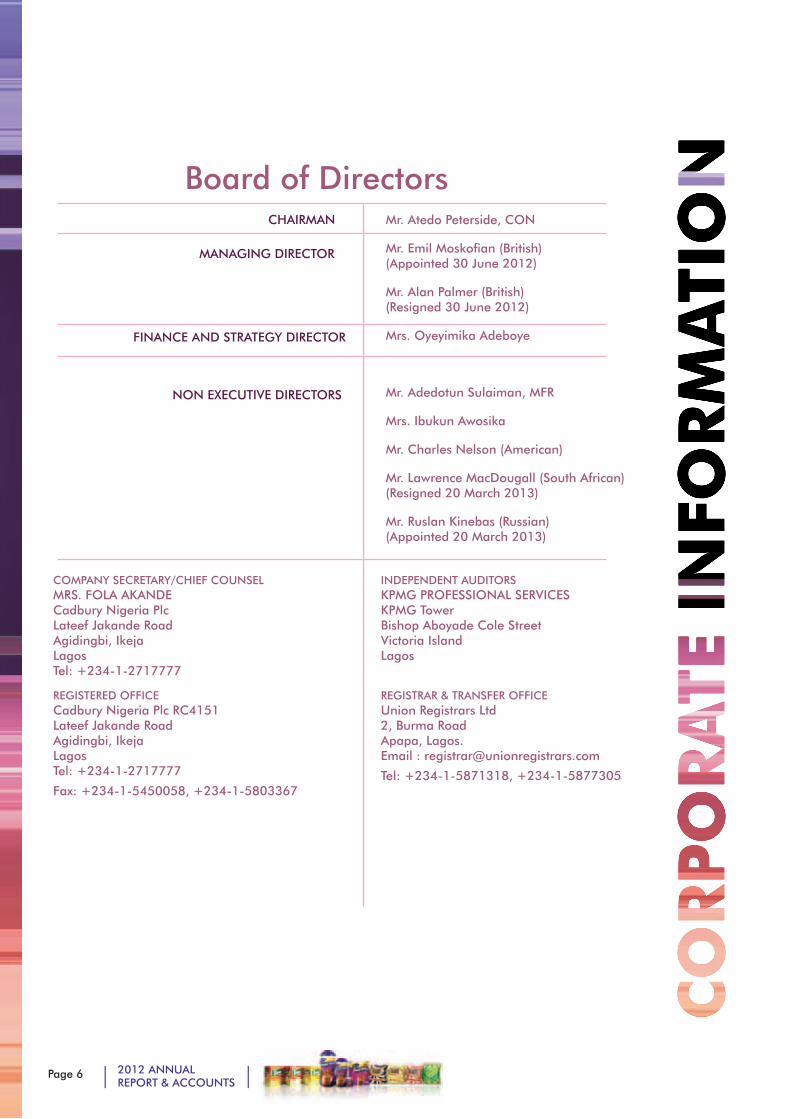
Board of Directors
Mr. Atedo Peterside, CON
Mr. Emil Moskofian (British) (Appointed 30 June 2012)
Mr. Alan Palmer (British) (Resigned 30 June 2012)
Mrs. Oyeyimika Adeboye
Mr. Adedotun Sulaiman, MFR
Mrs. Ibukun Awosika
Mr. Charles Nelson (American)
Mr. Lawrence MacDougall (South African) (Resigned 20 March 2013)
Mr. Ruslan Kinebas (Russian) (Appointed 20 March 2013)
CHAIRMAN
MANAGING DIRECTOR
FINANCE AND STRATEGY DIRECTOR
NON EXECUTIVE DIRECTORS
COMPANY SECRETARY/CHIEF COUNSEL MRS. FOLA AKANDECadbury Nigeria Plc Lateef Jakande Road Agidingbi, Ikeja Lagos Tel: +234-1-2717777
INDEPENDENT AUDITORSKPMG PROFESSIONAL SERVICESKPMG TowerBishop Aboyade Cole StreetVictoria IslandLagos
REGISTERED OFFICE Cadbury Nigeria Plc RC4151 Lateef Jakande Road Agidingbi, Ikeja Lagos Tel: +234-1-2717777
Fax: +234-1-5450058, +234-1-5803367
REGISTRAR & TRANSFER OFFICEUnion Registrars Ltd2, Burma RoadApapa, Lagos.Email : [email protected]
Tel: +234-1-5871318, +234-1-5877305

Page 72012 ANNUALREPORT & ACCOUNTS
The origins of Cadbury Nigeria Plc stretch back to the 1950s when the business was founded as an operation to source cocoa beans from Nigeria and as a precursor to enable the Company’s founders to prospect for opportunities to serve the local consumer market with world famous Cadbury branded products.
In the early 1960s, an initial packing operation was established to re-pack imported bulk products. This packing operation grew rapidly into a fully-fledged manufacturing operation and resulted in the incorporation of Cadbury Nigeria Limited in January 1965. In 1976, the Company became a publicly listed company with shares traded locally on the Nigerian Stock Exchange.
Introduced in 1960, Cadbury BOURNVITA, (the Company’s flagship brand, was initially imported and re-packed on the current 42-hectare site located in Agidingbi, Ikeja. Cadbury BOURNVITA consolidated the Food Drinks market in Nigeria and was the first Food Drink to be locally manufactured in the country. Full local manufacture of BOURNVITA commenced in 1965. BOURNVITA was re-launched in a world class, environmentally-friendly polypropylene jar in 2011 and remains a market leader in the Food Drinks category today.
Following incorporation, the Company developed other product categories most notable of which was Candy. Introduced in 1970, TOMTOM – the
big black and white sweet for soothing relief which has sustained market leadership for over 40 years – remains the most iconic brand in the Nigerian candy market and now comes in three variants: Classic, HoneyLemon and Strawberry. The other brands in the Company’s candy portfolio are TREBOR BUTTERMINT, the delicious sweet with the double pleasure of butter and mint, and HALLS AHOMKA GINGER. In 2012, the Company expanded its product categories when it launched TANG, the global leader in powdered beverages, into the Nigerian market.
Cadbury Nigeria Plc has a 99.66% owned subsidiary located in Ondo State that provides all the cocoa powder required for the manufacturing of Cadbury BOURNVITA. Stanmark Cocoa Processing Company Limited processes cocoa beans into several high quality cocoa by-products (such as cocoa butter, cocoa powder, cocoa cake and cocoa liquor) for local and export markets.
From its initial staff strength of 200 people in 1965, Cadbury Nigeria Plc currently employs more than 1,000 colleagues who have chosen to build their careers with the Company.
Cadbury Nigeria Plc is owned 74.99% by Cadbury Schweppes Overseas Limited, which is itself a wholly owned subsidiary of Mondelēz International. The remaining 24.01% equity ownership of the Company is held by a diverse group of indigenous individual and institutional shareholders.
Page 8 2012 ANNUALREPORT & ACCOUNTS
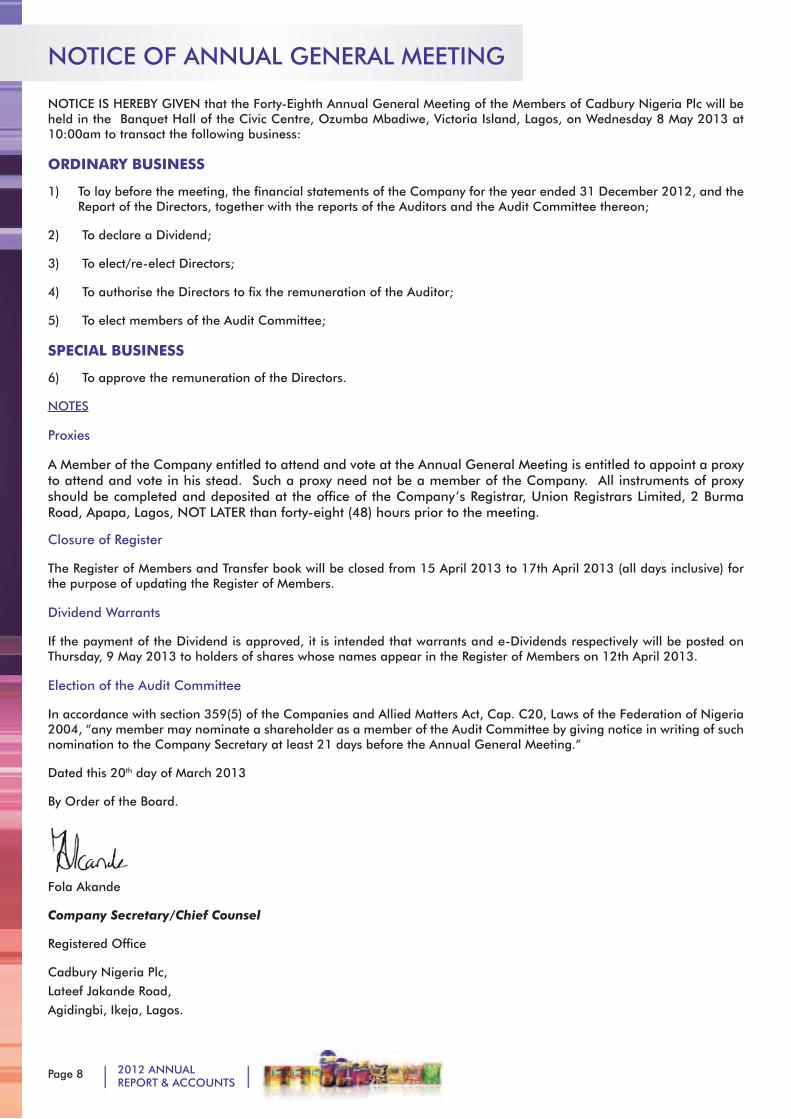
NOTICE OF ANNUAL GENERAL MEETING
NOTICE IS HEREBY GIVEN that the Forty-Eighth Annual General Meeting of the Members of Cadbury Nigeria Plc will be held in the Banquet Hall of the Civic Centre, Ozumba Mbadiwe, Victoria Island, Lagos, on Wednesday 8 May 2013 at 10:00am to transact the following business:
ORDINARY BUSINESS
1) To lay before the meeting, the financial statements of the Company for the year ended 31 December 2012, and the Report of the Directors, together with the reports of the Auditors and the Audit Committee thereon;
2) To declare a Dividend;
3) To elect/re-elect Directors;
4) To authorise the Directors to fix the remuneration of the Auditor;
5) To elect members of the Audit Committee;
SPECIAL BUSINESS
6) To approve the remuneration of the Directors.
NOTES
Proxies
A Member of the Company entitled to attend and vote at the Annual General Meeting is entitled to appoint a proxy to attend and vote in his stead. Such a proxy need not be a member of the Company. All instruments of proxy should be completed and deposited at the office of the Company’s Registrar, Union Registrars Limited, 2 Burma Road, Apapa, Lagos, NOT LATER than forty-eight (48) hours prior to the meeting.
Closure of Register
The Register of Members and Transfer book will be closed from 15 April 2013 to 17th April 2013 (all days inclusive) for the purpose of updating the Register of Members.
Dividend Warrants
If the payment of the Dividend is approved, it is intended that warrants and e-Dividends respectively will be posted on Thursday, 9 May 2013 to holders of shares whose names appear in the Register of Members on 12th April 2013.
Election of the Audit Committee
In accordance with section 359(5) of the Companies and Allied Matters Act, Cap. C20, Laws of the Federation of Nigeria 2004, “any member may nominate a shareholder as a member of the Audit Committee by giving notice in writing of such nomination to the Company Secretary at least 21 days before the Annual General Meeting.”
Dated this 20th day of March 2013
By Order of the Board.
Fola Akande
Company Secretary/Chief Counsel
Registered Office
Cadbury Nigeria Plc,Lateef Jakande Road,Agidingbi, Ikeja, Lagos.

Page 92012 ANNUALREPORT & ACCOUNTS
About Mondelēz InternationalMondelēz International, Inc. is one of the world’s largest snacks companies, with global net revenues of $35.0 billion in 2012. Launched on Oct. 1, 2012, following the spin-off of its North American grocery operations to shareholders, Mondelēz International is a new company in name and strategy, but carries forward the values of its legacy organization and the rich heritage of its iconic brands.
Creating Delicious Moments of Joy
The dream of Mondelēz International is to create delicious moments of joy always. 110,000 employees in 165 countries support this dream by manufacturing and marketing delicious food and beverage products for consumers around the world. The company is the world’s pre-eminent maker of snacks, with leading market shares in every category and every region of the world in which they compete.
Mondelēz International holds the No. 1 position globally in Biscuits, Chocolate, Candy and Powdered Beverages as well as the No. 2 position in Gum and Coffee. About three-quarters of its annual revenue is generated in the fast-growing Biscuits, Chocolate and Gum & Candy categories, and more than 40 percent of sales come from high-growth developing markets.
A Portfolio of the World’s Favourite Brands
Mondelēz International portfolio features nine billion-dollar brands: Cadbury, Cadbury Dairy Milk and Milka chocolate, Jacobs coffee, LU, Nabisco and Oreo biscuits, Tang powdered beverages and Trident gum. In addition, the company’s portfolio includes another 52 brands which each generate annual revenues of more than $100 million. In 2012, its Power Brands, which represent almost 60 percent of total revenue, continued to drive top line performance. These brands grew 8 percent, or nearly twice the growth rate of the total company.
Unique Competitive Advantages
At Mondelēz International, all the ingredients are in place to deliver sustainable, profitable growth: an advantaged geographic footprint with a significant presence in developing markets; large, fast-growing snacks categories; an unrivalled portfolio of beloved Power Brands and proven global innovation platforms; strong routes to market with significant barriers to entry; and world-class talent and capabilities.
Community Involvement
Mondelēz International community involvement includes contributions of more than $1 billion in cash and food for over 25 years. Through the Mondelēz International Foundation, the company is ramping up active play and nutrition education, while ensuring families have access to fresh foods through local agriculture. Other community-based programs that span the globe and drive change are;
• Investing in community programs that encourage kids to get active, learn nutrition basics, prepare healthy snacks and grow fresh foods.
• Focusing efforts in countries to provide the most impact.
• Partnering with local on-the-ground experts with strong knowledge of community needs.
• Inspiring employees to volunteer their time and talents.
For more information, visit www.mondelezinternational.com and www.facebook.com/mondelezinternational.
Page 10 2012 ANNUALREPORT & ACCOUNTS
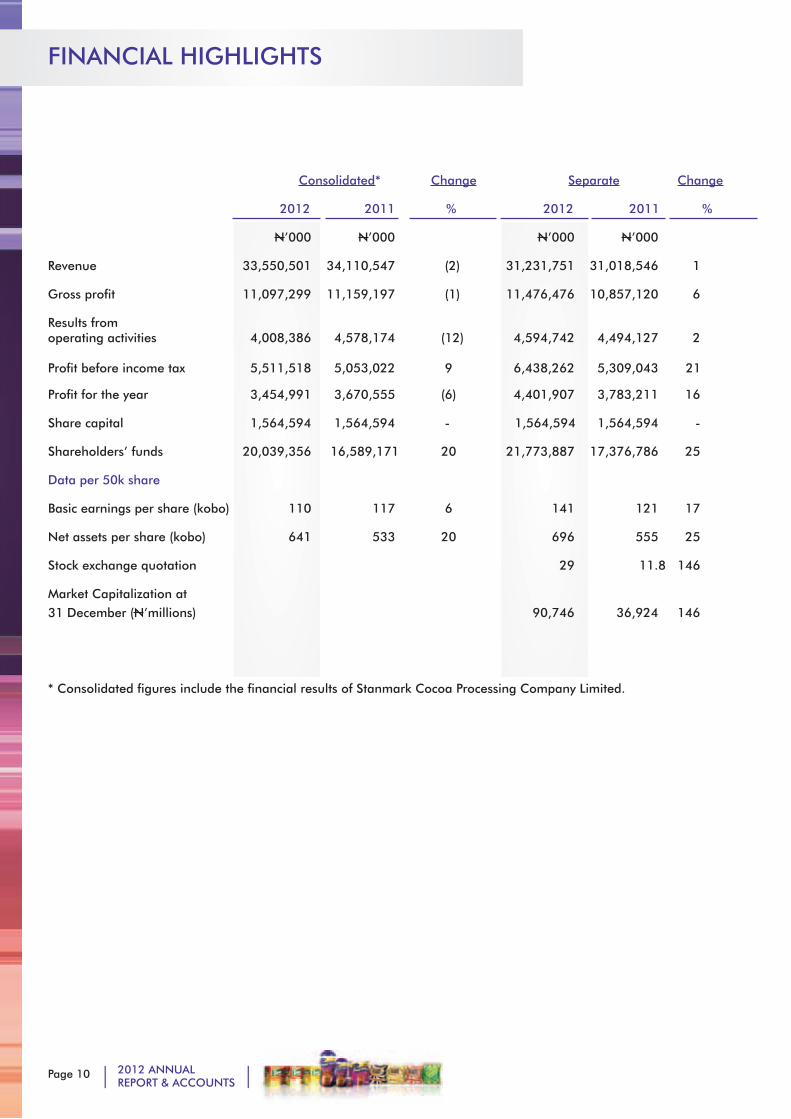
FINANCIAL HIGHLIGHTS
Consolidated* Change Separate Change
2012 2011 % 2012 2011 %
N’000 N’000 N’000 N’000
Revenue 33,550,501 34,110,547 (2) 31,231,751 31,018,546 1
Gross profit 11,097,299 11,159,197 (1) 11,476,476 10,857,120 6
Results fromoperating activities 4,008,386 4,578,174 (12) 4,594,742 4,494,127 2
Profit before income tax 5,511,518 5,053,022 9 6,438,262 5,309,043 21
Profit for the year 3,454,991 3,670,555 (6) 4,401,907 3,783,211 16
Share capital 1,564,594 1,564,594 - 1,564,594 1,564,594 -
Shareholders’ funds 20,039,356 16,589,171 20 21,773,887 17,376,786 25
Data per 50k share
Basic earnings per share (kobo) 110 117 6 141 121 17
Net assets per share (kobo) 641 533 20 696 555 25
Stock exchange quotation 29 11.8 146
Market Capitalization at31 December (N’millions) 90,746 36,924 146
* Consolidated figures include the financial results of Stanmark Cocoa Processing Company Limited.

2012 ANNUALREPORT & ACCOUNTS
CHAIRMAN’S STATEMENT
CHAIRMAN’S STATEMENT
Introduction
Fellow shareholders, distinguished ladies and gentlemen, on behalf of the Board of Directors, I would like to heartily welcome you all to the forty-eighth Annual General Meeting of Cadbury Nigeria Plc and present to you the financial statements and reports of our Company for the financial year ended 31 December 2012, while also reviewing the Company’s performance.
Ending Well, Closing Strong
For Cadbury Nigeria Plc, like the rest of the Nigerian economy, 2012 could easily be seen from two distinct prisms: the beginning and the end. We navigated a slow and tough beginning, occasioned by disruptions of economic activity that marked the commencement of the first quarter and we experienced a concerted powerful effort to end the year strong.
However, at all times in the year, we kept faith with the strategic decisions we had taken to ensure that the Company’s transformation agenda remained on course.
In 2012, the Company delivered higher operating profits despite posting slightly lower topline revenue caused by disruptions across the country
from the first quarter of the year. Despite the slow start to the year, our core brands, Bournvita and TomTom, maintained their leadership of their market segments, being firm national
consumer favourites.
In July 2012, Mr. Alan Palmer, our Managing Director retired from the services of our Company after 38 years of service to Cadbury and he was succeeded by Mr. Emil Moskofian, an experienced executive with over 20 years managerial experience spread across a dozen countries. I am happy
to note that the smooth transition in Executive Management enabled us to simultaneously strengthen our focus on driving sales and
sustaining efficiencies, while ensuring policy compliance at all times as we tried to close out the year with a strong
performance.
I am glad to inform shareholders that the Company’s investments in factory and site infrastructure at the Agidingbi plant has continued at pace and several of the completed projects have yielded multiple benefits and commendations to the Company.
Through A Challenging Year
Several external factors combined to exert significant pressure on our overall business revenue and profitability in 2012. In the forefront among these, were the upheavals and strikes arising from the fuel price increase and oil subsidy issues in the first quarter, sustained security challenges throughout the year, the prevalent high costs of power supply, persistent price fluctuations in the commodities markets with its attendant impact on pricing predictability for our raw material supplies.
The challenges from fluctuations in commodity prices culminated in unabated increases of input
costs, especially from raw materials such as cocoa, dairy and sugar. These huge cost challenges, while driven mainly by the international commodity market, were also exacerbated by a few Government policies and actions.
The year also witnessed our comprehensive route-to-market optimisation program, implementation of which has commenced in selected regions in the
Page 132012 ANNUALREPORT & ACCOUNTS
country. Combined with continuous credit facilitation for our distributors, this ensured our ability to drive our sales and strengthen the position for our brands.
In spite of the general concerns on capacity utilisation in the manufacturing sector, Cadbury Nigeria Plc has continued to drive operational efficiencies and add capacity for our immediate growth requirements. The most immediate impact of these efficiencies is the sustained profitability in 2012 which was the enabler of the Board’s recommendation in respect of the declaration of a dividend to shareholders this year.
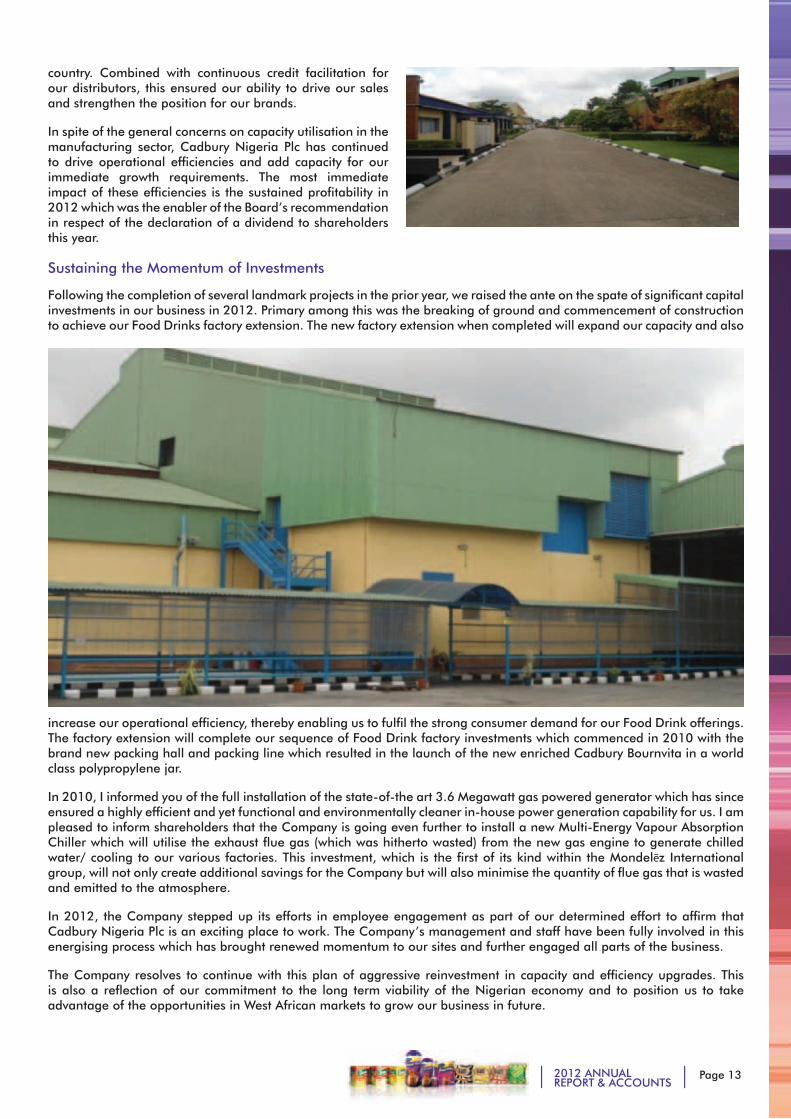
Sustaining the Momentum of Investments
Following the completion of several landmark projects in the prior year, we raised the ante on the spate of significant capital investments in our business in 2012. Primary among this was the breaking of ground and commencement of construction to achieve our Food Drinks factory extension. The new factory extension when completed will expand our capacity and also
increase our operational efficiency, thereby enabling us to fulfil the strong consumer demand for our Food Drink offerings. The factory extension will complete our sequence of Food Drink factory investments which commenced in 2010 with the brand new packing hall and packing line which resulted in the launch of the new enriched Cadbury Bournvita in a world class polypropylene jar.
In 2010, I informed you of the full installation of the state-of-the art 3.6 Megawatt gas powered generator which has since ensured a highly efficient and yet functional and environmentally cleaner in-house power generation capability for us. I am pleased to inform shareholders that the Company is going even further to install a new Multi-Energy Vapour Absorption Chiller which will utilise the exhaust flue gas (which was hitherto wasted) from the new gas engine to generate chilled water/ cooling to our various factories. This investment, which is the first of its kind within the Mondelēz International group, will not only create additional savings for the Company but will also minimise the quantity of flue gas that is wasted and emitted to the atmosphere.
In 2012, the Company stepped up its efforts in employee engagement as part of our determined effort to affirm that Cadbury Nigeria Plc is an exciting place to work. The Company’s management and staff have been fully involved in this energising process which has brought renewed momentum to our sites and further engaged all parts of the business.
The Company resolves to continue with this plan of aggressive reinvestment in capacity and efficiency upgrades. This is also a reflection of our commitment to the long term viability of the Nigerian economy and to position us to take advantage of the opportunities in West African markets to grow our business in future.
Page 14 2012 ANNUALREPORT & ACCOUNTS
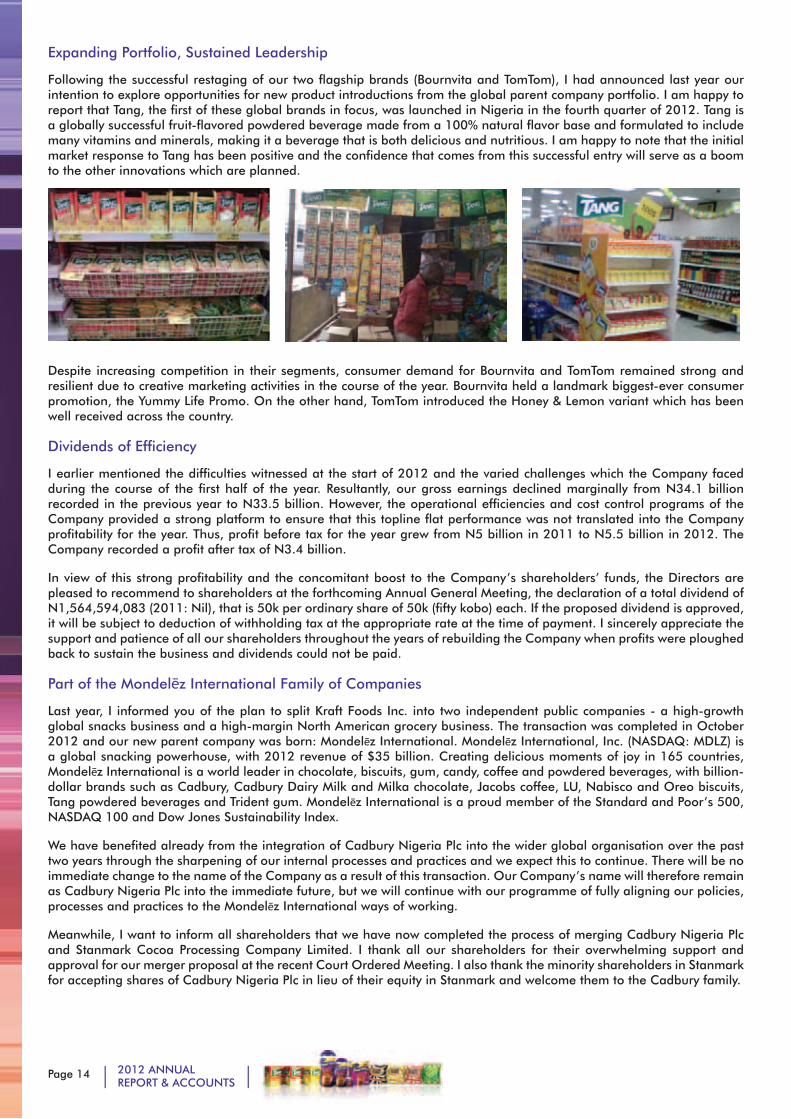
Expanding Portfolio, Sustained Leadership
Following the successful restaging of our two flagship brands (Bournvita and TomTom), I had announced last year our intention to explore opportunities for new product introductions from the global parent company portfolio. I am happy to report that Tang, the first of these global brands in focus, was launched in Nigeria in the fourth quarter of 2012. Tang is a globally successful fruit-flavored powdered beverage made from a 100% natural flavor base and formulated to include many vitamins and minerals, making it a beverage that is both delicious and nutritious. I am happy to note that the initial market response to Tang has been positive and the confidence that comes from this successful entry will serve as a boom to the other innovations which are planned.
Despite increasing competition in their segments, consumer demand for Bournvita and TomTom remained strong and resilient due to creative marketing activities in the course of the year. Bournvita held a landmark biggest-ever consumer promotion, the Yummy Life Promo. On the other hand, TomTom introduced the Honey & Lemon variant which has been well received across the country.
Dividends of Efficiency
I earlier mentioned the difficulties witnessed at the start of 2012 and the varied challenges which the Company faced during the course of the first half of the year. Resultantly, our gross earnings declined marginally from N34.1 billion recorded in the previous year to N33.5 billion. However, the operational efficiencies and cost control programs of the Company provided a strong platform to ensure that this topline flat performance was not translated into the Company profitability for the year. Thus, profit before tax for the year grew from N5 billion in 2011 to N5.5 billion in 2012. The Company recorded a profit after tax of N3.4 billion.
In view of this strong profitability and the concomitant boost to the Company’s shareholders’ funds, the Directors are pleased to recommend to shareholders at the forthcoming Annual General Meeting, the declaration of a total dividend of N1,564,594,083 (2011: Nil), that is 50k per ordinary share of 50k (fifty kobo) each. If the proposed dividend is approved, it will be subject to deduction of withholding tax at the appropriate rate at the time of payment. I sincerely appreciate the support and patience of all our shareholders throughout the years of rebuilding the Company when profits were ploughed back to sustain the business and dividends could not be paid.
Part of the Mondelēz International Family of Companies
Last year, I informed you of the plan to split Kraft Foods Inc. into two independent public companies - a high-growth global snacks business and a high-margin North American grocery business. The transaction was completed in October 2012 and our new parent company was born: Mondelēz International. Mondelēz International, Inc. (NASDAQ: MDLZ) is a global snacking powerhouse, with 2012 revenue of $35 billion. Creating delicious moments of joy in 165 countries, Mondelēz International is a world leader in chocolate, biscuits, gum, candy, coffee and powdered beverages, with billion-dollar brands such as Cadbury, Cadbury Dairy Milk and Milka chocolate, Jacobs coffee, LU, Nabisco and Oreo biscuits, Tang powdered beverages and Trident gum. Mondelēz International is a proud member of the Standard and Poor’s 500, NASDAQ 100 and Dow Jones Sustainability Index.
We have benefited already from the integration of Cadbury Nigeria Plc into the wider global organisation over the past two years through the sharpening of our internal processes and practices and we expect this to continue. There will be no immediate change to the name of the Company as a result of this transaction. Our Company’s name will therefore remain as Cadbury Nigeria Plc into the immediate future, but we will continue with our programme of fully aligning our policies, processes and practices to the Mondelēz International ways of working.
Meanwhile, I want to inform all shareholders that we have now completed the process of merging Cadbury Nigeria Plc and Stanmark Cocoa Processing Company Limited. I thank all our shareholders for their overwhelming support and approval for our merger proposal at the recent Court Ordered Meeting. I also thank the minority shareholders in Stanmark for accepting shares of Cadbury Nigeria Plc in lieu of their equity in Stanmark and welcome them to the Cadbury family.
Page 152012 ANNUALREPORT & ACCOUNTS
Unclaimed Dividend
Last year, I spoke about the significant unclaimed dividends due to our shareholders. Regrettably, this situation still subsists in our 2012 financial statements. I would like to repeat my earlier call on our shareholders to complete the e-dividend/e-bonus data update form that is attached to the back of the Annual Report to provide further data on themselves. Once completed, please detach the form and submit it to the Registrar either at the venue of the Annual General Meeting (AGM) or to their offices. This will assist the Registrar to facilitate the effective distribution of the unclaimed dividend fund and reduce this huge outstanding.
I hope that most of you have heeded my earlier calls to open bank accounts, stock broking accounts and Central Securities Clearing Systems accounts, all of which are required for any e-dividend and e-bonus which may be declared in future. As usual, the Registrars are available after the AGM or at their offices to offer appropriate advice to shareholders on any of these issues.
Governance, Ethics & Compliance
The Company remains committed to the principles of good governance and to high standards of business integrity, ethics and professionalism in every aspect of its operations. We have placed an enormous emphasis on Governance at the Board level and consistently embedded processes and policies to ensure full awareness by all our employees in this respect such that our employees become ambassadors for the high standards of ethics we require in our business.
Our employees are regularly exposed to classroom and online training on core and general policies (whether the policies are local or global) including weekly pep talks facilitated by randomly selected colleagues.
It is my pleasure to inform shareholders that in October 2012, Cadbury Nigeria Plc got its first ever GOOD rating in a multi-scope audit of our controls and compliance processes for the one year period between July 2011 and June 2012. The audit review was undertaken by international auditors from our parent company, Mondelēz International.
Strategic Priorities for 2013
The Company ended the year under review on a very strong footing and remains committed to sustaining the current transformation of our business. Our focus on delivering sustainable growth, efficiency and capability will remain the platforms through which we deliver increasing shareholder value in 2013. Our new route-to-market infrastructure, an expanded portfolio of strong brands and our passionate engaged workforce will be our vehicles for creating delicious moments of joy for our consumers and diverse stakeholder publics. The following constitute the Company’s strategic priorities in 2013:
• To invest in the equity of our brands especially Bournvita, TomTom and Tang.
• To speed up our innovation pipeline and bring fresh new and exciting consumer brands to Nigerian consumers.
• To scale up our Route-To-Market transformation program.
• To sustain our focus on quality, drive improvements in productivity and reinforce our operational efficiencies to maximise our competitive advantage.
• To build a strong sustainable business and develop an organisation of high potential talent.
Conclusion
Let me conclude by congratulating the Executive Leadership team led by Mr. Emil Moskofian for their hard work and commitment in delivering a credible bottom-line performance for the Company despite the tough start to the year. I also extend similar congratulations to our employees for their continued dedication and commitment.
Our special thanks go to the regional and global leadership teams of Mondelēz International, Cadbury Nigeria Plc’s ultimate parent company, for their continued support for the resurgence and transformation of Cadbury Nigeria Plc.
Finally, on behalf of your Board, let me express my appreciation to you, fellow shareholders, for your resolute support, sustained patience and continued confidence in the Company.
Atedo N.A. Peterside, CON

2012 ANNUALREPORT & ACCOUNTS
BOARD OF DIRECTORS AND COMPANY SECRETARY

Page 172012 ANNUALREPORT & ACCOUNTS
Atedo N A Peterside, CON joined the
Board of Cadbury Nigeria Plc as a
Non-Executive Director on 5 August
2009. He was appointed Chairman
of the Board with effect from 21
April 2010. He is the Founder and a
Non-Executive Chairman of Stanbic
IBTC Bank Plc and also the President
and Founder of ANAP Foundation,
which is a non-profit organisation
that is committed to promoting good
governance.
Mr Peterside is a Member of the
National Council on Privatisation
(NCP) and is the Chairman of the
NCP’s Technical Committee. He is a
member of the National Economic
Management Team which is headed by
the President of the Federal Republic of
Nigeria. Mr. Peterside also sits on the
Boards of the following publicly quoted
companies - Flour Mills of Nigeria PLC,
Nigerian Breweries Plc, Presco Plc and
Unilever Nigeria Plc.
Emil Moskofian was appointed to the
Board of Cadbury Nigeria Plc as the
Managing Director on 1 July 2012. He
also serves as Managing Director for
Cadbury West Africa and Chairman of
Cadbury Ghana Limited.He has over
20 years of international experience
leading businesses with British
American Tobacco. Prior to becoming
Managing Director for Cadbury
Nigeria Plc, he served as the Regional
Managing Director Africa and Turkey
IFFCO, UAE from 2010 to 2011.
Atedo N A Peterside, CON Chairman
Emil MoskofianManaging Director
BOA
RD O
F D
IREC
TORS
A
ND
CO
MPA
NY
SEC
RETA
RY

Page 18 2012 ANNUALREPORT & ACCOUNTS
Ibukun Awosika was appointed to
the Board of Cadbury Nigeria Plc.
as a Non-Executive Director on 22
October 2009. Mrs. Awosika is the
founder and CEO of The Chair Centre
Group. The companies in the group
include The Chair Centre Limited,
Sokoa Chair Centre Limited, Furniture
Manufacturers Mart Limited, and TCC
Systems and Services Limited and are
involved in furniture manufacturing,
retail and bank-way security systems
services.
Mrs Awosika also serves on a number
of corporate and not for profit boards
amongst which are: First Bank of
Nigeria Plc, Convention on Business
Integrity (CBI), Nigerian Sovereign
Investment Authority; she also chairs
the boards of FBN Life Assurance
Plc, and After School Graduate
Development Centre (AGDC), a facility
which she promoted to help address
youth employability and enterprise
issues in Nigeria.
Mrs Awosika is a graduate of Chemistry
from University of Ife-Nigeria, an
alumnae of the Chief Executive
Programme of Lagos Business School,
and the Global Executive MBA of IESE
Business School, Barcelona-Spain.
Charles Nelson was appointed to the
Board of Cadbury Nigeria Plc. as a Non-
Executive Director on 15 September
2010. Mr. Nelson, an American with
over 20 years experience in Corporate
Finance, joined Kraft Foods Inc. in 1988
and has held a succession of senior
finance roles across the Kraft Group
including Finance Director, Kraft Foods
South East Asia and Financial Planning
& Analysis Manager, Kraft Jacobs
Suchard Iberia. Mr. Nelson is currently
the Director of Financial Planning &
Analysis, Controlling & Treasury, Kraft
Foods Middle East & Africa (MEA) and
is based in Vienna, Austria.
Oyeyimika Adeboye joined the Board
of Cadbury Nigeria Plc. as Finance
and Strategy Director on 30 November
2008. Prior to joining the Board, Mrs.
Adeboye was the Chief Financial
Officer and Director of Finance at
another publicly quoted Food and
Beverage Company in Nigeria. She
had previously worked for two firms
of Chartered Accountants and has
an impressive track record in finance,
strategy and administration both in
Nigeria and the UK.
Mrs. Adeboye is also a member of the
Boards of Stanmark Cocoa Processing
Company Limited and Cadbury Ghana
Limited. She also sits on the Boards of
two charities in Nigeria.
Ibukun AwosikaNon-Executive Director
Charles NelsonNon-Executive Director
Oyeyimika AdeboyeFinance and Strategy Director
BOARD OF DIRECTORS AND COMPANY SECRETARY (CONTINUED)

Page 192012 ANNUALREPORT & ACCOUNTS
Adedotun Sulaiman, MFR was
appointed to the Board of Cadbury
Nigeria Plc. as a Non-Executive
Director on 5 August 2009. Mr.
Sulaiman, a renowned management &
strategy consultant, has over 30 years
of experience in transformational
engagements in Strategic Plan
Development, Organization
Design/Review, Human Resource
Management, Technology Planning
and Process Re-engineering. Mr.
Sulaiman, a past Country Managing
Director and Chairman of Accenture
Nigeria, is currently Chairman of
several companies and not-for-profit
organisations including Cornerstone
Insurance Plc, Mouka Ltd, SecureID
Ltd, Interswitch Ltd, Arian Capital
Management Ltd, Helios Towers
Nigeria Limited, Corona Schools Trust
Council and Youth Business Initiative.
Lawrence MacDougall was appointed
a Non-Executive Director on 15
September 2007. Mr. MacDougall was
the former President of the Middle East
and Africa Business Unit of Cadbury
Plc. and former Managing Director of
Cadbury South Africa. Presently, he
is the Regional President of Mondelēz
International EEMEA (Eastern Europe
Middle East and Africa) region. He
served as Chairman of the Board of
Directors of Cadbury Nigeria Plc. until
his resignation from the position on 20
April 2010 but remained on the Board
as a Non-Executive Director of the
Company. Lawrence resigned from the
Board of Cadbury Nigeria Plc. effective
20 March 2013.
Ruslan Kinebas was appointed as a
Non-Executive Director on 20 March
2013. Mr. Kinebas joined Kraft Foods
Inc. in 2010 with acquisition of Cadbury
Plc. He was appointed Area VP for
North Africa, West Africa and Turkey
in February 2013, taking responsibility
for this newly created geographic
growth cluster within EEMEA region of
Mondelēz International. Mr. Kinebas
spent the previous year and a half
in Zurich, leading the Cheese and
Grocery Business Unit in Mondelēz
Europe as Category President. Prior
to that, he was VP Sales, Snacking,
supporting the work of the Snacking
Venture Team. In 2010-11, as VP
and Area Director for South Eastern
Europe, based in Vienna, Mr. Kinebas
led iconic Kraft businesses in the
nine countries of the Area through a
tough economic environment, back to
growth.
BOARD OF DIRECTORS AND COMPANY SECRETARY (CONTINUED)
Adedotun Sulaiman, MFRNon-Executive Director
Lawrence MacDougallNon-Executive Director
Ruslan Kinebas Non-Executive Director
Page 20 2012 ANNUALREPORT & ACCOUNTS
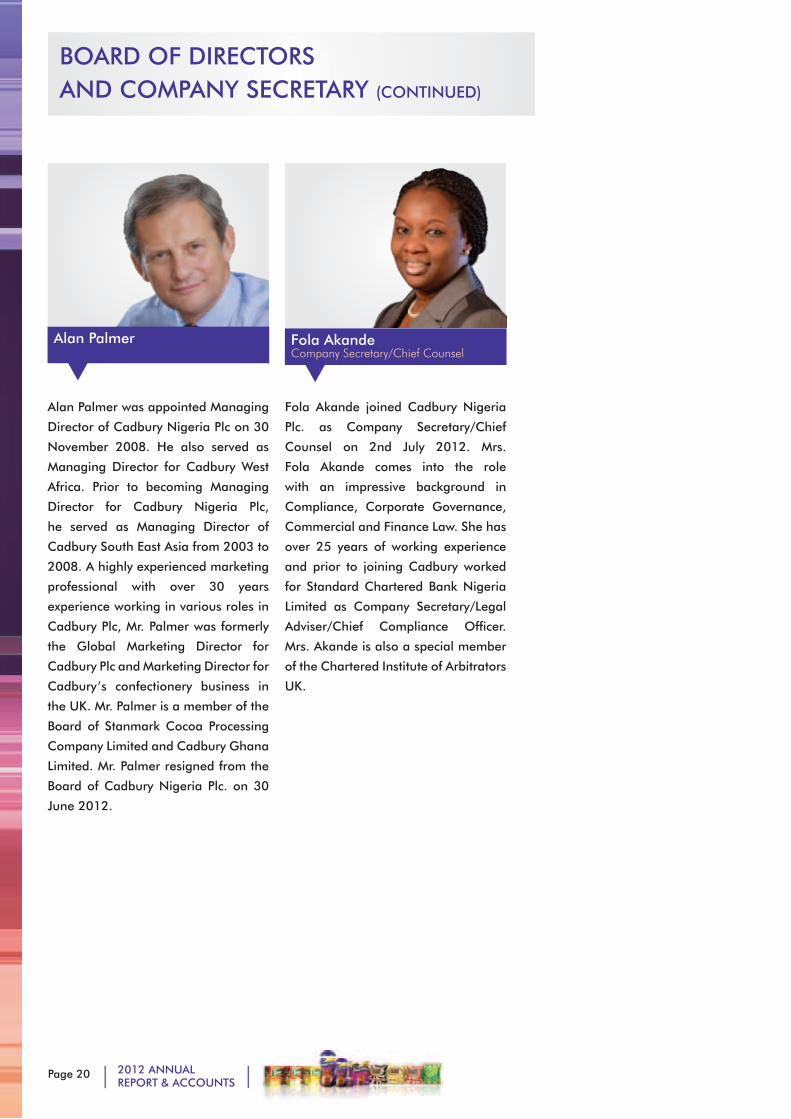
Alan Palmer was appointed Managing
Director of Cadbury Nigeria Plc on 30
November 2008. He also served as
Managing Director for Cadbury West
Africa. Prior to becoming Managing
Director for Cadbury Nigeria Plc,
he served as Managing Director of
Cadbury South East Asia from 2003 to
2008. A highly experienced marketing
professional with over 30 years
experience working in various roles in
Cadbury Plc, Mr. Palmer was formerly
the Global Marketing Director for
Cadbury Plc and Marketing Director for
Cadbury’s confectionery business in
the UK. Mr. Palmer is a member of the
Board of Stanmark Cocoa Processing
Company Limited and Cadbury Ghana
Limited. Mr. Palmer resigned from the
Board of Cadbury Nigeria Plc. on 30
June 2012.
Fola Akande joined Cadbury Nigeria
Plc. as Company Secretary/Chief
Counsel on 2nd July 2012. Mrs.
Fola Akande comes into the role
with an impressive background in
Compliance, Corporate Governance,
Commercial and Finance Law. She has
over 25 years of working experience
and prior to joining Cadbury worked
for Standard Chartered Bank Nigeria
Limited as Company Secretary/Legal
Adviser/Chief Compliance Officer.
Mrs. Akande is also a special member
of the Chartered Institute of Arbitrators
UK.
BOARD OF DIRECTORS AND COMPANY SECRETARY (CONTINUED)
Alan Palmer Fola AkandeCompany Secretary/Chief Counsel
Page 212012 ANNUALREPORT & ACCOUNTS
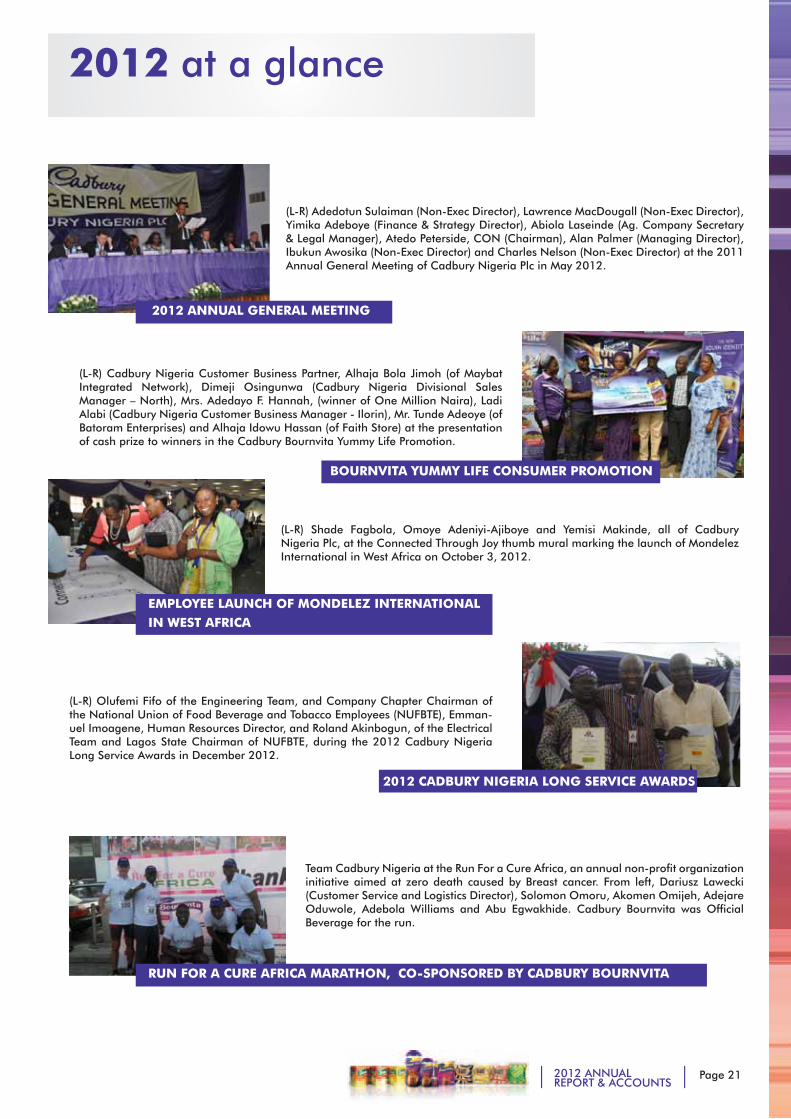
(L-R) Adedotun Sulaiman (Non-Exec Director), Lawrence MacDougall (Non-Exec Director), Yimika Adeboye (Finance & Strategy Director), Abiola Laseinde (Ag. Company Secretary & Legal Manager), Atedo Peterside, CON (Chairman), Alan Palmer (Managing Director), Ibukun Awosika (Non-Exec Director) and Charles Nelson (Non-Exec Director) at the 2011 Annual General Meeting of Cadbury Nigeria Plc in May 2012.
(L-R) Cadbury Nigeria Customer Business Partner, Alhaja Bola Jimoh (of Maybat Integrated Network), Dimeji Osingunwa (Cadbury Nigeria Divisional Sales Manager – North), Mrs. Adedayo F. Hannah, (winner of One Million Naira), Ladi Alabi (Cadbury Nigeria Customer Business Manager - Ilorin), Mr. Tunde Adeoye (of Batoram Enterprises) and Alhaja Idowu Hassan (of Faith Store) at the presentation of cash prize to winners in the Cadbury Bournvita Yummy Life Promotion.
BOURNVITA YUMMY LIFE CONSUMER PROMOTION
(L-R) Shade Fagbola, Omoye Adeniyi-Ajiboye and Yemisi Makinde, all of Cadbury Nigeria Plc, at the Connected Through Joy thumb mural marking the launch of Mondelez International in West Africa on October 3, 2012.
(L-R) Olufemi Fifo of the Engineering Team, and Company Chapter Chairman of the National Union of Food Beverage and Tobacco Employees (NUFBTE), Emman-uel Imoagene, Human Resources Director, and Roland Akinbogun, of the Electrical Team and Lagos State Chairman of NUFBTE, during the 2012 Cadbury Nigeria Long Service Awards in December 2012.
Team Cadbury Nigeria at the Run For a Cure Africa, an annual non-profit organization initiative aimed at zero death caused by Breast cancer. From left, Dariusz Lawecki (Customer Service and Logistics Director), Solomon Omoru, Akomen Omijeh, Adejare Oduwole, Adebola Williams and Abu Egwakhide. Cadbury Bournvita was Official Beverage for the run.
2012 at a glance
2012 ANNUAL GENERAL MEETING
EMPLOYEE LAUNCH OF MONDELEZ INTERNATIONAL IN WEST AFRICA
2012 CADBURY NIGERIA LONG SERVICE AWARDS
RUN FOR A CURE AFRICA MARATHON, CO-SPONSORED BY CADBURY BOURNVITA

Page 22 2012 ANNUALREPORT & ACCOUNTS
Nasir Malik, Integrated Supply Chain Director, takes the first dig during the ground breaking ceremony for the new Food Drinks Factory extension in Cadbury Nigeria Plc.
Employees of manufacturing and commercial teams of Cadbury Nigeria gather together to cut a cake in celebration of the “Good” rating received by Cadbury Nigeria Plc from the Mondelez International Multi-scope Au-dit.
Muslim faithfuls receive nourishing cups of Cadbury Bournvita at the end of a day’s fast during the 2012 Ramadan period.
Olabisi Oyekunle of the Candy Team (r), first winner of the new Manag-ing Director’s Special Recognition Award receives his certificate from Emil Moskofian, Managing Director Cadbury Nigeria Plc.
Emil Moskofian, Managing Director Cadbury Nigeria Plc addresses staff at his first all-colleague town hall meeting.
CONSTRUCTION OF NEW FOOD DRINKS FACTORY EXTENSION
CELEBRATING THE “GOOD” AUDIT RATING FROM MONDELEZ INTERNATIONAL
BOURNVITA RAMADAN ACTIVATION
MANAGING DIRECTOR’S SPECIAL RECOGNITION AWARDS
ALL-COLLEAGUE TOWN HALL MEETING
2012 at a glance

Page 232012 ANNUALREPORT & ACCOUNTS
A group photograph of all marketing agencies and members of the marketing team, during the 2012 Marketing partners conference in Cadbury Nigeria Plc
Kufre Ekanem, Corporate Affairs Manager, (r) welcomes Dr. Joseph Odumodu, Direc-tor General of the Standards Organization of Nigeria (SON) during the courtesy visit/factory tour of Cadbury Nigeria Plc.
(L-R) Abiola Laseinde, Legal Counsel, Adedotun Sulaiman (Non-Exec Director), Yimika Adeboye (Finance & Strategy Director), Atedo Peterside, CON (Chair-man), Alan Palmer, former Managing Director, Ibukun Awosika (Non-Exec Direc-tor), High Chief (Dr.) Bayo Akinnola, MFR, the Lisa of Ondo Kingdom and Emil Moskofian, Managing Director, during the send forth for Alan Palmer.
(L-R) Paul Udochi, Sales Director, Cadbury Nigeria Plc., Mrs. C. O. Bashiru, Managing Director, Tinuola Stores Ltd. and Alan Palmer, former Managing Director, Cadbury Nigeria Plc, during the trade launch of TomTom HoneyLemon.
ALL-MARKETING AGENCY MARKETING CONFERENCE
DIRECTOR GENERAL, STANDARD ORGANISATION OF NIGERIA VISITS CADBURY NIGERIA
SAYING FAREWELL TO ALAN PALMER
TOMTOM HONEYLEMON TRADE LAUNCH
2012 at a glance

2012 ANNUALREPORT & ACCOUNTS
DIRECTORS’ REPORT
Page 252012 ANNUALREPORT & ACCOUNTS
DIRECTORS’ REPORT For the year ended 31 December 2012
The Directors are pleased to present to the members their Annual Report together with the audited consolidated and separate financial statements for the year ended 31 December 2012.
Directors’ Responsibilities
The Directors accept responsibility for the preparation of the annual consolidated and separate financial statements set out on pages 38 to 115 that give a true and fair view in accordance with the International Financial Reporting Standards (IFRS) and in the manner required by the Companies and Allied Matters Act of Nigeria and the Financial Reporting Council of Nigeria Act, 2011.
The Directors further accept responsibility for maintaining adequate accounting records as required by the Companies and Allied Matters Act of Nigeria and for such internal control as the Directors determine is necessary to enable the preparation of financial statements that are free from material misstatement whether due to fraud or error.
The Directors have made an assessment of the Company’s ability to continue as a going concern and have no reason to believe the Company will not remain a going concern for at least twelve months from the date of this statement.
Principal Activities
Cadbury Nigeria Plc was incorporated in Nigeria on 9 January 1965 as a Company limited by shares. It became a publicly listed Company with its shares traded locally on the Nigerian Stock Exchange in 1976. The Company’s registered address is Lateef Jakande Road Agidingbi Ikeja. The Company is principally engaged in the manufacture and sale of branded fast moving consumer goods mostly to the Nigerian market, but increasingly for exports in West Africa.
The Product Range
The Company’s brands fall into two principal categories, namely Food Drinks and Confectionery. CADBURY
BOURNVITA and TANG are the main Food Drinks brand while TOMTOM, TOMTOM HONEY LEMON, AHOMKA GINGER and BUTTERMINT are the main brands in the Confectionery stable. The relative contribution to Group results of the Company’s brands in 2012 was 93% (2011: 91%) in terms of sales value.
During the year the Company launched two new products, TANG and Tom Tom Honey Lemon. These new products fall under the Food Drinks and Confectionery categories respectively.
Stanmark Cocoa Processing Company Limited (“SCPCL”) a subsidiary located in Ondo State, produces a range of intermediate products such as cocoa butter, liquor and powder. The cocoa butter and liquor are exported to a wide range of international customers; the cocoa powder is consumed locally. Cadbury Nigeria Plc’s entire cocoa powder requirement is sourced from SCPCL. SCPCL accounted for 7% (2011: 9%) of the Group revenue.
Subsequent to the year end, the Board of Directors of Cadbury Nigeria Plc and Stanmark Cocoa Processing Company Limited proposed and agreed to the merger of both companies. The shareholders of the two companies unanimously agreed to the merger at court ordered meetings held simultaneously on 30 January 2013.
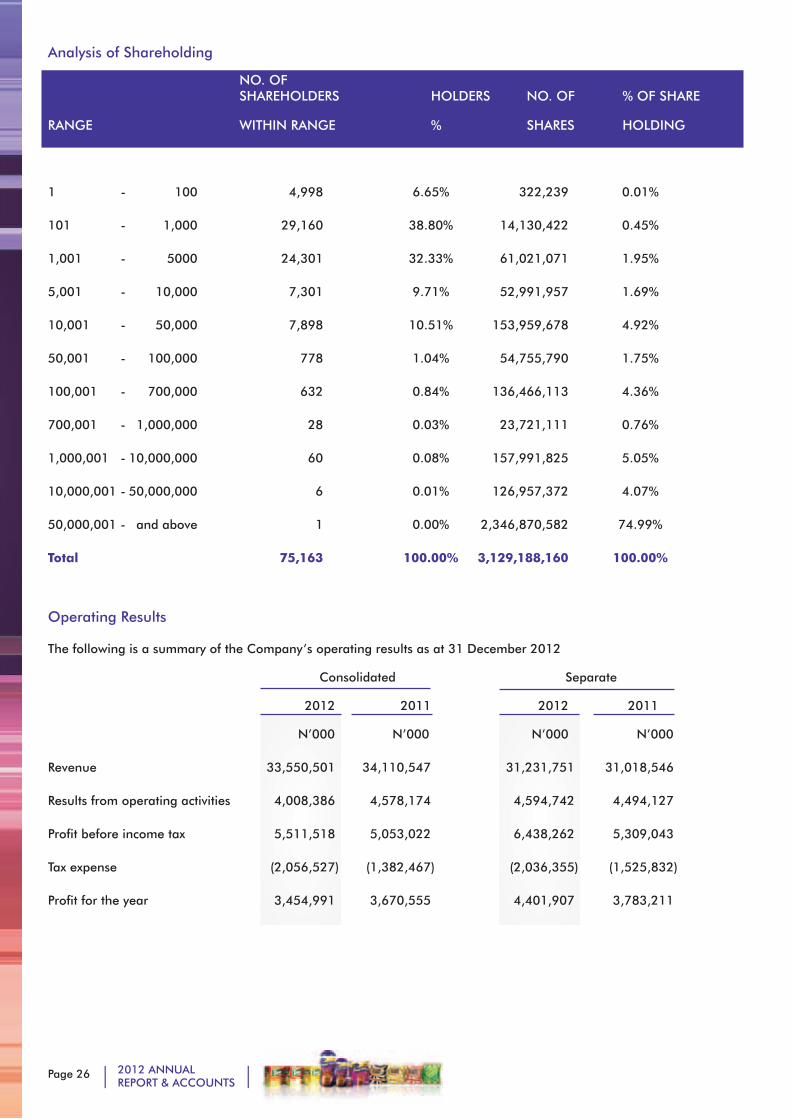
Shareholding
Cadbury Nigeria Plc is owned 74.99% (2011: 74.99%) by Cadbury Schweppes Overseas Limited (“CSOL”), incorporated in the United Kingdom while CSOL is owned by Mondelēz International (formerly Kraft Foods Inc,) and 25.01% (2011: 25.01%) by a highly diversified spread of Nigerian individuals and institutional shareholders. Other than CSOL, no other shareholder held more than 5% of the issued share capital of the Company as at 31 December 2012 (2011: Nil).
The Registrars have advised that the range of shareholding
as at 31 December 2012 was as follows:
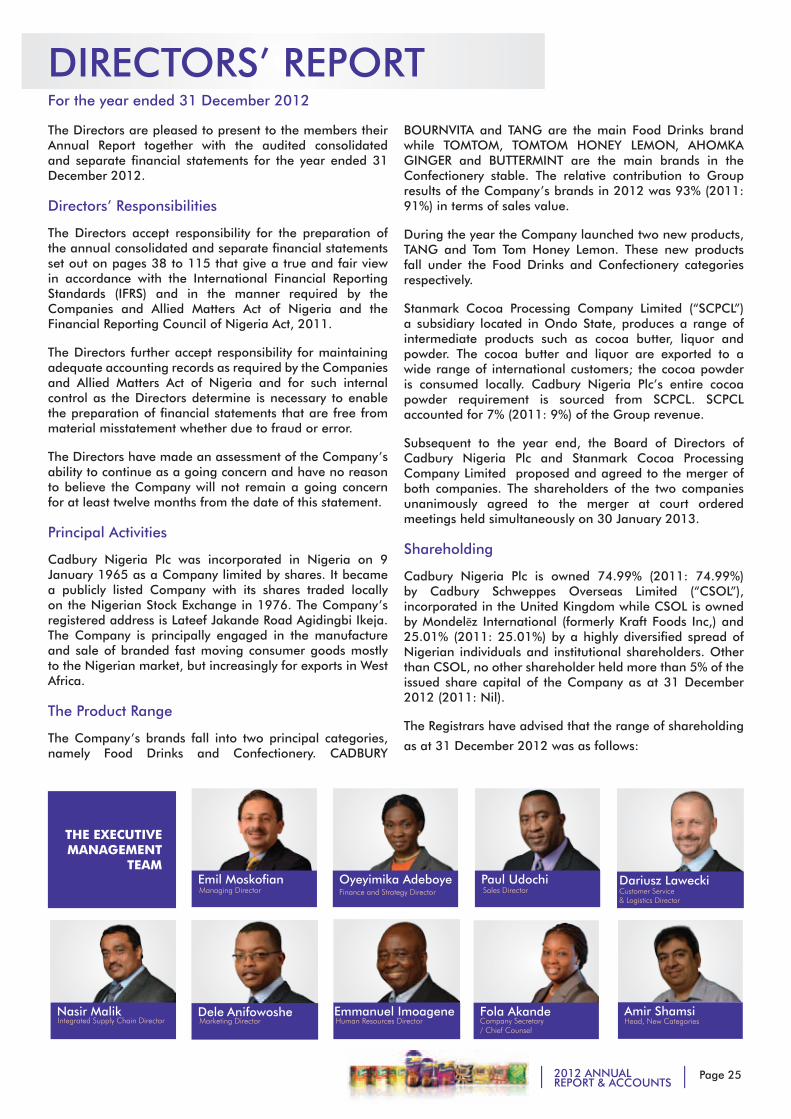
Emil MoskofianManaging Director
Paul UdochiSales Director
Dariusz LaweckiCustomer Service & Logistics Director
Amir ShamsiHead, New Categories
Nasir MalikIntegrated Supply Chain Director
Dele AnifowosheMarketing Director
Emmanuel ImoageneHuman Resources Director
Fola AkandeCompany Secretary / Chief Counsel
Oyeyimika AdeboyeFinance and Strategy Director
THE EXECUTIVE MANAGEMENT
TEAM
Page 26 2012 ANNUALREPORT & ACCOUNTS
Analysis of Shareholding
NO. OF SHAREHOLDERS HOLDERS NO. OF % OF SHARE
RANGE WITHIN RANGE % SHARES HOLDING
1 - 100 4,998 6.65% 322,239 0.01%
101 - 1,000 29,160 38.80% 14,130,422 0.45%
1,001 - 5000 24,301 32.33% 61,021,071 1.95%
5,001 - 10,000 7,301 9.71% 52,991,957 1.69%
10,001 - 50,000 7,898 10.51% 153,959,678 4.92%
50,001 - 100,000 778 1.04% 54,755,790 1.75%
100,001 - 700,000 632 0.84% 136,466,113 4.36%
700,001 - 1,000,000 28 0.03% 23,721,111 0.76%
1,000,001 - 10,000,000 60 0.08% 157,991,825 5.05%
10,000,001 - 50,000,000 6 0.01% 126,957,372 4.07%
50,000,001 - and above 1 0.00% 2,346,870,582 74.99%
Total 75,163 100.00% 3,129,188,160 100.00%
Operating Results
The following is a summary of the Company’s operating results as at 31 December 2012
Consolidated Separate
2012 2011 2012 2011
N’000 N’000 N’000 N’000
Revenue 33,550,501 34,110,547 31,231,751 31,018,546
Results from operating activities 4,008,386 4,578,174 4,594,742 4,494,127
Profit before income tax 5,511,518 5,053,022 6,438,262 5,309,043
Tax expense (2,056,527) (1,382,467) (2,036,355) (1,525,832)
Profit for the year 3,454,991 3,670,555 4,401,907 3,783,211
Page 272012 ANNUALREPORT & ACCOUNTS
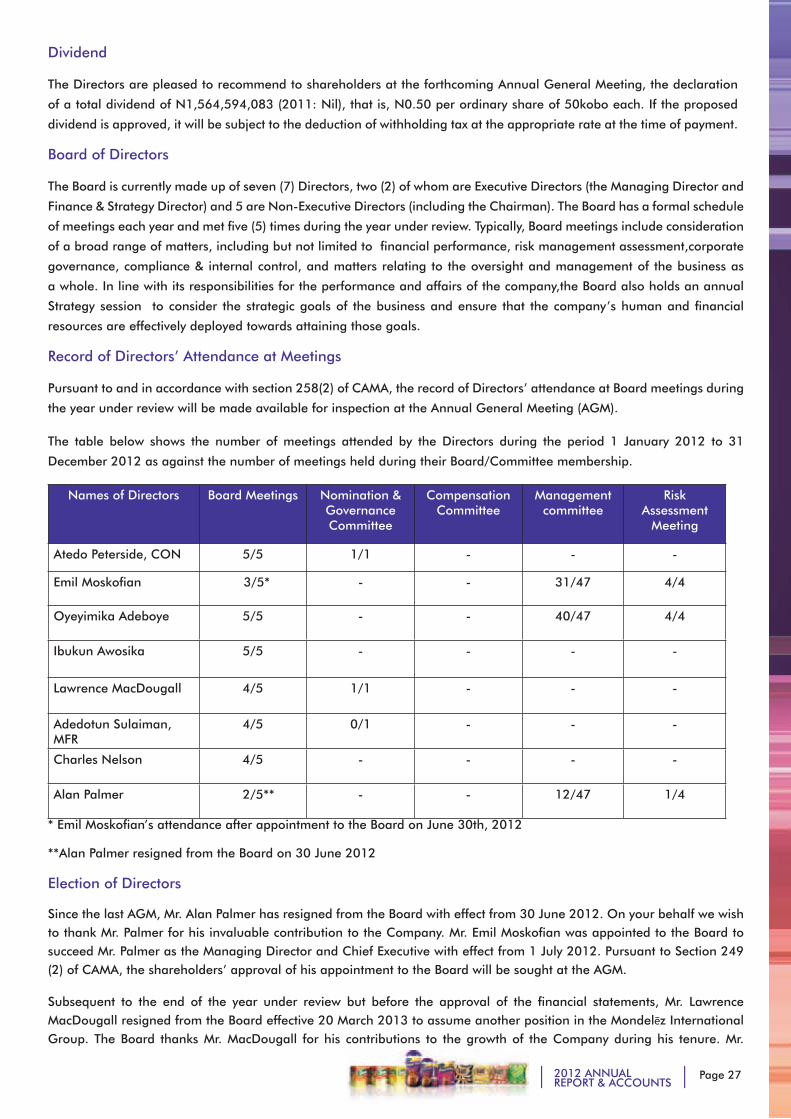
Dividend
The Directors are pleased to recommend to shareholders at the forthcoming Annual General Meeting, the declaration
of a total dividend of N1,564,594,083 (2011: Nil), that is, N0.50 per ordinary share of 50kobo each. If the proposed
dividend is approved, it will be subject to the deduction of withholding tax at the appropriate rate at the time of payment.
Board of Directors
The Board is currently made up of seven (7) Directors, two (2) of whom are Executive Directors (the Managing Director and
Finance & Strategy Director) and 5 are Non-Executive Directors (including the Chairman). The Board has a formal schedule
of meetings each year and met five (5) times during the year under review. Typically, Board meetings include consideration
of a broad range of matters, including but not limited to financial performance, risk management assessment,corporate
governance, compliance & internal control, and matters relating to the oversight and management of the business as
a whole. In line with its responsibilities for the performance and affairs of the company,the Board also holds an annual
Strategy session to consider the strategic goals of the business and ensure that the company’s human and financial
resources are effectively deployed towards attaining those goals.
Record of Directors’ Attendance at Meetings
Pursuant to and in accordance with section 258(2) of CAMA, the record of Directors’ attendance at Board meetings during
the year under review will be made available for inspection at the Annual General Meeting (AGM).
The table below shows the number of meetings attended by the Directors during the period 1 January 2012 to 31
December 2012 as against the number of meetings held during their Board/Committee membership.
Names of Directors Board Meetings Nomination & Governance Committee
Compensation Committee
Management committee
Risk Assessment
Meeting
Atedo Peterside, CON 5/5 1/1 - - -
Emil Moskofian 3/5* - - 31/47 4/4
Oyeyimika Adeboye 5/5 - - 40/47 4/4
Ibukun Awosika 5/5 - - - -
Lawrence MacDougall 4/5 1/1 - - -
Adedotun Sulaiman, MFR
4/5 0/1 - - -
Charles Nelson 4/5 - - - -
Alan Palmer 2/5** - - 12/47 1/4
* Emil Moskofian’s attendance after appointment to the Board on June 30th, 2012
**Alan Palmer resigned from the Board on 30 June 2012
Election of Directors
Since the last AGM, Mr. Alan Palmer has resigned from the Board with effect from 30 June 2012. On your behalf we wish to thank Mr. Palmer for his invaluable contribution to the Company. Mr. Emil Moskofian was appointed to the Board to succeed Mr. Palmer as the Managing Director and Chief Executive with effect from 1 July 2012. Pursuant to Section 249 (2) of CAMA, the shareholders’ approval of his appointment to the Board will be sought at the AGM.
Subsequent to the end of the year under review but before the approval of the financial statements, Mr. Lawrence MacDougall resigned from the Board effective 20 March 2013 to assume another position in the Mondelēz International Group. The Board thanks Mr. MacDougall for his contributions to the growth of the Company during his tenure. Mr.
Page 28 2012 ANNUALREPORT & ACCOUNTS
Ruslan Kinebas was subsequently appointed, effective 20 March 2013 to fill the vacancy as a result of Mr. MacDougall’s resignation.
The Directors to retire by rotation at the forthcoming AGM in conformity with the Articles of Association of the Company and section 259(1) of CAMA and who, being eligible, have offered themselves for re-election at the meeting are: Mr. Atedo N.A. Peterside CON and Mrs. Oyeyimika Adeboye
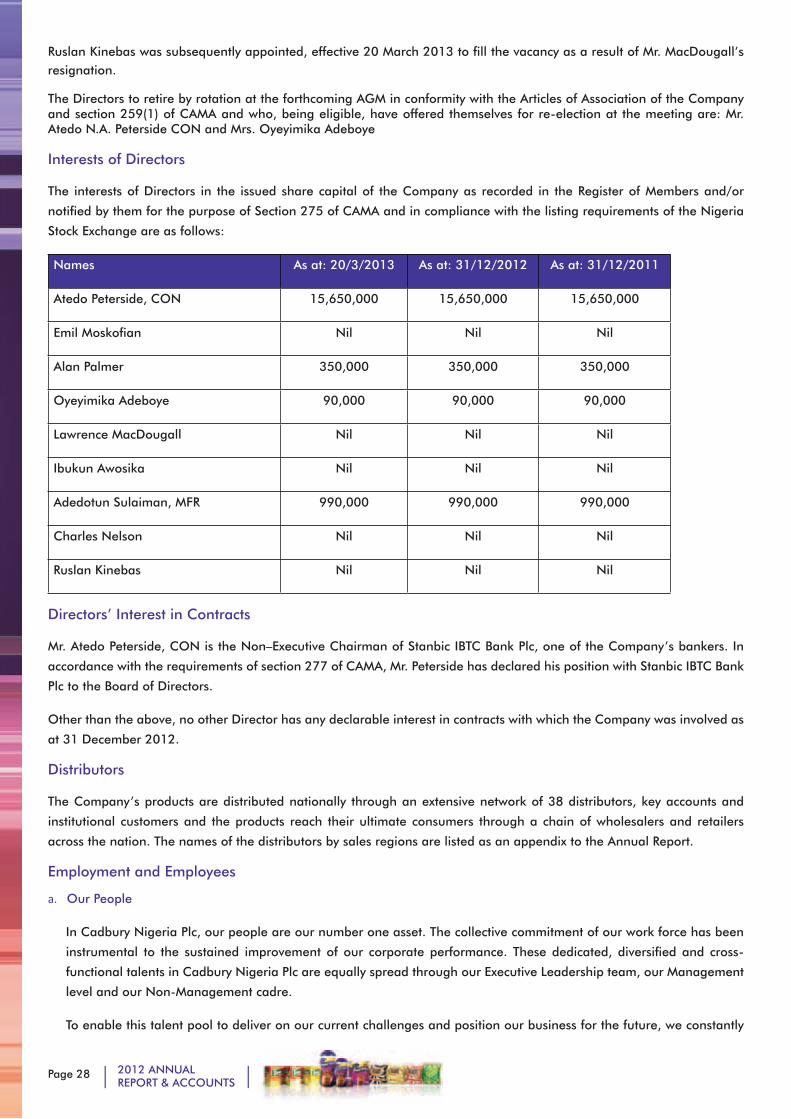
Interests of Directors
The interests of Directors in the issued share capital of the Company as recorded in the Register of Members and/or
notified by them for the purpose of Section 275 of CAMA and in compliance with the listing requirements of the Nigeria
Stock Exchange are as follows:
Names As at: 20/3/2013 As at: 31/12/2012 As at: 31/12/2011
Atedo Peterside, CON 15,650,000 15,650,000 15,650,000
Emil Moskofian Nil Nil Nil
Alan Palmer 350,000 350,000 350,000
Oyeyimika Adeboye 90,000 90,000 90,000
Lawrence MacDougall Nil Nil Nil
Ibukun Awosika Nil Nil Nil
Adedotun Sulaiman, MFR 990,000 990,000 990,000
Charles Nelson Nil Nil Nil
Ruslan Kinebas Nil Nil Nil
Directors’ Interest in Contracts
Mr. Atedo Peterside, CON is the Non–Executive Chairman of Stanbic IBTC Bank Plc, one of the Company’s bankers. In
accordance with the requirements of section 277 of CAMA, Mr. Peterside has declared his position with Stanbic IBTC Bank
Plc to the Board of Directors.
Other than the above, no other Director has any declarable interest in contracts with which the Company was involved as
at 31 December 2012.
Distributors
The Company’s products are distributed nationally through an extensive network of 38 distributors, key accounts and
institutional customers and the products reach their ultimate consumers through a chain of wholesalers and retailers
across the nation. The names of the distributors by sales regions are listed as an appendix to the Annual Report.
Employment and Employees
a. Our People
In Cadbury Nigeria Plc, our people are our number one asset. The collective commitment of our work force has been
instrumental to the sustained improvement of our corporate performance. These dedicated, diversified and cross-
functional talents in Cadbury Nigeria Plc are equally spread through our Executive Leadership team, our Management
level and our Non-Management cadre.
To enable this talent pool to deliver on our current challenges and position our business for the future, we constantly
Page 292012 ANNUALREPORT & ACCOUNTS
endeavour to align our policies, processes and practices to the very best international standards in employment
practices. To this end, we continue to receive support from the global Mondelēz International group to ensure that our
employees are empowered to achieve their best both for the Company and for themselves. In the year under review,
we elevated several middle level managers into senior management positions and our Management Traineeship
Program was also in place to ensure a reliable talent pipeline at the entry level. We were also able to infuse additional
talents into our business by recruiting tested managers (locally and internationally) who have added extra impetus to
our performance-driven, values led culture.
b. Learning and Development
We realize that our Company’s ability to sustain a competitive advantage in the long term is largely dependent on
the continuous development, training and empowerment of a team of knowledgeable, experienced and motivated
employees. Thus, we sustain a consistent policy of training our people, both locally and abroad, to enhance their skills
and competence as a key plank of our operational strategy.
We firmly believe that the individual employee must therefore also take the responsibility to drive his or her own
learning and development. To ensure this beneficial shared ownership of learning, we insist that every staff must
possess the drive, initiative and motivation to take advantage of the available learning and development opportunities.
c. Employee Involvement
The Company’s on-going success in achieving its commercial objectives depends on the contributions of employees
throughout the business. Through our colleague engagement platforms, we deliberately solicit employee involvement
and all our staff actively participate in the Company’s affairs on a regular basis irrespective of where they work.
Several formal channels and consultative committees exist for participation in the Company’s affairs. As part of the
Company’s commitment to transparent communication with its employees, Town Hall meetings are held periodically
to provide a platform for our employees to communicate in a face-to-face manner with the Company’s executive
management team and directly obtain clarifications and/or rationales behind the Company’s performance, activities
and future plans.
d. Equal Opportunity Statement
The Company is committed to providing equal opportunities to individuals within its business in all areas of employment.
In support of this, policies, procedures and practices focus on capability and do not discriminate on any basis beyond
merit and performance.
e. Employment of Physically Challenged Persons
It is the Company’s policy to promote diversity and offer everyone equal opportunities for employment. We welcome
applications for employment by physically challenged persons, bearing in mind the respective aptitude and abilities of
the applicants concerned. In the event that a member of staff becomes physically challenged whilst in the employment
of the Company, every effort is made to ensure that their employment with the Company continues and that appropriate
training and support is given to them. It is the Company’s policy that, as far as possible, all employees are treated alike
in the areas of training, career development and promotion.
The Company has two (2) physically challenged persons in its employment as at 31 December 2012 (2011:2).
Report on Quality, Environment, Health and Safety
As a leading player in the food and beverages industry, the Company gives the greatest priority to the implementation,
maintenance and continuous improvement of high standards of quality, environment, health and safety. All food production
areas are clearly marked and employees are required to follow clear procedures relating to hygiene and safety before
they are permitted access to food production areas of the site. Staff members and visitors to the site are required to use
appropriate protective equipment when involved in production or potentially hazardous tasks.
Page 30 2012 ANNUALREPORT & ACCOUNTS
The Company adopts Good Manufacturing Practice (“GMP”), which are a series of internationally accepted guidelines
covering the manufacturing and testing of products in all of its factory operations. Both our factories and suppliers’
facilities are subject to frequent GMP audits.
The Company is committed to the environment and seeks to continuously improve on our systems and processes to
prevent pollution and minimize the environmental impact of our operations.
Overall safety performance for the year 2012 was an improvement over the previous year. There was no major accident
within the manufacturing operations on site and Lost Time accidents reduced from 2 to 1. Each employee is encouraged
to conduct their activities with the highest concern for employee safety, health and the environment.
The Company is also committed to reducing the environmental impact of its activities, preventing pollution and promoting
the sustainability of the natural resources upon which it depends, while providing quality products that meets the needs
of its consumers. We are committed to continuous improvement of our environmental performance and meeting or
exceeding the requirements of all applicable environmental laws and regulations. In 2012, we reduced our water and
energy consumption per ton of product produced by 24.8% and 5.2% respectively from 2011.
Good health services are provided through the Company’s operation of its own Clinic managed by a full-time medical
doctor, working with a team of competent nurses and other staff along with the use of other hospitals and clinics on a
retained basis. The medical team conducts annual medical checks for all employees, as well as health seminars and
counseling for various groups. Nutritious meals are also provided free at the staff canteen for all employees.
We have a policy which ensures that all employees are fully informed about HIV/AIDS, including causes and prevention.
All affected employees have access to a full range of medical treatment, paid for by the Company. Our documented
policy, which is widely circulated among all employees, prohibits any form of discrimination against colleagues with HIV/
AIDS. Staff living with this condition are assured of confidentiality and hotlines are provided for those who desire more
counseling in complete anonymity. The Company does not require HIV screening as part of its pre-employment medical
examinations. World AIDS Day is marked annually by our employees and awareness of the condition is raised through
seminars, pamphlets, distribution of newsletters, the wearing of the red ribbon lapel pin and voluntary HIV counseling
and testing.
Bribery and Corruption
We condemn any form of bribery and corruption. Our employees must never, directly or through intermediaries, offer or
promise any personal or improper financial or other advantage in order to obtain or retain business or other advantage
from a third party, whether public or private. Nor must they accept any such advantage in return for any preferential
treatment of a third party. Moreover, employees must refrain from any activity or behavior that could give rise to the
appearance or suspicion of such conduct or the attempt thereof.
As a member of Mondelez International, the Company observes and applies requirements of the United States Foreign
Corrupt Practices Act (FCPA) and United Kingdom Anti-bribery Act in performing its business activities.
Page 312012 ANNUALREPORT & ACCOUNTS
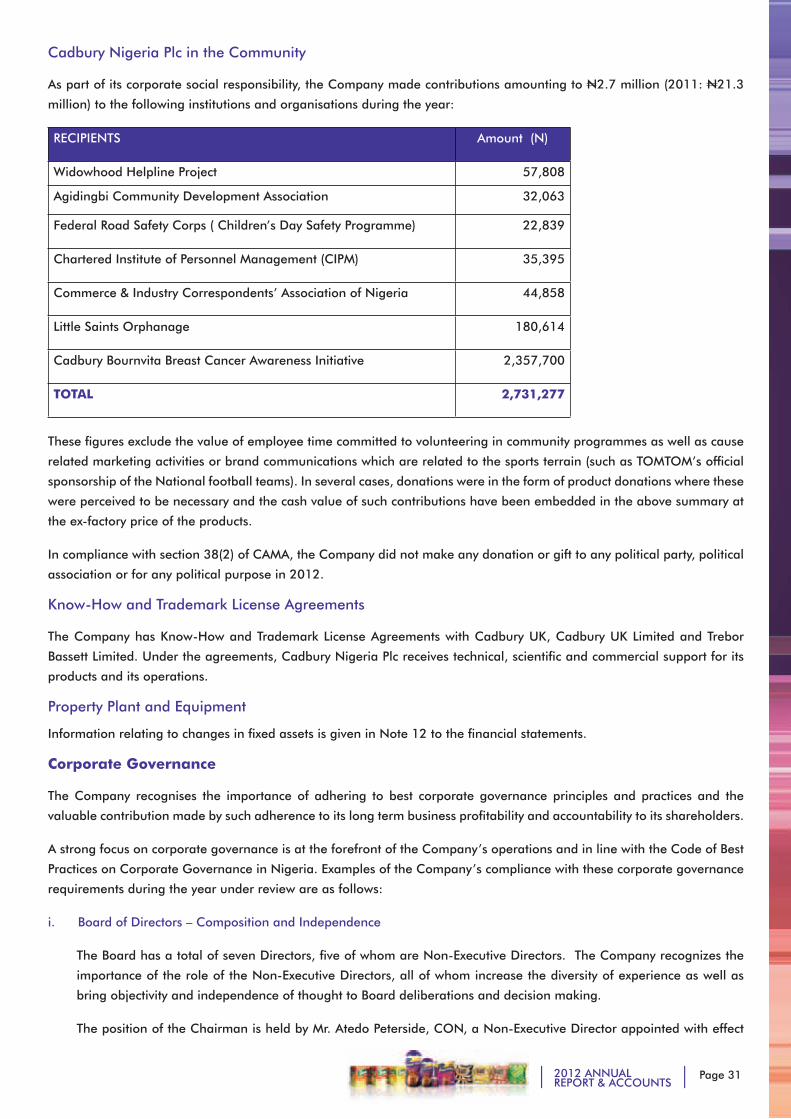
Cadbury Nigeria Plc in the Community
As part of its corporate social responsibility, the Company made contributions amounting to N2.7 million (2011: N21.3
million) to the following institutions and organisations during the year:
RECIPIENTS Amount (N)
Widowhood Helpline Project 57,808
Agidingbi Community Development Association 32,063
Federal Road Safety Corps ( Children’s Day Safety Programme) 22,839
Chartered Institute of Personnel Management (CIPM) 35,395
Commerce & Industry Correspondents’ Association of Nigeria 44,858
Little Saints Orphanage 180,614
Cadbury Bournvita Breast Cancer Awareness Initiative 2,357,700
TOTAL 2,731,277
These figures exclude the value of employee time committed to volunteering in community programmes as well as cause
related marketing activities or brand communications which are related to the sports terrain (such as TOMTOM’s official
sponsorship of the National football teams). In several cases, donations were in the form of product donations where these
were perceived to be necessary and the cash value of such contributions have been embedded in the above summary at
the ex-factory price of the products.
In compliance with section 38(2) of CAMA, the Company did not make any donation or gift to any political party, political
association or for any political purpose in 2012.
Know-How and Trademark License Agreements
The Company has Know-How and Trademark License Agreements with Cadbury UK, Cadbury UK Limited and Trebor
Bassett Limited. Under the agreements, Cadbury Nigeria Plc receives technical, scientific and commercial support for its
products and its operations.
Property Plant and Equipment
Information relating to changes in fixed assets is given in Note 12 to the financial statements.
Corporate Governance
The Company recognises the importance of adhering to best corporate governance principles and practices and the
valuable contribution made by such adherence to its long term business profitability and accountability to its shareholders.
A strong focus on corporate governance is at the forefront of the Company’s operations and in line with the Code of Best
Practices on Corporate Governance in Nigeria. Examples of the Company’s compliance with these corporate governance
requirements during the year under review are as follows:
i. Board of Directors – Composition and Independence
The Board has a total of seven Directors, five of whom are Non-Executive Directors. The Company recognizes the
importance of the role of the Non-Executive Directors, all of whom increase the diversity of experience as well as
bring objectivity and independence of thought to Board deliberations and decision making.
The position of the Chairman is held by Mr. Atedo Peterside, CON, a Non-Executive Director appointed with effect
Page 32 2012 ANNUALREPORT & ACCOUNTS
from 21 April 2010. This is separate and distinct from the position of Managing Director which is held by Mr. Emil
Moskofian.
ii. Board – Training and Access to Advisers
The Company has a structured and robust induction programme for new Directors in which the Company’s
business structure and operations are covered in depth and requisite information provided to assist new Directors in
discharging their duties effectively.
All the Directors have access to the advice and services of the Company Secretary and, if required, to the advice
and services of other professionals where such advice will improve the quality of their contribution to Board decision
making.
iii. Committees
In conformity with the Code of Best Practice in Corporate Governance, the Company has in place the following
Committees:
(a) Nominations & Governance Committee
The Nominations & Governance Committee is guided by a written Terms of Reference and is authorized to establish
and review recommendations,qualifications and mitigating any potential conflict of interest regarding the appointment
of any proposed Executive or Non-Executive Director. Thus ensuring that a review of Board candidates is undertaken
in a disciplined and objective manner. The Committee is also tasked with reviewing existing governance procedures
and practices in light of current domestic and global developments in corporate governance. The members of the
Nominations & Governance Committee are Mr. Lawrence MacDougall (Chair), Mr. Atedo Peterside, CON and Mr.
Adedotun Sulaiman, MFR.
(b) Compensation Committee
The Compensation Committee is responsible for making recommendations to the Board on the remuneration of the
Directors and senior executives of the Company. The members of the Compensation Committee are Mrs. Ibukun
Awosika (Chair), Mr. Lawrence MacDougall and Mr. Adedotun Sulaiman, MFR.
(c) Management Committee
The Management Committee comprises the functional directors who head up the core business units of the Company.
It meets on a weekly basis and is responsible for setting overall corporate targets, reviewing the Company’s performance
and operational issues and overseeing the affairs of the Company on a day-to-day basis. As at 31 December 2012,
the Management Committee was comprised of the following members: Mr. Emil Moskofian (Managing Director), Mrs.
Oyeyimika Adeboye (Finance & Strategy Director), Mr. Emmanuel Imoagene (Human Resources Director), Mr. Paul
Udochi (Sales Director), Mr. Nasir Malik (Site Transformation Director), Mr. Dele Anifowoshe (Marketing Director),
Mr. Dariusz Lawecki (Customer Services and Logistics Director) and Mrs. Fola Akande (Company Secretary/Chief
Counsel).
(d) Risk Assessment Committee
The Risk Committee comprises the functional directors and designated senior managers of the Company. It meets
on a quarterly basis and its report is forwarded to the Board of Directors for further guidance. It is responsible for
the oversight, review and management of the entire business risk of the Company and for proposing steps to
mitigate the effects of such business risks. As at 31 December 2012, the Risk Assessment Committee was comprised
of the following members: Mr. Emil Moskofian (Managing Director), Mrs. Oyeyimika Adeboye (Finance & Strategy
Director), Mr. Emmanuel Imoagene (Human Resources Director), Mr. Paul Udochi (Sales Director), Mr. Nasir Malik
(Site Transformation Director), Mr. Dele Anifowoshe (Marketing Director), Mr. Dariusz Lawecki (Customer Services

Page 332012 ANNUALREPORT & ACCOUNTS
and Logistics Director), Mrs. Fola Akande (Company Secretary/Legal Counsel) and Mrs. Mosunmola Oloyede (Head,
Internal Audit).
Code of Conduct
Being part of the wider Mondelēz International, all employees subscribe to the Mondelēz International Code of Conduct
which describes the values that should guide all employees as they do business. The Company maintains a steady
awareness of these values by continuous training and publicity of the contents of the Code to its employees throughout
the course of the year. Strict adherence to the Code is mandated in the Company’s day to day operations.
Share Trading Policy
Cadbury Nigeria Plc maintains a share trading policy that guides Directors, Audit Committee members and all employees
as to their dealing in the Company’s shares. The Policy was updated and revised by the Board with effect from 14 October
2010. Relevant persons are prohibited from dealing in the Company’s shares both when they are in possession of material
non-public information about the Company’s activities as well as during prescribed “blackout” periods. Notification of
individual share trading activity is required to be made to the appropriate regulatory bodies as well as the Company
Secretary.
Audit Committee
In accordance with section 359(5) of CAMA, members of the Audit Committee of the Company were elected at the last
Annual General Meeting held on 9 May 2012. Members that served on the Audit Committee comprise three representatives
of the shareholders (namely, Mr. Olaniran Jinadu, Mr. Chike Okorie and Mrs. Mary Joke Shofolahan) and three members
of the Board of Directors (Mr. Adedotun Sulaiman, MFR, Mrs. Oyeyimika Adeboye and Mr. Charles Nelson).
Independent Auditors
Messrs KPMG Professional Services served as the Independent Auditors during the year under review. The Independent
Auditor’s Report was signed by Oluwafemi Awotoye (Mr.), ACA, a Partner in the Firm.
In accordance with Section 357(2) of the Companies and Allied Matters Act, Cap. C20, Laws of the Federation of Nigeria,
2004, Messrs KPMG Professional Services have indicated their willingness to continue in office as Independent Auditors
to the Company.
By order of the Board.
Fola Akande
Company Secretary/Chief Counsel
FRC/2013/NBA/0000000106020 March 2013
Page 34 2012 ANNUALREPORT & ACCOUNTS
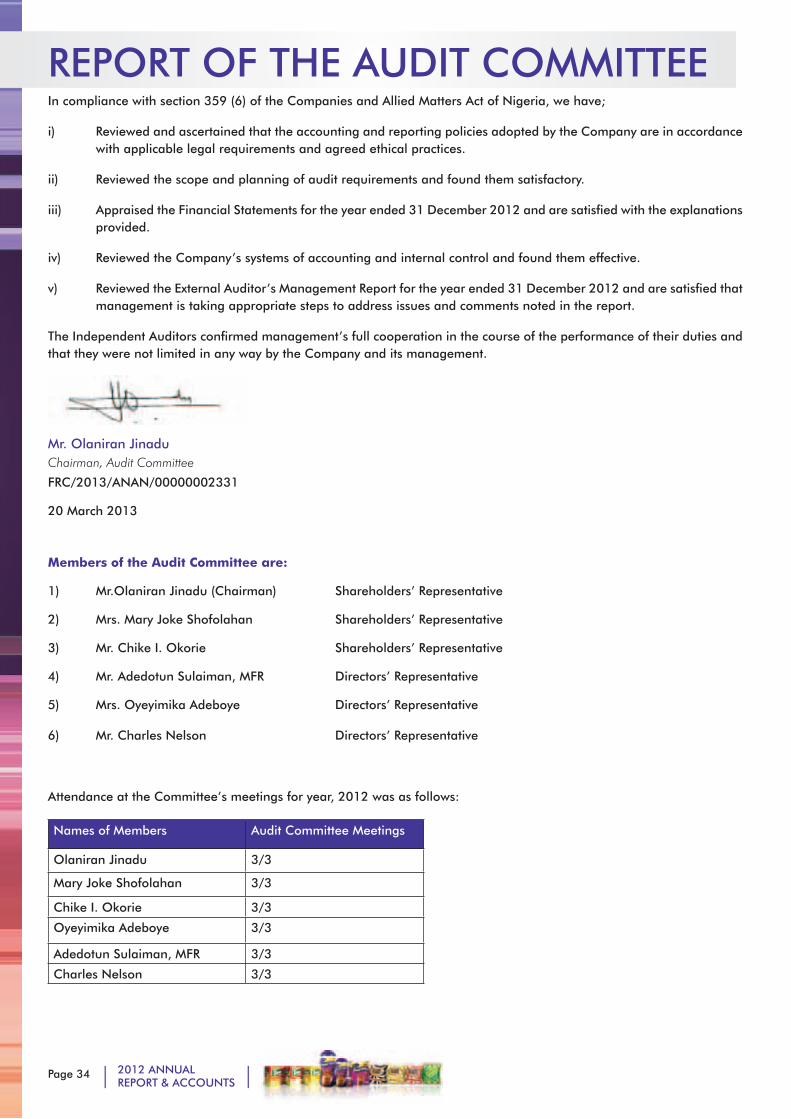
REPORT OF THE AUDIT COMMITTEE In compliance with section 359 (6) of the Companies and Allied Matters Act of Nigeria, we have;
i) Reviewed and ascertained that the accounting and reporting policies adopted by the Company are in accordance with applicable legal requirements and agreed ethical practices.
ii) Reviewed the scope and planning of audit requirements and found them satisfactory.
iii) Appraised the Financial Statements for the year ended 31 December 2012 and are satisfied with the explanations provided.
iv) Reviewed the Company’s systems of accounting and internal control and found them effective.
v) Reviewed the External Auditor’s Management Report for the year ended 31 December 2012 and are satisfied that management is taking appropriate steps to address issues and comments noted in the report.
The Independent Auditors confirmed management’s full cooperation in the course of the performance of their duties and that they were not limited in any way by the Company and its management.
Mr. Olaniran Jinadu Chairman, Audit Committee
FRC/2013/ANAN/00000002331
20 March 2013
Members of the Audit Committee are:
1) Mr.Olaniran Jinadu (Chairman) Shareholders’ Representative
2) Mrs. Mary Joke Shofolahan Shareholders’ Representative
3) Mr. Chike I. Okorie Shareholders’ Representative
4) Mr. Adedotun Sulaiman, MFR Directors’ Representative
5) Mrs. Oyeyimika Adeboye Directors’ Representative
6) Mr. Charles Nelson Directors’ Representative
Attendance at the Committee’s meetings for year, 2012 was as follows:
Names of Members Audit Committee Meetings
Olaniran Jinadu 3/3
Mary Joke Shofolahan 3/3
Chike I. Okorie 3/3
Oyeyimika Adeboye 3/3
Adedotun Sulaiman, MFR 3/3
Charles Nelson 3/3
Page 352012 ANNUALREPORT & ACCOUNTS
INDEPENDENTAUDITOR’S REPORTTo the Members of Cadbury Nigeria Plc
Report on the Financial Statements
We have audited the accompanying financial statements of Cadbury Nigeria Plc (‘the Company’) and its subsidiary company (together “the Group”) which comprise the statement of financial position as at December 31, 2012 and the statement of comprehensive income, statement of changes in equity, and statement of cash flows for the year then ended, and a summary of significant accounting policies and other explanatory information, as set out on pages 38 to 115.
Directors’ Responsibility for the Financial Statements
The directors are responsible for the preparation of financial statements that give a true and fair view in accordance with International Financial Reporting Standards, in the manner required by the Companies and Allied Matters Act of Nigeria and the Financial Reporting Council of Nigeria Act, 2011, and for such internal control as management determines is necessary to enable the preparation of financial statements that are free from material misstatement, whether due to fraud or error.
Auditor’s Responsibility
Our responsibility is to express an opinion on these financial statements based on our audit. We conducted our audit in accordance with International Standards on Auditing. Those standards require that we comply with ethical requirements and plan and perform the audit to obtain reasonable assurance about whether the financial statements are free from material misstatement.
An audit involves performing procedures to obtain audit evidence about the amounts and disclosures in the financial statements. The procedures selected depend on the auditor’s judgment, including the assessment of the risks of material misstatement of the financial statements, whether due to fraud or error. In making those risk assessments, the auditor considers internal control relevant to the entity’s preparation and fair presentation of the financial statements that give a true and fair view in order to design audit procedures that are appropriate in
the circumstances, but not for the purpose of expressing an opinion on the effectiveness of the entity’s internal control. An audit also includes evaluating the appropriateness of accounting policies used and the reasonableness of accounting estimates made by management, as well as evaluating the overall presentation of the financial statements.
We believe that the audit evidence we have obtained is sufficient and appropriate to provide a basis for our audit opinion.
Opinion
In our opinion, these financial statements give a true and fair view of the financial position of Cadbury Nigeria Plc (“the Company”) and its subsidiary company (together “the Group”) as at December 31, 2012, and of the Company’s financial performance and cash flows for the year then ended in accordance with International Financial Reporting Standards and in the manner required by the Companies and Allied Matters Act of Nigeria and the Financial Reporting Council of Nigeria Act, 2011.
Report on Other Legal and Regulatory Requirements
Compliance with the requirements of Schedule 6 of the Companies and Allied Matters Act of Nigeria
In our opinion, proper books of account have been kept by the Company, so far as appears from our examination of those books and the statement of financial position and the statements of comprehensive income are in agreement with the books of account.
20 March, 2013Lagos, NigeriaFRC NO: FRC/2013/ICAN/00000001182

Page 36 2012 ANNUALREPORT & ACCOUNTS

Page 372012 ANNUALREPORT & ACCOUNTS
2012 FINANCIALS
Page 38 2012 ANNUALREPORT & ACCOUNTS
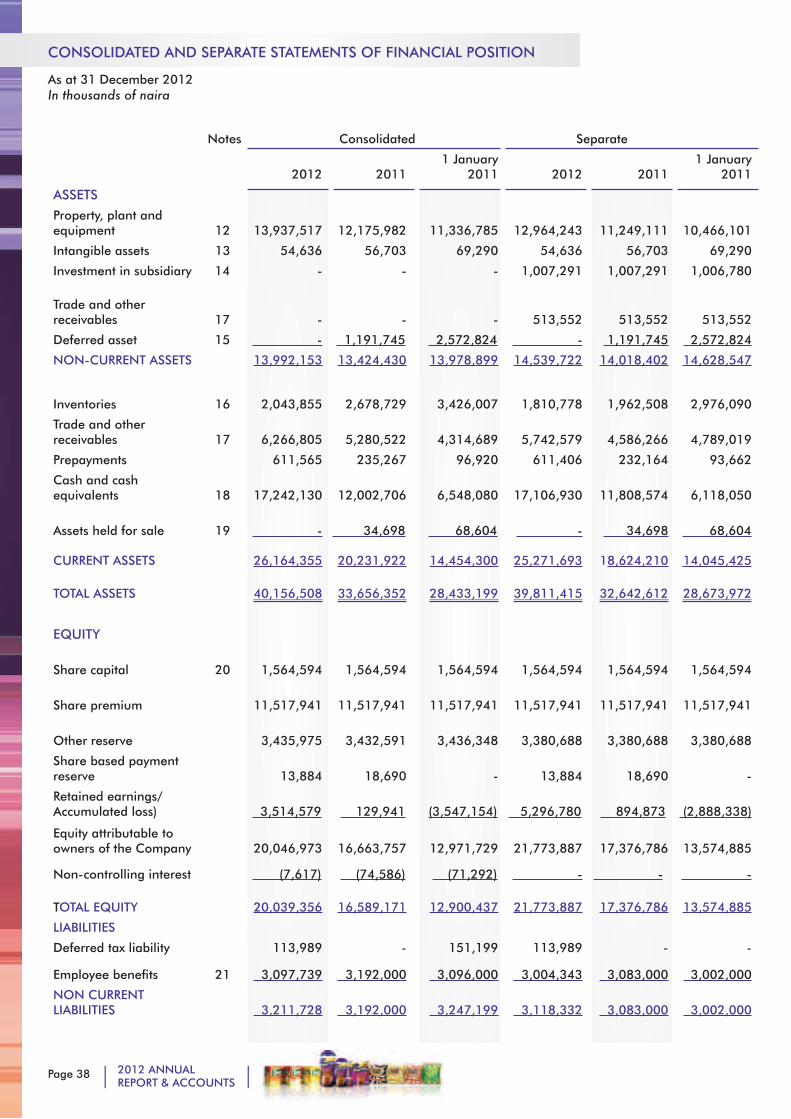
CONSOLIDATED AND SEPARATE STATEMENTS OF FINANCIAL POSITION
As at 31 December 2012In thousands of naira
Notes Consolidated Separate
2012
20111 January
2011
2012
20111 January
2011
ASSETS
Property, plant and equipment 12 13,937,517
12,175,982
11,336,785
12,964,243
11,249,111
10,466,101
Intangible assets 13 54,636 56,703 69,290 54,636 56,703 69,290
Investment in subsidiary 14 - - - 1,007,291 1,007,291 1,006,780
Trade and other receivables 17
- - -
513,552
513,552 513,552
Deferred asset 15 - 1,191,745 2,572,824 - 1,191,745 2,572,824
NON-CURRENT ASSETS
13,992,153 13,424,430 13,978,899 14,539,722 14,018,402 14,628,547
Inventories 16
2,043,855
2,678,729
3,426,007
1,810,778
1,962,508 2,976,090
Trade and other receivables 17
6,266,805
5,280,522
4,314,689
5,742,579
4,586,266 4,789,019
Prepayments 611,565 235,267 96,920 611,406 232,164 93,662
Cash and cash equivalents 18
17,242,130
12,002,706
6,548,080
17,106,930
11,808,574 6,118,050
Assets held for sale 19 -
34,698
68,604 - 34,698 68,604
CURRENT ASSETS 26,164,355 20,231,922 14,454,300 25,271,693 18,624,210 14,045,425
TOTAL ASSETS 40,156,508 33,656,352 28,433,199 39,811,415 32,642,612 28,673,972
EQUITY
Share capital 20 1,564,594 1,564,594
1,564,594 1,564,594 1,564,594 1,564,594
Share premium 11,517,941 11,517,941
11,517,941 11,517,941
11,517,941
11,517,941
Other reserve 3,435,975 3,432,591
3,436,348 3,380,688 3,380,688 3,380,688
Share based payment reserve 13,884
18,690 - 13,884 18,690 -
Retained earnings/Accumulated loss) 3,514,579 129,941 (3,547,154) 5,296,780 894,873 (2,888,338)
Equity attributable to owners of the Company 20,046,973 16,663,757 12,971,729 21,773,887 17,376,786 13,574,885
Non-controlling interest (7,617) (74,586) (71,292) - - -
TOTAL EQUITY 20,039,356 16,589,171 12,900,437 21,773,887 17,376,786 13,574,885
LIABILITIES
Deferred tax liability 113,989 - 151,199 113,989 - -
Employee benefits 21 3,097,739 3,192,000 3,096,000 3,004,343 3,083,000 3,002,000
NON CURRENT LIABILITIES 3,211,728 3,192,000 3,247,199 3,118,332 3,083,000 3,002,000
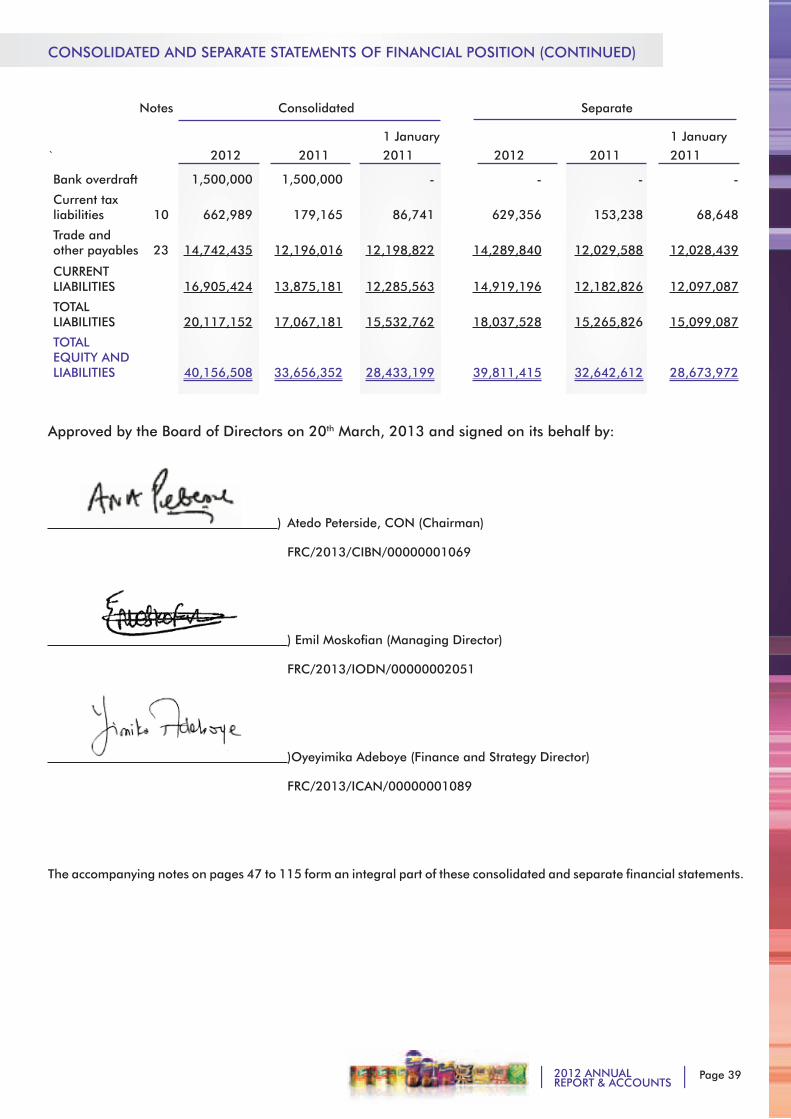
Page 392012 ANNUALREPORT & ACCOUNTS
CONSOLIDATED AND SEPARATE STATEMENTS OF FINANCIAL POSITION (CONTINUED)
Notes Consolidated Separate
1 January 1 January` 2012 2011 2011 2012 2011 2011
Bank overdraft 1,500,000 1,500,000 - - - -
Current tax liabilities 10
662,989
179,165
86,741
629,356 153,238 68,648
Trade and other payables 23
14,742,435
12,196,016
12,198,822 14,289,840 12,029,588 12,028,439
CURRENT LIABILITIES
16,905,424
13,875,181
12,285,563 14,919,196 12,182,826 12,097,087
TOTAL LIABILITIES
20,117,152
17,067,181
15,532,762 18,037,528 15,265,826 15,099,087
TOTAL EQUITY AND LIABILITIES
40,156,508
33,656,352
28,433,199 39,811,415 32,642,612 28,673,972
Approved by the Board of Directors on 20th March, 2013 and signed on its behalf by:
) Atedo Peterside, CON (Chairman)
FRC/2013/CIBN/00000001069
) Emil Moskofian (Managing Director)
FRC/2013/IODN/00000002051
)Oyeyimika Adeboye (Finance and Strategy Director)
FRC/2013/ICAN/00000001089
The accompanying notes on pages 47 to 115 form an integral part of these consolidated and separate financial statements.
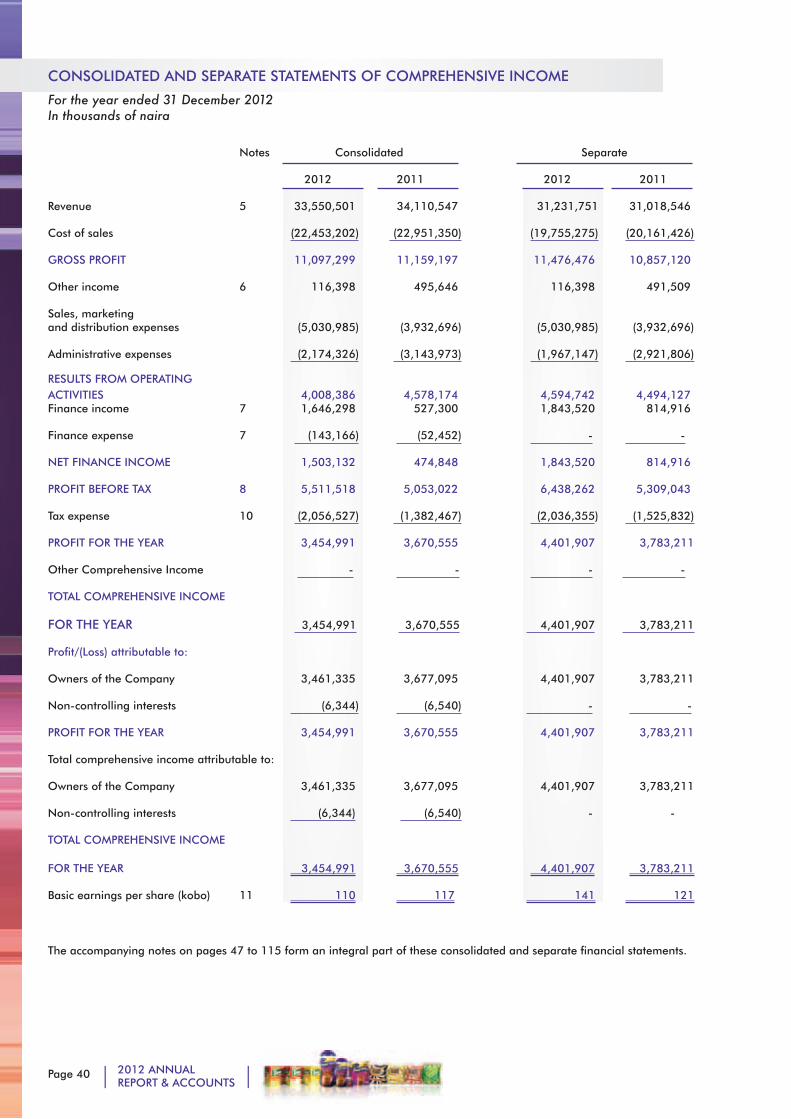
Page 40 2012 ANNUALREPORT & ACCOUNTS
CONSOLIDATED AND SEPARATE STATEMENTS OF COMPREHENSIVE INCOME
For the year ended 31 December 2012In thousands of naira
Notes Consolidated Separate
2012 2011 2012 2011
Revenue 5 33,550,501 34,110,547 31,231,751 31,018,546
Cost of sales (22,453,202) (22,951,350) (19,755,275) (20,161,426)
GROSS PROFIT 11,097,299 11,159,197 11,476,476 10,857,120
Other income 6 116,398 495,646 116,398 491,509
Sales, marketing and distribution expenses (5,030,985) (3,932,696) (5,030,985) (3,932,696)
Administrative expenses (2,174,326) (3,143,973) (1,967,147) (2,921,806)
RESULTS FROM OPERATING ACTIVITIES 4,008,386 4,578,174 4,594,742 4,494,127 Finance income 7 1,646,298 527,300 1,843,520 814,916
Finance expense 7 (143,166) (52,452) - -
NET FINANCE INCOME 1,503,132 474,848 1,843,520 814,916
PROFIT BEFORE TAX 8 5,511,518 5,053,022 6,438,262 5,309,043
Tax expense 10 (2,056,527) (1,382,467) (2,036,355) (1,525,832)
PROFIT FOR THE YEAR 3,454,991 3,670,555 4,401,907 3,783,211
Other Comprehensive Income - - - -
TOTAL COMPREHENSIVE INCOME
FOR THE YEAR 3,454,991 3,670,555 4,401,907 3,783,211
Profit/(Loss) attributable to:
Owners of the Company 3,461,335 3,677,095 4,401,907 3,783,211
Non-controlling interests (6,344) (6,540) - -
PROFIT FOR THE YEAR 3,454,991 3,670,555 4,401,907 3,783,211
Total comprehensive income attributable to:
Owners of the Company 3,461,335 3,677,095 4,401,907 3,783,211
Non-controlling interests (6,344) (6,540) - -
TOTAL COMPREHENSIVE INCOME
FOR THE YEAR 3,454,991 3,670,555 4,401,907 3,783,211
Basic earnings per share (kobo) 11 110 117 141 121
The accompanying notes on pages 47 to 115 form an integral part of these consolidated and separate financial statements.
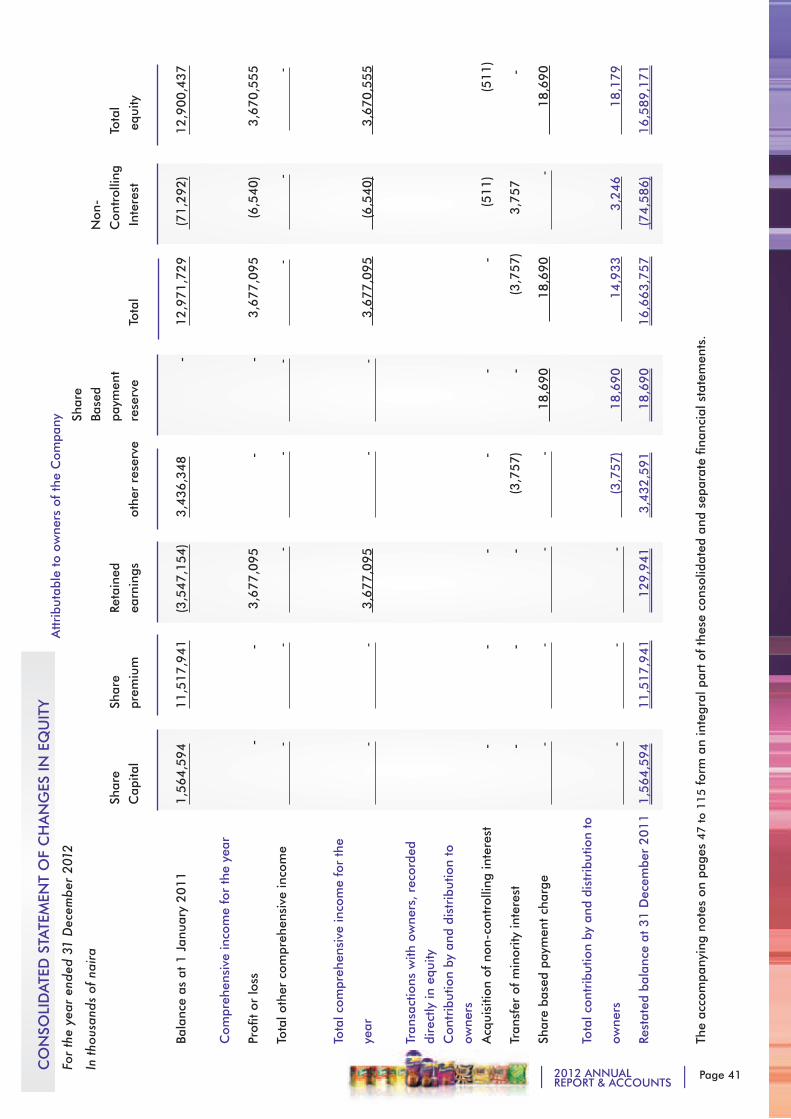
Page 412012 ANNUALREPORT & ACCOUNTS
Sh
are
Ba
sed
N
on-
Sh
are
Sh
are
Re
tain
ed
paym
ent
Con
trol
ling
Tota
l
Cap
ital
pr
emiu
m
earn
ings
ot
her
rese
rve
rese
rve
To
tal
In
tere
st
equ
ity
Bala
nce
as a
t 1 J
anua
ry 2
01
1
1
,56
4,5
94
11
,51
7,9
41
(3,5
47
,15
4)
3,4
36
,34
8
-
12,9
71,7
29
(
71,2
92)
12,9
00,4
37
Com
preh
ensi
ve in
com
e fo
r th
e ye
ar
Profi
t or
loss
-
-
3
,67
7,0
95
-
-
3,6
77,0
95
(
6,5
40)
3,6
70,5
55
Tota
l oth
er c
ompr
ehen
sive
inco
me
-
-
-
-
-
-
-
-
Tota
l com
preh
ensi
ve in
com
e fo
r th
e
year
-
-
3,6
77
,09
5
-
-
3,6
77,0
95
(
6,5
40)
3,6
70,5
55
Tran
sact
ions
with
ow
ners
, re
cord
ed
dire
ctly
in e
quity
Con
trib
utio
n by
and
dis
trib
utio
n to
ow
ners
Acq
uisi
tion
of n
on-c
ontr
ollin
g in
tere
st
-
-
-
-
-
-
(511)
(
511)
Tran
sfer
of
min
ority
inte
rest
-
-
-
(3
,75
7)
-
(3,7
57)
3,7
57
-
Shar
e ba
sed
paym
ent
char
ge
-
-
-
-
1
8,6
90
1
8,6
90
-
18,6
90
Tota
l con
trib
utio
n by
and
dis
trib
utio
n to
owne
rs
-
-
-
(3
,75
7)
1
8,6
90
1
4,9
33
3,2
46
1
8,1
79
Rest
ated
bal
ance
at
31
Dec
embe
r 2
01
1
1,5
64
,59
4
11
,51
7,9
41
1
29
,94
1
3,4
32
,59
1
1
8,6
90
16,6
63,7
57
(
74,5
86)
16,5
89,1
71
The
acco
mpa
nyin
g no
tes
on p
ages
47
to
11
5 f
orm
an
inte
gral
par
t of
the
se c
onso
lidat
ed a
nd s
epar
ate
finan
cial
sta
tem
ents
.
CO
NSO
LID
ATE
D S
TATE
MEN
T O
F C
HA
NG
ES IN
EQ
UIT
Y
For
the
year
end
ed 3
1 D
ecem
ber
2012
In th
ousa
nds
of n
aira
Att
ribu
tabl
e to
ow
ners
of
the
Com
pany
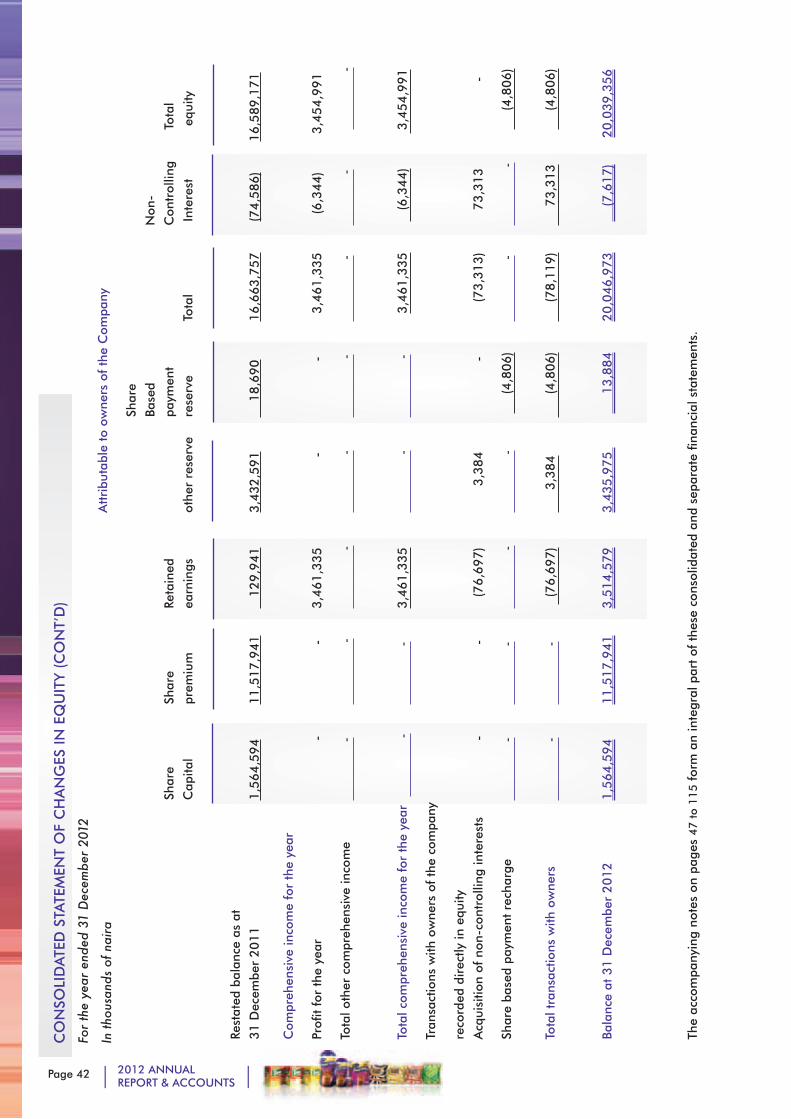
Page 42 2012 ANNUALREPORT & ACCOUNTS
A
ttri
buta
ble
to o
wne
rs o
f th
e C
ompa
ny
Sh
are
Ba
sed
N
on-
Sh
are
Sh
are
Re
tain
ed
paym
ent
Con
trol
ling
Tota
l
Cap
ital
pr
emiu
m
earn
ings
ot
her
rese
rve
rese
rve
To
tal
In
tere
st
equ
ity
Rest
ated
bal
ance
as
at
31 D
ecem
ber
20
11
1
,56
4,5
94
11
,51
7,9
41
1
29
,94
1
3,4
32
,59
1
18,6
90
16,6
63,7
57
(74,5
86)
1
6,5
89,1
71
C
ompr
ehen
sive
inco
me
for
the
year
Profi
t fo
r th
e ye
ar
-
-
3
,46
1,3
35
-
-
3,4
61,3
35
(
6,3
44)
3,4
54,9
91
Tota
l oth
er c
ompr
ehen
sive
inco
me
-
-
-
-
-
-
-
-
Tota
l com
preh
ensi
ve in
com
e fo
r th
e ye
ar
-
-
3
,46
1,3
35
-
-
3,4
61,3
35
(6
,344)
3
,454,9
91
Tran
sact
ions
with
ow
ners
of
the
com
pany
reco
rded
dir
ectly
in e
quity
A
cqui
sitio
n of
non
-con
trol
ling
inte
rest
s
-
-
(
76
,69
7)
3
,38
4
-
(
73,3
13)
73,3
13
-
Shar
e ba
sed
paym
ent
rech
arge
-
-
-
-
(4,8
06)
-
-
(4,8
06)
Tota
l tra
nsac
tions
with
ow
ners
-
-
(
76
,69
7)
3
,38
4
(4
,806)
(78,1
19)
73,3
13
(4,8
06)
Bala
nce
at 3
1 D
ecem
ber
20
12
1,5
64
,59
4
11
,51
7,9
41
3
,51
4,5
79
3,4
35
,97
5
13,8
84
20,0
46,9
73
(7,6
17)
20,0
39,3
56
The
acco
mpa
nyin
g no
tes
on p
ages
47
to
11
5 f
orm
an
inte
gral
par
t of
the
se c
onso
lidat
ed a
nd s
epar
ate
finan
cial
sta
tem
ents
.
CO
NSO
LID
ATE
D S
TATE
MEN
T O
F C
HA
NG
ES IN
EQ
UIT
Y (C
ON
T’D
)
For
the
year
end
ed 3
1 D
ecem
ber
2012
In th
ousa
nds
of n
aira
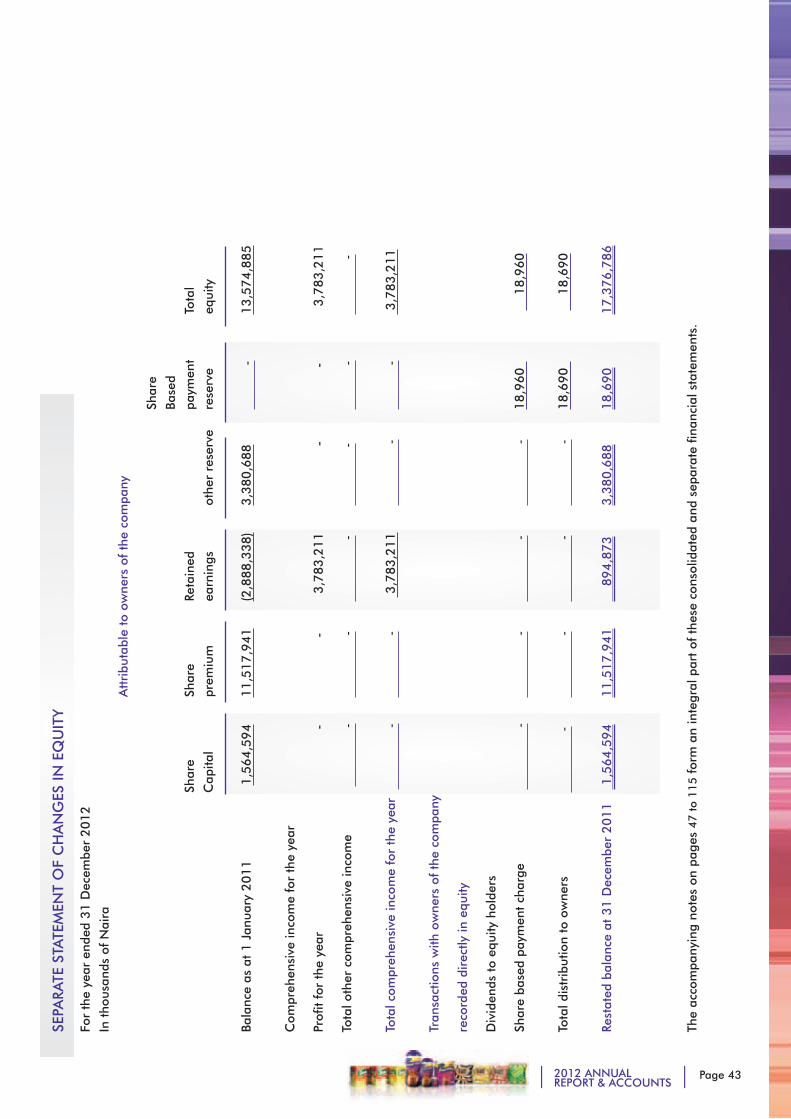
Page 432012 ANNUALREPORT & ACCOUNTS
SEPA
RATE
STA
TEM
ENT
OF
CH
AN
GES
IN E
QU
ITY
For
the
year
end
ed 3
1 D
ecem
ber
20
12
In t
hous
ands
of
Nai
ra
Att
ribu
tabl
e to
ow
ners
of
the
com
pany
Sh
are
Ba
sed
Sh
are
Sh
are
Re
tain
ed
paym
ent
Tota
l
Cap
ital
pr
emiu
m
earn
ings
ot
her
rese
rve
rese
rve
eq
uity
Bala
nce
as a
t 1 J
anua
ry 2
01
1
1,5
64
,59
4
11
,51
7,9
41
(2,8
88
,33
8)
3,3
80
,68
8
-
13,5
74,8
85
Com
preh
ensi
ve in
com
e fo
r th
e ye
ar
Profi
t fo
r th
e ye
ar
-
-
3
,78
3,2
11
-
-
3,7
83,2
11
Tota
l oth
er c
ompr
ehen
sive
inco
me
-
-
-
-
-
-
Tota
l com
preh
ensi
ve in
com
e fo
r th
e ye
ar
-
-
3
,78
3,2
11
-
-
3,7
83,2
11
Tran
sact
ions
with
ow
ners
of
the
com
pany
reco
rded
dir
ectly
in e
quity
Div
iden
ds t
o eq
uity
hol
ders
Shar
e ba
sed
paym
ent
char
ge
-
-
-
-
18,9
60
18,9
60
Tota
l dis
trib
utio
n to
ow
ners
-
-
-
-
18,6
90
18,6
90
Rest
ated
bal
ance
at
31
Dec
embe
r 2
01
1
1
,56
4,5
94
11
,51
7,9
41
8
94
,87
3
3,3
80
,68
8
18,6
90
17,3
76,7
86
The
acco
mpa
nyin
g no
tes
on p
ages
47
to
11
5 f
orm
an
inte
gral
par
t of
the
se c
onso
lidat
ed a
nd s
epar
ate
finan
cial
sta
tem
ents
.
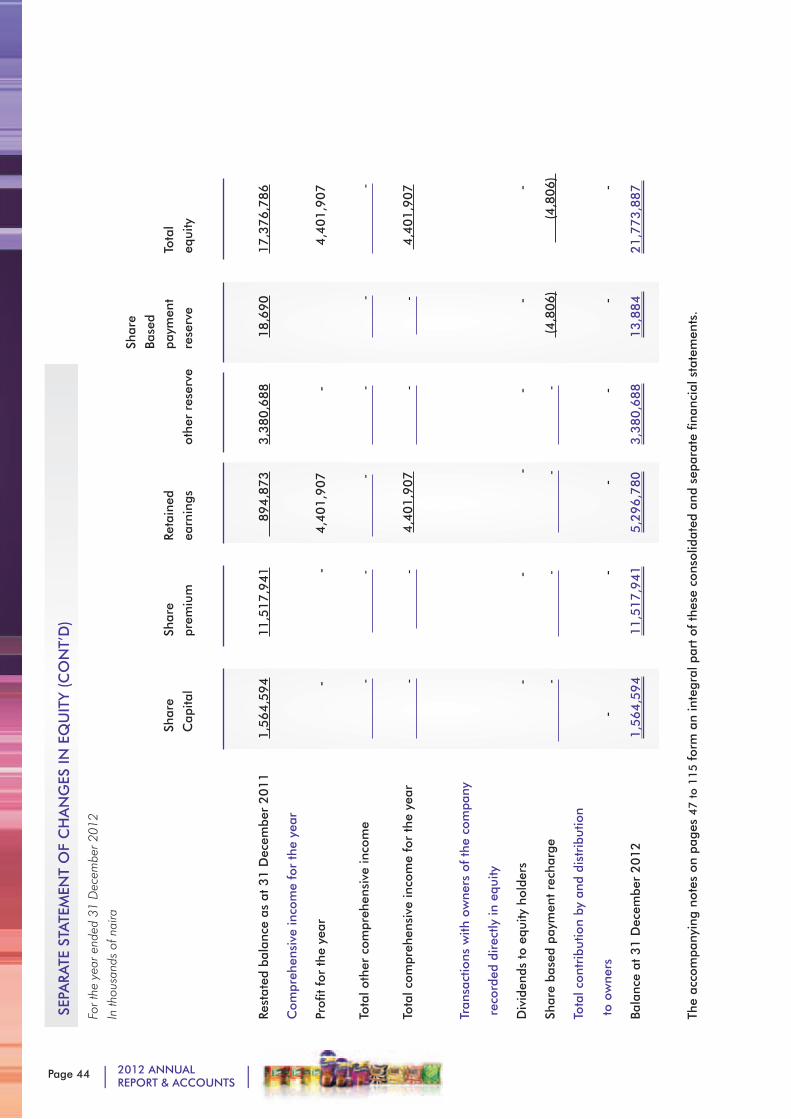
Page 44 2012 ANNUALREPORT & ACCOUNTS
SEP
ARA
TE S
TATE
MEN
T O
F C
HA
NG
ES IN
EQ
UIT
Y (C
ON
T’D
)
For t
he y
ear e
nded
31
Dec
embe
r 201
2
In th
ousa
nds
of n
aira
Shar
e
Ba
sed
Shar
e
Shar
e
Reta
ined
pa
ymen
t To
tal
C
apita
l
prem
ium
ea
rnin
gs
othe
r re
serv
e re
serv
e
equi
ty
Rest
ated
bal
ance
as
at 3
1 D
ecem
ber
20
11
1
,56
4,5
94
1
1,5
17
,94
1
8
94
,87
3
3,3
80,6
88
18,6
90
17,3
76,7
86
Com
preh
ensi
ve in
com
e fo
r th
e ye
ar
Profi
t fo
r th
e ye
ar
-
-
4
,40
1,9
07
-
4,4
01,9
07
Tota
l oth
er c
ompr
ehen
sive
inco
me
-
-
-
-
-
-
Tota
l com
preh
ensi
ve in
com
e fo
r th
e ye
ar
-
-
4
,40
1,9
07
-
-
4,4
01,9
07
Tran
sact
ions
with
ow
ners
of
the
com
pany
rec
orde
d di
rect
ly in
equ
ity
Div
iden
ds t
o eq
uity
hol
ders
-
-
-
-
-
-
Shar
e ba
sed
paym
ent
rech
arge
-
-
-
-
(4
,806)
(4,8
06)
Tota
l con
trib
utio
n by
and
dis
trib
utio
n
to
owne
rs
-
-
-
-
-
-
Bala
nce
at 3
1 D
ecem
ber
20
12
1
,56
4,5
94
1
1,5
17
,94
1
5
,29
6,7
80
3,3
80,6
88
1
3,8
84
21,7
73,8
87
The
acco
mpa
nyin
g no
tes
on p
ages
47
to
11
5 f
orm
an
inte
gral
par
t of
the
se c
onso
lidat
ed a
nd s
epar
ate
finan
cial
sta
tem
ents
.
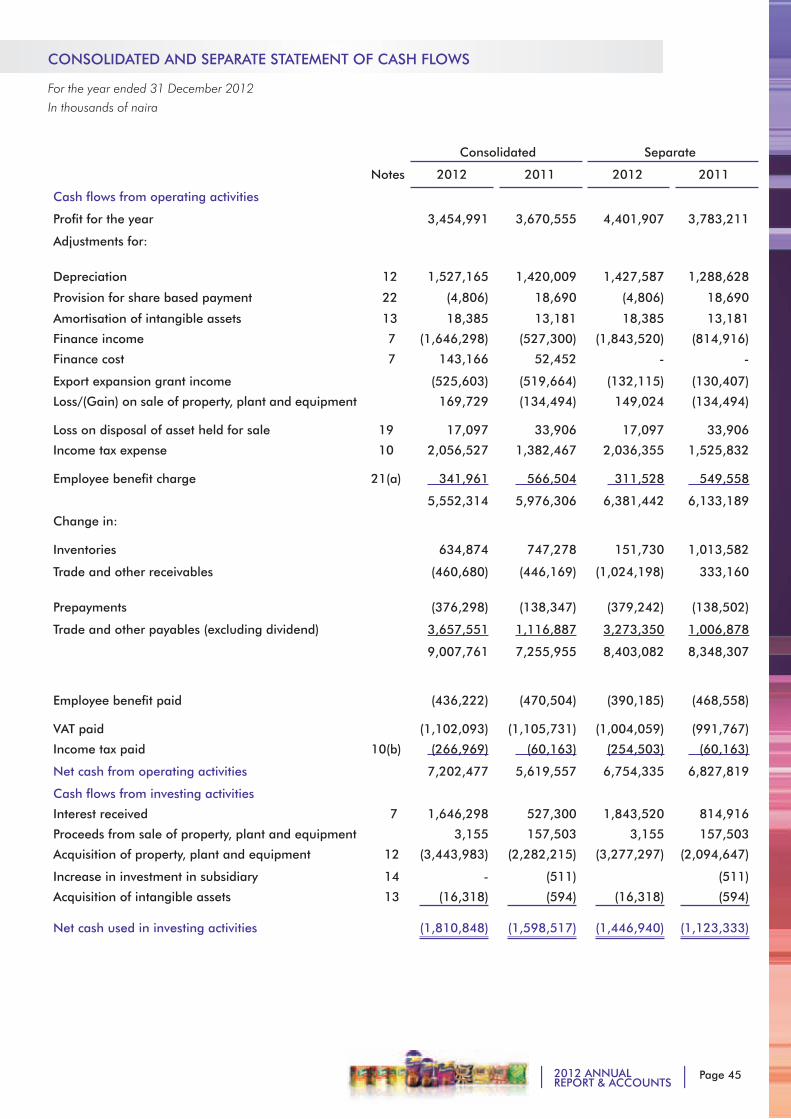
Page 452012 ANNUALREPORT & ACCOUNTS
CONSOLIDATED AND SEPARATE STATEMENT OF CASH FLOWS
For the year ended 31 December 2012
In thousands of naira
Consolidated Separate
Notes 2012 2011 2012 2011
Cash flows from operating activities
Profit for the year 3,454,991 3,670,555 4,401,907 3,783,211
Adjustments for:
Depreciation 12
1,527,165 1,420,009 1,427,587 1,288,628
Provision for share based payment 22 (4,806) 18,690 (4,806) 18,690
Amortisation of intangible assets 13 18,385 13,181 18,385 13,181
Finance income 7 (1,646,298) (527,300) (1,843,520) (814,916)
Finance cost 7 143,166 52,452 - -
Export expansion grant income (525,603) (519,664) (132,115) (130,407)
Loss/(Gain) on sale of property, plant and equipment
Loss on disposal of asset held for sale 19
169,729
17,097
(134,494)
33,906
149,024
17,097
(134,494)
33,906
Income tax expense
Employee benefit charge
10
21(a)
2,056,527
341,961
1,382,467
566,504
2,036,355
311,528
1,525,832
549,558
5,552,314 5,976,306 6,381,442 6,133,189
Change in:
Inventories
634,874 747,278 151,730 1,013,582
Trade and other receivables (460,680) (446,169) (1,024,198) 333,160
Prepayments
(376,298) (138,347)
(379,242) (138,502)
Trade and other payables (excluding dividend) 3,657,551 1,116,887 3,273,350 1,006,878
9,007,761 7,255,955 8,403,082 8,348,307
Employee benefit paid
VAT paid
(436,222)
(1,102,093)
(470,504)
(1,105,731)
(390,185)
(1,004,059)
(468,558)
(991,767)
Income tax paid 10(b) (266,969) (60,163) (254,503) (60,163)
Net cash from operating activities 7,202,477 5,619,557 6,754,335 6,827,819
Cash flows from investing activities
Interest received 7 1,646,298 527,300 1,843,520 814,916
Proceeds from sale of property, plant and equipment 3,155 157,503 3,155 157,503
Acquisition of property, plant and equipment 12 (3,443,983) (2,282,215) (3,277,297) (2,094,647)
Increase in investment in subsidiary 14 - (511) (511)
Acquisition of intangible assets 13 (16,318) (594) (16,318) (594)
Net cash used in investing activities (1,810,848) (1,598,517) (1,446,940) (1,123,333)
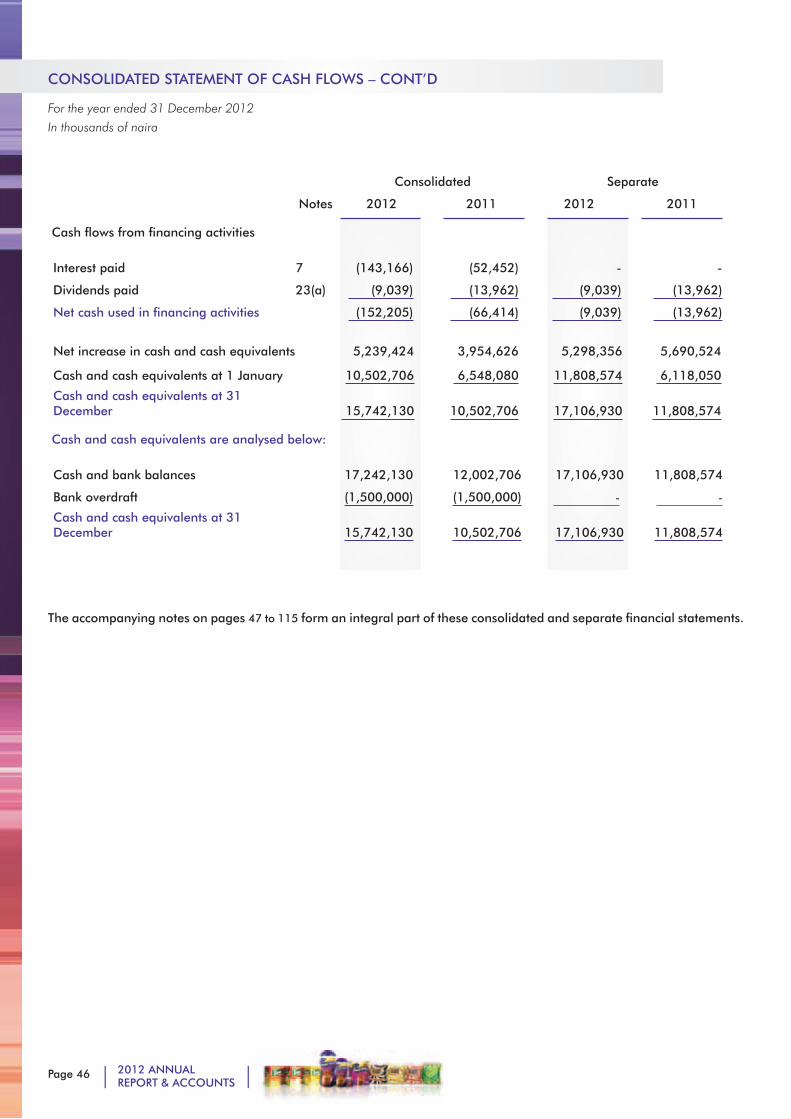
Page 46 2012 ANNUALREPORT & ACCOUNTS
CONSOLIDATED STATEMENT OF CASH FLOWS – CONT’D
For the year ended 31 December 2012
In thousands of naira
Consolidated Separate
Notes 2012 2011 2012 2011
Cash flows from financing activities
Interest paid 7 (143,166) (52,452) - -
Dividends paid 23(a) (9,039) (13,962) (9,039) (13,962)
Net cash used in financing activities (152,205) (66,414) (9,039) (13,962)
Net increase in cash and cash equivalents 5,239,424 3,954,626 5,298,356 5,690,524
Cash and cash equivalents at 1 January 10,502,706 6,548,080 11,808,574 6,118,050
Cash and cash equivalents at 31 December 15,742,130 10,502,706 17,106,930
11,808,574
Cash and cash equivalents are analysed below:
Cash and bank balances 17,242,130 12,002,706 17,106,930 11,808,574
Bank overdraft (1,500,000) (1,500,000) - -
Cash and cash equivalents at 31 December 15,742,130 10,502,706 17,106,930 11,808,574
The accompanying notes on pages 47 to 115 form an integral part of these consolidated and separate financial statements.
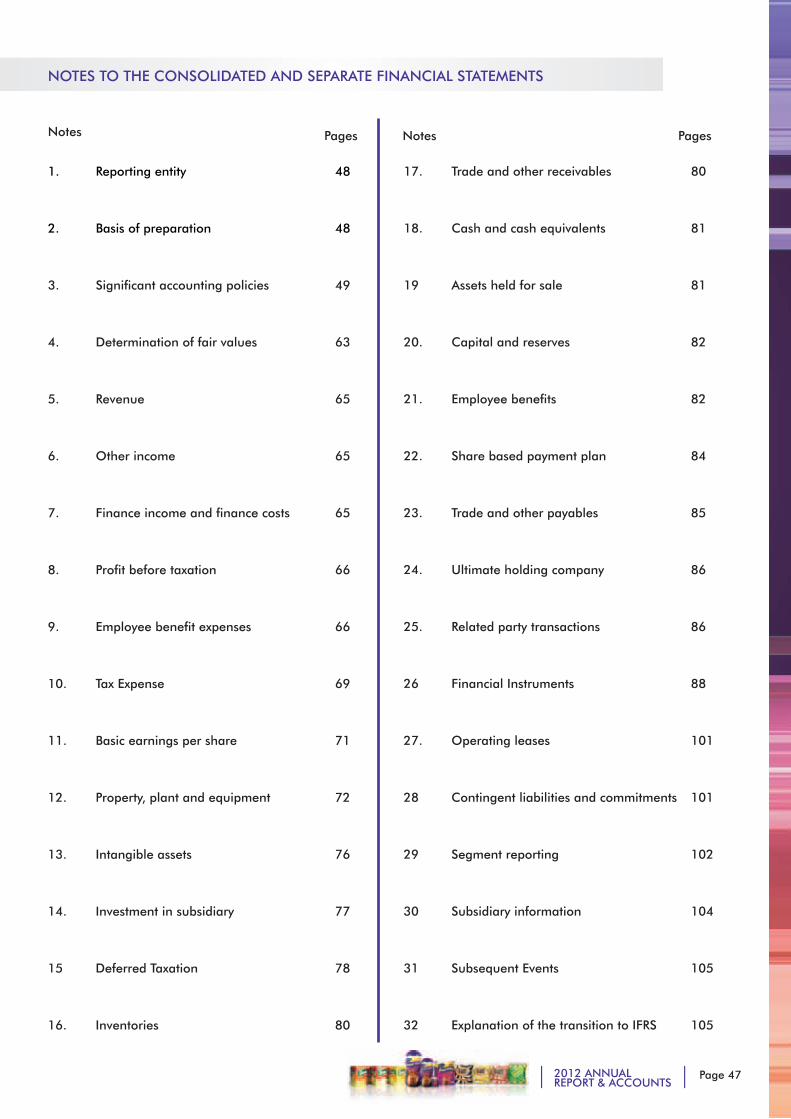
Page 472012 ANNUALREPORT & ACCOUNTS
1. Reporting entity 48
2. Basis of preparation 48
3. Significant accounting policies 49
4. Determination of fair values 63
5. Revenue 65
6. Other income 65
7. Finance income and finance costs 65
8. Profit before taxation 66
9. Employee benefit expenses 66
10. Tax Expense 69
11. Basic earnings per share 71
12. Property, plant and equipment 72
13. Intangible assets 76
14. Investment in subsidiary 77
15 Deferred Taxation 78
16. Inventories 80
17. Trade and other receivables 80
18. Cash and cash equivalents 81
19 Assets held for sale 81
20. Capital and reserves 82
21. Employee benefits 82
22. Share based payment plan 84
23. Trade and other payables 85
24. Ultimate holding company 86
25. Related party transactions 86
26 Financial Instruments 88
27. Operating leases 101
28 Contingent liabilities and commitments 101
29 Segment reporting 102
30 Subsidiary information 104
31 Subsequent Events 105
32 Explanation of the transition to IFRS 105
NOTES TO THE CONSOLIDATED AND SEPARATE FINANCIAL STATEMENTS
Notes Pages Notes Pages
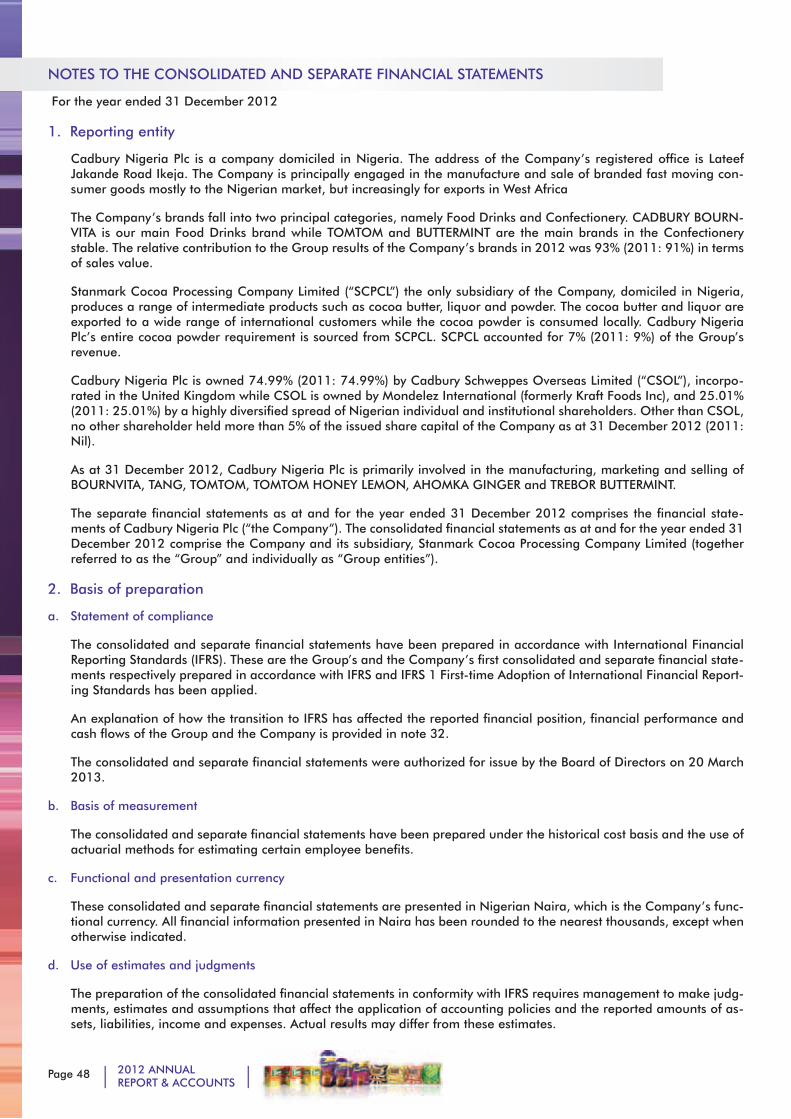
Page 48 2012 ANNUALREPORT & ACCOUNTS
NOTES TO THE CONSOLIDATED AND SEPARATE FINANCIAL STATEMENTS
For the year ended 31 December 2012
1. Reporting entity
Cadbury Nigeria Plc is a company domiciled in Nigeria. The address of the Company’s registered office is Lateef Jakande Road Ikeja. The Company is principally engaged in the manufacture and sale of branded fast moving con-sumer goods mostly to the Nigerian market, but increasingly for exports in West Africa
The Company’s brands fall into two principal categories, namely Food Drinks and Confectionery. CADBURY BOURN-VITA is our main Food Drinks brand while TOMTOM and BUTTERMINT are the main brands in the Confectionery stable. The relative contribution to the Group results of the Company’s brands in 2012 was 93% (2011: 91%) in terms of sales value.
Stanmark Cocoa Processing Company Limited (“SCPCL”) the only subsidiary of the Company, domiciled in Nigeria, produces a range of intermediate products such as cocoa butter, liquor and powder. The cocoa butter and liquor are exported to a wide range of international customers while the cocoa powder is consumed locally. Cadbury Nigeria Plc’s entire cocoa powder requirement is sourced from SCPCL. SCPCL accounted for 7% (2011: 9%) of the Group’s revenue.
Cadbury Nigeria Plc is owned 74.99% (2011: 74.99%) by Cadbury Schweppes Overseas Limited (“CSOL”), incorpo-rated in the United Kingdom while CSOL is owned by Mondelez International (formerly Kraft Foods Inc), and 25.01% (2011: 25.01%) by a highly diversified spread of Nigerian individual and institutional shareholders. Other than CSOL, no other shareholder held more than 5% of the issued share capital of the Company as at 31 December 2012 (2011: Nil).
As at 31 December 2012, Cadbury Nigeria Plc is primarily involved in the manufacturing, marketing and selling of BOURNVITA, TANG, TOMTOM, TOMTOM HONEY LEMON, AHOMKA GINGER and TREBOR BUTTERMINT.
The separate financial statements as at and for the year ended 31 December 2012 comprises the financial state-ments of Cadbury Nigeria Plc (“the Company”). The consolidated financial statements as at and for the year ended 31 December 2012 comprise the Company and its subsidiary, Stanmark Cocoa Processing Company Limited (together referred to as the “Group” and individually as “Group entities”).
2. Basis of preparation
a. Statement of compliance
The consolidated and separate financial statements have been prepared in accordance with International Financial Reporting Standards (IFRS). These are the Group’s and the Company’s first consolidated and separate financial state-ments respectively prepared in accordance with IFRS and IFRS 1 First-time Adoption of International Financial Report-ing Standards has been applied.
An explanation of how the transition to IFRS has affected the reported financial position, financial performance and cash flows of the Group and the Company is provided in note 32.
The consolidated and separate financial statements were authorized for issue by the Board of Directors on 20 March 2013.
b. Basis of measurement
The consolidated and separate financial statements have been prepared under the historical cost basis and the use of actuarial methods for estimating certain employee benefits.
c. Functional and presentation currency
These consolidated and separate financial statements are presented in Nigerian Naira, which is the Company’s func-tional currency. All financial information presented in Naira has been rounded to the nearest thousands, except when otherwise indicated.
d. Use of estimates and judgments
The preparation of the consolidated financial statements in conformity with IFRS requires management to make judg-ments, estimates and assumptions that affect the application of accounting policies and the reported amounts of as-sets, liabilities, income and expenses. Actual results may differ from these estimates.
Page 492012 ANNUALREPORT & ACCOUNTS
Estimates and underlying assumptions are reviewed on an ongoing basis. Revisions to accounting estimates are rec-ognized in the year in which the estimates are revised and in any future years affected.
Information about critical judgments in applying accounting policies that have the most significant effect on the amounts recognized in the consolidated financial statements is included in the following notes:
Note 21 – Employee benefit.
Note 22 – Share-based payment plan
Information about assumptions and estimation uncertainties that have a significant risk of resulting in a material ad-justment within the next financial year are included in the following notes:
Note 15 – Deferred taxation
Note 21 – Employee benefit
Note 28 – Contingent liabilities and commitments
Note 23 – Trade and other payables
e. Change in accounting estimate
In previous years, Intangible assets (software) are amortized on a straight-line basis in the statement of comprehensive income over a period of seven (7) years. Effective 1 January 2012, software are amortized on a straight-line basis in the statement of comprehensive income over a period of five (5) years. The change in the useful life of software from seven years in previous years to five years in current year decreased profit in current year by N5.06 million.
3. Significant accounting policies
The accounting policies set out below have been applied consistently to all years presented in these consolidated and
separate financial statements and in preparing the opening IFRS statements of financial position at January 1, 2011
for the purposes of the transition to IFRS, unless otherwise indicated.
The accounting policies have been applied consistently by the Group entity.
(a) Basis of consolidation
(i) Business combinations
Acquisitions prior to 1 January 2011
As part of its transition to IFRS, the Group elected not to restate business combinations that occurred prior to the
date of transition. The only acquisition made by the Group prior to the date of transition was the acquisition of
Stanmark Cocoa Processing Company Limited.
Acquisitions subsequent to 1 January 2011
Business combinations are accounted for using the acquisition method as at the acquisition date, which is the
date on which control is transferred to the Group. Control is the power to govern the financial and operating
policies of an entity so as to obtain benefits from its activities. In assessing control, the Group takes into
consideration potential voting rights that are currently exercisable.
The Group measures goodwill at the acquisition date as:
• the fair value of the consideration transferred; plus
• the recognized amount of any non-controlling interests in the acquiree; plus
• if the business combination is achieved in stages, the fair value of the pre-existing equity interest in the acquiree; less
• the net recognised amount (generally fair value) of the identifiable assets acquired and liabilities assumed
Page 50 2012 ANNUALREPORT & ACCOUNTS
When the excess is negative, a bargain purchase gain is recognised immediately in profit or loss.
The consideration transferred does not include amounts related to the settlement of pre-existing relationships.
Such amounts are generally recognized in profit or loss.
Transaction costs, other than those associated with the issue of debt or equity securities, that the Group incurs in
connection with a business combination are expensed as incurred.
Any contingent consideration payable is measured at fair value at the acquisition date. If the contingent
consideration is classified as equity, then it is not re-measured and settlement is accounted for within equity.
Otherwise, subsequent changes in the fair value of the contingent consideration are recognized in profit or loss.
(ii) Non-controlling interests
For each business combination, the group elects to measure any non-controlling interests in the acquire either:
• At fair value, or
• At their proportionate share of the acquiree’s identifiable net asset, which are generally fair values.
Changes in the Group’s interest in a subsidiary that do not result in a loss of control are accounted for as
transactions with owners in their capacity as owners. Adjustments to non-controlling interests are based on a
proportionate amount of the net assets of the subsidiary. No adjustment are made to goodwill and no gain or loss
is recognized in profit or loss
(iii) Subsidiaries
A subsidiary is an entity controlled by the group. The financial statements of the subsidiary are included in the
consolidated financial statements from the date that control commences until the date that control ceases. The
accounting policies of the subsidiary have been modified where necessary to align them with the policies adopted
by the Group.
(iv) Loss of control
On the loss of control, the Group de-recognises the assets and liabilities of the subsidiary, any non-controlling
interests and the other components of equity related to the subsidiary. Any surplus or deficit arising on the loss
of control is recognised as a profit or loss in the statement of other comprehensive income. If the Group retains
any interest in the previous subsidiary, then such interest is measured at fair value at the date that control is
lost. Subsequently it is accounted for as an equity-accounted investee or as an available for sale financial asset
depending on the level of influence retained.
(v) Transactions eliminated on consolidation
Intra-group balances and transactions, and any unrealized income and expenses arising from intra-group
transactions, are eliminated in preparing the consolidated financial statements. Unrealized gains arising from
transactions with equity accounted investees are eliminated against the investment to the extent of the Group’s
interest in the investee. Unrealized losses are eliminated in the same way as unrealized gains, but only to the
extent that there is no evidence of impairment.
(b) Foreign currency transactions
Transactions denominated in foreign currencies are translated and recorded in Naira at the actual exchange rates
as of the date of the transaction. Monetary assets and liabilities denominated in foreign currencies at the reporting
date are retranslated at the rates of exchange prevailing at that date. The foreign currency gain or loss on monetary
items is the difference between amortized cost in the functional currency at the beginning of the period, adjusted
for effective interest and payments during the period, and the amortized cost in foreign currency translated at the
Page 512012 ANNUALREPORT & ACCOUNTS
exchange rate at the end of the reporting period. Non-monetary assets and liabilities denominated in foreign
currencies that are measured at fair value are retranslated to the functional currency at the exchange rate at the
date that the fair value was determined.
Foreign currency differences arising on retranslation are recognized in profit or loss, except for qualifying cash flow
hedges, which are recognized in other comprehensive income. Non-monetary items that are measured in terms of
historical cost in a foreign currency are translated using the exchange rate at the date of the transaction.
(c) Financial instruments
i. Non-derivative financial assets
The Company initially recognizes loans and receivables and deposits on the date that they are originated. All other
financial assets (including assets designated at fair value through profit or loss) are recognized initially on the trade
date at which the Company becomes a party to the contractual provisions of the instrument.
The Company derecognizes a financial asset when the contractual rights to the cash flows from the asset expire, or it
transfers the rights to receive the contractual cash flows on the financial asset in a transaction in which substantially
all the risks and rewards of ownership of the financial asset are transferred. Any interest in transferred financial
assets that is created or retained by the Company is recognized as a separate asset or liability.
Financial assets and liabilities are offset and the net amount presented in the statement of financial position when, and
only when, the Company has a legal right to offset the amounts and intends either to settle on a net basis or to realize
the asset and settle the liability simultaneously.
The Company has the following non-derivative financial assets: financial assets at fair value through profit or loss,
loans and receivables.
Financial assets at fair value through profit or loss
A financial asset is classified at fair value through profit or loss if it is classified as held for trading or is designated
as such upon initial recognition. Financial assets are designated at fair value through profit or loss if the Company
manages such investments and makes purchase and sale decisions based on their fair value in accordance with the
Company’s documented risk management or investment strategy. Upon initial recognition attributable transaction
costs are recognized in profit or loss as incurred. Financial assets at fair value through profit or loss are measured
at fair value, and changes therein are recognized in profit or loss.
Loans and receivables
Loans and receivables are financial assets with fixed or determinable payments that are not quoted in an active
market. Such assets are recognized initially at fair value plus any directly attributable transaction costs. Subsequent
to initial recognition loans and receivables are measured at amortized cost using the effective interest method, less
any impairment losses. Loans and receivables comprise trade and other receivables.
Cash and cash equivalents
Cash and cash equivalents comprise cash on hand; cash balances with banks and call deposits with original
maturities of three months or less. Bank overdrafts that are repayable on demand and form an integral part of the
Company’s cash management are included as a component of cash and cash equivalents for the purpose of cash
flow statement.
ii. Non-derivative financial liabilities
All financial liabilities (including liabilities designated at fair value through profit or loss) are recognized initially on
Page 52 2012 ANNUALREPORT & ACCOUNTS
the trade date at which the Company becomes a party to the contractual provisions of the instrument.
The Company derecognizes a financial liability when its contractual obligations are discharged or cancelled or
expire.
Financial assets and liabilities are offset and the net amount presented in the statement of financial position when, and
only when, the Company has a legal right to offset the amounts and intends either to settle on a net basis or to realize
the asset and settle the liability simultaneously.
The Company has the following non-derivative financial liabilities: bank overdrafts, trade and other payables. Such
financial liabilities are recognized initially at fair value plus any directly attributable transaction costs. Subsequent
to initial recognition these financial liabilities are measured at amortized cost using the effective interest method.
iii. Share capital
The Company has only one class of shares, ordinary shares. Ordinary shares are classified as equity. When new
shares are issued, they are recorded in share capital at their par value. The excess of the issue price over the par
value is recorded in the share premium reserve.
Incremental costs directly attributable to the issue of ordinary shares are recognized as a deduction from equity, net of
any tax effects.
(d) Property, plant and equipment
(i) Recognition and measurement
Items of property, plant and equipment are measured at cost less accumulated depreciation and any accumulated
impairment losses. For the purposes of application of IFRS 1, the cost of certain items of property, plant and
equipment, namely land and buildings and plant and machinery was determined by reference to previous
valuation prior to the date of transition to IFRS. The Group elected to apply the optional exemption to use this
previous valuation as deemed cost as 1 January 2011, the date of transition to IFRS.
Cost includes expenditure that is directly attributable to the acquisition of the asset. Property, plant and
equipment under construction are disclosed as capital work-in-progress. The cost of construction recognised
includes the cost of materials and direct labor, any other costs directly attributable to bringing the assets to a
working condition for their intended use, the costs of dismantling and removing the items and restoring the site
on which they are located, and borrowing costs on qualifying assets.
Purchased software that is integral to the functionality of the related equipment is capitalized as part of the
equipment.
When parts of an item of property, plant and equipment have different useful lives, they are accounted for as
separate items (major components) of property, plant and equipment.
Gains or losses on disposal of an item of property, plant and equipment are determined by comparing the
proceeds from disposal with the carrying amount of property, plant and equipment, and are recognized as profit
or loss in the statement of comprehensive income.
(ii) Subsequent costs
Subsequent expenditure is capitalized only when it is probable that the future economic benefits associated with
the expenditure will flow to the group. Ongoing repairs and maintenance are expensed as incurred.
(iii) Depreciation
Page 532012 ANNUALREPORT & ACCOUNTS
Items of property, plant and equipment are depreciated from the date they are available for use or, in respect
of capital-work-in-progress, from the date that the asset is completed and ready for use.
Depreciation is calculated to write off the cost of items of property, plant and equipment less their estimated
residual values using a straight-line basis over their estimated useful lives. Depreciation is generally recognized
in profit or loss, unless the amount is included in the carrying amount of another asset. Leased assets are
depreciated over the shorter of the lease term and their useful lives unless it is reasonably certain that the Group
will obtain ownership by the end of the lease term in which case the assets are depreciated over the useful life.
The estimated useful lives for the current and comparative years of significant items of property, plant and
equipment are as follows:
• Leasehold land – Over the lease term period
• Buildings – 40 years
• Plant and Machinery
» Power Generating Equipment –10 years
» Packaging Equipment – 10 years
» Food and Candy Processing Equipment – 10 years
» Ovens 2 years
• Motor Vehicles – 5 years
• Furniture and Equipment – 6.67 years
• Software – 5 years
Depreciation methods, useful lives and residual values are reviewed at each financial year end and adjusted if
appropriate.
Capital work-in-progress is not depreciated. The attributable cost of each asset is transferred to the relevant
asset category immediately the asset is available for use and depreciated accordingly.
Depreciation on revalued buildings is recognised in profit or loss. On the subsequent sale or retirement of
a revalued property, the attributable revaluation surplus remaining in the properties revaluation reserve is
transferred directly to retained earnings. No transfer is made from the revaluation reserve to retained earnings
except when an asset is derecognised.
(e) Intangible assets
(i) Research and Expenditure
Expenditure on research activities, undertaken with the prospect of gaining new scientific or technical knowledge
and understanding, is recognised in profit or loss as incurred.
Development activities involve a plan or design for the production of new or substantially improved products
and processes. Development expenditure is capitalised only if development costs can be measured reliably,
the product or process is technically and commercially feasible, future economic benefits are probable, and
the Group intends to and has sufficient resources to complete development and to use or sell the asset. The
expenditure capitalised includes the cost of materials, direct labour, overhead costs that are directly attributable
to preparing the asset for its intended use, and capitalised borrowing costs. Other development expenditure is
recognised in profit or loss as incurred.
Capitalised development expenditure is measured at cost less accumulated amortisation and any accumulated
Page 54 2012 ANNUALREPORT & ACCOUNTS
impairment losses.
(ii) Subsequent expenditure
Subsequent expenditure is capitalized only when it increases the future economic benefits embodied in the
specific asset to which it relates. All other expenditure, including expenditure on internally generated goodwill
and brands, is recognized in profit or loss as incurred.
(iii) Other intangible assets
Other intangible assets that are acquired by the group and have finite useful lives are measured at cost less
accumulated amortization and any accumulated impairment losses.
(iv) Amortization of intangible assets other than goodwill
Intangible assets are amortized on a straight-line basis in profit or loss over their estimated useful lives, from
the date that they are available for use.. The estimated useful life of computer software for the current and
comparative years is 5 years (formerly 7 years). Amortisation methods, useful lives and residual values are
reviewed at each reporting date and adjusted if appropriate.
(f) Leases
i. Leased assets
Assets held by the Group under leases which transfer to the Group substantially all of the risks and rewards of
ownership are classified as finance leases. On initial recognition, the leased asset is measured at an amount
equal to the lower of its fair value and the present value of the minimum lease payments. Subsequent to initial
recognition, the asset is accounted for in accordance with the accounting policy applicable to that asset.
Assets held under other leases are classified as operating leases and are not recognised in the Group’s statement
of financial position.
ii. Lease Payments
Payments made under operating leases are recognised in profit or loss on a straight-line basis over the term of
the lease. Lease incentives received are recognised as an integral part of the total lease expense, over the term
of the lease.
Minimum lease payments made under finance leases are apportioned between the finance expense and the
reduction of the outstanding liability. The finance expense is allocated to each period during the lease term so
as to produce a constant periodic rate of interest on the remaining balance of the liability.
iii. Determining whether an arrangement contains a lease
At inception of an arrangement, the Group determines whether such an arrangement is or contains a lease.
This will be the case if the following two criteria are met:
• the fulfillment of the arrangement is dependent on the use of a specific asset or assets; and
• the arrangement contains a right to use the asset(s).
At inception or on reassessment of the arrangement, the Group separates payments and other consideration required by such an arrangement into those for the lease and those for other elements on the basis of their relative fair values. If the Group concludes for a finance lease that it is impracticable to separate the payments reliably, then an asset and a liability are recognised at an amount equal to the fair value of the underlying as-set. Subsequently the liability is reduced as payments are made and an imputed finance cost on the liability is

Page 552012 ANNUALREPORT & ACCOUNTS
Page 56 2012 ANNUALREPORT & ACCOUNTS
recognised using the Group’s incremental borrowing rate.
(g) Inventories
Inventories are measured at the lower of cost and net realizable value. The cost of inventories includes expenditure
incurred in acquiring the inventories, production or conversion costs and other costs incurred in bringing them to
their existing location and condition. In the case of manufactured inventories and work-in-progress, cost includes an
appropriate share of production overheads based on normal operating capacity. Cost also includes transfers from
equity of any gain or loss on qualifying cash flow hedges of foreign currency purchases of inventory.
The basis of costing is as follows:
• Engineering spares and consumable stock - purchase cost on a weighted average basis including transpor-
tation and clearing costs;
• Raw, sundry and non-returnable packaging materials, finished products and products in process measured
on the basis of standard cost adjusted for variances. The cost of finished goods and products in progress
comprises raw materials, direct labour, other direct costs and related production overheads;
• Stock-in-transit - purchase cost incurred to date;
Weighted average cost and standard cost are reviewed periodically to ensure they consistently approximate histori-cal cost.Net realizable value is the estimated selling price in the ordinary course of business, less the estimated costs of completion and selling expenses. Stock values are adjusted for obsolete, slow-moving or defective items where
appropriate.
(h) Impairment
(i) Non-derivative financial assets
A financial asset not carried at fair value through profit or loss is assessed at each reporting date to determine
whether there is objective evidence that it is impaired. A financial asset is impaired if objective evidence indicates
that a loss event has occurred after the initial recognition of the asset, and that the loss event had a negative
effect on the estimated future cash flows of that asset that can be reliably estimated.
Objective evidence that financial assets are impaired can include default or delinquency by a debtor, restructuring
of an amount due to the Group on terms that the Group would not consider otherwise, indications that a debtor
or issuer will enter bankruptcy, or the disappearance of an active market for a security. In addition, for an
investment in an equity security, a significant or prolonged decline in its fair value below its cost is objective
evidence of impairment.
The Group considers evidence of impairment for receivables at both a specific asset and collective level. All
individually significant receivables are assessed for specific impairment. All individually significant receivables
found not to be specifically impaired are then collectively assessed for any impairment that has been incurred
but not yet identified. Receivables that are not individually significant are collectively assessed for impairment
by grouping together receivables with similar risk characteristics.
In assessing collective impairment the Group uses historical trends of the probability of default, timing of
recoveries and the amount of loss incurred, adjusted for management’s judgment as to whether current
economic and credit conditions are such that the actual losses are likely to be greater or less than suggested
by historical trends.
An impairment loss in respect of a financial asset measured at amortized cost is calculated as the difference
between its carrying amount and the present value of the estimated future cash flows discounted at the asset’s
original effective interest rate. Losses are recognized in profit or loss and reflected in an allowance account
Page 572012 ANNUALREPORT & ACCOUNTS
against receivables. Interest on the impaired asset, where applicable, continues to be recognized through the
unwinding of the discount. When a subsequent event causes the amount of impairment loss to decrease, the
decrease in impairment loss is reversed through profit or loss.
(ii) Non-financial assets
The carrying amounts of the Group’s non-financial assets, other than inventories and deferred tax assets,
are reviewed at each reporting date to determine whether there is any indication of impairment. If any such
indication exists, then the asset’s recoverable amount is estimated. Goodwill and intangible assets that have
indefinite useful lives are tested annually for impairment. An impairment loss is recognized if the carrying
amount of an asset or cash generating unit (CGU) exceeds its recoverable amount.
The recoverable amount of an asset or cash-generating unit is the greater of its value in use and its fair value
less costs to sell. In assessing value in use, the estimated future cash flows are discounted to their present
value using a pre-tax discount rate that reflects current market assessments of the time value of money and the
risks specific to the asset. For the purpose of impairment testing, assets that cannot be tested individually are
grouped together into the smallest group of assets that generates cash inflows from continuing use that are
largely independent of the cash inflows of other assets or groups of assets (the “cash-generating unit, or CGU”).
For the purposes of goodwill impairment testing, goodwill acquired in a business combination is allocated to the
CGU, or the group of CGUs, that is expected to benefit from the synergies of the combination. This allocation
is subject to an operating segment ceiling test and reflects the lowest level at which that goodwill is monitored
for internal reporting purposes.
The Group’s corporate assets do not generate separate cash inflows. If there is an indication that a corporate
asset may be impaired, then the recoverable amount is determined for the CGU to which the corporate asset
belongs.
An impairment loss is recognized if the carrying amount of an asset or its CGU exceeds its estimated recoverable
amount. Impairment losses are recognized in profit or loss. Impairment losses recognized in respect of CGUs
are allocated first to reduce the carrying amount of any goodwill allocated to the units, and then to reduce the
carrying amounts of the other assets in the unit (group of units) on a pro rata basis.
An impairment loss in respect of goodwill is not reversed. In respect of other assets, impairment losses recognized
in prior years are assessed at each reporting date for any indications that the loss has decreased or no longer
exists. An impairment loss is reversed if there has been a change in the estimates used to determine the
recoverable amount. An impairment loss is reversed only to the extent that the asset’s carrying amount does
not exceed the carrying amount that would have been determined, net of depreciation or amortization, if no
impairment loss had been recognized.
Goodwill that forms part of the carrying amount of an investment in an associate is not recognized separately,
and therefore is not tested for impairment separately. Instead, the entire amount of the investment in an
associate is tested for impairment as a single asset when there is objective evidence that the investment in an
associate may be impaired.
(i) Employee benefits
(i) Defined benefit gratuity scheme
A defined benefit plan is a post-employment benefit plan other than a defined contribution plan. The Group’s
net obligation in respect of defined benefit gratuity scheme is calculated by estimating the amount of future
benefit that employees have earned in return for their service in the current and prior years and that benefit is
discounted to determine its present value. In determining the liability for employee benefits under the defined
benefit scheme, consideration is given to future increases in salary rates and the Group’s experience with staff
Page 58 2012 ANNUALREPORT & ACCOUNTS
turnover.
The recognised liability is determined by an independent actuarial valuation every year using the projected unit
credit method. Actuarial gains and losses arising from differences between the actual and expected outcome
in the valuation of the obligation are recognized fully in profit or loss. The effect of any curtailment is also
charged in full in profit or loss immediately the curtailment occurs. The discount rate is the yield on Federal
Government of Nigeria issued bonds that have maturity dates approximately the terms of the company’s
obligation. Although the scheme is not funded, the Company ensures that adequate arrangements are in place
to meet its obligations under the scheme.
(ii) Defined contribution scheme
A defined contribution plan is a post-employment benefit plan under which an entity pays fixed contributions
into a separate entity and has no legal or constructive obligation to pay further amounts in respect of all
employee benefits relating to employee service in current and prior periods. In line with the provisions of the
Pension Reform Act 2004, the Group entities have instituted a defined contribution pension scheme for their
permanent staff. Staff contributions to the scheme are funded through payroll deductions. Obligations for
contributions to the defined contribution plan are recognised as employee benefit expense in profit or loss in
the periods which related services are rendered by employees. Employees contribute 7.5% each of their Basic
salary, Transport & Housing Allowances to the Fund on a monthly basis. The Group entities contribution is
10.3% of each employee’s Basic salary, Transport & Housing Allowances.
(iii) Short-term employee benefits
Short-term employee benefit obligations are measured on an undiscounted basis and are expensed as the
related service is provided.
A liability is recognized for the amount expected to be paid under short-term cash bonus or profit sharing plans
if the group has a present legal or constructive obligation to pay this amount as a result of past service provided
by the employee, and the obligation can be estimated reliably.
(iv) Share-based payment transactions
The Company participates in a Group share-based payment arrangement instituted by its ultimate parent,
Mondelēz International (formerly Kraft Foods Inc). Certain employees of the Company participate in this
arrangement which is based on the shares of Mondelez International. The grant date fair value of share-
based payment awards granted to employees is recognized as an employee expense, with a corresponding
increase in equity, over the years that the employees unconditionally become entitled to the awards. The
amount recognized as an expense is adjusted to reflect the number of awards for which the related service
and non-market performance conditions are expected to be met, such that the amount ultimately recognized
as expense is based on the number of awards that do meet the related service and non-market performance
conditions at the vesting date. For share-based payment awards with non-vesting conditions, the grant date fair
value of the share-based payment is measured to reflect such conditions and there is no true-up for differences
between expected and actual outcomes.
The fair value of the amount payable to employees in respect of share appreciation rights, which are settled in
cash, is recognized as an expense with a corresponding increase in accrued liability, over the period that the
employees become unconditionally entitled to payment. The liability is premeasured at each reporting date
and at settlement date based on the fair value of the share appreciation rights. Any changes in the liability are
recognized as employee benefit in the administrative expenses in profit or loss.
Share-based payment arrangements in which the Company receives goods or services and has no obligation
to settle the share-based payment transaction are accounted for as equity-settled share-based payment
Page 592012 ANNUALREPORT & ACCOUNTS
transactions, regardless of the equity instrument awarded.
(j) Other long-term employee benefits
The Company’s other long-term employee benefits represents Long Service Awards scheme instituted for all
permanent employees. The Company’s obligation in respect of the Long Service Awards scheme is the amount
of future benefits that employees have earned in return for their service in the current and prior periods. The
benefit is discounted to determine its present value. The discount rate is the yield at the reporting date on Federal
Government of Nigeria issued bonds that have maturity dates approximating the term of the Company’s obligation.
The calculation is performed using the Projected Unit Credit method. Any actuarial gains and losses are recognized
fully in profit or loss.
(k) Termination benefits
Termination benefits are recognized as an expense when the Company is committed demonstrably, without realistic
possibility of withdrawal, to a formal detailed plan to either terminate employment before the normal retirement
date, or to provide termination benefits as a result of an offer made to encourage voluntary redundancy. Termination
benefits for voluntary redundancies are recognized as an expense if the Company has made an offer of voluntary
redundancy, it is probable that the offer will be accepted, and the number of acceptances can be estimated reliably.
If benefits are payable more than 12 months after the reporting period, then they are discounted to their present
value.
(l) Provisions
A provision is recognized if, as a result of a past event, the Company has a present legal or constructive obligation
that can be estimated reliably, and it is probable that an outflow of economic benefits will be required to settle the
obligation. Provisions are determined by discounting the expected future pre-tax cash flows at a rate that reflects
current market assessments of the time value of money and the risks specific to the liability. The unwinding of the
discount is recognized as finance cost.
A provision for restructuring is recognised when the Company has approved a detailed and formal restructuring
plan, and the restructuring either has commenced or has been announced publicly. Future operating losses are not
provided for.
(m) Revenue
Revenue from the sale of goods in the course of ordinary activities is measured at the fair value of the consideration
received or receivable, net of value added tax, sales returns, trade discounts and volume rebates. Revenue is
recognized when significant risks and rewards of ownership have been transferred to the customer, recovery of the
consideration is probable, the associated costs and possible return of goods can be estimated reliably, there is no
continuing management involvement with the goods and the amount of revenue can be measured reliably. If it is
probable that discounts will be granted and the amount can be measured reliably, then the discount is recognized
as a reduction of revenue as the sales are recognized.
(n) Government Grants
An unconditional government grant related to export sales is recognized in profit or loss as cost of sales when the
grant becomes receivable.
(o) Finance income and finance costs
Finance income comprises interest income on funds invested, dividend income and changes in the fair value of
financial assets at fair value through profit or loss where the Group holds such financial assets. Interest income is
Page 60 2012 ANNUALREPORT & ACCOUNTS
recognized as it accrues in profit or loss, using the effective interest method. Dividend income is recognized in profit
or loss on the date that the Group’s right to receive payment is established.
Finance costs comprise interest expense on borrowings, unwinding of the discount on provisions, changes in the
fair value of financial assets at fair value through profit or loss where the Group holds such financial assets and
impairment losses recognized on financial assets (other than trade receivables).
Borrowing cost that are not directly attributable to the acquisition, construction or production of a qualifying asset
are recognized in profit or loss.
Foreign currency gains and losses are reported on a net basis.
(p) Tax
Income tax expense represents the sum of current tax expense and deferred tax expense. Current tax and deferred
tax are recognized in profit and loss except to the extent that it relates to a business combination, or items recognized
directly in equity or in other comprehensive income.
(i) Current tax
Current tax is the expected tax payable or receivable on the taxable income or loss for the year, using tax rates
statutorily enacted at the reporting date, and any adjustment to tax payable in respect of previous years. The
Company is subject to the following types of current income tax;
• Company Income Tax- This relates to tax on revenue and profit generated by the Company during the year, to be taxed under the Companies Income Tax Act Cap C21, LFN 2004 as amended to date.
• Tertiary Education Tax- Tertiary education tax is based on the assessable income of the Company and is governed by the Tertiary Education Trust Fund (Establishment) Act LFN 2011
(ii) Deferred tax
Deferred tax is recognised in respect of temporary differences between the carrying amounts of assets and
liabilities for financial reporting purposes and the amounts used for taxation purposes. Deferred tax is not
recognised for:
• temporary differences on the initial recognition of assets or liabilities in a transaction that is not a business combination and that affects neither accounting nor taxable profit or loss;
• temporary differences related to investments in subsidiaries, associates and jointly controlled entities to the extent that the Group is able to control the timing of the reversal of the temporary differences and it is prob-able that they will not reverse in the foreseeable future; and
• taxable temporary differences arising on the initial recognition of goodwill.
The measurement of deferred tax reflects the tax consequences that would follow the manner in which the
Group expects, at the end of the reporting period, to recover or settle the carrying amount of its assets and
liabilities. For investment property that is measured at fair value, the presumption that the carrying amount of
the investment property will be recovered through sale has not been rebutted.
Deferred tax is measured at the tax rates that are expected to be applied to temporary differences when they
reverse, using tax rates enacted or substantively enacted at the reporting date.
Deferred tax assets and liabilities are offset if there is a legally enforceable right to offset current tax liabilities
and assets, and they relate to taxes levied by the same tax authority on the same taxable entity, or on different
tax entities, but they intend to settle current tax liabilities and assets on a net basis or their tax assets and
liabilities will be realised simultaneously.
Page 612012 ANNUALREPORT & ACCOUNTS
A deferred tax asset is recognised for unused tax losses, tax credits and deductible temporary differences to the
extent that it is probable that future taxable profits will be available against which they can be utilised. Deferred
tax assets are reviewed at each reporting date and are reduced to the extent that it is no longer probable that
the related tax benefit will be realized
(iii) Tax exposures
In determining the amount of current and deferred tax, the Group takes into account the impact of uncertain
tax positions and whether additional taxes and interest may be due. This assessment relies on estimates and
assumptions and may involve a series of judgments about future events. New information may become available
that causes the Company to change its judgment regarding the adequacy of existing tax liabilities; such changes
to tax liabilities will impact tax expense in the period that such a determination is made.
(q) Earnings per share
The Group presents basic and diluted earnings per share (EPS) data for its ordinary shares. Basic EPS is calculated
by dividing the profit or loss attributable to ordinary shareholders of the Company by the weighted average number
of ordinary shares outstanding during the year, adjusted for own shares held (if any). Diluted EPS is determined
by adjusting the profit or loss attributable to ordinary shareholders and the weighted average number of ordinary
shares outstanding, adjusted for own shares held (if any), for the effects of all dilutive potential ordinary shares.
(r) Assets held for sale
Non-current assets held for sale, or disposal groups comprising assets and liabilities that are expected to be
recovered primarily through sale rather than through continuing use are classified as held for sale. Immediately
before classification as held for sale, the assets, or components of a disposal group, are re-measured in accordance
with the Group’s accounting policies. Thereafter generally the assets, or disposal group, are measured at the lower
of their carrying amount and fair value less cost to sell. Any impairment loss on a disposal group first is allocated to
goodwill (if it exists), and then to remaining assets and liabilities on pro rata basis, except that no loss is allocated to
inventories, financial assets and deferred tax assets, which continue to be measured in accordance with the Group’s
accounting policies. Impairment losses on initial classification as held for sale and subsequent gains and losses on
re-measurement are recognised in statement of comprehensive income. Gains are not recognised in excess of any
cumulative impairment loss.
Once classified as held for sale, intangible assets and property, plant and equipment are no longer amortised or
depreciated.
(s) Segment reporting
An operating segment is a distinguishable component of the Group that earns revenue and incurs expenditure
from providing related products or services (business segment), or providing products or services within a particular
economic environment (geographical segment), and which is subject to risks and returns that are different from
those of other segments.
The group’s primary format for segment reporting is based on business segments. The business segments are
determined by management based on the group’s internal reporting structure.
All operating segments’ operating results are reviewed regularly by the Company’s Board of Directors to make
decisions about resources to be allocated to the segment and assess its performance, and for which discrete financial
information is available.
Segment results that are reported to the Company’s Board of Directors include items directly attributable to a
segment as well as those that can be allocated on a reasonable basis. Unallocated items comprise mainly corporate
Page 62 2012 ANNUALREPORT & ACCOUNTS
assets, head office expenses and tax assets and liabilities.
(t) New standards and interpretations not yet adopted
A number of new standards, amendments to standards and interpretations are effective for annual periods beginning
after 1 January 2013 and beyond, and have not been applied in preparing these consolidated financial statements.
Those which may be relevant to the Group are set out below. The Group does not plan to adopt these standards
early.
(i) IFRS 9 Financial Instruments (2010), IFRS 9 Financial Instruments (2009)
IFRS 9 (2009) introduces new requirements for the classification and measurement of financial assets. Under IFRS
9 (2009), financial assets are classified and measured based on the business model in which they are held and the
characteristics of their contractual cash flows. IFRS 9 (2010) introduces additions relating to financial liabilities. The
IASB currently has an active project to make limited amendments to the classification and measurement requirements
of IFRS 9 and add new requirements to address the impairment of financial assets and hedge accounting.
IFRS 9 (2010 and 2009) are effective for annual periods beginning on or after 1 January 2015 with early adoption
permitted. The adoption of IFRS 9 (2010) is expected to have an impact on the Group’s financial assets, but not any
impact on the Group’s financial liabilities.
(ii) IFRS 10 Consolidated Financial Statements, IFRS 12 Disclosure of Interests in Other Entities (2011)
IFRS 10 introduces a single control model to determine whether an investee should be consolidated. As a result, the
Group may need to change its consolidation conclusion in respect of its investees, which may lead to changes in the
current accounting for these investees.
IFRS 12 brings together into a single standard all the disclosure requirements about an entity’s interests in
subsidiaries, joint arrangements, associates and unconsolidated structured entities.IFRS 12 requires the disclosure
of information about the nature, risks and financial effects of these interests.
Although, these standards are effective for annual periods beginning on or after 1 January 2013 with early adoption
permitted, the entity would not apply this standard in its annual period beginning on 1 January 2013. This is because
the business combination that occurred between the entity and its subsidiary (Stanmark) was done subsequent to
year end. Therefore, this standard would not be required.
(iii) IFRS 13 Fair Value Measurement (2011)
IFRS 13 provides a single source of guidance on how fair value is measured, and replaces the fair value measurement
guidance that is currently dispersed throughout IFRS. Subject to limited exceptions, IFRS 13 is applied when fair
value measurements or disclosures are required or permitted by other IFRSs. The Group is currently reviewing its
methodologies in determining fair values. IFRS 13 is effective for annual periods beginning on or after 1 January
2013 with early adoption permitted.
(iv) IAS 19 Employee Benefits (2011)
IAS 19 (2011) changes the definition of short-term and other long-term employee benefits to clarify the distinction
between the two. For defined benefit plans, removal of the accounting policy choice for recognition of actuarial
gains and losses is not expected to have a significant impact on the Group. However, the Group may need to assess
the impact of the change in measurement principles of expected return on plan assets. IAS 19 (2011) is effective for
annual periods beginning on or after 1 January 2013 with early adoption permitted.
The amendments to IAS 1 improved the consistency and clarity of the presentation of items of other comprehensive
income (OCI). The main change resulting from the amendments was a requirement for entities to group items in
Page 632012 ANNUALREPORT & ACCOUNTS
OCI on the basis of whether they are potentially re-classifiable to profit or loss subsequently. It did not change the
existing option to present total comprehensive income in one or two statements. It changes the title of the statement
of comprehensive income to the ‘Statement of profit or loss and other comprehensive income’. However, other titles
are allowed.
(v) Presentation of items of Other Comprehensive Income (Amendment to IAS 1)
Presentation of items of Other Comprehensive Income (Amendment to IAS 1) is effective 1 July 2012 but the Group
intends to adopt it for its annual periods beginning on 1 January 2013.
(vi) IAS 27 Separate Financial Statements (2011)
IAS 27 Separate Financial Statement contains accounting and disclosure requirements for investment in subsidiaries,
joint ventures and associates when an entity prepares a separate financial statement. The Standard requires an
entity preparing separate financial statement to account for those investments at cost or in accordance with IFRS 9
Financial Instruments.
Although, IAS 27 is effective for annual periods beginning on or after 1 January 2013 with early adoption permitted,
the entity would not apply this standard in its annual period beginning on 1 January 2013. This is because of the
business combination that occurred between the entity and its subsidiary (Stanmark) subsequent to year end (see
Note 31). Therefore, this standard would not be required.
4 Determination of fair values
A number of the Group’s accounting policies and disclosures require the determination of fair value, for both
financial and non-financial assets and liabilities. Fair values have been determined for measurement and/
or disclosure purposes based on the methods indicated below. When applicable, further information about the
assumptions made in determining fair values is disclosed in the notes specific to that asset or liability. The impact of
the application of these standards on the entity’s financial information has not been determined.
(i) Property, plant and equipment
The fair value of property, plant and equipment recognised as a result of a business combination is based on the
quoted market prices for similar items when available and replacement cost based on independent valuation
when appropriate.
(ii) Trade and other receivables
The fair value of trade and other receivables is estimated as the present value of future cash flows, discounted
at the market rate of interest at the reporting date. This fair value is determined for disclosure purposes. Short
term trade receivables with no stated interest rate are measured at the original invoice amount if the effect of
discounting is immaterial. Fair value is determined at initial recognition and, for disclosure purposes, at each
annual reporting date.
(iii) Share-based payment transactions
The fair value of the share based payment plan is measured at the grant date using the Monte Carlo model
taking into account the terms and conditions of the plan.

Page 64 2012 ANNUALREPORT & ACCOUNTS
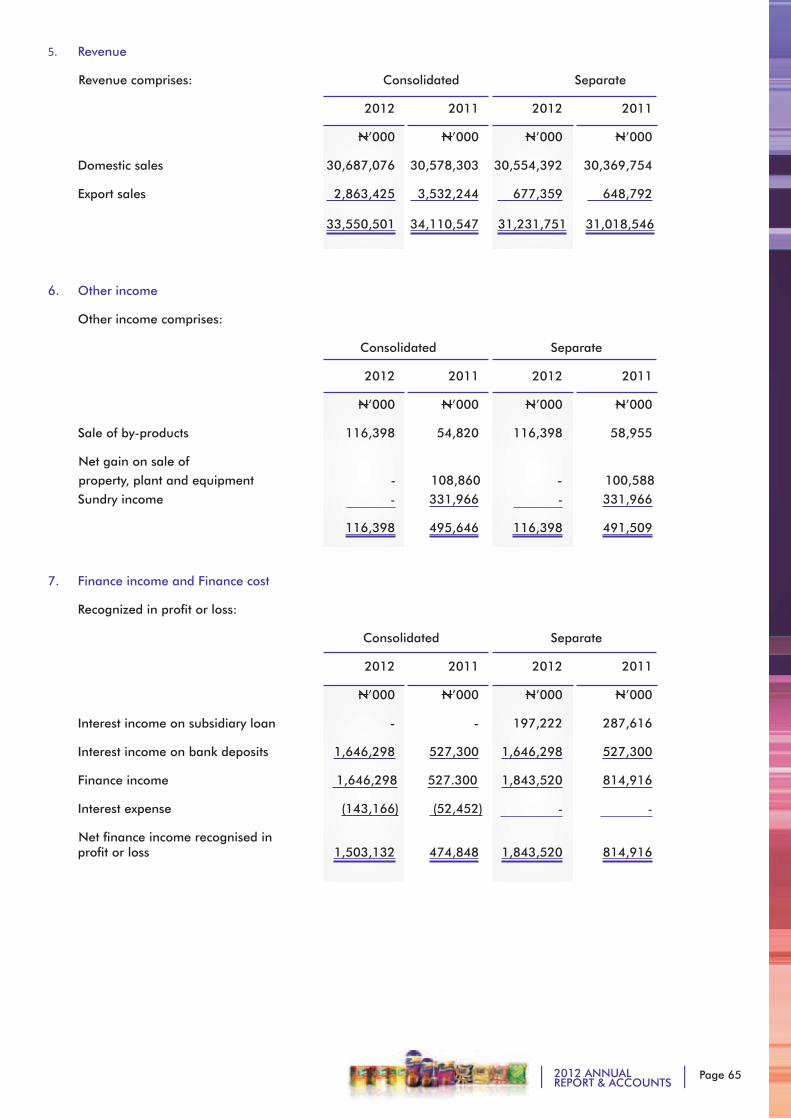
Page 652012 ANNUALREPORT & ACCOUNTS
5. Revenue
Revenue comprises: Consolidated Separate
2012 2011 2012 2011
N’000 N’000 N’000 N’000
Domestic sales 30,687,076 30,578,303 30,554,392 30,369,754
Export sales 2,863,425 3,532,244 677,359 648,792 33,550,501 34,110,547 31,231,751 31,018,546
6. Other income
Other income comprises:
Consolidated Separate
2012 2011 2012 2011
N’000 N’000 N’000 N’000
Sale of by-products 116,398 54,820 116,398 58,955
Net gain on sale of property, plant and equipment - 108,860 - 100,588 Sundry income - 331,966 - 331,966
116,398 495,646 116,398 491,509
7. Finance income and Finance cost
Recognized in profit or loss:
Consolidated Separate
2012 2011 2012 2011
N’000 N’000 N’000 N’000
Interest income on subsidiary loan - - 197,222 287,616
Interest income on bank deposits 1,646,298 527,300 1,646,298 527,300
Finance income 1,646,298 527.300 1,843,520 814,916
Interest expense (143,166) (52,452) - -
Net finance income recognised in profit or loss 1,503,132 474,848 1,843,520 814,916
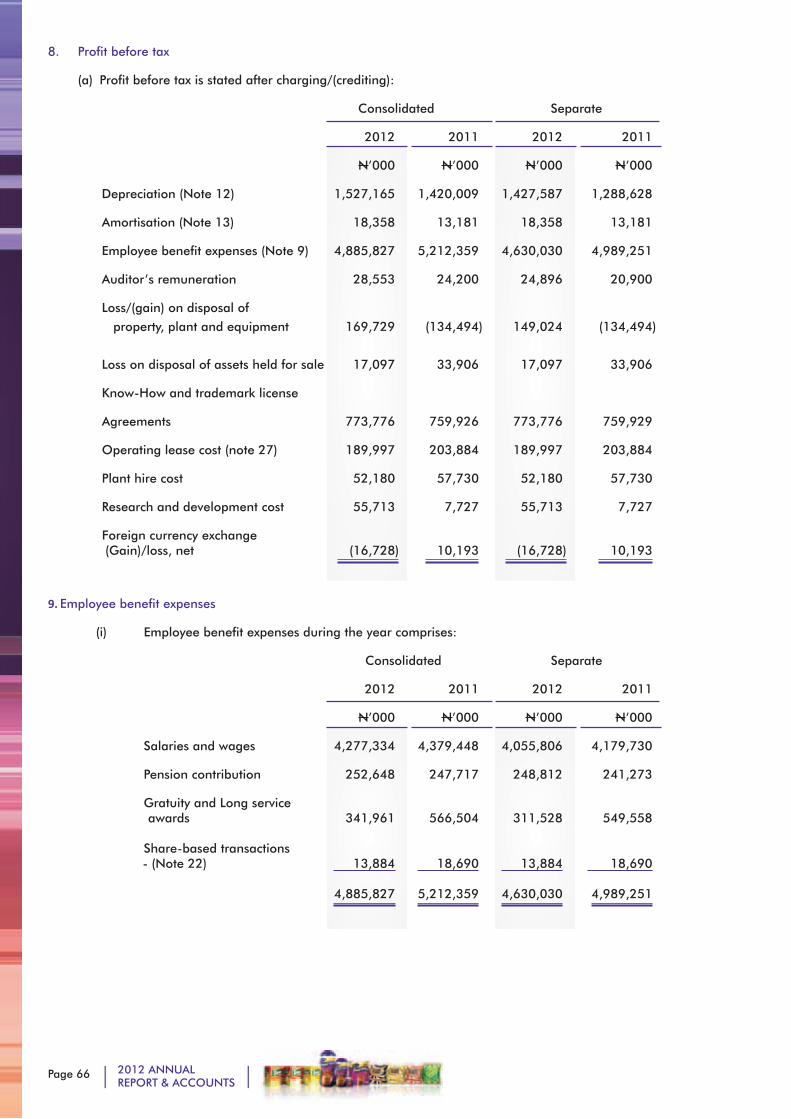
Page 66 2012 ANNUALREPORT & ACCOUNTS
8. Profit before tax
(a) Profit before tax is stated after charging/(crediting):
Consolidated Separate
2012 2011 2012 2011
N’000 N’000 N’000 N’000
Depreciation (Note 12) 1,527,165 1,420,009 1,427,587 1,288,628
Amortisation (Note 13) 18,358 13,181 18,358 13,181
Employee benefit expenses (Note 9) 4,885,827 5,212,359 4,630,030 4,989,251
Auditor’s remuneration 28,553 24,200 24,896 20,900
Loss/(gain) on disposal of property, plant and equipment 169,729 (134,494) 149,024 (134,494)
Loss on disposal of assets held for sale 17,097 33,906 17,097 33,906
Know-How and trademark license
Agreements 773,776 759,926 773,776 759,929
Operating lease cost (note 27) 189,997 203,884 189,997 203,884
Plant hire cost 52,180 57,730 52,180 57,730
Research and development cost 55,713 7,727 55,713 7,727
Foreign currency exchange (Gain)/loss, net (16,728) 10,193 (16,728) 10,193
9. Employee benefit expenses
(i) Employee benefit expenses during the year comprises:
Consolidated Separate
2012 2011 2012 2011
N’000 N’000 N’000 N’000
Salaries and wages 4,277,334 4,379,448 4,055,806 4,179,730
Pension contribution 252,648 247,717 248,812 241,273
Gratuity and Long service awards 341,961 566,504 311,528 549,558
Share-based transactions - (Note 22) 13,884 18,690 13,884 18,690 4,885,827 5,212,359 4,630,030 4,989,251
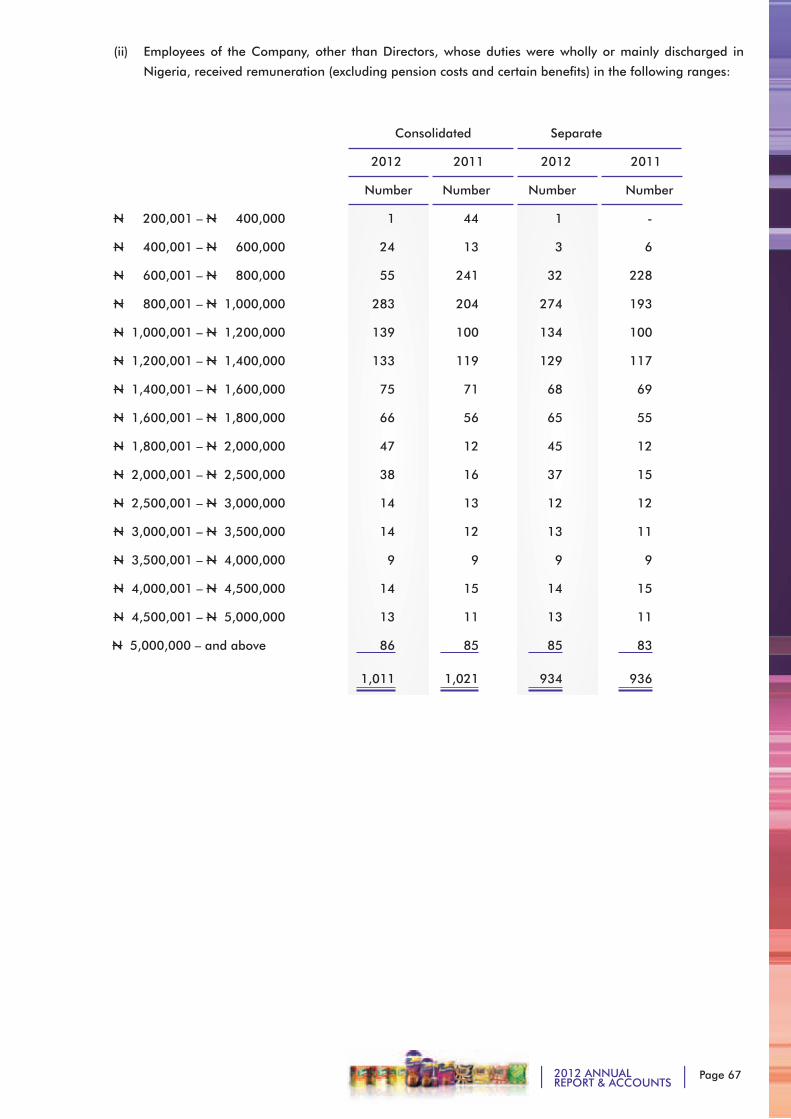
Page 672012 ANNUALREPORT & ACCOUNTS
(ii) Employees of the Company, other than Directors, whose duties were wholly or mainly discharged in
Nigeria, received remuneration (excluding pension costs and certain benefits) in the following ranges:
Consolidated Separate
2012 2011 2012 2011
Number Number Number Number
N 200,001 – N 400,000 1 44 1 -
N 400,001 – N 600,000 24 13 3 6
N 600,001 – N 800,000 55 241 32 228
N 800,001 – N 1,000,000 283 204 274 193
N 1,000,001 – N 1,200,000 139 100 134 100
N 1,200,001 – N 1,400,000 133 119 129 117
N 1,400,001 – N 1,600,000 75 71 68 69
N 1,600,001 – N 1,800,000 66 56 65 55
N 1,800,001 – N 2,000,000 47 12 45 12
N 2,000,001 – N 2,500,000 38 16 37 15
N 2,500,001 – N 3,000,000 14 13 12 12
N 3,000,001 – N 3,500,000 14 12 13 11
N 3,500,001 – N 4,000,000 9 9 9 9
N 4,000,001 – N 4,500,000 14 15 14 15
N 4,500,001 – N 5,000,000 13 11 13 11
N 5,000,000 – and above 86 85 85 83
1,011 1,021 934 936
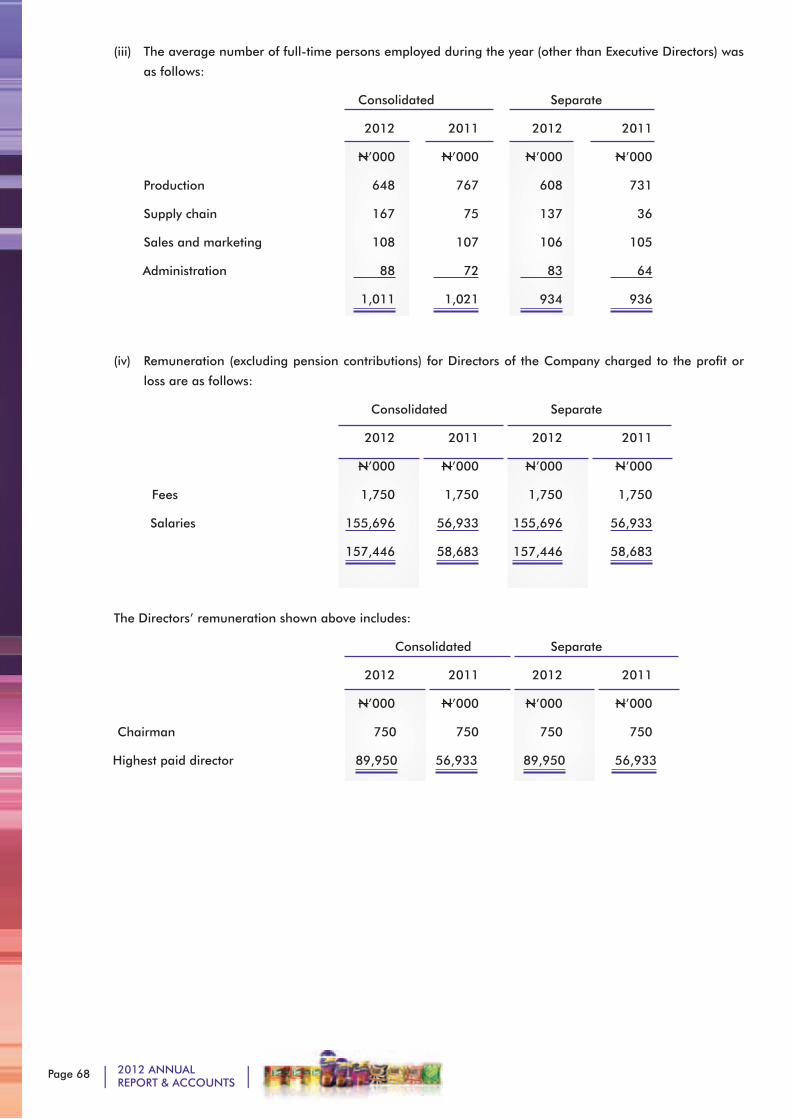
Page 68 2012 ANNUALREPORT & ACCOUNTS
(iii) The average number of full-time persons employed during the year (other than Executive Directors) was
as follows:
Consolidated Separate
2012 2011 2012 2011
N’000 N’000 N’000 N’000
Production 648 767 608 731
Supply chain 167 75 137 36
Sales and marketing 108 107 106 105
Administration 88 72 83 64
1,011 1,021 934 936
(iv) Remuneration (excluding pension contributions) for Directors of the Company charged to the profit or
loss are as follows:
Consolidated Separate
2012 2011 2012 2011
N’000 N’000 N’000 N’000
Fees 1,750 1,750 1,750 1,750
Salaries 155,696 56,933 155,696 56,933
157,446 58,683 157,446 58,683
The Directors’ remuneration shown above includes:
Consolidated Separate
2012 2011 2012 2011
N’000 N’000 N’000 N’000
Chairman 750 750 750 750
Highest paid director 89,950 56,933 89,950 56,933
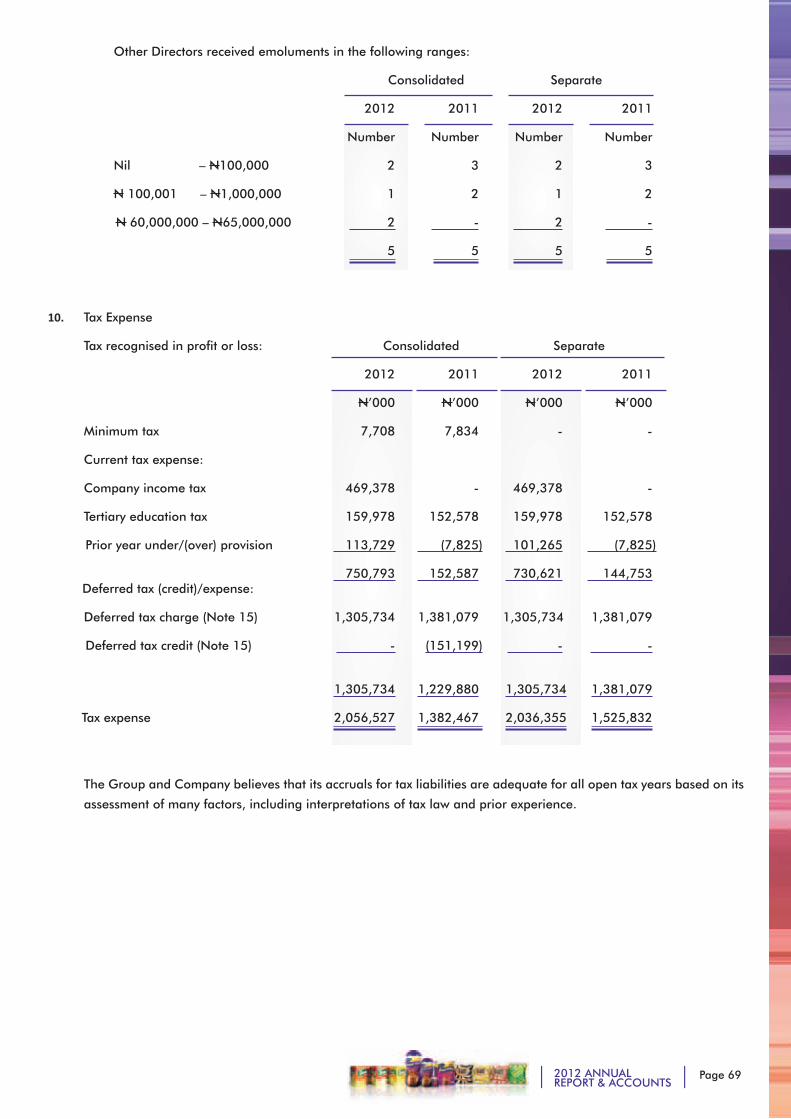
Page 692012 ANNUALREPORT & ACCOUNTS
Other Directors received emoluments in the following ranges:
Consolidated Separate
2012 2011 2012 2011
Number Number Number Number
Nil – N100,000 2 3 2 3
N 100,001 – N1,000,000 1 2 1 2
N 60,000,000 – N65,000,000 2 - 2 -
5 5 5 5
10. Tax Expense
Tax recognised in profit or loss: Consolidated Separate
2012 2011 2012 2011
N’000 N’000 N’000 N’000
Minimum tax 7,708 7,834 - -
Current tax expense:
Company income tax 469,378 - 469,378 -
Tertiary education tax 159,978 152,578 159,978 152,578
Prior year under/(over) provision 113,729 (7,825) 101,265 (7,825)
750,793 152,587 730,621 144,753 Deferred tax (credit)/expense:
Deferred tax charge (Note 15) 1,305,734 1,381,079 1,305,734 1,381,079
Deferred tax credit (Note 15) - (151,199) - -
1,305,734 1,229,880 1,305,734 1,381,079
Tax expense 2,056,527 1,382,467 2,036,355 1,525,832
The Group and Company believes that its accruals for tax liabilities are adequate for all open tax years based on its
assessment of many factors, including interpretations of tax law and prior experience.
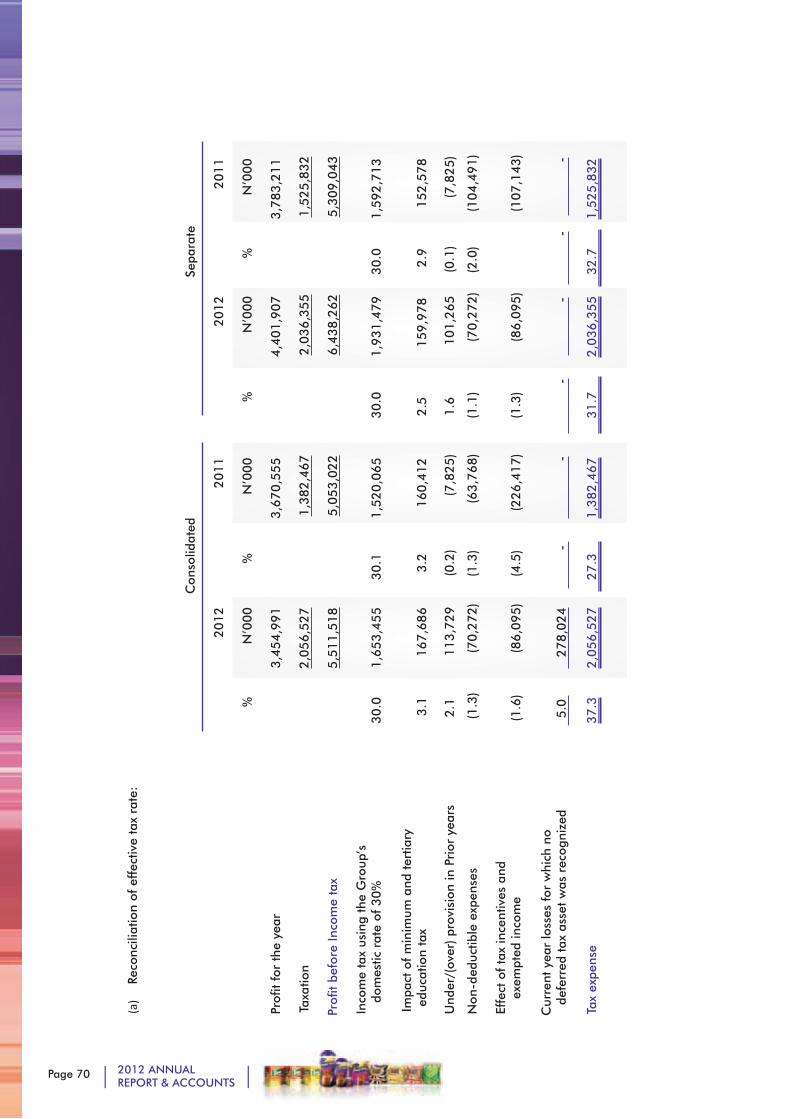
Page 70 2012 ANNUALREPORT & ACCOUNTS
(a)
Reco
ncili
atio
n of
eff
ectiv
e ta
x ra
te:
C
onso
lidat
ed
Sep
arat
e
2
01
2
20
11
2012
2011
%
N’0
00
%
N
’00
0
%
N’0
00
%
N’0
00
Pr
ofit
for
the
year
3,4
54
,99
1
3
,67
0,5
55
4,4
01,9
07
3,7
83,2
11
Taxa
tion
2
,05
6,5
27 1
,38
2,4
67
2,0
36,3
55
1,5
25,8
32
P
rofit
bef
ore
Inco
me
tax
5
,51
1,5
18 5
,05
3,0
22
6,4
38,2
62
5,3
09,0
43
In
com
e ta
x us
ing
the
Gro
up’s
d
omes
tic r
ate
of 3
0%
30
.0
1,6
53
,45
5
30
.1
1,5
20
,06
5
30.0
1,9
31,4
79
30.0
1,5
92,7
13
Impa
ct o
f m
inim
um a
nd t
ertia
ry
ed
ucat
ion
tax
3.1
1
67
,68
6
3.2
1
60
,41
2
2.5
159,9
78
2.9
1
52,5
78
U
nder
/(ov
er)
prov
isio
n in
Pri
or y
ears
2
.1 1
13
,72
9
(
0.2
) (
7,8
25
)
1.6
1
01,2
65
(
0.1
)
(7,8
25)
N
on-d
educ
tible
exp
ense
s
(1
.3)
(
70
,27
2)
(1
.3)
(63
,76
8)
(1.1
) (7
0,2
72)
(2.0
) (1
04,4
91)
Ef
fect
of
tax
ince
ntiv
es a
nd
exem
pted
inco
me
(
1.6
) (8
6,0
95
) (4
.5)
(22
6,4
17
) (1
.3)
(86,0
95)
(1
07,1
43)
C
urre
nt y
ear
loss
es f
or w
hich
no
de
ferr
ed t
ax a
sset
was
rec
ogni
zed
5.0
2
78
,02
4 -
-
-
-
-
-
Ta
x ex
pens
e
3
7.3
2
,05
6,5
27
2
7.3
1,3
82
,46
7
31.7
2,0
36,3
55
32.7
1,5
25,8
32
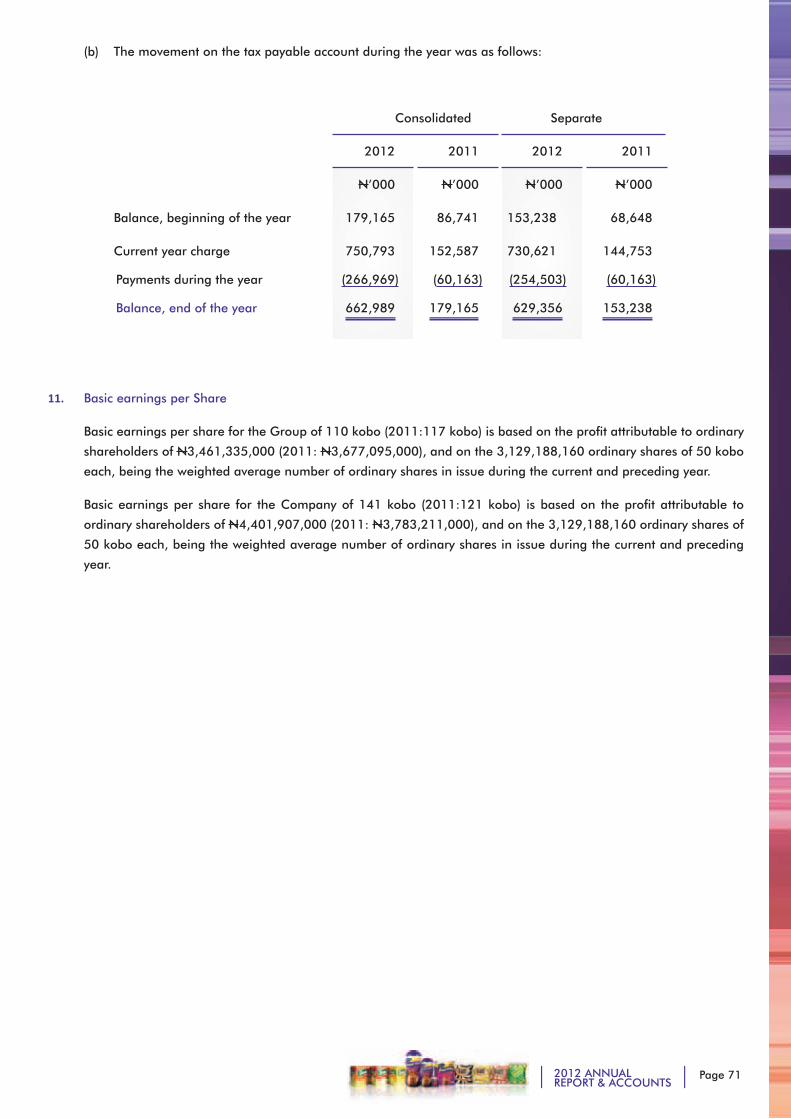
Page 712012 ANNUALREPORT & ACCOUNTS
(b) The movement on the tax payable account during the year was as follows:
Consolidated Separate
2012 2011 2012 2011
N’000 N’000 N’000 N’000
Balance, beginning of the year 179,165 86,741 153,238 68,648
Current year charge 750,793 152,587 730,621 144,753
Payments during the year (266,969) (60,163) (254,503) (60,163)
Balance, end of the year 662,989 179,165 629,356 153,238
11. Basic earnings per Share
Basic earnings per share for the Group of 110 kobo (2011:117 kobo) is based on the profit attributable to ordinary
shareholders of N3,461,335,000 (2011: N3,677,095,000), and on the 3,129,188,160 ordinary shares of 50 kobo
each, being the weighted average number of ordinary shares in issue during the current and preceding year.
Basic earnings per share for the Company of 141 kobo (2011:121 kobo) is based on the profit attributable to
ordinary shareholders of N4,401,907,000 (2011: N3,783,211,000), and on the 3,129,188,160 ordinary shares of
50 kobo each, being the weighted average number of ordinary shares in issue during the current and preceding
year.
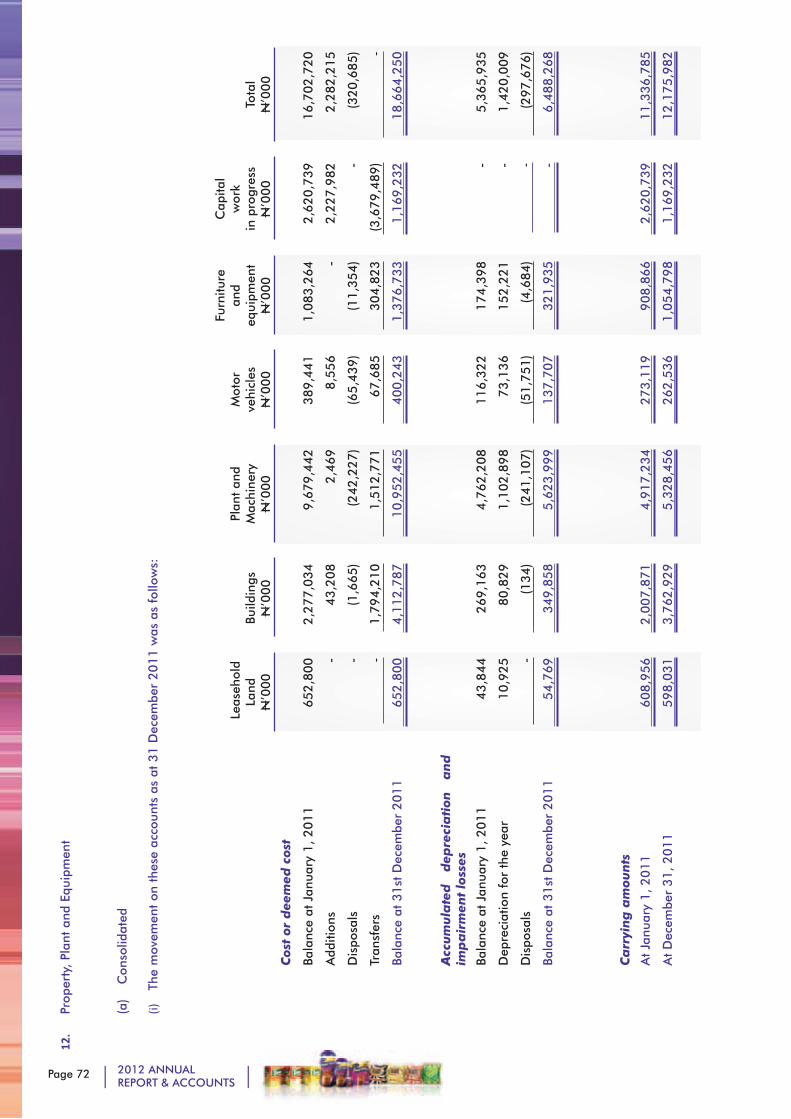
Page 72 2012 ANNUALREPORT & ACCOUNTS
12.
Prop
erty
, Pl
ant
and
Equi
pmen
t
(a)
Con
solid
ated
(i)
The
mov
emen
t on
the
se a
ccou
nts
as a
t 3
1 D
ecem
ber
20
11
was
as
follo
ws:
Lea
seho
ld
Land
N
’00
0Bu
ildin
gs
N’0
00
Plan
t an
d M
achi
nery
N
’00
0
Mot
or
vehi
cles
N
’000
Furn
iture
an
d eq
uipm
ent
N’0
00
Cap
ital
wor
k
in p
rogr
ess
N’0
00
Tota
l
N’0
00
Co
st o
r d
eem
ed c
ost
Bala
nce
at J
anua
ry 1
, 2
01
1 6
52
,80
0
2,2
77
,03
4
9
,67
9,4
42
389,4
41
1,0
83,2
64
2,6
20,7
39
16,7
02,7
20
Add
ition
s -
4
3,2
08
2
,46
9
8,5
56
-
2,2
27,9
82
2,2
82,2
15
Dis
posa
ls -
(1
,66
5)
(2
42
,22
7)
(65,4
39)
(11,3
54)
-
(
320,6
85)
Tran
sfer
s -
1
,79
4,2
10
1
,51
2,7
71
6
7,6
85
304,8
23
(3,6
79,4
89)
-
Bala
nce
at 3
1st
Dec
embe
r 2
01
1
65
2,8
00
4
,11
2,7
87
1
0,9
52
,45
5 4
00,2
43
1,3
76,7
33
1,1
69,2
32
18,6
64,2
50
Acc
um
ula
ted
d
epre
cia
tio
n
an
d
imp
air
men
t lo
sses
Bala
nce
at J
anua
ry 1
, 2
01
14
3,8
44
26
9,1
63
4
,76
2,2
08
116,3
22
174,3
98
-
5,3
65,9
35
Dep
reci
atio
n fo
r th
e ye
ar1
0,9
25
80
,82
91
,10
2,8
98
73,1
36
152,2
21
-
1,4
20,0
09
Dis
posa
ls -
(
13
4)
(2
41
,10
7)
(51,7
51)
(
4,6
84)
-
(
297,6
76)
Bala
nce
at 3
1st
Dec
embe
r 2
01
1
5
4,7
69
3
49
,85
8 5
,62
3,9
99
1
37,7
07
321,9
35
-
6,4
88,2
68
Ca
rryi
ng
am
oun
ts
At
Janu
ary
1,
20
11
6
08
,95
6 2
,00
7,8
71
4
,91
7,2
34
2
73,1
19
908,8
66
2,6
20,7
39
11,3
36,7
85
At
Dec
embe
r 3
1,
20
11
5
98
,03
1 3
,76
2,9
29
5
,32
8,4
56
2
62,5
36
1,0
54,7
98
1,1
69,2
32
12,1
75,9
82

Page 732012 ANNUALREPORT & ACCOUNTS
(ii)
The
mov
emen
t on
the
se a
ccou
nts
as a
t 3
1 D
ecem
ber
20
12
was
as
follo
ws:
Lea
seho
ld
Land
N
’00
0Bu
ildin
gs
N
’00
0
Plan
t an
d M
achi
nery
N
’00
0
Mot
or v
e-hi
cles
N
’00
0
Furn
iture
an
d eq
uip-
men
t
N’0
00
Cap
ital
wor
k
in p
rogr
ess
N’0
00
Tota
l
N
’000
Co
st o
r d
eem
ed c
ost
At
Janu
ary
1,
20
12
6
52
,80
0
4
,11
2,7
87
1
0,9
52
,45
5
40
0,2
43
1,3
76,7
33
1,1
69,2
32
18,6
64,2
50
Tran
sfer
fro
m a
sset
hel
d fo
r sa
le
Add
ition
s
-
4,7
42
17,6
01
18
,45
2
-
16,6
98
3,4
04,0
91
17,6
01
3,4
43,9
83
Dis
posa
ls -
(
14
4,2
21
) (1
61
,04
5)
(4
8,1
86)
(
107,0
53)
-
(4
60,5
05)
Tran
sfer
s
-
4
61
,27
0
1
,04
8,6
21
1
43
,60
2
107,2
57
(1,7
60,7
50)
-
At
31 D
ecem
ber
31
, 2
01
2
6
52
,80
0
4
,43
4,5
78
11
,87
6,0
84
4
95
,65
9
1
,393,6
35
2
,812,5
73
21,6
65,3
29
Acc
um
ula
ted
dep
reci
ati
on
an
d
imp
air
men
t lo
sses
Bala
nce
at J
anua
ry 1
, 2
01
25
4,7
69
34
9,8
58
5
,62
3,9
99
13
7,7
07
321,9
35
-
6,4
88,2
68
Dep
reci
atio
n fo
r th
e ye
ar
1
0,9
25
1
05
,11
3
1,1
38
,97
5
1
29
,87
5
142,2
77
-
1,5
27,1
65
Dis
posa
ls
-
(2
2,6
38
) (1
30
,42
9)
(
48
,18
6)
(8
6,3
68)
-
(2
87,6
21)
At
Dec
embe
r 3
1,
20
12
6
5,6
94
4
32
,33
3 6
,63
2,5
45
2
19
,396
377,8
44
-
7,7
27,8
12
Ca
rryi
ng
am
oun
ts
At
Janu
ary
1,
20
12
5
98
,03
1 3
,76
2,9
29
5
,32
8,4
56
2
62
,53
6
1,0
54,7
98
1
,169,2
32
12,1
75,9
82
At
Dec
embe
r 3
1,
20
12
5
87
,10
6 4
,00
2,2
45
5
,24
3,5
39
2
76
,26
3
1,0
15,7
91
2
,812,5
73
13,9
37,5
17
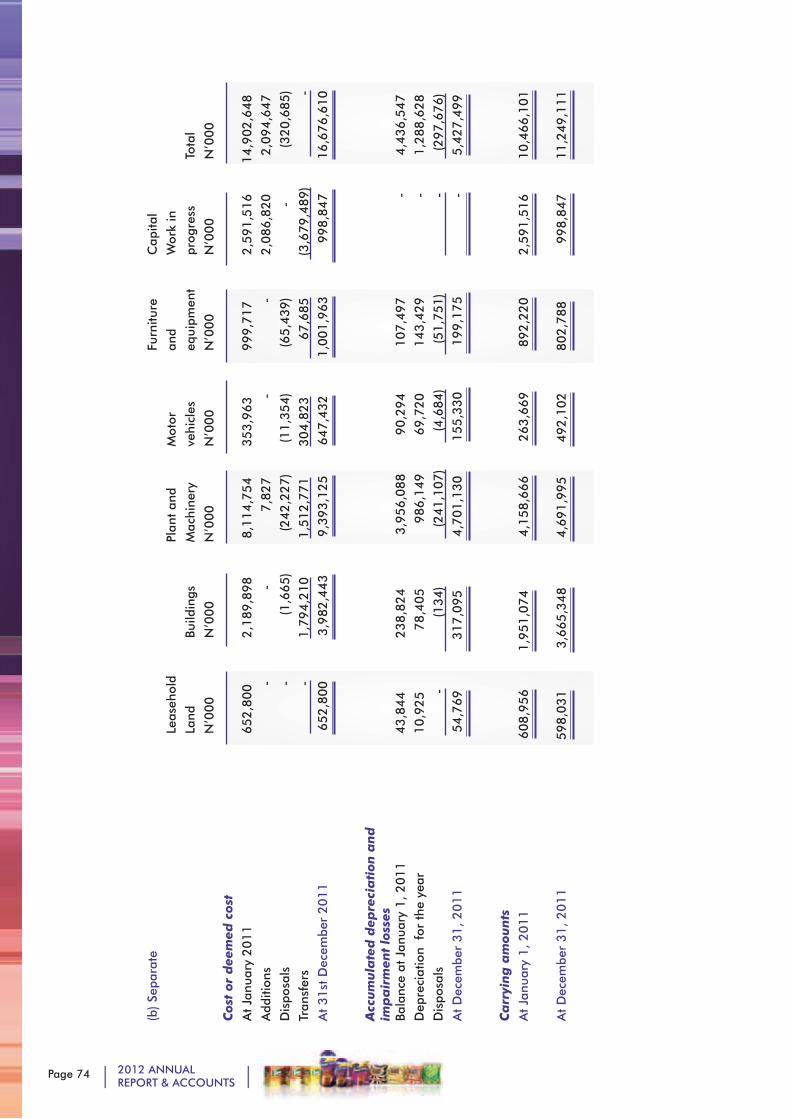
Page 74 2012 ANNUALREPORT & ACCOUNTS
(b)
Sepa
rate
Fu
rnitu
re
Cap
ital
Leas
ehol
d
Pl
ant
and
Mot
or
an
d
Wor
k in
La
nd
Bu
ildin
gs
Mac
hine
ry
vehi
cles
eq
uipm
ent
prog
ress
To
tal
N’0
00
N’0
00
N’0
00
N’0
00
N
’000
N
’000
N
’000
Co
st o
r d
eem
ed c
ost
At
Janu
ary
201
1
6
52
,80
0
2,1
89
,89
8
8,1
14
,75
4
35
3,9
63
999,7
17
2,5
91,5
16
14,9
02,6
48
Add
ition
s
-
- 7
,82
7
-
-
2,0
86,8
20
2,0
94,6
47
Dis
posa
ls
-
(1
,66
5)
(2
42
,22
7)
(1
1,3
54)
(
65,4
39)
-
(
320,6
85)
Tran
sfer
s
- 1
,79
4,2
10
1,5
12
,77
1
30
4,8
23
6
7,6
85
(
3,6
79,4
89)
-A
t 31st
Dec
embe
r 2
01
1
6
52
,80
0
3
,98
2,4
43 9
,39
3,1
25
6
47,4
32
1,0
01,9
63
998,8
47
16,6
76,6
10
Acc
um
ula
ted
dep
reci
ati
on
an
d
imp
air
men
t lo
sses
Bala
nce
at J
anua
ry 1
, 2
01
1
43
,84
4
23
8,8
24
3
,95
6,0
88
9
0,2
94
107,4
97
-
4
,436,5
47
Dep
reci
atio
n f
or t
he y
ear
10
,92
5
7
8,4
05
9
86
,14
9
6
9,7
20
143,4
29
-
1
,288,6
28
Dis
posa
ls
-
(1
34
) (2
41
,10
7)
(4,6
84)
(51,7
51)
-
(
297,6
76)
At
Dec
embe
r 3
1,
20
11
54
,76
9
3
17
,09
5 4
,70
1,1
30
1
55,3
30
199,1
75
-
5
,427,4
99
Ca
rryi
ng
am
oun
ts
A
t Ja
nuar
y 1, 2
01
1
6
08
,95
6
1,9
51
,07
4 4
,15
8,6
66 2
63,6
69
8
92,2
20
2,5
91,5
16
10,4
66,1
01
A
t D
ecem
ber
31
, 2
01
1
5
98
,03
1 3
,66
5,3
48 4
,69
1,9
95 4
92,1
02
802,7
88
9
98,8
47
11,2
49,1
11
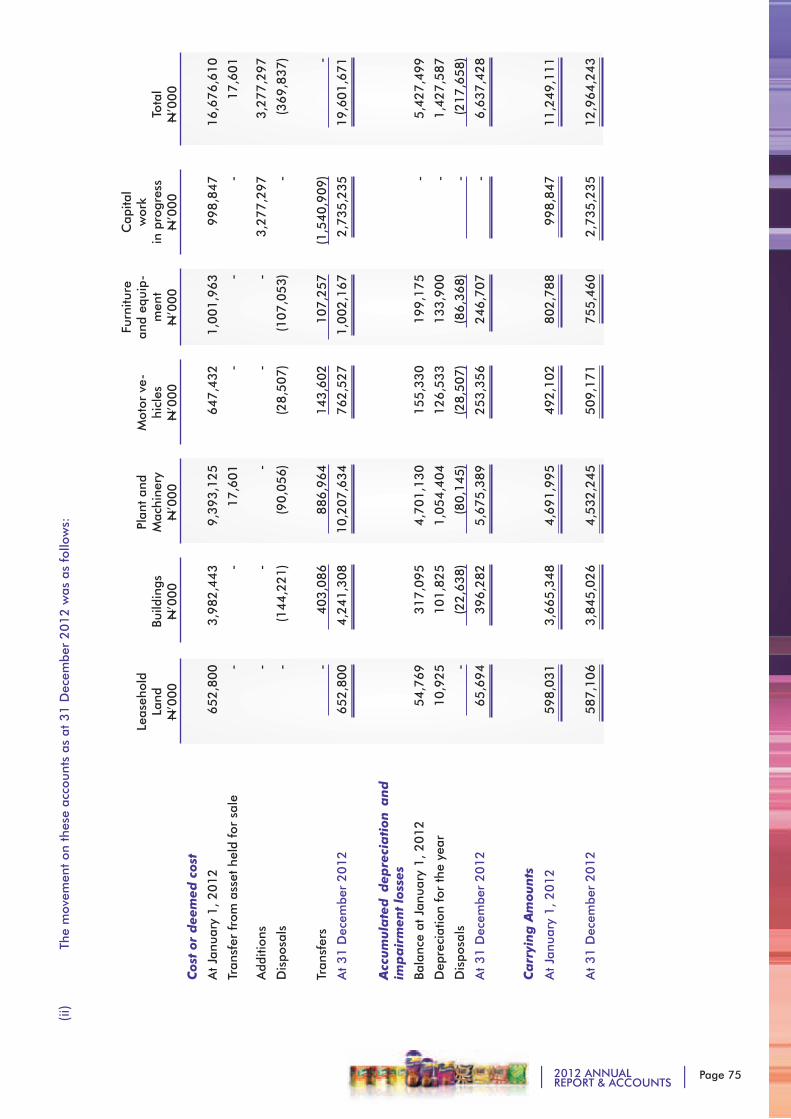
Page 752012 ANNUALREPORT & ACCOUNTS
(ii)
The
mov
emen
t on
the
se a
ccou
nts
as a
t 3
1 D
ecem
ber
20
12
was
as
follo
ws:
Leas
ehol
d La
nd
N’0
00
Build
ings
N’0
00
Plan
t an
d M
achi
nery
N
’00
0
Mot
or v
e-hi
cles
N
’000
Furn
iture
an
d eq
uip-
men
t
N’0
00
Cap
ital
wor
k
in p
rogr
ess
N’0
00
Tota
l
N’0
00
Co
st o
r d
eem
ed c
ost
At
Janu
ary
1,
20
12
65
2,8
00
3,9
82
,44
3 9
,39
3,1
25
647,4
32
1,0
01,9
63
998,8
47
16,6
76,6
10
Tran
sfer
fro
m a
sset
hel
d fo
r sa
le
Add
ition
s
-
-
-
-
1
7,6
01
-
-
-
-
-
-
3,2
77,2
97
1
7,6
01
3,2
77,2
97
Dis
posa
ls -
(
14
4,2
21
) (
90
,05
6)
(28,5
07)
(107,0
53)
-
(369,8
37)
Tran
sfer
s
-
4
03
,08
6
8
86
,96
4
143,6
02
107,2
57
(1,5
40,9
09)
-
At
31 D
ecem
ber
20
12
6
52
,80
0
4
,24
1,3
08
1
0,2
07
,63
4
762,5
27
1,0
02,1
67
2,7
35,2
35
19,6
01,6
71
Acc
um
ula
ted
dep
reci
ati
on
an
d
imp
air
men
t lo
sses
Bala
nce
at J
anua
ry 1
, 2
01
2 5
4,7
69
3
17
,09
5
4
,70
1,1
30
155,3
30
1
99,1
75
-
5,4
27,4
99
Dep
reci
atio
n fo
r th
e ye
ar 1
0,9
25
1
01
,82
5
1
,05
4,4
04
126,5
33
133,9
00
-
1,4
27,5
87
Dis
posa
ls -
(
22
,63
8)
(8
0,1
45
)
(
28,5
07)
(
86,3
68)
-
(217,6
58)
At
31 D
ecem
ber
20
12
6
5,6
94
3
96
,28
2
5
,67
5,3
89
253,3
56
2
46,7
07
-
6,6
37,4
28
Ca
rryi
ng
Am
oun
ts
At
Janu
ary
1,
20
12
5
98
,03
1
3
,66
5,3
48
4
,69
1,9
95
492,1
02
802,7
88
998,8
47
11,2
49,1
11
At
31 D
ecem
ber
20
12
5
87
,10
6
3
,84
5,0
26
4
,53
2,2
45
5
09,1
71
755,4
60
2,7
35,2
35
12,9
64,2
43
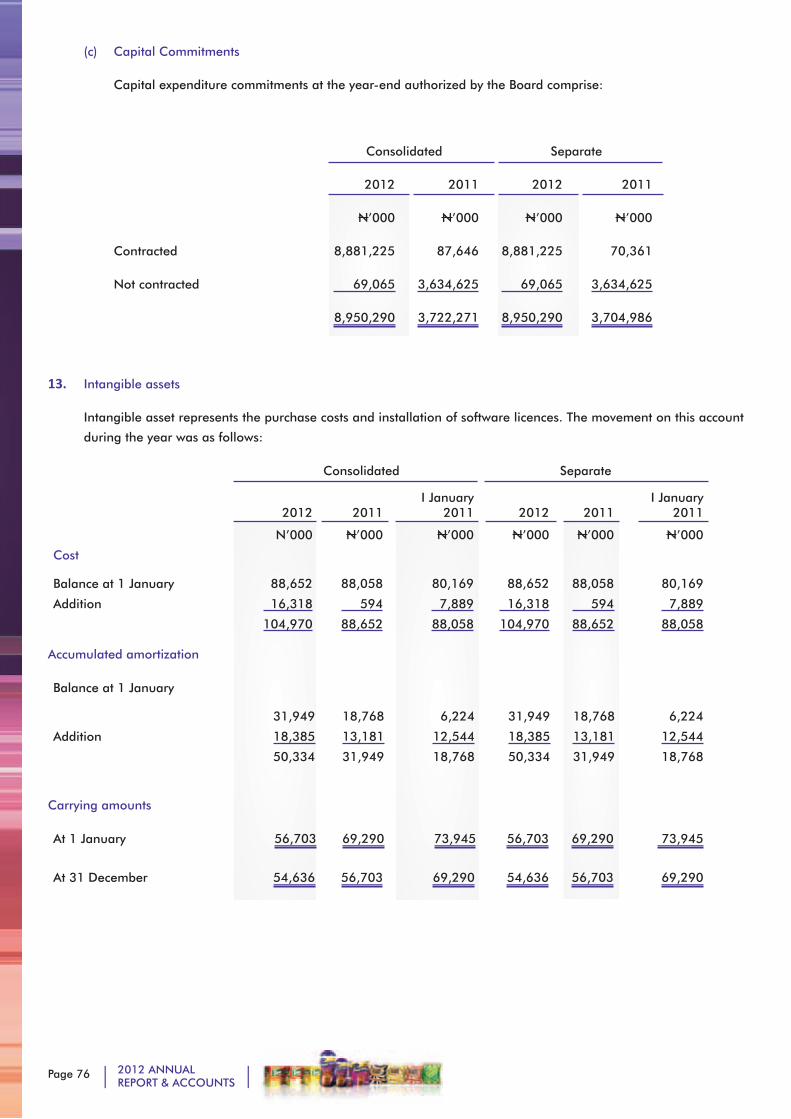
Page 76 2012 ANNUALREPORT & ACCOUNTS
(c) Capital Commitments
Capital expenditure commitments at the year-end authorized by the Board comprise:
Consolidated Separate
2012 2011 2012 2011
N’000 N’000 N’000 N’000
Contracted 8,881,225 87,646 8,881,225 70,361
Not contracted 69,065 3,634,625 69,065 3,634,625
8,950,290 3,722,271 8,950,290 3,704,986
13. Intangible assets
Intangible asset represents the purchase costs and installation of software licences. The movement on this account
during the year was as follows:
Consolidated Separate
2012 2011I January
2011 2012 2011I January
2011
N’000 N’000 N’000 N’000 N’000 N’000
Cost
Balance at 1 January 88,652 88,058 80,169 88,652 88,058 80,169
Addition 16,318 594 7,889 16,318 594 7,889
104,970 88,652 88,058 104,970 88,652 88,058
Accumulated amortization
Balance at 1 January
31,949 18,768 6,224 31,949 18,768 6,224
Addition 18,385 13,181 12,544 18,385 13,181 12,544
50,334 31,949 18,768 50,334 31,949 18,768
Carrying amounts
At 1 January 56,703 69,290 73,945 56,703 69,290 73,945
At 31 December 54,636 56,703 69,290 54,636 56,703 69,290
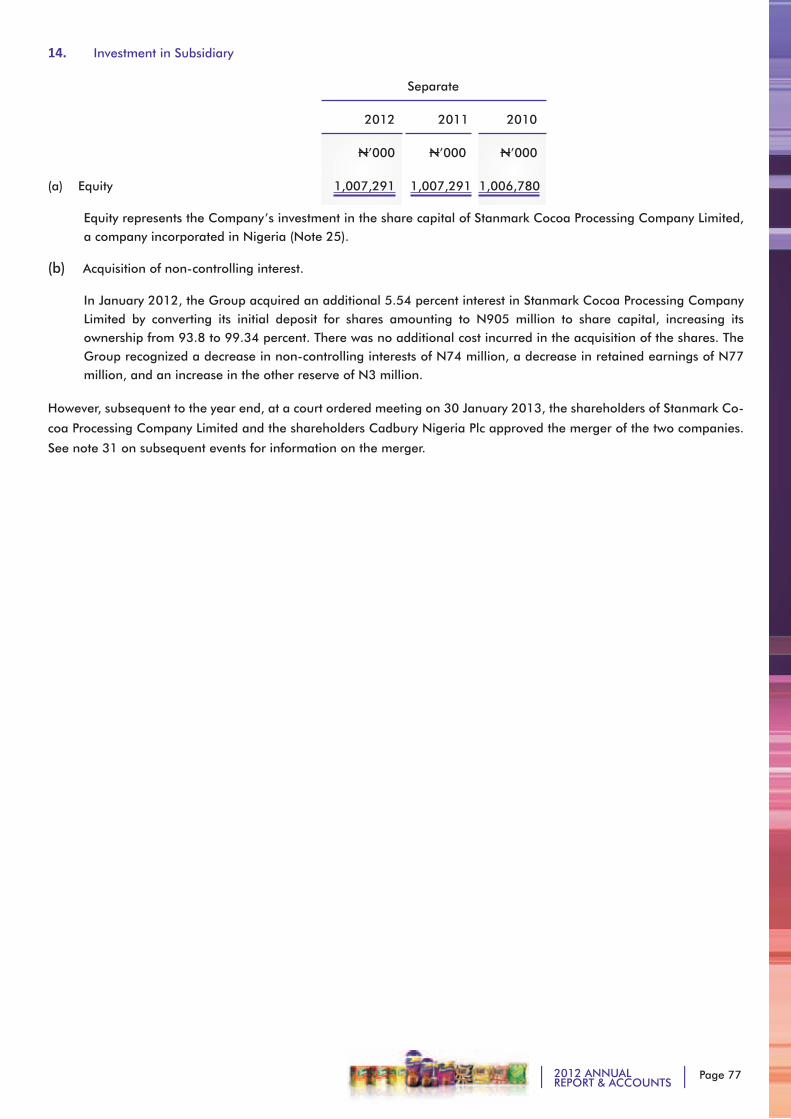
Page 772012 ANNUALREPORT & ACCOUNTS
14. Investment in Subsidiary
Separate
2012 2011 2010
N’000 N’000 N’000
(a) Equity 1,007,291 1,007,291 1,006,780
Equity represents the Company’s investment in the share capital of Stanmark Cocoa Processing Company Limited, a company incorporated in Nigeria (Note 25).
(b) Acquisition of non-controlling interest.
In January 2012, the Group acquired an additional 5.54 percent interest in Stanmark Cocoa Processing Company Limited by converting its initial deposit for shares amounting to N905 million to share capital, increasing its ownership from 93.8 to 99.34 percent. There was no additional cost incurred in the acquisition of the shares. The Group recognized a decrease in non-controlling interests of N74 million, a decrease in retained earnings of N77 million, and an increase in the other reserve of N3 million.
However, subsequent to the year end, at a court ordered meeting on 30 January 2013, the shareholders of Stanmark Co-
coa Processing Company Limited and the shareholders Cadbury Nigeria Plc approved the merger of the two companies.
See note 31 on subsequent events for information on the merger.
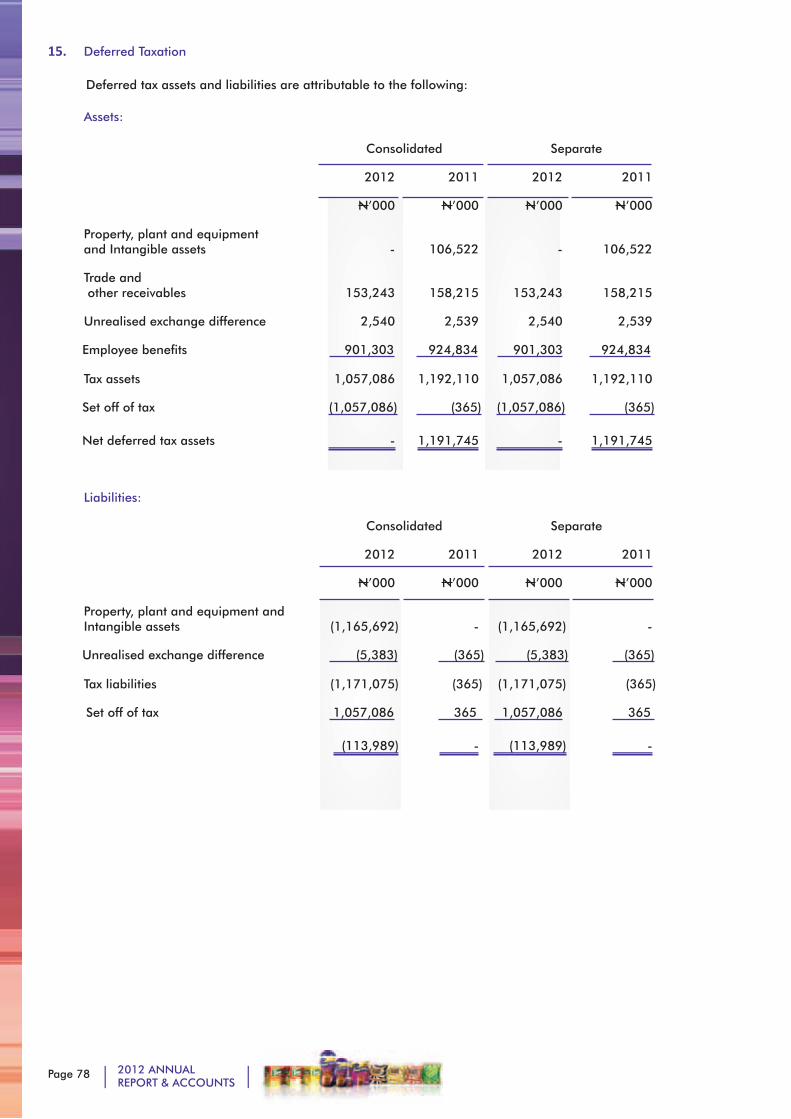
Page 78 2012 ANNUALREPORT & ACCOUNTS
15. Deferred Taxation
Deferred tax assets and liabilities are attributable to the following:
Assets:
Consolidated Separate
2012 2011 2012 2011
N’000 N’000 N’000 N’000
Property, plant and equipmentand Intangible assets - 106,522 - 106,522
Trade and other receivables 153,243 158,215 153,243 158,215
Unrealised exchange difference 2,540 2,539 2,540 2,539
Employee benefits 901,303 924,834 901,303 924,834
Tax assets 1,057,086 1,192,110 1,057,086 1,192,110
Set off of tax (1,057,086) (365) (1,057,086) (365)
Net deferred tax assets - 1,191,745 - 1,191,745
Liabilities:
Consolidated Separate
2012 2011 2012 2011
N’000 N’000 N’000 N’000
Property, plant and equipment andIntangible assets (1,165,692) - (1,165,692) -
Unrealised exchange difference (5,383) (365) (5,383) (365)
Tax liabilities (1,171,075) (365) (1,171,075) (365)
Set off of tax 1,057,086 365 1,057,086 365
(113,989) - (113,989) -
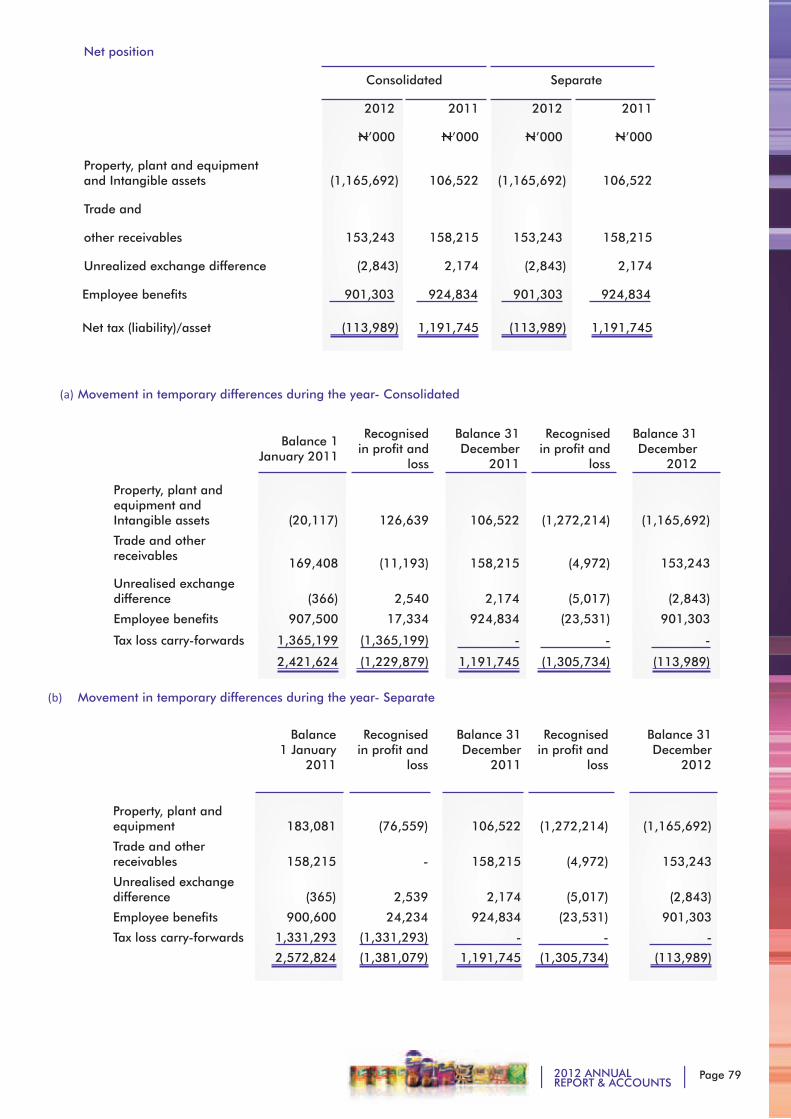
Page 792012 ANNUALREPORT & ACCOUNTS
Net position
Consolidated Separate
2012 2011 2012 2011
N’000 N’000 N’000 N’000
Property, plant and equipment and Intangible assets (1,165,692) 106,522 (1,165,692) 106,522
Trade and
other receivables 153,243 158,215 153,243 158,215
Unrealized exchange difference (2,843) 2,174 (2,843) 2,174
Employee benefits 901,303 924,834 901,303 924,834
Net tax (liability)/asset (113,989) 1,191,745 (113,989) 1,191,745
(a) Movement in temporary differences during the year- Consolidated
Balance 1 January 2011
Recognised in profit and
loss
Balance 31 December
2011
Recognised in profit and
loss
Balance 31 December
2012
Property, plant and equipment and Intangible assets (20,117) 126,639 106,522 (1,272,214) (1,165,692)
Trade and other receivables 169,408 (11,193) 158,215 (4,972) 153,243
Unrealised exchange difference (366) 2,540 2,174 (5,017) (2,843)
Employee benefits 907,500 17,334 924,834 (23,531) 901,303
Tax loss carry-forwards 1,365,199 (1,365,199) - - -
2,421,624 (1,229,879) 1,191,745 (1,305,734) (113,989)
(b) Movement in temporary differences during the year- Separate
Balance 1 January
2011
Recognised in profit and
loss
Balance 31 December
2011
Recognised in profit and
loss
Balance 31 December
2012
Property, plant and equipment 183,081 (76,559) 106,522 (1,272,214) (1,165,692)
Trade and other receivables 158,215 - 158,215 (4,972) 153,243
Unrealised exchange difference (365) 2,539 2,174 (5,017) (2,843)
Employee benefits 900,600 24,234 924,834 (23,531) 901,303
Tax loss carry-forwards 1,331,293 (1,331,293) - - -
2,572,824 (1,381,079) 1,191,745 (1,305,734) (113,989)
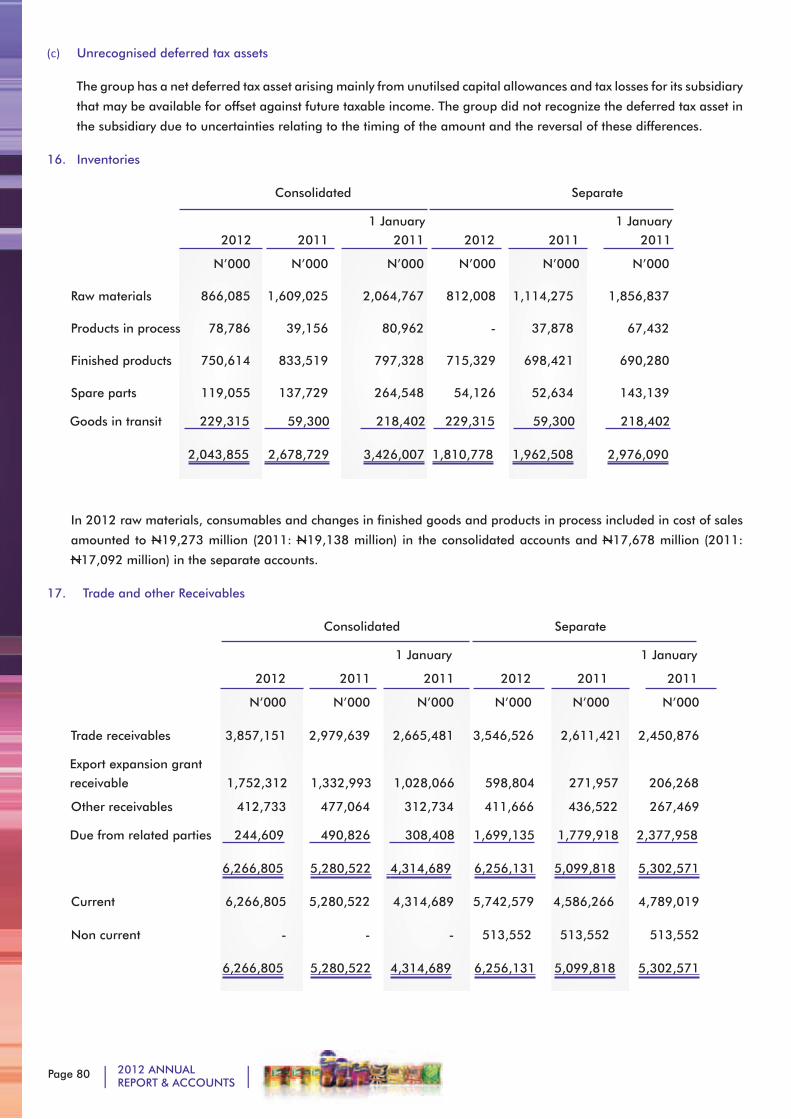
Page 80 2012 ANNUALREPORT & ACCOUNTS
(c) Unrecognised deferred tax assets
The group has a net deferred tax asset arising mainly from unutilsed capital allowances and tax losses for its subsidiary
that may be available for offset against future taxable income. The group did not recognize the deferred tax asset in
the subsidiary due to uncertainties relating to the timing of the amount and the reversal of these differences.
16. Inventories
Consolidated Separate
1 January 1 January 2012 2011 2011 2012 2011 2011
N’000 N’000 N’000 N’000 N’000 N’000
Raw materials 866,085 1,609,025 2,064,767 812,008 1,114,275 1,856,837
Products in process 78,786 39,156 80,962 - 37,878 67,432
Finished products 750,614 833,519 797,328 715,329 698,421 690,280
Spare parts 119,055 137,729 264,548 54,126 52,634 143,139
Goods in transit 229,315 59,300 218,402 229,315 59,300 218,402
2,043,855 2,678,729 3,426,007 1,810,778 1,962,508 2,976,090
In 2012 raw materials, consumables and changes in finished goods and products in process included in cost of sales
amounted to N19,273 million (2011: N19,138 million) in the consolidated accounts and N17,678 million (2011:
N17,092 million) in the separate accounts.
17. Trade and other Receivables
Consolidated Separate
1 January 1 January
2012 2011 2011 2012 2011 2011
N’000 N’000 N’000 N’000 N’000 N’000
Trade receivables 3,857,151 2,979,639 2,665,481 3,546,526 2,611,421 2,450,876
Export expansion grant receivable 1,752,312 1,332,993 1,028,066 598,804 271,957 206,268
Other receivables 412,733 477,064 312,734 411,666 436,522 267,469
Due from related parties 244,609 490,826 308,408 1,699,135 1,779,918 2,377,958
6,266,805 5,280,522 4,314,689 6,256,131 5,099,818 5,302,571
Current 6,266,805 5,280,522 4,314,689 5,742,579 4,586,266 4,789,019
Non current - - - 513,552 513,552 513,552
6,266,805 5,280,522 4,314,689 6,256,131 5,099,818 5,302,571
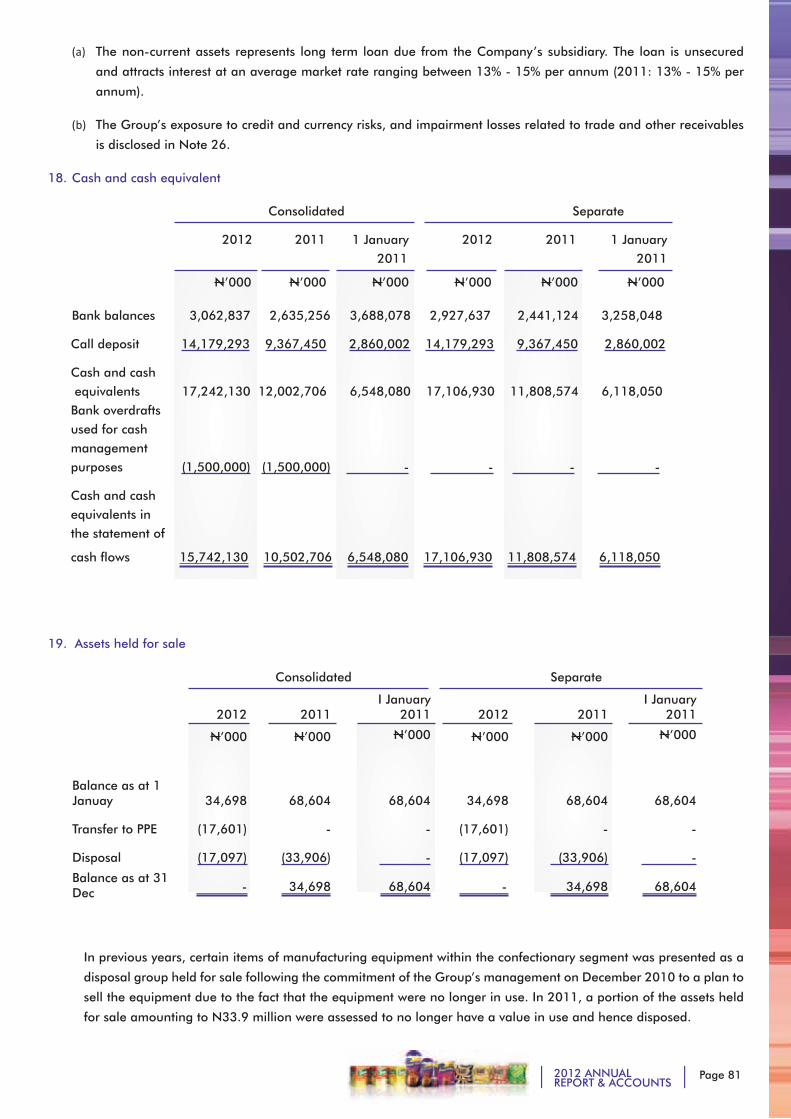
Page 812012 ANNUALREPORT & ACCOUNTS
(a) The non-current assets represents long term loan due from the Company’s subsidiary. The loan is unsecured
and attracts interest at an average market rate ranging between 13% - 15% per annum (2011: 13% - 15% per
annum).
(b) The Group’s exposure to credit and currency risks, and impairment losses related to trade and other receivables
is disclosed in Note 26.
18. Cash and cash equivalent
Consolidated Separate
2012 2011 1 January 2012 2011 1 January 2011 2011
N’000 N’000 N’000 N’000 N’000 N’000
Bank balances 3,062,837 2,635,256 3,688,078 2,927,637 2,441,124 3,258,048
Call deposit 14,179,293 9,367,450 2,860,002 14,179,293 9,367,450 2,860,002
Cash and cash equivalents 17,242,130 12,002,706 6,548,080 17,106,930 11,808,574 6,118,050 Bank overdrafts used for cash management purposes (1,500,000) (1,500,000) - - - -
Cash and cash equivalents in the statement of
cash flows 15,742,130 10,502,706 6,548,080 17,106,930 11,808,574 6,118,050
19. Assets held for sale
Consolidated Separate
2012 2011I January
2011 2012 2011I January
2011
N’000 N’000 N’000 N’000 N’000 N’000
Balance as at 1 Januay
Transfer to PPE
Disposal
34,698
(17,601)
(17,097)
68,604
-
(33,906)
68,604
-
-
34,698
(17,601)
(17,097)
68,604
-
(33,906)
68,604
-
-
Balance as at 31 Dec - 34,698 68,604 - 34,698 68,604
In previous years, certain items of manufacturing equipment within the confectionary segment was presented as a
disposal group held for sale following the commitment of the Group’s management on December 2010 to a plan to
sell the equipment due to the fact that the equipment were no longer in use. In 2011, a portion of the assets held
for sale amounting to N33.9 million were assessed to no longer have a value in use and hence disposed.
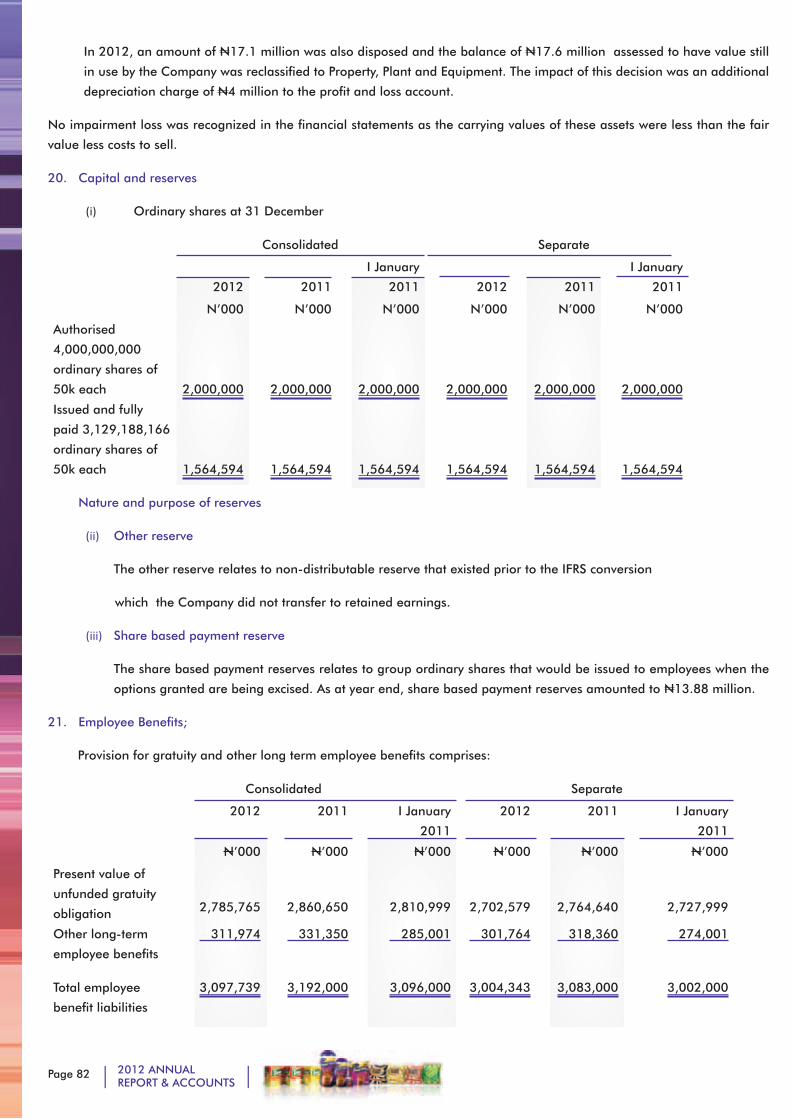
Page 82 2012 ANNUALREPORT & ACCOUNTS
In 2012, an amount of N17.1 million was also disposed and the balance of N17.6 million assessed to have value still
in use by the Company was reclassified to Property, Plant and Equipment. The impact of this decision was an additional
depreciation charge of N4 million to the profit and loss account.
No impairment loss was recognized in the financial statements as the carrying values of these assets were less than the fair
value less costs to sell.
20. Capital and reserves
(i) Ordinary shares at 31 December
Consolidated Separate
2012 2011
I January
2011 2012 2011
I January
2011
N’000 N’000 N’000 N’000 N’000 N’000
Authorised
4,000,000,000
ordinary shares of
50k each 2,000,000 2,000,000 2,000,000 2,000,000 2,000,000 2,000,000
Issued and fully
paid 3,129,188,166
ordinary shares of
50k each 1,564,594 1,564,594 1,564,594 1,564,594 1,564,594 1,564,594
Nature and purpose of reserves
(ii) Other reserve
The other reserve relates to non-distributable reserve that existed prior to the IFRS conversion
which the Company did not transfer to retained earnings.
(iii) Share based payment reserve
The share based payment reserves relates to group ordinary shares that would be issued to employees when the
options granted are being excised. As at year end, share based payment reserves amounted to N13.88 million.
21. Employee Benefits;
Provision for gratuity and other long term employee benefits comprises:
Consolidated Separate
2012 2011 I January
2011
2012 2011 I January
2011
N’000 N’000 N’000 N’000 N’000 N’000
Present value of
unfunded gratuity
obligation 2,785,765 2,860,650
2,810,999 2,702,579 2,764,640 2,727,999
Other long-term
employee benefits
311,974 331,350 285,001 301,764 318,360 274,001
Total employee
benefit liabilities
3,097,739 3,192,000 3,096,000 3,004,343 3,083,000 3,002,000
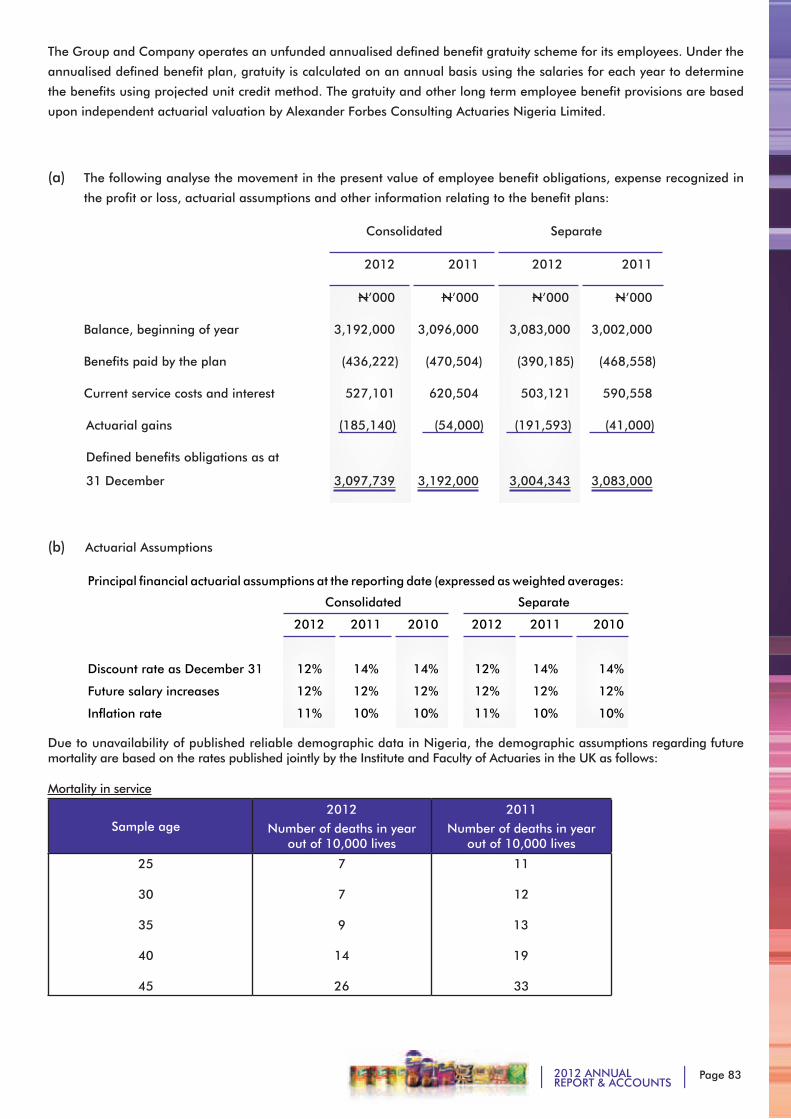
Page 832012 ANNUALREPORT & ACCOUNTS
The Group and Company operates an unfunded annualised defined benefit gratuity scheme for its employees. Under the
annualised defined benefit plan, gratuity is calculated on an annual basis using the salaries for each year to determine
the benefits using projected unit credit method. The gratuity and other long term employee benefit provisions are based
upon independent actuarial valuation by Alexander Forbes Consulting Actuaries Nigeria Limited.
(a) The following analyse the movement in the present value of employee benefit obligations, expense recognized in
the profit or loss, actuarial assumptions and other information relating to the benefit plans:
Consolidated Separate
2012 2011 2012 2011
N’000 N’000 N’000 N’000
Balance, beginning of year 3,192,000 3,096,000 3,083,000 3,002,000
Benefits paid by the plan (436,222) (470,504) (390,185) (468,558)
Current service costs and interest 527,101 620,504 503,121 590,558
Actuarial gains (185,140) (54,000) (191,593) (41,000)
Defined benefits obligations as at
31 December 3,097,739 3,192,000 3,004,343 3,083,000
(b) Actuarial Assumptions
Principal financial actuarial assumptions at the reporting date (expressed as weighted averages:
Consolidated Separate
2012 2011 2010 2012 2011 2010
Discount rate as December 31 12% 14% 14% 12% 14% 14%
Future salary increases 12% 12% 12% 12% 12% 12%
Inflation rate 11% 10% 10% 11% 10% 10%
Due to unavailability of published reliable demographic data in Nigeria, the demographic assumptions regarding future mortality are based on the rates published jointly by the Institute and Faculty of Actuaries in the UK as follows:
Mortality in service
Sample age2012
Number of deaths in year out of 10,000 lives
2011Number of deaths in year
out of 10,000 lives
25
30
35
40
45
7
7
9
14
26
11
12
13
19
33
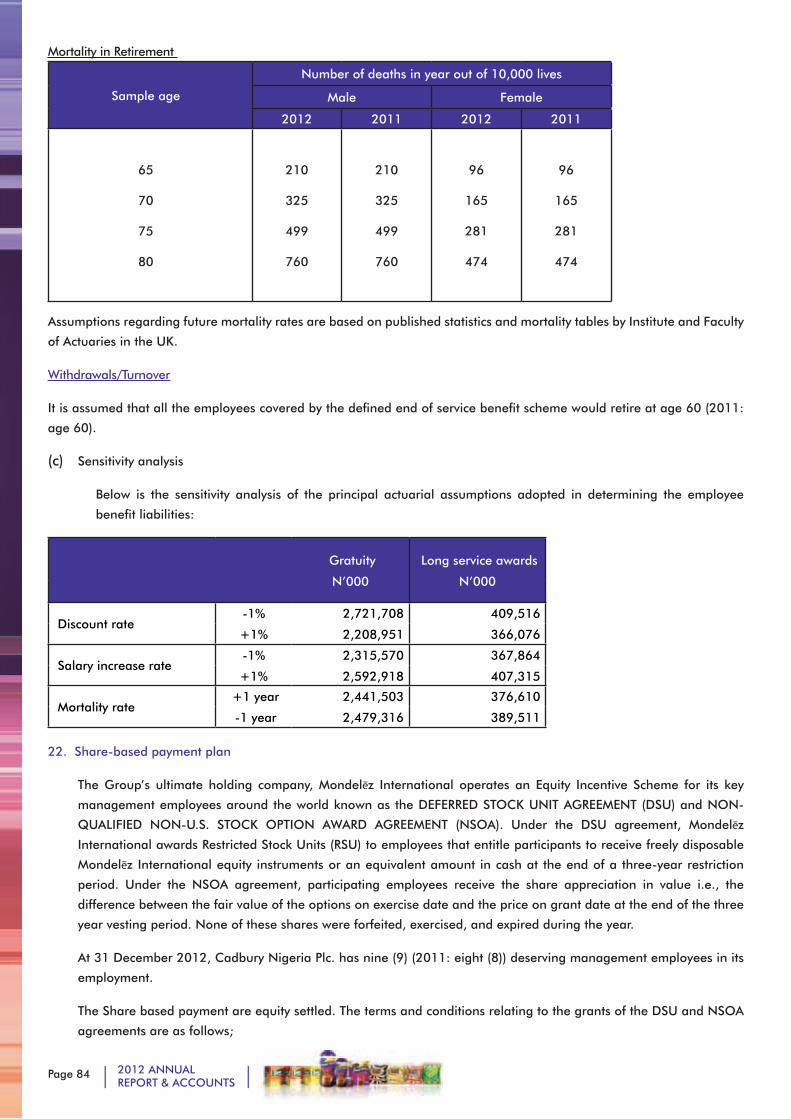
Page 84 2012 ANNUALREPORT & ACCOUNTS
Mortality in Retirement
Sample age
Number of deaths in year out of 10,000 lives
Male Female
2012 2011 2012 2011
65
70
75
80
210
325
499
760
210
325
499
760
96
165
281
474
96
165
281
474
Assumptions regarding future mortality rates are based on published statistics and mortality tables by Institute and Faculty
of Actuaries in the UK.
Withdrawals/Turnover
It is assumed that all the employees covered by the defined end of service benefit scheme would retire at age 60 (2011:
age 60).
(c) Sensitivity analysis
Below is the sensitivity analysis of the principal actuarial assumptions adopted in determining the employee
benefit liabilities:
Gratuity
N’000
Long service awards
N’000
Discount rate -1% 2,721,708 409,516
+1% 2,208,951 366,076
Salary increase rate -1% 2,315,570 367,864
+1% 2,592,918 407,315
Mortality rate +1 year 2,441,503 376,610
-1 year 2,479,316 389,511
22. Share-based payment plan
The Group’s ultimate holding company, Mondelēz International operates an Equity Incentive Scheme for its key
management employees around the world known as the DEFERRED STOCK UNIT AGREEMENT (DSU) and NON-
QUALIFIED NON-U.S. STOCK OPTION AWARD AGREEMENT (NSOA). Under the DSU agreement, Mondelēz
International awards Restricted Stock Units (RSU) to employees that entitle participants to receive freely disposable
Mondelēz International equity instruments or an equivalent amount in cash at the end of a three-year restriction
period. Under the NSOA agreement, participating employees receive the share appreciation in value i.e., the
difference between the fair value of the options on exercise date and the price on grant date at the end of the three
year vesting period. None of these shares were forfeited, exercised, and expired during the year.
At 31 December 2012, Cadbury Nigeria Plc. has nine (9) (2011: eight (8)) deserving management employees in its
employment.
The Share based payment are equity settled. The terms and conditions relating to the grants of the DSU and NSOA
agreements are as follows;
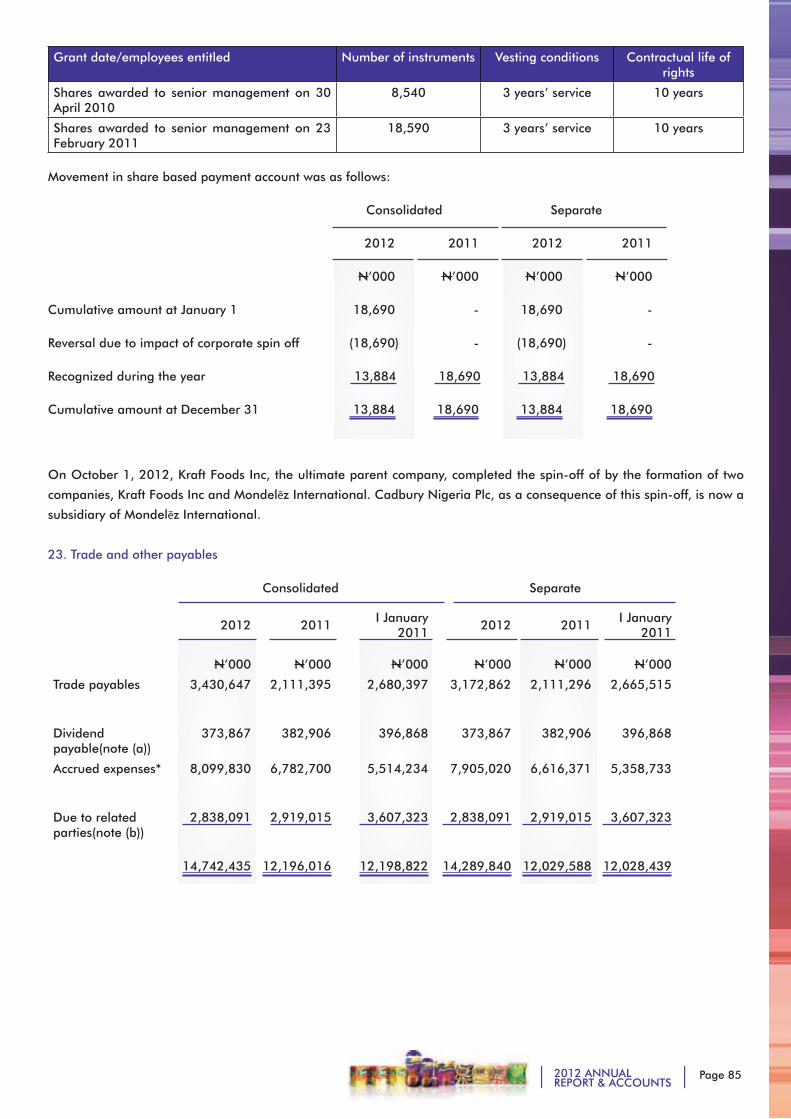
Page 852012 ANNUALREPORT & ACCOUNTS
Grant date/employees entitled Number of instruments Vesting conditions Contractual life of rights
Shares awarded to senior management on 30 April 2010
8,540 3 years’ service 10 years
Shares awarded to senior management on 23 February 2011
18,590 3 years’ service 10 years
Movement in share based payment account was as follows:
Consolidated Separate
2012 2011 2012 2011
N’000 N’000 N’000 N’000
Cumulative amount at January 1 18,690 - 18,690 -
Reversal due to impact of corporate spin off (18,690) - (18,690) -
Recognized during the year 13,884 18,690 13,884 18,690
Cumulative amount at December 31 13,884 18,690 13,884 18,690
On October 1, 2012, Kraft Foods Inc, the ultimate parent company, completed the spin-off of by the formation of two
companies, Kraft Foods Inc and Mondelēz International. Cadbury Nigeria Plc, as a consequence of this spin-off, is now a
subsidiary of Mondelēz International.
23. Trade and other payables
Consolidated Separate
2012 2011I January
20112012 2011
I January 2011
N’000 N’000 N’000 N’000 N’000 N’000
Trade payables 3,430,647 2,111,395
2,680,397
3,172,862 2,111,296 2,665,515
Dividend payable(note (a))
373,867 382,906 396,868 373,867 382,906 396,868
Accrued expenses* 8,099,830 6,782,700 5,514,234 7,905,020 6,616,371 5,358,733
Due to related parties(note (b))
2,838,091 2,919,015 3,607,323 2,838,091 2,919,015 3,607,323
14,742,435 12,196,016 12,198,822 14,289,840 12,029,588 12,028,439
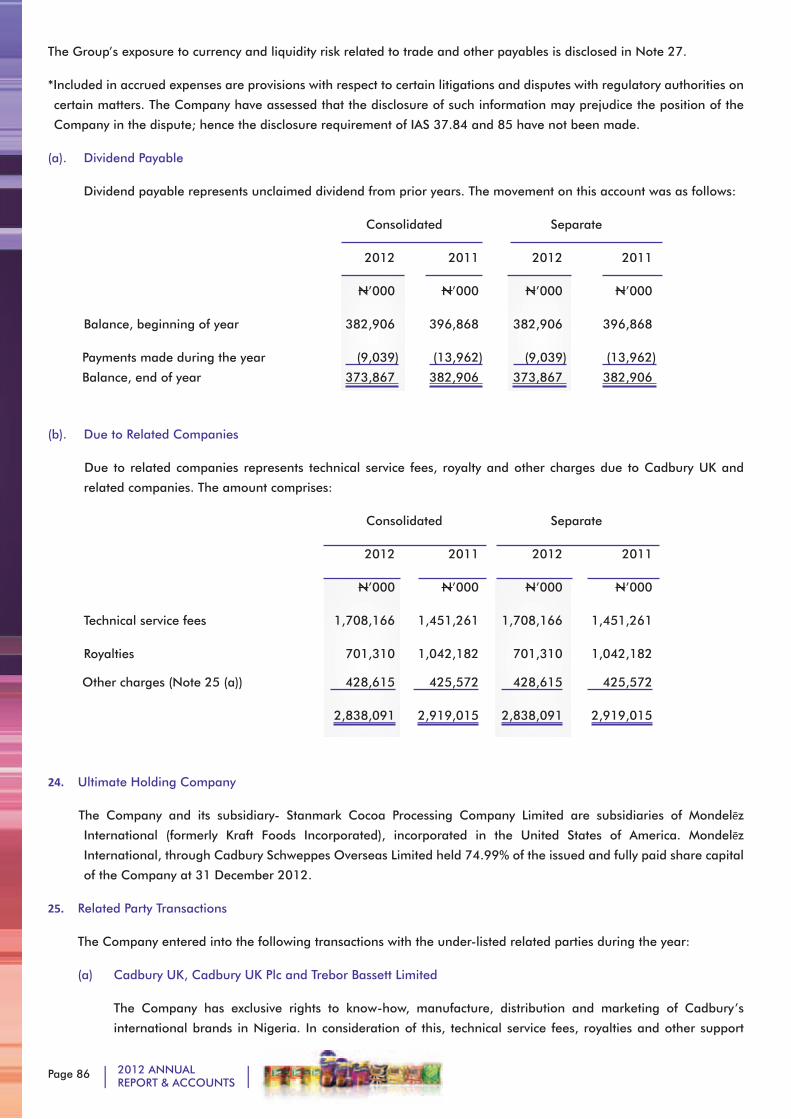
Page 86 2012 ANNUALREPORT & ACCOUNTS
The Group’s exposure to currency and liquidity risk related to trade and other payables is disclosed in Note 27.
*Included in accrued expenses are provisions with respect to certain litigations and disputes with regulatory authorities on
certain matters. The Company have assessed that the disclosure of such information may prejudice the position of the
Company in the dispute; hence the disclosure requirement of IAS 37.84 and 85 have not been made.
(a). Dividend Payable
Dividend payable represents unclaimed dividend from prior years. The movement on this account was as follows:
Consolidated Separate
2012 2011 2012 2011
N’000 N’000 N’000 N’000
Balance, beginning of year 382,906 396,868 382,906 396,868
Payments made during the year (9,039) (13,962) (9,039) (13,962)
Balance, end of year 373,867 382,906 373,867 382,906
(b). Due to Related Companies
Due to related companies represents technical service fees, royalty and other charges due to Cadbury UK and
related companies. The amount comprises:
Consolidated Separate
2012 2011 2012 2011
N’000 N’000 N’000 N’000
Technical service fees 1,708,166 1,451,261 1,708,166 1,451,261
Royalties 701,310 1,042,182 701,310 1,042,182
Other charges (Note 25 (a)) 428,615 425,572 428,615 425,572
2,838,091 2,919,015 2,838,091 2,919,015
24. Ultimate Holding Company
The Company and its subsidiary- Stanmark Cocoa Processing Company Limited are subsidiaries of Mondelēz
International (formerly Kraft Foods Incorporated), incorporated in the United States of America. Mondelēz
International, through Cadbury Schweppes Overseas Limited held 74.99% of the issued and fully paid share capital
of the Company at 31 December 2012.
25. Related Party Transactions
The Company entered into the following transactions with the under-listed related parties during the year:
(a) Cadbury UK, Cadbury UK Plc and Trebor Bassett Limited
The Company has exclusive rights to know-how, manufacture, distribution and marketing of Cadbury’s
international brands in Nigeria. In consideration of this, technical service fees, royalties and other support
Page 872012 ANNUALREPORT & ACCOUNTS
charges are paid to Cadbury UK, Cadbury UK Plc and Trebor Bassett Limited.
The trade mark license and know – how agreements are made with the approval of the National Office for
Technology Acquisition and Promotion. At the year end, the total amount due to Cadbury UK was N2,838
million (2011: N2,919 million) (Note 23).
Other charges as disclosed in Note 23 mainly represent IT and other charges paid by Cadbury UK on behalf
of the Company in respect of IT hardware and software acquisition, licensing, software maintenance charges,
and other sundry costs.
(b) Stanmark Cocoa Processing Company Limited (SCPCL)
(i) The Company has a majority shareholding of 99.3% (2011: 93.38%) in SCPCL, which is engaged in
processing of cocoa to butter, powder, liquor and cake. On 24 February 2012 the deposit for shares in
Stanmark Cocoa beans Processing Company Limited was approved by the Corporate Affairs Commission
for conversion to 905 million Ordinary Shares at a price of N1 per share.
(ii) SCPCL supplies all the cocoa powder used by the Company in its manufacturing process. Total value of
purchases from SCPCL was N 1,836 million (2011: N 1,923 million)
(iii) SCPCL’s management team during the year included four personnel seconded from the Company.
(iv) The Company provided working capital facilities to SCPCL for the purchase of cocoa beans due to the
seasonal nature of the product and to enable SCPCL meet the Company’s cocoa powder requirement.
Interest on the loan is linked to ruling commercial rates and averaged 13% p.a. (2011: 13% - 15% p.a.)
and is subject to review in line with market conditions. Under the loan arrangement, SCPCL is to repay
the loan balance through the invoiced amount of cocoa powder supplied, proceeds from the export of
other cocoa related by-products not required by the Company and government grants received on export
sales.
The Company also made some other payments on behalf of SCPCL. The total amount due from SCPCL to
the Company at year end was N939 million (2011: N812 million) (Note 17).
(v) The Company provided SCPCL with a long term loan (See Note 12(b)).
(c) Cadbury Ghana Limited (CGL)
The Company sells some of its products to CGL. Sales in the current year amounted to N682 million (2011:
N649 million). The net amount due to the Company from CGL was N 245 million (2011: N 302 million) at
year end.
(d) Kraft Food South Africa (Pty) Limited (KFSAL)
The Group sells cocoa butter to KFSAL. Sales in the current year amounted to N77 million (2011: N247
million). There were no outstanding due from KFSAL to the group at year end (2011: N12 million).
(e) Dirol Cadbury LLC (DCL)
The Group sells cocoa butter to DCL. Sales in the current year amounted to N127 million (2011: N199 million).
There were no outstanding due from DCL to the group at year end (2011: N25 million).
(f) Kraft Foods Thailand (KFT)
The Company buys TANG products from KFT which it sells and markets to its consumers.
Purchases in the current year amounted to N353 million (2011: Nil). The amount due to KFT by the Company
Page 88 2012 ANNUALREPORT & ACCOUNTS
at year end was N6 million (2011: Nil).
(g) StanbicIBTC Bank Plc
The Company maintained banking relationship with Stanbic IBTC Bank Plc during the year. The Chairman of the
Company Atedo Peterside is also the Chairman of Stanbic IBTC Bank Plc. During the year, the Company held
term deposits with StanbicIBTC Bank Plc as investments. These deposits are included as part of the call deposits
shown in note 18.
(h) Transactions with key management personnel
Key management personnel compensation
In addition to their salaries, the Company also provides non-cash benefits to Executive Directors and key heads
of function, and contributes to a post-employment defined contribution plan on their behalf. In accordance with
the terms of the plan, Executive Directors and key heads of function retire at age 60 and if qualified, are entitled
to receive gratuity lump sum amount from the Cadbury Nigeria Plc.
Executive Directors, if qualified also participate in the Company’s long service awards programme. This
programme awards a certain sum of cash benefit which accrues to the recipient on graduated periods of
uninterrupted service. .
Key management personnel compensation comprised:
In thousands of naira 2012 2011
Short-term employee benefits 320,981 196,338
Contribution to compulsory pension fund scheme 11,996 10,958
Defined contribution gratuity scheme - -
Other long-term benefits - -
Share based payments 4,536 9,466
337,513 216,762
26. Financial Instruments
Financial Risk Management
Overview
The Group has exposure to the following risks arising from financial instruments:
• Credit risk
• Liquidity risk
• Market risk
• Interest rate risk
• Operational risk
• Capital management
This note presents information about the Group’s exposure to each of the above risks, the Group’s objectives, policies
and processes for measuring and managing risk, and the Group’s management of capital.
Page 892012 ANNUALREPORT & ACCOUNTS
Risk management framework
The Board of Directors has overall responsibility for the establishment and oversight of the Company’s risk management
framework. The Board of Directors has established the Risk Management Committee, which is responsible for
developing and monitoring the Group’s risk management policies. The Committee reports regularly to the Board of
Directors on its activities.
The Group’s risk management policies are established to identify and analyse the risks faced by the Group, to set
appropriate risk limits and controls, and to monitor risks and adherence to limits. Risk management policies and
systems are reviewed regularly to reflect changes in market conditions and the Group’s activities. The Group, through
its training and management standards and procedures, aims to develop a disciplined and constructive control
environment in which all employees understand their roles and obligations.
The Group Audit Committee oversees how management monitors compliance with the Group’s risk management
policies and procedures, and reviews the adequacy of the risk management framework in relation to the risks faced
by the Company. The Group Audit Committee is assisted in its oversight role by the Internal Audit Function. Internal
Audit undertakes both regular and ad hoc reviews of risk management controls and procedures, the results of which
are reported to the Audit Committee.
(a) Credit risk
Credit risk is the risk of financial loss to the Group if a customer or counterparty to a financial instrument fails
to meet its contractual obligations, and arises principally from the Group’s receivables from customers.
(i) Exposure to credit risk
The carrying amount of financial assets represents the maximum credit exposure. The maximum exposure to
credit risk at the reporting date was:
Consolidated Separate
Carrying amount Carrying amount
2012 2011 I January 2011
2012 2011 I January 2011
Cash and cash equivalents 17,242,130 12,002,706 6,548,080 17,106,930 11,808,574 6,118,050
Trade receivables 3,857,151 2,979,639 2,665,481 3,546,526 2,611,421 2,450,876
Export expansion grant receivable
1,752,312 1,332,993 1,028,066 598,804 271,957 206,268
Other receivables 412,733 477,064 312,734 411,666 436,522 267,469
Due from related parties 244,609 490,826 308,408 1,699,135 1,779,918 2,377,958
23,508,935 17,283,228 10,862,769 23,363,061 16,908,392 11,420,621
Trade and other receivables:
The Group’s exposure to credit risk is influenced mainly by the individual characteristics of each customer.
The Risk Management Committee has established a credit policy under which each new customer is analysed
individually for creditworthiness before the Group’s standard payment and delivery terms and conditions are
offered. The Group’s review includes external ratings when available, and in some cases bank references.
Purchase limits are established for each customer, which represents the maximum open amount without
requiring approval from the Risk Management Committee; these limits are reviewed quarterly. Customers that
fail to meet the Group’s benchmark creditworthiness may transact with the Group only on a prepayment basis.
Page 90 2012 ANNUALREPORT & ACCOUNTS
More than 86% of the Group’s customers have been transacting with the Group for over four (4) years, and no
impairment loss has been recognized against these customers. In monitoring customer credit risk, customers
are grouped according to their credit characteristics, including whether they are an individual or a legal entity,
whether they are a wholesale, retail or end-user customer, geographic location, industry, aging profile, maturity
and existence of previous financial difficulties. Trade and other receivables relate mainly to the Group’s wholesale
customers. Customers that are graded as “high risk” are placed on a restricted customer list and monitored by the
Risk Management Committee, and future sales are made on a prepayment basis.
The Group establishes an allowance for impairment that represents its estimate of incurred losses in respect of
trade and other receivables. The main components of this allowance are a specific loss component that relates to
individually significant exposures, and a collective loss component established for groups of similar assets in respect
of losses that have been incurred but not yet identified. The collective loss allowance is determined based on historical
data of payment statistics for similar financial assets.
The Group does not have any significant concentration of credit risk.
The aging of loans and receivables at the reporting date was:
Consolidated Separate Gross Amount Gross Amount
2012 2011I January
2011 2012 2011I January
2011
Not past due 0-30 days
3,354,838 2,597,028 2,166,545 3,051,461 2,412,919 2,059,242
Past due 31- 180 days
502,032 290,556 445,232 494,784 198,502 391,581
Past due 181- 365 days
- 92,055 53,704 - - 53
More than one year
519,290 520,560 520,550 519,290 520,560 520,550
4,376,160 3,500,199 3,186,031 4,065,535 3,131,981 2,971,426
Consolidated Separate
Impairment Impairment
2012 2011I January
2011 2012 2011I January
2011
Not past due 0-30 days
- - - - - -
Past due 31- 180 days
- - - - - -
Past due 181- 365 days
- - - - - -
More than one year (519,009) (520,560) (520,560) (519,009) (520,560) (520,550)
(519,009) (520,560) (520,560) (519,009) (520,560) (520,550)
Page 912012 ANNUALREPORT & ACCOUNTS
Consolidated Separate
Carrying Amount Carrying Amount
2012 2011 I January 2011
2012 2011 I January 2011
Not past due 0-30 days
3,354,838 2,597,028 2,166,545 3,051,461 2,412,919 2,059,242
Past due 31- 180 days
502,313 290,556 445,232 495,065 198,502 391,581
Past due 181- 365 days
- 92,055 53,704 - - 53
More than one year
- - - - - -
3,857,151 2,979,639 2,665,481 3,546,526 2,611,421 2,450,876
The Group believes that the unimpaired amounts that are past due by more than 30 days are still collectable in full, based on historic payment behavior and extensive analysis of customer credit risk, including underlying customer credit ratings, when available.
The credit quality of trade and other receivables is assessed based on a credit policy established by the Risk Management Committee. The Group has monitored customer credit risk, by grouping trade and other receivables based on their char-acteristics. An analysis of the credit quality of trade and other receivables not impaired is as follows:
Consolidated Separate
2012 2011 2012 2011
N’000 N’000 N’000 N’000
Four or more years trading history with the Group 2,867,053 2,214,791 2,556,428 1,932,451
Less than four years trading history with the Group 990,098 764,848 990,098 678,970
Higher risk - - - -
3,857,151 2,979,639 3,546,526 2,611,421
Based on the Group’s monitoring of customer credit risk, the Group believes that, except as indicated above, no impair-ment allowance is necessary in respect of trade receivables not past due.
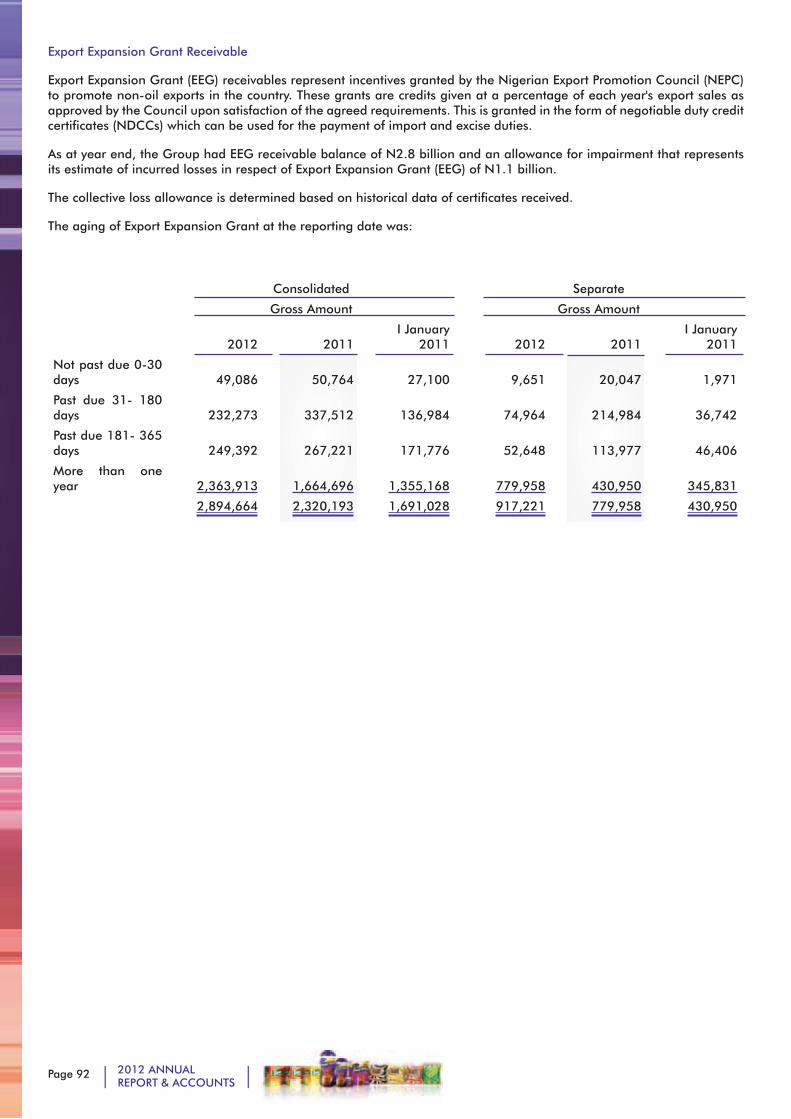
Page 92 2012 ANNUALREPORT & ACCOUNTS
Export Expansion Grant Receivable
Export Expansion Grant (EEG) receivables represent incentives granted by the Nigerian Export Promotion Council (NEPC) to promote non-oil exports in the country. These grants are credits given at a percentage of each year's export sales as approved by the Council upon satisfaction of the agreed requirements. This is granted in the form of negotiable duty credit certificates (NDCCs) which can be used for the payment of import and excise duties.
As at year end, the Group had EEG receivable balance of N2.8 billion and an allowance for impairment that represents its estimate of incurred losses in respect of Export Expansion Grant (EEG) of N1.1 billion.
The collective loss allowance is determined based on historical data of certificates received.
The aging of Export Expansion Grant at the reporting date was:
Consolidated Separate
Gross Amount Gross Amount
2012 2011I January
2011 2012 2011I January
2011
Not past due 0-30 days 49,086 50,764 27,100 9,651 20,047 1,971
Past due 31- 180 days
232,273 337,512 136,984 74,964 214,984 36,742
Past due 181- 365 days
249,392 267,221 171,776 52,648 113,977 46,406
More than one year
2,363,913
1,664,696 1,355,168 779,958 430,950 345,831
2,894,664 2,320,193 1,691,028 917,221 779,958 430,950
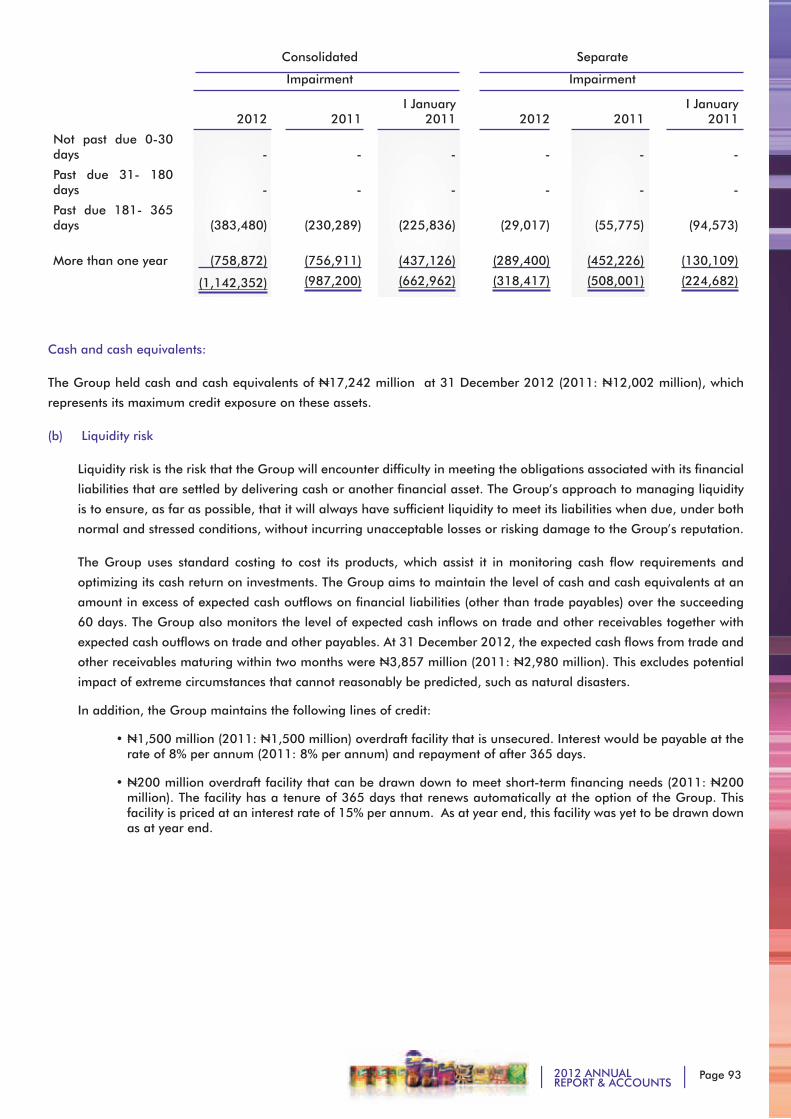
Page 932012 ANNUALREPORT & ACCOUNTS
Consolidated Separate
Impairment Impairment
2012 2011I January
2011 2012 2011I January
2011
Not past due 0-30 days - - - - - -
Past due 31- 180 days - - - - - -
Past due 181- 365 days (383,480) (230,289) (225,836)
(29,017)
(55,775) (94,573)
More than one year (758,872) (756,911) (437,126) (289,400)
(452,226) (130,109)
(1,142,352) (987,200) (662,962) (318,417) (508,001) (224,682)
Cash and cash equivalents:
The Group held cash and cash equivalents of N17,242 million at 31 December 2012 (2011: N12,002 million), which
represents its maximum credit exposure on these assets.
(b) Liquidity risk
Liquidity risk is the risk that the Group will encounter difficulty in meeting the obligations associated with its financial
liabilities that are settled by delivering cash or another financial asset. The Group’s approach to managing liquidity
is to ensure, as far as possible, that it will always have sufficient liquidity to meet its liabilities when due, under both
normal and stressed conditions, without incurring unacceptable losses or risking damage to the Group’s reputation.
The Group uses standard costing to cost its products, which assist it in monitoring cash flow requirements and
optimizing its cash return on investments. The Group aims to maintain the level of cash and cash equivalents at an
amount in excess of expected cash outflows on financial liabilities (other than trade payables) over the succeeding
60 days. The Group also monitors the level of expected cash inflows on trade and other receivables together with
expected cash outflows on trade and other payables. At 31 December 2012, the expected cash flows from trade and
other receivables maturing within two months were N3,857 million (2011: N2,980 million). This excludes potential
impact of extreme circumstances that cannot reasonably be predicted, such as natural disasters.
In addition, the Group maintains the following lines of credit:
• N1,500 million (2011: N1,500 million) overdraft facility that is unsecured. Interest would be payable at the rate of 8% per annum (2011: 8% per annum) and repayment of after 365 days.
• N200 million overdraft facility that can be drawn down to meet short-term financing needs (2011: N200 million). The facility has a tenure of 365 days that renews automatically at the option of the Group. This facility is priced at an interest rate of 15% per annum. As at year end, this facility was yet to be drawn down as at year end.
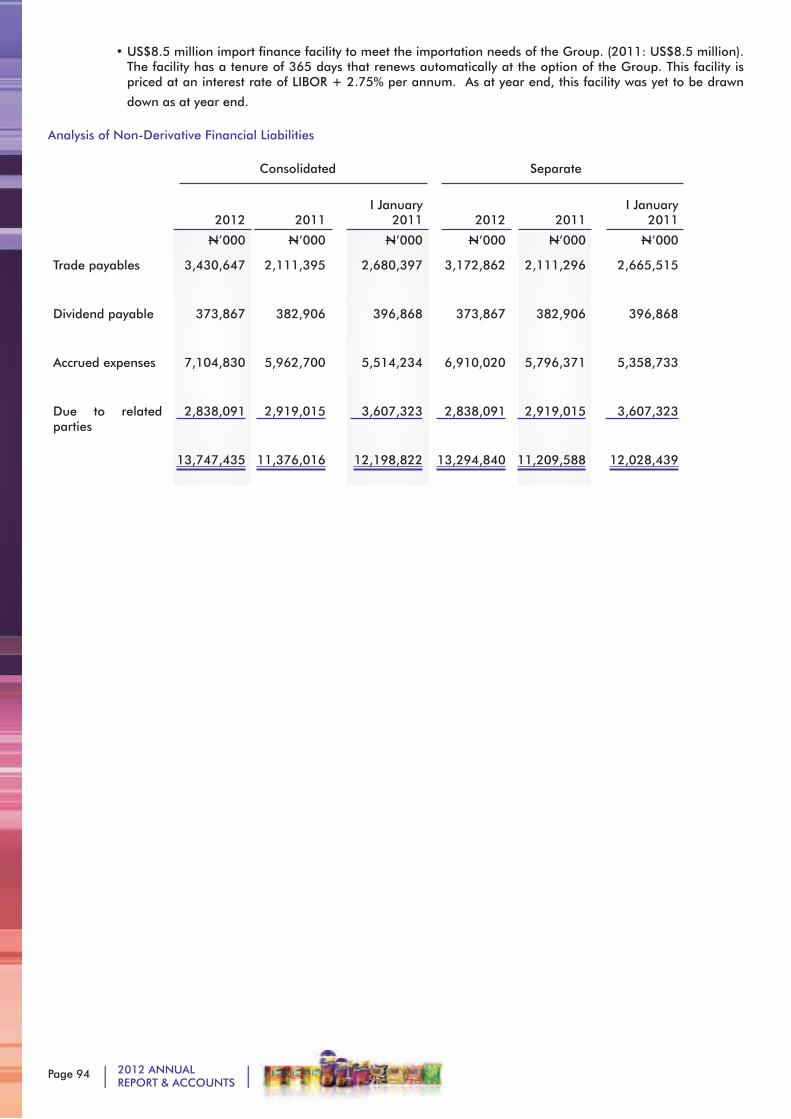
Page 94 2012 ANNUALREPORT & ACCOUNTS
• US$8.5 million import finance facility to meet the importation needs of the Group. (2011: US$8.5 million). The facility has a tenure of 365 days that renews automatically at the option of the Group. This facility is priced at an interest rate of LIBOR + 2.75% per annum. As at year end, this facility was yet to be drawn
down as at year end.
Analysis of Non-Derivative Financial Liabilities
Consolidated Separate
2012 2011I January
2011 2012 2011I January
2011
N’000 N’000 N’000 N’000 N’000 N’000
Trade payables 3,430,647 2,111,395
2,680,397
3,172,862 2,111,296 2,665,515
Dividend payable 373,867 382,906 396,868 373,867 382,906 396,868
Accrued expenses 7,104,830 5,962,700 5,514,234 6,910,020 5,796,371 5,358,733
Due to related parties
2,838,091 2,919,015 3,607,323 2,838,091 2,919,015 3,607,323
13,747,435 11,376,016 12,198,822 13,294,840 11,209,588 12,028,439
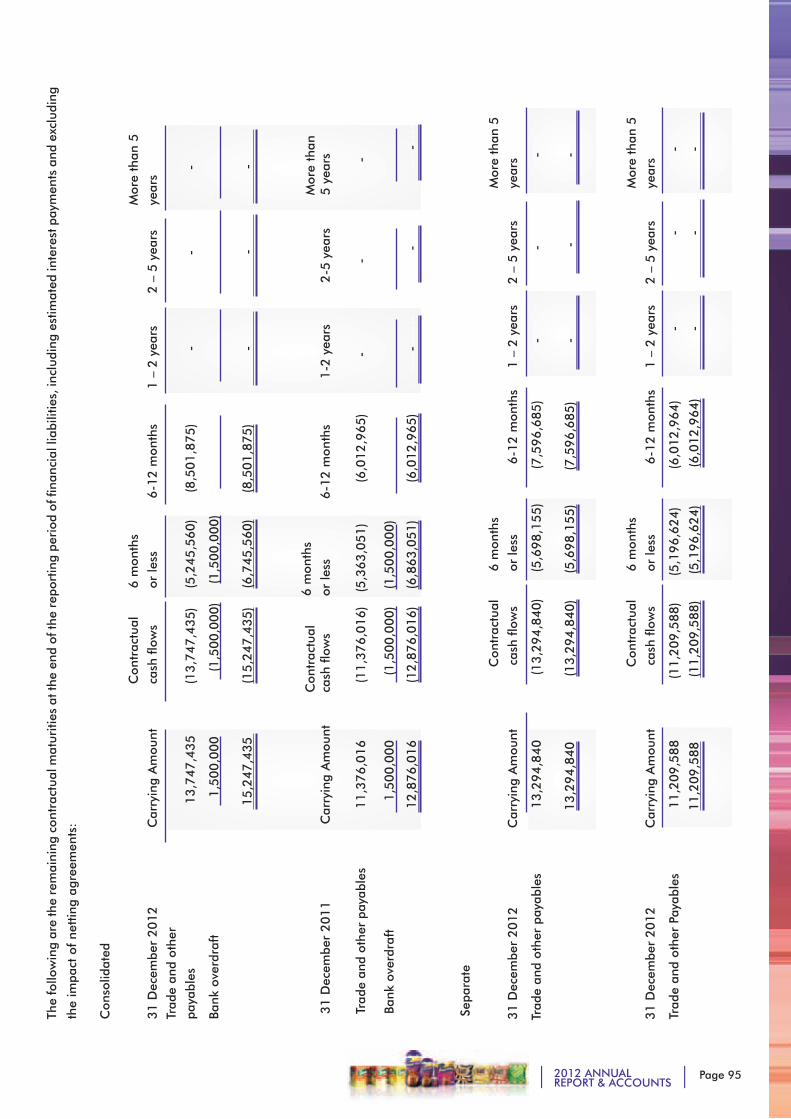
Page 952012 ANNUALREPORT & ACCOUNTS
The
follo
win
g ar
e th
e re
mai
ning
con
trac
tual
mat
uriti
es a
t the
end
of t
he r
epor
ting
peri
od o
f fina
ncia
l lia
bilit
ies,
incl
udin
g es
timat
ed in
tere
st p
aym
ents
and
exc
ludi
ng
the
impa
ct o
f ne
ttin
g ag
reem
ents
:
Con
solid
ated
C
ontr
actu
al
6 m
onth
s
M
ore
than
531 D
ecem
ber
20
12
Car
ryin
g A
mou
nt
cash
flow
s or
less
6
-12
mon
ths
1 –
2 y
ears
2 –
5 y
ears
ye
ars
Trad
e an
d ot
her
paya
bles
1
3,7
47
,43
5
(13
,74
7,4
35
) (5
,24
5,5
60
) (8
,50
1,8
75)
-
-
-
Bank
ove
rdra
ft
1,5
00
,00
0 (
1,5
00
,00
0)
(1
,50
0,0
00
)
1
5,2
47
,43
5 (1
5,2
47
,43
5)
(6
,74
5,5
60
) (8
,50
1,8
75)
-
-
-
31 D
ecem
ber
20
11
C
arry
ing
Am
ount
Con
trac
tual
ca
sh fl
ows
6 m
onth
s or
less
6-1
2 m
onth
s1-2
yea
rs2-5
yea
rsM
ore
than
5 y
ears
Trad
e an
d ot
her
paya
bles
Bank
ove
rdra
ft
11
,376
,01
6
1
,50
0,0
00
(11
,37
6,0
16
)
(1
,50
0,0
00
)
(5
,36
3,0
51
)
(1
,50
0,0
00
)
(6,0
12
,965)
-
-
-
1
2,8
76
,01
6
(1
2,8
76
,01
6)
(6,8
63
,05
1)
(6,0
12
,965)
-
----
----
--
-
----
----
-
-- -
----
Sep
arat
e
Con
trac
tual
6
mon
ths
Mor
e th
an 5
31 D
ecem
ber
20
12
C
arry
ing
Am
ount
ca
sh fl
ows
or le
ss
6
-12 m
onth
s
1 –
2 y
ears
2 –
5 y
ears
ye
ars
Trad
e an
d ot
her
paya
bles
13
,29
4,8
40
(
13
,29
4,8
40
) (5
,69
8,1
55
) (7
,59
6,6
85)
-
-
-
1
3,2
94
,84
0
(1
3,2
94
,84
0)
(5
,69
8,1
55
) (7
,59
6,6
85)
-
-
-
C
ontr
actu
al
6 m
onth
s
M
ore
than
5
31 D
ecem
ber
20
12
C
arry
ing
Am
ount
ca
sh fl
ows
or le
ss
6
-12 m
onth
s
1 –
2 y
ears
2 –
5 y
ears
ye
ars
Tra
de a
nd o
ther
Pay
able
s
1
1,2
09
,58
8 (1
1,2
09
,58
8) (5
,19
6,6
24
) (
6,0
12,9
64)
- -
-
1
1,2
09
,58
8 (1
1,2
09
,58
8)
(5
,19
6,6
24
) (6
,012,9
64)
-
-
-
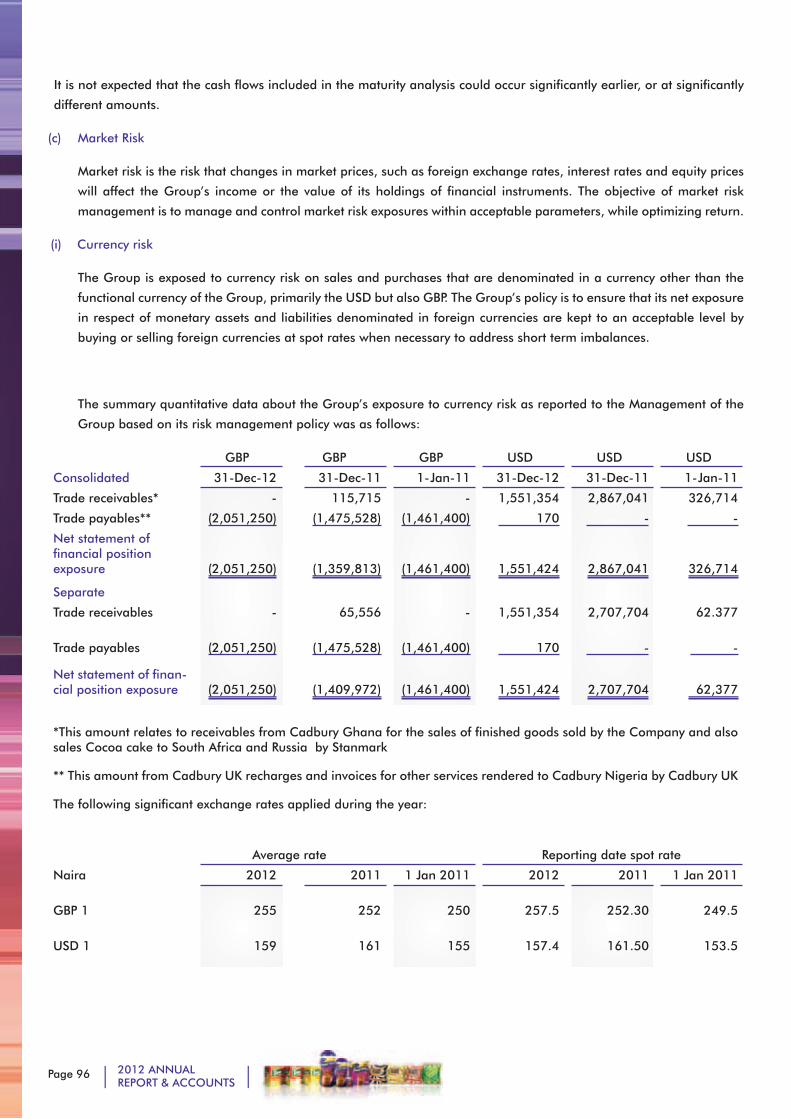
Page 96 2012 ANNUALREPORT & ACCOUNTS
It is not expected that the cash flows included in the maturity analysis could occur significantly earlier, or at significantly
different amounts.
(c) Market Risk
Market risk is the risk that changes in market prices, such as foreign exchange rates, interest rates and equity prices
will affect the Group’s income or the value of its holdings of financial instruments. The objective of market risk
management is to manage and control market risk exposures within acceptable parameters, while optimizing return.
(i) Currency risk
The Group is exposed to currency risk on sales and purchases that are denominated in a currency other than the
functional currency of the Group, primarily the USD but also GBP. The Group’s policy is to ensure that its net exposure
in respect of monetary assets and liabilities denominated in foreign currencies are kept to an acceptable level by
buying or selling foreign currencies at spot rates when necessary to address short term imbalances.
The summary quantitative data about the Group’s exposure to currency risk as reported to the Management of the
Group based on its risk management policy was as follows:
Consolidated
GBP GBP GBP USD USD USD
31-Dec-12 31-Dec-11 1-Jan-11 31-Dec-12 31-Dec-11 1-Jan-11
Trade receivables* - 115,715 - 1,551,354 2,867,041 326,714
Trade payables** (2,051,250) (1,475,528) (1,461,400) 170 - -
Net statement of financial position exposure (2,051,250)
(1,359,813) (1,461,400) 1,551,424
2,867,041 326,714
Separate
Trade receivables - 65,556 - 1,551,354 2,707,704 62.377
Trade payables (2,051,250)
(1,475,528) (1,461,400) 170 - -
Net statement of finan-cial position exposure (2,051,250)
(1,409,972) (1,461,400) 1,551,424
2,707,704 62,377
*This amount relates to receivables from Cadbury Ghana for the sales of finished goods sold by the Company and also sales Cocoa cake to South Africa and Russia by Stanmark
** This amount from Cadbury UK recharges and invoices for other services rendered to Cadbury Nigeria by Cadbury UK
The following significant exchange rates applied during the year:
Average rate Reporting date spot rate
Naira 2012 2011 1 Jan 2011 2012 2011 1 Jan 2011
GBP 1 255 252 250 257.5
252.30 249.5
USD 1 159 161 155 157.4
161.50 153.5
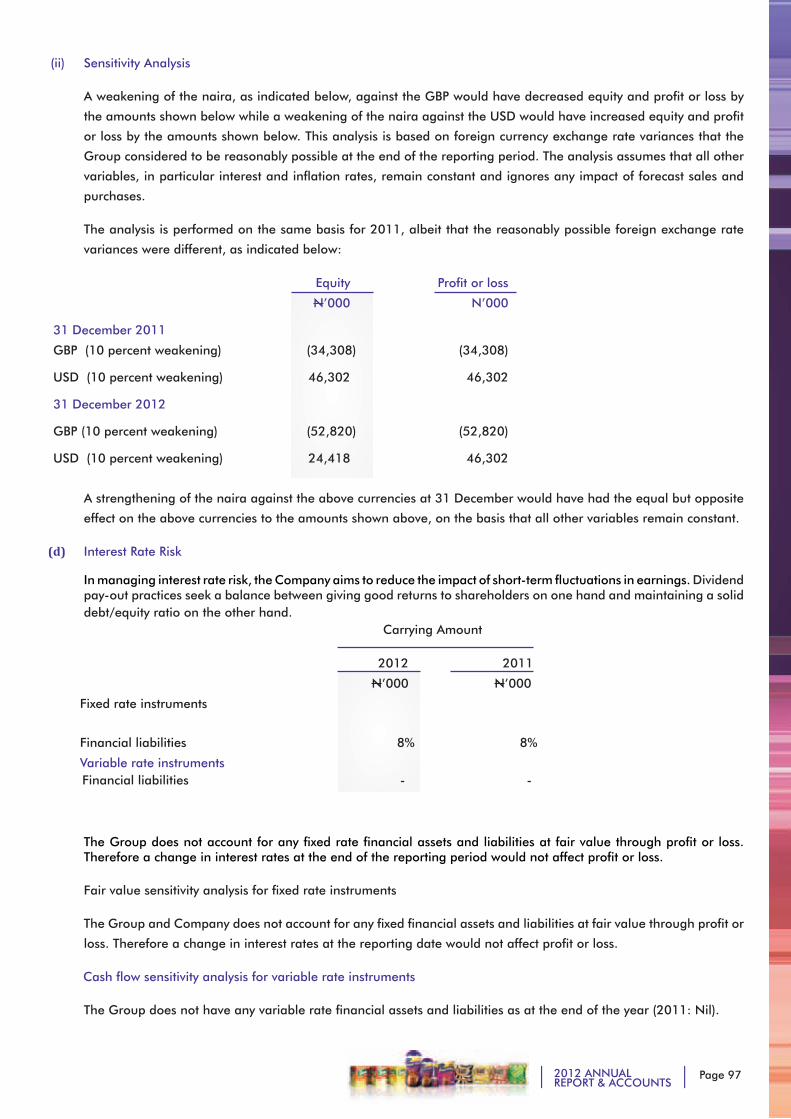
Page 972012 ANNUALREPORT & ACCOUNTS
(ii) Sensitivity Analysis
A weakening of the naira, as indicated below, against the GBP would have decreased equity and profit or loss by
the amounts shown below while a weakening of the naira against the USD would have increased equity and profit
or loss by the amounts shown below. This analysis is based on foreign currency exchange rate variances that the
Group considered to be reasonably possible at the end of the reporting period. The analysis assumes that all other
variables, in particular interest and inflation rates, remain constant and ignores any impact of forecast sales and
purchases.
The analysis is performed on the same basis for 2011, albeit that the reasonably possible foreign exchange rate
variances were different, as indicated below:
Equity Profit or loss
N’000 N’000
31 December 2011
GBP (10 percent weakening) (34,308) (34,308)
USD (10 percent weakening) 46,302 46,302
31 December 2012
GBP (10 percent weakening) (52,820) (52,820)
USD (10 percent weakening) 24,418 46,302
A strengthening of the naira against the above currencies at 31 December would have had the equal but opposite
effect on the above currencies to the amounts shown above, on the basis that all other variables remain constant.
(d) Interest Rate Risk
In managing interest rate risk, the Company aims to reduce the impact of short-term fluctuations in earnings. Dividend pay-out practices seek a balance between giving good returns to shareholders on one hand and maintaining a solid debt/equity ratio on the other hand. Carrying Amount
2012 2011
N’000 N’000
Fixed rate instruments
Financial liabilities 8% 8%
Variable rate instruments Financial liabilities - -
The Group does not account for any fixed rate financial assets and liabilities at fair value through profit or loss. Therefore a change in interest rates at the end of the reporting period would not affect profit or loss.
Fair value sensitivity analysis for fixed rate instruments
The Group and Company does not account for any fixed financial assets and liabilities at fair value through profit or
loss. Therefore a change in interest rates at the reporting date would not affect profit or loss.
Cash flow sensitivity analysis for variable rate instruments
The Group does not have any variable rate financial assets and liabilities as at the end of the year (2011: Nil).
Page 98 2012 ANNUALREPORT & ACCOUNTS
(e) Operational risk
Operational risk is the risk of direct or indirect loss arising from a wide variety of causes associated with the Group
and Company’s processes, personnel, technology and infrastructure, and from external factors other than credit,
market and liquidity risks such as those arising from legal and regulatory requirements and generally accepted
standards of corporate behaviour. Operational risks arise from all of the Group and Company’s operations.
The Group and Company’s objective is to manage operational risk so as to balance the avoidance of financial
losses and damage to the Group and Company’s reputation with overall cost effectiveness and to avoid control
procedures that restrict initiative and creativity.
The primary responsibility for the development and implementation of controls to address operational risk is
assigned to management and the executive committee. This responsibility is supported by the development of
overall Group and Company’s standards for the management of operational risk in the following areas:
• documentation of processes, controls and procedures
• periodic assessment of operational risks faced, and the adequacy of controls and procedures to address the risks identified by the risk management committee
• training and professional development of employees
• appropriate segregation of duties, including the independent authorization of transactions
• monitoring of compliance with regulatory and other legal requirements
• requirements for reporting of operational losses and proposed remedial action
• development of contingency plans for various actions
• reconciliation and monitoring of transactions
• development, communication and monitoring of ethical and acceptable business practices
• risk mitigation, including insurance when this is effective.
• monitoring of business process performance and development and implementation of improvement mecha-nisms thereof
Compliance with the Group and Company’s standards, established procedures and controls is supported by
periodic reviews undertaken by Internal Audit. The results of Internal Audit reviews are discussed with management
to which they relate, with summaries submitted to the Audit Committee and senior management of the Company
at management meetings.
(f) Capital management
The Board’s policy is to maintain a strong capital base so as to maintain investor, creditor and market confidence
and to sustain future development of the business. Management monitors the return on capital, which the
Company defines as the result from operating activities divided by total shareholders’ equity. Management also
monitors the level of dividends to all shareholders.
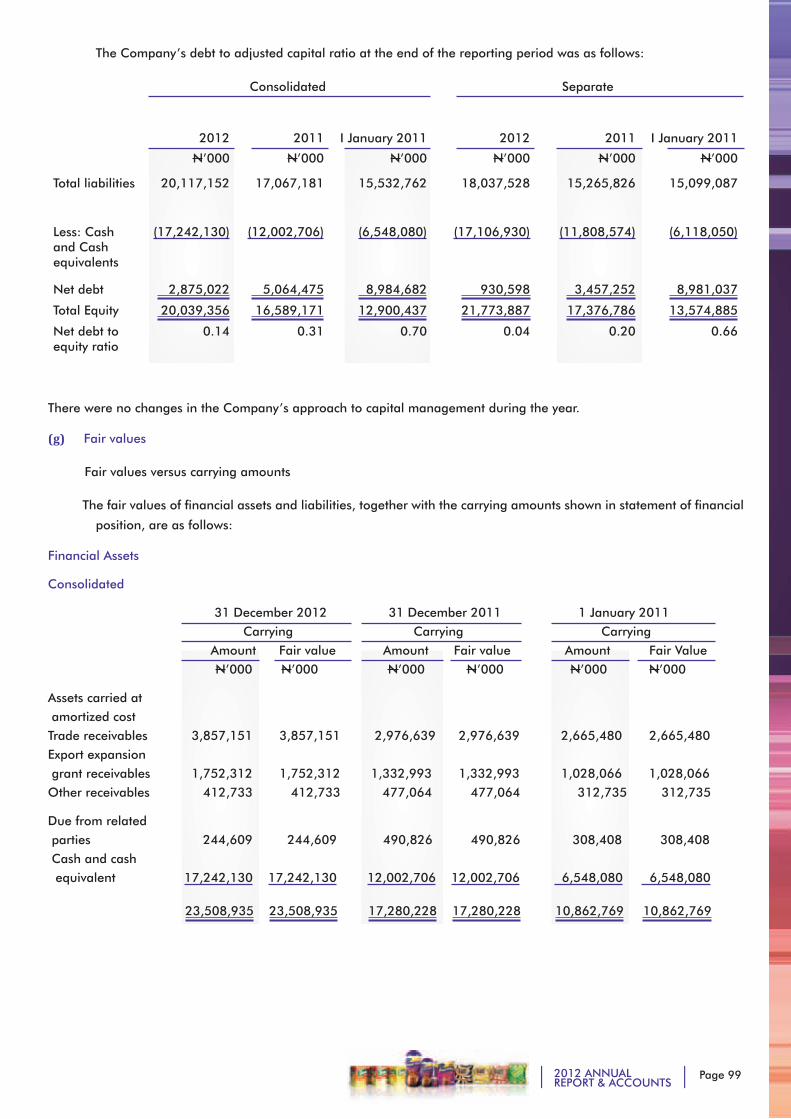
Page 992012 ANNUALREPORT & ACCOUNTS
The Company’s debt to adjusted capital ratio at the end of the reporting period was as follows:
Consolidated Separate
2012 2011 I January 2011 2012 2011 I January 2011
N’000 N’000 N’000 N’000 N’000 N’000
Total liabilities 20,117,152 17,067,181
15,532,762
18,037,528 15,265,826 15,099,087
Less: Cash and Cash equivalents
(17,242,130) (12,002,706) (6,548,080) (17,106,930) (11,808,574) (6,118,050)
Net debt 2,875,022 5,064,475 8,984,682 930,598 3,457,252 8,981,037
Total Equity 20,039,356 16,589,171 12,900,437 21,773,887 17,376,786 13,574,885
Net debt to equity ratio
0.14 0.31 0.70 0.04 0.20 0.66
There were no changes in the Company’s approach to capital management during the year.
(g) Fair values
Fair values versus carrying amounts
The fair values of financial assets and liabilities, together with the carrying amounts shown in statement of financial
position, are as follows:
Financial Assets
Consolidated
31 December 2012 31 December 2011 1 January 2011 Carrying Carrying Carrying Amount Fair value Amount Fair value Amount Fair Value N’000 N’000 N’000 N’000 N’000 N’000
Assets carried at amortized cost Trade receivables 3,857,151 3,857,151 2,976,639 2,976,639 2,665,480 2,665,480Export expansion grant receivables 1,752,312 1,752,312 1,332,993 1,332,993 1,028,066 1,028,066Other receivables 412,733 412,733 477,064 477,064 312,735 312,735
Due from related parties 244,609 244,609 490,826 490,826 308,408 308,408 Cash and cash equivalent 17,242,130 17,242,130 12,002,706 12,002,706 6,548,080 6,548,080
23,508,935 23,508,935 17,280,228 17,280,228 10,862,769 10,862,769
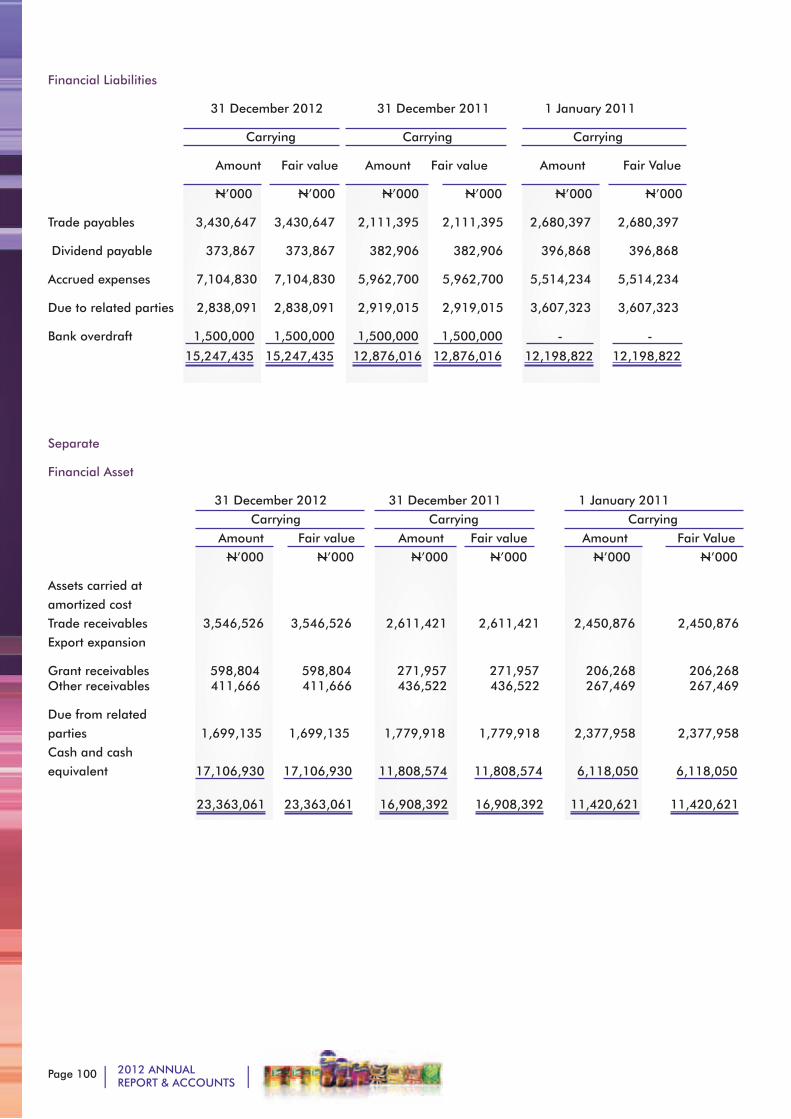
Page 100 2012 ANNUALREPORT & ACCOUNTS
Financial Liabilities
31 December 2012 31 December 2011 1 January 2011
Carrying Carrying Carrying
Amount Fair value Amount Fair value Amount Fair Value
N’000 N’000 N’000 N’000 N’000 N’000
Trade payables 3,430,647 3,430,647 2,111,395 2,111,395 2,680,397 2,680,397
Dividend payable 373,867 373,867 382,906 382,906 396,868 396,868
Accrued expenses 7,104,830 7,104,830 5,962,700 5,962,700 5,514,234 5,514,234
Due to related parties 2,838,091 2,838,091 2,919,015 2,919,015 3,607,323 3,607,323
Bank overdraft 1,500,000 1,500,000 1,500,000 1,500,000 - -
15,247,435 15,247,435 12,876,016 12,876,016 12,198,822 12,198,822
Separate
Financial Asset
31 December 2012 31 December 2011 1 January 2011 Carrying Carrying Carrying Amount Fair value Amount Fair value Amount Fair Value N’000 N’000 N’000 N’000 N’000 N’000
Assets carried atamortized cost Trade receivables 3,546,526 3,546,526 2,611,421 2,611,421 2,450,876 2,450,876Export expansion
Grant receivables 598,804 598,804 271,957 271,957 206,268 206,268 Other receivables 411,666 411,666 436,522 436,522 267,469 267,469
Due from relatedparties 1,699,135 1,699,135 1,779,918 1,779,918 2,377,958 2,377,958Cash and cashequivalent 17,106,930 17,106,930 11,808,574 11,808,574 6,118,050 6,118,050
23,363,061 23,363,061 16,908,392 16,908,392 11,420,621 11,420,621
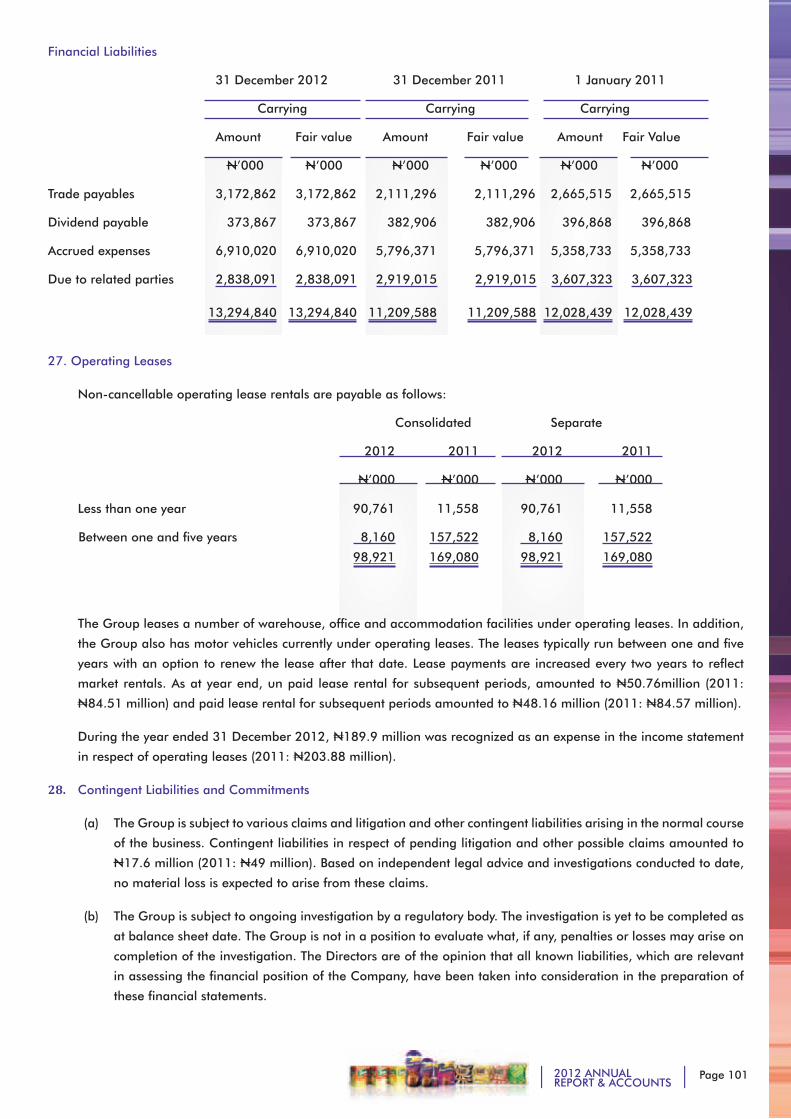
Page 1012012 ANNUALREPORT & ACCOUNTS
Financial Liabilities
31 December 2012 31 December 2011 1 January 2011
Carrying Carrying Carrying
Amount Fair value Amount Fair value Amount Fair Value
N’000 N’000 N’000 N’000 N’000 N’000
Trade payables 3,172,862 3,172,862 2,111,296 2,111,296 2,665,515 2,665,515
Dividend payable 373,867 373,867 382,906 382,906 396,868 396,868
Accrued expenses 6,910,020 6,910,020 5,796,371 5,796,371 5,358,733 5,358,733
Due to related parties 2,838,091 2,838,091 2,919,015 2,919,015 3,607,323 3,607,323
13,294,840 13,294,840 11,209,588 11,209,588 12,028,439 12,028,439
27. Operating Leases
Non-cancellable operating lease rentals are payable as follows:
Consolidated Separate
2012 2011 2012 2011
N’000 N’000 N’000 N’000
Less than one year 90,761 11,558 90,761 11,558
Between one and five years 8,160 157,522 8,160 157,522
98,921 169,080 98,921 169,080
The Group leases a number of warehouse, office and accommodation facilities under operating leases. In addition,
the Group also has motor vehicles currently under operating leases. The leases typically run between one and five
years with an option to renew the lease after that date. Lease payments are increased every two years to reflect
market rentals. As at year end, un paid lease rental for subsequent periods, amounted to N50.76million (2011:
N84.51 million) and paid lease rental for subsequent periods amounted to N48.16 million (2011: N84.57 million).
During the year ended 31 December 2012, N189.9 million was recognized as an expense in the income statement
in respect of operating leases (2011: N203.88 million).
28. Contingent Liabilities and Commitments
(a) The Group is subject to various claims and litigation and other contingent liabilities arising in the normal course
of the business. Contingent liabilities in respect of pending litigation and other possible claims amounted to
N17.6 million (2011: N49 million). Based on independent legal advice and investigations conducted to date,
no material loss is expected to arise from these claims.
(b) The Group is subject to ongoing investigation by a regulatory body. The investigation is yet to be completed as
at balance sheet date. The Group is not in a position to evaluate what, if any, penalties or losses may arise on
completion of the investigation. The Directors are of the opinion that all known liabilities, which are relevant
in assessing the financial position of the Company, have been taken into consideration in the preparation of
these financial statements.
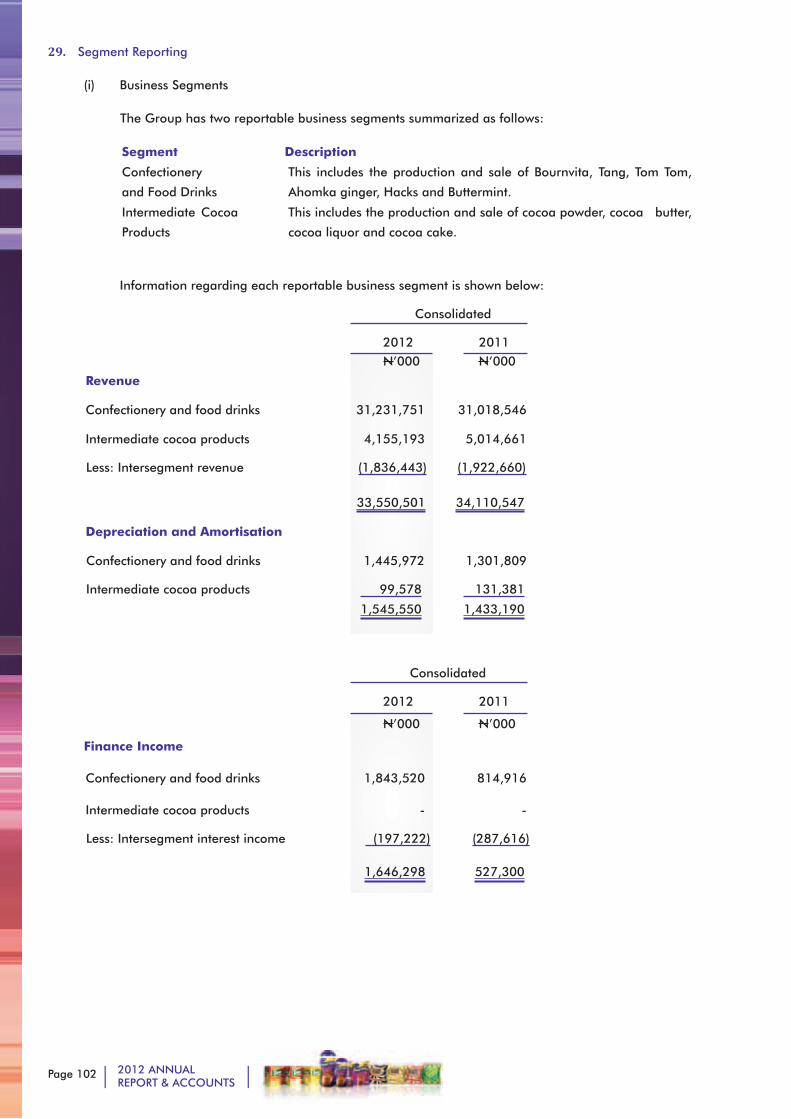
Page 102 2012 ANNUALREPORT & ACCOUNTS
29. Segment Reporting
(i) Business Segments
The Group has two reportable business segments summarized as follows:
Segment Description
Confectionery
and Food Drinks
This includes the production and sale of Bournvita, Tang, Tom Tom,
Ahomka ginger, Hacks and Buttermint.
Intermediate Cocoa
Products
This includes the production and sale of cocoa powder, cocoa butter,
cocoa liquor and cocoa cake.
Information regarding each reportable business segment is shown below:
Consolidated
2012 2011 N’000 N’000
Revenue
Confectionery and food drinks 31,231,751 31,018,546
Intermediate cocoa products 4,155,193 5,014,661
Less: Intersegment revenue (1,836,443) (1,922,660)
33,550,501 34,110,547
Depreciation and Amortisation
Confectionery and food drinks 1,445,972 1,301,809
Intermediate cocoa products 99,578 131,381
1,545,550 1,433,190
Consolidated
2012 2011
N’000 N’000
Finance Income
Confectionery and food drinks 1,843,520 814,916
Intermediate cocoa products - -
Less: Intersegment interest income (197,222) (287,616)
1,646,298 527,300
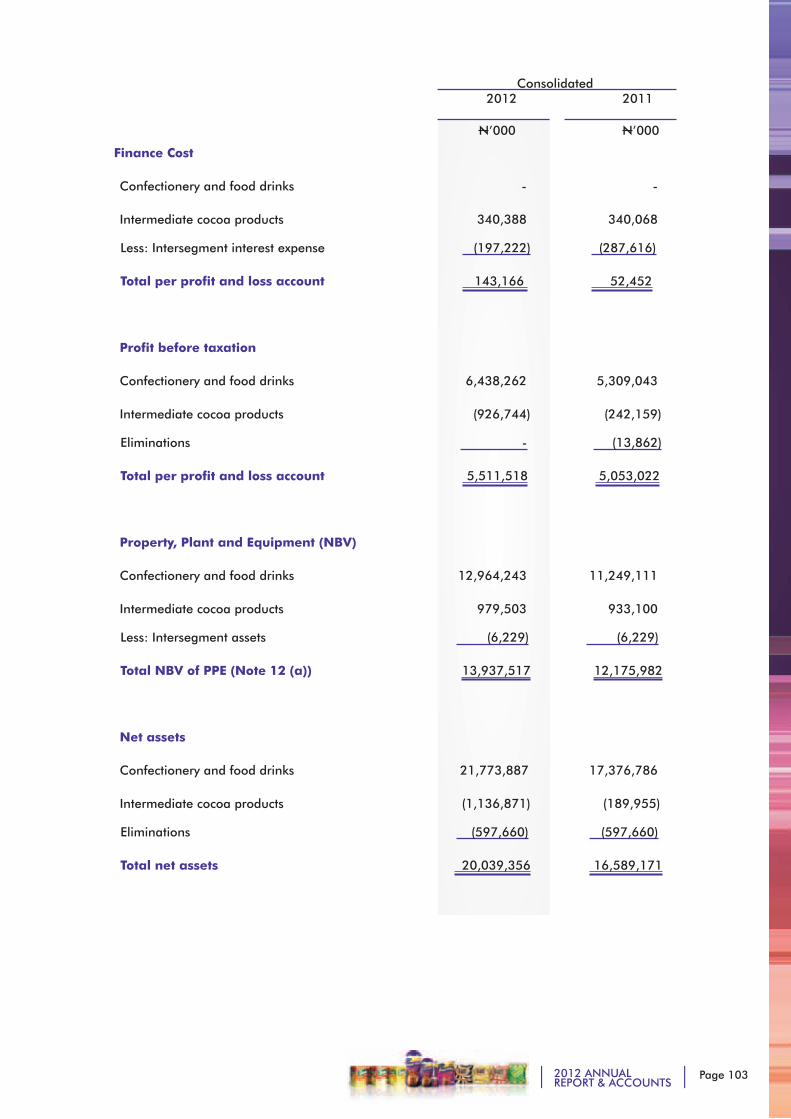
Page 1032012 ANNUALREPORT & ACCOUNTS
Consolidated 2012 2011
N’000 N’000
Finance Cost
Confectionery and food drinks - -
Intermediate cocoa products 340,388 340,068
Less: Intersegment interest expense (197,222) (287,616)
Total per profit and loss account 143,166 52,452
Profit before taxation
Confectionery and food drinks 6,438,262 5,309,043
Intermediate cocoa products (926,744) (242,159)
Eliminations - (13,862)
Total per profit and loss account 5,511,518 5,053,022
Property, Plant and Equipment (NBV)
Confectionery and food drinks 12,964,243 11,249,111
Intermediate cocoa products 979,503 933,100
Less: Intersegment assets (6,229) (6,229)
Total NBV of PPE (Note 12 (a)) 13,937,517 12,175,982
Net assets
Confectionery and food drinks 21,773,887 17,376,786
Intermediate cocoa products (1,136,871) (189,955)
Eliminations (597,660) (597,660)
Total net assets 20,039,356 16,589,171
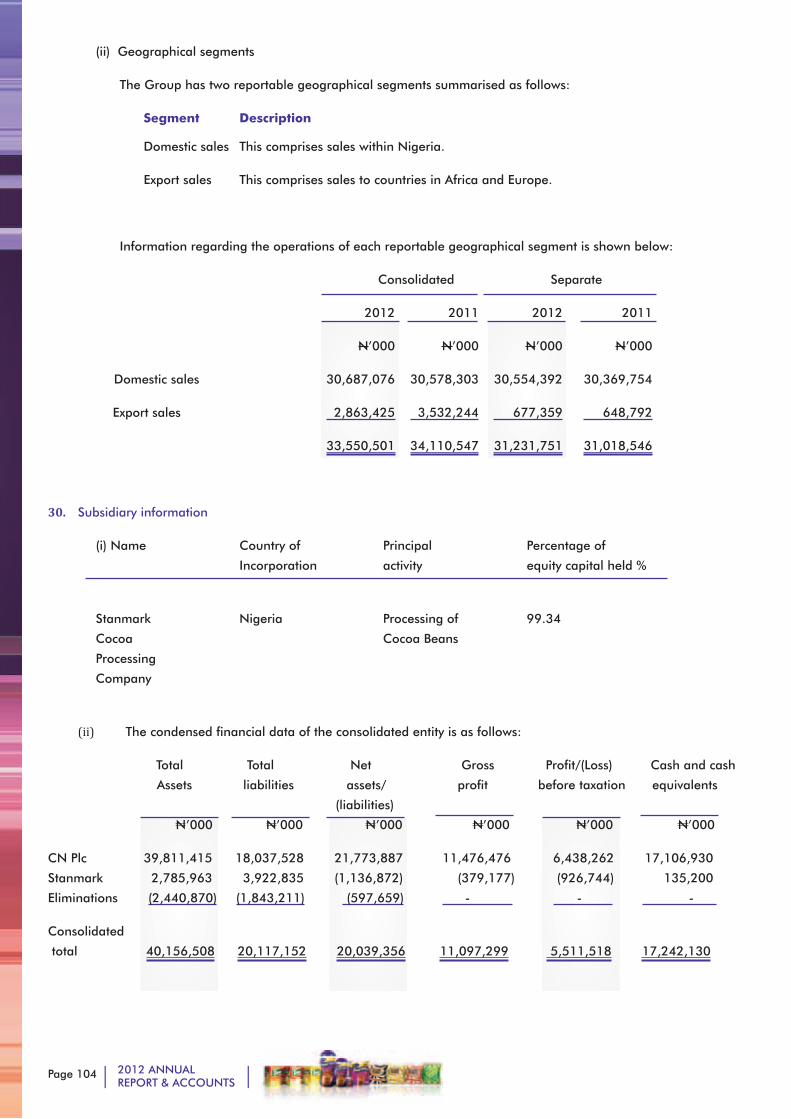
Page 104 2012 ANNUALREPORT & ACCOUNTS
(ii) Geographical segments
The Group has two reportable geographical segments summarised as follows:
Segment Description
Domestic sales This comprises sales within Nigeria.
Export sales This comprises sales to countries in Africa and Europe.
Information regarding the operations of each reportable geographical segment is shown below:
Consolidated Separate
2012 2011 2012 2011
N’000 N’000 N’000 N’000
Domestic sales 30,687,076 30,578,303 30,554,392 30,369,754
Export sales 2,863,425 3,532,244 677,359 648,792
33,550,501 34,110,547 31,231,751 31,018,546
30. Subsidiary information
(i) Name Country of Principal Percentage of
Incorporation activity equity capital held %
Stanmark Nigeria Processing of 99.34
Cocoa Cocoa Beans
Processing
Company
(ii) The condensed financial data of the consolidated entity is as follows:
Total Total Net Gross Profit/(Loss) Cash and cash
Assets liabilities assets/ profit before taxation equivalents
(liabilities)
N’000 N’000 N’000 N’000 N’000 N’000
CN Plc 39,811,415 18,037,528 21,773,887 11,476,476 6,438,262 17,106,930
Stanmark 2,785,963 3,922,835 (1,136,872) (379,177) (926,744) 135,200
Eliminations (2,440,870) (1,843,211) (597,659) - - -
Consolidated
total 40,156,508 20,117,152 20,039,356 11,097,299 5,511,518 17,242,130
Page 1052012 ANNUALREPORT & ACCOUNTS
31. Subsequent events
On 6 December 2012, Cadbury Nigeria Plc obtained the Security and Exchange Commission (SEC) approval in
principle to merge with Stanmark Cocoa Processing Company. The merger was approved by the shareholders of both
Companies in court ordered meetings held simultaneously on 30 January 2013. There are no other post balance
sheet events which could have a material effect on the financial position of the Group and Company respectively, as
at 31 December 2012 and the results for the year then ended, which have not been adequately provided for.
32. Explanation of transition to IFRSs
As stated in note (3a), these are the Group’s first consolidated financial statements prepared in accordance with
IFRSs.
The accounting policies set out in note 3 have been applied in preparing the financial statements for the year ended
31 December 2012, the comparative information presented in these financial statements for the year ended 31
December 2011 and in the preparation of an opening IFRS statement of financial position at 1 January 2011 (the
Group’s date of transition). In preparing its opening IFRS statement of financial position, the Group has adjusted
amounts reported previously in financial statements prepared in accordance with the Statements of Accounting
Standards of Nigeria (previous GAAP). An explanation of how the transition from previous GAAP to IFRSs has affected
the Group’s financial position, financial performance and cash flows is set out in the following tables and the notes
that accompany the tables.
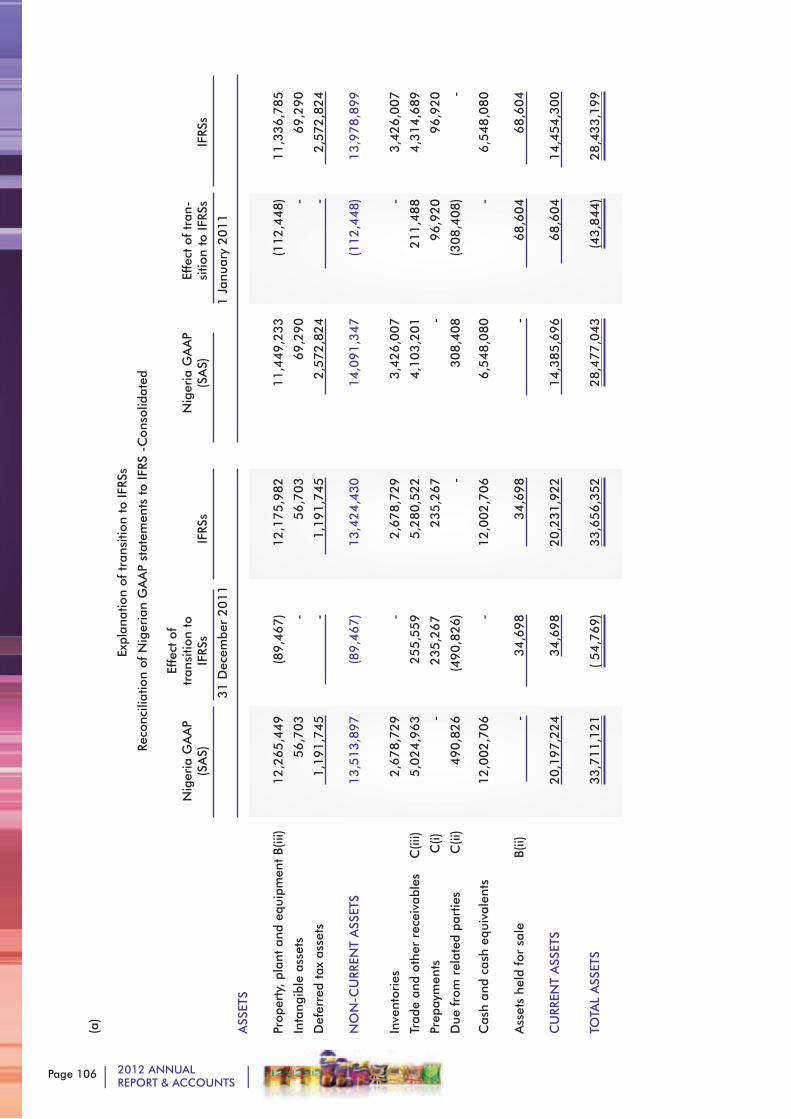
Page 106 2012 ANNUALREPORT & ACCOUNTS
(a)
Expl
anat
ion
of t
rans
ition
to
IFRS
s
Rec
onci
liatio
n of
Nig
eria
n G
AA
P st
atem
ents
to
IFRS
-C
onso
lidat
ed
Nig
eria
GA
AP
(SA
S)
Effe
ct o
f tr
ansi
tion
to
IFRS
sIF
RSs
Nig
eria
GA
AP
(SA
S)
Effe
ct o
f tr
an-
sitio
n to
IFRS
sIF
RSs
31
Dec
embe
r 2
01
11 J
anua
ry 2
011
ASS
ETS
Prop
erty
, pl
ant
and
equi
pmen
t B(
iii)
1
2,2
65
,44
9
(8
9,4
67
)
12
,17
5,9
82
11,4
49,2
33
(112,4
48)
11,3
36,7
85
Inta
ngib
le a
sset
s 5
6,7
03
-
5
6,7
03
69,2
90
-
69,2
90
Def
erre
d ta
x as
sets
1
,19
1,7
45
-
1
,19
1,7
45
2,5
72,8
24
-
2,5
72,8
24
NO
N-C
URR
ENT
ASS
ETS
1
3,5
13
,89
7
(8
9,4
67
)
13
,42
4,4
30
14,0
91,3
47
(1
12,4
48)
1
3,9
78,8
99
Inve
ntor
ies
2,6
78
,72
9
-
2,6
78
,72
9
3,4
26,0
07
-
3,4
26,0
07
Trad
e an
d ot
her
rece
ivab
les
C
(iii)
5,0
24
,96
32
55
,55
95
,28
0,5
22
4,1
03,2
01
211,4
88
4,3
14,6
89
Prep
aym
ents
C
(i)-
2
35
,26
72
35
,26
7
-
96,9
20
96,9
20
Due
fro
m r
elat
ed p
artie
s
C
(ii)
Cas
h an
d ca
sh e
quiv
alen
ts
4
90
,82
6
12
,00
2,7
06
(49
0,8
26
) -
-
12
,00
2,7
06
308,4
08
6,5
48,0
80
(3
08
,40
8) -
-
6,5
48,0
80
Ass
ets
held
for
sal
e
B(
ii)
-
3
4,6
98
3
4,6
98
-
68,6
04
68,6
04
CU
RREN
T A
SSET
S20
,19
7,2
24
34,6
98
20
,23
1,9
22
14,3
85,6
96
68,6
04
14,4
54,3
00
TOTA
L A
SSET
S
33
,71
1,1
21
( 5
4,7
69
)
33
,65
6,3
52
28,4
77,0
43
(43,8
44)
28,4
33,1
99
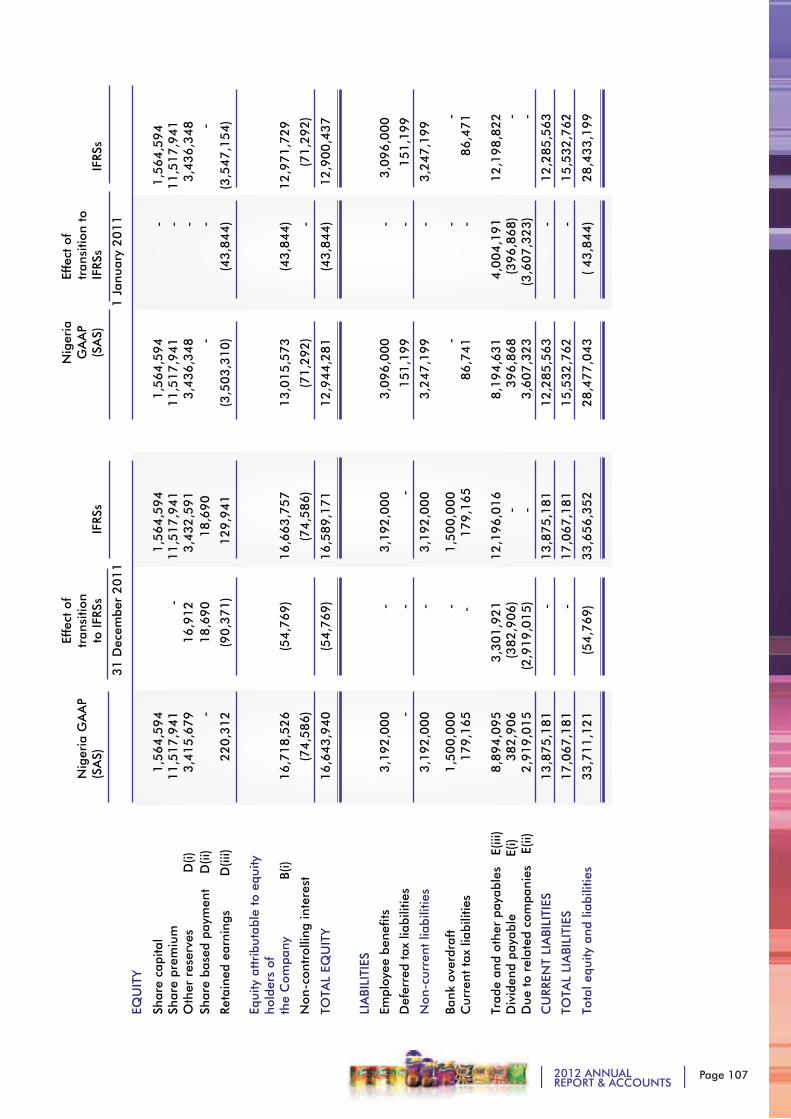
Page 1072012 ANNUALREPORT & ACCOUNTS
N
iger
ia G
AA
P (S
AS)
Effe
ct o
f tr
ansi
tion
to IF
RSs
IF
RSs
Nig
eria
G
AA
P (S
AS)
Effe
ct o
f tr
ansi
tion
to
IFRS
s
IFRS
s
3
1 D
ecem
ber
20
11
1 J
anua
ry 2
01
1
EQU
ITY
Shar
e ca
pita
l
1,5
64
,59
4
-
1,5
64
,59
4
1,5
64
,59
4
-
1
,56
4,5
94
Shar
e pr
emiu
m
Oth
er r
eser
ves
D
(i)
11
,51
7,9
41
3,4
15
,67
9
-
16
,91
2
11
,51
7,9
41
3,4
32
,59
1
11
,51
7,9
41
3
,43
6,3
48
-
-
11
,51
7,9
41
3,4
36
,34
8
Sh
are
base
d pa
ymen
t
D(ii
) -
18
,69
0
18
,69
0
-
-
-
Re
tain
ed e
arni
ngs
D(ii
i)
2
20
,31
2
(
90
,37
1)
1
29
,94
1
(3
,50
3,3
10
)
(
43
,84
4)
(3
,54
7,1
54
)
Equi
ty a
ttri
buta
ble
to e
quity
ho
lder
s of
th
e C
ompa
ny
B(i)
16
,71
8,5
26
(54
,76
9)
1
6,6
63
,75
7
13
,01
5,5
73
(
43
,84
4)
1
2,9
71
,72
9
Non
-con
trol
ling
inte
rest
(7
4,5
86
)
(7
4,5
86
)
(7
1,2
92
)
-
(7
1,2
92
)
TOTA
L EQ
UIT
Y
1
6,6
43
,94
0
(5
4,7
69
)
16
,58
9,1
71
1
2,9
44
,28
1
(4
3,8
44
)
12
,90
0,4
37
LI
ABI
LITI
ES
Empl
oyee
ben
efits
3,1
92
,00
0
-
3,1
92
,00
0
3,0
96
,00
0
-
3,0
96
,00
0
D
efer
red
tax
liabi
litie
s
-
-
-
15
1,1
99
-
1
51
,19
9
N
on-c
urre
nt li
abili
ties
3,1
92
,00
0
-
3,1
92
,00
0
3
,24
7,1
99
-
3,2
47
,19
9
Bank
ove
rdra
ft
Cur
rent
tax
liab
ilitie
s
1,5
00
,00
0
17
9,1
65
-
-
1
,50
0,0
00
17
9,1
65
-
86
,74
1
-
-
-
86
,47
1
Trad
e an
d ot
her
paya
bles
E
(iii)
Div
iden
d pa
yabl
e
E(i)
Due
to
rela
ted
com
pani
es
E(ii
)
8,8
94
,09
5
38
2,9
06
2
,91
9,0
15
3,3
01
,92
1
(38
2,9
06
)
(2
,91
9,0
15
)
12
,19
6,0
16
- -
8,1
94
,63
1
39
6,8
68
3
,60
7,3
23
4,0
04
,19
1
(39
6,8
68
) (
3,6
07
,32
3)
1
2,1
98
,82
2 - -
CU
RREN
T LI
ABI
LITI
ES
1
3,8
75
,18
1
-
1
3,8
75
,18
1
12
,28
5,5
63
-
12
,28
5,5
63
TOTA
L LI
ABI
LITI
ES
1
7,0
67
,18
1
-
1
7,0
67
,18
1
15
,53
2,7
62
-
15
,53
2,7
62
Tota
l equ
ity a
nd li
abili
ties
3
3,7
11
,12
1
(5
4,7
69
)
3
3,6
56
,35
2
28
,47
7,0
43
(
43
,84
4)
2
8,4
33
,19
9
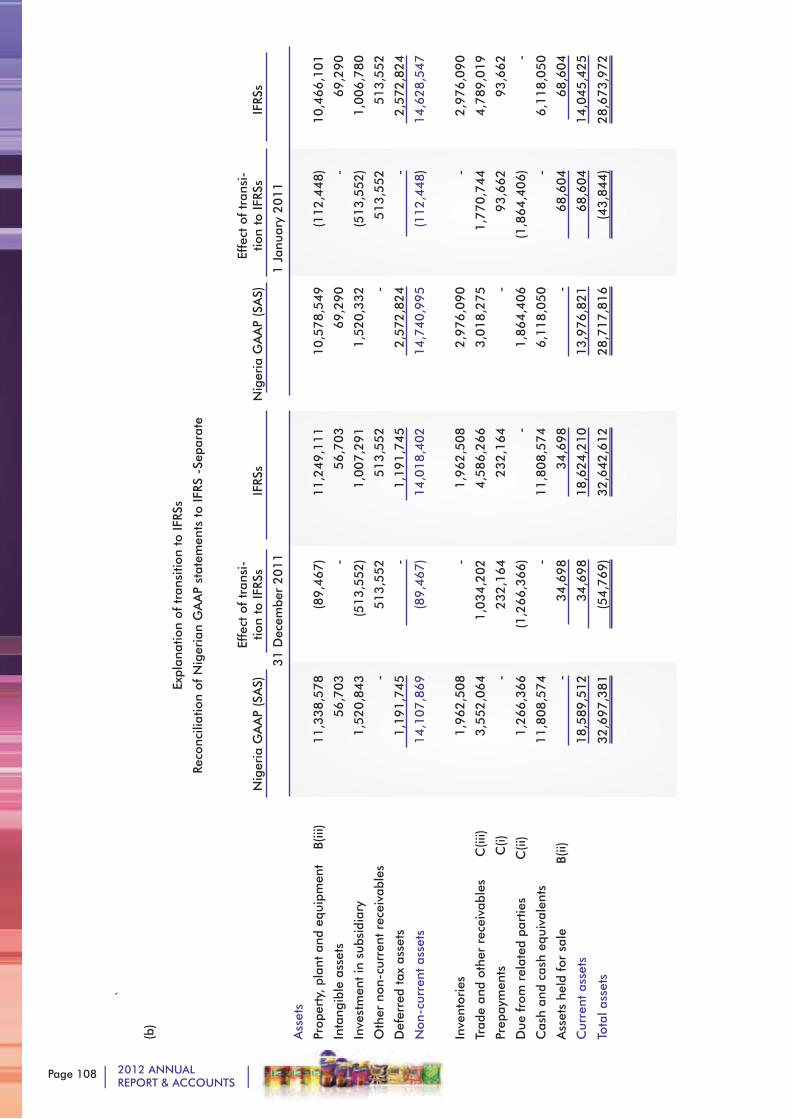
Page 108 2012 ANNUALREPORT & ACCOUNTS
`
(b)
Expl
anat
ion
of t
rans
ition
to
IFRS
s
Reco
ncili
atio
n of
Nig
eria
n G
AA
P st
atem
ents
to
IFRS
-Se
para
te
Nig
eria
GA
AP
(SA
S)
Effe
ct o
f tr
ansi
-tio
n to
IFRS
sIF
RSs
Nig
eria
GA
AP
(SA
S)
Effe
ct o
f tr
ansi
-tio
n to
IFRS
sIF
RSs
31
Dec
embe
r 2
01
11 J
anua
ry 2
011
Ass
ets
Prop
erty
, pl
ant
and
equi
pmen
t
B(ii
i)1
1,3
38
,57
8
(8
9,4
67
) 1
1,2
49
,111
10,5
78,5
49
(1
12,4
48)
1
0,4
66,1
01
Inta
ngib
le a
sset
s 5
6,7
03
-
5
6,7
03
6
9,2
90
-
6
9,2
90
Inve
stm
ent
in s
ubsi
diar
y
1
,52
0,8
43
(
51
3,5
52
) 1
,00
7,2
91
1
,520,3
32
(513,5
52)
1
,006,7
80
Oth
er n
on-c
urre
nt r
ecei
vabl
es -
5
13
,55
2 5
13
,55
2
-
513,5
52
513,5
52
Def
erre
d ta
x as
sets
1
,19
1,7
45
-
1
,19
1,7
45
2
,572,8
24
-
2,5
72,8
24
Non
-cur
rent
ass
ets
1
4,1
07
,86
9
(8
9,4
67
) 1
4,0
18
,40
2
1
4,7
40,9
95
(112,4
48)
14,6
28,5
47
Inve
ntor
ies
1
,96
2,5
08
-
1
,96
2,5
08
2
,976,0
90
-
2,9
76,0
90
Trad
e an
d ot
her
rece
ivab
les
C(ii
i) 3
,55
2,0
64
1,0
34
,20
2
4
,58
6,2
66
3
,018,2
75
1,7
70,7
44
4,7
89,0
19
Prep
aym
ents
C(i)
-
2
32
,16
4
23
2,1
64
-
93,6
62
93,6
62
Due
fro
m r
elat
ed p
artie
s
C
(ii)
1,2
66
,36
6
(1,2
66
,36
6)
-
1,8
64,4
06
(1,8
64,4
06)
-
Cas
h an
d ca
sh e
quiv
alen
ts1
1,8
08
,57
4
-
1
1,8
08
,574
6
,118,0
50
-
6,1
18,0
50
Ass
ets
held
for
sal
e
B(
ii) -
3
4,6
98
3
4,6
98
-
6
8,6
04
6
8,6
04
Cur
rent
ass
ets
1
8,5
89
,51
2
3
4,6
98
1
8,6
24
,21
0
13,9
76,8
21
68,6
04
1
4,0
45,4
25
Tota
l ass
ets
3
2,6
97
,38
1
(5
4,7
69
) 3
2,6
42
,612
28,7
17,8
16
(4
3,8
44)
28,6
73,9
72
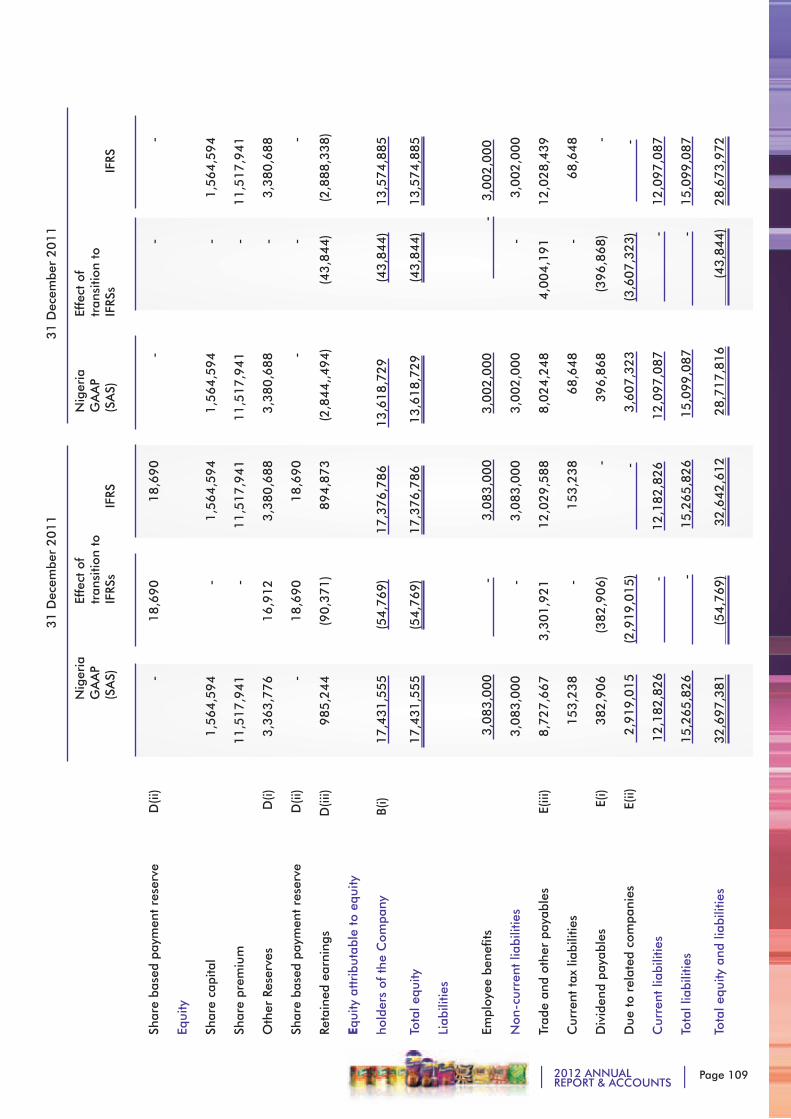
Page 1092012 ANNUALREPORT & ACCOUNTS
3
1 D
ecem
ber
20
11
31 D
ecem
ber
2011
N
iger
ia
Effe
ct o
f
N
iger
ia
Effe
ct o
f
GA
AP
tr
ansi
tion
to
GA
AP
tr
ansi
tion
to
(S
AS)
IFRS
s
IFRS
(SA
S)
IF
RSs
IFRS
Shar
e ba
sed
paym
ent
rese
rve
D(ii
) -
18
,69
0
18
,69
0
- -
-
Equi
ty
Shar
e ca
pita
l
1,5
64
,59
4
- 1
,56
4,5
94
1,5
64,5
94
- 1,5
64,5
94
Shar
e pr
emiu
m
1
1,5
17
,94
1
- 1
1,5
17
,94
1
11,5
17,9
41
- 11,5
17,9
41
Oth
er R
eser
ves
D(i)
3
,36
3,7
76
1
6,9
12
3
,38
0,6
88
3,3
80,6
88
- 3,3
80,6
88
Shar
e ba
sed
paym
ent
rese
rve
D(ii
) -
18
,69
0
18
,69
0
- -
-
Reta
ined
ear
ning
s D
(iii)
98
5,2
44
(9
0,3
71
) 8
94
,87
3
(2,8
44,,
494)
(43,8
44)
(2,8
88,3
38)
Equi
ty a
ttri
buta
ble
to e
quity
hold
ers
of t
he C
ompa
ny
B
(i)
1
7,4
31
,55
5 (5
4,7
69
) 1
7,3
76
,78
6
13,6
18,7
29
(43,8
44)
13,5
74,8
85
Tota
l equ
ity
17
,43
1,5
55
(5
4,7
69
) 1
7,3
76
,78
6
13,6
18,7
29
(43,8
44)
13,5
74,8
85
Liab
ilitie
s
Empl
oyee
ben
efits
3,0
83
,00
0 -
3,0
83
,00
0
3,0
02,0
00
-
3,0
02,0
00
Non
-cur
rent
liab
ilitie
s
3,0
83
,00
0
-
3,0
83
,00
0
3,0
02,0
00
- 3
,002,0
00
Trad
e an
d ot
her
paya
bles
E(iii
) 8
,72
7,6
67
3
,30
1,9
21
1
2,0
29
,58
8
8,0
24,2
48
4,0
04,1
91
12,0
28,4
39
Cur
rent
tax
liab
ilitie
s
15
3,2
38
-
1
53
,23
8
68,6
48
-
68,6
48
Div
iden
d pa
yabl
es
E(i)
38
2,9
06
(3
82
,90
6)
-
396,8
68
(396,8
68)
-
Due
to
rela
ted
com
pani
es
E(
ii) 2
,91
9,0
15 (2
,91
9,0
15
) -
3,6
07,3
23
(3
,607,3
23)
-
Cur
rent
liab
ilitie
s
1
2,1
82
,82
6 -
1
2,1
82
,82
6
1
2,0
97,0
87
-
12,0
97,0
87
Tota
l lia
bilit
ies
1
5,2
65
,82
6 -
1
5,2
65
,82
6
1
5,0
99,0
87
-
15,0
99,0
87
Tota
l equ
ity a
nd li
abili
ties
3
2,6
97
,38
1 (
54
,76
9)
3
2,6
42
,61
2
2
8,7
17,8
16
(43,8
44)
28,6
73,9
72
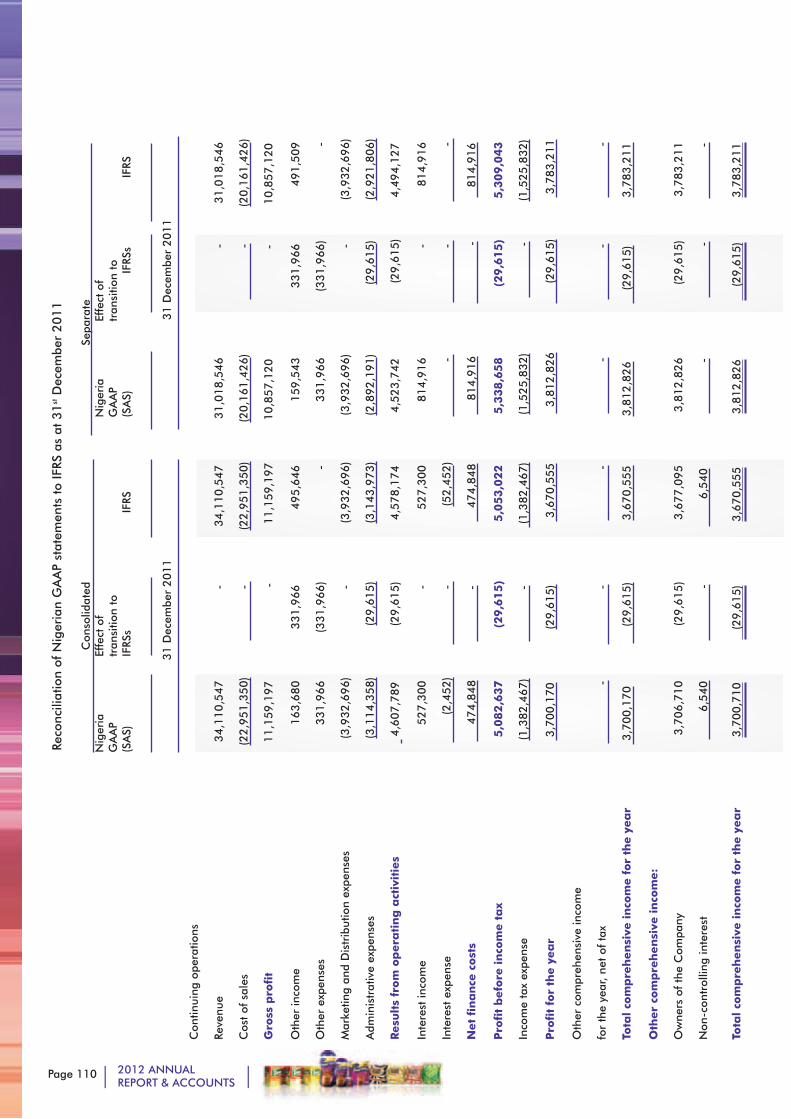
Page 110 2012 ANNUALREPORT & ACCOUNTS
Reco
ncili
atio
n of
Nig
eria
n G
AA
P st
atem
ents
to
IFRS
as
at 3
1st D
ecem
ber
2011
C
onso
lidat
ed
Sep
arat
e
N
iger
ia
Ef
fect
of
Nig
eria
Effe
ct o
f
G
AA
P
tran
sitio
n to
GA
AP
tr
ansi
tion
to
(SA
S)
IF
RSs
IFRS
(SA
S)
IFRS
s
IFRS
3
1 D
ecem
ber
20
11
31 D
ecem
ber
2011
Con
tinui
ng o
pera
tions
Reve
nue
3
4,1
10
,54
7
-
34
,11
0,5
47
31,0
18,5
46
-
31,0
18,5
46
Cos
t of
sal
es
(2
2,9
51
,35
0)
-
(
22
,95
1,3
50
) (2
0,1
61,4
26)
-
(20,1
61,4
26)
Gro
ss p
rofi
t
11
,15
9,1
97
-
1
1,1
59
,19
7
10,8
57,1
20
-
10,8
57,1
20
Oth
er in
com
e
16
3,6
80
3
31
,96
6
49
5,6
46
159,5
43
331,9
66
491,5
09
Oth
er e
xpen
ses
3
31
,96
6
(33
1,9
66
) -
331,9
66
(331,9
66)
-
Mar
ketin
g an
d D
istr
ibut
ion
expe
nses
(3,9
32
,69
6)
- (3
,93
2,6
96
) (3
,932,6
96)
- (3
,932,6
96)
Adm
inis
trat
ive
expe
nses
(3,1
14
,35
8)
(29
,61
5)
(3,1
43
,97
3)
(2,8
92,1
91)
(29,6
15)
(2,9
21,8
06)
Resu
lts
from
op
era
tin
g a
ctiv
itie
s
4,6
07
,78
9
(2
9,6
15
) 4
,57
8,1
74
4,5
23,7
42
(
29,6
15)
4,4
94,1
27
Inte
rest
inco
me
5
27
,30
0
- 5
27
,30
0
814,9
16
- 814,9
16
Inte
rest
exp
ense
(2
,45
2)
-
(
52
,45
2)
-
-
-
Net
fin
an
ce c
ost
s
4
74
,84
8
-
4
74
,84
8
814,9
16
-
8
14,9
16
Pro
fit
befo
re in
com
e t
ax
5,0
82,6
37
(29,6
15)
5,0
53,0
22
5,3
38,6
58
(29,6
15)
5,3
09,0
43
Inco
me
tax
expe
nse
(1
,38
2,4
67
) -
(1
,38
2,4
67
)
(1,5
25,8
32)
-
(1,5
25,8
32)
Pro
fit
for
the y
ea
r
3,7
00
,17
0 (
29
,61
5)
3,6
70
,55
5
3,8
12,8
26
(
29,6
15)
3,7
83,2
11
Oth
er c
ompr
ehen
sive
inco
me
for
the
year
, ne
t of
tax
-
-
-
-
-
-
Tota
l co
mp
reh
en
sive
in
com
e f
or
the y
ea
r
3,7
00
,17
0
(
29
,61
5)
3
,67
0,5
55
3,8
12,8
26
(29,6
15)
3,7
83,2
11
Oth
er
com
pre
hen
sive
in
com
e:
Ow
ners
of
the
Com
pany
3,7
06
,71
0
(29
,61
5)
3,6
77
,09
5
3,8
12,8
26
(29,6
15)
3,7
83,2
11
Non
-con
trol
ling
inte
rest
6
,54
0 -
6
,54
0
-
-
-
Tota
l co
mp
reh
en
sive
in
com
e f
or
the y
ea
r
3
,70
0,7
10
(
29
,61
5) 3
,67
0,5
55
3,8
12,8
26
(2
9,6
15)
3,7
83,2
11
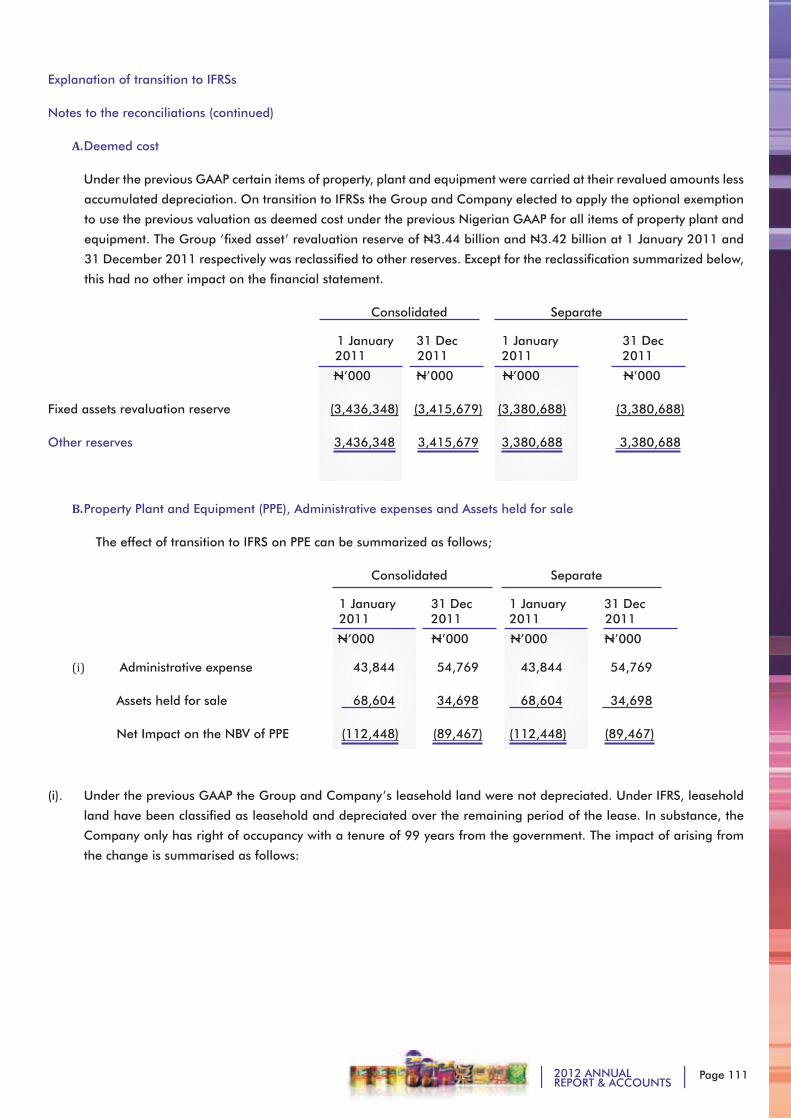
Page 1112012 ANNUALREPORT & ACCOUNTS
Explanation of transition to IFRSs
Notes to the reconciliations (continued)
A. Deemed cost
Under the previous GAAP certain items of property, plant and equipment were carried at their revalued amounts less
accumulated depreciation. On transition to IFRSs the Group and Company elected to apply the optional exemption
to use the previous valuation as deemed cost under the previous Nigerian GAAP for all items of property plant and
equipment. The Group ‘fixed asset’ revaluation reserve of N3.44 billion and N3.42 billion at 1 January 2011 and
31 December 2011 respectively was reclassified to other reserves. Except for the reclassification summarized below,
this had no other impact on the financial statement.
Consolidated Separate
1 January 31 Dec 1 January 31 Dec 2011 2011 2011 2011
N’000 N’000 N’000 N’000
Fixed assets revaluation reserve (3,436,348) (3,415,679) (3,380,688) (3,380,688)
Other reserves 3,436,348 3,415,679 3,380,688 3,380,688
B. Property Plant and Equipment (PPE), Administrative expenses and Assets held for sale
The effect of transition to IFRS on PPE can be summarized as follows;
Consolidated Separate
1 January 31 Dec 1 January 31 Dec 2011 2011 2011 2011
N’000 N’000 N’000 N’000
(i) Administrative expense 43,844 54,769 43,844 54,769
Assets held for sale 68,604 34,698 68,604 34,698
Net Impact on the NBV of PPE (112,448) (89,467) (112,448) (89,467)
(i). Under the previous GAAP the Group and Company’s leasehold land were not depreciated. Under IFRS, leasehold
land have been classified as leasehold and depreciated over the remaining period of the lease. In substance, the
Company only has right of occupancy with a tenure of 99 years from the government. The impact of arising from
the change is summarised as follows:
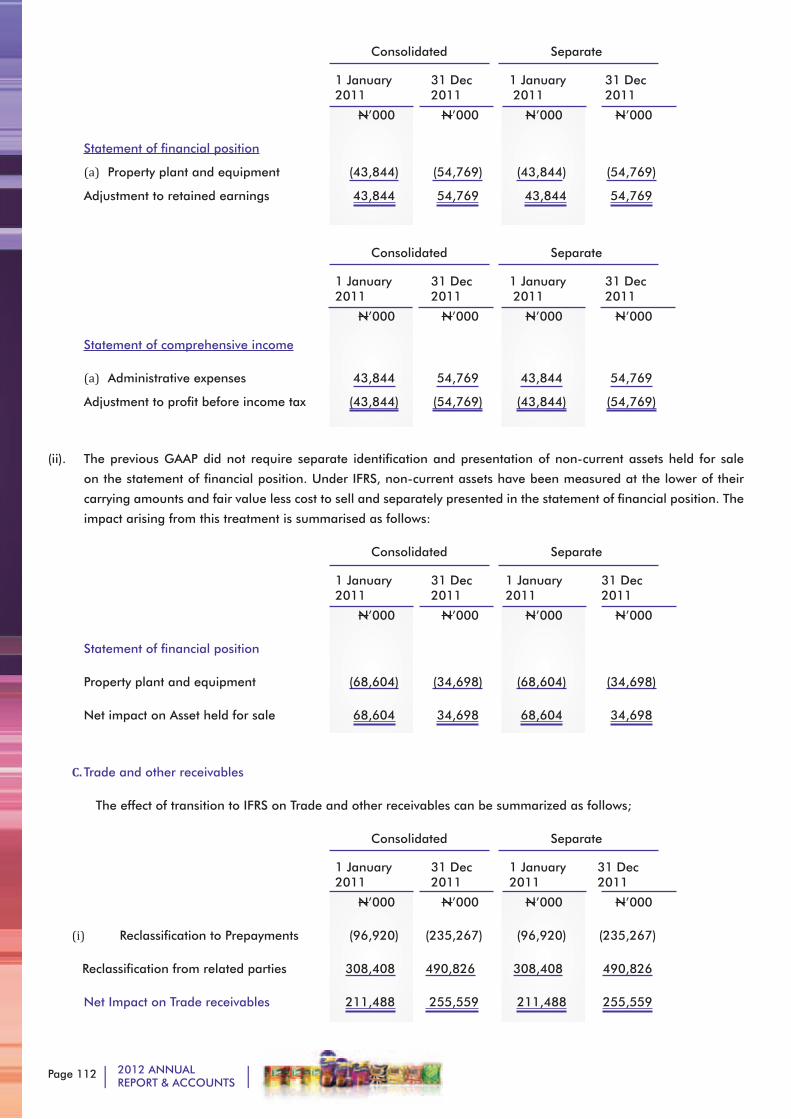
Page 112 2012 ANNUALREPORT & ACCOUNTS
Consolidated Separate
1 January 31 Dec 1 January 31 Dec 2011 2011 2011 2011
N’000 N’000 N’000 N’000
Statement of financial position
(a) Property plant and equipment (43,844) (54,769) (43,844) (54,769)
Adjustment to retained earnings 43,844 54,769 43,844 54,769
Consolidated Separate
1 January 31 Dec 1 January 31 Dec 2011 2011 2011 2011
N’000 N’000 N’000 N’000
Statement of comprehensive income
(a) Administrative expenses 43,844 54,769 43,844 54,769
Adjustment to profit before income tax (43,844) (54,769) (43,844) (54,769)
(ii). The previous GAAP did not require separate identification and presentation of non-current assets held for sale
on the statement of financial position. Under IFRS, non-current assets have been measured at the lower of their
carrying amounts and fair value less cost to sell and separately presented in the statement of financial position. The
impact arising from this treatment is summarised as follows:
Consolidated Separate
1 January 31 Dec 1 January 31 Dec 2011 2011 2011 2011
N’000 N’000 N’000 N’000
Statement of financial position
Property plant and equipment (68,604) (34,698) (68,604) (34,698)
Net impact on Asset held for sale 68,604 34,698 68,604 34,698
C. Trade and other receivables
The effect of transition to IFRS on Trade and other receivables can be summarized as follows;
Consolidated Separate
1 January 31 Dec 1 January 31 Dec 2011 2011 2011 2011
N’000 N’000 N’000 N’000
(i) Reclassification to Prepayments (96,920) (235,267) (96,920) (235,267)
Reclassification from related parties 308,408 490,826 308,408 490,826
Net Impact on Trade receivables 211,488 255,559 211,488 255,559
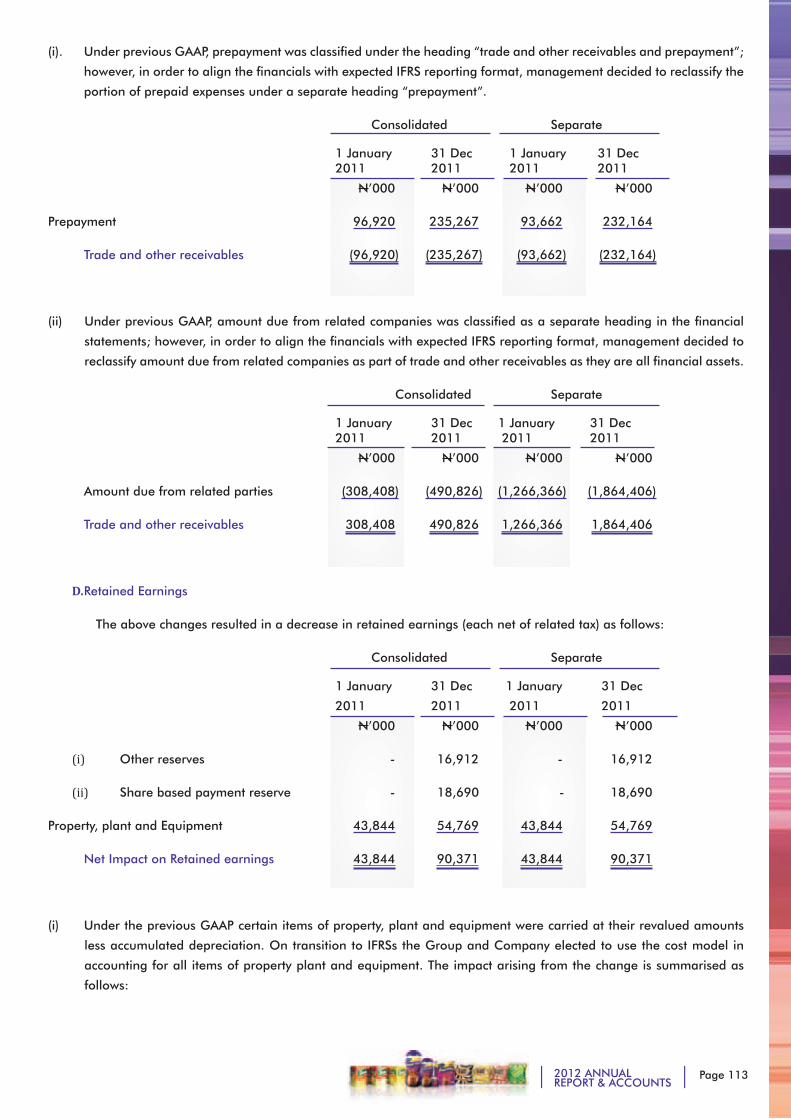
Page 1132012 ANNUALREPORT & ACCOUNTS
(i). Under previous GAAP, prepayment was classified under the heading “trade and other receivables and prepayment”;
however, in order to align the financials with expected IFRS reporting format, management decided to reclassify the
portion of prepaid expenses under a separate heading “prepayment”.
Consolidated Separate
1 January 31 Dec 1 January 31 Dec 2011 2011 2011 2011
N’000 N’000 N’000 N’000
Prepayment 96,920 235,267 93,662 232,164
Trade and other receivables (96,920) (235,267) (93,662) (232,164)
(ii) Under previous GAAP, amount due from related companies was classified as a separate heading in the financial
statements; however, in order to align the financials with expected IFRS reporting format, management decided to
reclassify amount due from related companies as part of trade and other receivables as they are all financial assets.
Consolidated Separate
1 January 31 Dec 1 January 31 Dec 2011 2011 2011 2011
N’000 N’000 N’000 N’000
Amount due from related parties (308,408) (490,826) (1,266,366) (1,864,406)
Trade and other receivables 308,408 490,826 1,266,366 1,864,406
D. Retained Earnings
The above changes resulted in a decrease in retained earnings (each net of related tax) as follows:
Consolidated Separate
1 January 31 Dec 1 January 31 Dec
2011 2011 2011 2011
N’000 N’000 N’000 N’000
(i) Other reserves - 16,912 - 16,912
(ii) Share based payment reserve - 18,690 - 18,690
Property, plant and Equipment 43,844 54,769 43,844 54,769
Net Impact on Retained earnings 43,844 90,371 43,844 90,371
(i) Under the previous GAAP certain items of property, plant and equipment were carried at their revalued amounts
less accumulated depreciation. On transition to IFRSs the Group and Company elected to use the cost model in
accounting for all items of property plant and equipment. The impact arising from the change is summarised as
follows:
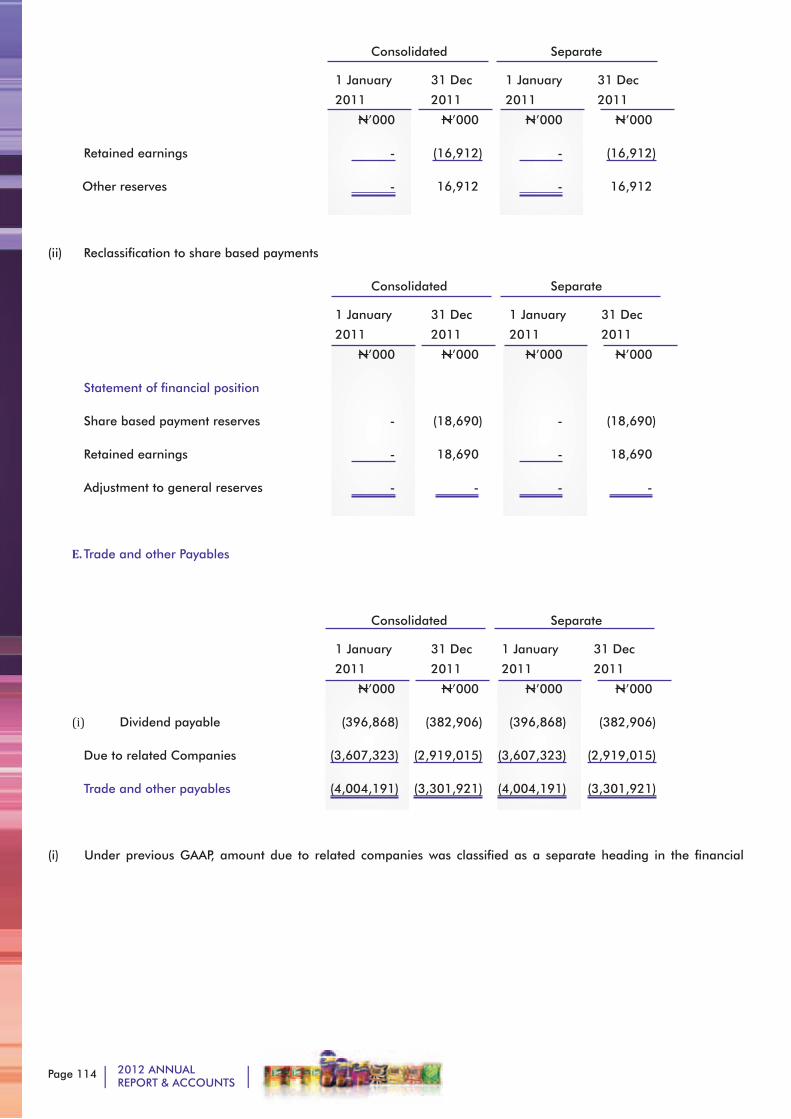
Page 114 2012 ANNUALREPORT & ACCOUNTS
Consolidated Separate
1 January 31 Dec 1 January 31 Dec
2011 2011 2011 2011
N’000 N’000 N’000 N’000
Retained earnings - (16,912) - (16,912)
Other reserves - 16,912 - 16,912
(ii) Reclassification to share based payments
Consolidated Separate
1 January 31 Dec 1 January 31 Dec
2011 2011 2011 2011
N’000 N’000 N’000 N’000
Statement of financial position
Share based payment reserves - (18,690) - (18,690)
Retained earnings - 18,690 - 18,690
Adjustment to general reserves - - - -
E. Trade and other Payables
Consolidated Separate
1 January 31 Dec 1 January 31 Dec
2011 2011 2011 2011
N’000 N’000 N’000 N’000
(i) Dividend payable (396,868) (382,906) (396,868) (382,906)
Due to related Companies (3,607,323) (2,919,015) (3,607,323) (2,919,015)
Trade and other payables (4,004,191) (3,301,921) (4,004,191) (3,301,921)
(i) Under previous GAAP, amount due to related companies was classified as a separate heading in the financial
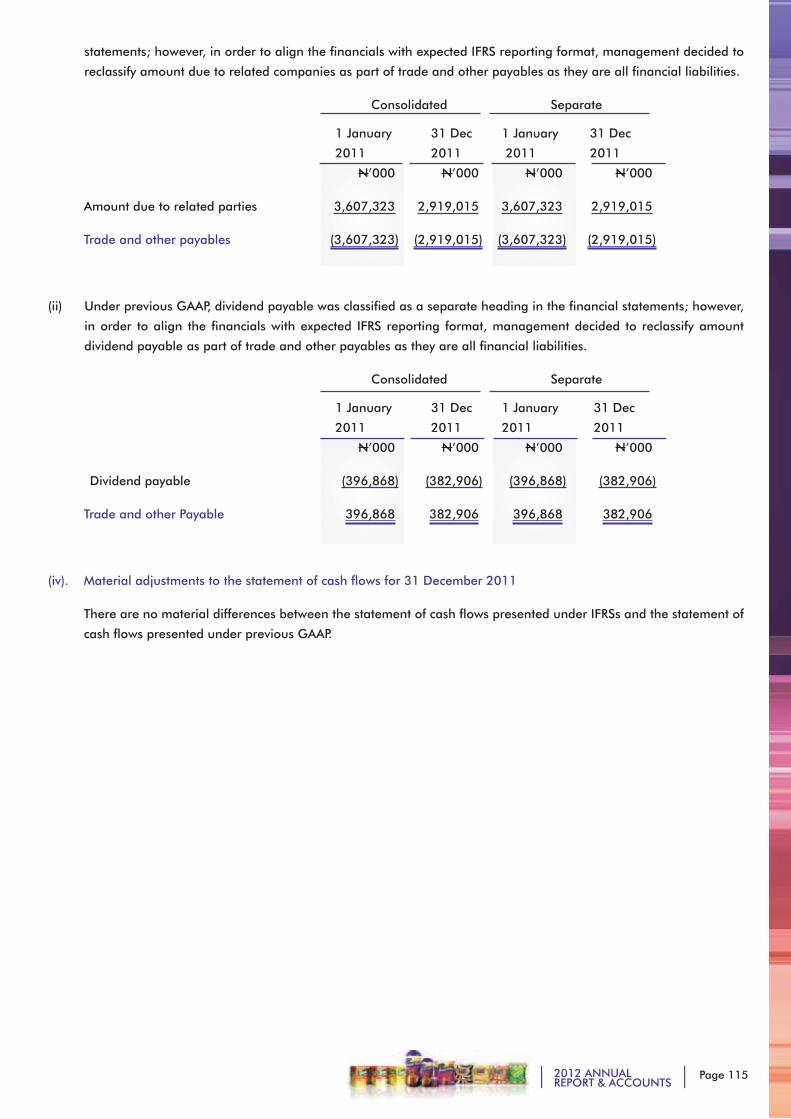
Page 1152012 ANNUALREPORT & ACCOUNTS
statements; however, in order to align the financials with expected IFRS reporting format, management decided to
reclassify amount due to related companies as part of trade and other payables as they are all financial liabilities.
Consolidated Separate
1 January 31 Dec 1 January 31 Dec
2011 2011 2011 2011
N’000 N’000 N’000 N’000
Amount due to related parties 3,607,323 2,919,015 3,607,323 2,919,015
Trade and other payables (3,607,323) (2,919,015) (3,607,323) (2,919,015)
(ii) Under previous GAAP, dividend payable was classified as a separate heading in the financial statements; however,
in order to align the financials with expected IFRS reporting format, management decided to reclassify amount
dividend payable as part of trade and other payables as they are all financial liabilities.
Consolidated Separate
1 January 31 Dec 1 January 31 Dec
2011 2011 2011 2011
N’000 N’000 N’000 N’000
Dividend payable (396,868) (382,906) (396,868) (382,906)
Trade and other Payable 396,868 382,906 396,868 382,906
(iv). Material adjustments to the statement of cash flows for 31 December 2011
There are no material differences between the statement of cash flows presented under IFRSs and the statement of
cash flows presented under previous GAAP.
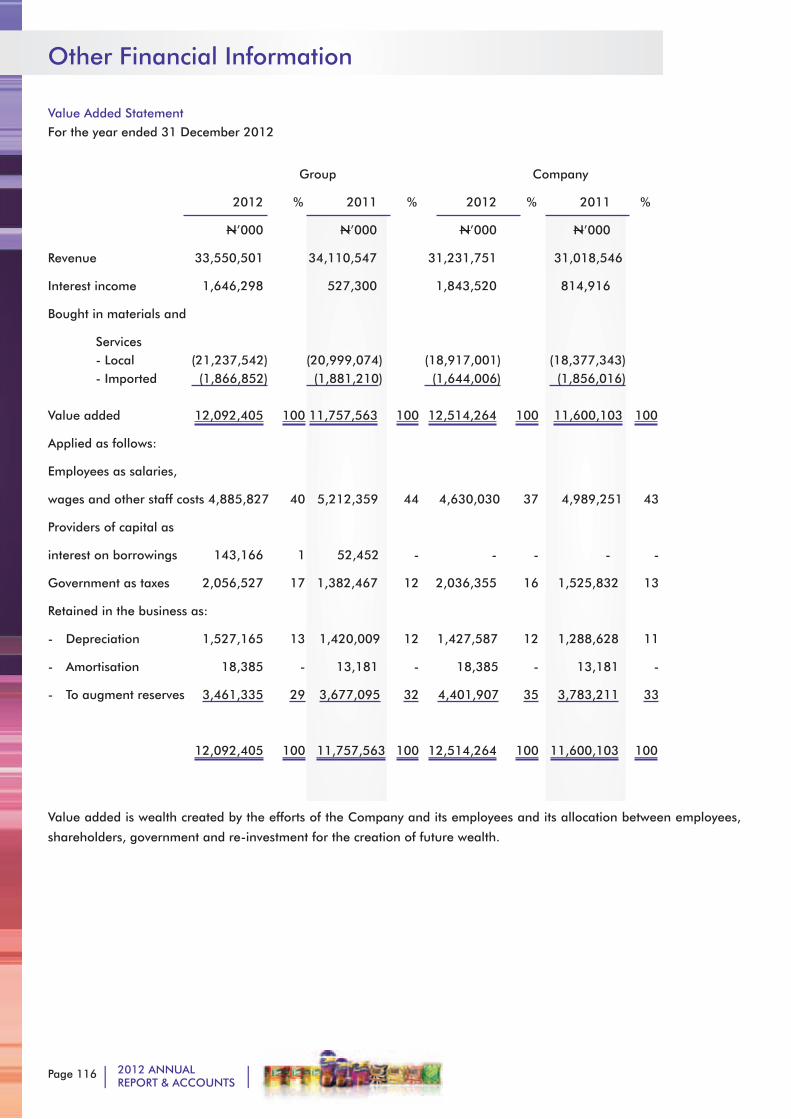
Page 116 2012 ANNUALREPORT & ACCOUNTS
Other Financial Information
Value Added StatementFor the year ended 31 December 2012
Group Company
2012 % 2011 % 2012 % 2011 %
N’000 N’000 N’000 N’000
Revenue 33,550,501 34,110,547 31,231,751 31,018,546
Interest income 1,646,298 527,300 1,843,520 814,916
Bought in materials and
Services - Local (21,237,542) (20,999,074) (18,917,001) (18,377,343) - Imported (1,866,852) (1,881,210) (1,644,006) (1,856,016)
Value added 12,092,405 100 11,757,563 100 12,514,264 100 11,600,103 100
Applied as follows:
Employees as salaries,
wages and other staff costs 4,885,827 40 5,212,359 44 4,630,030 37 4,989,251 43
Providers of capital as
interest on borrowings 143,166 1 52,452 - - - - -
Government as taxes 2,056,527 17 1,382,467 12 2,036,355 16 1,525,832 13
Retained in the business as:
- Depreciation 1,527,165 13 1,420,009 12 1,427,587 12 1,288,628 11
- Amortisation 18,385 - 13,181 - 18,385 - 13,181 -
- To augment reserves 3,461,335 29 3,677,095 32 4,401,907 35 3,783,211 33
12,092,405 100 11,757,563 100 12,514,264 100 11,600,103 100
Value added is wealth created by the efforts of the Company and its employees and its allocation between employees,
shareholders, government and re-investment for the creation of future wealth.
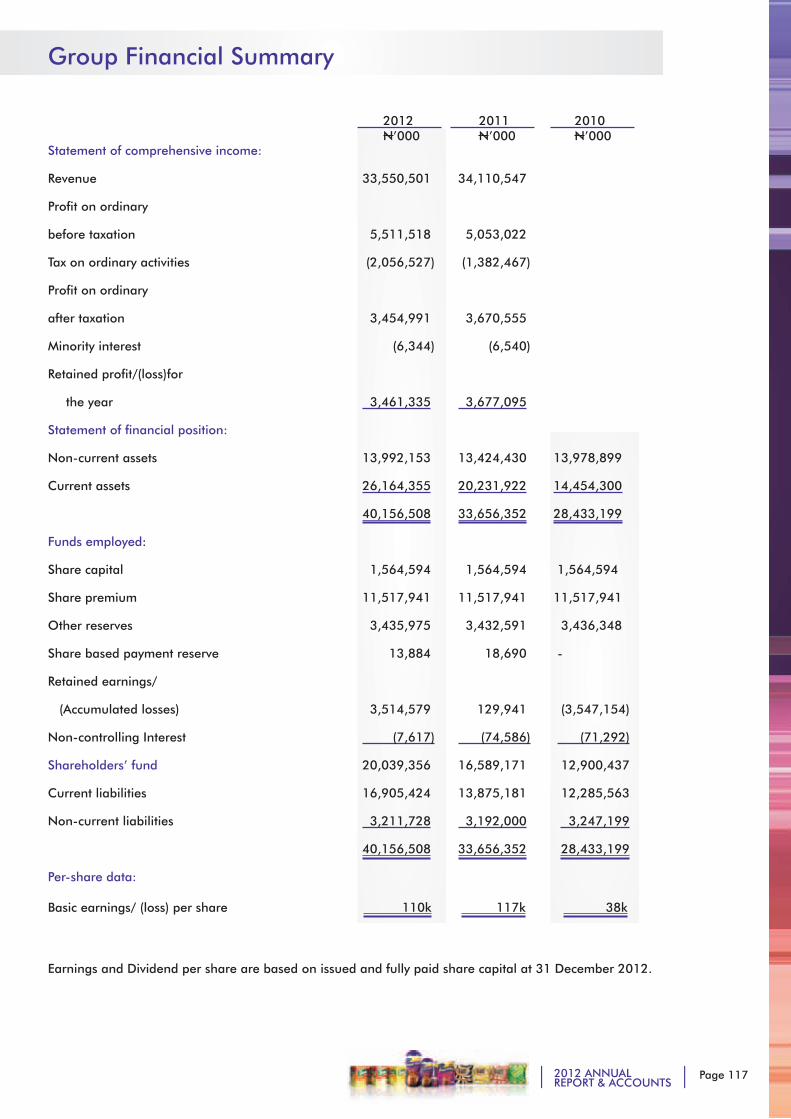
Page 1172012 ANNUALREPORT & ACCOUNTS
Group Financial Summary
2012 2011 2010 N’000 N’000 N’000 Statement of comprehensive income:
Revenue 33,550,501 34,110,547
Profit on ordinary
before taxation 5,511,518 5,053,022
Tax on ordinary activities (2,056,527) (1,382,467)
Profit on ordinary
after taxation 3,454,991 3,670,555
Minority interest (6,344) (6,540)
Retained profit/(loss)for
the year 3,461,335 3,677,095
Statement of financial position:
Non-current assets 13,992,153 13,424,430 13,978,899
Current assets 26,164,355 20,231,922 14,454,300
40,156,508 33,656,352 28,433,199
Funds employed:
Share capital 1,564,594 1,564,594 1,564,594
Share premium 11,517,941 11,517,941 11,517,941
Other reserves 3,435,975 3,432,591 3,436,348
Share based payment reserve 13,884 18,690 -
Retained earnings/
(Accumulated losses) 3,514,579 129,941 (3,547,154)
Non-controlling Interest (7,617) (74,586) (71,292)
Shareholders’ fund 20,039,356 16,589,171 12,900,437
Current liabilities 16,905,424 13,875,181 12,285,563
Non-current liabilities 3,211,728 3,192,000 3,247,199
40,156,508 33,656,352 28,433,199
Per-share data:
Basic earnings/ (loss) per share 110k 117k 38k
Earnings and Dividend per share are based on issued and fully paid share capital at 31 December 2012.
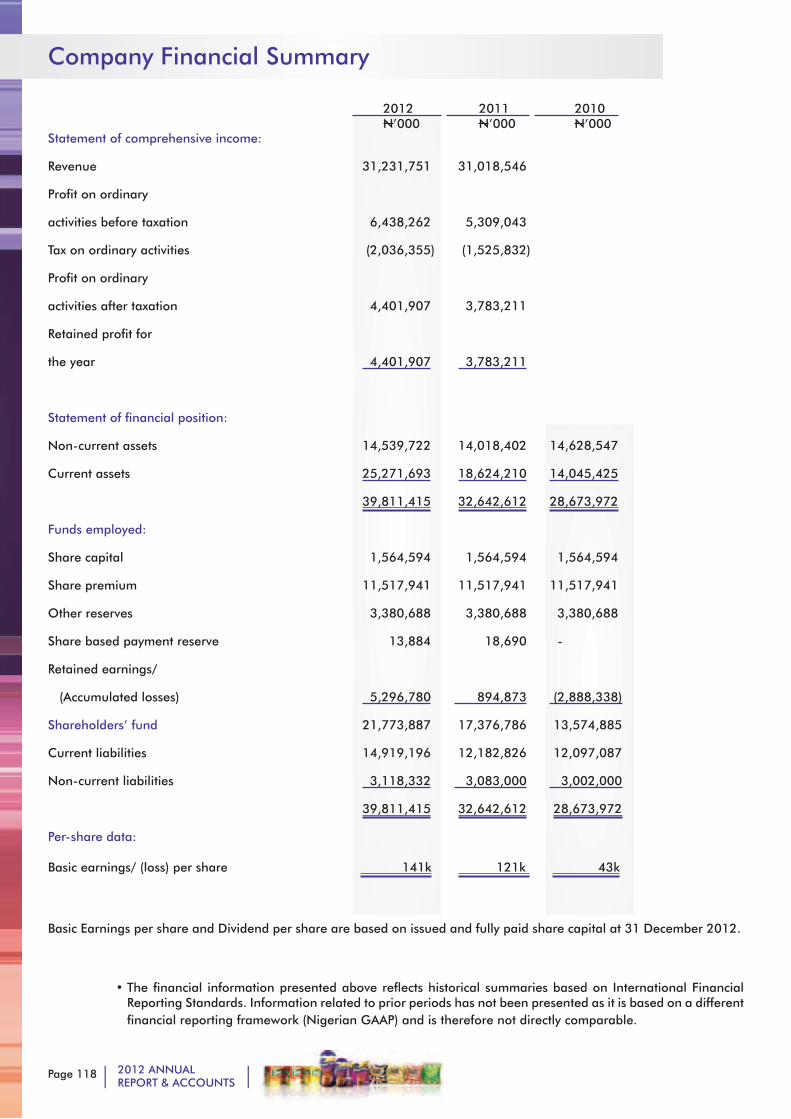
Page 118 2012 ANNUALREPORT & ACCOUNTS
Company Financial Summary
2012 2011 2010 N’000 N’000 N’000Statement of comprehensive income:
Revenue 31,231,751 31,018,546
Profit on ordinary
activities before taxation 6,438,262 5,309,043
Tax on ordinary activities (2,036,355) (1,525,832)
Profit on ordinary
activities after taxation 4,401,907 3,783,211
Retained profit for
the year 4,401,907 3,783,211
Statement of financial position:
Non-current assets 14,539,722 14,018,402 14,628,547
Current assets 25,271,693 18,624,210 14,045,425
39,811,415 32,642,612 28,673,972
Funds employed:
Share capital 1,564,594 1,564,594 1,564,594
Share premium 11,517,941 11,517,941 11,517,941
Other reserves 3,380,688 3,380,688 3,380,688
Share based payment reserve 13,884 18,690 -
Retained earnings/
(Accumulated losses) 5,296,780 894,873 (2,888,338)
Shareholders’ fund 21,773,887 17,376,786 13,574,885
Current liabilities 14,919,196 12,182,826 12,097,087
Non-current liabilities 3,118,332 3,083,000 3,002,000
39,811,415 32,642,612 28,673,972
Per-share data:
Basic earnings/ (loss) per share 141k 121k 43k
Basic Earnings per share and Dividend per share are based on issued and fully paid share capital at 31 December 2012.
• The financial information presented above reflects historical summaries based on International Financial Reporting Standards. Information related to prior periods has not been presented as it is based on a different financial reporting framework (Nigerian GAAP) and is therefore not directly comparable.
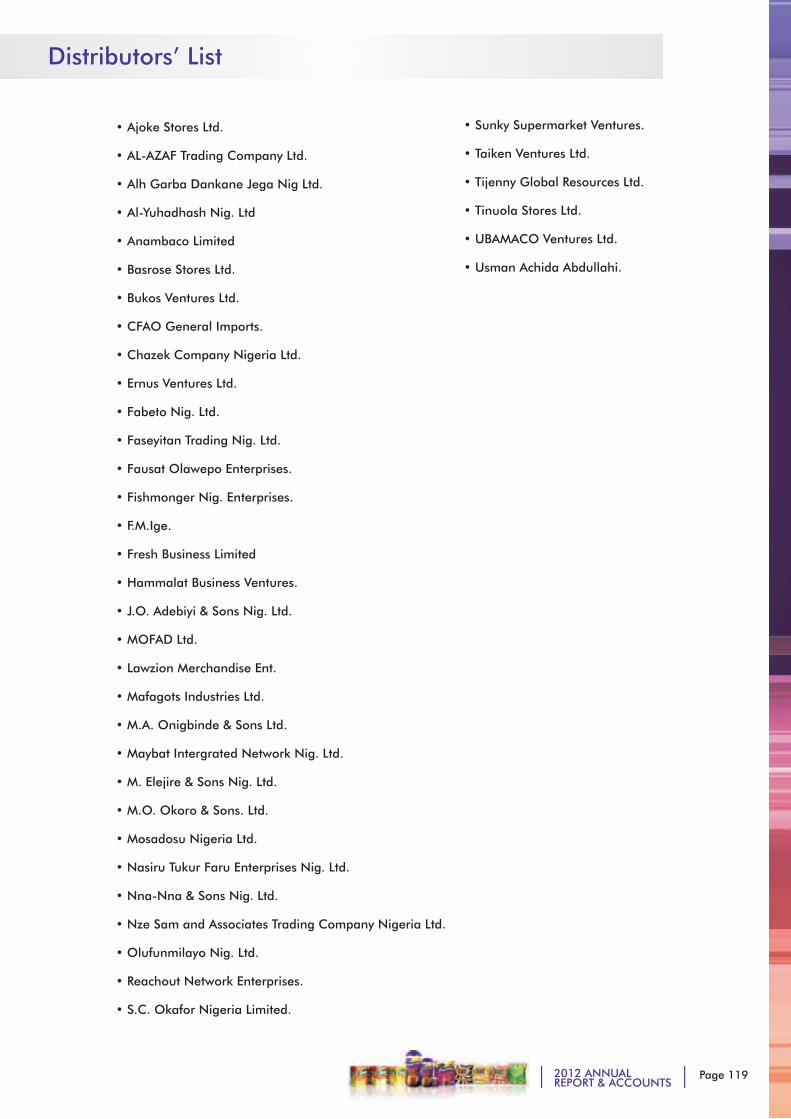
Page 1192012 ANNUALREPORT & ACCOUNTS
Distributors’ List
• Ajoke Stores Ltd.
• AL-AZAF Trading Company Ltd.
• Alh Garba Dankane Jega Nig Ltd.
• Al-Yuhadhash Nig. Ltd
• Anambaco Limited
• Basrose Stores Ltd.
• Bukos Ventures Ltd.
• CFAO General Imports.
• Chazek Company Nigeria Ltd.
• Ernus Ventures Ltd.
• Fabeto Nig. Ltd.
• Faseyitan Trading Nig. Ltd.
• Fausat Olawepo Enterprises.
• Fishmonger Nig. Enterprises.
• F.M.Ige.
• Fresh Business Limited
• Hammalat Business Ventures.
• J.O. Adebiyi & Sons Nig. Ltd.
• MOFAD Ltd.
• Lawzion Merchandise Ent.
• Mafagots Industries Ltd.
• M.A. Onigbinde & Sons Ltd.
• Maybat Intergrated Network Nig. Ltd.
• M. Elejire & Sons Nig. Ltd.
• M.O. Okoro & Sons. Ltd.
• Mosadosu Nigeria Ltd.
• Nasiru Tukur Faru Enterprises Nig. Ltd.
• Nna-Nna & Sons Nig. Ltd.
• Nze Sam and Associates Trading Company Nigeria Ltd.
• Olufunmilayo Nig. Ltd.
• Reachout Network Enterprises.
• S.C. Okafor Nigeria Limited.
• Sunky Supermarket Ventures.
• Taiken Ventures Ltd.
• Tijenny Global Resources Ltd.
• Tinuola Stores Ltd.
• UBAMACO Ventures Ltd.
• Usman Achida Abdullahi.
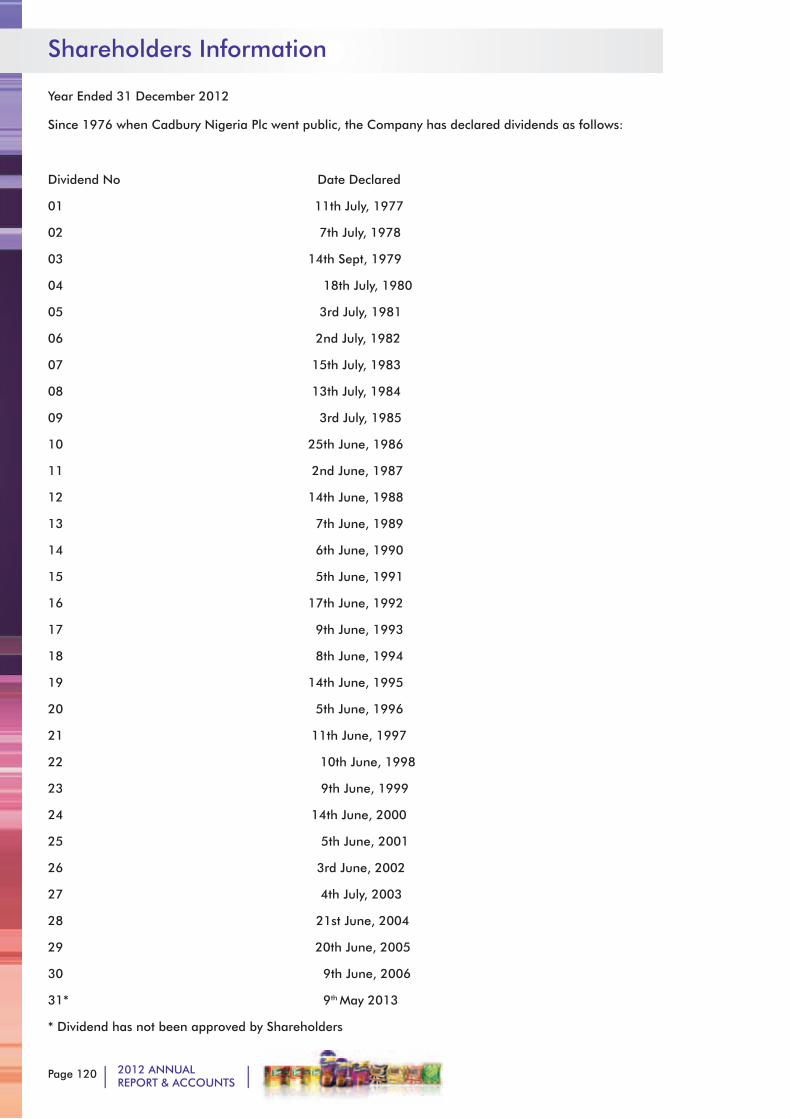
Page 120 2012 ANNUALREPORT & ACCOUNTS
Shareholders Information
Year Ended 31 December 2012
Since 1976 when Cadbury Nigeria Plc went public, the Company has declared dividends as follows:
Dividend No Date Declared
01 11th July, 1977
02 7th July, 1978
03 14th Sept, 1979
04 18th July, 1980
05 3rd July, 1981
06 2nd July, 1982
07 15th July, 1983
08 13th July, 1984
09 3rd July, 1985
10 25th June, 1986
11 2nd June, 1987
12 14th June, 1988
13 7th June, 1989
14 6th June, 1990
15 5th June, 1991
16 17th June, 1992
17 9th June, 1993
18 8th June, 1994
19 14th June, 1995
20 5th June, 1996
21 11th June, 1997
22 10th June, 1998
23 9th June, 1999
24 14th June, 2000
25 5th June, 2001
26 3rd June, 2002
27 4th July, 2003
28 21st June, 2004
29 20th June, 2005
30 9th June, 2006
31* 9th May 2013
* Dividend has not been approved by Shareholders
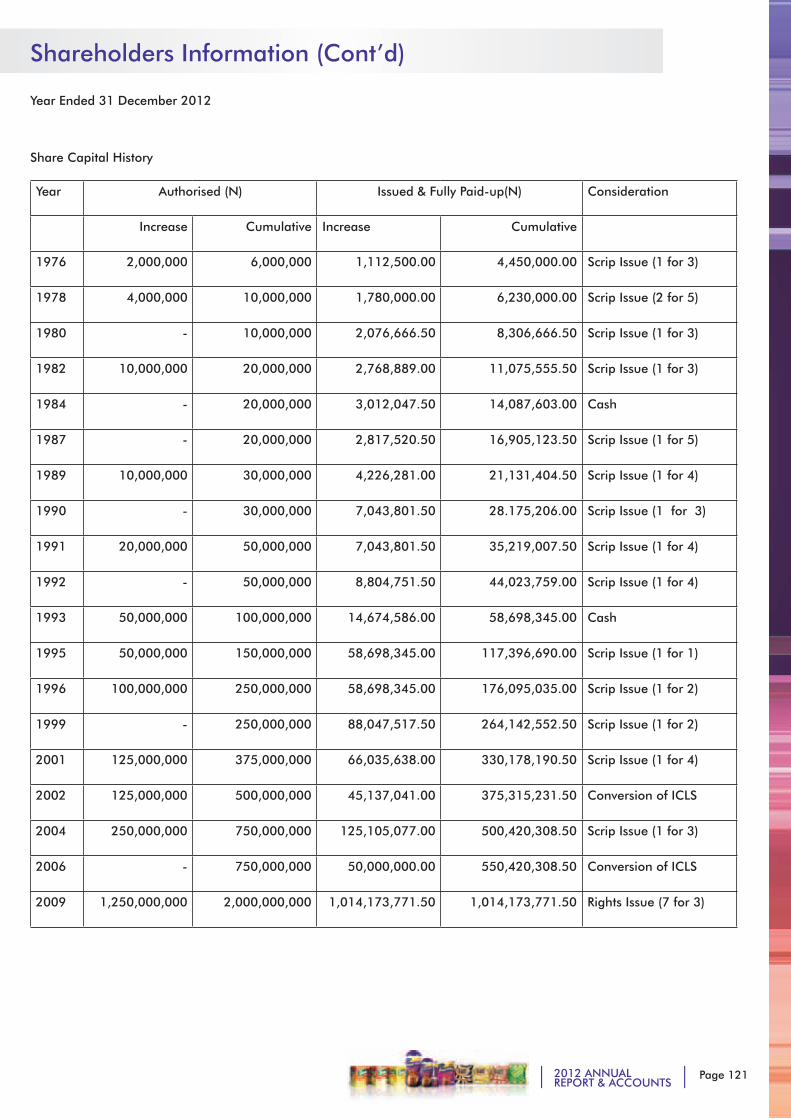
Page 1212012 ANNUALREPORT & ACCOUNTS
Shareholders Information (Cont’d)
Year Ended 31 December 2012
Share Capital History
Year Authorised (N) Issued & Fully Paid-up(N) Consideration
Increase Cumulative Increase Cumulative
1976 2,000,000 6,000,000 1,112,500.00 4,450,000.00 Scrip Issue (1 for 3)
1978 4,000,000 10,000,000 1,780,000.00 6,230,000.00 Scrip Issue (2 for 5)
1980 - 10,000,000 2,076,666.50 8,306,666.50 Scrip Issue (1 for 3)
1982 10,000,000 20,000,000 2,768,889.00 11,075,555.50 Scrip Issue (1 for 3)
1984 - 20,000,000 3,012,047.50 14,087,603.00 Cash
1987 - 20,000,000 2,817,520.50 16,905,123.50 Scrip Issue (1 for 5)
1989 10,000,000 30,000,000 4,226,281.00 21,131,404.50 Scrip Issue (1 for 4)
1990 - 30,000,000 7,043,801.50 28.175,206.00 Scrip Issue (1 for 3)
1991 20,000,000 50,000,000 7,043,801.50 35,219,007.50 Scrip Issue (1 for 4)
1992 - 50,000,000 8,804,751.50 44,023,759.00 Scrip Issue (1 for 4)
1993 50,000,000 100,000,000 14,674,586.00 58,698,345.00 Cash
1995 50,000,000 150,000,000 58,698,345.00 117,396,690.00 Scrip Issue (1 for 1)
1996 100,000,000 250,000,000 58,698,345.00 176,095,035.00 Scrip Issue (1 for 2)
1999 - 250,000,000 88,047,517.50 264,142,552.50 Scrip Issue (1 for 2)
2001 125,000,000 375,000,000 66,035,638.00 330,178,190.50 Scrip Issue (1 for 4)
2002 125,000,000 500,000,000 45,137,041.00 375,315,231.50 Conversion of ICLS
2004 250,000,000 750,000,000 125,105,077.00 500,420,308.50 Scrip Issue (1 for 3)
2006 - 750,000,000 50,000,000.00 550,420,308.50 Conversion of ICLS
2009 1,250,000,000 2,000,000,000 1,014,173,771.50 1,014,173,771.50 Rights Issue (7 for 3)

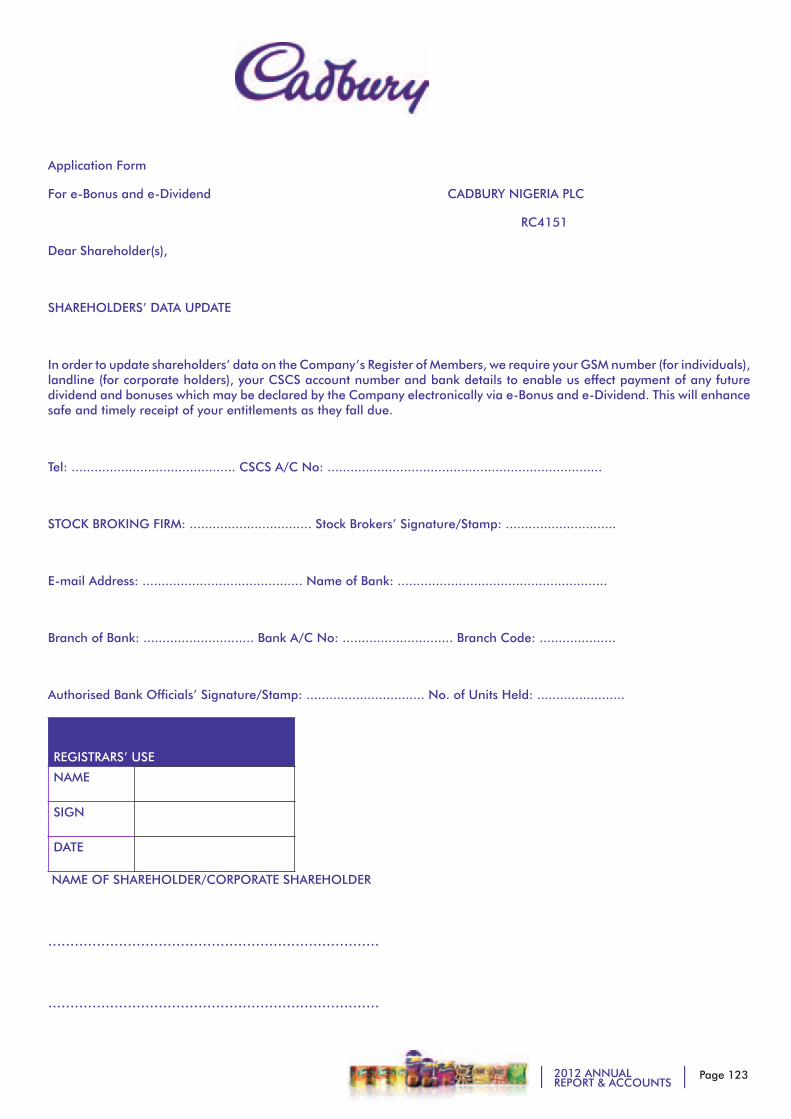
Page 1232012 ANNUALREPORT & ACCOUNTS
Application Form
For e-Bonus and e-Dividend CADBURY NIGERIA PLC
RC4151
Dear Shareholder(s),
SHAREHOLDERS’ DATA UPDATE
In order to update shareholders’ data on the Company’s Register of Members, we require your GSM number (for individuals), landline (for corporate holders), your CSCS account number and bank details to enable us effect payment of any future dividend and bonuses which may be declared by the Company electronically via e-Bonus and e-Dividend. This will enhance safe and timely receipt of your entitlements as they fall due.
Tel: ........................................... CSCS A/C No: ........................................................................
STOCK BROKING FIRM: ................................ Stock Brokers’ Signature/Stamp: .............................
E-mail Address: .......................................... Name of Bank: .......................................................
Branch of Bank: ............................. Bank A/C No: ............................. Branch Code: ....................
Authorised Bank Officials’ Signature/Stamp: ............................... No. of Units Held: .......................
REGISTRARS’ USE
NAME
SIGNATURE
DATE
NAME OF SHAREHOLDER/CORPORATE SHAREHOLDER
...........................................................................
...........................................................................
Seco
nd
Fold
here
an
d I
nse
rt
UN
ION
REG
ISTR
AR
S LI
MIT
ED
2 B
UR
MA
RO
AD
APA
PA, LA
GO
S
NIG
ERIA
Seco
nd
Fold
here
First Fold
Ple
ase
aff
ix
Posr
ag
e S
tam
p
Page 1252012 ANNUALREPORT & ACCOUNTS
PRESENT ADDRESS: ..............................................
...........................................................................
...........................................................................
NAME OF COMPANY IN WHICH YOU HAVE SHARES
CADBURY NIGERIA PLC
Please notify our Registrars, Union Registrars Limited, of any changes in telephone, address and bank whenever it occurs.
Yours’ sincerely,
FOR: CADBURY NIGERIA PLC
Fola AkandeCompany Secretary/Chief Counsel
Note: please be informed that by filling and sending this form to our Registrars, Union Registrars Limited for processing, you have applied to have any future dividend and bonuses paid to you by e-Dividend and e-Bonus, thereby authorizing CADBURY NIGERIA PLC to credit your account (in respect of dividends and bonuses) electronically.
PLEASE COMPLETE AND RETURN TO SIGNATURE/RIGHT THUMBPRINT OF SHAREHOLDER
UNION REGISTRARS LIMITED In case of Corporate Shareholder, use Company Seal
2 BURMA ROAD, APAPA, LAGOS

Seco
nd
Fold
here
an
d I
nse
rt
UN
ION
REG
ISTR
AR
S LI
MIT
ED
2 B
UR
MA
RO
AD
APA
PA, LA
GO
S
NIG
ERIA
Seco
nd
Fold
here
First Fold
Ple
ase
aff
ix
Posr
ag
e S
tam
p

Page 1272012 ANNUALREPORT & ACCOUNTS
CADBURY NIGERIA PLC
48TH ANNUAL GENERAL MEETING TO BE HELD
AT 10.00AM ON WEDNESDAY 8 MAY 2013
THE CIVIC CENTRE, VICTORIA ISLAND LAGOS
RESOLUTIONS FOR AGAINST
ORDINARY BUSINESS
To declare a dividend
To approve the appointment of the following as Directors:
Mr. Emil Moskofian
Mr. Ruslan Kinebasan Kinebas
To re-elect the following Directors retiring by rotation:
Mr. Atedo Peterside, CON
Mrs. Oyeyimika adeboye
To authorise the Directors to fix the remuneration of the Auditors
To elect members of the Audit Committee
SPECIAL BUSINESS
To authorise the remuneration of the Directors
Please indicate with ‘X’ in the appropriate space how you wish your votes to be cast on the resolutions set out above. Unless otherwise instructed, the proxy will vote or abstain from voting at his/her discretion.
PROXY FORM
I/We ………………………………………………………………………
being a member/members of Cadbury Nigeria Plc
hereby appoint ** ………………………………………………..
…………………………………………. Or failing him/her the
Chairman of the meeting as my/our proxy to act
and vote for me/us and on my/our behalf at the
Annual General Meeting of the Company to be held
on Wednesday 8 May 2013 and at any adjournment
thereof.
Dated this …………… Day of ………………………… 2013
Shareholder’s Signature ………………………………………
Seco
nd
Fold
here
an
d I
nse
rt
UN
ION
REG
ISTR
AR
S LI
MIT
ED
2 B
UR
MA
RO
AD
APA
PA, LA
GO
S
NIG
ERIA
Seco
nd
Fold
here
First Fold
Ple
ase
aff
ix
Posr
ag
e S
tam
p
Page 1292012 ANNUALREPORT & ACCOUNTS
Notes:
Please sign the above proxy form and post it, so as to reach the address overleaf not later that 48 hours
before the time for holding the Meeting. If executed by a corporation, the proxy form should be sealed
with the Corporation’s common seal.
The name of the Shareholder must be written in BLOCK CAPITALS on the proxy form where marked.
Following the normal practice, the Chairman of the Meeting has been entered on the form to ensure
that someone will be at the Meeting to act as your proxy, but if you wish, you may insert in the blank
space on the form (marked **) the name of the person, whether a member of the Company or not, who
will attend the Meeting and vote on your behalf instead of the Chairman.
A member (Shareholder) who is unable to attend the Annual General Meeting is allowed by law to vote
on a poll by proxy. The above form has been prepared to enable you to exercise your right to vote, in
case you cannot personally attend the Meeting.
……………………………………………………………………………………………………………………………
CADBURY NIGERIA PLC
48TH ANNUAL GENERAL MEETING
Shareholder’s Admission Form
BEFORE POSTING THE ABOVE FORM, PLEASE TEAR OFF THIS PART AND RETAIN FOR ADMISSION TO
THE MEETING
Please admit the shareholder on this form or his/her duly appointed proxy to the Annual General Meeting to be held at
The Civic Centre, Victoria Island, Lagos at 10.00AM on Wednesday 8 May 2013.
Name of Shareholder: …………………………………………………………………………………………………………………………………………………………………………………
Number of Shares Held: ………………………………………………………………… Signature of person attending: ………………………………………………………
This admission form must be produced by the Shareholder or his/her proxy, who need not be a member of the Company, in order to obtain entrance to the Annual General Meeting.

Seco
nd
Fold
here
an
d I
nse
rt
UN
ION
REG
ISTR
AR
S LI
MIT
ED
2 B
UR
MA
RO
AD
APA
PA, LA
GO
S
NIG
ERIA
Seco
nd
Fold
here
First Fold
Ple
ase
aff
ix
Posr
ag
e S
tam
p

NOTES

Page 132 2012 ANNUALREPORT & ACCOUNTS
NOTES

Page 1332012 ANNUALREPORT & ACCOUNTS
NOTES

Page 134 2012 ANNUALREPORT & ACCOUNTS
NOTES

aaan.0051INSIGHT