Embed Size (px)
Citation preview
Page 1 of 40
PRE-LEAVING CERTIFICATE EXAMINATION, 2016
MARKING SCHEME
ACCOUNTING
HIGHER AND ORDINARY LEVEL
*WMS15*
35 Finglas Business Park, Tolka Valley Road, Finglas, Dublin 11T: 01 808 1494, F: 01 836 2739, E: [email protected], W: www.examcraft.ie
Page 2 of 40
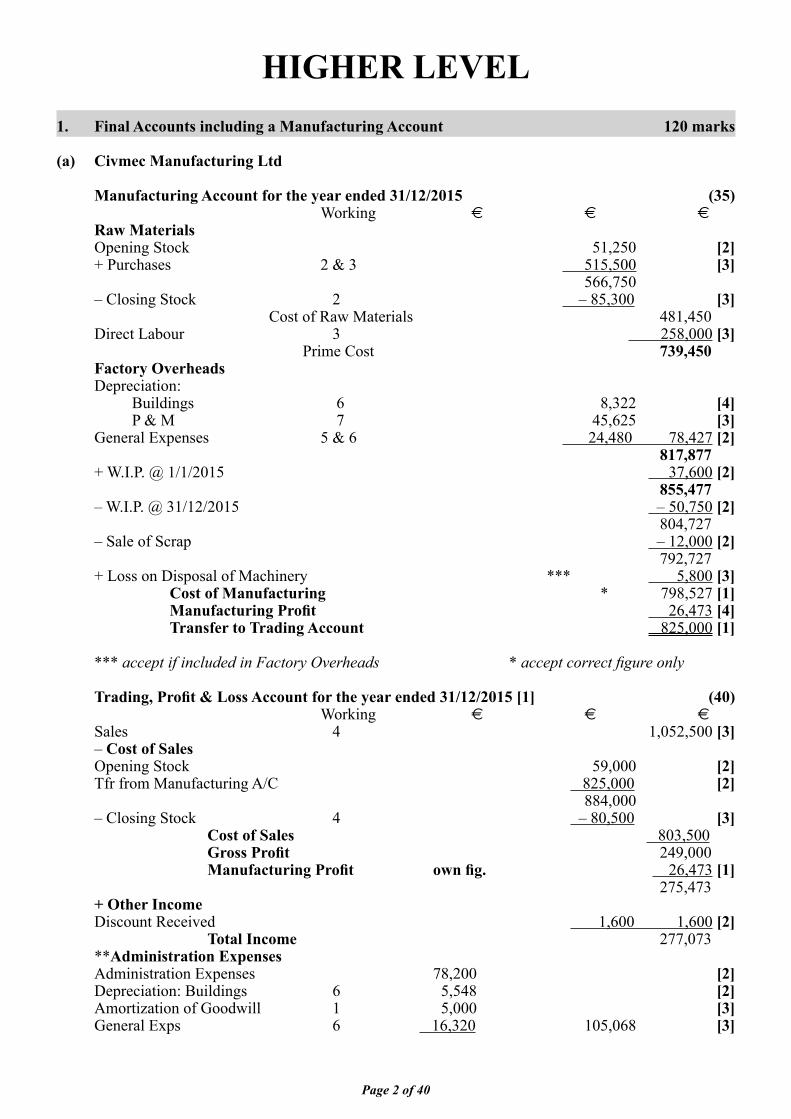
HIGHER LEVEL1. Final Accounts including a Manufacturing Account 120 marks
(a) Civmec Manufacturing Ltd Manufacturing Account for the year ended 31/12/2015 (35) Working € € € Raw Materials Opening Stock 51,250 [2] + Purchases 2 & 3 515,500 [3] 566,750 – Closing Stock 2 – 85,300 [3] Cost of Raw Materials 481,450 Direct Labour 3 258,000 [3] Prime Cost 739,450 Factory Overheads Depreciation: Buildings 6 8,322 [4] P & M 7 45,625 [3] General Expenses 5 & 6 24,480 78,427 [2] 817,877 + W.I.P. @ 1/1/2015 37,600 [2] 855,477 – W.I.P. @ 31/12/2015 – 50,750 [2] 804,727 – Sale of Scrap – 12,000 [2] 792,727 + Loss on Disposal of Machinery *** 5,800 [3] Cost of Manufacturing * 798,527 [1] Manufacturing Profi t 26,473 [4] Transfer to Trading Account 825,000 [1] *** accept if included in Factory Overheads * accept correct fi gure only Trading, Profi t & Loss Account for the year ended 31/12/2015 [1] (40) Working € € € Sales 4 1,052,500 [3] – Cost of Sales Opening Stock 59,000 [2] Tfr from Manufacturing A/C 825,000 [2] 884,000 – Closing Stock 4 – 80,500 [3] Cost of Sales 803,500 Gross Profi t 249,000 Manufacturing Profi t own fi g. 26,473 [1] 275,473 + Other Income Discount Received 1,600 1,600 [2] Total Income 277,073 **Administration Expenses Administration Expenses 78,200 [2] Depreciation: Buildings 6 5,548 [2] Amortization of Goodwill 1 5,000 [3] General Exps 6 16,320 105,068 [3]
Page 3 of 40
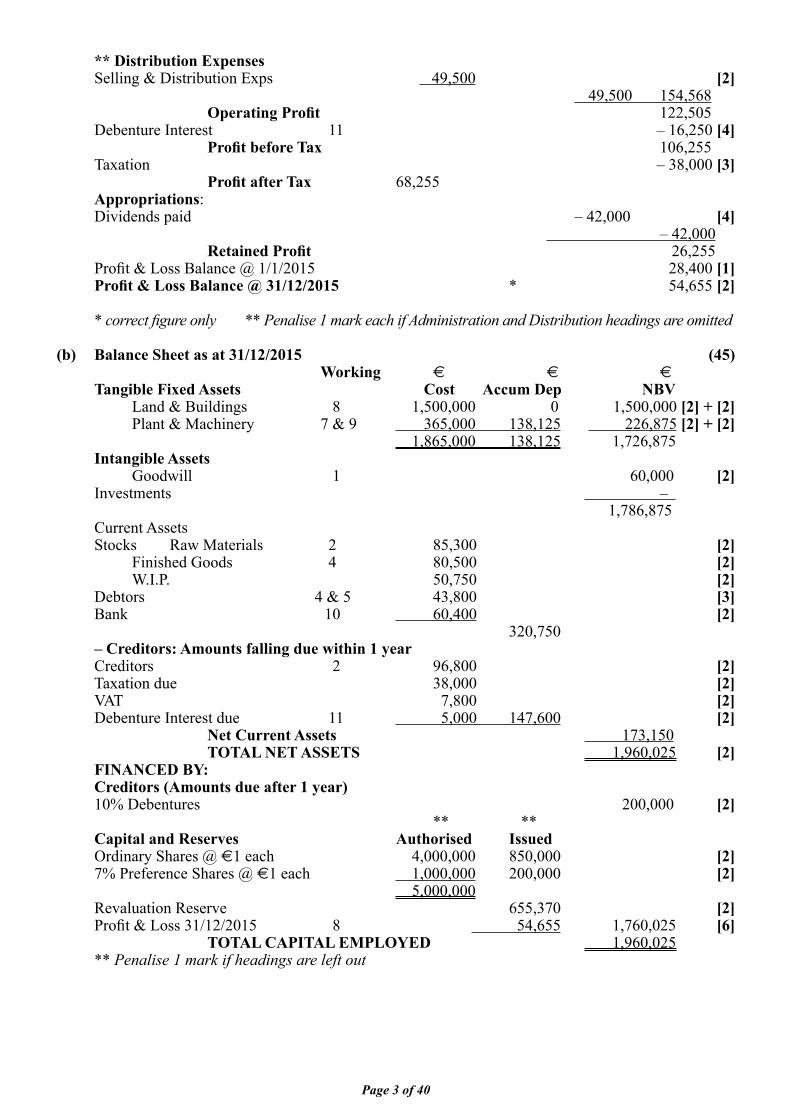
** Distribution Expenses Selling & Distribution Exps 49,500 [2] 49,500 154,568 Operating Profi t 122,505 Debenture Interest 11 – 16,250 [4] Profi t before Tax 106,255 Taxation – 38,000 [3] Profi t after Tax 68,255 Appropriations: Dividends paid – 42,000 [4] – 42,000 Retained Profi t 26,255 Profi t & Loss Balance @ 1/1/2015 28,400 [1] Profi t & Loss Balance @ 31/12/2015 * 54,655 [2]
* correct fi gure only ** Penalise 1 mark each if Administration and Distribution headings are omitted
(b) Balance Sheet as at 31/12/2015 (45) Working € € € Tangible Fixed Assets Cost Accum Dep NBV Land & Buildings 8 1,500,000 0 1,500,000 [2] + [2] Plant & Machinery 7 & 9 365,000 138,125 226,875 [2] + [2] 1,865,000 138,125 1,726,875 Intangible Assets Goodwill 1 60,000 [2] Investments – 1,786,875 Current Assets Stocks Raw Materials 2 85,300 [2] Finished Goods 4 80,500 [2] W.I.P. 50,750 [2] Debtors 4 & 5 43,800 [3] Bank 10 60,400 [2] 320,750 – Creditors: Amounts falling due within 1 year Creditors 2 96,800 [2] Taxation due 38,000 [2] VAT 7,800 [2] Debenture Interest due 11 5,000 147,600 [2] Net Current Assets 173,150 TOTAL NET ASSETS 1,960,025 [2] FINANCED BY: Creditors (Amounts due after 1 year) 10% Debentures 200,000 [2] ** ** Capital and Reserves Authorised Issued Ordinary Shares @ €1 each 4,000,000 850,000 [2] 7% Preference Shares @ €1 each 1,000,000 200,000 [2] 5,000,000 Revaluation Reserve 655,370 [2] Profi t & Loss 31/12/2015 8 54,655 1,760,025 [6] TOTAL CAPITAL EMPLOYED 1,960,025 ** Penalise 1 mark if headings are left out
Page 4 of 40
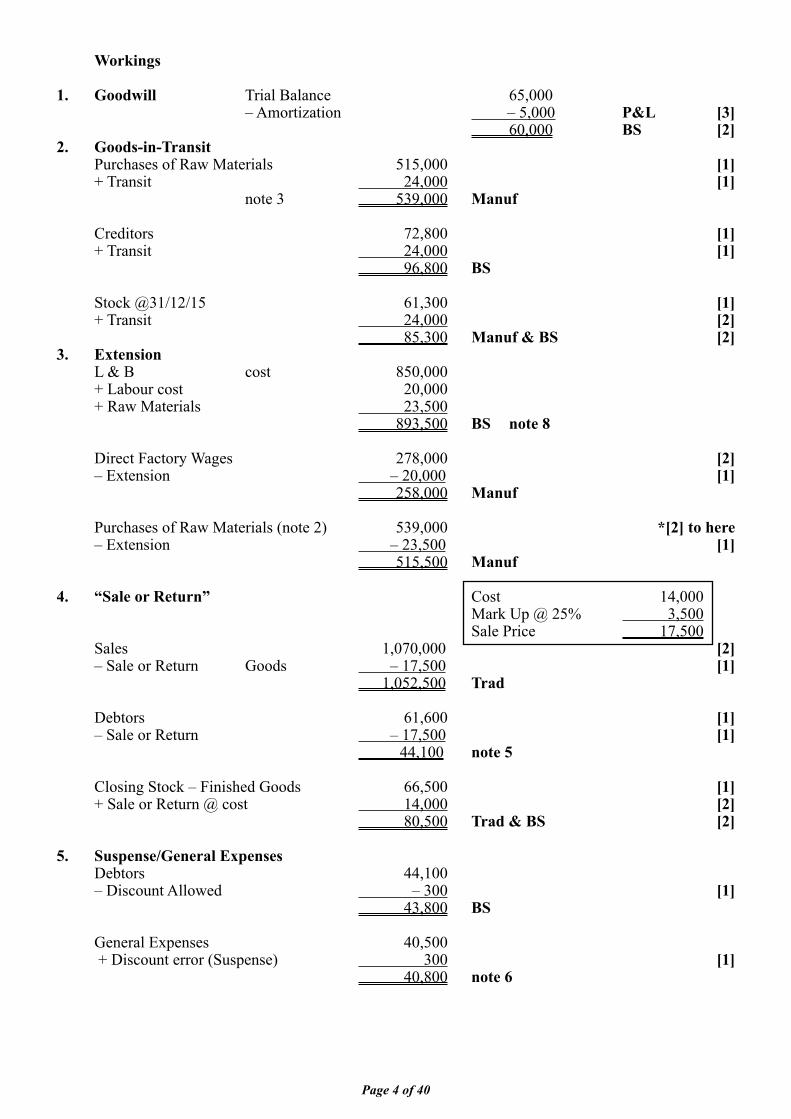
Workings
1. Goodwill Trial Balance 65,000 – Amortization – 5,000 P&L [3] 60,000 BS [2]2. Goods-in-Transit Purchases of Raw Materials 515,000 [1] + Transit 24,000 [1] note 3 539,000 Manuf
Creditors 72,800 [1] + Transit 24,000 [1] 96,800 BS
Stock @31/12/15 61,300 [1] + Transit 24,000 [2] 85,300 Manuf & BS [2]3. Extension L & B cost 850,000 + Labour cost 20,000 + Raw Materials 23,500 893,500 BS note 8
Direct Factory Wages 278,000 [2] – Extension – 20,000 [1] 258,000 Manuf
Purchases of Raw Materials (note 2) 539,000 *[2] to here – Extension – 23,500 [1] 515,500 Manuf
4. “Sale or Return” Cost 14,000 Mark Up @ 25% 3,500 Sale Price 17,500 Sales 1,070,000 [2] – Sale or Return Goods – 17,500 [1] 1,052,500 Trad
Debtors 61,600 [1] – Sale or Return – 17,500 [1] 44,100 note 5
Closing Stock – Finished Goods 66,500 [1] + Sale or Return @ cost 14,000 [2] 80,500 Trad & BS [2]
5. Suspense/General Expenses Debtors 44,100 – Discount Allowed – 300 [1] 43,800 BS
General Expenses 40,500 + Discount error (Suspense) 300 [1] 40,800 note 6
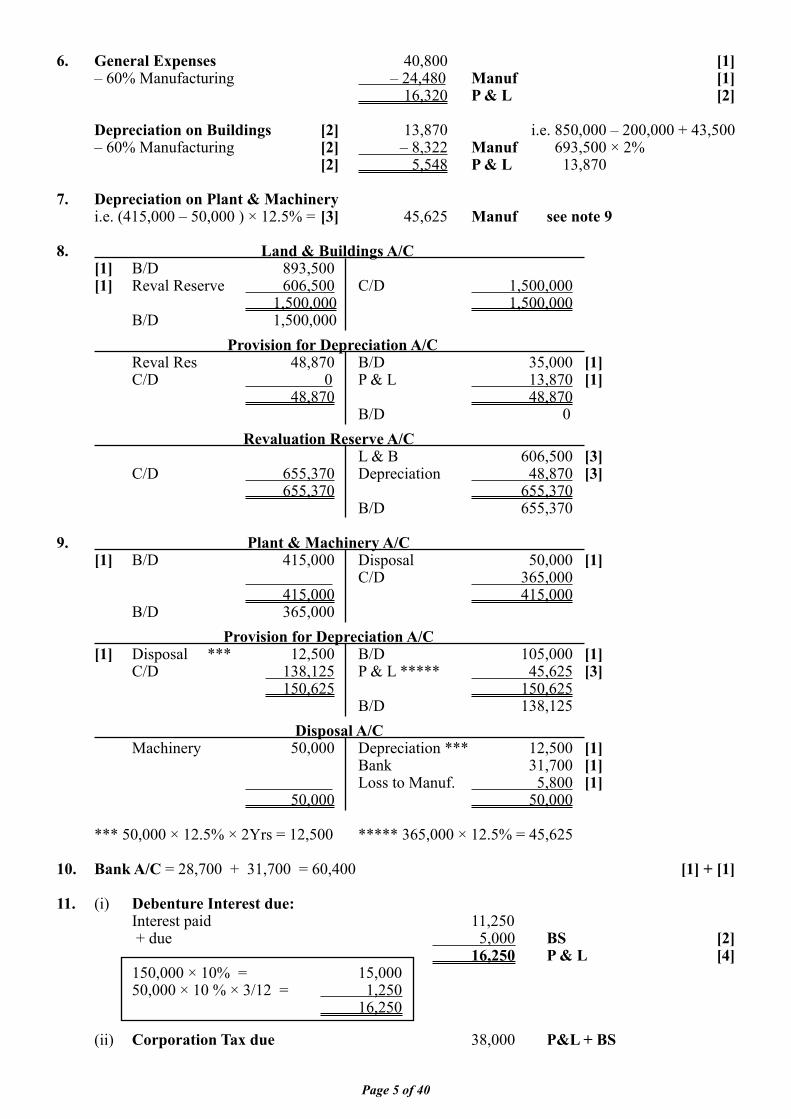
Page 5 of 40
6. General Expenses 40,800 [1] – 60% Manufacturing – 24,480 Manuf [1] 16,320 P & L [2]
Depreciation on Buildings [2] 13,870 i.e. 850,000 – 200,000 + 43,500 – 60% Manufacturing [2] – 8,322 Manuf 693,500 × 2% [2] 5,548 P & L 13,870 7. Depreciation on Plant & Machinery i.e. (415,000 – 50,000 ) × 12.5% = [3] 45,625 Manuf see note 9
8. Land & Buildings A/C [1] B/D 893,500 [1] Reval Reserve 606,500 C/D 1,500,000 1,500,000 1,500,000 B/D 1,500,000 Provision for Depreciation A/C Reval Res 48,870 B/D 35,000 [1] C/D 0 P & L 13,870 [1] 48,870 48,870 B/D 0 Revaluation Reserve A/C L & B 606,500 [3] C/D 655,370 Depreciation 48,870 [3] 655,370 655,370 B/D 655,370
9. Plant & Machinery A/C [1] B/D 415,000 Disposal 50,000 [1] C/D 365,000 415,000 415,000 B/D 365,000 Provision for Depreciation A/C [1] Disposal *** 12,500 B/D 105,000 [1] C/D 138,125 P & L ***** 45,625 [3] 150,625 150,625 B/D 138,125 Disposal A/C Machinery 50,000 Depreciation *** 12,500 [1] Bank 31,700 [1] Loss to Manuf. 5,800 [1] 50,000 50,000
*** 50,000 × 12.5% × 2Yrs = 12,500 ***** 365,000 × 12.5% = 45,625
10. Bank A/C = 28,700 + 31,700 = 60,400 [1] + [1]
11. (i) Debenture Interest due: Interest paid 11,250 + due 5,000 BS [2] 16,250 P & L [4] 150,000 × 10% = 15,000 50,000 × 10 % × 3/12 = 1,250 16,250
(ii) Corporation Tax due 38,000 P&L + BS
Page 6 of 40
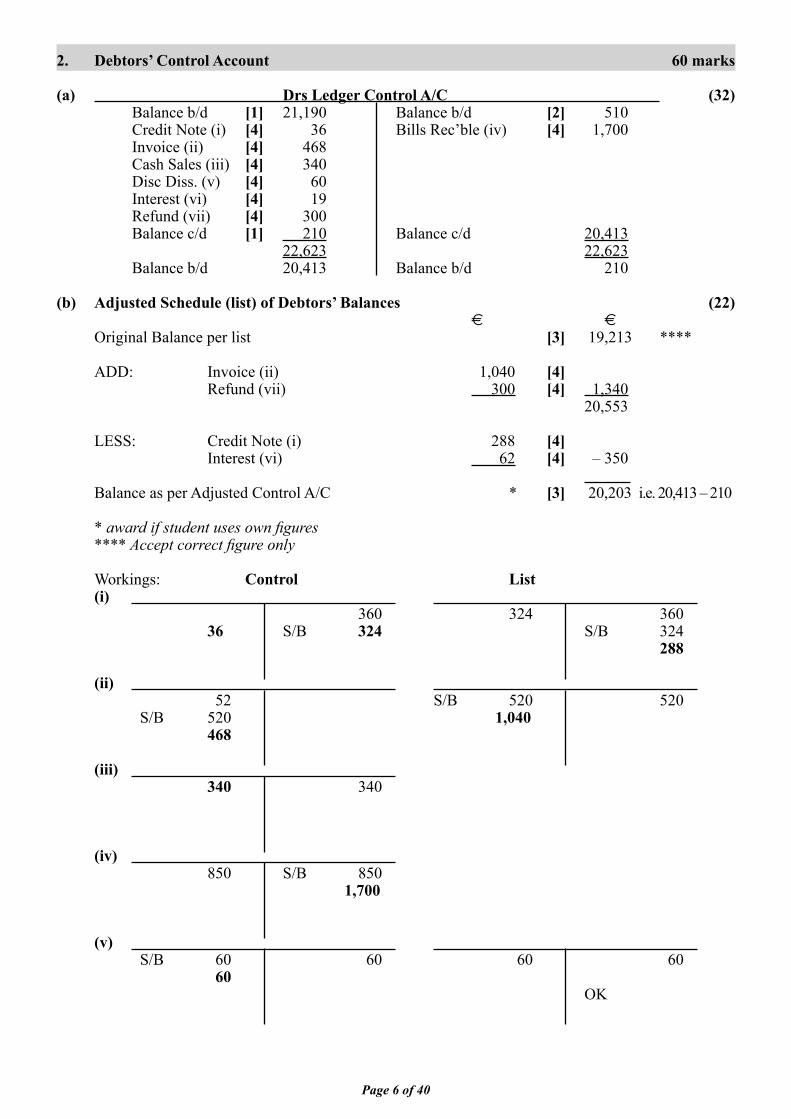
2. Debtors’ Control Account 60 marks (a) Drs Ledger Control A/C (32) Balance b/d [1] 21,190 Balance b/d [2] 510 Credit Note (i) [4] 36 Bills Rec’ble (iv) [4] 1,700 Invoice (ii) [4] 468 Cash Sales (iii) [4] 340 Disc Diss. (v) [4] 60 Interest (vi) [4] 19 Refund (vii) [4] 300 Balance c/d [1] 210 Balance c/d 20,413 22,623 22,623 Balance b/d 20,413 Balance b/d 210 (b) Adjusted Schedule (list) of Debtors’ Balances (22) € € Original Balance per list [3] 19,213 **** ADD: Invoice (ii) 1,040 [4] Refund (vii) 300 [4] 1,340 20,553 LESS: Credit Note (i) 288 [4] Interest (vi) 62 [4] – 350 Balance as per Adjusted Control A/C * [3] 20,203 i.e. 20,413 – 210
* award if student uses own fi gures **** Accept correct fi gure only Workings: Control List (i) 360 324 360 36 S/B 324 S/B 324 288 (ii) 52 S/B 520 520 S/B 520 1,040 468 (iii) 340 340 (iv) 850 S/B 850 1,700 (v) S/B 60 60 60 60 60 OK
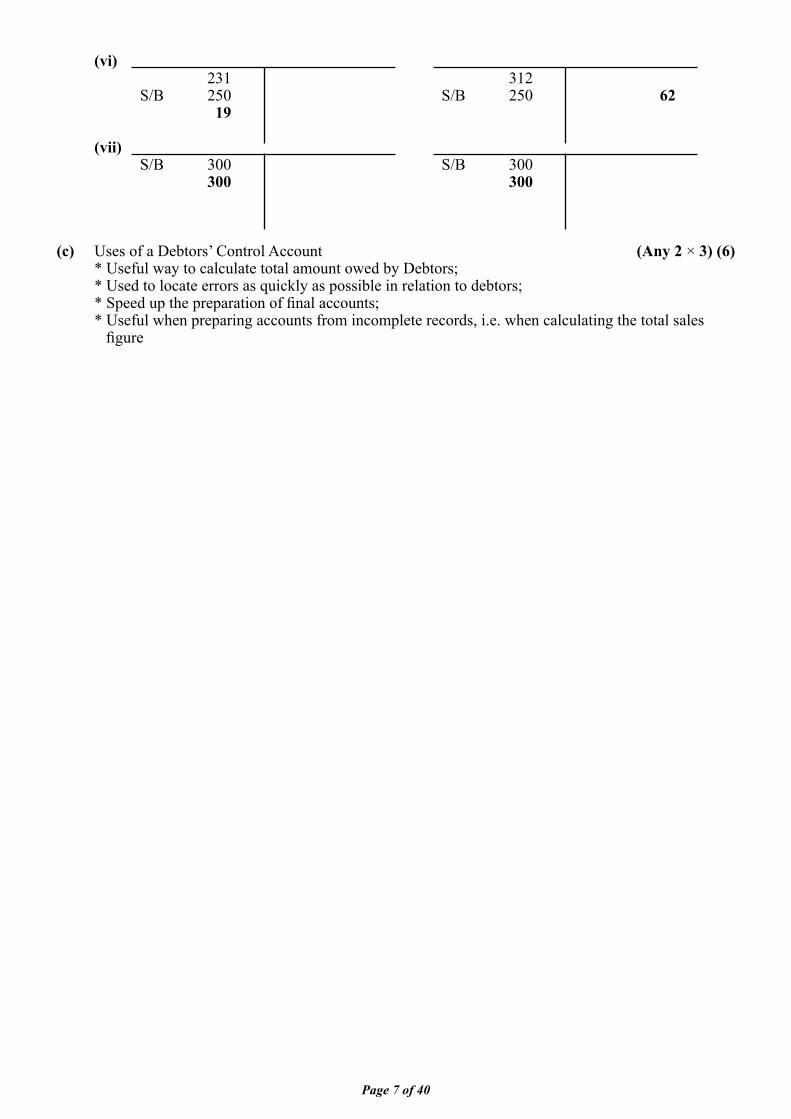
Page 7 of 40
(vi) 231 312 S/B 250 S/B 250 62 19 (vii) S/B 300 S/B 300 300 300
(c) Uses of a Debtors’ Control Account (Any 2 × 3) (6) * Useful way to calculate total amount owed by Debtors; * Used to locate errors as quickly as possible in relation to debtors; * Speed up the preparation of fi nal accounts; * Useful when preparing accounts from incomplete records, i.e. when calculating the total sales fi gure
Page 8 of 40
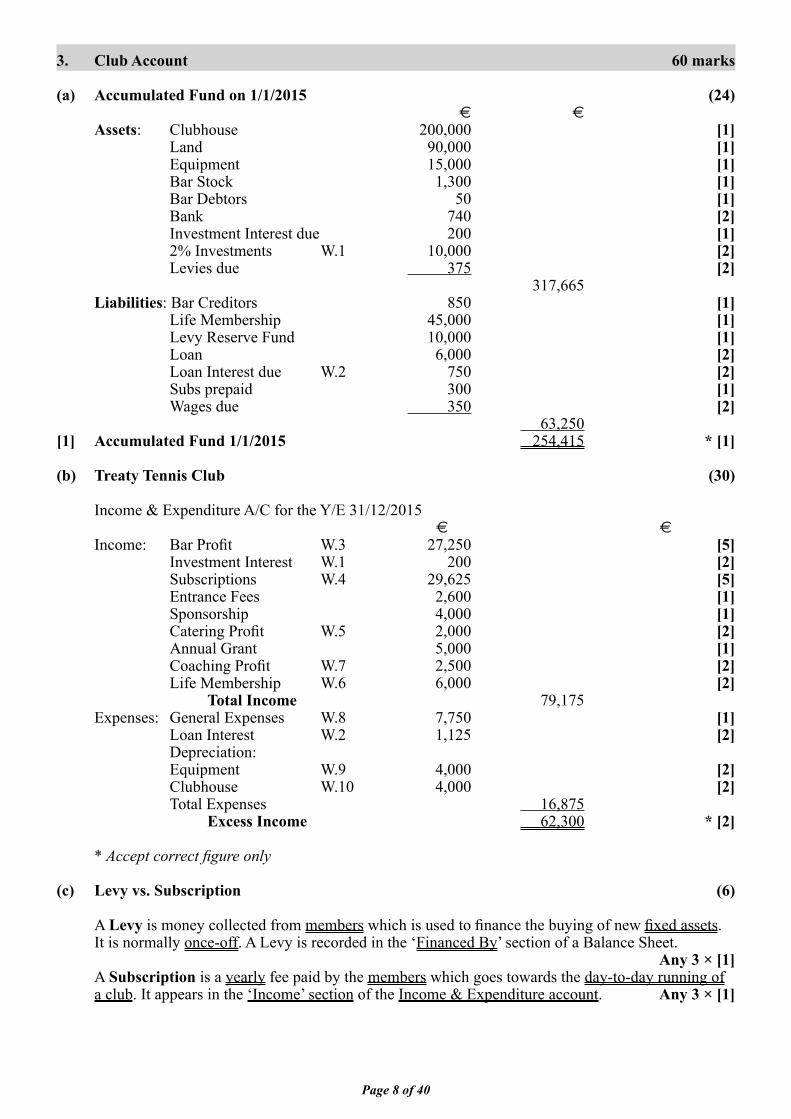
3. Club Account 60 marks
(a) Accumulated Fund on 1/1/2015 (24) € € Assets: Clubhouse 200,000 [1] Land 90,000 [1] Equipment 15,000 [1] Bar Stock 1,300 [1] Bar Debtors 50 [1] Bank 740 [2] Investment Interest due 200 [1] 2% Investments W.1 10,000 [2] Levies due 375 [2] 317,665 Liabilities: Bar Creditors 850 [1] Life Membership 45,000 [1] Levy Reserve Fund 10,000 [1] Loan 6,000 [2] Loan Interest due W.2 750 [2] Subs prepaid 300 [1] Wages due 350 [2] 63,250 [1] Accumulated Fund 1/1/2015 254,415 * [1]
(b) Treaty Tennis Club (30)
Income & Expenditure A/C for the Y/E 31/12/2015 € €
Income: Bar Profi t W.3 27,250 [5] Investment Interest W.1 200 [2] Subscriptions W.4 29,625 [5] Entrance Fees 2,600 [1] Sponsorship 4,000 [1] Catering Profi t W.5 2,000 [2] Annual Grant 5,000 [1] Coaching Profi t W.7 2,500 [2] Life Membership W.6 6,000 [2] Total Income 79,175 Expenses: General Expenses W.8 7,750 [1] Loan Interest W.2 1,125 [2] Depreciation: Equipment W.9 4,000 [2] Clubhouse W.10 4,000 [2] Total Expenses 16,875 Excess Income 62,300 * [2] * Accept correct fi gure only
(c) Levy vs. Subscription (6) A Levy is money collected from members which is used to fi nance the buying of new fi xed assets. It is normally once-off. A Levy is recorded in the ‘Financed By’ section of a Balance Sheet. Any 3 × [1] A Subscription is a yearly fee paid by the members which goes towards the day-to-day running of a club. It appears in the ‘Income’ section of the Income & Expenditure account. Any 3 × [1]
Page 9 of 40
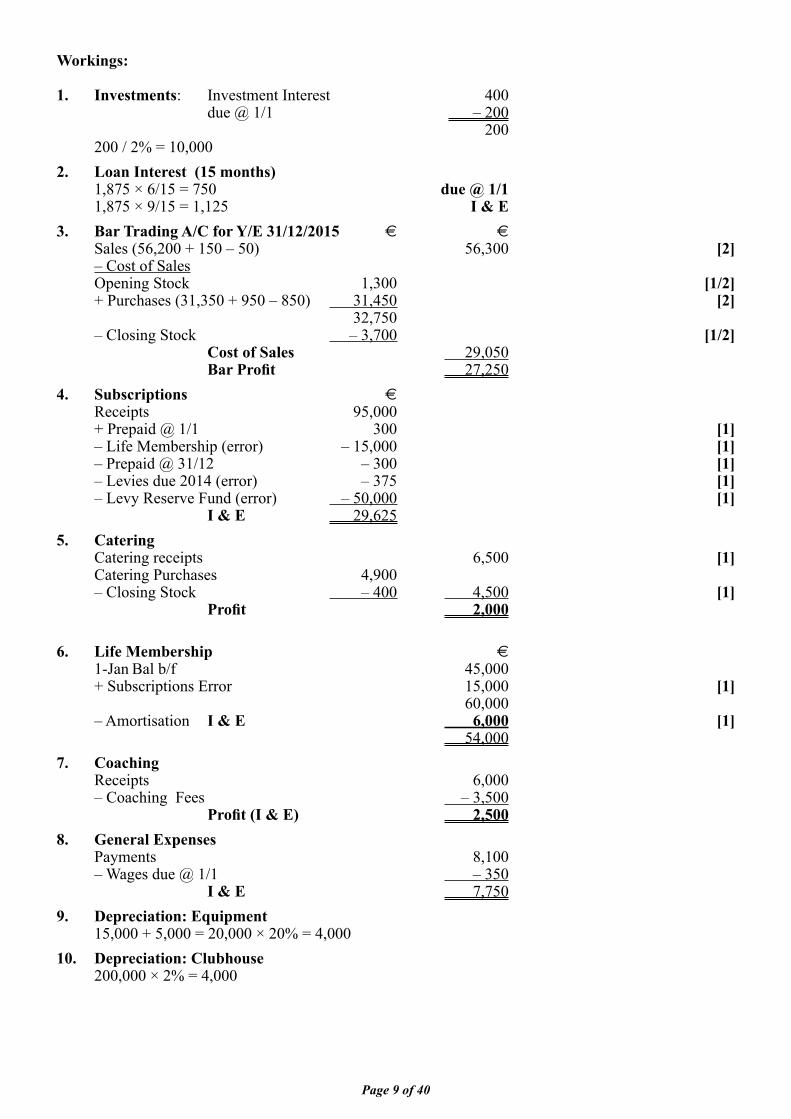
Workings:
1. Investments: Investment Interest 400 due @ 1/1 – 200 200 200 / 2% = 10,000 2. Loan Interest (15 months) 1,875 × 6/15 = 750 due @ 1/1 1,875 × 9/15 = 1,125 I & E3. Bar Trading A/C for Y/E 31/12/2015 € € Sales (56,200 + 150 – 50) 56,300 [2] – Cost of Sales Opening Stock 1,300 [1/2] + Purchases (31,350 + 950 – 850) 31,450 [2] 32,750 – Closing Stock – 3,700 [1/2] Cost of Sales 29,050 Bar Profi t 27,2504. Subscriptions €
Receipts 95,000 + Prepaid @ 1/1 300 [1] – Life Membership (error) – 15,000 [1] – Prepaid @ 31/12 – 300 [1] – Levies due 2014 (error) – 375 [1] – Levy Reserve Fund (error) – 50,000 [1] I & E 29,625 5. Catering Catering receipts 6,500 [1] Catering Purchases 4,900 – Closing Stock – 400 4,500 [1] Profi t 2,000 6. Life Membership €
1-Jan Bal b/f 45,000 + Subscriptions Error 15,000 [1] 60,000 – Amortisation I & E 6,000 [1] 54,0007. Coaching Receipts 6,000 – Coaching Fees – 3,500 Profi t (I & E) 2,500 8. General Expenses Payments 8,100 – Wages due @ 1/1 – 350 I & E 7,750 9. Depreciation: Equipment 15,000 + 5,000 = 20,000 × 20% = 4,00010. Depreciation: Clubhouse 200,000 × 2% = 4,000
Page 10 of 40
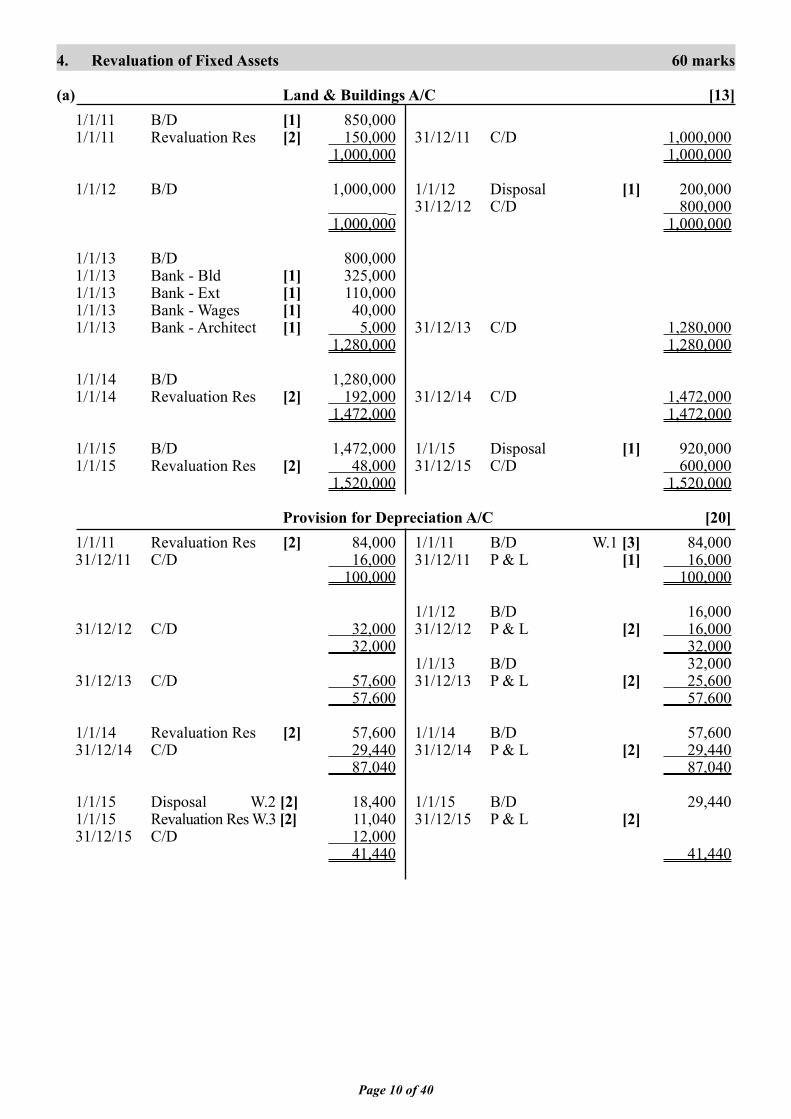
4. Revaluation of Fixed Assets 60 marks
(a) Land & Buildings A/C [13] 1/1/11 B/D [1] 850,000 1/1/11 Revaluation Res [2] 150,000 31/12/11 C/D 1,000,000 1,000,000 1,000,000
1/1/12 B/D 1,000,000 1/1/12 Disposal [1] 200,000 _ 31/12/12 C/D 800,000 1,000,000 1,000,000
1/1/13 B/D 800,000 1/1/13 Bank - Bld [1] 325,000 1/1/13 Bank - Ext [1] 110,000 1/1/13 Bank - Wages [1] 40,000 1/1/13 Bank - Architect [1] 5,000 31/12/13 C/D 1,280,000 1,280,000 1,280,000
1/1/14 B/D 1,280,000 1/1/14 Revaluation Res [2] 192,000 31/12/14 C/D 1,472,000 1,472,000 1,472,000 1/1/15 B/D 1,472,000 1/1/15 Disposal [1] 920,000 1/1/15 Revaluation Res [2] 48,000 31/12/15 C/D 600,000 1,520,000 1,520,000
Provision for Depreciation A/C [20] 1/1/11 Revaluation Res [2] 84,000 1/1/11 B/D W.1 [3] 84,000 31/12/11 C/D 16,000 31/12/11 P & L [1] 16,000 100,000 100,000
1/1/12 B/D 16,000 31/12/12 C/D 32,000 31/12/12 P & L [2] 16,000 32,000 32,000 1/1/13 B/D 32,000 31/12/13 C/D 57,600 31/12/13 P & L [2] 25,600 57,600 57,600 1/1/14 Revaluation Res [2] 57,600 1/1/14 B/D 57,600 31/12/14 C/D 29,440 31/12/14 P & L [2] 29,440 87,040 87,040 1/1/15 Disposal W.2 [2] 18,400 1/1/15 B/D 29,440 1/1/15 Revaluation Res W.3 [2] 11,040 31/12/15 P & L [2] 31/12/15 C/D 12,000 41,440 41,440
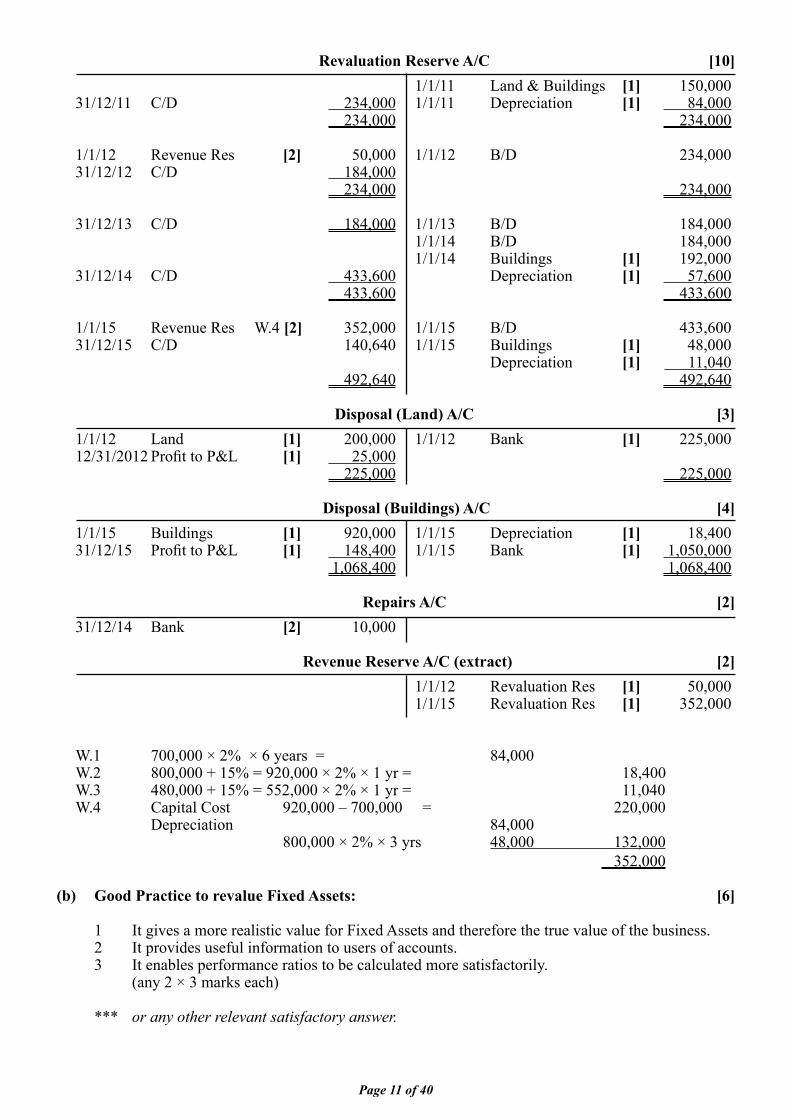
Page 11 of 40
Revaluation Reserve A/C [10] 1/1/11 Land & Buildings [1] 150,000 31/12/11 C/D 234,000 1/1/11 Depreciation [1] 84,000 234,000 234,000
1/1/12 Revenue Res [2] 50,000 1/1/12 B/D 234,000 31/12/12 C/D 184,000 234,000 234,000
31/12/13 C/D 184,000 1/1/13 B/D 184,000 1/1/14 B/D 184,000 1/1/14 Buildings [1] 192,000 31/12/14 C/D 433,600 Depreciation [1] 57,600 433,600 433,600
1/1/15 Revenue Res W.4 [2] 352,000 1/1/15 B/D 433,600 31/12/15 C/D 140,640 1/1/15 Buildings [1] 48,000 Depreciation [1] 11,040 492,640 492,640
Disposal (Land) A/C [3] 1/1/12 Land [1] 200,000 1/1/12 Bank [1] 225,000 12/31/2012 Profi t to P&L [1] 25,000 225,000 225,000 Disposal (Buildings) A/C [4] 1/1/15 Buildings [1] 920,000 1/1/15 Depreciation [1] 18,400 31/12/15 Profi t to P&L [1] 148,400 1/1/15 Bank [1] 1,050,000 1,068,400 1,068,400 Repairs A/C [2] 31/12/14 Bank [2] 10,000 Revenue Reserve A/C (extract) [2] 1/1/12 Revaluation Res [1] 50,000 1/1/15 Revaluation Res [1] 352,000 W.1 700,000 × 2% × 6 years = 84,000 W.2 800,000 + 15% = 920,000 × 2% × 1 yr = 18,400 W.3 480,000 + 15% = 552,000 × 2% × 1 yr = 11,040 W.4 Capital Cost 920,000 – 700,000 = 220,000 Depreciation 84,000 800,000 × 2% × 3 yrs 48,000 132,000 352,000
(b) Good Practice to revalue Fixed Assets: [6]
1 It gives a more realistic value for Fixed Assets and therefore the true value of the business. 2 It provides useful information to users of accounts. 3 It enables performance ratios to be calculated more satisfactorily. (any 2 × 3 marks each) *** or any other relevant satisfactory answer.
Page 12 of 40
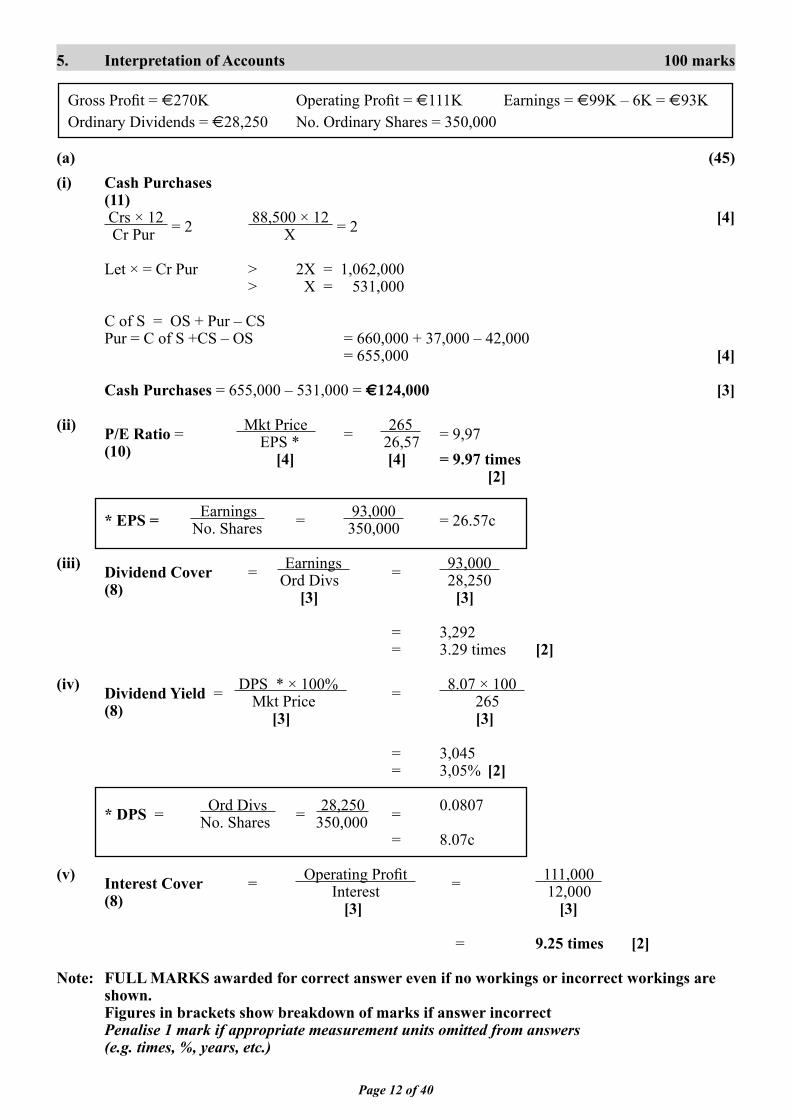
5. Interpretation of Accounts 100 marks
Gross Profi t = €270K Operating Profi t = €111K Earnings = €99K – 6K = €93K Ordinary Dividends = €28,250 No. Ordinary Shares = 350,000
(a) (45)(i) Cash Purchases (11) Crs × 12 = 2 88,500 × 12 = 2 [4] Cr Pur X Let × = Cr Pur > 2X = 1,062,000 > X = 531,000
C of S = OS + Pur – CS Pur = C of S +CS – OS = 660,000 + 37,000 – 42,000 = 655,000 [4]
Cash Purchases = 655,000 – 531,000 = €124,000 [3] (ii) P/E Ratio = Mkt Price = 265 = 9,97 (10) EPS * 26,57 [4] [4] = 9.97 times [2] * EPS = Earnings = 93,000 = 26.57c No. Shares 350,000 (iii) Dividend Cover = Earnings = 93,000 (8) Ord Divs 28,250 [3] [3] = 3,292 = 3.29 times [2] (iv) Dividend Yield = DPS * × 100% = 8.07 × 100 (8) Mkt Price 265 [3] [3]
= 3,045 = 3,05% [2] * DPS = Ord Divs = 28,250 = 0.0807 No. Shares 350,000 = 8.07c
(v) Interest Cover = Operating Profi t = 111,000 (8) Interest 12,000 [3] [3] = 9.25 times [2] Note: FULL MARKS awarded for correct answer even if no workings or incorrect workings are shown. Figures in brackets show breakdown of marks if answer incorrect Penalise 1 mark if appropriate measurement units omitted from answers (e.g. times, %, years, etc.)
Page 13 of 40
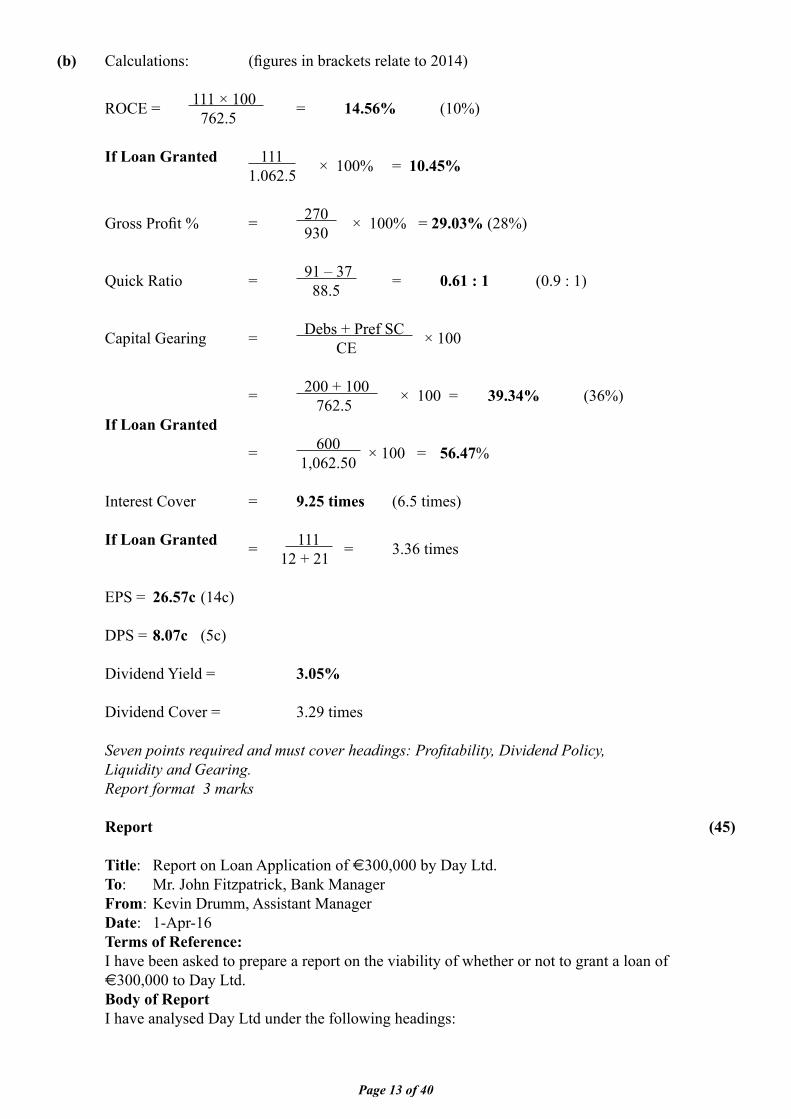
(b) Calculations: (fi gures in brackets relate to 2014) ROCE = 111 × 100 = 14.56% (10%) 762.5
If Loan Granted 111 × 100% = 10.45% 1.062.5 Gross Profi t % = 270 × 100% = 29.03% (28%) 930
Quick Ratio = 91 – 37 = 0.61 : 1 (0.9 : 1) 88.5
Capital Gearing = Debs + Pref SC × 100 CE = 200 + 100 × 100 = 39.34% (36%) 762.5 If Loan Granted = 600 × 100 = 56.47% 1,062.50 Interest Cover = 9.25 times (6.5 times) If Loan Granted = 111 = 3.36 times 12 + 21 EPS = 26.57c (14c) DPS = 8.07c (5c) Dividend Yield = 3.05% Dividend Cover = 3.29 times Seven points required and must cover headings: Profi tability, Dividend Policy, Liquidity and Gearing. Report format 3 marks Report (45)
Title: Report on Loan Application of €300,000 by Day Ltd. To: Mr. John Fitzpatrick, Bank Manager From: Kevin Drumm, Assistant Manager Date: 1-Apr-16 Terms of Reference: I have been asked to prepare a report on the viability of whether or not to grant a loan of €300,000 to Day Ltd. Body of Report I have analysed Day Ltd under the following headings:
Page 14 of 40
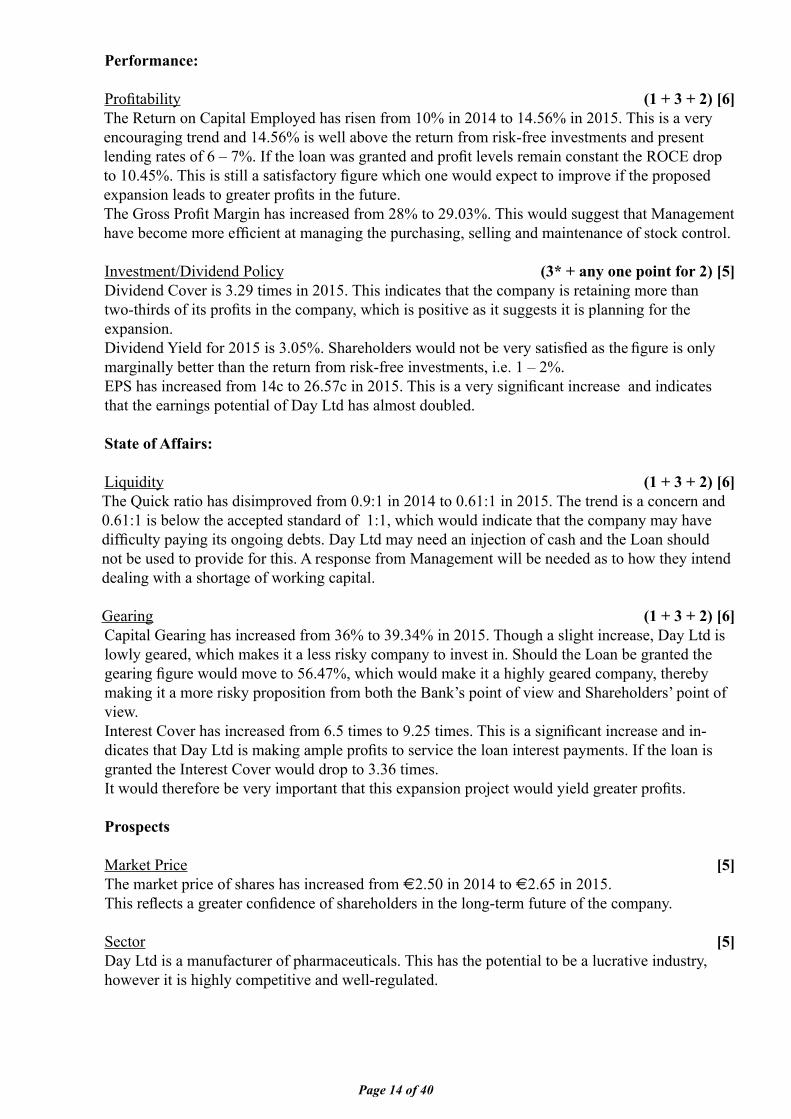
Performance:
Profi tability (1 + 3 + 2) [6]The Return on Capital Employed has risen from 10% in 2014 to 14.56% in 2015. This is a very encouraging trend and 14.56% is well above the return from risk-free investments and present lending rates of 6 – 7%. If the loan was granted and profi t levels remain constant the ROCE drop to 10.45%. This is still a satisfactory fi gure which one would expect to improve if the proposed expansion leads to greater profi ts in the future. The Gross Profi t Margin has increased from 28% to 29.03%. This would suggest that Management have become more effi cient at managing the purchasing, selling and maintenance of stock control.
Investment/Dividend Policy (3* + any one point for 2) [5] Dividend Cover is 3.29 times in 2015. This indicates that the company is retaining more than two-thirds of its profi ts in the company, which is positive as it suggests it is planning for the expansion. Dividend Yield for 2015 is 3.05%. Shareholders would not be very satisfi ed as the fi gure is only marginally better than the return from risk-free investments, i.e. 1 – 2%. EPS has increased from 14c to 26.57c in 2015. This is a very signifi cant increase and indicates that the earnings potential of Day Ltd has almost doubled. State of Affairs:
Liquidity (1 + 3 + 2) [6]The Quick ratio has disimproved from 0.9:1 in 2014 to 0.61:1 in 2015. The trend is a concern and 0.61:1 is below the accepted standard of 1:1, which would indicate that the company may have diffi culty paying its ongoing debts. Day Ltd may need an injection of cash and the Loan should not be used to provide for this. A response from Management will be needed as to how they intend dealing with a shortage of working capital. Gearing (1 + 3 + 2) [6]Capital Gearing has increased from 36% to 39.34% in 2015. Though a slight increase, Day Ltd is lowly geared, which makes it a less risky company to invest in. Should the Loan be granted the gearing fi gure would move to 56.47%, which would make it a highly geared company, thereby making it a more risky proposition from both the Bank’s point of view and Shareholders’ point of view. Interest Cover has increased from 6.5 times to 9.25 times. This is a signifi cant increase and in-dicates that Day Ltd is making ample profi ts to service the loan interest payments. If the loan is granted the Interest Cover would drop to 3.36 times.It would therefore be very important that this expansion project would yield greater profi ts.
Prospects Market Price [5] The market price of shares has increased from €2.50 in 2014 to €2.65 in 2015. This refl ects a greater confi dence of shareholders in the long-term future of the company. Sector [5] Day Ltd is a manufacturer of pharmaceuticals. This has the potential to be a lucrative industry, however it is highly competitive and well-regulated.
Page 15 of 40
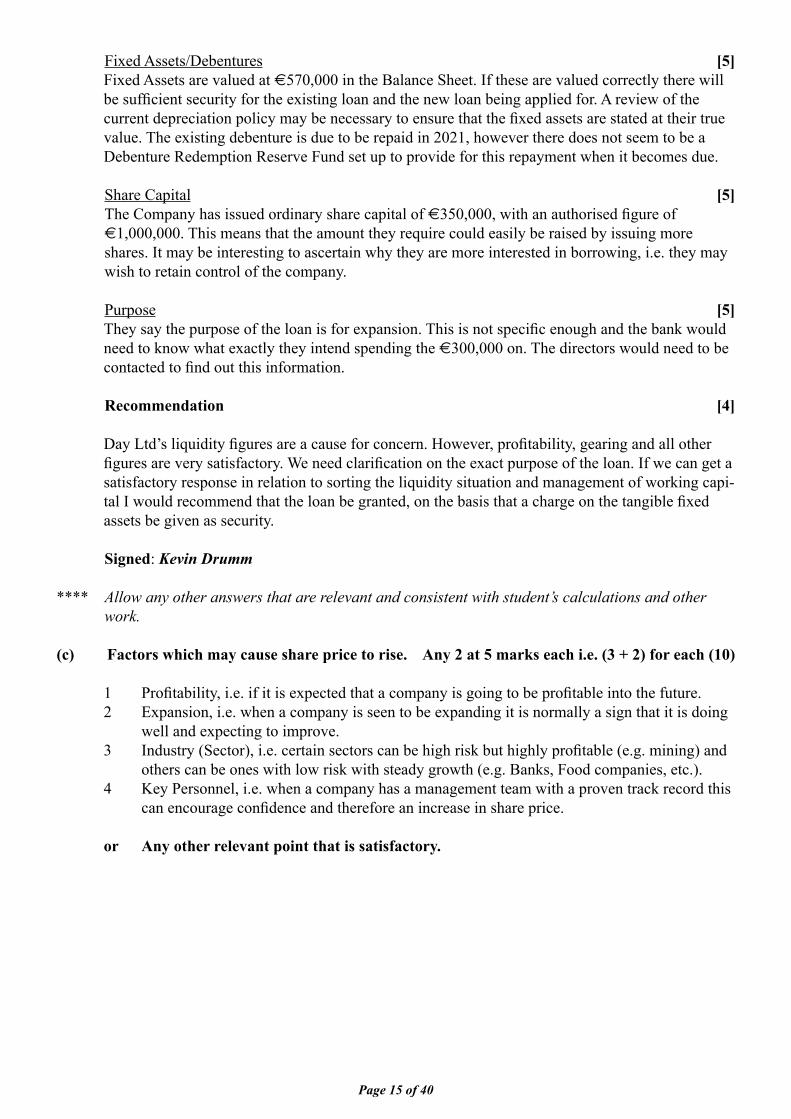
Fixed Assets/Debentures [5]Fixed Assets are valued at €570,000 in the Balance Sheet. If these are valued correctly there will be suffi cient security for the existing loan and the new loan being applied for. A review of the current depreciation policy may be necessary to ensure that the fi xed assets are stated at their true value. The existing debenture is due to be repaid in 2021, however there does not seem to be a Debenture Redemption Reserve Fund set up to provide for this repayment when it becomes due.
Share Capital [5]The Company has issued ordinary share capital of €350,000, with an authorised fi gure of €1,000,000. This means that the amount they require could easily be raised by issuing more shares. It may be interesting to ascertain why they are more interested in borrowing, i.e. they may wish to retain control of the company. Purpose [5]They say the purpose of the loan is for expansion. This is not specifi c enough and the bank would need to know what exactly they intend spending the €300,000 on. The directors would need to be contacted to fi nd out this information.
Recommendation [4]
Day Ltd’s liquidity fi gures are a cause for concern. However, profi tability, gearing and all other fi gures are very satisfactory. We need clarifi cation on the exact purpose of the loan. If we can get a satisfactory response in relation to sorting the liquidity situation and management of working capi-tal I would recommend that the loan be granted, on the basis that a charge on the tangible fi xed assets be given as security.
Signed: Kevin Drumm **** Allow any other answers that are relevant and consistent with student’s calculations and other work. (c) Factors which may cause share price to rise. Any 2 at 5 marks each i.e. (3 + 2) for each (10)
1 Profi tability, i.e. if it is expected that a company is going to be profi table into the future. 2 Expansion, i.e. when a company is seen to be expanding it is normally a sign that it is doing
well and expecting to improve. 3 Industry (Sector), i.e. certain sectors can be high risk but highly profi table (e.g. mining) and
others can be ones with low risk with steady growth (e.g. Banks, Food companies, etc.). 4 Key Personnel, i.e. when a company has a management team with a proven track record this
can encourage confi dence and therefore an increase in share price.
or Any other relevant point that is satisfactory.
Page 16 of 40
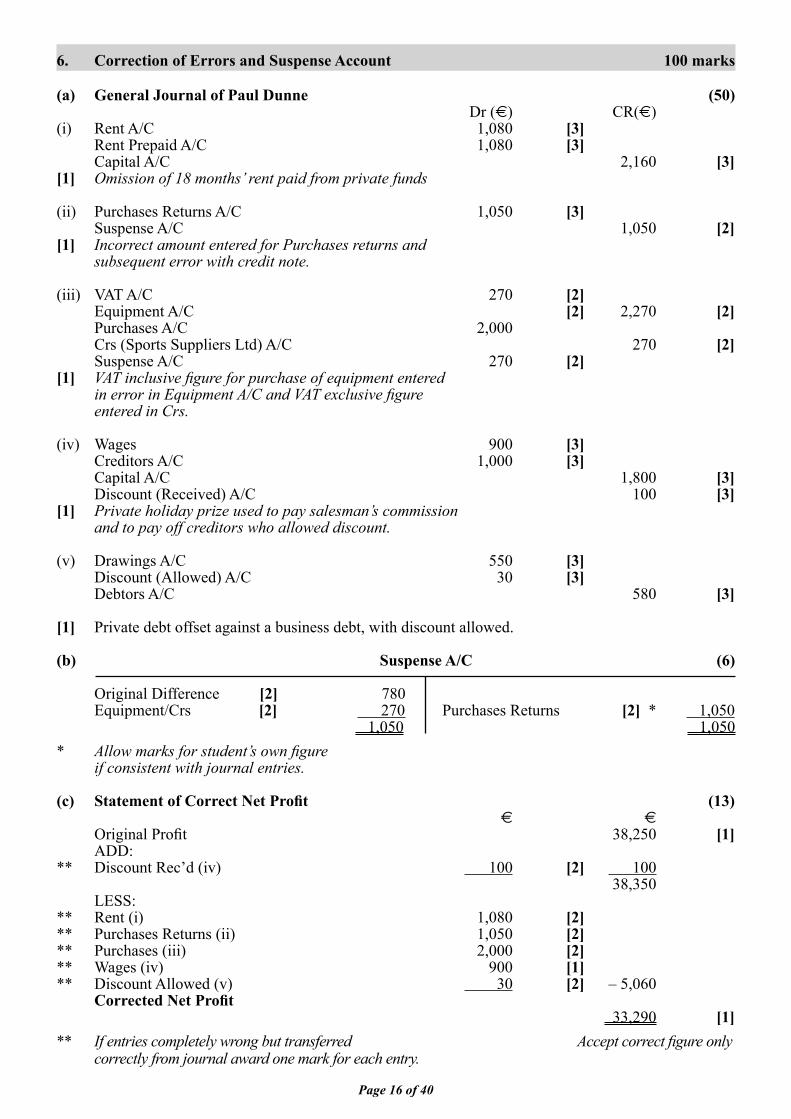
6. Correction of Errors and Suspense Account 100 marks
(a) General Journal of Paul Dunne (50) Dr (€) CR(€)(i) Rent A/C 1,080 [3] Rent Prepaid A/C 1,080 [3] Capital A/C 2,160 [3][1] Omission of 18 months’ rent paid from private funds
(ii) Purchases Returns A/C 1,050 [3] Suspense A/C 1,050 [2][1] Incorrect amount entered for Purchases returns and subsequent error with credit note.
(iii) VAT A/C 270 [2] Equipment A/C [2] 2,270 [2] Purchases A/C 2,000 Crs (Sports Suppliers Ltd) A/C 270 [2] Suspense A/C 270 [2][1] VAT inclusive fi gure for purchase of equipment entered in error in Equipment A/C and VAT exclusive fi gure entered in Crs.
(iv) Wages 900 [3] Creditors A/C 1,000 [3] Capital A/C 1,800 [3] Discount (Received) A/C 100 [3][1] Private holiday prize used to pay salesman’s commission and to pay off creditors who allowed discount. (v) Drawings A/C 550 [3] Discount (Allowed) A/C 30 [3] Debtors A/C 580 [3]
[1] Private debt offset against a business debt, with discount allowed.
(b) Suspense A/C (6)
Original Difference [2] 780 Equipment/Crs [2] 270 Purchases Returns [2] * 1,050 1,050 1,050* Allow marks for student’s own fi gure if consistent with journal entries.
(c) Statement of Correct Net Profi t (13) € €
Original Profi t 38,250 [1] ADD:** Discount Rec’d (iv) 100 [2] 100 38,350 LESS:** Rent (i) 1,080 [2]** Purchases Returns (ii) 1,050 [2] ** Purchases (iii) 2,000 [2]** Wages (iv) 900 [1]** Discount Allowed (v) 30 [2] – 5,060 Corrected Net Profi t 33,290 [1]** If entries completely wrong but transferred Accept correct fi gure only correctly from journal award one mark for each entry.
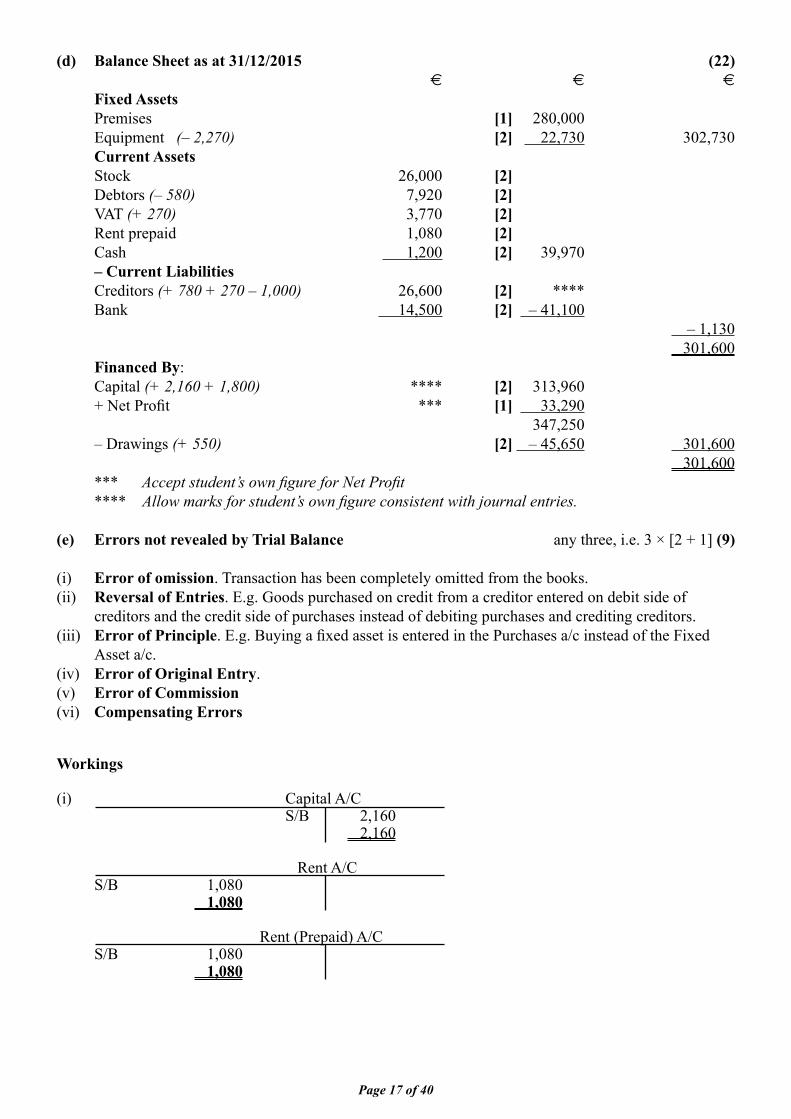
Page 17 of 40
(d) Balance Sheet as at 31/12/2015 (22) € € €
Fixed Assets Premises [1] 280,000 Equipment (– 2,270) [2] 22,730 302,730 Current Assets Stock 26,000 [2] Debtors (– 580) 7,920 [2] VAT (+ 270) 3,770 [2] Rent prepaid 1,080 [2] Cash 1,200 [2] 39,970 – Current Liabilities Creditors (+ 780 + 270 – 1,000) 26,600 [2] **** Bank 14,500 [2] – 41,100 – 1,130 301,600 Financed By: Capital (+ 2,160 + 1,800) **** [2] 313,960 + Net Profi t *** [1] 33,290 347,250 – Drawings (+ 550) [2] – 45,650 301,600 301,600 *** Accept student’s own fi gure for Net Profi t **** Allow marks for student’s own fi gure consistent with journal entries.
(e) Errors not revealed by Trial Balance any three, i.e. 3 × [2 + 1] (9) (i) Error of omission. Transaction has been completely omitted from the books. (ii) Reversal of Entries. E.g. Goods purchased on credit from a creditor entered on debit side of creditors and the credit side of purchases instead of debiting purchases and crediting creditors. (iii) Error of Principle. E.g. Buying a fi xed asset is entered in the Purchases a/c instead of the Fixed Asset a/c.(iv) Error of Original Entry. (v) Error of Commission (vi) Compensating Errors
Workings
(i) Capital A/C S/B 2,160 2,160
Rent A/C S/B 1,080 1,080 Rent (Prepaid) A/C S/B 1,080 1,080
Page 18 of 40
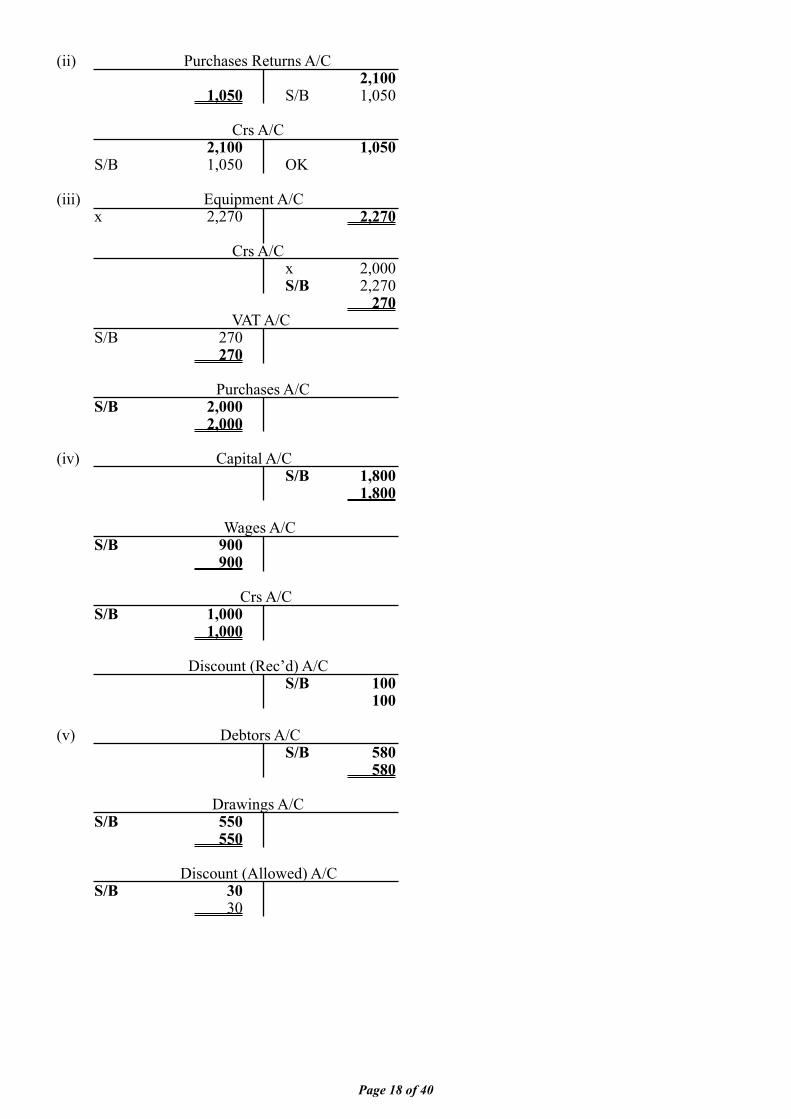
(ii) Purchases Returns A/C 2,100 1,050 S/B 1,050 Crs A/C 2,100 1,050 S/B 1,050 OK (iii) Equipment A/C x 2,270 2,270
Crs A/C x 2,000 S/B 2,270 270 VAT A/C S/B 270 270
Purchases A/C S/B 2,000 2,000 (iv) Capital A/C S/B 1,800 1,800 Wages A/C S/B 900 900 Crs A/C S/B 1,000 1,000 Discount (Rec’d) A/C S/B 100 100 (v) Debtors A/C S/B 580 580 Drawings A/C S/B 550 550 Discount (Allowed) A/C S/B 30 30
Page 19 of 40
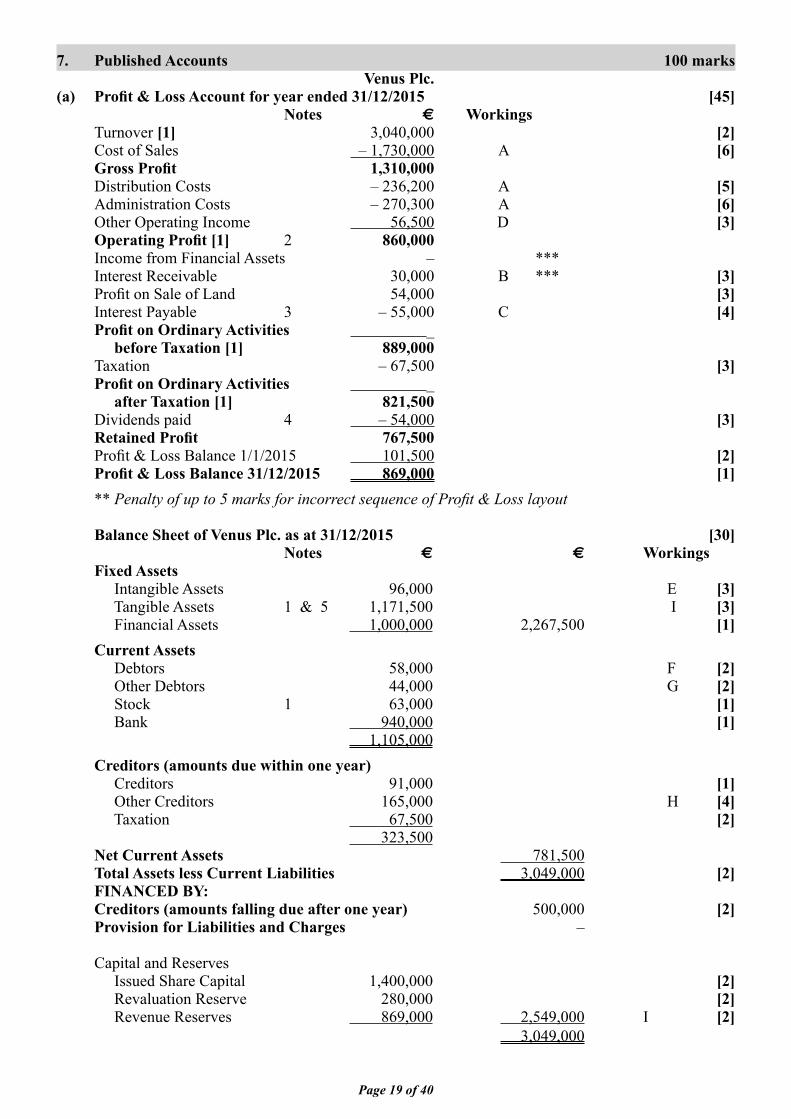
7. Published Accounts 100 marks Venus Plc.(a) Profi t & Loss Account for year ended 31/12/2015 [45] Notes € Workings Turnover [1] 3,040,000 [2] Cost of Sales – 1,730,000 A [6] Gross Profi t 1,310,000 Distribution Costs – 236,200 A [5] Administration Costs – 270,300 A [6] Other Operating Income 56,500 D [3] Operating Profi t [1] 2 860,000 Income from Financial Assets – *** Interest Receivable 30,000 B *** [3] Profi t on Sale of Land 54,000 [3] Interest Payable 3 – 55,000 C [4] Profi t on Ordinary Activities _ before Taxation [1] 889,000 Taxation – 67,500 [3] Profi t on Ordinary Activities _ after Taxation [1] 821,500 Dividends paid 4 – 54,000 [3] Retained Profi t 767,500 Profi t & Loss Balance 1/1/2015 101,500 [2] Profi t & Loss Balance 31/12/2015 869,000 [1] ** Penalty of up to 5 marks for incorrect sequence of Profi t & Loss layout Balance Sheet of Venus Plc. as at 31/12/2015 [30] Notes € € Workings Fixed Assets Intangible Assets 96,000 E [3] Tangible Assets 1 & 5 1,171,500 I [3] Financial Assets 1,000,000 2,267,500 [1] Current Assets Debtors 58,000 F [2] Other Debtors 44,000 G [2] Stock 1 63,000 [1] Bank 940,000 [1] 1,105,000 Creditors (amounts due within one year) Creditors 91,000 [1] Other Creditors 165,000 H [4] Taxation 67,500 [2] 323,500 Net Current Assets 781,500 Total Assets less Current Liabilities 3,049,000 [2] FINANCED BY: Creditors (amounts falling due after one year) 500,000 [2] Provision for Liabilities and Charges –
Capital and Reserves Issued Share Capital 1,400,000 [2] Revaluation Reserve 280,000 [2] Revenue Reserves 869,000 2,549,000 I [2] 3,049,000
Page 20 of 40
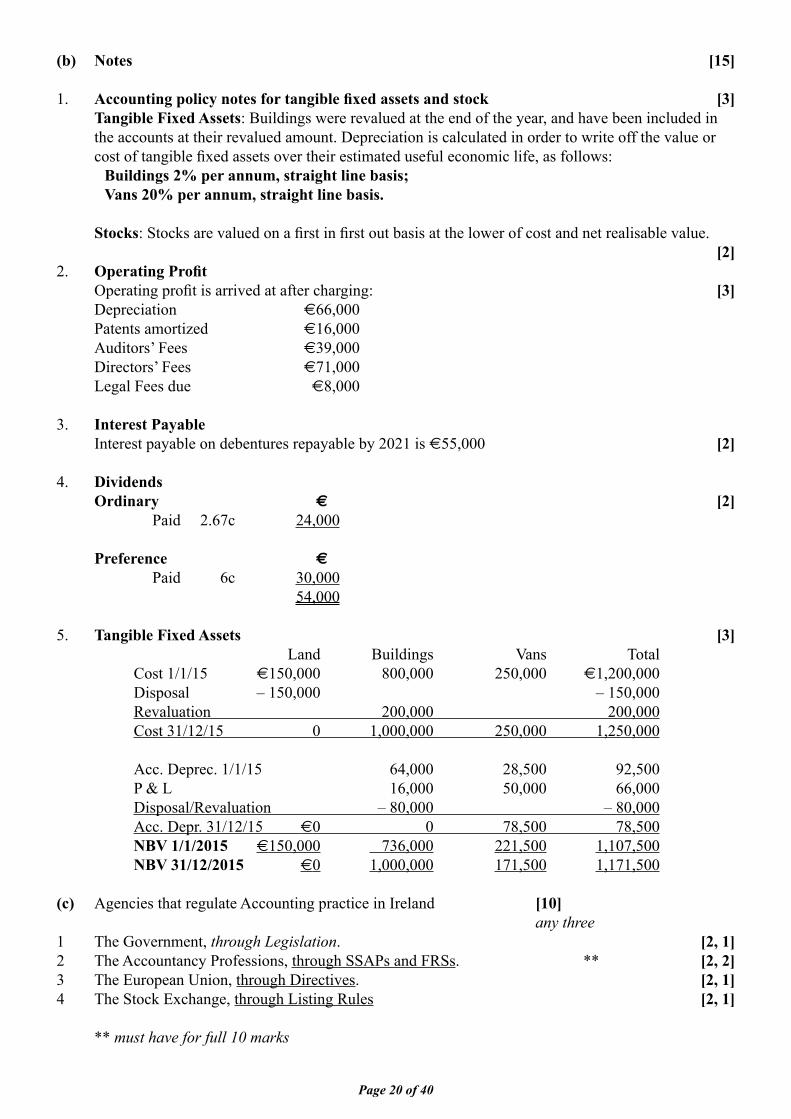
(b) Notes [15]
1. Accounting policy notes for tangible fi xed assets and stock [3] Tangible Fixed Assets: Buildings were revalued at the end of the year, and have been included in the accounts at their revalued amount. Depreciation is calculated in order to write off the value or cost of tangible fi xed assets over their estimated useful economic life, as follows: Buildings 2% per annum, straight line basis; Vans 20% per annum, straight line basis. Stocks: Stocks are valued on a fi rst in fi rst out basis at the lower of cost and net realisable value. [2]2. Operating Profi t Operating profi t is arrived at after charging: [3] Depreciation €66,000 Patents amortized €16,000 Auditors’ Fees €39,000 Directors’ Fees €71,000 Legal Fees due €8,000 3. Interest Payable Interest payable on debentures repayable by 2021 is €55,000 [2] 4. Dividends Ordinary € [2] Paid 2.67c 24,000 Preference € Paid 6c 30,000 54,000
5. Tangible Fixed Assets [3] Land Buildings Vans Total Cost 1/1/15 €150,000 800,000 250,000 €1,200,000 Disposal – 150,000 – 150,000 Revaluation 200,000 200,000 Cost 31/12/15 0 1,000,000 250,000 1,250,000
Acc. Deprec. 1/1/15 64,000 28,500 92,500 P & L 16,000 50,000 66,000 Disposal/Revaluation – 80,000 – 80,000 Acc. Depr. 31/12/15 €0 0 78,500 78,500 NBV 1/1/2015 €150,000 736,000 221,500 1,107,500 NBV 31/12/2015 €0 1,000,000 171,500 1,171,500 (c) Agencies that regulate Accounting practice in Ireland [10] any three1 The Government, through Legislation. [2, 1]2 The Accountancy Professions, through SSAPs and FRSs. ** [2, 2]3 The European Union, through Directives. [2, 1]4 The Stock Exchange, through Listing Rules [2, 1]
** must have for full 10 marks
Page 21 of 40
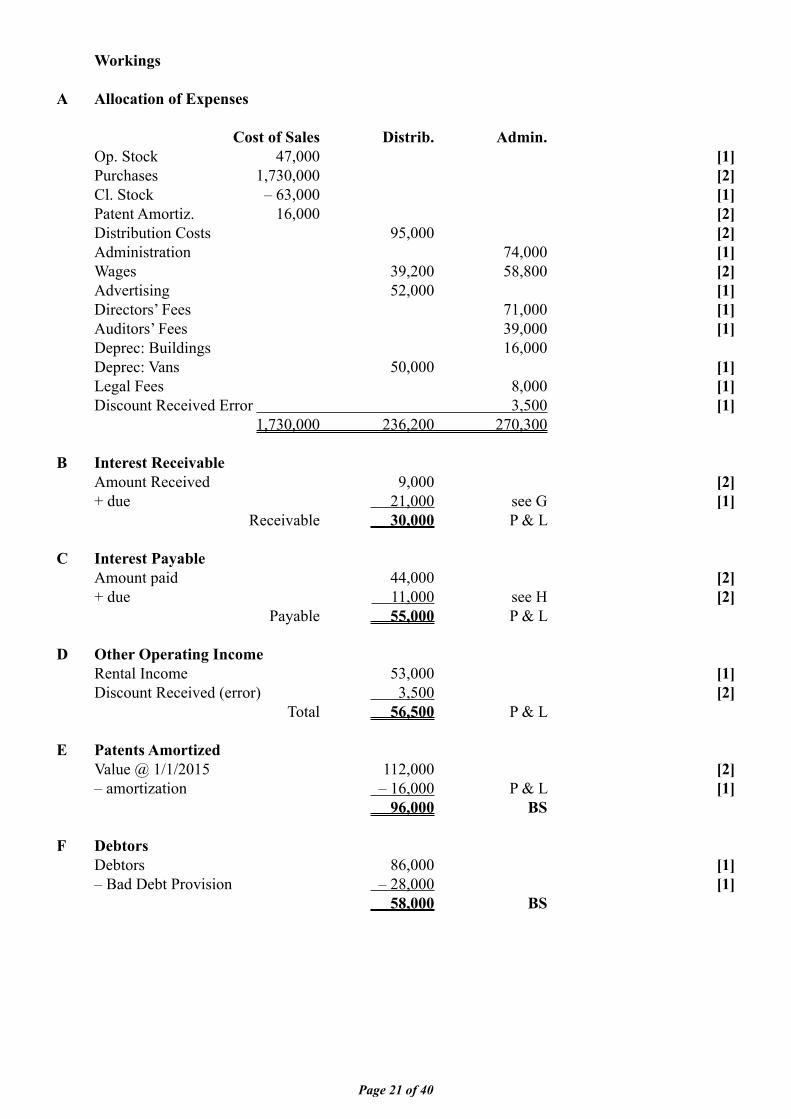
Workings A Allocation of Expenses
Cost of Sales Distrib. Admin. Op. Stock 47,000 [1] Purchases 1,730,000 [2] Cl. Stock – 63,000 [1] Patent Amortiz. 16,000 [2] Distribution Costs 95,000 [2] Administration 74,000 [1] Wages 39,200 58,800 [2] Advertising 52,000 [1] Directors’ Fees 71,000 [1] Auditors’ Fees 39,000 [1] Deprec: Buildings 16,000 Deprec: Vans 50,000 [1] Legal Fees 8,000 [1] Discount Received Error 3,500 [1] 1,730,000 236,200 270,300 B Interest Receivable Amount Received 9,000 [2] + due 21,000 see G [1] Receivable 30,000 P & L C Interest Payable Amount paid 44,000 [2] + due 11,000 see H [2] Payable 55,000 P & L D Other Operating Income Rental Income 53,000 [1] Discount Received (error) 3,500 [2] Total 56,500 P & L E Patents Amortized Value @ 1/1/2015 112,000 [2] – amortization – 16,000 P & L [1] 96,000 BS F Debtors Debtors 86,000 [1] – Bad Debt Provision – 28,000 [1] 58,000 BS
Page 22 of 40
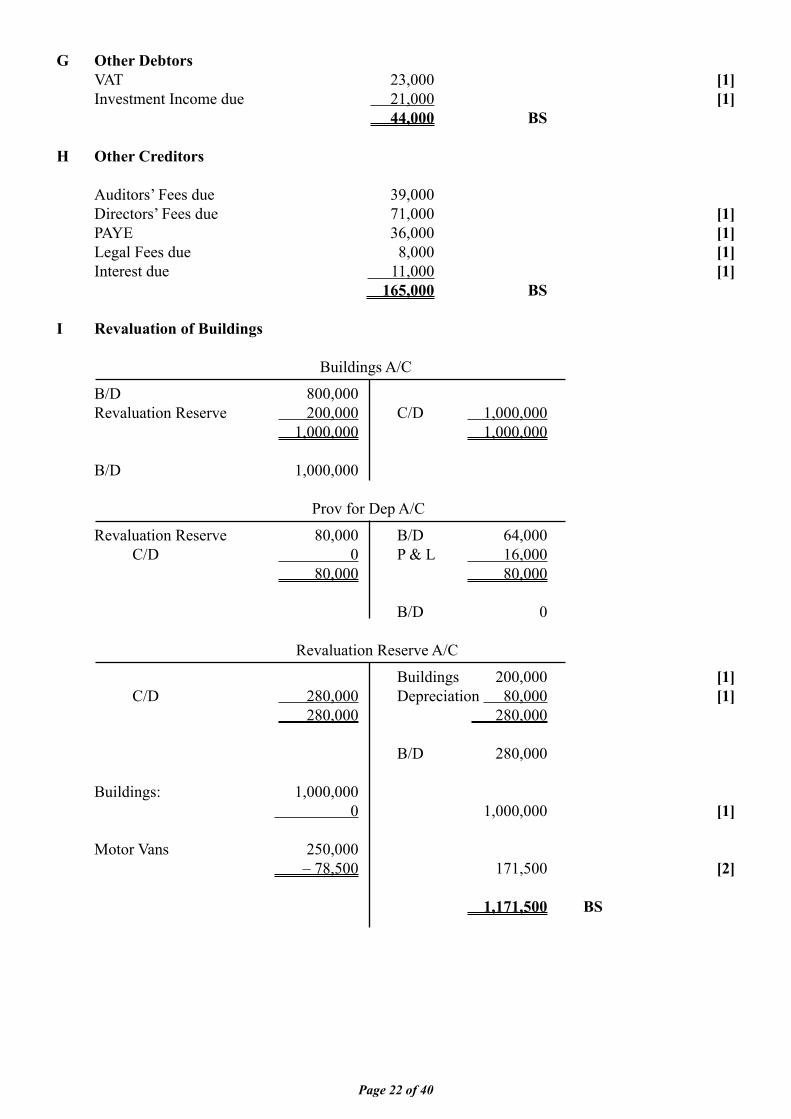
G Other Debtors VAT 23,000 [1] Investment Income due 21,000 [1] 44,000 BS
H Other Creditors Auditors’ Fees due 39,000 Directors’ Fees due 71,000 [1] PAYE 36,000 [1] Legal Fees due 8,000 [1] Interest due 11,000 [1] 165,000 BS I Revaluation of Buildings Buildings A/C
B/D 800,000 Revaluation Reserve 200,000 C/D 1,000,000 1,000,000 1,000,000 B/D 1,000,000 Prov for Dep A/C
Revaluation Reserve 80,000 B/D 64,000 C/D 0 P & L 16,000 80,000 80,000 B/D 0 Revaluation Reserve A/C
Buildings 200,000 [1] C/D 280,000 Depreciation 80,000 [1] 280,000 280,000 B/D 280,000 Buildings: 1,000,000 0 1,000,000 [1]
Motor Vans 250,000 – 78,500 171,500 [2] 1,171,500 BS
Page 23 of 40
8.
Prod
uct C
ostin
g
80 m
arks
(A)
(i)
O
verh
ead
Ana
lysi
s She
et
(27)
Bas
is o
f
Prod
uctio
n D
epts
Ser
vice
Dep
ts
Ove
rhea
d
A
ppor
tionm
ent
Tota
l (€
)
Ass
embl
y *
**
F
inis
hing
Adm
in
***
Mar
ketin
g
Mat
eria
ls H
andl
ing
Cos
ts
[1]
Dire
ct M
ater
ials
15
,000
9,
000
<[1]
> 6,
000
Ligh
t & H
eat
Vo
lum
e 24
,600
12
,300
<[1
]>
6,15
0 3,
075 <
[1]>
3,
075
A
dmin
istra
tion
Cos
ts
N
o. o
f Em
ploy
ees
13,5
00
4,50
0 <[
1]>
4,50
0 2,
700 <
[1]>
1,
800
M
achi
ne R
epai
rs
[1]
Mac
hine
Hou
rs
14,4
00
10,8
00 <
[1]>
3,
600
In
dire
ct L
abou
r
Labo
ur H
ours
16
,800
10
,500
<[1
]>
6,30
0
Mac
hine
ry In
sura
nce
M
achi
ne V
alua
tion
8,70
0 5,
220
<[1]
> 3,
480
Fa
ctor
y B
ldgs
Insu
ranc
e
Floo
r Spa
ce
1,10
0 66
0 <[
1]>
330
55 <[
1]>
55
M
achi
nery
Dep
reci
atio
n [1
] M
achi
ne V
alua
tion
10,8
00
6,48
0 <[
1]>
4320
R
ent &
Rat
es
Fl
oor S
pace
9,
700
5,82
0 <[
1]>
2,91
0 48
5 <[1
]>
485
Supe
rvis
ors’
Sala
ries
[1]
No.
of E
mpl
oyee
s 57
,900
19
,300
<[1
]>
19,3
00
11,5
80 <[
1]>
7,72
0
Can
teen
Cos
ts
N
o. o
f Em
ploy
ees
21,
600
7,
200
<[1]
> 7
,200
4
,320
<[1]
> 2
,880
194,
100
91,7
80
64
,090
22
,215
16,0
15
(ii)
Rea
ppor
tion
Serv
Dep
t - A
dmin
M
achi
ne H
ours
16,6
61
[1]
5,55
4 [1
] –
22,2
15
Rea
ppor
tion
Serv
Dep
t - M
ktin
g M
achi
ne H
ours
1
2,01
1 [1
]
4,
004
[1]
– 1
6,01
5
****
* 19
4,10
0 12
0,45
2 [1
] 7
3,64
8 [1
]
0
0
**
***
Max
4 m
arks
for b
asis
of a
ppor
tionm
ent b
eing
cor
rect
.
***
<[1]
> m
eans
1/2
mar
k fo
r eac
h of
the
two fi g
ures
.
Ded
uct 1
mar
k fo
r eac
h in
corr
ect u
p to
tota
l 4 m
arks
.
(iii)
Ove
rhea
d A
bsor
ptio
n R
ate
* ow
n fi g
ure
= a
ccep
tabl
e
(10)
1)
Pr
oduc
tion
Dep
t. A
ssem
bly
Tot
al O
verh
eads
=
120
,452
=
4.01
5
M
achi
ne H
ours
30
,000
=
€4.
02 p
er m
achi
ne h
our
[5]
2)
Pr
oduc
tion
Dep
t. Fi
nish
ing
To
tal O
verh
eads
=
73,6
48
= 4.
910
Labo
ur H
ours
15,0
00
= €
4.91
per
labo
ur h
our
[5]
Page 24 of 40
(iv) Selling Price of Job ZY 595 (16) Direct Costs € € €
Direct Materials Assembly Dept 3,200 Finishing Dept 2,100 5,300
Direct Labour Assembly Dept 2,800 Finishing Dept 3,650 6,450 Prime Cost 11,750 [3]
Overheads: Assembly Dept.: 300 hrs × 4.02 1,206 [4] Finishing Dept.: 200 hrs × 4.91 982 [4] 2,188.00 Total Cost of Production (70%) 13,938.00 Profi t @ 30% of Selling Price 5,973.43 ** [5] Selling Price 19,911.43 *
** 13,938 × 30/70 = 5,973.43 (B) Under/Over Absorption of Overheads (15) € €
Actual overheads 195,000 Absorbed Overheads Assembly Dept: 28,000 × 4.02 112,560 [5] Finishing Dept: 15,500 × 4.91 76,105 –188,665 Under-Absorbed 6,335 [5]
Effect on Net Profi t: If overheads are under-absorbed this means that the actual Net Profi t fi gure will be less [5] than the budgeted fi gure as the overheads were greater than expected. (C) Overhead Absorption Rates: (12)
Overhead Absorption Rates are based on budgeted rather than actual costs because [2 + 2 + 2] the actual costs would not be known until the end of the year and it is not practical for a fi rm to wait until then to decide the cost of a product/job and from which the Selling Price to be charged. Methods used for Absorbing Overheads: [2 + 2 + 2] Per Machine Hours. Per Labour Hour. As a Percentage of Prime Cost. Per Unit.
Page 25 of 40
9. Budgeting 80 marks (a) Production Budget (11) Jan Feb Mar April May Sales 5,000 [1] 6,500 [1] 7,000 [1] 8,000 [1] 8,500 + Closing Stock 3,900 [1] 4,200 [1] 4,800 [1] 5,100 [1] 6,000 8,900 10,700 11,800 13,100 14,500 – Opening Stock 0 – 3,900 [1] – 4,200 [1] – 4,800 [1] – 5,100 Production units 8,900 6,800 7,600 8,300 9,400 (b) Raw Materials Purchases Budget (13) Jan Feb Mar April May Production units 8,900 [1/2] 6,800 [1/2] 7,600 [1/2] 8,300 [1/2] 9,400 Materials (kg) per unit × 6 [1/2] × 6 × 6 × 6 × 6 Total kgs req’d for Prod 53,400 [1/2] 40,800 [1/2] 45,600 [1/2] 49,800 [1/2] 56,400 + Closing Stock 10,200 [1/2] 11,400 [1/2] 12,450 [1/2] 14,100 [1] 63,600 52,200 58,050 63,900 – Opening Stock 0 – 10,200 [1/2] – 11,400 [1/2] – 12,450 [1/2] Req’d Purchases (kgs) 63,600 [1/2] 42,000 [1/2] 46,650 [1/2] 51,450 [1/2] Price per kg (€) 3,00 [1/2] 3,00 3,00 3,00 Total Total Purchases (€) 190,800 [1/2] 126,000 [1/2] 139,950 [1/2] 154,350 [1/2] € 611,100 (c) Cash Budget – January to April (35)
Jan Feb Mar April Total Receipts Sales Cash 50,400 [1] 65,520 [1] 70,560 [1] 80,640 [1] 267,120 One Month Credit 0 61,250 [1] 79,625 [1] 85,750 [1] 226,625 Two Months Credit 0 0 61,250 [1] 79,625 [1] 140,875 ** Bank Loan 0 30,000 [1] 0 0 30,000 50,400 156,770 211,435 246,015 664,620
Payments Purchases 0 190,800 [1] 126,000 [1] 139,950 [1] 456,750 Wages 0 22,000 [1] 22,000 [1] 22,000 [1] 66,000 Variable overheads 53,400 [1] 40,800 [1] 45,600 [1] 49,800 [1] 189,600 Fixed overheads 19,625 [1] 19,625 [1] 19,625 [1] 19,625 [1] 78,500 Equipment 0 36,000 [1] 0 0 36,000 Interest 0 200 [1] 200 [1] 200 [1] 600 73,025 €309,425 213,425 231,575 827,450 Net Cash – 22,625 [1] – 152,655 [1] – 1,990 [1] 14,440 [1] – 162,830 ** Loan can also be shown here Opening Cash 0 – 22,625 – 175,280 – 177,270 0 Closing Cash – 22,625 – 175,280 – 177,270 – 162,830 [3] – 162,830
Page 26 of 40
(d) Budgeted Profi t and Loss Account for the 4 months ended 30/4/2017 (14) € € €
Sales 927,500 [1] Less: Cost of Sales Opening Stock 0 + Purchases * 611,100 [1] 611,100 – Closing Stock – Finished Goods 91,800 [1] Raw Materials * 42,300 [1] – 134,100 – 477,000 Gross Profi t 450,500 Less: Expenses Wages * 88,000 [2] Variable O/H * 189,600 [1] Fixed O/H * 78,500 [1] Depreciation - Equipment * 1,500 [1] Discount Allowed 11,130 [2] – 368,730 Operating Profi t 81,770 Interest ** – 600 [1] Net Profi t *** 81,170 [2] *** correct fi gure only ** Interest does not have to be shown as a separate expense in management accounts * Full marks also awarded to students who prepared a Manufacturing A/C and transferred the Cost of Production to the trading.
* Budgeted Manufacturing A/c For 4 months ended 30/4/2017 Direct Costs € €
Raw Materials Opening Stock 0 + Purchases 611,100 * 611,100 – Closing Stock – 42,300 * 568,800 Wages 88,000 Prime Cost 656,800 Indirect Costs Variable O/Hs 189,600 * Fixed O/Hs 78,500 * Depreciation – Equipment 1,500 * 269,600 Cost of Production 926,400 (e) Advice for Zach Ltd. (7)
After the fi rst 4 months Zach Ltd. is expecting to be making a profi t of €81,170 while having a Cash defi cit of €162,830. There is a danger here that the company is overtrading. [3] If that is the case it may not be able to pay its own suppliers on time which means that it could have diffi culty sourcing raw materials on credit into the future. Zach Ltd. needs to start getting payments in from Debtors more quickly. To do this it may * [2] offer cash discounts for prompt payment. It needs to have stricter credit controls. If some of the Debtors go bankrupt and are unable to pay it could have serious consequences for the company. * [2] As a short-term measure Zach Ltd. should consider negotiating a Bank overdraft to help tie them over a temporary cash fl ow problem. * [2] any two *
Page 27 of 40
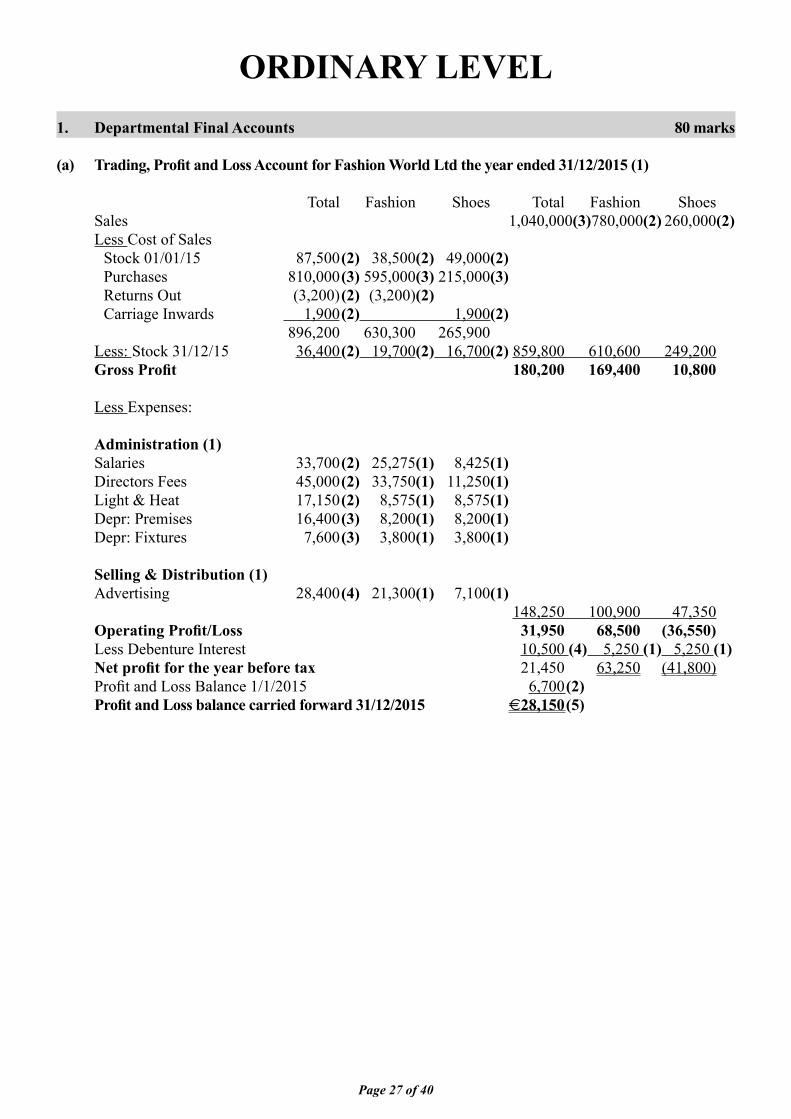
ORDINARY LEVEL1. Departmental Final Accounts 80 marks
(a) Trading, Profi t and Loss Account for Fashion World Ltd the year ended 31/12/2015 (1)
Total Fashion Shoes Total Fashion Shoes Sales 1,040,000 (3) 780,000 (2) 260,000 (2) Less Cost of Sales Stock 01/01/15 87,500 (2) 38,500 (2) 49,000 (2) Purchases 810,000 (3) 595,000 (3) 215,000 (3) Returns Out (3,200) (2) (3,200) (2) Carriage Inwards 1,900 (2) 1,900 (2) 896,200 630,300 265,900 Less: Stock 31/12/15 36,400 (2) 19,700 (2) 16,700 (2) 859,800 610,600 249,200 Gross Profi t 180,200 169,400 10,800
Less Expenses:
Administration (1) Salaries 33,700 (2) 25,275 (1) 8,425 (1) Directors Fees 45,000 (2) 33,750 (1) 11,250 (1) Light & Heat 17,150 (2) 8,575 (1) 8,575 (1) Depr: Premises 16,400 (3) 8,200 (1) 8,200 (1) Depr: Fixtures 7,600 (3) 3,800 (1) 3,800 (1)
Selling & Distribution (1) Advertising 28,400 (4) 21,300 (1) 7,100 (1) 148,250 100,900 47,350 Operating Profi t/Loss 31,950 68,500 (36,550) Less Debenture Interest 10,500 (4) 5,250 (1) 5,250 (1) Net profi t for the year before tax 21,450 63,250 (41,800) Profi t and Loss Balance 1/1/2015 6,700 (2) Profi t and Loss balance carried forward 31/12/2015 €28,150 (5)
Page 28 of 40
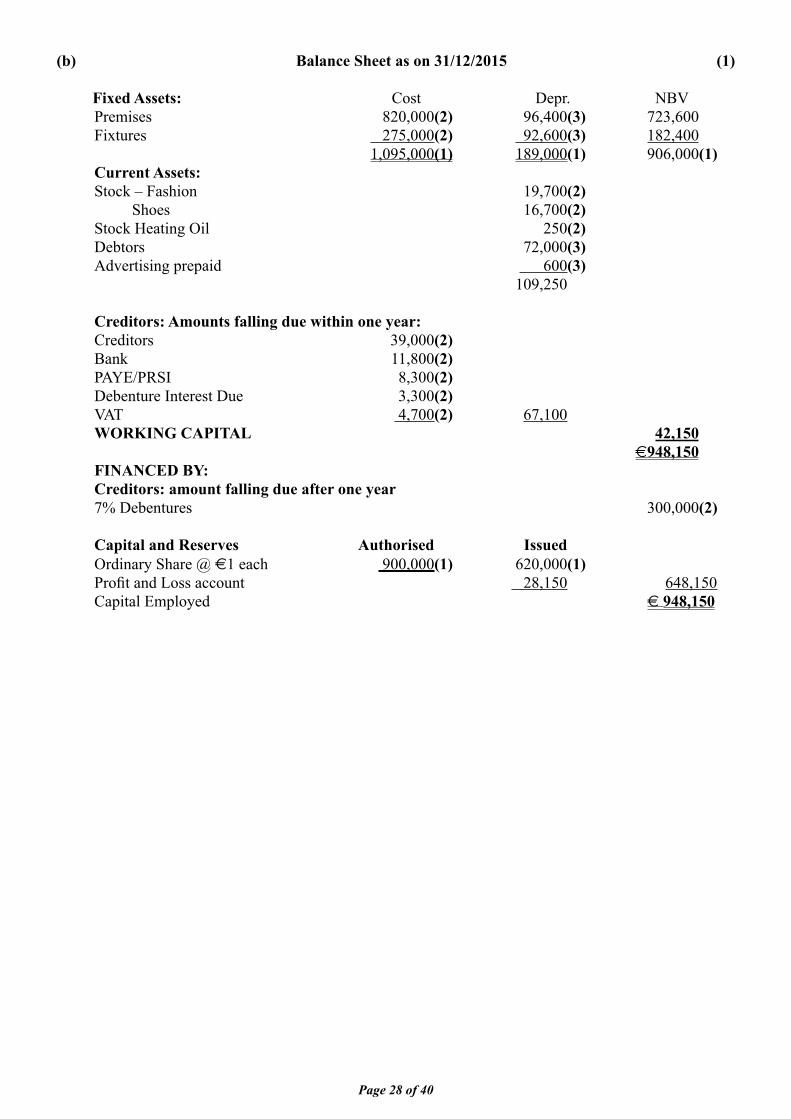
(b) Balance Sheet as on 31/12/2015 (1)
Fixed Assets: Cost Depr. NBV Premises 820,000 (2) 96,400 (3) 723,600 Fixtures 275,000 (2) 92,600 (3) 182,400 1,095,000 (1) 189,000 (1) 906,000 (1) Current Assets: Stock – Fashion 19,700 (2) Shoes 16,700 (2) Stock Heating Oil 250 (2) Debtors 72,000 (3) Advertising prepaid 600 (3) 109,250
Creditors: Amounts falling due within one year: Creditors 39,000 (2) Bank 11,800 (2) PAYE/PRSI 8,300 (2) Debenture Interest Due 3,300 (2) VAT 4,700 (2) 67,100 WORKING CAPITAL 42,150 €948,150 FINANCED BY: Creditors: amount falling due after one year 7% Debentures 300,000 (2)
Capital and Reserves Authorised Issued Ordinary Share @ €1 each 900,000 (1) 620,000 (1) Profi t and Loss account 28,150 648,150 Capital Employed € 948,150
Page 29 of 40
2. Incomplete Records: 60 marks
(a) Statement of Net Worth / Capital as at 01/01/2015 (30)
Assets: € €
Premises 275,000 (2) Plant & Machinery (165,000 – 19,000) 146,000 (6) Lorries 67,500 (3) Debtors 29,800 (2) Stock 37,800 (2) Advertising prepaid 1,400 (3) 557,500
Less Liabilities:
Expenses due 750 (3) Creditors 26,500 (3) Bank Overdraft 6,800 (3) 34,050
Capital / Net Worth on 01/01/2015 € 523,450 (3)**
** Accept correct fi gure only.
(b) Statement of Profi t or Loss for year ended 31/12/2015 (30)
Assets: 640,000 (3) Less Depreciation on Lorries 10% 6,750 (3) 633,250 Add: Expenses Prepaid 90 (4) 633,340 Less Liabilities: 73,000 (3) Net Worth on 31/12/2015 € 560,340 Less Net worth on 01/01/2015 523,450 (1) * Apparent profi t for the year 36,890 Less Capital introduced 20,000 (4) 16,890 Add Drawings: Wedding Present 1,600 (2) Stock (12 × €105) 1,260 (4) 2,860 Net profi t for the year 2015 € 19,750 (6) **
* Accept student’s own consistent fi gure. ** Accept correct fi gure only.
Page 30 of 40
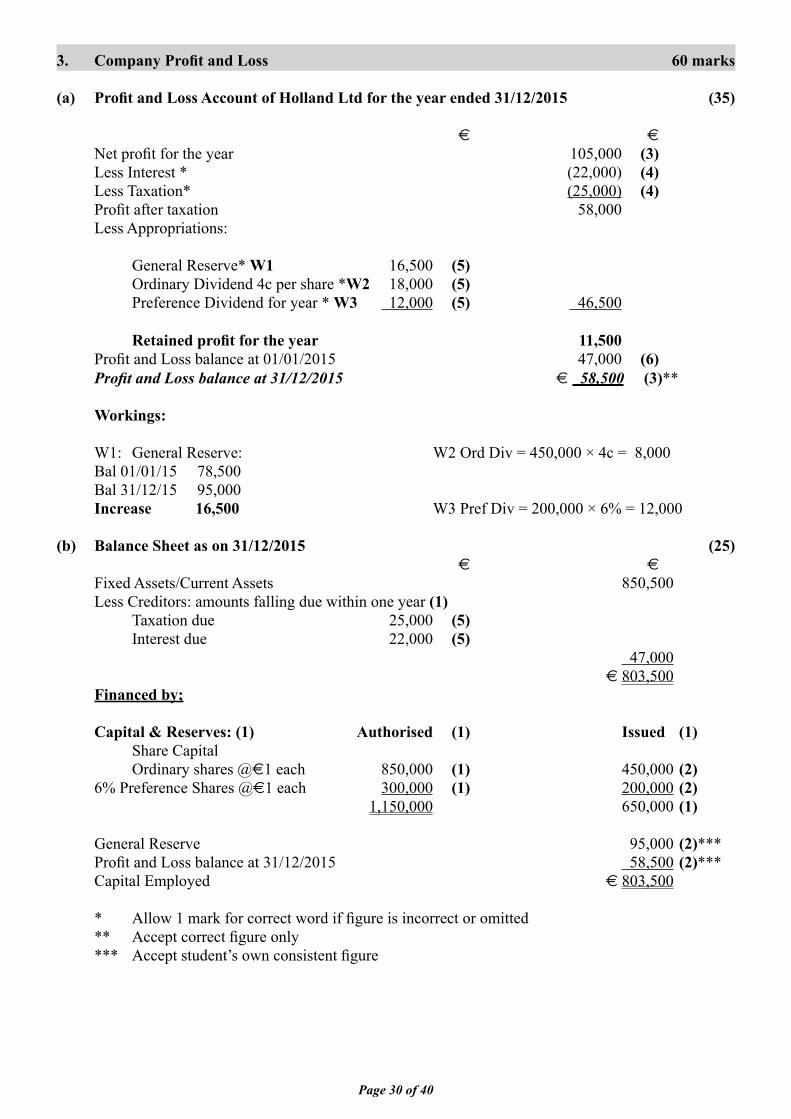
3. Company Profi t and Loss 60 marks
(a) Profi t and Loss Account of Holland Ltd for the year ended 31/12/2015 (35)
€ €
Net profi t for the year 105,000 (3) Less Interest * (22,000) (4) Less Taxation* (25,000) (4) Profi t after taxation 58,000 Less Appropriations:
General Reserve* W1 16,500 (5) Ordinary Dividend 4c per share *W2 18,000 (5) Preference Dividend for year * W3 12,000 (5) 46,500
Retained profi t for the year 11,500 Profi t and Loss balance at 01/01/2015 47,000 (6) Profi t and Loss balance at 31/12/2015 € 58,500 (3)**
Workings:
W1: General Reserve: W2 Ord Div = 450,000 × 4c = 8,000 Bal 01/01/15 78,500 Bal 31/12/15 95,000 Increase 16,500 W3 Pref Div = 200,000 × 6% = 12,000
(b) Balance Sheet as on 31/12/2015 (25) € €
Fixed Assets/Current Assets 850,500 Less Creditors: amounts falling due within one year (1) Taxation due 25,000 (5) Interest due 22,000 (5) 47,000 € 803,500 Financed by;
Capital & Reserves: (1) Authorised (1) Issued (1) Share Capital Ordinary shares @€1 each 850,000 (1) 450,000 (2) 6% Preference Shares @€1 each 300,000 (1) 200,000 (2) 1,150,000 650,000 (1)
General Reserve 95,000 (2)*** Profi t and Loss balance at 31/12/2015 58,500 (2)*** Capital Employed € 803,500
* Allow 1 mark for correct word if fi gure is incorrect or omitted ** Accept correct fi gure only *** Accept student’s own consistent fi gure
Page 31 of 40
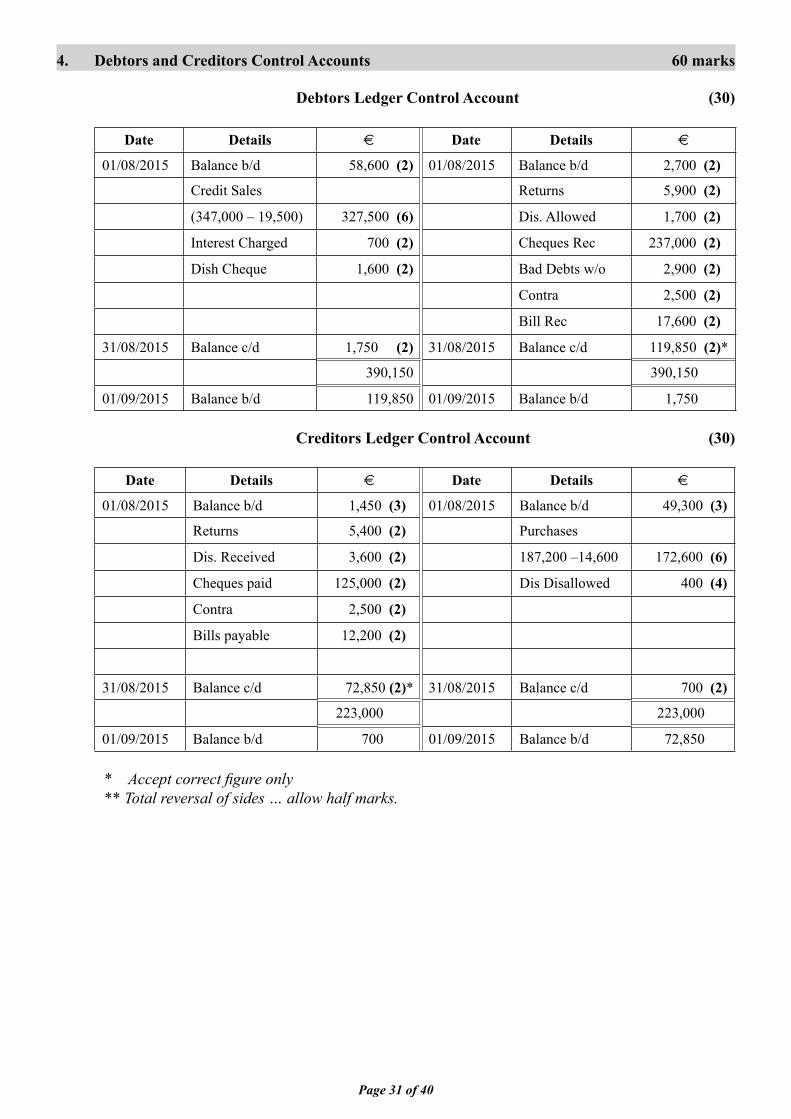
4. Debtors and Creditors Control Accounts 60 marks
Debtors Ledger Control Account (30)
Date Details € Date Details €
01/08/2015 Balance b/d 58,600 (2) 01/08/2015 Balance b/d 2,700 (2)
Credit Sales Returns 5,900 (2)
(347,000 – 19,500) 327,500 (6) Dis. Allowed 1,700 (2)
Interest Charged 700 (2) Cheques Rec 237,000 (2)
Dish Cheque 1,600 (2) Bad Debts w/o 2,900 (2)
Contra 2,500 (2)
Bill Rec 17,600 (2)
31/08/2015 Balance c/d 1,750 (2) 31/08/2015 Balance c/d 119,850 (2)*
390,150 390,150
01/09/2015 Balance b/d 119,850 01/09/2015 Balance b/d 1,750
Creditors Ledger Control Account (30)
Date Details € Date Details €
01/08/2015 Balance b/d 1,450 (3) 01/08/2015 Balance b/d 49,300 (3)
Returns 5,400 (2) Purchases
Dis. Received 3,600 (2) 187,200 –14,600 172,600 (6)
Cheques paid 125,000 (2) Dis Disallowed 400 (4)
Contra 2,500 (2)
Bills payable 12,200 (2)
31/08/2015 Balance c/d 72,850 (2)* 31/08/2015 Balance c/d 700 (2)
223,000 223,000
01/09/2015 Balance b/d 700 01/09/2015 Balance b/d 72,850
* Accept correct fi gure only ** Total reversal of sides … allow half marks.
Page 32 of 40
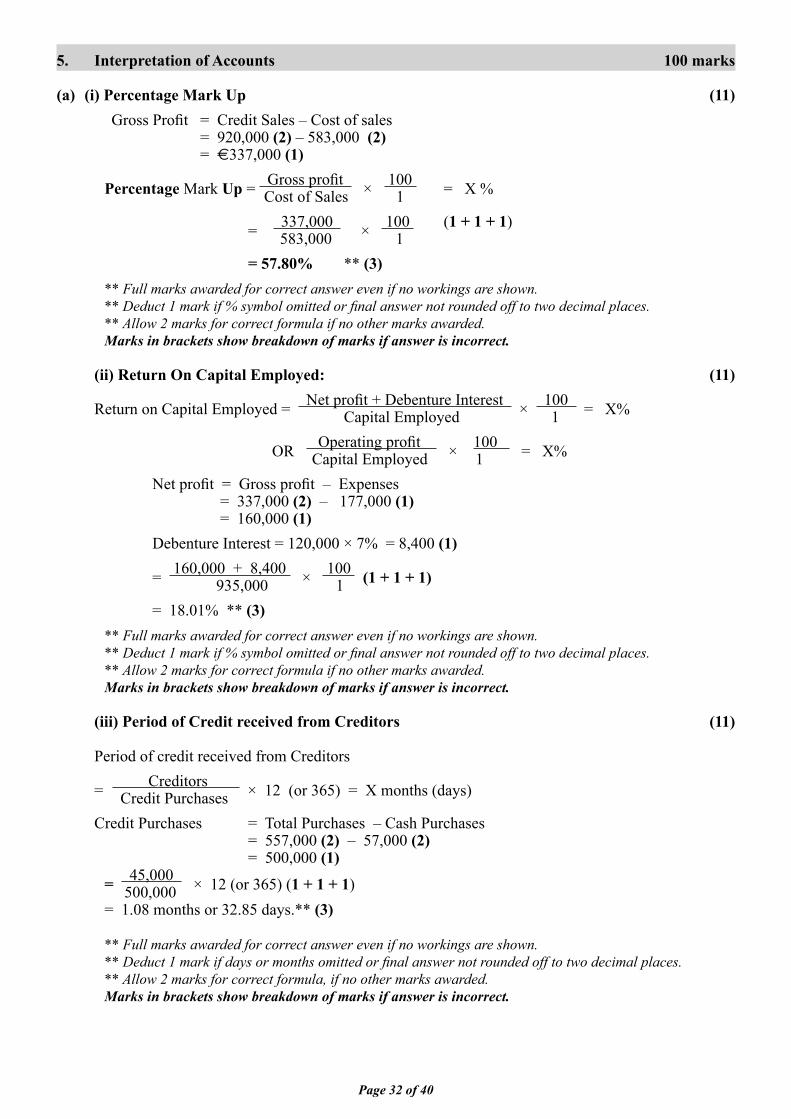
5. Interpretation of Accounts 100 marks
(a) (i) Percentage Mark Up (11)Gross Profi t = Credit Sales – Cost of sales = 920,000 (2) – 583,000 (2) = €337,000 (1)
Percentage Mark Up = Gross profi t × 100 = X % Cost of Sales 1 = 337,000 × 100 (1 + 1 + 1) 583,000 1 = 57.80% ** (3) ** Full marks awarded for correct answer even if no workings are shown. ** Deduct 1 mark if % symbol omitted or fi nal answer not rounded off to two decimal places. ** Allow 2 marks for correct formula if no other marks awarded. Marks in brackets show breakdown of marks if answer is incorrect.
(ii) Return On Capital Employed: (11) Return on Capital Employed = Net profi t + Debenture Interest × 100 = X% Capital Employed 1
OR Operating profi t × 100 = X% Capital Employed 1Net profi t = Gross profi t – Expenses = 337,000 (2) – 177,000 (1) = 160,000 (1)Debenture Interest = 120,000 × 7% = 8,400 (1)
= 160,000 + 8,400 × 100 (1 + 1 + 1) 935,000 1= 18.01% ** (3)
** Full marks awarded for correct answer even if no workings are shown. ** Deduct 1 mark if % symbol omitted or fi nal answer not rounded off to two decimal places. ** Allow 2 marks for correct formula if no other marks awarded. Marks in brackets show breakdown of marks if answer is incorrect.
(iii) Period of Credit received from Creditors (11)
Period of credit received from Creditors
= Creditors × 12 (or 365) = X months (days) Credit Purchases Credit Purchases = Total Purchases – Cash Purchases = 557,000 (2) – 57,000 (2) = 500,000 (1) = 45,000 × 12 (or 365) (1 + 1 + 1) 500,000 = 1.08 months or 32.85 days.** (3)
** Full marks awarded for correct answer even if no workings are shown. ** Deduct 1 mark if days or months omitted or fi nal answer not rounded off to two decimal places. ** Allow 2 marks for correct formula, if no other marks awarded. Marks in brackets show breakdown of marks if answer is incorrect.
Page 33 of 40
(iv) Working Capital: (7)
Working Capital = Current Assets less Current Liabilities = 175,000 (2) – 45,000 (2) = €130,000 ** (3)
** Full marks awarded for correct answer even if no workings are shown. Marks in brackets show breakdown of marks if answer is incorrect.
(b) (i) Shareholders Funds: (10) This is the amount of money owed by the company to the ordinary shareholders (3) It consists of issued ordinary share capital (2) plus Reserves (2). In this set of accounts the
shareholders funds equal €655,000 (1) + €160,000 (1) = €815,000 (1)
(ii) 7% Debentures 2022/2023(10) Debentures are long-term (1) loans.(1) The fi xed (1) annual (1) rate of interest (1) is 7% (1).
Loan must be repaid (1) in one lump sum (1) during the years 2022/2023 (1). The Debenture in this set of accounts is €120,000 (1)
(iii) Authorised Share Capital (10) When a company is set up (2), the authorised share capital is set out in the Memorandum of
Association (2). It is the total (2) number of shares that the company can sell/issue (2). In this set of accounts, the authorised share capital is €800,000 (2)
(iv) Trade Debtors: (10) Trade Debtors represents customers (2) of the business to whom goods/services (2) have
been sold on credit. (2) The Debtors agree to pay what they owe at some future date (2). The debtors in this set of accounts owe the business €49,000 (2)
Marks in brackets show breakdown of marks.
(c) Would Richmount have diffi culty in paying its bills as they fall due? Explain your answer. (10)
Diffi culty in paying its bills? NO. (2)
Explanation: Acid Test Ratio is 2.84 :1 (2) Above (1) the recommended of 1:1: (1) For every €1 that the business owes (2) it has €2.84 to cover the debt. (2)
Accept student’s own comment consistent with fi gure. Marks in brackets show breakdown of marks.
(d) The Return on Capital employed: Comment (10)
The return on capital employed has increased (2) from 14.62% in 2014 to 18.01% in 2015 (1). This is an excellent return (1) and shareholders would be very satisfi ed (1). It is much higher than current interest rates on risk free investments (2) of 2 – 3% approx. (1). The company is performing well. (2)
Accept student’s own comment consistent with fi gure.Marks in brackets show breakdown of marks.
Page 34 of 40
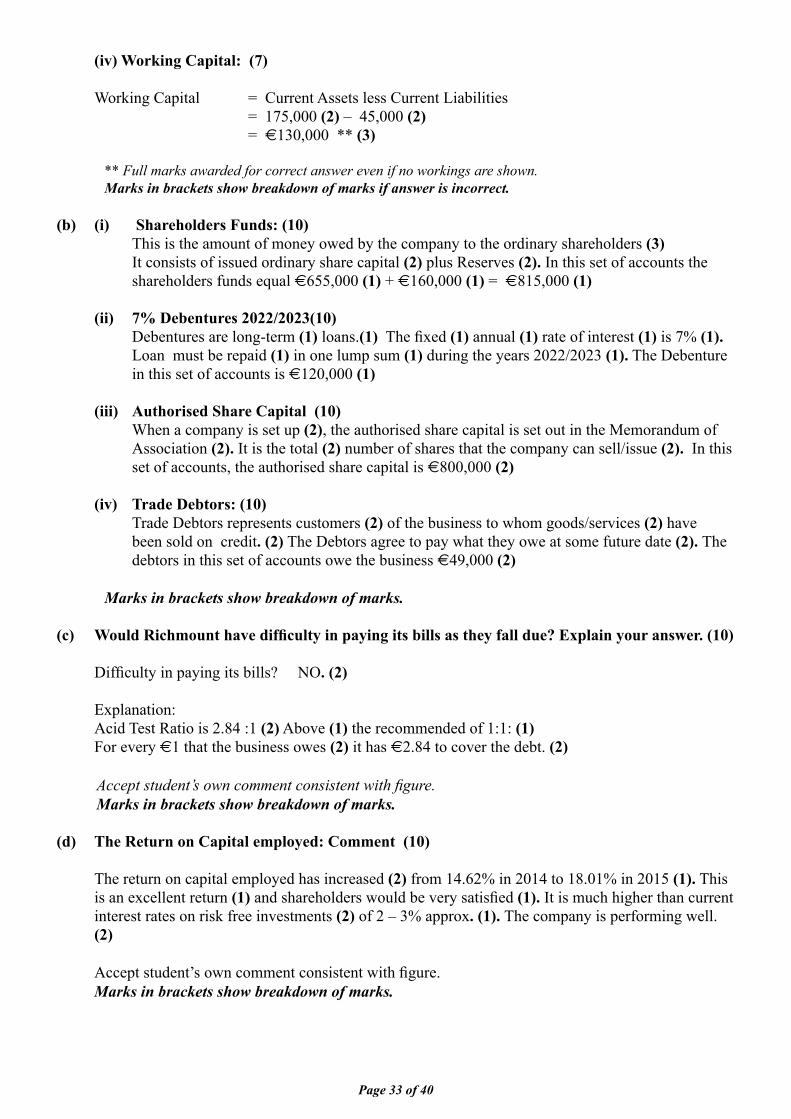
6. Accounts of a Service Firm 100 marks
(a) Statement of Capital at 01/01/2015 (20)
Assets: Land and Property 270,000 (2) Caravans 180,000 (2) Tents 15,000 (2) Camping Equipment 12,000 (2) 477,000 Liabilities Advance Deposits 3,600 (4) Bank Overdraft 1,150 (2) Water Charges due 150 (3) 4,900
Capital at 01/01/2015 (1) € 472,100 ** (2)
(b) Income and Expenditure Account for year ended 31/12/2015 (40)
Income: € €
Receipts from Tourists (W1) 35,400 (5) Receipts from Tents 5,800 (3) Rent from Camping Equipment 4,600 (3) 45,800 Expenditure
Water Charges (W2) 540 (3) Wages 4,200 (2) Advertising (W3) 3,825 (4) Repairs 4,600 (2) Insurance (W4) 5,700 (4) Dep: Tents (W5) 2,250 (4) Dep: Camping Equipment (W 6) 1,200 (4) 22,315
Net profi t for the year € 23,485 ** (6) Workings: 1: 32,600 (1) + 3,600 (2) – 800 (2) = 35,400 2: 690 (1) – 150 (2) = 540 3: 5,100 (1) – 1,275(3) = 3,825 4: 6,300 (1) – 600 (3) = 5,700 5: 15,000 × 15% = 2,250 6: 12,000 × 10% = 1,200 ** Accept correct fi gure only.
Page 35 of 40
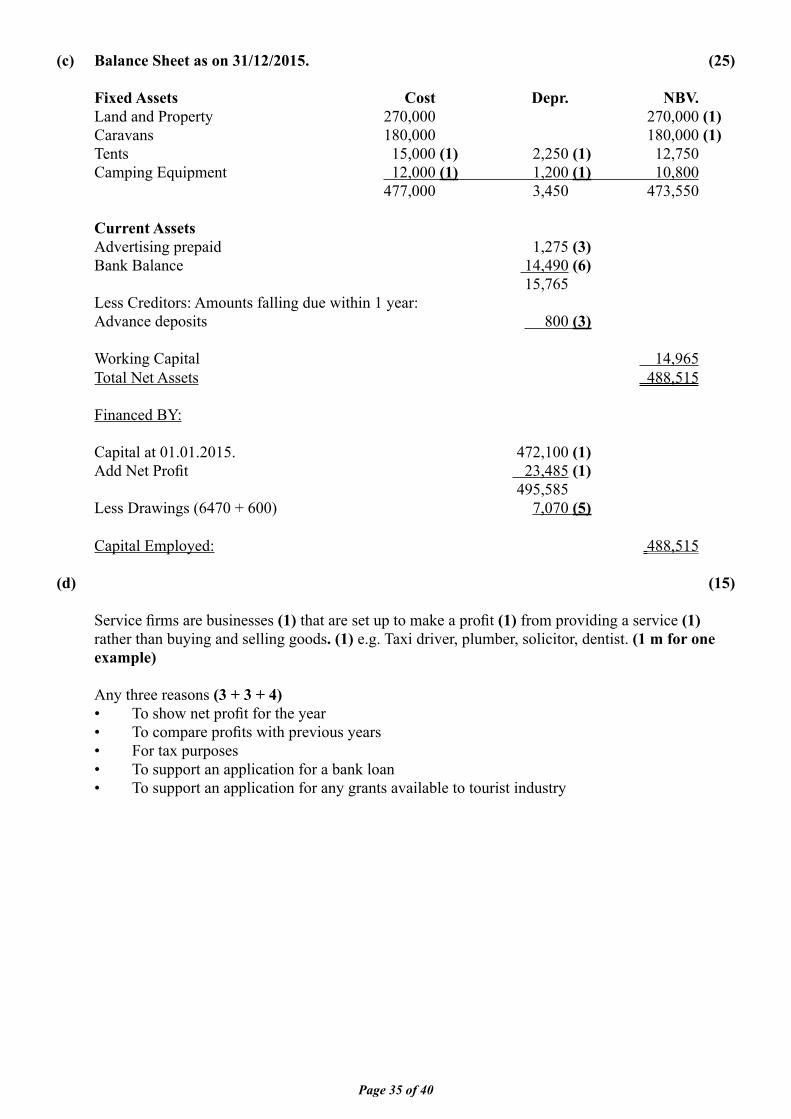
(c) Balance Sheet as on 31/12/2015. (25)
Fixed Assets Cost Depr. NBV. Land and Property 270,000 270,000 (1) Caravans 180,000 180,000 (1) Tents 15,000 (1) 2,250 (1) 12,750 Camping Equipment 12,000 (1) 1,200 (1) 10,800 477,000 3,450 473,550
Current Assets Advertising prepaid 1,275 (3) Bank Balance 14,490 (6) 15,765 Less Creditors: Amounts falling due within 1 year: Advance deposits 800 (3)
Working Capital 14,965 Total Net Assets 488,515
Financed BY:
Capital at 01.01.2015. 472,100 (1) Add Net Profi t 23,485 (1) 495,585 Less Drawings (6470 + 600) 7,070 (5)
Capital Employed: 488,515
(d) (15)
Service fi rms are businesses (1) that are set up to make a profi t (1) from providing a service (1) rather than buying and selling goods. (1) e.g. Taxi driver, plumber, solicitor, dentist. (1 m for one example)
Any three reasons (3 + 3 + 4) • To show net profi t for the year • To compare profi ts with previous years • For tax purposes • To support an application for a bank loan • To support an application for any grants available to tourist industry
Page 36 of 40
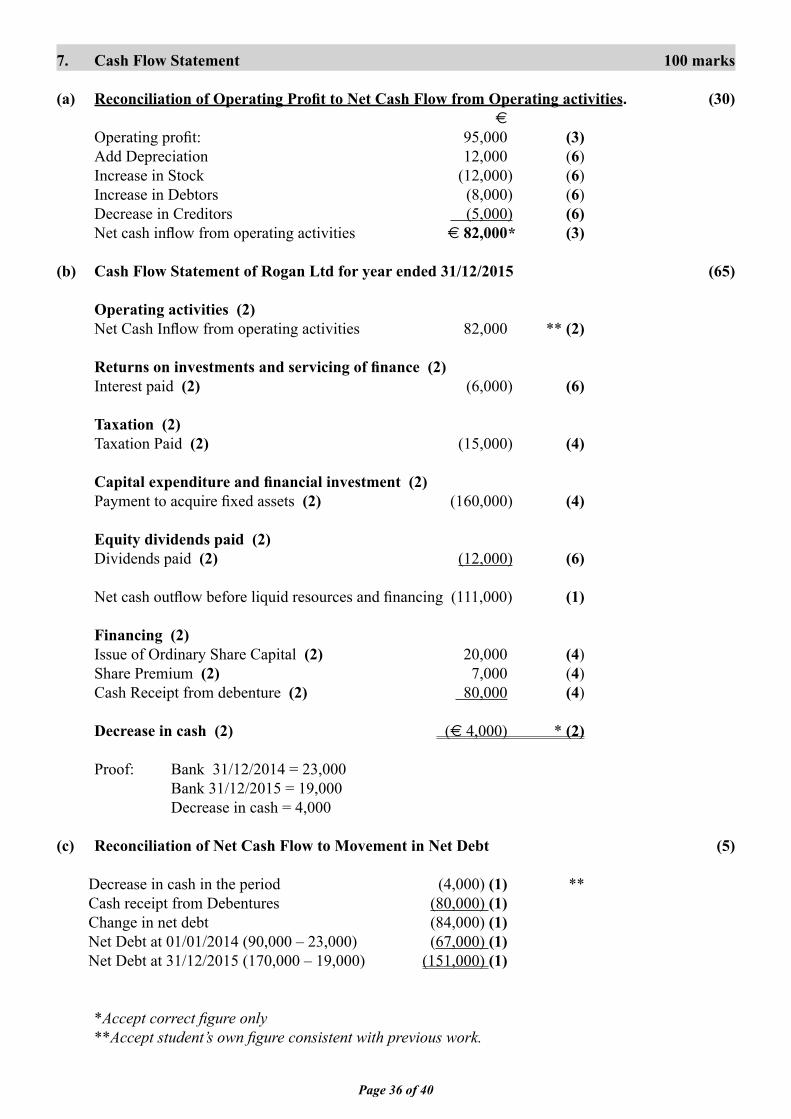
7. Cash Flow Statement 100 marks
(a) Reconciliation of Operating Profi t to Net Cash Flow from Operating activities. (30) €
Operating profi t: 95,000 (3) Add Depreciation 12,000 (6) Increase in Stock (12,000) (6) Increase in Debtors (8,000) (6) Decrease in Creditors (5,000) (6) Net cash infl ow from operating activities € 82,000 (3)
(b) Cash Flow Statement of Rogan Ltd for year ended 31/12/2015 (65)
Operating activities (2) Net Cash Infl ow from operating activities 82,000 ** (2)
Returns on investments and servicing of fi nance (2) Interest paid (2) (6,000) (6)
Taxation (2) Taxation Paid (2) (15,000) (4)
Capital expenditure and fi nancial investment (2) Payment to acquire fi xed assets (2) (160,000) (4)
Equity dividends paid (2) Dividends paid (2) (12,000) (6)
Net cash outfl ow before liquid resources and fi nancing (111,000) (1)
Financing (2) Issue of Ordinary Share Capital (2) 20,000 (4) Share Premium (2) 7,000 (4) Cash Receipt from debenture (2) 80,000 (4)
Decrease in cash (2) (€ 4,000) * (2)
Proof: Bank 31/12/2014 = 23,000 Bank 31/12/2015 = 19,000 Decrease in cash = 4,000
(c) Reconciliation of Net Cash Flow to Movement in Net Debt (5)
Decrease in cash in the period (4,000) (1) ** Cash receipt from Debentures (80,000) (1) Change in net debt (84,000) (1) Net Debt at 01/01/2014 (90,000 – 23,000) (67,000) (1) Net Debt at 31/12/2015 (170,000 – 19,000) (151,000) (1)
*Accept correct fi gure only **Accept student’s own fi gure consistent with previous work.
*
Page 37 of 40
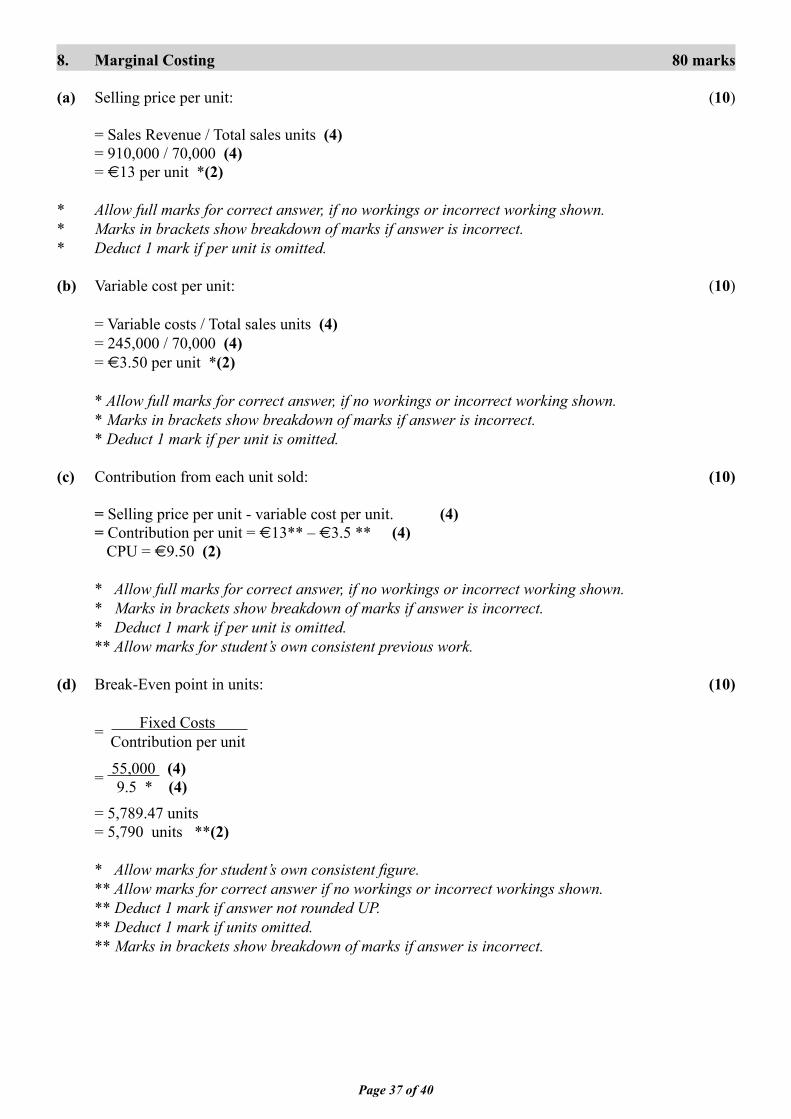
8. Marginal Costing 80 marks
(a) Selling price per unit: (10)
= Sales Revenue / Total sales units (4) = 910,000 / 70,000 (4) = €13 per unit *(2)
* Allow full marks for correct answer, if no workings or incorrect working shown.* Marks in brackets show breakdown of marks if answer is incorrect.* Deduct 1 mark if per unit is omitted.
(b) Variable cost per unit: (10)
= Variable costs / Total sales units (4) = 245,000 / 70,000 (4) = €3.50 per unit *(2)
* Allow full marks for correct answer, if no workings or incorrect working shown. * Marks in brackets show breakdown of marks if answer is incorrect. * Deduct 1 mark if per unit is omitted.
(c) Contribution from each unit sold: (10)
= Selling price per unit - variable cost per unit. (4) = Contribution per unit = €13** – €3.5 ** (4) CPU = €9.50 (2)
* Allow full marks for correct answer, if no workings or incorrect working shown. * Marks in brackets show breakdown of marks if answer is incorrect. * Deduct 1 mark if per unit is omitted. ** Allow marks for student’s own consistent previous work.
(d) Break-Even point in units: (10)
= Fixed Costs Contribution per unit
= 55,000 (4) 9.5 * (4) = 5,789.47 units = 5,790 units **(2)
* Allow marks for student’s own consistent fi gure. ** Allow marks for correct answer if no workings or incorrect workings shown. ** Deduct 1 mark if answer not rounded UP. ** Deduct 1 mark if units omitted. ** Marks in brackets show breakdown of marks if answer is incorrect.
Page 38 of 40
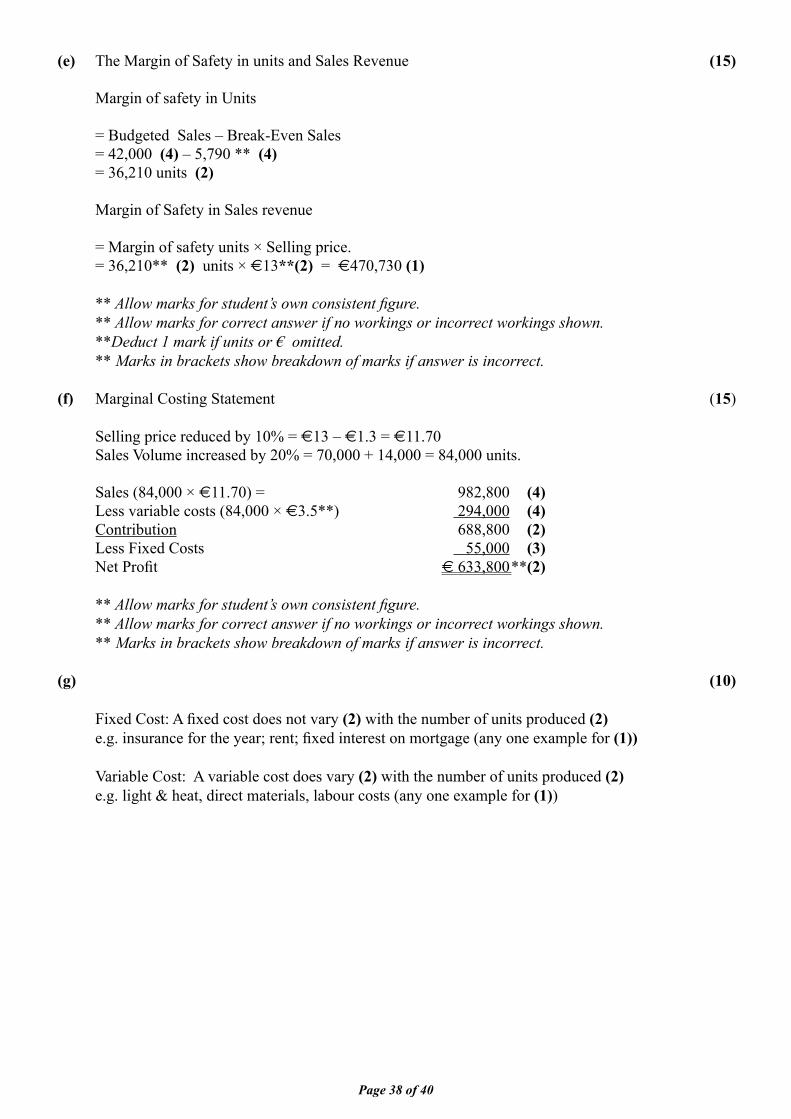
(e) The Margin of Safety in units and Sales Revenue (15)
Margin of safety in Units
= Budgeted Sales – Break-Even Sales = 42,000 (4) – 5,790 ** (4) = 36,210 units (2)
Margin of Safety in Sales revenue
= Margin of safety units × Selling price. = 36,210** (2) units × €13**(2) = €470,730 (1)
** Allow marks for student’s own consistent fi gure. ** Allow marks for correct answer if no workings or incorrect workings shown. **Deduct 1 mark if units or € omitted. ** Marks in brackets show breakdown of marks if answer is incorrect.
(f) Marginal Costing Statement (15)
Selling price reduced by 10% = €13 – €1.3 = €11.70 Sales Volume increased by 20% = 70,000 + 14,000 = 84,000 units.
Sales (84,000 × €11.70) = 982,800 (4) Less variable costs (84,000 × €3.5**) 294,000 (4) Contribution 688,800 (2) Less Fixed Costs 55,000 (3) Net Profi t € 633,800 **(2)
** Allow marks for student’s own consistent fi gure. ** Allow marks for correct answer if no workings or incorrect workings shown. ** Marks in brackets show breakdown of marks if answer is incorrect.
(g) (10)
Fixed Cost: A fi xed cost does not vary (2) with the number of units produced (2) e.g. insurance for the year; rent; fi xed interest on mortgage (any one example for (1))
Variable Cost: A variable cost does vary (2) with the number of units produced (2) e.g. light & heat, direct materials, labour costs (any one example for (1))
Page 39 of 40
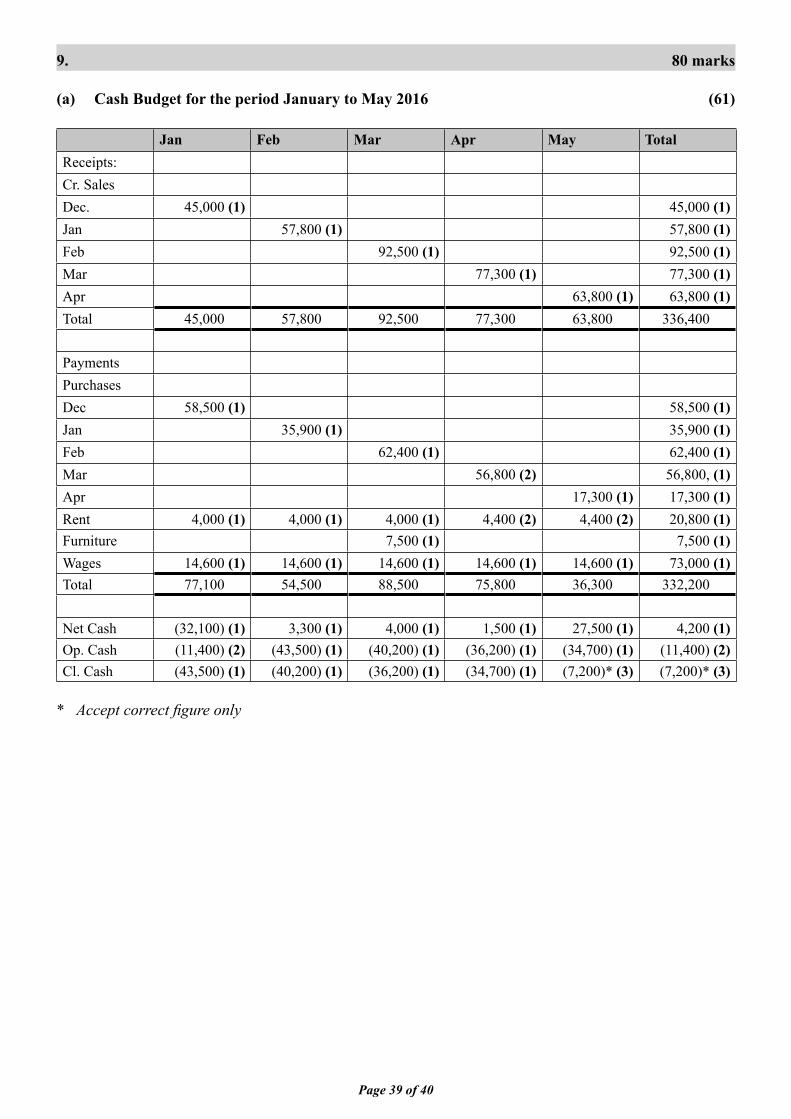
9. 80 marks
(a) Cash Budget for the period January to May 2016 (61)
Jan Feb Mar Apr May TotalReceipts:Cr. SalesDec. 45,000 (1) 45,000 (1)Jan 57,800 (1) 57,800 (1)Feb 92,500 (1) 92,500 (1)Mar 77,300 (1) 77,300 (1)Apr 63,800 (1) 63,800 (1)Total 45,000 57,800 92,500 77,300 63,800 336,400
PaymentsPurchasesDec 58,500 (1) 58,500 (1)Jan 35,900 (1) 35,900 (1)Feb 62,400 (1) 62,400 (1)Mar 56,800 (2) 56,800, (1)Apr 17,300 (1) 17,300 (1)Rent 4,000 (1) 4,000 (1) 4,000 (1) 4,400 (2) 4,400 (2) 20,800 (1)Furniture 7,500 (1) 7,500 (1)Wages 14,600 (1) 14,600 (1) 14,600 (1) 14,600 (1) 14,600 (1) 73,000 (1)Total 77,100 54,500 88,500 75,800 36,300 332,200
Net Cash (32,100) (1) 3,300 (1) 4,000 (1) 1,500 (1) 27,500 (1) 4,200 (1)Op. Cash (11,400) (2) (43,500) (1) (40,200) (1) (36,200) (1) (34,700) (1) (11,400) (2)Cl. Cash (43,500) (1) (40,200) (1) (36,200) (1) (34,700) (1) (7,200)* (3) (7,200)* (3)
* Accept correct fi gure only
Page 40 of 40
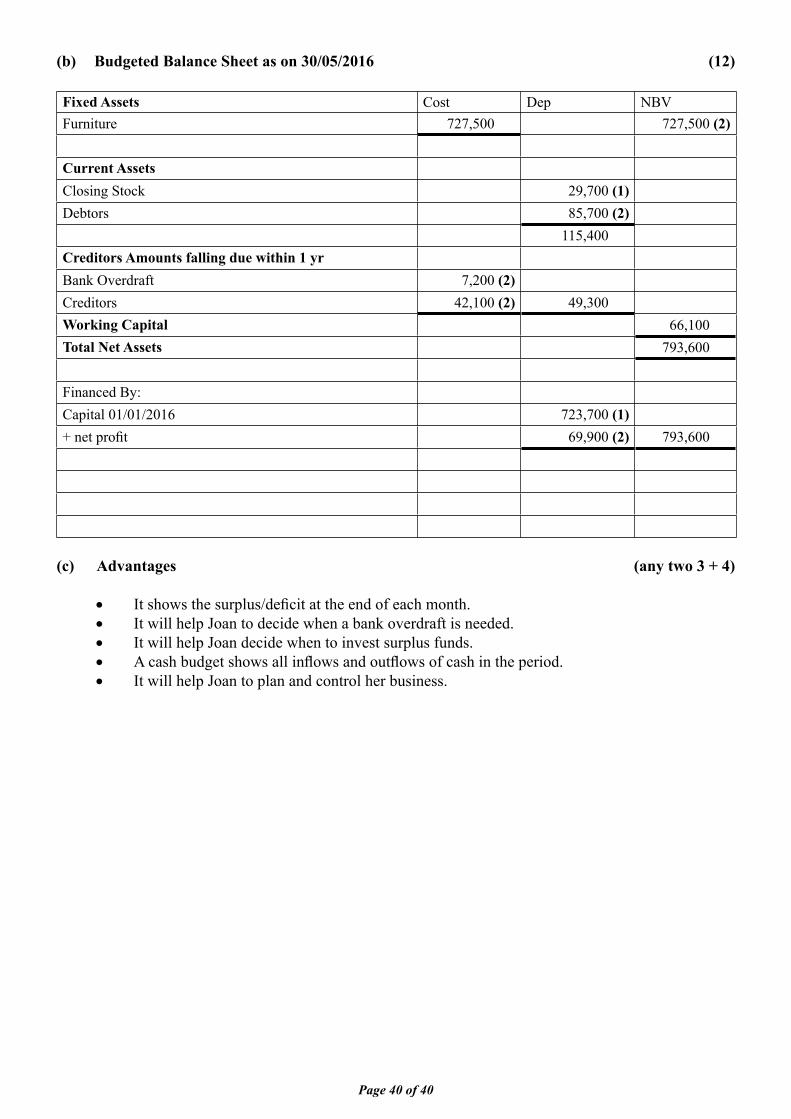
(b) Budgeted Balance Sheet as on 30/05/2016 (12)
Fixed Assets Cost Dep NBVFurniture 727,500 727,500 (2)
Current AssetsClosing Stock 29,700 (1)Debtors 85,700 (2)
115,400Creditors Amounts falling due within 1 yrBank Overdraft 7,200 (2)Creditors 42,100 (2) 49,300Working Capital 66,100Total Net Assets 793,600
Financed By:Capital 01/01/2016 723,700 (1)+ net profi t 69,900 (2) 793,600
(c) Advantages (any two 3 + 4)
It shows the surplus/defi cit at the end of each month. It will help Joan to decide when a bank overdraft is needed. It will help Joan decide when to invest surplus funds. A cash budget shows all infl ows and outfl ows of cash in the period. It will help Joan to plan and control her business.