Embed Size (px)
Citation preview
Accounting for Changes in Particle Charge, Dry Mass andComposition Occurring During Studies of Single Levitated ParticlesAllen E. Haddrell,† James F. Davies,† Akihiro Yabushita,‡ and Jonathan P. Reid*,†
†School of Chemistry, University of Bristol, Bristol BS8 1TS, U.K.‡Department of Molecular Engineering, Kyoto University, Kyotodaigakukatsura, Nishikyo-ku Kyoto 615-8510, Japan
*S Supporting Information
ABSTRACT: The most used instrument in single particlehygroscopic analysis over the past thirty years has been theelectrodynamic balance (EDB). Two general assumptions aremade in hygroscopic studies involving the EDB. First, it isassumed that the net charge on the droplet is invariant overthe time scale required to record a hygroscopic growth cycle.Second, it is assumed that the composition of the droplet isconstant (aside from the addition and removal of water). Inthis study, we demonstrate that these assumptions cannotalways be made and may indeed prove incorrect. The presenceof net charge in the humidified vapor phase reduces the total net charge retained by the droplet over prolonged levitationperiods. The gradual reduction in charge limits the reproducibility of hygroscopicity measurements made on repeated RH cycleswith a single particle, or prolonged experiments in which the particle is held at a high relative humidity. Further, two contrastingexamples of the influence of changes in chemical composition changes are reported. In the first, simple acid−base chemistry inthe droplet leads to the irreversible removal of gaseous ammonia from a droplet containing an ammonium salt on a time scalethat is shorter than the hygroscopicity measurement. In the second example, the net charge on the droplet (<100 fC) is highenough to drive redox chemistry within the droplet. This is demonstrated by the reduction of iodic acid in a droplet made solelyof iodic acid and water to form iodine and an iodate salt.
I. INTRODUCTION
The hygroscopic properties of ambient aerosols play a majorrole in numerous areas of the environment ranging from largescale phenomena, such as global climate change,1 to localevents, such as the induction of adverse health effects inhumans.2,3 Over the past thirty years, numerous aerosol analysistechniques have been developed to accurately measure thedegree to which an aerosol will uptake and lose water as afunction of relative humidity (RH).4−6 These techniquesinclude optical levitation, optical tweezers, tandem differentialmobility analyzers (TDMA), and the electrodynamic balance(EDB). In the operation of the EDB for hygroscopic studies,three specific assumptions are made. First, that the net chargeon the droplet throughout the course of the study remainsconstant. Second, that the chemical composition within thedroplet will remain constant, with only the amount of water inthe droplet changing. The importance of accounting forchanges in gas/particle partitioning of semivolatiles withchange in RH has been recently highlighted by Barley et al.7
And third, that the amount of net charge in the aerosol is solow that it will not affect its chemical composition. Presented inthis study are multiple examples where these assumptions arenot valid. The more general implications of these measure-ments for EDB studies are considered.The presence of a net charge on a droplet is crucial for its
accurate mass measurement in the EDB. The physics that
govern the operation of an EDB are similar to that of an iontrap. The DC offset of the electric field capable of holding adroplet with net charge at the null point of the EDB isproportional to the mass-to-charge ratio of the droplet itself;the presence of a net charge on the droplet is necessary fordroplet levitation to occur. With the assumption that the drag,photophoretic, and thermophoretic forces are either insignif-icant or constant, the correlation between droplet mass and DCoffset is shown in eq 1.8
=mnq
VCgzDC
(1)
where m is the absolute mass of the particle, n is the number ofelementary charges present on the particle, q is the elementarycharge, z is the distance between the electrodes across which aDC potential, VDC, is applied, C is a geometric factor that isdependent on the shape of the EDB and g is the acceleration ofgravity. The voltage VDC is applied either to an end-capelectrode or as an offset to the AC waveform applied to the ringelectrodes, dependent on the set up of the apparatus. The DCpotential required to maintain the droplet position at the nullpoint of the trap in both the vertical and horizontal planes is
Received: May 21, 2012Revised: July 2, 2012
Article
pubs.acs.org/JPCA
© XXXX American Chemical Society A dx.doi.org/10.1021/jp304920x | J. Phys. Chem. A XXXX, XXX, XXX−XXX
recorded in hygroscopic growth measurements with variation inRH. For the successful levitation of a droplet with a radiusbetween ∼3 and ∼30 μm, a net charge on the droplet rangingbetween 10 and 300 fC is required,9 which equates to a totalion imbalance within the droplet of ∼105 to ∼106 (where theion imbalance is the ratio of the total number of ions in thedroplet divided by the net charge on the droplet). When thecharge is this high on a droplet, the exact number of elementalcharges on any given droplet in a single experiment isimpossible to measure during levitation,10 and as such theabsolute mass cannot be determined. For this reason, the size ofa droplet held within the EDB is reported as the growth factor(GF), which is typically defined as the ratio of the mass of thedroplet at a given RH to that of the dry mass. Of note is thatany change in the net charge of the droplet would have aresultant change in the reported GF similar to that of the gainor loss of mass.In a typical hygroscopic experiment using an EDB, the RH of
the system is ramped through a cycle from a low RH (<20%) toa high RH (>80%) and back in incremental steps with theresultant change in droplet size measured. For a hygroscopicitycycle to be completed, allowing time for the system to reachequilibrium at each incremental RH step, an experimenttypically requires more than 20 h to complete. The cycle shouldbe repeated for each droplet to ensure reproducibility, meaningthat in a given hygroscopic experiment the droplet remainslevitated within the trap for a number of days and is cycledfrom low to high RH repeatedly. An alternative approach isadopted by Chan and co-workers in the scanning EDB wherethe RH is continually varied through a set program, and thetime response at the null point of the balance calibrated by asolution droplet of known hygroscopic response.11 Subsequentmeasurements rely on this calibrated response to retrieve thehygroscopic response of less well characterized aerosol, and theaccuracy of these experiments is dependent on the RH profilebeing highly reproducible.Recent work by Galembeck et al.12 garnered widespread
interest13,14 when they demonstrated that the charging ofdielectrics occurs at a faster rate in conditions of high humidity.Specifically, they found that during a series of wet and drycycles, the passage of humidified or dry nitrogen over either apure brass or chrome-plated brass cylinder resulted in chargebuildup on the cylinder during periods where the RH was>50%. The rate at which the charge buildup occurred withincreasing RH was found to be a nonlinear relationship, withthe rate of charge build-up increasing significantly as the RHincreased. These findings are not that surprising when thephysical processes involved in the transfer of water to an airfloware considered.A common method used to generate a humidified airflow is
to pass a dry airflow directly through water using a bubbler,resulting in an airflow as it leaves the bubbler with an RH near100%. The mechanism by which water vapor with net charge ispassed from the liquid phase and into the gas phase in a bubbleris not fully understood, and remains an area of interest. Thephenomenon of aerosol charging during this process has beenstudied for over seven decades with Chapman15 and Kohler16
performing some of the earliest work. With the advent of highspeed motion imaging, Blanchard et al. were able to collectimages of a collapsing bubble at the surface, showing thatbubble collapse is followed be the ejection of a jet of droplets.17
Blanchard followed this work by measuring the charge on thedroplets ejected from a single bubble. Two correlations were
noted: between bubble radius and net charge, and between thedepth of water in which the bubble has risen and net charge.18
Taken together these findings show that the mechanism leadingto the charging of the bubble occurs at the bubble−waterinterface and not at the surface of the water itself. Thesefindings were verified by the work by Jarrold and co-workers,19
in a similar style of experiment as Blanchard in which the netcharge of a droplet ejected from a bursting bubble wasmeasured. They found the presence of both positive andnegative charges being ejected from the bursting bubble, withapproximately 5 × 10⁴ elementary charges per droplet.Although the vast majority of the elemental charges detectedwere negative, positive charges were also detected to a lesserextent with their abundance only 16% of the total measurablecharge. Further work by Li and Somasundaran,20−22 coupledwith the findings of Jarrold and co-workers,19 shows that thecharge of the droplets ejected from a bubbler are simply aproduct of the net charge on the surface of the bubble as itpasses through the water, where the charge arises from elevatedlevels of hydroxide or hydronium ions at the air−waterinterface in a bubble. To be clear, by these mechanisms all thevapor above water will have a slight net charge and the use of abubbler simply increases the amount. For this reason, all thevapor used in hygroscopicity studies possesses a slight netcharge, carried by small water droplets (≪50 nm diameter)generated by the action of the bubbler. Thus, in an EDB acounter charge will be attracted to and deposited on thelevitated droplet over time, resulting in the net charge of thedroplet being lowered and leading to an apparent increase inthe mass of the droplet, as per eq 1.Although the net charge found on the droplet in an EDB is
relatively low, on the fC scale,9,23 the density of the charge onthe droplet is not equally distributed. Charge−charge repulsiondictates that all of the excess charge on a droplet will be locatedat or near the surface, creating a microenvironment in thedroplet at the surface of high charge imbalance. When this iscoupled with extremely high solute concentrations within thedroplet, ranging from saturated to supersaturated, the environ-ment found within a levitated droplet with net charge is unlikeany that could be easily produced in the bulk phase. Theseconditions create the potential for redox chemistry to occurthat would not under normal conditions in solution. The resultof these reactions would lead to changes in the chemicalcomposition of levitated droplets over time. Thus, any studyinvolving aerosol with a significant net charge (>fC), thepotential for the charge to induce redox chemistry or affect gas/particle partitioning should be considered upon interpretingobservations.Aside from the excess charge, the mere act of levitation may
also alter the chemical composition of the droplet. For instance,ammonium is commonly found on ambient particulate matterin the atmosphere. The ammonium will be in equilibrium withany conjugate base present in the droplet, usually an anionicspecies, and the acid−base equilibrium that is establishedresults in the formation of ammonia. The small volume coupledwith high surface area-to-volume ratio of a droplet dictates thatany ammonia created will simply evaporate from the dropletunless there is an appropriate partial pressure of ammonia inthe gas phase to maintain an equilibrium balance with thecondensed phase. In many cases, the rate of loss of ammoniafrom a droplet may only be very slow as the equilibriumconstant for these reactions is very low, typically ranging from10−8 to 10−13 for anions common to ambient aerosols.
The Journal of Physical Chemistry A Article
dx.doi.org/10.1021/jp304920x | J. Phys. Chem. A XXXX, XXX, XXX−XXXB
Nevertheless, the time scale of loss must be considered whenundertaking hygroscopicity measurements on aerosol thatcontain ammonium salts.In this study we present three examples in which either the
charge or chemical composition of a trapped droplet varies overtime in initially unforeseen ways, leading to drifts in mass-to-charge ratio. We also consider how these variations must beaccounted for or minimized to arrive at unambiguous androbust results, particularly when making measurements ofhygroscopic growth. Specifically, two examples are presented inwhich the chemical composition of the particle is not constantover the course of a hygroscopicity measurement, one driven byredox chemistry and the other by the irreversible evaporation ofammonia over a short-time scale (minutes) liberated by acid−base chemistry. The first example presented, however,illustrates how the net charge on a droplet trapped in anEDB may not be static and the consequences of this for theaccuracy of hygroscopicity measurements.
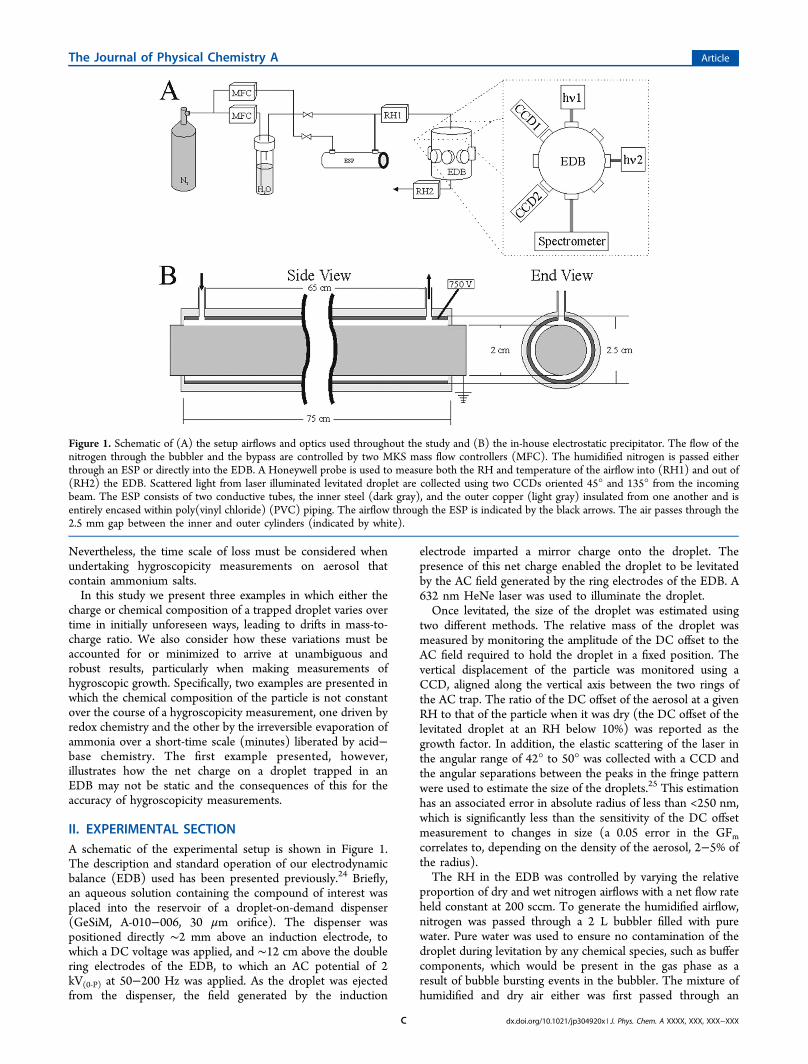
II. EXPERIMENTAL SECTIONA schematic of the experimental setup is shown in Figure 1.The description and standard operation of our electrodynamicbalance (EDB) used has been presented previously.24 Briefly,an aqueous solution containing the compound of interest wasplaced into the reservoir of a droplet-on-demand dispenser(GeSiM, A-010−006, 30 μm orifice). The dispenser waspositioned directly ∼2 mm above an induction electrode, towhich a DC voltage was applied, and ∼12 cm above the doublering electrodes of the EDB, to which an AC potential of 2kV(0‑P) at 50−200 Hz was applied. As the droplet was ejectedfrom the dispenser, the field generated by the induction
electrode imparted a mirror charge onto the droplet. Thepresence of this net charge enabled the droplet to be levitatedby the AC field generated by the ring electrodes of the EDB. A632 nm HeNe laser was used to illuminate the droplet.Once levitated, the size of the droplet was estimated using
two different methods. The relative mass of the droplet wasmeasured by monitoring the amplitude of the DC offset to theAC field required to hold the droplet in a fixed position. Thevertical displacement of the particle was monitored using aCCD, aligned along the vertical axis between the two rings ofthe AC trap. The ratio of the DC offset of the aerosol at a givenRH to that of the particle when it was dry (the DC offset of thelevitated droplet at an RH below 10%) was reported as thegrowth factor. In addition, the elastic scattering of the laser inthe angular range of 42° to 50° was collected with a CCD andthe angular separations between the peaks in the fringe patternwere used to estimate the size of the droplets.25 This estimationhas an associated error in absolute radius of less than <250 nm,which is significantly less than the sensitivity of the DC offsetmeasurement to changes in size (a 0.05 error in the GFmcorrelates to, depending on the density of the aerosol, 2−5% ofthe radius).The RH in the EDB was controlled by varying the relative
proportion of dry and wet nitrogen airflows with a net flow rateheld constant at 200 sccm. To generate the humidified airflow,nitrogen was passed through a 2 L bubbler filled with purewater. Pure water was used to ensure no contamination of thedroplet during levitation by any chemical species, such as buffercomponents, which would be present in the gas phase as aresult of bubble bursting events in the bubbler. The mixture ofhumidified and dry air either was first passed through an
Figure 1. Schematic of (A) the setup airflows and optics used throughout the study and (B) the in-house electrostatic precipitator. The flow of thenitrogen through the bubbler and the bypass are controlled by two MKS mass flow controllers (MFC). The humidified nitrogen is passed eitherthrough an ESP or directly into the EDB. A Honeywell probe is used to measure both the RH and temperature of the airflow into (RH1) and out of(RH2) the EDB. Scattered light from laser illuminated levitated droplet are collected using two CCDs oriented 45° and 135° from the incomingbeam. The ESP consists of two conductive tubes, the inner steel (dark gray), and the outer copper (light gray) insulated from one another and isentirely encased within poly(vinyl chloride) (PVC) piping. The airflow through the ESP is indicated by the black arrows. The air passes through the2.5 mm gap between the inner and outer cylinders (indicated by white).
The Journal of Physical Chemistry A Article
dx.doi.org/10.1021/jp304920x | J. Phys. Chem. A XXXX, XXX, XXX−XXXC
electrostatic precipitator (ESP) or was placed directly into theEDB. The ESP was built in house, the dimensions of whichwere shown in Figure 1B, and was implemented to allow theremoval of charged particles from the humidified gas flow. Thetemperature and relative humidity of the airflows entering andleaving the EDB were measured using two Honeywell probes(HIH-4602-A/C Series). The RH was then ramped from <20%to >90% then back to <20% over a period of ∼24 h, with 1 hgiven to equilibrate at each 10% increase in RH and two hoursgiven to equilibrate each 10% decrease in RH.The GF of the droplet trapped in the EDB at any given time
point was calculated using the method described in detailpreviously by Pope26 to account for temperature drift andgradients within the EDB itself. The time, RH and temperature(for both probes located in the top and bottom of thechamber), DC offset, and calculated aerosol radius weremeasured in real time at a frequency of 10 Hz. To keep thedata set manageable, it was compressed in real time into 10 sincrements. The collected values were averaged and thestandard deviation over this time period calculated.A second laser (Laser Quantum, Model Opus, 532 nm) was
aligned to illuminate the levitated droplet (inset of Figure 1A).The Raman spectra of the droplets were collected using anAndor Shamrock spectrometer (Model SR-303i-A) coupledwith an Andor iDus CCD (Moel DU420A-OE) and using theAndor SOLIS software for analysis. The Raman scattering wasintegrated for a period of 10 s and 20 accumulations weresummed for each reported Raman spectrum. Once levitated, ashort period of time was required to optimize the alignment ofthe droplet with the second laser. Thus, the first Ramanmeasurement was completed typically 4 min after the dropletwas captured in the trap.A second EDB, based on concentric-cylindrical electrodes
(Heinisch et al. 2009) was used to measure the time-resolvedsize evolution of droplets under fixed conditions. Theexperimental setup has been described in detail in an earlierpublication and will be only briefly reviewed here (Davies et al.2012). A charged droplet was introduced into the EDB andconfined within an airflow of known temperature and humidity.Elastic light scattering, collected with a CCD, was utilized toinfer the change in droplet size with time, either using thegeometric ray optics approach for estimating size from thefringe spacing or through full Mie calculations (Davies et al.2012). Changes in droplet size were measured with a time-resolution of <10 ms over a time window extending from a fewseconds to many hours. The first size recorded was ∼100 msafter droplet generation, accounting for the transit time of thedroplet from the microdispenser to a stable location in the trap.A good estimation of droplet initial size was attained by linearextrapolation of the radius-squared dependence to t = 0 s, andusing the solution concentration of the dispenser an estimate ofthe dry size was made (Davies et al. 2012).The net charge of droplets generated by the microdispenser
was measured using a Keithley 6514 System electrometercoupled to an in-house constructed Faraday cup. The amountof charge per droplet as a function of the dispenser pulseheight, pulse width and pulse frequency, and dispenser heightfrom, and amplitude of and inner diameter of, the inductionelectrode were measured.Sodium chloride (>99.5%, lab reagent grade, S7653), citric
acid (>99.5%, lab reagent grade, 251275), iodic acid (>99.5%,ACS reagent, 58060), ammonium succinate (S427594),
succinic acid (>99%, S3674), and sucrose (>99.5%, S7903)were all purchased from Sigma-Aldrich and used as supplied.
III. RESULTSWe first consider an example of the need to account for drifts inparticle charge over time when making EDB measurements ofhygroscopic growth, suggesting a method that reliably avoidsthe systematic decrease in charge over long time frames and athigh relative humidity. In a second example, we explore theproblems associated with performing hygroscopicity measure-ments when the dry mass of the particle changes with time dueto volatilization of semivolatile components produced throughsimple acid−base chemistry. We then consider how the dropletcharge can drive changes in composition (and dry mass)through redox chemistry in a final example.
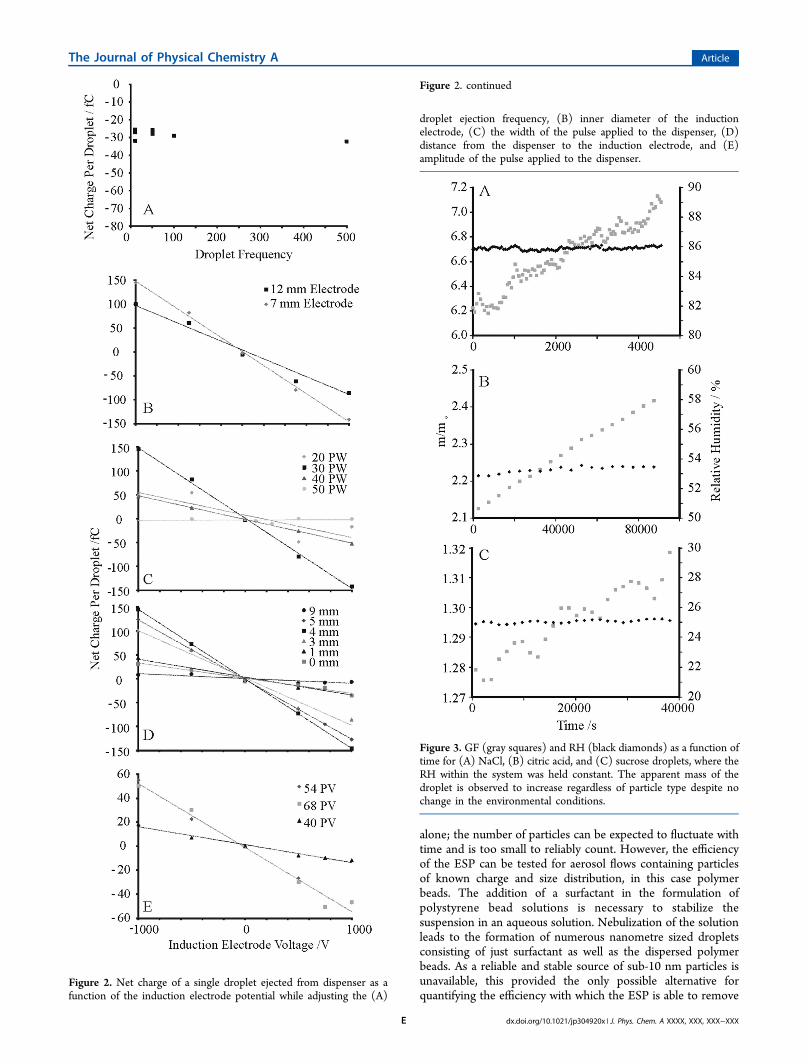
A. Change in Net Charge: Neutralization by anHumified Airflow. The amount of net charge imparted to adroplet when generated by the microdispenser under variousconditions is shown in Figure 2. The total net charge perdroplet is independent of pulse frequency and pulse heightwhile being dependent on pulse width, dispenser distance fromthe induction electrode, size of the hole in the inductionelectrode, and the amplitude of the induction electrode. Themeasured net charge per droplet was in line with similarmeasurements by other groups.9,23
The apparent drift in the GF observed in various particletypes when the RH was held constant over a long period oftime at a given RH are shown in Figure 3. This change isreferred to as “apparent” simply because this is how the changemight be attributed, even though the RH is invariant in thesemeasurements and, thus, the mass of the particle is notchanging. For all samples, the RH of the previous step of theRH profile was higher than that of the RH in which themeasurements were made. Thus the apparent changes in sizeare not the result of a kinetically limited change in droplet massthrough slow water loss. Although the degree of the shift is notthe same for all systems, the presence of the drift was observedin numerous particle types, demonstrating that the drift isindependent of the solute within the aqueous droplet. Thedegree of the drift was dependent on the RH: the greater theRH, the larger the rate of the apparent drift. For the sucroseparticle (Figure 3C), a detectible drift was observed at an RHunder 30%, where the aerosol is in a glassy state.27 In everyinstance, the drift was observed to be positive meaning that atno point was the aerosol gaining net charge.The net effect of drift on the GF of a NaCl droplet over two
RH cycles spanning 3 days is shown in Figure 4A. Anexamination of the absolute radius of the droplet measuredoptically shows no similar systematic shift in the absolute radiusbetween the two cycles. The limitations of optical analysis areapparent as the measurements of the size of the droplet areonly possible when the particle is spherical and present as asolution. The net shift in the GF of the exact same dropletcalculated from the DC offset data over the same period of timeis also shown. What is apparent is the continual increase in theGF of the droplet from one cycle to the next, and that there is acomplete lack of reproducibility between cycles. Clearly, amethod is required to remove charged species from thehumidified gas flow.The ability of the ESP to remove suspended charged droplets
from a humidified gas stream is shown in Figure S1(Supporting Information). Reliable measurements cannot beunambiguously made on the humidified gas flow from a bubbler
The Journal of Physical Chemistry A Article
dx.doi.org/10.1021/jp304920x | J. Phys. Chem. A XXXX, XXX, XXX−XXXD
alone; the number of particles can be expected to fluctuate withtime and is too small to reliably count. However, the efficiencyof the ESP can be tested for aerosol flows containing particlesof known charge and size distribution, in this case polymerbeads. The addition of a surfactant in the formulation ofpolystyrene bead solutions is necessary to stabilize thesuspension in an aqueous solution. Nebulization of the solutionleads to the formation of numerous nanometre sized dropletsconsisting of just surfactant as well as the dispersed polymerbeads. As a reliable and stable source of sub-10 nm particles isunavailable, this provided the only possible alternative forquantifying the efficiency with which the ESP is able to remove
Figure 2. Net charge of a single droplet ejected from dispenser as afunction of the induction electrode potential while adjusting the (A)
Figure 2. continued
droplet ejection frequency, (B) inner diameter of the inductionelectrode, (C) the width of the pulse applied to the dispenser, (D)distance from the dispenser to the induction electrode, and (E)amplitude of the pulse applied to the dispenser.
Figure 3. GF (gray squares) and RH (black diamonds) as a function oftime for (A) NaCl, (B) citric acid, and (C) sucrose droplets, where theRH within the system was held constant. The apparent mass of thedroplet is observed to increase regardless of particle type despite nochange in the environmental conditions.
The Journal of Physical Chemistry A Article
dx.doi.org/10.1021/jp304920x | J. Phys. Chem. A XXXX, XXX, XXX−XXXE
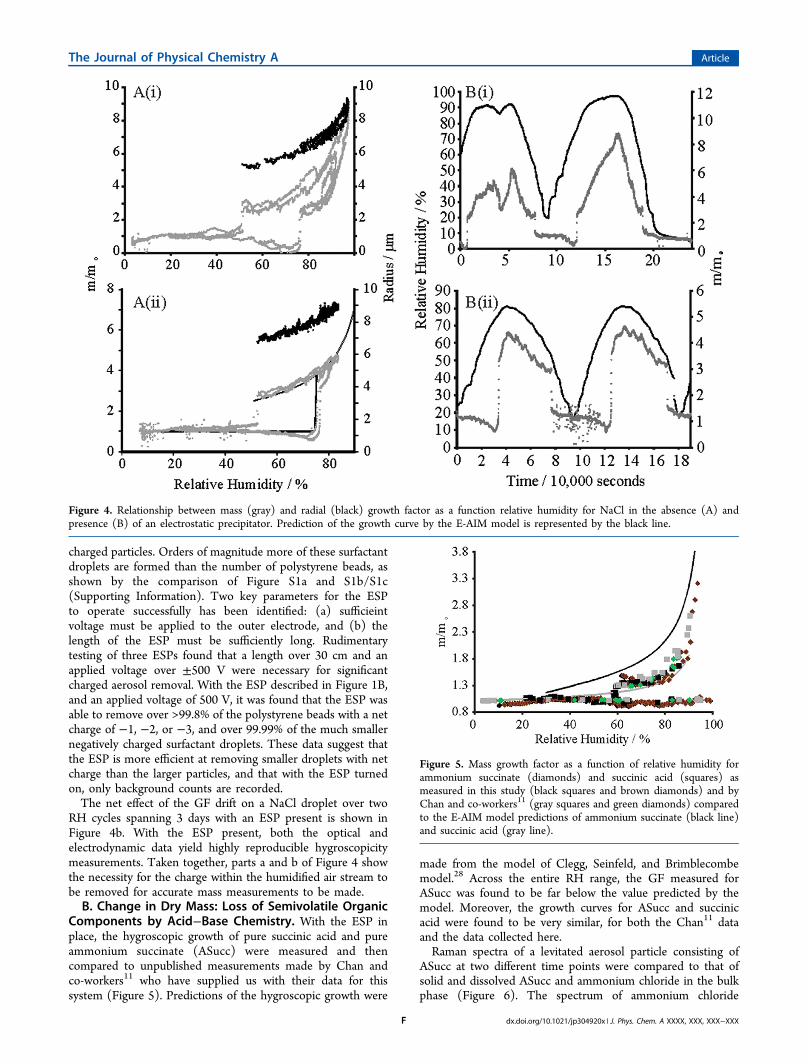
charged particles. Orders of magnitude more of these surfactantdroplets are formed than the number of polystyrene beads, asshown by the comparison of Figure S1a and S1b/S1c(Supporting Information). Two key parameters for the ESPto operate successfully has been identified: (a) sufficieintvoltage must be applied to the outer electrode, and (b) thelength of the ESP must be sufficiently long. Rudimentarytesting of three ESPs found that a length over 30 cm and anapplied voltage over ±500 V were necessary for significantcharged aerosol removal. With the ESP described in Figure 1B,and an applied voltage of 500 V, it was found that the ESP wasable to remove over >99.8% of the polystyrene beads with a netcharge of −1, −2, or −3, and over 99.99% of the much smallernegatively charged surfactant droplets. These data suggest thatthe ESP is more efficient at removing smaller droplets with netcharge than the larger particles, and that with the ESP turnedon, only background counts are recorded.The net effect of the GF drift on a NaCl droplet over two
RH cycles spanning 3 days with an ESP present is shown inFigure 4b. With the ESP present, both the optical andelectrodynamic data yield highly reproducible hygroscopicitymeasurements. Taken together, parts a and b of Figure 4 showthe necessity for the charge within the humidified air stream tobe removed for accurate mass measurements to be made.B. Change in Dry Mass: Loss of Semivolatile Organic
Components by Acid−Base Chemistry. With the ESP inplace, the hygroscopic growth of pure succinic acid and pureammonium succinate (ASucc) were measured and thencompared to unpublished measurements made by Chan andco-workers11 who have supplied us with their data for thissystem (Figure 5). Predictions of the hygroscopic growth were
made from the model of Clegg, Seinfeld, and Brimblecombemodel.28 Across the entire RH range, the GF measured forASucc was found to be far below the value predicted by themodel. Moreover, the growth curves for ASucc and succinicacid were found to be very similar, for both the Chan11 dataand the data collected here.Raman spectra of a levitated aerosol particle consisting of
ASucc at two different time points were compared to that ofsolid and dissolved ASucc and ammonium chloride in the bulkphase (Figure 6). The spectrum of ammonium chloride
Figure 4. Relationship between mass (gray) and radial (black) growth factor as a function relative humidity for NaCl in the absence (A) andpresence (B) of an electrostatic precipitator. Prediction of the growth curve by the E-AIM model is represented by the black line.
Figure 5. Mass growth factor as a function of relative humidity forammonium succinate (diamonds) and succinic acid (squares) asmeasured in this study (black squares and brown diamonds) and byChan and co-workers11 (gray squares and green diamonds) comparedto the E-AIM model predictions of ammonium succinate (black line)and succinic acid (gray line).
The Journal of Physical Chemistry A Article
dx.doi.org/10.1021/jp304920x | J. Phys. Chem. A XXXX, XXX, XXX−XXXF
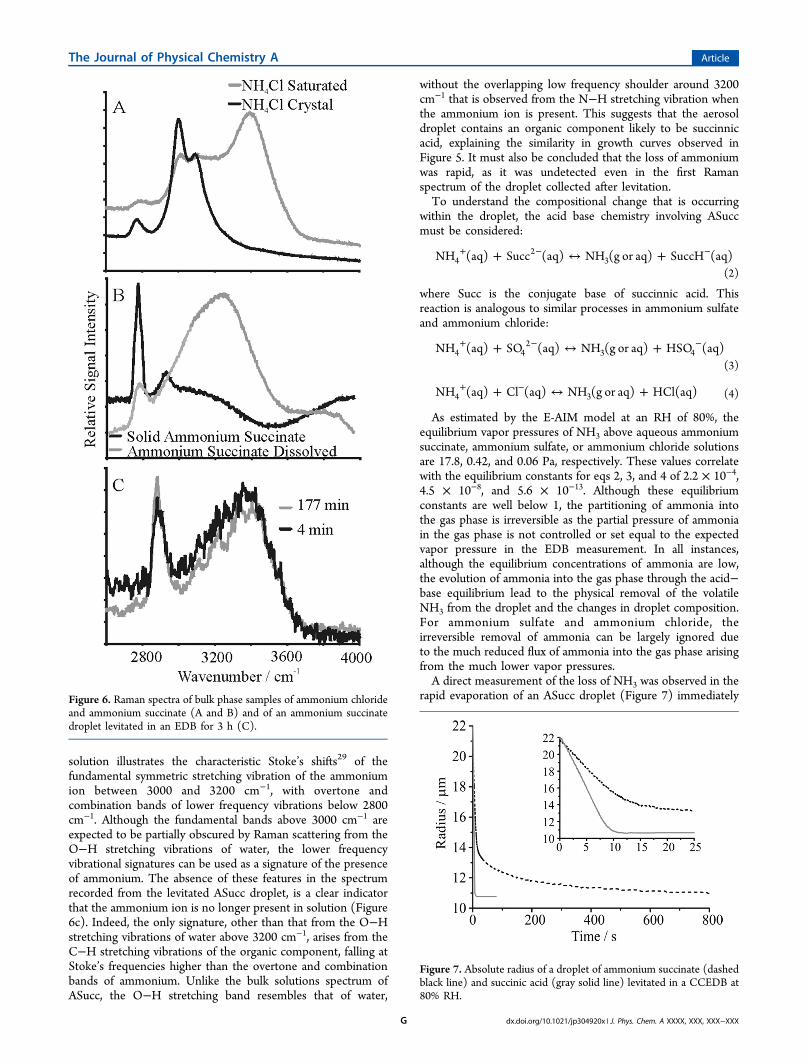
solution illustrates the characteristic Stoke’s shifts29 of thefundamental symmetric stretching vibration of the ammoniumion between 3000 and 3200 cm−1, with overtone andcombination bands of lower frequency vibrations below 2800cm−1. Although the fundamental bands above 3000 cm−1 areexpected to be partially obscured by Raman scattering from theO−H stretching vibrations of water, the lower frequencyvibrational signatures can be used as a signature of the presenceof ammonium. The absence of these features in the spectrumrecorded from the levitated ASucc droplet, is a clear indicatorthat the ammonium ion is no longer present in solution (Figure6c). Indeed, the only signature, other than that from the O−Hstretching vibrations of water above 3200 cm−1, arises from theC−H stretching vibrations of the organic component, falling atStoke’s frequencies higher than the overtone and combinationbands of ammonium. Unlike the bulk solutions spectrum ofASucc, the O−H stretching band resembles that of water,
without the overlapping low frequency shoulder around 3200cm−1 that is observed from the N−H stretching vibration whenthe ammonium ion is present. This suggests that the aerosoldroplet contains an organic component likely to be succinnicacid, explaining the similarity in growth curves observed inFigure 5. It must also be concluded that the loss of ammoniumwas rapid, as it was undetected even in the first Ramanspectrum of the droplet collected after levitation.To understand the compositional change that is occurring
within the droplet, the acid base chemistry involving ASuccmust be considered:
+ ↔ ++ − −NH (aq) Succ (aq) NH (g or aq) SuccH (aq)42
3(2)
where Succ is the conjugate base of succinnic acid. Thisreaction is analogous to similar processes in ammonium sulfateand ammonium chloride:
+ ↔ ++ − −NH (aq) SO (aq) NH (g or aq) HSO (aq)4 42
3 4(3)
+ ↔ ++ −NH (aq) Cl (aq) NH (g or aq) HCl(aq)4 3 (4)
As estimated by the E-AIM model at an RH of 80%, theequilibrium vapor pressures of NH3 above aqueous ammoniumsuccinate, ammonium sulfate, or ammonium chloride solutionsare 17.8, 0.42, and 0.06 Pa, respectively. These values correlatewith the equilibrium constants for eqs 2, 3, and 4 of 2.2 × 10−4,4.5 × 10−8, and 5.6 × 10⁻¹³. Although these equilibriumconstants are well below 1, the partitioning of ammonia intothe gas phase is irreversible as the partial pressure of ammoniain the gas phase is not controlled or set equal to the expectedvapor pressure in the EDB measurement. In all instances,although the equilibrium concentrations of ammonia are low,the evolution of ammonia into the gas phase through the acid−base equilibrium lead to the physical removal of the volatileNH3 from the droplet and the changes in droplet composition.For ammonium sulfate and ammonium chloride, theirreversible removal of ammonia can be largely ignored dueto the much reduced flux of ammonia into the gas phase arisingfrom the much lower vapor pressures.A direct measurement of the loss of NH3 was observed in the
rapid evaporation of an ASucc droplet (Figure 7) immediatelyFigure 6. Raman spectra of bulk phase samples of ammonium chlorideand ammonium succinate (A and B) and of an ammonium succinatedroplet levitated in an EDB for 3 h (C).
Figure 7. Absolute radius of a droplet of ammonium succinate (dashedblack line) and succinic acid (gray solid line) levitated in a CCEDB at80% RH.
The Journal of Physical Chemistry A Article
dx.doi.org/10.1021/jp304920x | J. Phys. Chem. A XXXX, XXX, XXX−XXXG
following trap loading in the concentric cylinder EDB at an RHof 80%. The water evaporated from the droplet in the first 10 sfollowing droplet generation, after which a slow loss of NH3can be seen. From the data, it appears to take on the order of12 min for all of the NH3 to leave the droplet, although themajority was lost in the first few minutes, coinciding well withthe time scale over which the Raman data reported earlier werecollected (Figure 6). In contrast, the initial rapid size changesobserved for a solution droplet of succinic acid when injectedinto the EDB can all be attributed to the rapid loss of wateruntil an equilibrium state is achieved (Figure 7), occurring on asimilar time scale to the initial rapid loss of water from theASucc droplet. No subsequent slow loss of a semivolatilecomponent is observed on the longer time scale. Forammonium sulfate, with an equilibrium ammonia vaporpressure of ∼2.5% of that from ASucc, a similar mass loss ofammonia would be expected to occur over a time frame ofmany hours, sufficiently long that it can ignored for mostmeasurements.It should be noted that the observed change in the chemical
composition driven by the acid base chemistry is not unique tothe EDB and will occur in other single aerosol analysistechniques and may go as far as to affect multiaerosol analysistechniques such as the tandem DMA. Indeed, McFiggans andco-workers have recently established that the irreversiblepartitioning of semivolatile organic compounds in HTDMAmeasurements must be accounted for in measurements ofhygroscopic growth.7 With change in RH, associated changes inthe equilibrium partitioning of the mass of the organiccomponents into the condensed phase are not able to occur,with the sheath gas flows devoid of the organic components. Ithas been suggested that this can lead to measurements ofgrowth factor that are systematically in error.C. Change in the Chemical Composition: Redox
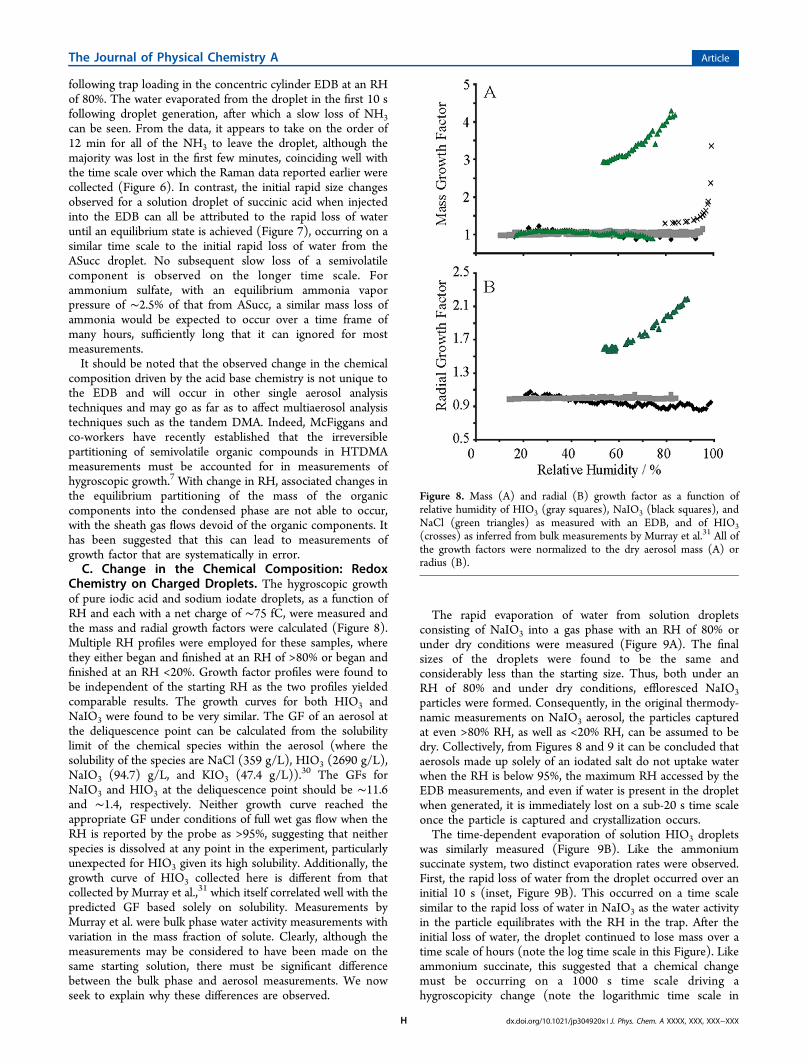
Chemistry on Charged Droplets. The hygroscopic growthof pure iodic acid and sodium iodate droplets, as a function ofRH and each with a net charge of ∼75 fC, were measured andthe mass and radial growth factors were calculated (Figure 8).Multiple RH profiles were employed for these samples, wherethey either began and finished at an RH of >80% or began andfinished at an RH <20%. Growth factor profiles were found tobe independent of the starting RH as the two profiles yieldedcomparable results. The growth curves for both HIO3 andNaIO3 were found to be very similar. The GF of an aerosol atthe deliquescence point can be calculated from the solubilitylimit of the chemical species within the aerosol (where thesolubility of the species are NaCl (359 g/L), HIO3 (2690 g/L),NaIO3 (94.7) g/L, and KIO3 (47.4 g/L)).30 The GFs forNaIO3 and HIO3 at the deliquescence point should be ∼11.6and ∼1.4, respectively. Neither growth curve reached theappropriate GF under conditions of full wet gas flow when theRH is reported by the probe as >95%, suggesting that neitherspecies is dissolved at any point in the experiment, particularlyunexpected for HIO3 given its high solubility. Additionally, thegrowth curve of HIO3 collected here is different from thatcollected by Murray et al.,31 which itself correlated well with thepredicted GF based solely on solubility. Measurements byMurray et al. were bulk phase water activity measurements withvariation in the mass fraction of solute. Clearly, although themeasurements may be considered to have been made on thesame starting solution, there must be significant differencebetween the bulk phase and aerosol measurements. We nowseek to explain why these differences are observed.
The rapid evaporation of water from solution dropletsconsisting of NaIO3 into a gas phase with an RH of 80% orunder dry conditions were measured (Figure 9A). The finalsizes of the droplets were found to be the same andconsiderably less than the starting size. Thus, both under anRH of 80% and under dry conditions, effloresced NaIO3particles were formed. Consequently, in the original thermody-namic measurements on NaIO3 aerosol, the particles capturedat even >80% RH, as well as <20% RH, can be assumed to bedry. Collectively, from Figures 8 and 9 it can be concluded thataerosols made up solely of an iodated salt do not uptake waterwhen the RH is below 95%, the maximum RH accessed by theEDB measurements, and even if water is present in the dropletwhen generated, it is immediately lost on a sub-20 s time scaleonce the particle is captured and crystallization occurs.The time-dependent evaporation of solution HIO3 droplets
was similarly measured (Figure 9B). Like the ammoniumsuccinate system, two distinct evaporation rates were observed.First, the rapid loss of water from the droplet occurred over aninitial 10 s (inset, Figure 9B). This occurred on a time scalesimilar to the rapid loss of water in NaIO3 as the water activityin the particle equilibrates with the RH in the trap. After theinitial loss of water, the droplet continued to lose mass over atime scale of hours (note the log time scale in this Figure). Likeammonium succinate, this suggested that a chemical changemust be occurring on a 1000 s time scale driving ahygroscopicity change (note the logarithmic time scale in
Figure 8. Mass (A) and radial (B) growth factor as a function ofrelative humidity of HIO3 (gray squares), NaIO3 (black squares), andNaCl (green triangles) as measured with an EDB, and of HIO3(crosses) as inferred from bulk measurements by Murray et al.31 All ofthe growth factors were normalized to the dry aerosol mass (A) orradius (B).
The Journal of Physical Chemistry A Article
dx.doi.org/10.1021/jp304920x | J. Phys. Chem. A XXXX, XXX, XXX−XXXH
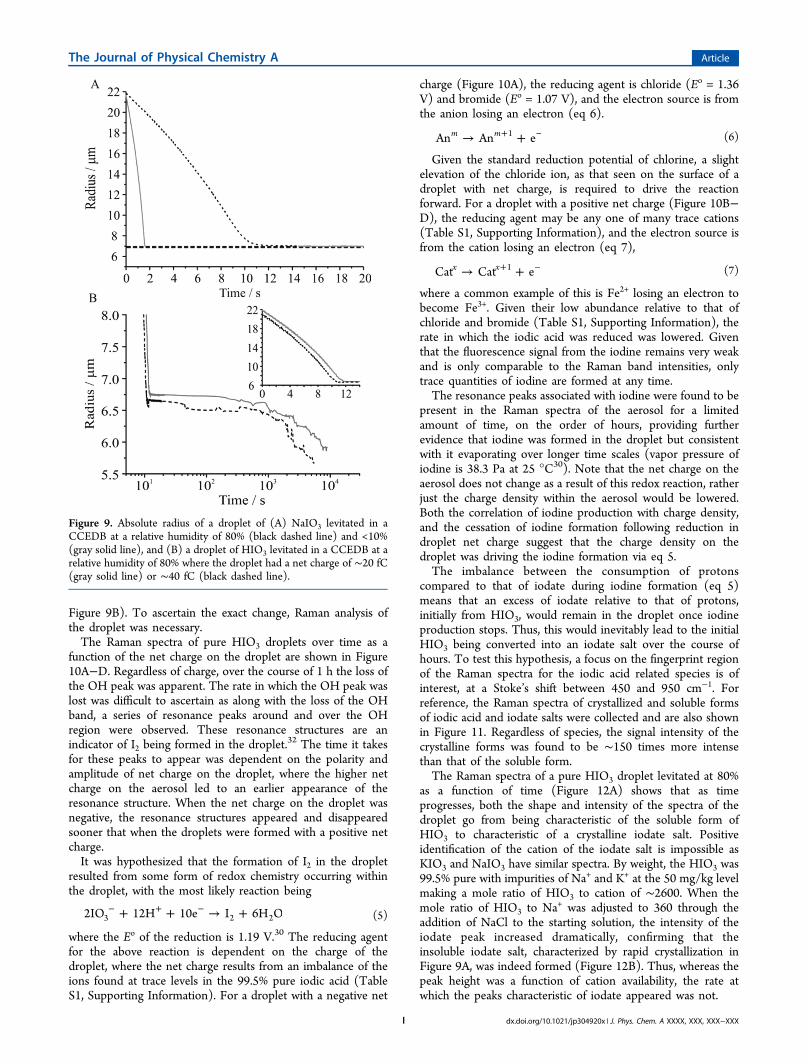
Figure 9B). To ascertain the exact change, Raman analysis ofthe droplet was necessary.The Raman spectra of pure HIO3 droplets over time as a
function of the net charge on the droplet are shown in Figure10A−D. Regardless of charge, over the course of 1 h the loss ofthe OH peak was apparent. The rate in which the OH peak waslost was difficult to ascertain as along with the loss of the OHband, a series of resonance peaks around and over the OHregion were observed. These resonance structures are anindicator of I2 being formed in the droplet.32 The time it takesfor these peaks to appear was dependent on the polarity andamplitude of net charge on the droplet, where the higher netcharge on the aerosol led to an earlier appearance of theresonance structure. When the net charge on the droplet wasnegative, the resonance structures appeared and disappearedsooner that when the droplets were formed with a positive netcharge.It was hypothesized that the formation of I2 in the droplet
resulted from some form of redox chemistry occurring withinthe droplet, with the most likely reaction being
+ + → +− + −2IO 12H 10e I 6H O3 2 2 (5)
where the Eo of the reduction is 1.19 V.30 The reducing agentfor the above reaction is dependent on the charge of thedroplet, where the net charge results from an imbalance of theions found at trace levels in the 99.5% pure iodic acid (TableS1, Supporting Information). For a droplet with a negative net
charge (Figure 10A), the reducing agent is chloride (Eo = 1.36V) and bromide (Eo = 1.07 V), and the electron source is fromthe anion losing an electron (eq 6).
→ ++ −An An em m 1 (6)
Given the standard reduction potential of chlorine, a slightelevation of the chloride ion, as that seen on the surface of adroplet with net charge, is required to drive the reactionforward. For a droplet with a positive net charge (Figure 10B−D), the reducing agent may be any one of many trace cations(Table S1, Supporting Information), and the electron source isfrom the cation losing an electron (eq 7),
→ ++ −Cat Cat ex x 1 (7)
where a common example of this is Fe2+ losing an electron tobecome Fe3+. Given their low abundance relative to that ofchloride and bromide (Table S1, Supporting Information), therate in which the iodic acid was reduced was lowered. Giventhat the fluorescence signal from the iodine remains very weakand is only comparable to the Raman band intensities, onlytrace quantities of iodine are formed at any time.The resonance peaks associated with iodine were found to be
present in the Raman spectra of the aerosol for a limitedamount of time, on the order of hours, providing furtherevidence that iodine was formed in the droplet but consistentwith it evaporating over longer time scales (vapor pressure ofiodine is 38.3 Pa at 25 °C30). Note that the net charge on theaerosol does not change as a result of this redox reaction, ratherjust the charge density within the aerosol would be lowered.Both the correlation of iodine production with charge density,and the cessation of iodine formation following reduction indroplet net charge suggest that the charge density on thedroplet was driving the iodine formation via eq 5.The imbalance between the consumption of protons
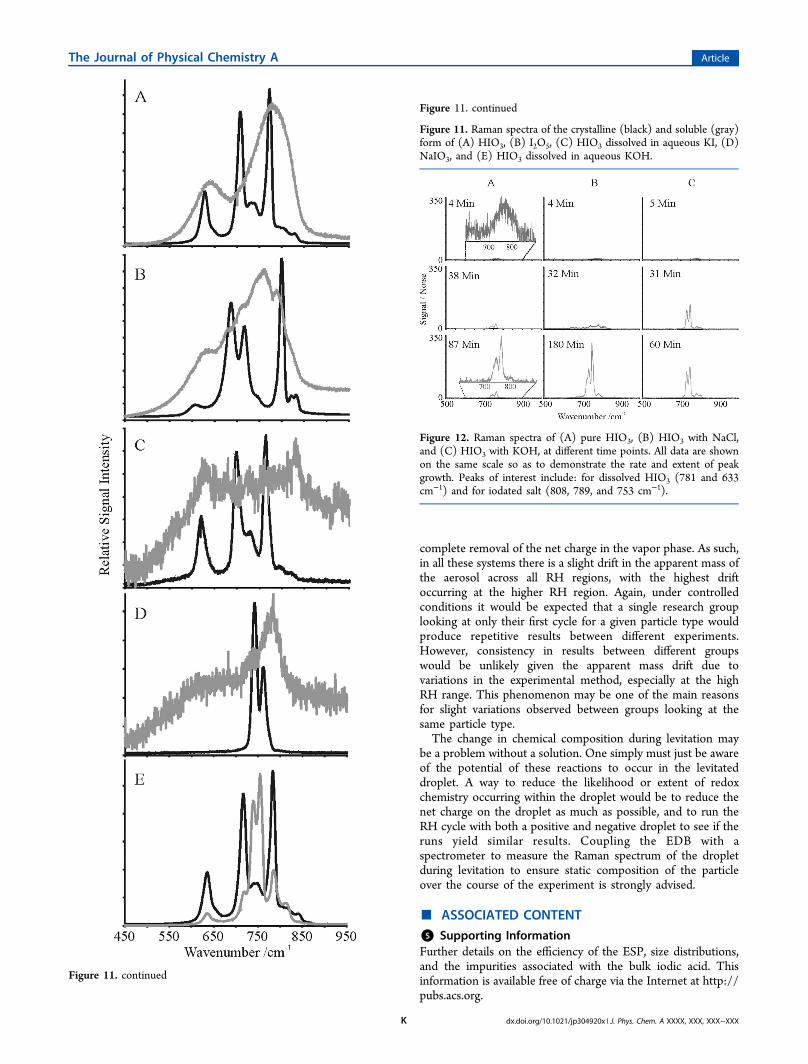
compared to that of iodate during iodine formation (eq 5)means that an excess of iodate relative to that of protons,initially from HIO3, would remain in the droplet once iodineproduction stops. Thus, this would inevitably lead to the initialHIO3 being converted into an iodate salt over the course ofhours. To test this hypothesis, a focus on the fingerprint regionof the Raman spectra for the iodic acid related species is ofinterest, at a Stoke’s shift between 450 and 950 cm−1. Forreference, the Raman spectra of crystallized and soluble formsof iodic acid and iodate salts were collected and are also shownin Figure 11. Regardless of species, the signal intensity of thecrystalline forms was found to be ∼150 times more intensethan that of the soluble form.The Raman spectra of a pure HIO3 droplet levitated at 80%
as a function of time (Figure 12A) shows that as timeprogresses, both the shape and intensity of the spectra of thedroplet go from being characteristic of the soluble form ofHIO3 to characteristic of a crystalline iodate salt. Positiveidentification of the cation of the iodate salt is impossible asKIO3 and NaIO3 have similar spectra. By weight, the HIO3 was99.5% pure with impurities of Na+ and K+ at the 50 mg/kg levelmaking a mole ratio of HIO3 to cation of ∼2600. When themole ratio of HIO3 to Na+ was adjusted to 360 through theaddition of NaCl to the starting solution, the intensity of theiodate peak increased dramatically, confirming that theinsoluble iodate salt, characterized by rapid crystallization inFigure 9A, was indeed formed (Figure 12B). Thus, whereas thepeak height was a function of cation availability, the rate atwhich the peaks characteristic of iodate appeared was not.
Figure 9. Absolute radius of a droplet of (A) NaIO3 levitated in aCCEDB at a relative humidity of 80% (black dashed line) and <10%(gray solid line), and (B) a droplet of HIO3 levitated in a CCEDB at arelative humidity of 80% where the droplet had a net charge of ∼20 fC(gray solid line) or ∼40 fC (black dashed line).
The Journal of Physical Chemistry A Article
dx.doi.org/10.1021/jp304920x | J. Phys. Chem. A XXXX, XXX, XXX−XXXI
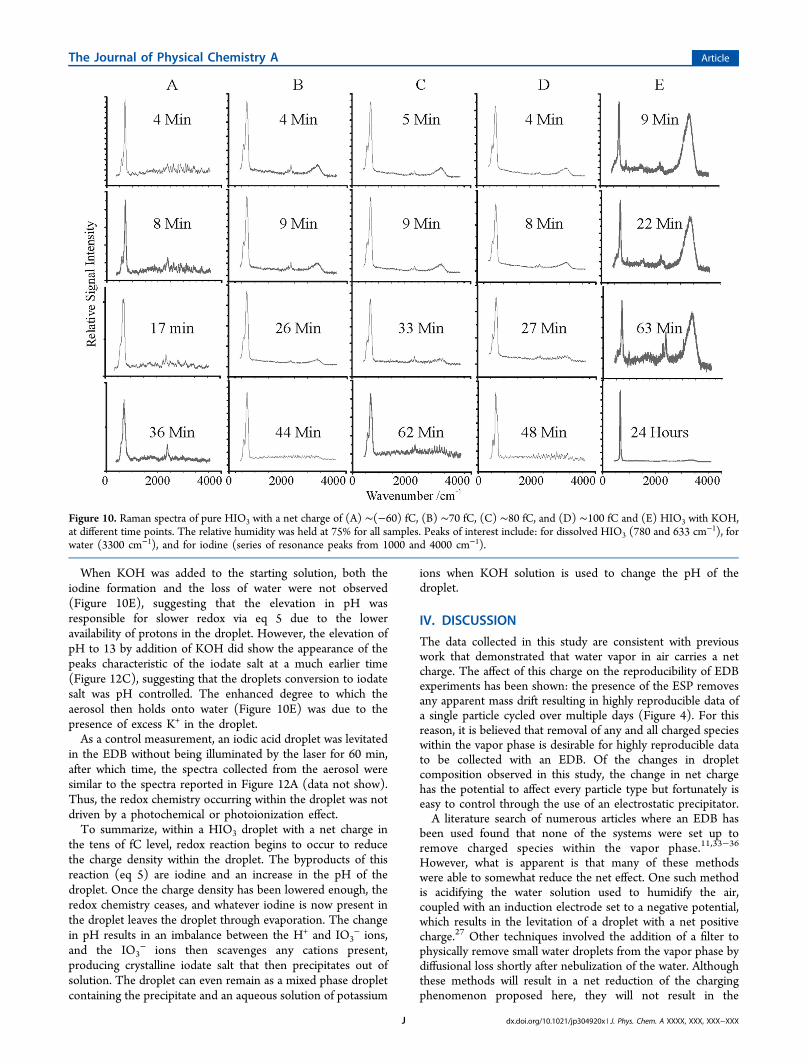
When KOH was added to the starting solution, both theiodine formation and the loss of water were not observed(Figure 10E), suggesting that the elevation in pH wasresponsible for slower redox via eq 5 due to the loweravailability of protons in the droplet. However, the elevation ofpH to 13 by addition of KOH did show the appearance of thepeaks characteristic of the iodate salt at a much earlier time(Figure 12C), suggesting that the droplets conversion to iodatesalt was pH controlled. The enhanced degree to which theaerosol then holds onto water (Figure 10E) was due to thepresence of excess K+ in the droplet.As a control measurement, an iodic acid droplet was levitated
in the EDB without being illuminated by the laser for 60 min,after which time, the spectra collected from the aerosol weresimilar to the spectra reported in Figure 12A (data not show).Thus, the redox chemistry occurring within the droplet was notdriven by a photochemical or photoionization effect.To summarize, within a HIO3 droplet with a net charge in
the tens of fC level, redox reaction begins to occur to reducethe charge density within the droplet. The byproducts of thisreaction (eq 5) are iodine and an increase in the pH of thedroplet. Once the charge density has been lowered enough, theredox chemistry ceases, and whatever iodine is now present inthe droplet leaves the droplet through evaporation. The changein pH results in an imbalance between the H+ and IO3
− ions,and the IO3
− ions then scavenges any cations present,producing crystalline iodate salt that then precipitates out ofsolution. The droplet can even remain as a mixed phase dropletcontaining the precipitate and an aqueous solution of potassium
ions when KOH solution is used to change the pH of thedroplet.
IV. DISCUSSION
The data collected in this study are consistent with previouswork that demonstrated that water vapor in air carries a netcharge. The affect of this charge on the reproducibility of EDBexperiments has been shown: the presence of the ESP removesany apparent mass drift resulting in highly reproducible data ofa single particle cycled over multiple days (Figure 4). For thisreason, it is believed that removal of any and all charged specieswithin the vapor phase is desirable for highly reproducible datato be collected with an EDB. Of the changes in dropletcomposition observed in this study, the change in net chargehas the potential to affect every particle type but fortunately iseasy to control through the use of an electrostatic precipitator.A literature search of numerous articles where an EDB has
been used found that none of the systems were set up toremove charged species within the vapor phase.11,33−36
However, what is apparent is that many of these methodswere able to somewhat reduce the net effect. One such methodis acidifying the water solution used to humidify the air,coupled with an induction electrode set to a negative potential,which results in the levitation of a droplet with a net positivecharge.27 Other techniques involved the addition of a filter tophysically remove small water droplets from the vapor phase bydiffusional loss shortly after nebulization of the water. Althoughthese methods will result in a net reduction of the chargingphenomenon proposed here, they will not result in the
Figure 10. Raman spectra of pure HIO3 with a net charge of (A) ∼(−60) fC, (B) ∼70 fC, (C) ∼80 fC, and (D) ∼100 fC and (E) HIO3 with KOH,at different time points. The relative humidity was held at 75% for all samples. Peaks of interest include: for dissolved HIO3 (780 and 633 cm
−1), forwater (3300 cm−1), and for iodine (series of resonance peaks from 1000 and 4000 cm−1).
The Journal of Physical Chemistry A Article
dx.doi.org/10.1021/jp304920x | J. Phys. Chem. A XXXX, XXX, XXX−XXXJ
complete removal of the net charge in the vapor phase. As such,in all these systems there is a slight drift in the apparent mass ofthe aerosol across all RH regions, with the highest driftoccurring at the higher RH region. Again, under controlledconditions it would be expected that a single research grouplooking at only their first cycle for a given particle type wouldproduce repetitive results between different experiments.However, consistency in results between different groupswould be unlikely given the apparent mass drift due tovariations in the experimental method, especially at the highRH range. This phenomenon may be one of the main reasonsfor slight variations observed between groups looking at thesame particle type.The change in chemical composition during levitation may
be a problem without a solution. One simply must just be awareof the potential of these reactions to occur in the levitateddroplet. A way to reduce the likelihood or extent of redoxchemistry occurring within the droplet would be to reduce thenet charge on the droplet as much as possible, and to run theRH cycle with both a positive and negative droplet to see if theruns yield similar results. Coupling the EDB with aspectrometer to measure the Raman spectrum of the dropletduring levitation to ensure static composition of the particleover the course of the experiment is strongly advised.
■ ASSOCIATED CONTENT
*S Supporting InformationFurther details on the efficiency of the ESP, size distributions,and the impurities associated with the bulk iodic acid. Thisinformation is available free of charge via the Internet at http://pubs.acs.org.
Figure 11. continued
Figure 11. continued
Figure 11. Raman spectra of the crystalline (black) and soluble (gray)form of (A) HIO3, (B) I2O5, (C) HIO3 dissolved in aqueous KI, (D)NaIO3, and (E) HIO3 dissolved in aqueous KOH.
Figure 12. Raman spectra of (A) pure HIO3, (B) HIO3 with NaCl,and (C) HIO3 with KOH, at different time points. All data are shownon the same scale so as to demonstrate the rate and extent of peakgrowth. Peaks of interest include: for dissolved HIO3 (781 and 633cm−1) and for iodated salt (808, 789, and 753 cm−1).
The Journal of Physical Chemistry A Article
dx.doi.org/10.1021/jp304920x | J. Phys. Chem. A XXXX, XXX, XXX−XXXK
■ AUTHOR INFORMATION
Corresponding Author*Tel: 0117-331-7388. E-mail: [email protected].
NotesThe authors declare no competing financial interest.
■ ACKNOWLEDGMENTS
Professor Chak Chan (University of Science and Technology,Hong Kong) is acknowledged for sharing with us hisunpublished measurements of the hygroscopicity of ammoniumsuccinate. Informative and insightful discussions with BenMurray, Nana Kwamena, Jon Wills, and Rachael Miles areacknowledged. The hardware and high voltage power suppliesof the EDB were supplied by the Laboratory for Global Marineand Atmospheric Chemistry and Professor Simon Clegg(University of East Anglia, U.K.) is acknowledged for helpfuldiscussions and for providing the E-AIM simulations forammonium succinate. J.P.R. acknowledges financial supportfrom the EPSRC through the support of a LeadershipFellowship. A.E.H. acknowledges the University of Bristol andthe EPSRC for the support of a postdoctoral researchfellowship.
■ REFERENCES(1) Forster, P.; et al. Changes in Atmospheric Constituents and inRadiative Forcing in Climate Change 2007: The Physical Science Basis.Contribuion of Working Group I to the Fourth Assessment Report ofthe Intergovenmental Panel on Climate Change, 2007.(2) Dockery, D. W.; Pope, C. A.; Xu, X. P.; Spengler, J. D.; Ware, J.H.; Fay, M. E.; Ferris, B. G.; Speizer, F. E. An Association between Air-Pollution and Mortality in 6 United-States Cities. New Engl. J. Med.1993, 329 (24), 1753−1759.(3) Dockery, D. W.; Pope, C. A. Acute Respiratory Effects ofParticulate Air-Pollution. Annu. Rev. Publ. Health 1994, 15, 107−132.(4) Davis, E. J.; Buehler, M. F.; Ward, T. L. The Double-RingElectrodynamic Balance for Microparticle Characterization. Rev. Sci.Instrum. 1990, 61 (4), 1281−1288.(5) Davis, E. J.; Ravindran, P. Single-Particle Light-ScatteringMeasurements Using the Electrodynamic Balance. Aerosol Sci. Technol.1982, 1 (3), 337−350.(6) Hopkins, R. J.; Mitchem, L.; Ward, A. D.; Reid, J. P. Control andcharacterisation of a single aerosol droplet in a single-beam gradient-force optical trap. Phys. Chem. Chem. Phys. 2004, 6 (21), 4924−4927.(7) Barley, M. H.; Topping, D.; Lowe, D.; Utembe, S.; McFiggans, G.The sensitivity of secondary organic aerosol (SOA) componentpartitioning to the predictions of component properties - Part 3:Investigation of condensed compounds generated by a near-explicitmodel of VOC oxidation. Atmos. Chem. Phys. 2011, 11 (24), 13145−13159.(8) Davis, E. J. A history of single aerosol particle levitation. AerosolSci. Technol. 1997, 26 (3), 212−254.(9) Bogan, M. J.; Bakhoum, S. F. W.; Agnes, G. R. Promotion ofalpha-cyano-4-hydroxycinnamic acid and peptide cocrystallizationwithin levitated droplets with net charge. J. Am. Soc. Mass Spectrom.2005, 16 (2), 254−262.(10) Philip, M. A.; Gelbard, F.; Arnold, S. An Absolute Method forAerosol-Particle Mass and Charge Measurement. J. Colloid Interface Sci.1983, 91 (2), 507−515.(11) Liang, Z.; Chan, C. K. A fast technique for measuring wateractivity of atmospheric aerosols. Aerosol Sci. Technol. 1997, 26 (3),255−268.(12) Ducati, T. R. D.; Simoes, L. H.; Galembeck, F. ChargePartitioning at Gas-Solid Interfaces: Humidity Causes ElectricityBuildup on Metals. Langmuir 2010, 26 (17), 13763−13766.
(13) [Anon]. Electricity collected from the air could become thenewest alternative energy source. ChemSusChem 2010, 3 (10), 1103-1103.(14) Palmer, J., Scheme to ’pull electricity from the air’ sparks debate.BBC.co.uk: 2010.(15) Chapman, S. The charges on droplets produced by the sprayingof liquids as revealed by the Millikan oil drop method. Physics 1934, 5,150−152.(16) Kohler, H. An experimental investigation on sea water nuclei.Nova Acta Regiae Soc. Sci. Ups. 1941, 4 (12), 55.(17) Kientzler, C. F.; Arons, A. B.; Blanchard, D. C.; Woodcock, A.H. Photographic investigation of the projection droplets by bubblesbursting at a water surface. Tellus 1954, 6, 1−7.(18) Blanchard, D. C. Electrically Charged Drops from Bubbles inSea Water and Their Meteorological Significance. J. Meteorol. 1958, 15(4), 383−396.(19) Ewing, G. E.; Bhattacharyya, I.; Maze, J. T.; Jarrold, M. F.Charge Separation from the Bursting of Bubbles on Water. J. Phys.Chem. A 2011, 115 (23), 5723−5728.(20) Li, C.; Somasundaran, P. Reversal of Bubble Charge inMultivalent Inorganic Salt-Solutions - Effect of Aluminum. J. ColloidInterface Sci. 1992, 148 (2), 587−591.(21) Li, C.; Somasundaran, P. Reversal of Bubble Charge inMultivalent Inorganic Salt-Solutions - Effect of Lanthanum. ColloidSurf. A 1993, 81, 13−15.(22) Li, C.; Somasundaran, P. Reversal of Bubble Charge inMultivalent Inorganic Salt-Solutions - Effect of Magnesium. J. ColloidInterface Sci. 1991, 146 (1), 215−218.(23) Draper, N. D.; Bakhoum, S. F.; Haddrell, A. E.; Agnes, G. R.Ion-induced nucleation in solution: Promotion of solute nucleation incharged levitated droplets. J. Am. Chem. Soc. 2007, 129 (37), 11364−11377.(24) Hargreaves, G.; Kwamena, N. O. A.; Zhang, Y. H.; Butler, J. R.;Rushworth, S.; Clegg, S. L.; Reid, J. P. Measurements of theEquilibrium Size of Supersaturated Aqueous Sodium ChlorideDroplets at Low Relative Humidity Using Aerosol Optical Tweezersand an Electrodynamic Balance. J. Phys. Chem. A 2010, 114 (4), 1806−1815.(25) Glantschnig, W. J.; Chen, S. H. Light-Scattering from WaterDroplets in the Geometrical-Optics Approximation. Appl. Opt. 1981,20 (14), 2499−2509.(26) Pope, F. D.; Dennis-Smither, B. J.; Griffiths, P. T.; Clegg, S. L.;Cox, R. A. Studies of Single Aerosol Particles Containing MalonicAcid, Glutaric Acid, and Their Mixtures with Sodium Chloride. I.Hygroscopic Growth. J. Phys. Chem. A 2010, 114 (16), 5335−5341.(27) Zobrist, B.; Soonsin, V.; Luo, B. P.; Krieger, U. K.; Marcolli, C.;Peter, T.; Koop, T. Ultra-slow water diffusion in aqueous sucroseglasses. Phys. Chem. Chem. Phys. 2011, 13 (8), 3514−3526.(28) Clegg, S. L.; Seinfeld, J. H.; Brimblecombe, P. Thermodynamicmodelling of aqueous aerosols containing electrolytes and dissolvedorganic compounds. J. Aerosol. Sci. 2001, 32 (6), 713−738.(29) Krishnan, R. S. Raman spectrum of ammonium chloride and itsvariation with temperature. Proc. Indian Acad. Sci., Sect. A 1947, 26 (6),432−449.(30) CRC handbook of chemistry and physics; Chapman and Hall/CRCnetBASE: Boca Raton, FL, 1999.(31) Kumar, R.; Saunders, R. W.; Mahajan, A. S.; Plane, J. M. C.;Murray, B. J. Physical properties of iodate solutions and thedeliquescence of crystalline I(2)O(5) and HIO(3). Atmos. Chem.Phys. 2010, 10 (24), 12251−12260.(32) Smith, E.; Dent, G. Modern Raman spectroscopy: a practicalapproach; J. Wiley: Hoboken, NJ, 2005; 210 pp.(33) Svensson, E. A.; Delval, C.; von Hessberg, P.; Johnson, M. S.;Pettersson, J. B. C. Freezing of water droplets colliding with kaoliniteparticles. Atmos. Chem. Phys. 2009, 9 (13), 4295−4300.(34) Chen, B. H.; Laucks, M. L.; Davis, E. J. Carbon dioxide uptakeby hydrated lime aerosol particles. Aerosol Sci. Technol. 2004, 38 (6),588−597.
The Journal of Physical Chemistry A Article
dx.doi.org/10.1021/jp304920x | J. Phys. Chem. A XXXX, XXX, XXX−XXXL

(35) Rubel, G. O.; Gentry, J. W. Investigation of the Reactionbetween Single Aerosol Acid Droplets and Ammonia Gas. J. AerosolSci. 1984, 15 (6), 661−671.(36) Ray, A. K.; Johnson, R. D.; Souyri, A. Dynamic Behavior ofSingle Glycerol Droplets in Humid Air Streams. Langmuir 1989, 5 (1),133−140.
The Journal of Physical Chemistry A Article
dx.doi.org/10.1021/jp304920x | J. Phys. Chem. A XXXX, XXX, XXX−XXXM


![arXiv:1502.06704v2 [quant-ph] 3 Sep 2015 · arXiv:1502.06704v2 [quant-ph] 3 Sep 2015. 2 and colloidal particles [18] to levitated nanoparticles [19] (see Refs. [20, 21] for a review)](https://img.pdfslide.us/doc/110x75/5fb2e632c6897e6a2f3acfd3/arxiv150206704v2-quant-ph-3-sep-2015-arxiv150206704v2-quant-ph-3-sep-2015.jpg)