Embed Size (px)
Citation preview

ACCOUNTEMPS®
www.accountemps.com
ROBERT HALF ® FINANCE & ACCOUNTINGwww.roberthalf.com
ROBERT HALF ® MANAGEMENT RESOURCESwww.rhmr.com
OFFICETEAM ®
www.officeteam.com
ROBERT HALF ® TECHNOLOGYwww.rht.com
ROBERT HALF® LEGALwww.roberthalflegal.com
THE CREATIVE GROUP®
www.creativegroup.com
PROTIVITI®
www.protiviti.com
www. rhi.com
2884 Sand Hill Road
Menlo Park, California 94025
Tel. (650) 234-6000
©2008 Robert Half International Inc. An Equal Opportunity Employer.
ROB
ERT HA
LF INTERN
ATION
AL 2007
AN
NU
AL REPO
RT
ROBERT HALF INTERNATIONAL
A G l o b a l L e a d e r i n P r o f e s s i o n a l S e r v i c e s S i n c e 1 9 4 8
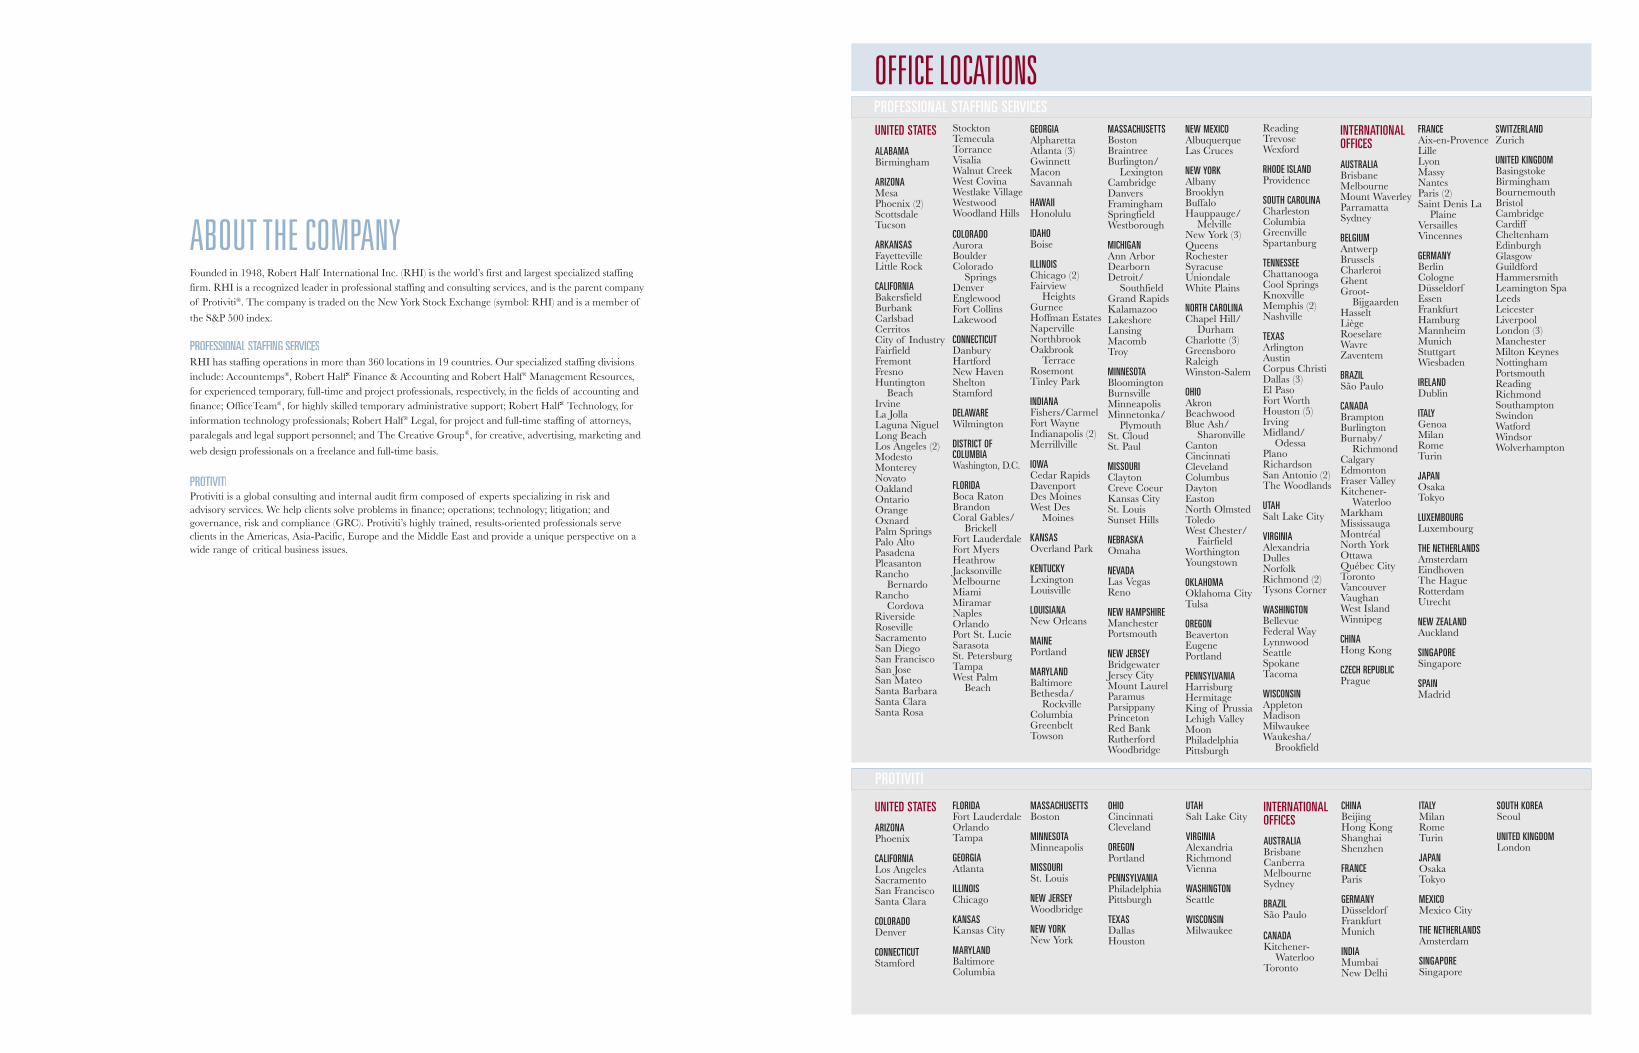
ABOUT THE COMPANYFounded in 1948, Robert Half International Inc. (RHI) is the world’s first and largest specialized staffing firm. RHI is a recognized leader in professional staffing and consulting services, and is the parent companyof Protiviti®. The company is traded on the New York Stock Exchange (symbol: RHI) and is a member of
the S&P 500 index.
PROFESSIONAL STAFFINTT G SERVRR ICESRHI has staffing operations in more than 360 locations in 19 countries. Our specialized staffing divisionsinclude: Accountemps®, Robert Half®ff Finance & Accounting and Robert Half®ff Management Resources, for experienced temporary, full-time and project professionals, respectively, in the fields of accounting and finance; OfficeTeam®, for highly skilled temporary administrative support; Robert Half®ff Technology, forinformation technology professionals; Robert Half®ff Legal, for project and full-time staffing of attorneys,paralegals and legal support personnel; and The Creative Group®, for creative, advertising, marketing and
web design professionals on a freelance and full-time basis.
PROTIVITIProtiviti is a global consulting and internal audit firm composed of experts specializing in risk and advisory services. We help clients solve problems in finance; operations; technology; litigation; andgovernance, risk and compliance (GRC). Protiviti’s highly trained, results-oriented professionals serve clients in the Americas, Asia-Pacific, Europe and the Middle East and provide a unique perspective on awide range of critical business issues.
UNITED STATES ALABAMABirmingham
ARIZONAMesaPhoenix (2)ScottsdaleTucson
ARKANSASFayetteville Little Rock
CALIFORNIABakersfield BurbankCarlsbad Cerritos City of Industry Fairfield Fremont Fresno Huntington Beach IrvineLa Jolla Laguna NiguelLong Beach Los Angeles (2)ModestoMonterey Novato OaklandOntarioOrangeOxnard Palm SpringsPalo AltoPasadena PleasantonRancho Bernardo Rancho Cordova Riverside Roseville SacramentoSan DiegoSan Francisco San Jose San Mateo Santa BarbaraSanta ClaraSanta Rosa
StocktonTemecula Torrance Visalia Walnut Creek West Covina Westlake Village Westwood Woodland Hills COLORADOAurora BoulderColorado Springs Denver Englewood Fort CollinsLakewood
CONNECTICUTDanbury Hartford New Haven SheltonStamford
DELAWAREWilmington
DISTRICT OF COLUMBIAWashington, D.C.
FLORIDABoca Raton BrandonCoral Gables/ Brickell Fort Lauderdale Fort Myers Heathrow Jacksonville Melbourne MiamiMiramarNaplesOrlando Port St. LucieSarasotaSt. Petersburg Tampa West Palm Beach
GEORGIAAlpharetta Atlanta (3)GwinnettMaconSavannah
HAWAIIHonolulu
IDAHOBoise
ILLINOISChicago (2)Fairview Heights Gurnee Hoffman Estates NapervilleNorthbrook Oakbrook Terrace Rosemont Tinley Park
INDIANAFishers/Carmel Fort Wayne Indianapolis (2)Merrillville
IOWACedar RapidsDavenport Des MoinesWest Des Moines
KANSASOverland Park
KENTUCKYLexington Louisville
LOUISIANANew Orleans
MAINEPortland
MARYLANDBaltimore Bethesda/ Rockville ColumbiaGreenbelt Towson
MASSACHUSETTSBostonBraintree Burlington/ Lexington CambridgeDanvers FraminghamSpringfieldWestborough
MICHIGANAnn ArborDearborn Detroit/ SouthfieldGrand RapidsKalamazoo Lakeshore LansingMacombTroy
MINNESOTABloomingtonBurnsville MinneapolisMinnetonka/ Plymouth St. CloudSt. Paul
MISSOURIClayton Creve CoeurKansas CitySt. LouisSunset Hills
NEBRASKAOmaha
NEVADALas Vegas Reno
NEW HAMPSHIREManchester Portsmouth
NEW JERSEYBridgewater Jersey CityMount Laurel Paramus Parsippany PrincetonRed BankRutherford Woodbridge
NEW MEXICOAlbuquerque Las Cruces
NEW YORKAlbany Brooklyn Buffalo Hauppauge/ Melville New York (3)QueensRochester SyracuseUniondaleWhite Plains
NORTH CAROLINAChapel Hill/ Durham Charlotte (3)Greensboro RaleighWinston-Salem
OHIOAkron Beachwood Blue Ash/ Sharonville CantonCincinnati Cleveland Columbus Dayton EastonNorth OlmstedToledo West Chester/ Fairfield Worthington Youngstown
OKLAHOMAOklahoma CityTulsa
OREGONBeaverton EugenePortland
PENNSYLVANIAHarrisburg Hermitage King of PrussiaLehigh Valley MoonPhiladelphiaPittsburgh
Reading Trevose Wexford
RHODE ISLANDProvidence
SOUTH CAROLINACharleston ColumbiaGreenville Spartanburg
TENNESSEEChattanooga Cool SpringsKnoxville Memphis (2)Nashville
TEXASArlington Austin Corpus ChristiDallas (3)El Paso Fort Worth Houston (5)IrvingMidland/ Odessa PlanoRichardson San Antonio (2)The Woodlands
UTAHSalt Lake City
VIRGINIAAlexandria DullesNorfolk Richmond (2)Tysons Corner
WASHINGTONBellevue Federal Way Lynnwood Seattle SpokaneTacoma
WISCONSINAppleton MadisonMilwaukee Waukesha/ Brookfield
INTERNATIONAL OFFICES
AUSTRALIABrisbaneMelbourne Mount Waverley Parramatta Sydney
BELGIUMAntwerp BrusselsCharleroi GhentGroot- Bijgaarden HasseltLiègeRoeselare Wavre Zaventem
BRAZILSão Paulo
CANADABramptonBurlington Burnaby/ Richmond Calgary EdmontonFraser Valley Kitchener- Waterloo Markham Mississauga MontréalNorth York Ottawa Québec CityToronto Vancouver Vaughan West IslandWinnipeg
CHINAHong Kong
CZECH REPUBLICPrague
FRANCEAix-en-Provence LilleLyon MassyNantesParis (2)Saint Denis La Plaine Versailles Vincennes
GERMANYBerlin CologneDüsseldorf EssenFrankfurt Hamburg MannheimMunich Stuttgart Wiesbaden
IRELANDDublin
ITALYGenoaMilanRome Turin
JAPANOsakaTokyo
LUXEMBOURGLuxembourg
THE NETHERLANDSAmsterdam Eindhoven The HagueRotterdam Utrecht
NEW ZEALANDAuckland
SINGAPORESingapore
SPAINMadrid
SWITZERLANDZurich
UNITED KINGDOMBasingstokeBirmingham Bournemouth BristolCambridgeCardiff CheltenhamEdinburgh Glasgow Guildford Hammersmith Leamington SpaLeedsLeicesterLiverpool London (3)Manchester Milton Keynes NottinghamPortsmouth Reading Richmond SouthamptonSwindonWatford Windsor Wolverhampton
UNITED STATES
ARIZONAPhoenix
CALIFORNIALos AngelesSacramentoSan FranciscoSanta Clara
COLORADODenver
CONNECTICUTStamford
FLORIDAFort LauderdaleOrlandoTampa
GEORGIAAtlanta
ILLINOISChicago
KANSASKansas City
MARYLANDBaltimoreColumbia
MASSACHUSETTSBoston
MINNESOTAMinneapolis
MISSOURISt. Louis
NEW JERSEYWoodbridge
NEW YORKNew York
OHIOCincinnatiCleveland
OREGONPortland
PENNSYLVANIAPhiladelphiaPittsburgh
TEXASDallasHouston
UTAHSalt Lake City
VIRGINIAAlexandriaRichmondVienna
WASHINGTONSeattle
WISCONSINMilwaukee
INTERNATIONAL OFFICES
AUSTRALIABrisbaneCanberraMelbourneSydney
BRAZILSão Paulo
CANADAKitchener- WaterlooToronto
CHINABeijingHong KongShanghaiShenzhen
FRANCEParis
GERMANYDüsseldorfFrankfurtMunich
INDIAMumbaiNew Delhi
ITALYMilanRomeTurin
JAPANOsakaTokyo
MEXICOMexico City
THE NETHERLANDSAmsterdam
SINGAPORESingapore
SOUTH KOREASeoul
UNITED KINGDOMLondon
OFFICE LOCATIONSPROFESSIONAL STAFFING SERVICES
PROTIVITI
0
$100
$200
$300
$400
$500
0
$1,000
$2,000
$3,000
$4,000
$5,000
2007 ANNUAL REPORT Robert Half International 1
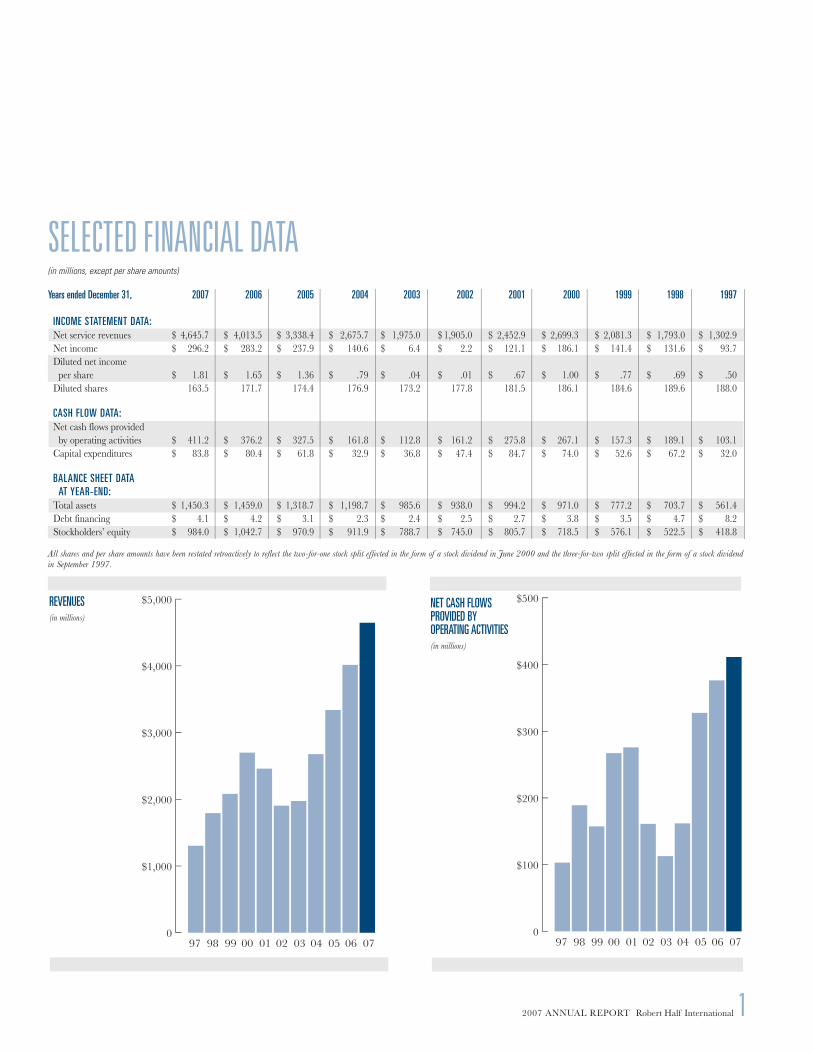
SELECTED FINANCIAL DATA(in millions, except per share amounts)
REVENUES(in millions)
NET CASH FLOWS PROVIDED BY OPERATING ACTIVITIES(in millions)
Years ended December 31, 2007 2006 2005 2004 2003 2002 2001 2000 1999 1998 1997
INCOME STATEMENT DATA:Net service revenues $ 4,645.7 $ 4,013.5 $ 3,338.4 $ 2,675.7 $ 1,975.0 $ 1,905.0 $ 2,452.9 $ 2,699.3 $ 2,081.3 $ 1,793.0 $ 1,302.9Net income $ 296.2 $ 283.2 $ 237.9 $ 140.6 $ 6.4 $ 2.2 $ 121.1 $ 186.1 $ 141.4 $ 131.6 $ 93.7Diluted net income per share $ 1.81 $ 1.65 $ 1.36 $ .79 $ .04 $ .01 $ .67 $ 1.00 $ .77 $ .69 $ .50Diluted shares 163.5 171.7 174.4 176.9 173.2 177.8 181.5 186.1 184.6 189.6 188.0
CASH FLOW DATA:Net cash flows provided by operating activities $ 411.2 $ 376.2 $ 327.5 $ 161.8 $ 112.8 $ 161.2 $ 275.8 $ 267.1 $ 157.3 $ 189.1 $ 103.1Capital expenditures $ 83.8 $ 80.4 $ 61.8 $ 32.9 $ 36.8 $ 47.4 $ 84.7 $ 74.0 $ 52.6 $ 67.2 $ 32.0
BALANCE SHEET DATA AT YEAR-END: Total assets $ 1,450.3 $ 1,459.0 $ 1,318.7 $ 1,198.7 $ 985.6 $ 938.0 $ 994.2 $ 971.0 $ 777.2 $ 703.7 $ 561.4Debt financing $ 4.1 $ 4.2 $ 3.1 $ 2.3 $ 2.4 $ 2.5 $ 2.7 $ 3.8 $ 3.5 $ 4.7 $ 8.2Stockholders’ equity $ 984.0 $ 1,042.7 $ 970.9 $ 911.9 $ 788.7 $ 745.0 $ 805.7 $ 718.5 $ 576.1 $ 522.5 $ 418.8
All shares and per share amounts have been restated retroactively to reflect the two-for-one stock split effected in the form of a stock dividend in June 2000 and the three-for-two split effected in the form of a stock dividend in September 1997.

n In March 2008, Robert Half International was named to the list of America’s Most Admired Companies by FORTUNE® magazine, ranking number one in the temporary help industry.
n In January 2008, Robert Half International was named to Forbes magazine’s Platinum 400 list of the Best Big Companies in America for the seventh year.
n Also in January 2008, RHI chairman and CEO Max Messmer was again named by Institutional Investor magazine to its list of the Best CEOs in America.
n In November 2007, Max Messmer received the Ernst & Young Entrepreneur of the Year national award in the Services category. The award recognizes leaders and visionaries who demonstrate innovation, financial success and personal commitment to their businesses.
n In April 2007, RHI was included on the Forbes Global 2000, a list of the world’s largest public companies. The company also was highlighted by Forbes as one of just 130 “global high performers,” a list of companies that set the pace for their respective industries.
n In April 2007, RHI ranked 17th in the BusinessWeek 50, which represents the magazine’s choice of “best in class” S&P 500 firms.
n In 2007, Protiviti was ranked by BusinessWeek for the second consecutive year as one of the Best Places to Launch a Career.
2 Robert Half International 2007 ANNUAL REPORT
Business HigHligHts
A reputation is built not by what we say about ourselves but what others say about us.

To our STockholderS
2006 AnnuAl RepoRt Robert Half International 3 2007 AnnuAl RepoRt Robert Half International 3
We are pleased to report that 2007 was another good year for Robert Half International. Annual revenue reached a record $4.65 billion, a 16 percent gain over 2006. Diluted earnings per share grew 10 percent to $1.81, also a record level.
the u.S. economy performed well during most of 2007, but conditions moderated somewhat late in the year. A combination of factors — the housing downturn and credit crunch chief among them — sharply limited fourth-quarter economic growth. According to preliminary estimates, real gross domestic product grew at an annual rate of just 0.6 percent in the final three months of the year. That rate is well below the third quarter’s 4.9 percent pace and the 2.2 percent rate reported for the full year.
labor market conditions in the united States also softened, with the unemployment rate rising slightly in the second half of the year. Second half non-farm payroll employment growth also slowed, and the trend became more pronounced in early 2008 with payroll declines in January and February. These were the first monthly job losses reported in more than four years. We have no special insight into the future, but recently reported economic data suggest we are facing a higher level of economic uncertainty in the united States as we enter 2008.
Despite these developments, we continued to see healthy demand for our services throughout 2007 and in the first weeks of 2008. Our strength is rooted partly in the very nature of the specialty labor markets we serve. Our primary candidate base is composed of college-educated professionals. the u.S. unemployment rate for this group usually has been lower than that for the general working population. At year-end, it was less than half of the rate for the total workforce.
In addition, we believe this decade has seen a fundamental change in the way companies view issues of corporate governance and internal control over financial reporting. The increased focus on these areas has stepped up demand for skilled accounting and finance professionals, first in the United States and, increasingly, internationally. Since serving clients’ accounting and finance needs provides the lion’s share of our business, higher demand for these individuals has translated into double-digit percentage growth in Robert Half ’s staffing revenue for four consecutive years. Last year’s performance was highlighted by especially impressive revenue gains in our permanent placement business and international staffing operations.
Harold M. Messmer, Jr. M. Keith WaddellChairman and Chief Executive Officer Vice Chairman, President and Chief Financial Officer

We are well positioned to capitalize on the demand for highly skilled talent. It starts with our long history. Robert Half pioneered the specialist financial recruitment industry back in 1948. We expanded the business by introducing professional-level temporary staffing in the early 1970s. Since that time, we have introduced new specialty divisions and launched Protiviti, our wholly owned subsidiary that provides internal audit and risk and advisory services. Our hard-earned expertise and well-established networks in specialized employment markets are unmatched in the industry, and we believe we are well positioned for the future.
FINANCIAL CONDITION
Our financial position remains solid. We ended the year with total assets of $1.45 billion, cash of $310 million and virtually no long-term debt. The majority of our assets are liquid; our business requires few fixed assets and no inventory. Our largest single reported asset at the end of last year was, as always, accounts receivable. We ended the year with receivables of $593 million. Because of the significance of that asset, we’ve had a long-standing focus on timely collection of accounts receivable.
Last year, cash from operating activities totaled $411 million. After $84 million of capital expenditures, free cash flow was $327 million. That compares with $296 million of free cash produced in 2006. Last year’s capital outlays remained modest at just 1.8 percent of revenues. We continued to develop our office and technology infrastructure domestically and outside the United States, as we are committed to providing our employees with the resources needed to serve our customers efficiently.
We want to be sure we acquire the best and most cost-efficient technology to employ in paying workers and billing customers. Therefore, more than half of current-year capital expenditures are expected to be allocated to improvements in information technology. Much of the remainder will be dedicated to opening new offices, relocating established ones and making leasehold improvements.
The free cash flow, plus cash drawn from our ample cash balance, was used to buy our own shares, pay cash dividends, and complete a small acquisition to expand our Protiviti business. We spent $397 million to buy 12.2 million Robert Half shares in the open market. A year earlier, we spent $273 million to buy 7.9 million shares in similar
4 Robert Half International 2007 AnnUAL RePORT
To our STockholderS
n The annual revenue of Robert Half Incorporated at the time of its purchase in 1986 was approximately $7 million. In fiscal-year 2007, the company’s revenue was $4.65 billion.
n A $1,000 investment in RHI stock on June 30, 1986, would have been worth $50,900 as of December 31, 2007, which represents a 20 percent compound annual rate of return.
n In the most recent five-year period ended December 31, 2007, revenues have more than doubled, from $2.0 billion to $4.65 billion.
n Cash flow from operations over the past five years was $1.4 billion. This funded $1.2 billion in RHI common stock repurchases and $200 million in dividends paid during the period.
n Return on equity averaged 22 percent per year during the most recent five years. Return on equity in 2007 was 29 percent.
SNApShOT: LONG-TERM FINANCIAL pERFORMANCE
2007 AnnuAl RepoRt Robert Half International 5
To our STockholderS
transactions. the purchases continued a program of open-market transactions made under a series of board authorizations that began in 1997. In the 11 years since we initiated these buybacks, we have used $1.5 billion of internally generated cash to purchase 58.8 million shares. We have long had a strong preference for buying back our shares, and we expect to continue this practice, as appropriate, in the future. At year-end, we had 9.2 million shares remaining to purchase under our current board authorization.
We continued to pay a quarterly dividend to our stockholders, and last year $66 million of cash was used for this purpose. the board recently increased the quarterly cash dividend to $0.11 per share, or $0.44 per share annually. this was the fourth consecutive annual increase since the quarterly cash dividend was initiated at $0.06 per share in 2004.
DIVISIONAL HIGHLIGHTS
Our three financial and accounting staffing divisions continue to represent a majority of our business domestically and internationally. their combined 2007 revenue of $2.8 billion accounted for 60 percent of the company total and was 20 percent higher than the prior year.
Accountemps reported $1.74 billion in revenue and produced 37 percent of last year’s total. the business grew 17 percent year over year. This specialized temporary help staffing unit was the company’s first expansion beyond the original Robert Half permanent placement business. It is now our single largest division.
Robert Half Management Resources, which we launched in 1997, is our newest financial staffing unit. Its 2007 revenue of $619 million was 13 percent of the company total. Revenue for this division increased 20 percent from the prior year.
our permanent placement division, Robert Half Finance & Accounting, had $444 million in 2007 revenue. this mainstay unit produced the fastest growth of all of our businesses last year with a year-to-year gain of 32 percent. Robert Half Finance & Accounting also was a key contributor to last year’s operating income. this division accounts for 10 percent of total revenue and produced 18 percent of aggregate operating profit in 2007.
At last year’s outset, we decided to hire additional personnel in our Robert Half Finance & Accounting division. the strength of global industry demand and the quality of our new hires enabled them to become productive relatively quickly. over the years, our permanent placement business, like that of the rest of the industry, has proven to be susceptible to economic slowdowns. We believe we are in a better position today because of our experienced management and staff, and our geographic diversification. Compared to earlier periods of economic uncertainty, we now have a much bigger permanent placement presence in international markets. that could help cushion the income effects of a u.S. slowdown, should one materialize.
OfficeTeam revenue of $861 million was 19 percent of the total and was up 11 percent from 2006. We are just a few years away from OfficeTeam’s 20th anniversary. During this time, we have worked hard to differentiate this business by focusing on high-end administrative staffing and concentrating on excellent customer service. Our brand research tells us that we have been successful on both fronts.
Robert Half technology revenue of $425 million was 9 percent of the total and 19 percent ahead of last year. We have seen our technology staffing customers settle into a more measured approach to expansion after the explosive growth in the dot-com era of the late 1990s. Demand for our services has grown as businesses continue to invest in It infrastructure and as more emphasis has been placed on network security in response to the growth of wireless Internet access.
PROTIVITI
protiviti’s revenue last year was $552 million, or 12 percent of the total. For the most part, growth came from international markets. u.S. revenue fell about 2 percent to $406 million. By contrast, international revenue of $146 million was up 13 percent from the prior year.
last year was a challenging one for protiviti. the surge in its u.S. revenues that followed the 2002 enactment of the Sarbanes-oxley Act (SoX) has moderated. It has been nearly six years since SoX was passed, and during that time, most businesses have made significant progress in complying with its provisions. Further, last year the U.S. Securities and Exchange Commission and the Public Company Accounting Oversight Board issued additional regulations and guidance. Some businesses interpreted the pronouncements in ways that prompted
6 Robert Half International 2007 AnnuAl RepoRt
To our STockholderS
them to reduce their reliance on outside firms to help them with compliance. That applied particularly to the testing requirements that are part of Section 404 of the act.
None of this was a surprise to us; we expected SOX-related demand to decline as compliance efforts matured and regulations evolved. Our long-term strategy has always been to expand our client relationships and extend Protiviti’s service offerings. We made good progress in this regard during the year. Notable areas of success included consulting engagements in IT asset management, forensic accounting investigations, financial process effectiveness and private equity services.
We believe this business has a bright future; it has great people and a reputation for providing superior internal audit and risk consulting services to its clients. In the second quarter of 2007, Protiviti was recognized as an industry leader in the Forrester Research Wave report on risk consulting services. Forrester’s independent analysis reflects Protiviti’s ability to assist companies worldwide with their risk management practices and policies. It underscores our deep competencies, intellectual property and methodologies.
MOVING DEEPER INTO GLOBAL MARKETS
In the past several years, Robert Half has grown to become one of the few truly global specialized staffing firms. We have broadened our reach to 102 non-U.S. offices in 18 countries located on five continents. With infrastructure in place, our strategy now is to become more visible in the major international financial markets and metropolitan areas we serve. We believe the overseas market for specialized staffing is large and growing as more companies learn of the benefits of employing skilled interim professionals. The job ahead is to make the Robert Half brand as recognizable and respected on a global basis as it is in the United States.
International staffing revenue last year was $990 million, up 39 percent from 2006. Part of that advance reflects a gain from translating stronger foreign currencies into U.S. dollars. The year-to-year increase in constant dollars was 28 percent, also an impressive gain by most standards. Last year’s international staffing revenue represented 24 percent of total staffing billings. That is more than twice the $302 million, or 11 percent of the total, reported at the end of 2000.
Thus far, our Robert Half Management Resources and permanent placement divisions have made the deepest inroads overseas. We have been opportunistic in capitalizing on the global demand for financial staffing and recruitment services. We have been building our infrastructure and adding personnel outside North America for several years. These investments, along with vibrant employment markets in a number of countries, particularly in Continental Europe, contributed to last year’s very strong international revenue growth.
Protiviti, with its foundation in risk consulting and internal audit, plays a key role in our international business. Protiviti is helping multinational companies with regulatory compliance, as it has done in the United States. In Japan, for example, Protiviti is assisting firms with that country’s J-SOX mandate, a set of rules regarding financial reporting requirements similar to those in Sections 302 and 404 of the U.S. Sarbanes-Oxley Act. This legislation also brings business to Protiviti in other countries where Japanese companies have a presence.
Protiviti has put considerable energy into expanding its footprint since it was created in 2002. We ended the year with 60 Protiviti offices in 15 countries. In some cases, this presence has made for an easier transition when our staffing divisions have opened offices in a country or market where there is a Protiviti location, and the reverse has also been true. Further global expansion could become less of a priority in the future as we now believe Protiviti’s office network is adequately built out. Our international strategy for Protiviti going forward will focus primarily on increasing our market penetration.
2007 AnnuAl RepoRt Robert Half International 7
To our STockholderS
LOOKING AHEADWe are closely watching current developments in the economy and financial markets. We are optimistic about our long-term outlook, but the nature of our business is such that we do not have visibility into the demand for our services in the near to intermediate term. Still, if companies become more cautious about hiring this year, as some are predicting, we are well positioned to manage the effects of a slowdown.
The company has managed through 10 recessions since its inception, and we have emerged from each one a stronger business. We believe our brands are among the most respected in the industry. We enjoy a strong rate of internal growth, and we have the industry’s best balance sheet. We also have an experienced management team that has successfully contended with many economic cycles.
Our business is free of customer or industry concentrations. Our typical staffing clients are small and medium-size businesses, and no single client accounts for a significant percentage of our revenue. We also are not tied to the fate of any one industry. The recent difficulties in the financial services industry, which represents a small fraction of our business, provide a current example of how our broad-based industry mix can insulate us from sector-specific turmoil. We also are more geographically diversified today than we were just a few years ago. Protiviti further increases our diversity. It is a thriving business that in 2002 was only beginning.
We have learned to deal with economic uncertainty; it always has been with us to one degree or another. Experience has taught us that as long as we see a strong market for our services, we will continue to seek out the very best people we can hire. We believe that to act otherwise would be tantamount to ensuring that our growth will slow.
The modern staffing industry, in our view, requires both a high-tech and high-touch approach. We were early in embracing the use of Internet sourcing as a way to reach a larger audience of job seekers. We employ state-of-the-art e-marketing initiatives and Internet strategies that allow us to take advantage of the full potential of the Internet. Our job ads reach the major job boards, and we have content and job-posting relationships with websites that target our demographics. At the same time, ours is a relationship business. We are more than clickable icons on a screen; we are real people who care about helping others — whether they are hiring managers in search of the best talent or job candidates seeking meaningful employment. It is a similar story with Protiviti. The stronger their client relationships, the more likely Protiviti professionals will see their engagements extended and widened, and the more client referrals they will receive.
Our staffing business turns 60 this year. Our company’s anniversary highlights our experience, quality service, innovation, ethics and brand recognition. None of these attributes was developed overnight and, under the best of circumstances, they would be difficult to duplicate. We have more than 400 staffing and consulting locations worldwide and generate more than $4.6 billion in revenue. We derive invaluable benefits from the scope of our operations, but we recognize that we also are a local business. We know how important it is to be part of our communities. The proximity to our customer base and our longevity have helped us to build deep networks that benefit companies and job seekers alike. Robert Half ’s state-of-the-art tools, decades of experience and established local networks give us powerful advantages.
No business can be successful without an excellent employee team, and, in our view, Robert Half attracts the best people in this industry. We would like to express our appreciation for the dedication and talents of our management teams in the field and at Corporate Services. We also want to acknowledge our board of directors for their strategic counsel and insights during the year and you, our stockholders, for your continued support and encouragement.
Respectfully submitted,
Harold M. Messmer, Jr. M. Keith Waddell March 7, 2008 March 7, 2008


To ensure their companies have access to the talent they need to maintain productivity — and stay with-in budget — more businesses are turning to skilled
accounting and finance professionals on a project basis to augment the efforts of core staff. Hiring managers look for individuals with up-to-date knowledge who can provide immediate temporary assistance, supplement skills gaps in full-time staff, and satisfy cyclical or short-term needs.
Accountemps is the world’s first and largest staffing ser-vice specializing exclusively in temporary accounting, finance and bookkeeping professionals. We provide cli-ents with skilled staff and senior accountants, financial analysts, payroll professionals, cost accountants, credit managers, audit and tax accountants, and bookkeepers. Through our Salaried Professional Service, available in select markets, we hire professionals on a full-time basis, enabling us to provide personnel with difficult-to-find skill sets for our clients’ long-term and recurring needs. These professionals are ideal for projects such as systems conversions, reconciliations, audits, testing and documentation, month-end closings, and quarterly financial reporting.
Our expert staffing managers, many of whom have backgrounds and prior work experience in accounting, understand the business needs of our clients. They can locate candidates for even the most hard-to-fill positions.
Our extensive network and valued business relationships in the local communities we serve make us the most recognized name in financial staffing. Our database of 2 million experienced accounting and finance profes-sionals is among the largest in the staffing industry. As a result, we are able to offer a client-satisfaction guarantee with every placement we make.
We have access to experienced talent in part because of our long-standing relationships with the industry’s most respected financial associations. Our alliance partners include the American Institute of Certified Public Accountants, American Payroll Association, American Society of Women Accountants, Association of Latino Professionals in Finance and Accounting, National Association of Credit Management, Credit Institute of Canada, Belgian Institute of Management Accountants and Controllers, BVBC in Germany, and Association of Accounting Technicians in the United Kingdom.
We are committed to supporting the professional development of our candidates by providing access to e-learning courses in areas such as finance, accounting and related software systems. These courses help to ensure our temporary professionals maintain their tech-nical and business skills while giving our clients access to well-trained and highly skilled professionals.
As part of Robert Half International’s family of finan-cial staffing services, we work with our sister divisions, Robert Half Finance & Accounting and Robert Half Management Resources, to provide comprehensive staffing solutions. Our financial staffing divisions place accounting and finance professionals on a temporary, full-time and senior-level consulting basis. Few staffing firms can equal the depth of our resources and services.
Our surveys and other publications, such as the annual Salary Guide and Glossary of Job Descriptions for Accounting and Finance, provide insight into compensation trends as well as career and staff management issues affecting the field. These materials serve as valued resources for companies and job seekers alike.
For more information about our services, please visit our website at www.accountemps.com.
2007 ANNUAL REPORT Robert Half International 9
Temporary accounting, fi nance and bookkeeping professionals

2007 ANNUAL REPORT Robert Half International 11
Recognizing the need for a business that concentrat-ed exclusively on placing accounting and finance professionals, a young accountant named Robert
Half opened the Robert Half Personnel Agency in New York City in 1948. Founded with a focus on ethics and service quality, the company was the first to specialize in locating accounting and finance talent for businesses. Today, Robert Half Finance & Accounting is the largest global financial recruitment firm, with more than 360 locations worldwide.
For 60 years, Robert Half Finance & Accounting has been dedicated to helping companies of all sizes meet their financial recruitment needs. That commitment continues today as global demand for experienced financial professionals has led to intensified competi-tion for top performers among private and public companies and public accounting firms. To access the expertise they seek to manage strategic initiatives and improve financial processes, businesses turn to Robert Half Finance & Accounting.
Our professional recruiters understand our clients’ unique requirements and objectives. They help companies locate the right job candidates for positions ranging from controller, staff accountant and financial analyst to internal auditor, accounting manager, book-keeper and payroll coordinator. As part of our service, our recruiting managers offer employers expert advice on local hiring and compensation trends, enabling businesses to make more informed decisions regarding personnel needs.
Our innovative, time-saving Company-In process allows businesses to interview multiple candidates in one day and decide which to hire or invite for additional interviews.
Companies that work with Robert Half Finance & Accounting can take advantage of the network of con-tacts we have developed throughout our long history in financial recruitment. Our alliance partners in the United States and Canada include the American Insti-
tute of Certified Public Accountants, American Payroll Association, American Society of Women Accountants, Association of Latino Professionals in Finance and Ac-counting, Credit Institute of Canada, The Institute of Internal Auditors, and National Association of Credit Management.
Our alliance partnerships outside of North America include the Financial Executives Institute in Belgium, Belgian Institute of Management Accountants and Controllers, BVBC in Germany, Credit Manage-ment Association in Germany and France, Chartered Institute of Management Accountants, Institute of Chartered Accountants in England and Wales, and CPA Australia.
We offer our candidates access to online courses and certification programs, and we are registered as a continuing professional education (CPE) course pro-vider with the National Association of State Boards of Accountancy’s National Registry of CPE sponsors. We also provide discounted industry association member-ships and career guidance to the individuals we serve.
As part of Robert Half International’s suite of finan-cial staffing services, we offer comprehensive human resources solutions to businesses and extensive career opportunities to job seekers. Working with our Accountemps and Robert Half Management Resources divisions, we can meet the needs of firms across every accounting and finance practice area by providing temporary, senior-level consulting and full-time placements.
Robert Half Finance & Accounting has earned a reputation for industry leadership and integrity. With our value-added tools, global network and dedication to delivering outstanding service, we are well positioned to meet the needs of today’s employers and accounting and finance professionals.
For more information about our services, please visit our website at www.roberthalf.com.
Professional recruitment services in accounting and finance


The assortment of government regulations and other complex issues impacting businesses today is fueling global demand for senior financial professionals.
Companies need experienced specialists who can manage in-depth financial analysis and reporting, business process improvement, internal audit and com-pliance, enterprise resource planning, acquisitions and divestiture, and the implementation and integration of financial systems.
As organizations compete for highly skilled talent, they depend on Robert Half Management Resources to help them meet their specialized project needs. With a network of more than 140 offices extending throughout North America, Europe and the Asia-Pacific region, Robert Half Management Resources is the foremost provider of senior-level accounting and finance profes-sionals on a project and interim basis.
Regulatory compliance is a business issue not only in the United States but also internationally, and Robert Half Management Resources is well positioned to serve firms worldwide that must respond to governance mandates and other challenges.
Our consultants have subject-matter expertise and global industry knowledge in the most in-demand areas, such as international financial reporting stan-dards, internal audit, corporate taxation, merger and acquisition analysis, treasury and cash management, information technology, financial administration and operations, and reconciliation and restatements.
Companies engage our professionals to fill key financial positions, including vice president of finance, controller, internal auditor, business analyst and senior accountant. Because we can assign consultants on a just-in-time basis, we can complete projects for our clients on time and on budget. We also retain a select group of consultants as full-time employees who can help companies address long-term or recurring business needs. Providing access to consultants who
can return on a quarterly or annual basis offers firms the advantage of working with professionals already familiar with their accounting processes.
We provide access to training for our financial consultants, including e-learning courses, multiple certification programs, and live and online continuing professional education.
Another benefit of working with Robert Half Manage-ment Resources is our account executive team, which is composed of former finance and consulting profession-als. They understand our clients’ business challenges and requirements and can swiftly locate consultants with skill sets that match each company’s needs.
We maintain alliances with financial professional as-sociations around the world, and we are proud to have exclusive relationships with Financial Executives In-ternational, the American Institute of Certified Public Accountants, and the Association of Latino Profession-als in Finance and Accounting. In addition, we are a principal partner of The Institute of Internal Auditors. Outside North America, our alliances include DDIM in Germany, the Belgian Institute of Management Accountants and Controllers, and The Institute of Internal Auditors in Belgium and the Netherlands.
As part of Robert Half International’s suite of financial staffing services, we partner with our Accountemps and Robert Half Finance & Accounting divisions to offer comprehensive human resources solutions to our clients and career opportunities to experienced job seekers. We also provide staff augmentation services to Protiviti, our internal audit and risk consulting subsidiary, giving this business access to our global network of experienced accounting and finance professionals.
For more information about our services, please visit our website at www.roberthalfmr.com.
2007 ANNUAL REPORT Robert Half International 13
Senior-level financial professionals on a project and interim basis

2007 ANNUAL REPORT Robert Half International 15
Temporary and temporary-to-full-time administrative professionals
The role of office support professionals continues to expand, as businesses rely increasingly on skilled administrative talent to help maximize productivity,
achieve cost efficiency and assist internal staff. When workloads swell and special projects are introduced, many firms turn to temporary administrative personnel to relieve the pressure on core staff and take advantage of skills not available internally.
The easiest way for employers to locate experienced administrative professionals is by working with a staffing firm that specializes in the field. This targeted focus has made OfficeTeam a leading provider of highly skilled administrative staff on a temporary and temporary-to-full-time basis. Companies turn to us for individuals who have the technical expertise, interpersonal skills and industry experience to contribute immediately in any office environment.
Our interim staff, ranging from administrative and executive assistants to receptionists and customer service representatives, can step in at a moment’s notice to fill staff vacancies and assist core personnel during peak workload periods. Businesses also count on OfficeTeam for temporary-to-full-time professionals who can make an immediate contribution while also being evaluated for full-time positions.
We understand that companies’ staffing needs can change overnight, and we have the flexibility and speed to assist them. Our clients benefit from the vast network of skilled professionals we employ: We currently have more than 2 million administrative professionals in our proprietary database, including certified Microsoft Office professionals. The training and resources we pro-vide our candidates, free of charge, allow them to build their skills and experience so they can assist companies quickly, without a long “ramp-up” phase or extensive on-the-job training.
Many OfficeTeam staffing managers have prior indus-try experience in human resources, office technology or administration, which makes them uniquely qualified to assess our clients’ needs and provide them with the right talent. We are so confident that we can consistently make effective matches that we guarantee client satisfac-tion with every candidate we place.
OfficeTeam is a key sponsor of the International Association of Administrative Professionals (IAAP), the leading organization for administrative and office support professionals. Outside North America, we maintain alliances with Personnel Managers Club and www.assistantclub.be. These relationships are instru-mental in helping us expand our global network of highly skilled professionals.
OfficeTeam regularly researches trends impacting the workplace and the administrative field. Our research findings are frequently sought by the U.S. Department of Labor’s Bureau of Labor Statistics, colleges and universities, the media, businesses, and professional associations. Our clients and candidates benefit from our value-added resources — including workplace surveys, salary guides and other ongoing research. This information enables them to make better hiring and career decisions. According to quality assurance data we collect regularly, our clients and candidates are so pleased with our services that nine out of 10 tell us they would recommend OfficeTeam to their colleagues.
OfficeTeam addresses the needs of our clients and can-didates through our more than 300 locations in North America, Europe and Australia.
For more information about our services, please visit our website at www.officeteam.com.

2007 ANNUAL REPORT Robert Half International 17
Increasingly, companies are looking to their technol-ogy executives to identify and leverage new technical advances to spur their firms’ growth. Information
technology (IT) leaders are responsible for facilitat-ing communication among a dispersed and mobile workforce, and between the business and its customers. Company decision makers also are becoming more reliant on customer data that the IT department col-lects, stores and analyzes to anticipate changing market demands.
Success in this environment requires access to skilled IT professionals, and many firms now rely on a combi-nation of full-time and interim IT employees to meet their variable human resources needs.
Robert Half Technology account executives typically have experience in the IT field, which means they un-derstand what employers need. We provide companies with full-time and project-based IT professionals skilled in areas such as web development, network security, systems integration and desktop support, among others.
Effectively meeting the demands of our clients depends on our ability to attract the best IT job candidates. We offer not only immediate employment opportunities but also long-term career-building resources. Uponregistering with Robert Half Technology, consultants have 24x7 access to a wide range of professional devel-opment courses.
Our web-based training program includes interactive educational courses covering the skills employers value most, from business fundamentals to technical abilities. IT professionals also can enroll in free courses prepar-ing them for some of the field’s most important certi-fications, including Project Management Professional, Cisco Certified Network Administrator and Microsoft Certified Systems Engineer.
Our reputation in the IT community is enhanced by our long-standing industry alliances. We maintain active business relationships with targeted user groups and industry associations such as HDI (formerly Help Desk Institute) and the Association of Information Technology Professionals. These partnerships allow us to broaden our networks, augment our knowledge of the latest IT research and trends, and demonstrate our leadership as a provider of highly skilled IT profes-sionals.
Robert Half Technology has attained Gold Certified Partner status with Microsoft. This relationship gives us access to exclusive training for our consultants in Microsoft technologies such as Windows Vista, SQLServer and SharePoint. Our account executives often present at Microsoft’s annual partner meetings and local events, generating interest in our services within the Microsoft partner community as well as among companies using Microsoft products.
We draw on our many years of experience with workplace issues to provide businesses and job seekers with staff management and career advice. We share the results of our numerous surveys of IT executives, as well as other research, through publications such as our annual Salary Guide and a variety of podcasts and online resources. Our expertise also makes us a frequently cited source in business and trade publica-tions worldwide.
Robert Half Technology is the premier IT staffing resource for firms that need employees who can meet project requirements and also help bring IT to the fore-front of the business. Companies value our extensive network of highly skilled IT professionals, which allows us to staff even the most challenging assignments and ensure that our clients’ IT teams are as productive as possible.
For more information about our services, please visit our website at www.rht.com.
Information technology professionals on a project and full-time basis


2007 ANNUAL REPORT Robert Half International 19
Spurred by heightened demand for legal services, law offices are expanding their practice areas and inter-national reach. Likewise, corporate legal departments
are stepping up service levels to internal clients and ad-dressing ongoing corporate governance requirements.
All of these efforts require an outstanding legal team. To help them locate experienced legal professionals, businesses throughout North America turn to Robert Half Legal.
We specialize in providing experienced project and full-time attorneys, paralegals and support professionals for law firms and corporate legal departments. We also place project teams for an array of initiatives, including litigation support and e-discovery. By working with Robert Half Legal, law firms and corporate legal departments can increase productivity, better control costs and manage a higher volume of cases. We can meet our clients’ combined project placement, legal support and legal search needs.
Robert Half Legal is ideally suited to serve law firms and corporate legal departments because of our experi-ence in the legal field. Many of our account executives are former attorneys and administrators with firsthand knowledge of law office operations. Put simply, we know the legal staffing business inside and out.
In addition to their own professional contacts, our account executives draw upon Robert Half Legal’s vast candidate database and recruitment and referral net-work. Our reputation and recruiting efforts are further enhanced by national alliances and business relation-ships with prominent industry organizations such as
the Association of Corporate Counsel, Association of Legal Administrators and Minority Corporate Counsel Association. Members of these highly respected associa-tions value our ongoing commitment to the industry and our leadership as a provider of experienced legal talent.
We also provide complimentary training to help our job candidates enhance their skill sets and advance their careers. This includes online training courses and free continuing legal education (CLE) in select markets.
Moreover, Robert Half Legal regularly conducts in-depth research and surveys of attorneys to remain current on significant employment and workplace developments impacting legal professionals. We then share our findings with clients, candidates and the busi-ness community, helping them make more informed decisions about their human resources needs. Our an-nual Salary Guide, for instance, features a detailed analy-sis of hiring and compensation trends. Our Future Law Office initiative is part of our ongoing effort to provide our clients and candidates with a global perspective on industry trends shaping the business and practice of law. Highlights from our research can be viewed at www.futurelawoffice.com.
With our experienced account executives and an extensive database of highly skilled candidates, Robert Half Legal is an asset to businesses focused on building productivity and profitability.
For more information about our services, please visit our website at www.roberthalflegal.com.
Experienced legal professionals for project and full-time positions

2007 ANNUAL REPORT Robert Half International 21
Freelance creative, web, advertising and marketing professionals
Rapidly evolving marketing approaches and con-
sumer expectations have created both challenges
and opportunities for companies of all sizes. To
win new business, firms must develop dynamic, uni-
fied branding campaigns that engage customers who
have grown increasingly accustomed to controlling
how and when they receive information. The good
news is that an expanded array of tools is available
for meeting this challenge. The most sophisticated
initiatives typically combine traditional marketing
techniques with more recent platforms, such as social
networking websites, online video and mobile media.
The Creative Group is a preferred resource for
creative professionals who can help companies build
relationships with clients and customers using the
right blend of media. Our roster of experienced ad-
vertising, marketing, web and public relations profes-
sionals can successfully execute projects of any scope
and size. We represent a broad range of freelancers,
including Flash and InDesign experts, as well as
experienced interactive strategists and communica-
tions specialists. By working with us, businesses know
they will be provided with highly skilled professionals
who have been assessed using TalentMatchSM, our
proprietary evaluation process, which includes a per-
sonal interview and skills testing on leading software
applications.
Our staffing teams are typically comprised of former
designers and marketers who are adept at finding
the right solution to our clients’ communications or
design needs. Whether it’s locating a freelancer with
a unique skill set or assembling a group of creative
professionals to undertake a major initiative, they are
available to assist at a moment’s notice. Our recruiters’
participation in leading industry associations and
extensive personal networks provide them access to
the most sought-after talent, enabling them to quickly
fill in-demand positions.
To help our freelancers keep their skills current,
we offer them immediate access to complimentary
training on software applications such as Flash and
Acrobat, as well as books and white papers on topics
ranging from marketing strategy to project manage-
ment. In addition, we work with leading software
and technical training companies such as lynda.com
and Adobe Systems to provide access to industry
certification exams and educational tools. Recently,
we expanded our relationship with Adobe to become
an Adobe Premium Solutions Partner. We also spon-
sor the Adobe Design Achievement Awards, which
honor top student designers from around the world.
Our commitment to recognizing and rewarding the
best creative talent is evidenced by our sponsorship
of The Webby Awards. For seven consecutive years,
we have been the exclusive career partner of The
Webbys, hailed as the “Oscars of the Internet.” This
has helped us meet and recruit highly skilled new
media professionals and update our associates on the
latest Internet trends.
In addition, we enjoy relationships with a number of
prestigious publications, including HOW magazine
and Graphic Design USA. Our work with these targeted
industry magazines reinforces our specialization and
dedication to the profession.
For more information about our services, please visit
our website at www.creativegroup.com.


2007 ANNUAL REPORT Robert Half International 23
Today’s business landscape is changing the ways in which organizations function and, perhaps more importantly, is creating new challenges on a daily
basis, regardless of location, industry or business model. Critical financial, regulatory and operational risks continue to emerge that CEOs, CFOs, CIOs, general counsel, chief compliance officers and chief audit executives, as well as boards of directors and their various committees, must manage in order for their companies to be successful. To assist them in addressing these risks and building effective controls to manage and monitor them, these organizations are seeking the expertise and guidance of Protiviti.
Protiviti is a global consulting and internal audit firm composed of experts specializing in risk and advisory services. We help clients solve problems in finance; operations; technology; litigation; and governance, risk and compliance (GRC).
Since its inception in 2002, Protiviti has expanded internationally and serves clients throughout the Americas, Asia-Pacific, Europe and the Middle East. During this time, the company has built an outstanding reputation for quality service and professionalism. Protiviti has been recognized by leading industry analysts for its superior risk consulting services and, in 2007, was ranked by BusinessWeek for the second consecutive year as one of the Best Places to Launch a Career.
Protiviti’s services include:
Internal Audit — Protiviti works with companies of virtu-ally any size, public or private, to assist them with their global internal audit needs. This can include starting and running internal audit activities on a fully out-sourced basis or working with an existing internal audit function to supplement a team that may lack adequate staff or skills. Protiviti’s services also include advising clients on IT security, business continuity, fraud detection and regulatory issues, among many others, and assisting with internal audits in multiple countries.
Risk & Advisory Services — To assist organizations with their business challenges and associated risks, Protiviti offers a comprehensive suite of risk solutions. These include Business Operations Improvement; CIO Solu-tions; Enterprise Application Solutions; Enterprise Information Management; Finance Transformation; Financial Risk Strategy & Management; Governance, Risk & Compliance; and Litigation, Restructuring & Investigative Services.
For a large number of companies, we also offer our proprietary technology platform, the Protiviti Gover-nance Portal, which facilitates a common approach to risk management and internal audit, and significantly enhances the overall value our clients receive.
Industry Expertise — Protiviti professionals possess advanced skills and extensive experience in virtually all industry verticals, including commercial airlines, communications, consumer products, distribution, educational institutions, energy and utilities, financial services, government services, healthcare insurers, healthcare providers, hospitality, manufacturing, me-dia, nonprofits, pharmaceuticals and life sciences, real estate, retail, services, and technology.
Thought Leadership — Protiviti regularly delivers to the marketplace world-class research and publications that underscore our deep understanding of business and industry issues and our expertise in risk consulting and internal audit. Our Global Risk Barometer study has become a recognized benchmark for how the world’s largest companies are assessing and managing their key risks. In addition, Protiviti recently released the fourth edition of its acclaimed Guide to the Sarbanes-Oxley Act: Internal Control Reporting Requirements and continues to publish its highly regarded Internal Auditing Around the World series.
For more information about our services, please visit our website at www.protiviti.com.
Internal audit and risk & advisory services

2007 ANNUAL REPORT Robert Half International 25
Robert Half International supports a variety of nonprofit organizations and provides our employees with opportunities to impact the
communities in which they live and work. We concen-trate the majority of our philanthropic efforts on education and workforce-development initiatives.
In 2007, we marked our 10-year anniversary of working with Boys & Girls Clubs of America. We are proud to support this organization in its efforts to provide educational and career-exploration opportuni-ties to children throughout the United States. In addi-tion, all year long our internal staff carried on their tradition of participating in their communities through the coordination of food and toy drives, as well as taking part in activity-based fundraising events, such as walk-a-thons, charity runs and bike rides.
Educating the Future WorkforceDuring the year, we expanded our commitment to educational and workforce-development programs through our support of Upwardly Global and Students In Free Enterprise (SIFE).
Upwardly Global brings employers together with highly skilled, work-authorized immigrants, helping them to update their resumes, sharpen interviewing skills and develop professional networks. Robert Half supports the efforts of Upwardly Global by providing access to e-learning programs, mentorship arrange-ments, career advice and practice job interviews.
Working in partnership with business and higher education, SIFE gives students the tools to learn about business in real-life situations, while helping members of their communities achieve and sustain economic success. Robert Half staff serve as expert judges at SIFE student competitions. We also share career advice in SIFE’s student publication, Career Connections.
In 2007, Robert Half continued our relationship with Dress for Success, which provides professional attire, a network of support and career-development tools to
assist disadvantaged women in their job search efforts. During the year, we held our fifth clothing drive, and we are pleased to report that more than 100,000 items of clothing and accessories have now been donated through this program. The donations, which come from our clients, candidates and internal employees, are helping thousands of job seekers approach employ-ment interviews with additional confidence.
Robert Half also supports Adopt-A-Classroom, a nonprofit organization that helps teachers purchase much-needed classroom supplies and other resources.
A Global PresenceThroughout 2007, our colleagues in the United Kingdom focused their philanthropic efforts on Teenage Cancer Trust, a charity devoted to improving the lives of teenagers and young adults with cancer. In addition to the activities of Robert Half volunteers, the company has pledged to raise £100,000 toward the creation of a day room in the new Teenage Cancer Trust unit currently being built for the Birmingham Children’s Hospital.
Since 2006, our offices in Continental Europe have been actively supporting SOS Children’s Villages, an independent, nongovernmental social development organization that focuses on children without parental care and children of families in difficult circumstances. Robert Half professionals provide seminars for teen-agers on resume writing and interviewing, and help communities and emergency programs by organizing local activities.
We are proud to support our nonprofit partners in expanding services to their communities. For more information about our Leading by Example program,
please visit www.rhi.com/philanthropy.
Leading by example in our communities
26 Robert Half International 2007 AnnuAl RepoRt
For 60 years, Robert Half International has been assisting businesses and job seekers with their hiring and employment needs.
to ensure we remain up-to-date on emerging develop-ments that may affect our clients and candidates, we frequently conduct research on hiring trends, skills and specialties in demand, and workplace culture. In addition, we collaborate with professional associations worldwide on research initiatives that focus on compen-sation, corporate identity, corporate social responsibility and other issues.
our alliances with industry associations allow us to re-main at the forefront of the fields we serve. For example, Robert Half is a member of AARp’s national employer team and has been awarded RetirementJobs.com’s Age Friendly employer Certification.
We provide clients and candidates with a variety of complimentary resources, including our annual salary guides, which track compensation levels and hiring trends in the fields we serve. Businesses use the salary guides in their hiring efforts and when planning annual budgets, and job seekers turn to the guides when nego-tiating starting compensation. other resources we make available to businesses and job candidates include the International Financial Salary Guide, Global Financial Employ-ment Monitor and Working Hours: A Global Comparison.
We recently launched FinanceJobsAbroad.com, a website exclusively for those who seek employment
opportunities overseas. We also produce career-related podcasts and other resources to help professionals advance in their careers.
Robert Half International’s chairman and Ceo, Max Messmer, is a frequently published author whose books include The Fast Forward MBA in Hiring; Human Resources Kit For Dummies, 2nd edition; Motivating Employees For Dummies; Job Hunting For Dummies, 2nd edition; and Managing Your Career For Dummies (John Wiley & Sons, Inc.). His most recent title, Human Resource Management, was released in late 2007 by Wiley pathways and serves as a resource for students. Mr. Messmer also authors a popular column, “Resumania,” which is syndicated by Scripps-Howard news Service.
protiviti, Robert Half ’s internal audit and risk consult-ing subsidiary, also is highly regarded for its industry-leading research and expertise. protiviti’s resources include Knowledgeleader, a subscription-based web portal; comprehensive guides to the Sarbanes-oxley Act and its ongoing requirements; and reports covering corporate governance, risk management and fraud. protiviti’s Global Risk Barometer provides an analysis of risk profiles and risk management practices of the world’s largest companies.
For more information about our many resources, please
visit the leading Resource section of www.rhi.com.
THE LEADING RESOURCE

Certain information contained in Management’s Discussion and Analysis and in other parts of this report may be deemed forward-looking statements regarding events and financial trends that may affect the Company’s future operating results or financial positions. These statements may be identified by words such as “estimate”, “forecast”, “project”, “plan”, “intend”, “believe”, “expect”, “anticipate”, or variations or negatives thereof or by similar or comparable words or phrases. Forward-looking statements are subject to risks and uncertainties that could cause actual results to differ materially from those expressed in the statements. These risks and uncertainties include, but are not limited to, the following: changes in levels of unemployment and other economic conditions in the United States or foreign countries where the Company does business, or in particular regions or industries; reduction in the supply of candidates for temporary employment or the Company’s ability to attract candidates; the entry of new competitors into the market-place or expansion by existing competitors; the ability of the Company to maintain existing client relationships and attract new clients in the context of changing economic or competitive conditions; the impact of competitive pressures, including any change in the demand for the Company’s services, on the Company’s ability to maintain its margins; the possibility of the Company incurring liability for its activities, including the activities of its temporary employees, or for events impacting its temporary employees on clients’ prem-ises; the possibility that adverse publicity could impact the Company’s ability to attract and retain clients and candidates; the success of the Company in attracting, training, and retaining qualified management personnel and other staff employees; whether governments will impose additional regulations or licensing requirements on personnel services businesses in particular or on employer/employee relationships in general; whether there will be ongoing demand for Sarbanes-Oxley or other regulatory compliance services; and litigation relating to prior or current transactions or activities, including litiga-tion that may be disclosed from time to time in the Company’s SEC filings. Additionally, with respect to Protiviti, other risks and uncertainties include the fact that future success will depend on its ability to retain employees and attract clients; there can be no assurance that there will be ongoing demand for Sarbanes-Oxley or other regulatory compliance services; failure to produce projected revenues could adversely affect financial results; and there is the possibility of involvement in litigation relating to prior or current transactions or activities. Because long-term contracts are not a significant part of the Company’s business, future results cannot be reliably predicted by considering past trends or extrapolating past results.
Critical Accounting Policies and Estimates As described below, the Company’s most critical accounting policies and esti-mates are those that involve subjective decisions or assessments.
Accounts ReceivAble AllowAnces. The Company maintains allowances for estimated losses resulting from (i) the inability of its customers to make required payments, (ii) temporary placement sales adjustments, and (iii) permanent placement candidates not remaining with the client through the 90-day guarantee period, commonly referred to as “fall offs”. The Company establishes these allowances based on its review of customers’ credit profiles, historical loss statistics and current trends. The adequacy of these allowances
is reviewed each reporting period. Historically, the Company’s actual losses and credits have been consistent with these allowances. As a percentage of gross accounts receivable, the Company’s accounts receivable allowances totaled 4.6% and 4.1% as of December 31, 2007 and 2006, respectively. As of December 31, 2007, a five-percentage point deviation in the Company’s accounts receivable allowances balance would have resulted in an increase or decrease in the allowance of $1.4 million. Although future results cannot always be predicted by extrapolating past results, management believes that it is reasonably likely that future results will be consistent with historical trends and experience. However, if the financial condition of the Company’s customers were to deteriorate, resulting in an impairment of their ability to make payments, or if unexpected events or significant future changes in trends were to occur, additional allowances may be required.
income tAx Assets And liAbilities. In establishing its deferred income tax assets and liabilities, the Company makes judgments and interpretations based on the enacted tax laws and published tax guidance that are applicable to its operations. Deferred tax assets and liabilities are measured and recorded using current enacted tax rates, which the Company expects will apply to taxable income in the years in which those temporary differences are recovered or settled. The likelihood of a material change in the Company’s expected real-ization of these assets is dependent on future taxable income, its ability to use foreign tax credit carryforwards and carrybacks, final U.S. and foreign tax settlements, and the effectiveness of its tax planning strategies in the various relevant jurisdictions.
The Company also evaluates the need for valuation allowances to reduce the deferred tax assets to realizable amounts. Management evaluates all positive and negative evidence and uses judgment regarding past and future events, including operating results, to help determine when it is more likely than not that all or some portion of our deferred tax assets may not be realized. When appropriate, a valuation allowance is recorded against deferred tax assets to offset future tax benefits that may not be realized. In relation to actual net operating losses in certain foreign operations, valuation allowances of $12.7 million were recorded as of December 31, 2007. If such losses are ultimately utilized to offset future operating income, the Company will benefit its deferred tax assets up to the full amount of the valuation reserve.
While management believes that its judgments and interpretations regarding income taxes are appropriate, significant differences in actual experience may materially affect the future financial results of the Company.
Goodwill impAiRment. The Company assesses the impairment of good-will annually, or more often if events or changes in circumstances indicate that the carrying value may not be recoverable. Impairment assessments for goodwill are done at a reporting unit level. For purposes of this assess-ment, the Company’s reporting units are its lines of business. In performing periodic impairment tests, the fair value of the reporting unit is compared to the carrying value, including goodwill and intangible assets. If the fair value exceeds the carrying value, there is no impairment. If the carrying value exceeds the fair value, however, an impairment condition may exist.
The goodwill impairment assessment is based upon a discounted cash flow analysis. The estimate of future cash flows is based upon, among other things,
2007 AnnUAl REPORT Robert Half International 27
MAnAgEMEnt’s DisCussion AnD AnAlysis of finAnCiAl ConDition AnD REsults of oPERAtions
a discount rate and certain assumptions about expected future operating performance. The discount rate used by management has been calculated on a consistent basis and has not fluctuated significantly. The primary assump-tions related to future operating performance include revenue growth rates and expense levels. These assumptions are updated annually and are primarily based upon historical trends. Although management does not anticipate that these assumptions will change materially in the future, the Company’s esti-mates of discounted cash flow may differ from actual cash flow due to, among other things, economic conditions, changes to its business model or changes in its operating performance. The Company completed its annual goodwill impairment analysis during each of the years ended December 31, 2007 and 2006, and determined that no adjustment to the carrying value of goodwill was required. Based upon the Company’s most recent goodwill impair-ment analysis, management believes that unless a reporting unit were to be abandoned, the possibility of goodwill impairment as a result of a change in assumptions is unlikely.
Workers’ Compensation. Except for states which require participation in state-operated insurance funds, the Company retains the economic burden for the first $0.5 million per occurrence in workers’ compensation claims. Workers’ compensation includes ongoing healthcare and indemnity coverage for claims and may be paid over numerous years following the date of injury. Claims in excess of $0.5 million are insured. Workers’ compensation expense includes the insurance premiums for claims in excess of $0.5 million, claims administration fees charged by the Company’s workers’ compensation admin-istrator, premiums paid to state-operated insurance funds, and an estimate for the Company’s liability for Incurred But Not Reported (“IBNR”) claims and for the ongoing development of existing claims. Total workers’ compensa-tion expense was $9.4 and $12.4 million, representing 0.27% and 0.39% of applicable U.S. revenue for the years ended December 31, 2007 and 2006, respectively.
The accrual for IBNR claims and for the ongoing development of existing claims in each reporting period includes estimates. The Company has estab-lished reserves for workers’ compensation claims using loss development rates which are estimated using periodic third party actuarial valuations based upon historical loss statistics which include the Company’s historical frequency and severity of workers’ compensation claims, and an estimate of future cost trends. While management believes that its assumptions and estimates are appropriate, significant differences in actual experience or significant changes in assumptions may materially affect the Company’s future results. Based on the Company’s results for the year ended December 31, 2007, a five-percentage point deviation in the Company’s estimated loss development rates would have resulted in an increase or decrease in the allowance of $0.3 million.
stoCk-based Compensation. Under various stock plans, officers, employees, and outside directors have received or may receive grants of restricted stock, stock units, stock appreciation rights or options to purchase common stock. Effective January 1, 2006, the Company adopted the fair value recognition provisions of Statement of Financial Accounting Standards (“SFAS”) No. 123(R), Share-Based Payment (“SFAS 123(R)”), using the modified prospective transition method; accordingly, prior periods have not been restated. Stock-based compensation expense recognized in the Company’s Consolidated Financial Statements (“Financial Statements”) for the years ended December 31, 2007 and 2006 included compensation expense for stock options, which includes grants made prior to, but not yet vested as of December 31, 2005, as well as stock options granted subsequent to December 31, 2005.
Beginning in 2005, the Company significantly decreased its use of stock options as part of its compensation programs. For the years ended December 31, 2007 and 2006, the Company’s pre-tax stock-based compensation cost from options totaled $9.2 million and $17.6 million, respectively. Under both SFAS No. 123, Accounting for Stock-Based Compensation (“SFAS 123”), and SFAS
123(R) the Company determined the fair value of stock options using the Black-Scholes valuation model.
SFAS 123(R) requires the Company to recognize compensation expense for only the portion of restricted stock and stock units that is expected to vest, rather than record forfeitures when they occur, as previously permitted. If the actual number of forfeitures differs from those estimated by management, additional adjustments to compensation expense may be required in future periods. For the years ended December 31, 2007 and 2006, compensation expense related to restricted stock and stock units was $53.8 million and $40.8 million, respectively, of which $21.1 million and $10.2 million was related to grants made in 2007 and 2006, respectively. A one-percentage point deviation in the estimated forfeiture rates would have resulted in a $0.5 million and $0.4 million increase or decrease in compensation expense related to restricted stock and stock units for the years ended December 31, 2007 and 2006, respectively.
Recent Accounting Pronouncements In February 2007, the Financial Accounting Standards Board (“FASB”) issued SFAS No. 159, The Fair Value Option for Financial Assets and Financial Liabilities (“SFAS 159”), which gives entities the option to measure eligible financial as-sets, and financial liabilities at fair value on an instrument by instrument basis, that are otherwise not permitted to be accounted for at fair value under other accounting standards. The election to use the fair value option is available when an entity first recognizes a financial asset or financial liability. Subsequent changes in fair value must be recorded in earnings. This statement is effective as of January 1, 2008. The Company does not expect the adoption of SFAS 159 to have a material impact on its Financial Statements.
In June 2007, the FASB ratified Emerging Issues Task Force (“EITF”) Issue No. 06-11, Accounting for Income Tax Benefits of Dividends on Share-Based Payment Awards (“EITF 06-11”). EITF 06-11 requires that tax benefits generated by dividends paid during the vesting period on certain equity-classified share-based compensation awards be classified as additional paid-in capital and included in a pool of excess tax benefits available to absorb tax deficiencies from share-based payment awards. EITF 06-11 is effective as of January 1, 2008. The Company does not expect the adoption of EITF 06-11 to have a material impact on its Financial Statements.
In December 2007, the FASB issued SFAS No. 141 (revised 2007), Business Combinations (“SFAS No. 141(R)”). SFAS No. 141(R) establishes principles and requirements for how an acquirer recognizes and measures in its finan-cial statements the identifiable assets acquired, the liabilities assumed, any noncontrolling interest in the acquiree, and the goodwill acquired. SFAS No. 141(R) also establishes disclosure requirements to enable the evaluation of the nature and financial effects of the business combination. SFAS No. 141(R) is effective for fiscal years beginning after December 15, 2008. The Company is in the process of analyzing the impact of SFAS No. 141(R) on its Financial Statements.
In December 2007, the FASB issued SFAS No. 160, Noncontrolling Interests in Consolidated Financial Statements—an amendment of Accounting Research Bulletin No. 51 (“SFAS No. 160”). SFAS No. 160 establishes accounting and reporting standards for ownership interests in subsidiaries held by parties other than the parent, the amount of consolidated net income attributable to the parent and to the noncontrolling interest, changes in a parent’s ownership interest, and the valuation of retained, noncontrolling equity investments when a subsid-iary is deconsolidated. SFAS No. 160 also establishes disclosure requirements that clearly identify and distinguish between the interests of the parent and the interests of the noncontrolling owners. SFAS No. 160 is effective for fiscal years beginning after December 15, 2008. The Company is in the process of analyzing the impact of SFAS No. 160 on its Financial Statements.
28 Robert Half International 2007 ANNUAl REpoRT
management’s disCussion and analysis of finanCial Condition and results of operations

Results of Operations for the Three Years Ended December 31, 2007 Temporary and consultant staffing services revenues were $3.6 billion, $3.1 billion and $2.6 billion for the years ended December 31, 2007, 2006 and 2005, respectively, increasing by 16% and 19% in 2007 and 2006, respectively. On a constant-currency basis, temporary and consultant staffing services revenues increased 14% and 18% for the years ended December 31, 2007 and 2006, respectively. Permanent placement revenues were $444 million, $336 million and $219 million for the years ended December 31, 2007, 2006 and 2005, respectively, increasing by 32% and 53% in 2007 and 2006, respectively. On a constant-currency basis, permanent placement services revenues increased 29% and 52% for the years ended December 31, 2007 and 2006, respectively. Improvement in both domestic and international markets, particularly Continental Europe, contributed to the increase in temporary and permanent staffing services revenues for the year ended December 31, 2007. Risk consulting and internal audit services revenues were $552 million, $543 million and $479 million for the years ended December 31, 2007, 2006 and 2005, respectively, increasing by 2% and 13% in 2007 and 2006, respectively. On a constant-currency basis, risk consulting and internal audit services revenues were flat and increased 13% for the years ended December 31, 2007 and 2006, respectively. The 2007 increase in risk consulting and internal audit services revenues is primarily due to higher international revenues, particu-larly in Asia. There can be no assurances that there will be ongoing demand for Sarbanes-Oxley or other regulatory compliance services, or that future results can be reliably predicted by considering past trends or extrapolating past results. We expect total Company revenues to continue to be impacted by general macroeconomic conditions in 2008.
The Company’s temporary and permanent staffing services business has more than 360 offices in 42 states, the District of Columbia and eighteen foreign countries, while Protiviti has 60 offices in 22 states and fourteen foreign countries. Revenues from foreign operations represented 24%, 21% and 19% of revenues for the years ended December 31, 2007, 2006 and 2005, respectively.
Gross margin dollars from the Company’s temporary and consultant staffing services represent revenues less direct costs of services, which consist of payroll, payroll taxes and insurance costs for temporary employees, and reim-bursable expenses. Gross margin dollars from permanent placement staffing services represent revenues less reimbursable expenses. Gross margin dollars for risk consulting and internal audit services represent revenues less direct costs of services, which consist primarily of professional staff payroll, payroll taxes, insurance costs and reimbursable expenses. Gross margin dollars for the Company’s temporary and consultant staffing services were $1.4 billion, $1.2 billion and $963 million for the years ended December 31, 2007, 2006 and 2005, respectively, increasing by 17% and 20% in 2007 and 2006, respectively. On a constant-currency basis, temporary and consultant staffing services gross margin dollars increased 15% and 18% for the years ended December 31, 2007 and 2006, respectively. Gross margin amounts equaled 37%, 37% and 36% of revenues for temporary and consultant staffing services for the years ended December 31, 2007, 2006 and 2005, respectively.
Gross margin dollars for the Company’s permanent placement staffing divi-sion were $444 million, $336 million and $219 million for the years ended December 31, 2007, 2006 and 2005, respectively, increasing by 32% and 53% in 2007 and 2006, respectively. On a constant-currency basis, permanent placement staffing services gross margin dollars increased 29% and 52% for the years ended December 31, 2007 and 2006, respectively.
Gross margin dollars for the Company’s risk consulting and internal audit division were $175 million, $199 million and $190 million for the years ended December 31, 2007, 2006 and 2005, respectively, decreasing by 12% in 2007 and increasing by 5% in 2006. On a constant-currency basis, risk consulting and internal audit services gross margin dollars decreased 13% and increased 5% for the years ended December 31, 2007 and 2006, respectively. Gross
margin amounts equaled 32%, 37% and 40% of revenues for risk consulting and internal audit services for the years ended December 31, 2007, 2006 and 2005, respectively. The 2007 and 2006 decreases in gross margin percentage are primarily the result of additional professional staff related to the expansion of international operations as well as lower utilization of the professional staff in the United States.
Selling, general and administrative expenses were $1.5 billion in 2007, compared to $1.2 billion in 2006 and $991 million in 2005. Selling, general and administrative expenses as a percentage of revenues were 32%, 31% and 30% for the years ended December 31, 2007, 2006 and 2005, respectively. Selling, general and administrative expenses consist primarily of staff compen-sation, advertising, depreciation and occupancy costs. The 2007 increase relates primarily to higher staff compensation costs.
For acquisitions, the Company allocates the excess of cost over the fair market value of the net tangible assets first to identifiable intangible assets, if any, and then to goodwill. Identifiable intangible assets are amortized over their lives, typically ranging from two to five years. Goodwill is not amortized, but is tested at least annually for impairment. The Company completed its annual goodwill impairment analysis during each of the years ended December 31, 2007 and 2006, and determined that no adjustment to the carrying value of goodwill was required. Net intangible assets, consisting primarily of good-will, represented 13% of total assets and 20% of total stockholders’ equity at December 31, 2007.
Interest income for the years ended December 31, 2007, 2006 and 2005 was $17.2 million, $19.3 million and $12.1 million, respectively. Lower 2007 interest income resulted from lower average cash balances, partially offset by higher interest rates. Interest expense for the years ended December 31, 2007, 2006 and 2005 was $4.1 million, $2.5 million and $1.1 million, respectively.
The provision for income taxes was 40%, 39% and 39% of income before taxes for the years ended December 31, 2007, 2006 and 2005, respectively.
Liquidity and Capital Resources The change in the Company’s liquidity during the years ended December 31, 2007, 2006 and 2005 is primarily the net effect of funds generated by opera-tions and the funds used for capital expenditures, repurchases of common stock, payment of dividends and principal payments on outstanding notes payable.
Cash and cash equivalents were $310 million, $447 million and $458 million at December 31, 2007, 2006 and 2005, respectively. Operating activities provided $411 million during the year ended December 31, 2007, partially offset by $116 million and $452 million of net cash used in investing activities and financing activities, respectively. Operating activities provided $376 million during the year ended December 31, 2006, partially offset by $96 million and $299 million of net cash used in investing activities and financing activities, respectively. Operating activities and investing activities provided $328 million and $22 million, respectively, during the year ended December 31, 2005, partially offset by $232 million of net cash used in financing activities.
Operating activities — Net cash provided by operating activities for the year ended December 31, 2007 was composed of net income of $296 million adjusted for non-cash items of $124 million, and net cash used by changes in working capital of $9 million. Net cash provided by operating activities for the year ended December 31, 2006 was composed of net income of $283 million adjusted for non-cash items of $58 million, and net cash provided by changes in working capital of $35 million. Net cash provided by operating activities for the year ended December 31, 2005 was composed of net income of $238 million adjusted for non-cash items of $122 million, and net cash used for changes in working capital of $32 million.
2007 ANNUAL REPORT Robert Half International 29
ManageMent’s Discussion anD analysis of financial conDition anD Results of opeRations

ManageMent’s Discussion anD analysis of financial conDition anD Results of opeRations
30 Robert Half International 2007 AnnuAl RepoRt
Investing activities — Cash used in investing activities for the year ended December 31, 2007 was $116 million. this was composed of capital expen-ditures of $84 million, purchases of goodwill and other intangible assets of $19 million, and deposits to trusts for employee benefits and retirement plans of $13 million. Cash used in investing activities for the year ended December 31, 2006 was $96 million. this was composed of capital expenditures of $80 million, purchases of goodwill and other intangible assets of $12 million, and deposits to trusts for employee benefits and retirement plans of $4 million. Cash provided by investing activities for the year ended December 31, 2005 was $22 million. this was primarily composed of proceeds from sales and maturities of marketable securities of $92 million, partially offset by capital expenditures of $62 million, purchases of goodwill and other intangible assets of $4 million, and deposits to trusts for employee benefits and retirement plans of $3 million.
Financing activities — Cash used in financing activities for the year ended December 31, 2007 was $452 million. this included repurchases of $453 million in common stock and $66 million in cash dividends to stockholders, partially offset by proceeds of $52 million from exercises of stock options and the excess tax benefits from stock-based compensation of $15 million. Cash used in financing activities for the year ended December 31, 2006 was $299 million. this included repurchases of $400 million in common stock and $54 million in cash dividends to stockholders, partially offset by proceeds of $105 million from exercises of stock options and the excess tax benefits from stock-based compensation of $50 million. Cash used in financing activities for the year ended December 31, 2005 was $232 million. this included repurchases of $262 million in common stock and $48 million in cash dividends to stock-holders, partially offset by proceeds of $77 million from exercises of stock options.
As of December 31, 2007, the Company is authorized to repurchase, from time to time, up to 9.2 million additional shares of the Company’s common stock on the open market or in privately negotiated transactions, depending on market conditions. During the years ended December 31, 2007, 2006 and 2005, the Company repurchased approximately 12.2 million shares, 7.9 million shares and 7.6 million shares of common stock on the open market for a total cost of $397 million, $273 million and $222 million, respectively. Additional stock repurchases were made in connection with employee stock plans, whereby Company shares were tendered by employees for the payment of exercise price and applicable statutory withholding taxes. During the years ended December 31, 2007, 2006 and 2005, such repurchases totaled approxi-mately 1.6 million shares, 3.3 million shares and 1.6 million shares at a cost of $58 million, $127 million and $53 million, respectively. Repurchases of securi-ties have been funded with cash generated from operations.
the Company’s working capital at December 31, 2007 included $310 million in cash and cash equivalents. the Company’s working capital requirements relate primarily to accounts receivable. While there can be no assurances in this regard, the Company expects that internally generated cash will be suffi-cient to support the working capital needs of the Company, the Company’s fixed payments, dividends, and other obligations on both a short- and long-term basis.
on February 13, 2008 the Company announced a quarterly dividend of $.11 per share to be paid to all shareholders of record on February 25, 2008. the dividend will be paid on March 14, 2008.
the Company’s cash flows generated from operations are also the primary source for funding various contractual obligations. the table below summa-rizes the Company’s major commitments as of December 31, 2007 (in thou-sands):
payMents Due by peRioD contractual obligations 2008 2009 and 2010 2011 and 2012 thereafter total long-term debt obligations $ 629 $ 2,334 $ 534 $ 2,271 $ 5,768operating lease obligations 98,421 164,103 78,489 25,435 366,448purchase obligations 24,841 11,199 — — 36,040other liabilities 416 1,256 629 7,551 9,852
total $ 124,307 $ 178,892 $ 79,652 $ 35,257 $ 418,108
long-term debt obligations consist of promissory notes and related interest as well as other forms of indebtedness issued in connection with certain acquisi-tions and other payment obligations. operating lease obligations consist of minimum rental commitments for 2008 and thereafter under non-cancelable leases in effect at December 31, 2007. purchase obligations consist of purchase commitments primarily related to telecom service agreements, software licenses and subscriptions, and computer hardware and software maintenance agreements. the above table does not reflect $5.8 million of unrecognized tax benefits which the Company has accrued for uncertain tax positions in accor-dance with FASB Interpretation no. 48, Accounting for Uncertainty in Income Taxes. As of December 31, 2007, the Company classified $3.5 million of its unrec-ognized tax benefits as a current liability, as these amounts are expected to be paid in the next twelve months. the remaining $2.3 million of unrecognized tax benefits have been classified as a non-current liability, as a reasonably reliable estimate of the period of future payments, if any, could not be determined.
QuantitativeandQualitativeDisclosuresAboutMarketRiskthe Company is exposed to the impact of foreign currency fluctuations. the Company’s exposure to foreign currency exchange rates relates primarily to the Company’s foreign subsidiaries. exchange rates impact the u.S. dollar value of the Company’s reported earnings, investments in its foreign subsid-iaries, and the intercompany transactions with its foreign subsidiaries.
For the year ended December 31, 2007, approximately 24% of the Company’s revenues were generated outside of the united States. these operations transact business in their functional currency. As a result, fluctuations in the value of foreign currencies against the u.S. dollar have an impact on the Company’s reported results. Revenues and expenses denominated in foreign currencies are translated into u.S. dollars at the monthly average exchange rates prevailing during the period. Consequently, as the value of the u.S. dollar changes relative to the currencies of the Company’s non-u.S. markets, the Company’s reported results vary.
Fluctuations in currency exchange rates impact the u.S. dollar amount of the Company’s stockholders’ equity. the assets and liabilities of the Company’s non-u.S. subsidiaries are translated into u.S. dollars at the exchange rates in effect at period end. the resulting translation adjustments are recorded in stockholders’ equity as a component of accumulated other comprehensive income.

2007 ANNUAL REPORT Robert Half International 31
DECEMBER 31, 2007 2006
ASSETSCash and cash equivalents $ 310,000 $ 447,479Accounts receivable, less allowances of $28,464 and $22,495 593,169 531,824Deferred income taxes and other current assets 156,469 133,052
Total current assets 1,059,638 1,112,355
Goodwill and other intangible assets, net 195,143 178,665Property and equipment, net 152,311 132,081Deferred income taxes 43,206 35,920
Total assets $ 1,450,298 $ 1,459,021
LIABILITIESAccounts payable and accrued expenses $ 108,070 $ 99,484Accrued payroll costs and retirement obligations 323,264 294,325Income taxes payable 16,248 8,568Current portion of notes payable and other indebtedness 370 363
Total current liabilities 447,952 402,740
Notes payable and other indebtedness, less current portion 3,753 3,831Other liabilities 14,544 9,779
Total liabilities 466,249 416,350
Commitments and Contingencies (Note I)
STOCKHOLDERS’ EQUITYPreferred stock, $.001 par value authorized 5,000,000 shares; issued and outstanding zero shares — —Common stock, $.001 par value authorized 260,000,000 shares; issued and outstanding
158,057,575 and 167,847,849 shares 158 168Capital surplus 915,038 1,003,926Deferred compensation — —Accumulated other comprehensive income 68,853 38,577Retained earnings — —
Total stockholders’ equity 984,049 1,042,671
Total liabilities and stockholders’ equity $ 1,450,298 $ 1,459,021
The accompanying Notes to Consolidated Financial Statements are an integral part of these financial statements.
(in thousands, except share amounts)
CONSOLIDATED STATEMENTS OF FINANCIAL POSITION
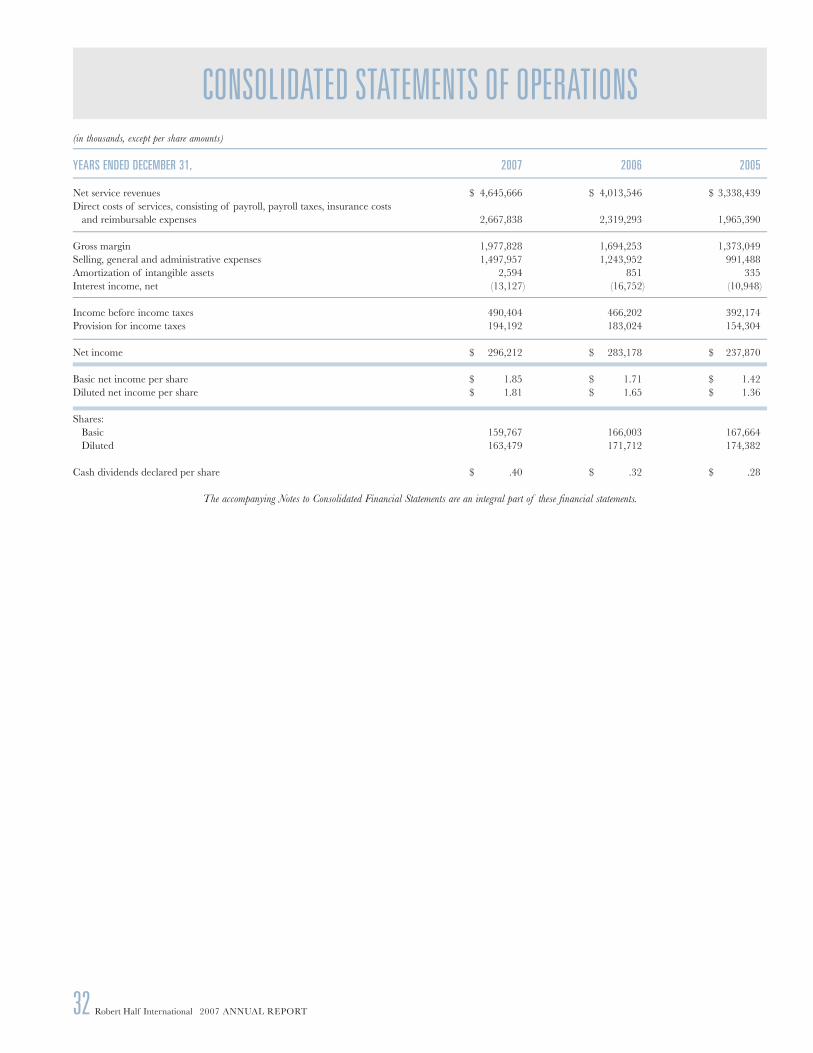
32 Robert Half International 2007 ANNUAL REPORT
YEARS ENDED DECEMBER 31, 2007 2006 2005
Net service revenues $ 4,645,666 $ 4,013,546 $ 3,338,439Direct costs of services, consisting of payroll, payroll taxes, insurance costs and reimbursable expenses 2,667,838 2,319,293 1,965,390
Gross margin 1,977,828 1,694,253 1,373,049Selling, general and administrative expenses 1,497,957 1,243,952 991,488Amortization of intangible assets 2,594 851 335Interest income, net (13,127) (16,752) (10,948)
Income before income taxes 490,404 466,202 392,174Provision for income taxes 194,192 183,024 154,304
Net income $ 296,212 $ 283,178 $ 237,870
Basic net income per share $ 1.85 $ 1.71 $ 1.42Diluted net income per share $ 1.81 $ 1.65 $ 1.36
Shares: Basic 159,767 166,003 167,664 Diluted 163,479 171,712 174,382
Cash dividends declared per share $ .40 $ .32 $ .28
The accompanying Notes to Consolidated Financial Statements are an integral part of these financial statements.
(in thousands, except per share amounts)
CONSOLIDATED STATEMENTS OF OPERATIONS
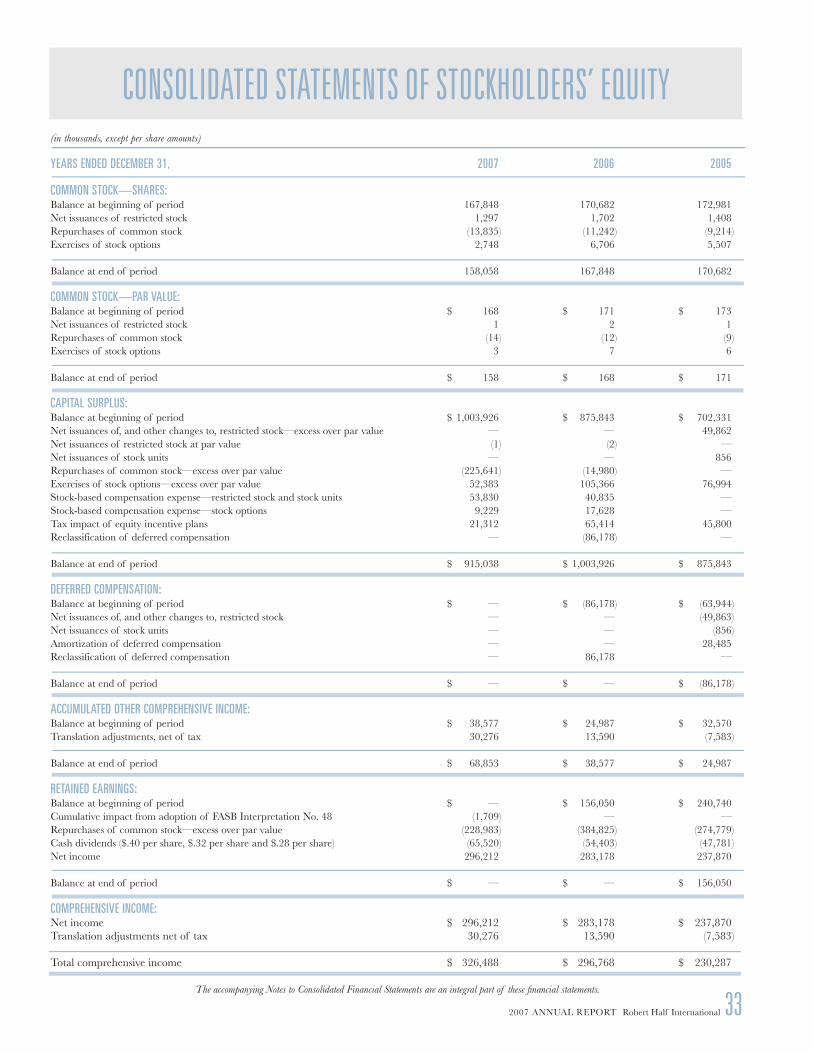
2007 ANNUAL REPORT Robert Half International 33
(in thousands, except per share amounts)
YEARS ENDED DECEMBER 31, 2007 2006 2005
COMMON STOCK—SHARES:Balance at beginning of period 167,848 170,682 172,981Net issuances of restricted stock 1,297 1,702 1,408Repurchases of common stock (13,835) (11,242) (9,214)Exercises of stock options 2,748 6,706 5,507
Balance at end of period 158,058 167,848 170,682
COMMON STOCK—PAR VALUE:Balance at beginning of period $ 168 $ 171 $ 173Net issuances of restricted stock 1 2 1Repurchases of common stock (14) (12) (9)Exercises of stock options 3 7 6
Balance at end of period $ 158 $ 168 $ 171
CAPITAL SURPLUS:Balance at beginning of period $ 1,003,926 $ 875,843 $ 702,331Net issuances of, and other changes to, restricted stock—excess over par value — — 49,862Net issuances of restricted stock at par value (1) (2) —Net issuances of stock units — — 856Repurchases of common stock—excess over par value (225,641) (14,980) —Exercises of stock options—excess over par value 52,383 105,366 76,994Stock-based compensation expense—restricted stock and stock units 53,830 40,835 —Stock-based compensation expense—stock options 9,229 17,628 —Tax impact of equity incentive plans 21,312 65,414 45,800Reclassification of deferred compensation — (86,178) —
Balance at end of period $ 915,038 $ 1,003,926 $ 875,843
DEFERRED COMPENSATION:Balance at beginning of period $ — $ (86,178) $ (63,944)Net issuances of, and other changes to, restricted stock — — (49,863)Net issuances of stock units — — (856)Amortization of deferred compensation — — 28,485Reclassification of deferred compensation — 86,178 —
Balance at end of period $ — $ — $ (86,178)
ACCUMULATED OTHER COMPREHENSIVE INCOME:Balance at beginning of period $ 38,577 $ 24,987 $ 32,570Translation adjustments, net of tax 30,276 13,590 (7,583)
Balance at end of period $ 68,853 $ 38,577 $ 24,987
RETAINED EARNINGS:Balance at beginning of period $ — $ 156,050 $ 240,740Cumulative impact from adoption of FASB Interpretation No. 48 (1,709) — —Repurchases of common stock—excess over par value (228,983) (384,825) (274,779)Cash dividends ($.40 per share, $.32 per share and $.28 per share) (65,520) (54,403) (47,781)Net income 296,212 283,178 237,870
Balance at end of period $ — $ — $ 156,050
COMPREHENSIVE INCOME:Net income $ 296,212 $ 283,178 $ 237,870Translation adjustments net of tax 30,276 13,590 (7,583)
Total comprehensive income $ 326,488 $ 296,768 $ 230,287
CONSOLIDATED STATEMENTS OF STOCKHOLDERS’ EQUITY
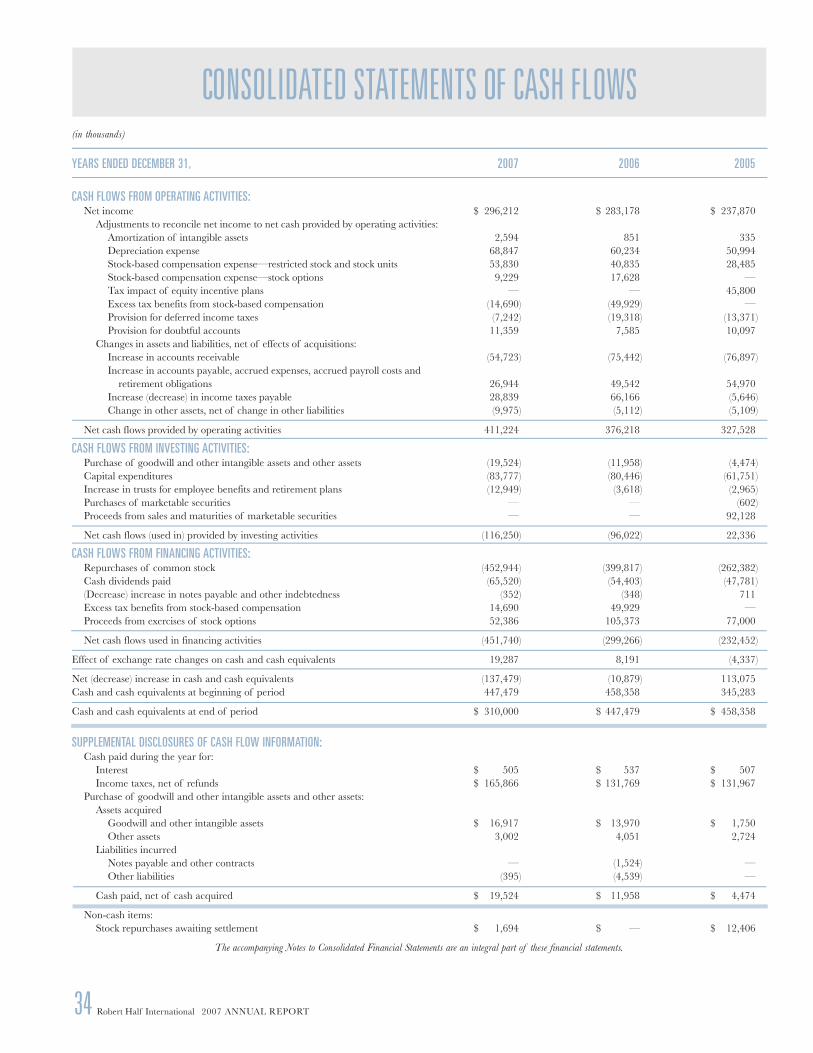
34 Robert Half International 2007 ANNUAL REPORT
YEARS ENDED DECEMBER 31, 2007 2006 2005
CASH FLOWS FROM OPERATING ACTIVITIES: Net income $ 296,212 $ 283,178 $ 237,870 Adjustments to reconcile net income to net cash provided by operating activities: Amortization of intangible assets 2,594 851 335 Depreciation expense 68,847 60,234 50,994 Stock-based compensation expense—restricted stock and stock units 53,830 40,835 28,485 Stock-based compensation expense—stock options 9,229 17,628 — Tax impact of equity incentive plans — — 45,800 Excess tax benefits from stock-based compensation (14,690) (49,929) — Provision for deferred income taxes (7,242) (19,318) (13,371) Provision for doubtful accounts 11,359 7,585 10,097 Changes in assets and liabilities, net of effects of acquisitions: Increase in accounts receivable (54,723) (75,442) (76,897) Increase in accounts payable, accrued expenses, accrued payroll costs and retirement obligations 26,944 49,542 54,970 Increase (decrease) in income taxes payable 28,839 66,166 (5,646) Change in other assets, net of change in other liabilities (9,975) (5,112) (5,109)
Net cash flows provided by operating activities 411,224 376,218 327,528
CASH FLOWS FROM INVESTING ACTIVITIES: Purchase of goodwill and other intangible assets and other assets (19,524) (11,958) (4,474) Capital expenditures (83,777) (80,446) (61,751) Increase in trusts for employee benefits and retirement plans (12,949) (3,618) (2,965) Purchases of marketable securities — — (602) Proceeds from sales and maturities of marketable securities — — 92,128
Net cash flows (used in) provided by investing activities (116,250) (96,022) 22,336
CASH FLOWS FROM FINANCING ACTIVITIES: Repurchases of common stock (452,944) (399,817) (262,382) Cash dividends paid (65,520) (54,403) (47,781) (Decrease) increase in notes payable and other indebtedness (352) (348) 711 Excess tax benefits from stock-based compensation 14,690 49,929 — Proceeds from exercises of stock options 52,386 105,373 77,000
Net cash flows used in financing activities (451,740) (299,266) (232,452)
Effect of exchange rate changes on cash and cash equivalents 19,287 8,191 (4,337)
Net (decrease) increase in cash and cash equivalents (137,479) (10,879) 113,075Cash and cash equivalents at beginning of period 447,479 458,358 345,283
Cash and cash equivalents at end of period $ 310,000 $ 447,479 $ 458,358
SUPPLEMENTAL DISCLOSURES OF CASH FLOW INFORMATION: Cash paid during the year for: Interest $ 505 $ 537 $ 507 Income taxes, net of refunds $ 165,866 $ 131,769 $ 131,967 Purchase of goodwill and other intangible assets and other assets: Assets acquired Goodwill and other intangible assets $ 16,917 $ 13,970 $ 1,750 Other assets 3,002 4,051 2,724 Liabilities incurred Notes payable and other contracts — (1,524) — Other liabilities (395) (4,539) —
Cash paid, net of cash acquired $ 19,524 $ 11,958 $ 4,474
Non-cash items: Stock repurchases awaiting settlement $ 1,694 $ — $ 12,406
The accompanying Notes to Consolidated Financial Statements are an integral part of these financial statements.
(in thousands)
CONSOLIDATED STATEMENTS OF CASH FLOWS

2007 AnnuAl RepoRt Robert Half International 35
Note A — Summary of Significant Accounting Policies Nature of operatioNs. Robert Half International Inc. (the “Company”) provides specialized staffing and risk consulting services through such divi-sions as Accountemps®, Robert Half® Finance & Accounting, OfficeTeam®, Robert Half® Technology, Robert Half® Management Resources, Robert Half® Legal, The Creative Group®, and Protiviti®. the Company, through its Accountemps, Robert Half Finance & Accounting, and Robert Half Management Resources divisions, is a special-ized provider of temporary, full-time, and project professionals in the fields of accounting and finance. OfficeTeam specializes in highly skilled temporary administrative support personnel. Robert Half Technology provides information technology professionals. Robert Half Legal provides temporary, project, and full-time staffing of attorneys and specialized support personnel within law firms and corporate legal departments. The Creative Group provides project staffing in the advertising, marketing, and web design fields. Protiviti provides business and technology risk consulting and internal audit services, and is a wholly-owned subsidiary of the Company. Revenues are predominantly derived from special-ized staffing services. the Company operates in north America, South America, europe, Asia and Australia. the Company is a Delaware corporation.
Basis of preseNtatioN. the Consolidated Financial Statements (“Financial Statements”) of the Company are prepared in conformity with accounting principles generally accepted in the united States of America (“GAAp”) and the rules of the Securities and exchange Commission (“SeC”).
priNciples of coNsolidatioN. the Financial Statements include the accounts of the Company and its subsidiaries, all of which are wholly-owned. All intercompany balances have been eliminated.
use of estimates. the preparation of financial statements in conformity with GAAp requires management to make estimates and assumptions that affect the reported amounts of assets and liabilities and disclosure of contin-gent assets and liabilities at the date of the financial statements and the reported amounts of revenues and expenses during the reporting period. As of December 31, 2007, such estimates included allowances for uncollectible accounts receivable, workers’ compensation losses and income and other taxes.
reveNue recogNitioN. the Company derives its revenues from three segments: temporary and consultant staffing, permanent placement staffing, and risk consulting and internal audit services. net service revenues as presented on the Consolidated Statements of operations represent services rendered to customers less sales adjustments and allowances. Reimbursements, including those related to travel and out-of-pocket expenses, are also included in net service revenues, and equivalent amounts of reimbursable expenses are included in direct costs of services. the Company records revenue on a gross basis as a principal versus on a net basis as an agent in the presentation of revenues and expenses. the Company has concluded that gross reporting is appropriate because the Company (i) has the risk of identifying and hiring qualified employees, (ii) has the discretion to select the employees and establish their price and duties and (iii) bears the risk for services that are not fully paid for by customers.
Temporary and consultant staffing revenues — temporary and consultant staffing revenues are recognized when the services are rendered by the Company’s temporary employees. employees placed on temporary assignment by the Company are the Company’s legal employees while they are working on assignments. the Company pays all related costs of employment, including workers’ compensation insurance, state and federal unemployment taxes, social security and certain fringe benefits. the Company assumes the risk of accept-ability of its employees to its customers.
Permanent placement staffing revenues — permanent placement staffing revenues are recognized when employment candidates accept offers of permanent employment. the Company has a substantial history of estimating the effect of permanent placement candidates who do not remain with its clients
through the 90-day guarantee period. Allowances are established to estimate these losses. Fees to clients are generally calculated as a percentage of the new employee’s annual compensation. no fees for permanent placement services are charged to employment candidates.
Risk consulting and internal audit revenues — Risk consulting and internal audit services are generally provided on a time-and-material basis or fixed-fee basis. Revenues earned under time-and-material arrangements are recognized as services are provided. Revenues on fixed-fee arrangements are recognized using a proportional performance method as hours are incurred relative to total estimated hours for the engagement. the Company periodically evaluates the need to provide for any losses on these projects, and losses are recognized when it is probable that a loss will be incurred.
costs of services. Direct costs of temporary and consultant staffing services consist of payroll, payroll taxes and insurance costs for the Company’s temporary employees, as well as reimbursable expenses. Direct costs of permanent placement staffing services consist of reimbursable expenses. Risk consulting and internal audit costs of services include professional staff payroll, payroll taxes and insurance costs, as well as reimbursable expenses.
advertisiNg costs. the Company expenses all advertising costs as incurred. Advertising expense totaled $59.2 million, $52.3 million and $47.4 million for the years ended December 31, 2007, 2006 and 2005, respectively.
compreheNsive iNcome. Comprehensive income includes net income and certain other items that are recorded directly to Stockholders’ equity. the Company’s only source of other comprehensive income is foreign currency translation adjustments.
cash aNd cash equivaleNts. the Company considers all highly liquid investments with a maturity at the date of purchase of three months or less as cash equivalents.
goodwill aNd iNtaNgiBle assets. Intangible assets primarily consist of the cost of acquired companies in excess of the fair market value of their net tangible assets at the date of acquisition. Identifiable intangible assets are amortized over their lives, typically ranging from two to five years. Goodwill is not amortized, but is tested at least annually for impairment. the Company completed its annual goodwill impairment analysis during each of the three years ended December 31, 2007, and determined that no adjustment to the carrying value of goodwill was required.
iNcome tax assets aNd liaBilities. In establishing its deferred income tax assets and liabilities, the Company makes judgments and interpretations based on the enacted tax laws and published tax guidance that are applicable to its operations. Deferred tax assets and liabilities are measured and recorded using current enacted tax rates, which the Company expects will apply to taxable income in the years in which those temporary differences are recovered or settled. the likelihood of a material change in the Company’s expected realization of these assets is dependent on future taxable income, its ability to use foreign tax credit carryforwards and carrybacks, final u.S. and foreign tax settlements, and the effectiveness of its tax planning strategies in the various relevant jurisdictions.
workers’ compeNsatioN. except for states which require participation in state-operated insurance funds, the Company retains the economic burden for the first $0.5 million per occurrence in workers’ compensation claims. Workers’ compensation includes ongoing healthcare and indemnity coverage for claims and may be paid over numerous years following the date of injury. Claims in excess of $0.5 million are insured. Workers’ compensation expense includes the insurance premiums for claims in excess of $0.5 million, claims administration fees charged by the Company’s workers’ compensation admin-istrator, premiums paid to state-operated insurance funds, and an estimate for the Company’s liability for Incurred But not Reported (“IBnR”) claims and for the ongoing development of existing claims.
NoteS to CoNSolidAted FiNANCiAl StAtemeNtS

36 Robert Half International 2007 ANNUAL REPORT
The accrual for IBNR claims and for the ongoing development of existing claims in each reporting period includes estimates. The Company has estab-lished reserves for workers’ compensation claims using loss development rates which are estimated using periodic third party actuarial valuations based upon historical loss statistics which include the Company’s historical frequency and severity of workers’ compensation claims, and an estimate of future cost trends. While management believes that its assumptions and estimates are appropriate, significant differences in actual experience or significant changes in assumptions may materially affect the Company’s future results.
FOREIGN CURRENCY TRANSLATION. The results of operations of the Company’s foreign subsidiaries are translated at the monthly average exchange rates prevailing during the period. The financial position of the Company’s foreign subsidiaries is translated at the current exchange rates at the end of the period, and the related translation adjustments are recorded as a component of accumulated other comprehensive income within Stockholders’ Equity. Gains and losses resulting from foreign currency transactions are included as a component of selling, general and administrative expenses in the Consolidated Statements of Operations, and have not been material for all periods presented.
STOCK-BASED COMPENSATION. Under various stock plans, officers, employees, and outside directors have received or may receive grants of restricted stock, stock units, stock appreciation rights or options to purchase common stock. Effective January 1, 2006, the Company adopted the fair value recognition provisions of Statement of Financial Accounting Standards (“SFAS”) No. 123(R), Share-Based Payment (“SFAS 123(R)”). Prior to January 1, 2006, the Company accounted for the plans under the measurement and recognition provisions of Accounting Principles Board (“APB”) Opinion No. 25, Accounting for Stock Issued to Employees (“APB 25”), and related Interpretations as permitted by SFAS No. 123, Accounting for Stock-Based Compensation (“SFAS 123”). Under APB 25, the Company recorded stock-based compensation expense for restricted stock and stock units in its Financial Statements. Under the provi-sions of APB 25, the Company was not required to recognize compensation expense for stock options due to using the intrinsic value method. Stock-based compensation expense for stock options was included as a pro forma disclosure in the financial statement footnotes.
The following table reflects pro forma net income and basic and diluted net income per share (in thousands, except per share amounts):
YEAR ENDED DECEMBER 31, 2005
Net Income As reported $ 237,870 Stock-based employee compensation expense, net of related tax effects 17,148 Total stock-based employee compensation expense determined under fair value based method for all awards, net of related tax effects (31,466)
Pro forma $ 223,552
Net Income Per Share Basic As reported $ 1.42 Pro forma $ 1.33 Diluted As reported $ 1.36 Pro forma $ 1.29
The fair value of each option is estimated, as of the grant date, using the Black-Scholes option pricing model with the following weighted average assumptions used for grants in 2005: expected dividend yield of 0.92%; expected volatility of 47.1%; risk-free interest rate of 3.8%; and expected life of 6.1 years.
The Company adopted SFAS 123(R) using the modified prospective transition
method. Under this transition method, the Company’s Financial Statements for prior periods have not been restated to reflect, and do not include, the impact of SFAS 123(R). Stock-based compensation expense recognized in the Company’s Financial Statements for the years ended December 31, 2007 and 2006 included compensation expense for stock options, which includes grants made prior to, but not yet vested as of December 31, 2005, as well as stock options granted subsequent to December 31, 2005. The effect of applying SFAS 123(R) is outlined in the following table (in thousands, except per share amounts):
YEARS ENDED DECEMBER 31, 2007 2006
Income before income taxes $ (9,228) $ (17,628)Net income $ (5,574) $ (10,707)Net income per share: Basic $ (0.03) $ (0.06) Diluted $ (0.03) $ (0.06)
See Note K—Stock Plans for further information.
PROPERTY AND EQUIPMENT. Property and equipment are recorded at cost. Depreciation expense is computed using the straight-line method over the following useful lives:
Computer hardware 2 to 3 years Computer software 2 to 5 years Furniture and equipment 5 years Leasehold improvements Term of lease, 5 years maximum
INTERNAL-USE SOFTWARE. The Company capitalizes direct costs incurred in the development of internal-use software. Amounts capitalized are reported as a component of computer software within property and equipment. The Company capitalized approximately $13.3 million, $8.3 million and $4.5 million of internal-use software development costs for the years ended December 31, 2007, 2006 and 2005, respectively.
Note B — New Accounting Pronouncements In February 2007, the Financial Accounting Standards Board (“FASB”) issued SFAS No. 159, The Fair Value Option for Financial Assets and Financial Liabilities (“SFAS 159”), which gives entities the option to measure eligible financial assets, and financial liabilities at fair value on an instrument by instrument basis, that are otherwise not permitted to be accounted for at fair value under other accounting standards. The election to use the fair value option is avail-able when an entity first recognizes a financial asset or financial liability. Subsequent changes in fair value must be recorded in earnings. This statement is effective as of January 1, 2008. The Company does not expect the adoption of SFAS 159 to have a material impact on its Financial Statements.
In June 2007, the FASB ratified Emerging Issues Task Force (“EITF”) Issue No. 06-11, Accounting for Income Tax Benefits of Dividends on Share-Based Payment Awards (“EITF 06-11”). EITF 06-11 requires that tax benefits generated by dividends paid during the vesting period on certain equity-classified share-based compensation awards be classified as additional paid-in capital and included in a pool of excess tax benefits available to absorb tax deficiencies from share-based payment awards. EITF 06-11 is effective as of January 1, 2008. The Company does not expect the adoption of EITF 06-11 to have a material impact on its Financial Statements.
In December 2007, the FASB issued SFAS No. 141 (revised 2007), Business Combinations (“SFAS No. 141(R)”). SFAS No. 141(R) establishes principles and requirements for how an acquirer recognizes and measures in its finan-cial statements the identifiable assets acquired, the liabilities assumed, any noncontrolling interest in the acquiree, and the goodwill acquired. SFAS No. 141(R) also establishes disclosure requirements to enable the evaluation of the nature and financial effects of the business combination. SFAS No. 141(R) is effective for fiscal years beginning after December 15, 2008. The Company
NOTES TO CONSOLIDATED FINANCIAL STATEMENTS

2007 ANNUAL REPORT Robert Half International 37
is in the process of analyzing the impact of SFAS No. 141(R) on its Financial Statements.
In December 2007, the FASB issued SFAS No. 160, Noncontrolling Interests in Consolidated Financial Statements—an amendment of Accounting Research Bulletin No. 51 (“SFAS No. 160”). SFAS No. 160 establishes accounting and reporting standards for ownership interests in subsidiaries held by parties other than the parent, the amount of consolidated net income attributable to the parent and to the noncontrolling interest, changes in a parent’s ownership interest, and the valuation of retained, noncontrolling equity investments when a subsid-iary is deconsolidated. SFAS No. 160 also establishes disclosure requirements that clearly identify and distinguish between the interests of the parent and the interests of the noncontrolling owners. SFAS No. 160 is effective for fiscal years beginning after December 15, 2008. The Company is in the process of analyzing the impact of SFAS No. 160 on its Financial Statements.
Note C — Deferred Income Taxes and Other Current Assets Deferred income taxes and other current assets consisted of the following (in thousands):
DECEMBER 31, 2007 2006
Deferred income taxes $ 55,522 $ 55,066 Deposits in trusts for employee benefits and retirement plans 51,179 38,229 Other 49,768 39,757
$ 156,469 $ 133,052
Note D — Goodwill and Other Intangible Assets, NetThe following table sets forth the activity in goodwill and other intangible assets from December 31, 2005 through December 31, 2007 (in thousands):
OTHER INTANGIBLE GOODWILL ASSETS TOTAL
Balance as of December 31, 2005 $ 164,131 $ 1,726 $ 165,857 Purchase of intangible assets 12,232 1,738 13,970 Translation adjustments 762 15 777 Decrease in unamortized retirement costs — (1,088) (1,088) Amortization of intangible assets — (851) (851)
Balance as of December 31, 2006 177,125 1,540 178,665 Purchase of intangible assets 11,817 5,100 16,917 Translation adjustments 2,126 29 2,155 Amortization of intangible assets — (2,594) (2,594)
Balance as of December 31, 2007 $ 191,068 $ 4,075 $ 195,143
The estimated remaining amortization expense is $2.4 million for 2008, $1.3 million for 2009, and $0.4 million thereafter.
Note E — Property and Equipment, Net Property and equipment consisted of the following (in thousands):
DECEMBER 31, 2007 2006
Computer hardware $ 151,924 $ 131,591 Computer software 243,216 208,683 Furniture and equipment 129,103 118,536 Leasehold improvements 113,654 94,766 Other 16,089 15,955
Property and equipment, cost 653,986 569,531 Accumulated depreciation (501,675) (437,450 )
Property and equipment, net $ 152,311 $ 132,081
Note F — Accrued Payroll Costs and Retirement Obligations Accrued payroll costs and retirement obligations consisted of the following (in thousands):
DECEMBER 31, 2007 2006
Payroll and benefits $ 195,383 $ 173,307 Employee retirement obligations 64,049 59,129 Workers’ compensation 28,996 24,933 Payroll taxes 34,836 36,956
$ 323,264 $ 294,325
Included in employee retirement obligations is $57 million at December 31, 2007, and $53 million at December 31, 2006, related to the Company’s Chief Executive Officer for a deferred compensation plan and other benefits.
Note G — Notes Payable and Other Indebtedness The Company issued promissory notes as well as other forms of indebtedness in connection with certain acquisitions and other payment obligations. These are due in varying installments, carry varying interest rates and, in aggregate, amounted to $4.1 million at December 31, 2007 and $4.2 million at December 31, 2006. At December 31, 2007, $2.0 million of the notes were collateral-ized by a standby letter of credit. The following table shows the schedule of maturities for notes payable and other indebtedness at December 31, 2007 (in thousands): 2008 $ 370 2009 1,861 2010 113 2011 123 2012 111 Thereafter 1,545 $ 4,123 At December 31, 2007, the notes carried fixed rates and the weighted average interest rate for the above was approximately 6.5%, 6.9% and 8.7% for the years ended December 31, 2007, 2006 and 2005, respectively.
The Company has an uncommitted letter of credit facility (“the facility”) of up to $35.0 million, which is available to cover the issuance of debt support standby letters of credit. The Company had used $23.1 million in debt support standby letters of credit as of December 31, 2007, and $27.0 million, as of
NOTES TO CONSOLIDATED FINANCIAL STATEMENTS

38 Robert Half International 2007 ANNUAL REPORT
December 31, 2006. Of the debt support standby letters of credit outstanding, $21.0 million, as of December 31, 2007 and $24.8 million, as of December 31, 2006, satisfies workers’ compensation insurer’s collateral requirements. There is a service fee of 1.0% on the used portion of the facility. The facility is subject to certain financial covenants and expires on August 31, 2008.
Note H — Income Taxes The provision (benefit) for income taxes for the years ended December 31, 2007, 2006 and 2005 consisted of the following (in thousands):
YEARS ENDED DECEMBER 31, 2007 2006 2005
Current: Federal $ 144,520 $ 148,926 $ 128,497 State 31,448 32,329 27,746 Foreign 25,466 21,087 11,432 Deferred: Federal and state (6,599) (19,096) (13,380) Foreign (643) (222) 9
$ 194,192 $ 183,024 $ 154,304
Income before the provision for income taxes for the years ended December 31, 2007, 2006 and 2005 consisted of the following (in thousands):
YEARS ENDED DECEMBER 31, 2007 2006 2005
Domestic $ 439,015 $ 423,312 $ 359,709Foreign 51,389 42,890 32,465
$ 490,404 $ 466,202 $ 392,174
The income taxes shown above varied from the statutory federal income tax rates for these periods as follows:
YEARS ENDED DECEMBER 31, 2007 2006 2005
Federal U.S. income tax rate 35.0 % 35.0 % 35.0 %State income taxes, net of federal tax benefit 4.3 4.2 4.3Tax-free interest income (0.3) (0.5) (0.4)Non-deductible expenses 0.5 0.4 0.3 Non-U.S. income taxed at different rates, net of foreign tax credits 0.5 0.1 (0.4)Federal tax credits (0.3) — — Other, net (0.1) 0.1 0.5
Effective tax rate 39.6 % 39.3 % 39.3 %
The deferred portion of the tax provision consisted of the following (in thousands):
YEARS ENDED DECEMBER 31, 2007 2006 2005
Amortization of franchise rights $ 994 $ 972 $ 912 Amortization of other intangibles (214) 339 449Accrued expenses, deducted for tax when paid (8,544) (22,154) (10,239)Capitalized costs for books, deducted for tax 6,701 3,673 226 Depreciation (3,146) (4,980) (6,815)Federal benefit of state FIN 48 liability (3,242) — — Other, net 209 2,832 2,096
$ (7,242) $ (19,318) $ (13,371)
The deferred income tax amounts included on the Consolidated Statements of Financial Position are comprised of the following (in thousands):
DECEMBER 31, 2007 2006
Current deferred income tax assets, net $ 55,522 $ 55,066 Long-term deferred income tax assets, net 43,206 35,920
$ 98,728 $ 90,986
The components of the deferred income tax amounts at December 31, 2007 and 2006 were as follows (in thousands):
DECEMBER 31, 2007 2006
Deferred Income Tax Assets Provision for bad debts $ 7,191 $ 6,178 Employee retirement and other benefit obligations 48,219 45,170 Workers’ compensation 9,245 9,814 Deferred compensation 23,979 19,656 Credits and net operating loss carryforwards 23,892 22,300 Property and equipment basis differences 2,497 6,054 Other 15,773 11,866
Total deferred income tax assets 130,796 121,038
Deferred Income Tax Liabilities Amortization of intangible assets (14,935) (14,156) Other (4,434) (4,359)
Total deferred income tax liabilities (19,369) (18,515) Valuation allowance (12,699) (11,537)
Total deferred income tax assets, net $ 98,728 $ 90,986
The Company has net operating loss carryforwards in a number of states. The tax benefit of these net operating losses is $0.9 million. These state net operating losses expire in 2008 and later. The Company has net operating loss carryforwards in foreign countries. The tax benefit of these net operating losses is $12.7 million. These net operating losses expire in 2008 and later.
The Company has not provided deferred income taxes or foreign withholding taxes on $4.8 million and $7.0 million of undistributed earnings of its non-U.S. subsidiaries as of December 31, 2007 and 2006 respectively, since the Company intends to reinvest these earnings indefinitely. The U.S. tax impact upon repatriation, net of foreign tax credits, would be $0.4 million and zero for the years ended December 31, 2007 and 2006, respectively.
The Company adopted FASB Interpretation No. 48, Accounting for Uncertainty in Income Taxes (“FIN 48”) on January 1, 2007. FIN 48 prescribes a recognition threshold and measurement attribute criteria for the financial statement recog-nition and measurement of a tax position taken or expected to be taken in a tax return. The interpretation also provides guidance on derecognition, clas-sification, interest and penalties, accounting in interim periods, disclosure and transition. As a result of the adoption of FIN 48, the Company recognized a $1.7 million increase in the liability for unrecognized gross tax benefits, which was accounted for as a decrease to retained earnings on January 1, 2007.
NOTES TO CONSOLIDATED FINANCIAL STATEMENTS

The following table reconciles the total amounts of gross unrecognized tax benefits from January 1, 2007 to December 31, 2007 (in thousands):
Unrecognized tax benefits as of January 1, 2007 $ 8,088 Gross increases—tax positions in prior years 523 Gross decreases—tax positions in prior years (1,465) Gross increases—tax positions in current year 122 Settlements (1,450) Lapse of statute of limitations (35)
Unrecognized tax benefits as of December 31, 2007 $ 5,783
The total amount of unrecognized tax benefits that, if recognized, would affect the effective tax rate is $4.2 million.
The Company’s continuing practice is to recognize interest and penalties related to income tax matters in income tax expense. The total amount of interest and penalties accrued as of December 31, 2007 is $4.9 million, including $1.9 million that was accrued during the year.
The Company believes it is reasonably possible that the settlement of certain tax uncertainties could occur within the next twelve months; accordingly, $3.5 million of the unrecognized gross tax benefit has been classified as a current liability as of December 31, 2007. This amount primarily represents unrec-ognized tax benefits comprised of items related to assessed state income tax audits, as well as state and federal settlement negotiations currently in progress.
The Company’s major income tax jurisdictions are the United States and Canada. For U.S. federal income tax, the Company remains subject to exami-nation for 2002 and subsequent years. For major U.S. states, with few excep-tions, the Company remains subject to examination for 2000 and subsequent years. For Canada, the Company remains subject to examination for 2002 and subsequent years.
Note I — Commitments and Contingencies Rental expense, primarily for office premises, amounted to $95.8 million, $83.4 million and $75.6 million for the years ended December 31, 2007, 2006 and 2005, respectively. The approximate minimum rental commitments for 2008 and thereafter under non-cancelable leases in effect at December 31, 2007 were as follows (in thousands):
2008 $ 98,421 2009 89,910 2010 74,193 2011 46,541 2012 31,948 Thereafter 25,435
$ 366,448
Additionally, as of December 31, 2007, the Company had future purchase commitments of approximately $36 million over the next three years primarily related to telecom service agreements, software licenses and subscriptions, and computer hardware and software maintenance agreements.
On September 10, 2004, Plaintiff Mark Laffitte, on behalf of himself and a putative class of salaried Account Executives and Staffing Managers, filed a complaint in California Superior Court naming the Company and three of its wholly owned subsidiaries as Defendants. The complaint alleges that salaried Account Executives and Staffing Managers based in California have been misclassified under California law as exempt employees and seeks an unspecified amount for unpaid overtime pay alleged to be due to them had they been paid as non-exempt hourly employees. In addition, the Plaintiff seeks an unspecified amount for statutory penalties for alleged violations of
the California Labor Code arising from the alleged misclassification of these employees as exempt employees. On June 22, 2006, the Court heard cross-motions concerning class certification. On September 18, 2006, the Court issued an order certifying a class with respect to claims for alleged unpaid over-time pay but denied certification with respect to claims relating to meal periods and rest time breaks. At this stage of the litigation, it is not feasible to predict the outcome of or a range of loss, should a loss occur, from this proceeding, and accordingly, no amounts have been provided in the accompanying finan-cial statements. The Company believes it has meritorious defenses to the alle-gations, and the Company intends to continue to vigorously defend against the litigation.
On December 6, 2004, Plaintiffs Ian O’Donnell and David Jolicoeur, on behalf of themselves and a putative class of salaried Staffing Managers, Account Executives and Account Managers, filed a complaint in Massachusetts Superior Court naming the Company and one of its wholly owned subsid-iaries as Defendants. The complaint alleges that salaried Staffing Managers, Account Executives and Account Managers based in Massachusetts within the past two years have been misclassified under Massachusetts law as exempt employees and seeks an unspecified amount equal to three times their unpaid overtime compensation alleged to be due to them had they been paid as non-exempt, hourly employees, plus costs and legal fees. The complaint also makes similar allegations under the U.S. Fair Labor Standards Act on behalf of all Staffing Managers, Account Executives and Account Managers employed in any state other than Massachusetts and California within the past three years and seeks an unspecified amount for unpaid overtime pay alleged to be due to them had they been paid as non-exempt, hourly employees, plus an equal amount as liquidated damages. The case has been removed to the United States District Court for the District of Massachusetts. On March 30, 2006, the Court allowed Plaintiffs to amend their complaint to add claims that the Company failed to pay its exempt employees on a “salary basis” as required by Massachusetts and federal law, but denied Plaintiffs’ first motion seeking conditional certification of their federal claims as a collective action on behalf of a group of Staffing Managers, Account Executives and Account Managers. The Plaintiffs later filed a second motion for conditional certification, which the Court denied on May 10, 2007. On January 9, 2008, the Court denied two other motions brought by the Plaintiffs, for reconsideration of the Court’s denial of conditional certification and for certification of that question to the First Circuit Court of Appeals. In the same January 9, 2008 decision, the Court also denied cross-motions for summary judgment on Plaintiffs’ salary basis claims. Finally, the Court reserved judgment regarding Plaintiffs’ motion for certification of a class based on state law claims, subject to further briefing by the parties. At this stage of the litigation, it is not feasible to predict its outcome or a range of loss, should a loss occur. Accordingly, no amounts have been provided in the accompanying financial statements. The Company believes it has meritorious defenses to the allegations, and the Company intends to continue to vigorously defend against the litigation.
On August 9, 2005, Plaintiff Lizette Greene, on behalf of herself and a puta-tive class of salaried “inside sales persons,” filed a complaint in United States District Court for the Northern District of California naming the Company and three of its wholly owned subsidiaries as Defendants. On December 1, 2005, the Plaintiff amended the Complaint. The Amended Complaint alleges that purported “inside sales persons” based in California have been misclassified under federal law as exempt employees and seeks an unspecified amount for unpaid overtime pay alleged to be due to them had they been paid as non-exempt, hourly employees. In addition, the Plaintiff also makes two claims under the California Private Attorney Generals Act seeking an unspeci-fied amount for statutory penalties for alleged violations of the California Labor Code arising from the alleged misclassification of these employees as exempt employees. Plaintiff also makes a claim under California Business and Professions Code § 17200 for a putative nation wide class of purported “inside sales persons.” On December 22, 2006, the Plaintiff filed a motion for conditional certification of their federal claims in which they seek to represent
2007 ANNUAL REPORT Robert Half International 39
Notes to CoNsolidated FiNaNCial statemeNts
40 Robert Half International 2007 ANNUAL REPORT
NOTES TO CONSOLIDATED FINANCIAL STATEMENTS
a class of salaried employees who worked for the Company and certain of its subsidiaries in California within three years before the complaint was filed and seeking permission to mail class members a notice regarding their right to opt into the case as plaintiffs. On June 7, 2007, the Court stayed this litiga-tion pending resolution of the Laffitte action described in the first paragraph of this Note I. At this stage of the litigation, it is not feasible to predict the outcome of or a range of loss, should a loss occur, from this proceeding, and accordingly, no amounts have been provided in the accompanying financial statements. The Company believes it has meritorious defenses to the allegations, and the Company intends to continue to vigorously defend against the litigation.
On May 4, 2006, Plaintiff Don Tran, on behalf of himself and a putative class of salaried consultants, and a sub-class of terminated salaried consultants, filed a complaint in California Superior Court naming Protiviti Inc., a wholly owned subsidiary of the Company (“Protiviti”), as Defendant. The complaint alleges that salaried consultants based in California have been misclassified under California law as exempt employees and seeks an unspecified amount for unpaid overtime pay alleged to be due to them had they been paid as non-exempt, hourly employees. Plaintiff also seeks an unspecified amount for statu-tory penalties for alleged violations of the California Labor Code arising from the alleged misclassification of these employees as exempt employees. Thecomplaint further seeks damages and penalties for the failure to provide meal and rest periods, and for the failure to reimburse business expenses, including, without limitation, parking and cellular telephone expenses. At this stage of the litigation, it is not feasible to predict the outcome of or a range of loss, should a loss occur, from this proceeding, and accordingly, no amounts have been provided in the accompanying financial statements. Protiviti believes it has meritorious defenses to the allegations, and Protiviti intends to continue to vigorously defend against the litigation.
On September 24, 2007, Plaintiff Van Williamson, on behalf of himself and a putative class of salaried Account Executives and Staffing Managers, filed a complaint in California Superior Court naming the Company and three of its wholly owned subsidiaries as Defendants. The complaint alleges that salaried Account Executives and Staffing Managers based in California were not provided meal periods, paid rest periods, and accurate itemized wage state-ments. It seeks one hour of wages for each employee for each meal and rest period missed during the statutory liability period. It also seeks an unspecified amount for statutory penalties for alleged violations of the California LaborCode arising from the alleged failure to provide the meal and rest periods and accurate itemized wage statements. The allegations in the complaint are substantially similar to the allegations included in the complaint filed by Mark Laffitte against the Company and three of its wholly owned subsidiaries on September 10, 2004, and described above. At this stage of the litigation, it is not feasible to predict the outcome of or a range of loss, should a loss occur, from this proceeding, and accordingly, no amounts have been provided in the accompanying financial statements. The Company believes it has meritorious defenses to the allegations, and the Company intends to vigorously defend against the litigation.
The Company is involved in a number of other lawsuits arising in the ordi-nary course of business. While management does not expect any of these other matters to have a material adverse effect on the Company’s results of operations, financial position or cash flows, litigation is subject to certain inherent uncertainties.
Legal costs associated with the resolution of claims, lawsuits and other contin-gencies are expensed as incurred.
Note J — Stockholders’ Equity STOCK REPURCHASE PROGRAM. As of December 31, 2007, the Company is authorized to repurchase, from time to time, up to 9.2 million additional shares of the Company’s common stock on the open market or in privately negotiated transactions, depending on market conditions. During the years
ended December 31, 2007, 2006 and 2005, the Company repurchased approximately 12.2 million shares, 7.9 million shares and 7.6 million shares of common stock on the open market for a total cost of $397 million, $273 million and $222 million, respectively. Additional stock repurchases were made in connection with employee stock plans, whereby Company shares were tendered by employees for the payment of exercise price and applicable statu-tory withholding taxes. During the years ended December 31, 2007, 2006 and 2005, such repurchases totaled approximately 1.6 million shares, 3.3 million shares and 1.6 million shares at a cost of $58 million, $127 million and $53 million, respectively. Repurchases of securities have been funded with cash generated from operations.
Repurchases of shares are applied first to the extent of retained earnings and any remaining amounts are applied to capital surplus. As a result, the Company had no retained earnings as of December 31, 2007.
The repurchased shares are held in treasury and are presented as if construc-tively retired. Treasury stock is accounted for using the cost method. Treasury stock activity for each of the three years ended December 31, 2007 (consisting of stock option exercises and the purchase of shares for the treasury) is presented in the Consolidated Statements of Stockholders’ Equity.
Note K — Stock PlansUnder various stock plans, officers, employees, and outside directors have received or may receive grants of restricted stock, stock units, stock apprecia-tion rights or options to purchase common stock. Grants have been made at the discretion of the Committees of the Board of Directors. Grants generally vest over four years. Shares offered under the plan are authorized but unissued shares or treasury shares.
Options currently outstanding under the plans have an exercise price equal to the fair market value of the Company’s common stock at the date of grant and consist of non-statutory stock options under the Internal Revenue Code, and generally have a term of 10 years.
Recipients of restricted stock do not pay any cash consideration to the Company for the shares, have the right to vote all shares subject to such grant, and receive all dividends with respect to such shares, whether or not the shares have vested. Recipients of stock units do not pay any cash consideration for the units, do not have the right to vote, and do not receive dividends with respect to such units. Compensation expense for restricted stock and stock units is generally recognized on a straight-line basis over the vesting period, based on the stock’s fair market value on the grant date.
Effective January 1, 2006, the Company adopted the fair value recognition provisions of SFAS 123(R) using the modified prospective transition method; accordingly, prior periods have not been restated. Stock-based compensation expense recognized in the Company’s Financial Statements for the years ended December 31, 2007 and 2006 included compensation expense for stock options, which includes grants made prior to, but not yet vested as of December 31, 2005, as well as stock options granted subsequent to December 31, 2005.
SFAS 123(R) requires that excess tax benefits be recognized as an addition to capital surplus and that unrealized tax benefits be recognized as income tax expense unless there are excess tax benefits from previous equity awards to which it can be offset. The Company calculates the amount of eligible excess tax benefits that are available to offset future tax shortfalls in accordance with the long-form method described in paragraph 81 of SFAS 123(R).
Under both SFAS 123 and SFAS 123(R), the Company determines the fair value of stock options using the Black-Scholes valuation model. Under SFAS 123, the Company estimated forfeitures. SFAS 123(R) requires the Company to recognize expense over the service period for options that are expected to vest and record adjustments to compensation expense at the end of the service period if actual forfeitures differ from original estimates.

No stock options were granted during the year ended December 31, 2007. During the year ended December 31, 2006, the Company granted stock options on 0.2 million shares. The assumptions utilized in the Black-Scholes valuation model for these stock options included expected dividend yield of .99%, expected volatility of 38.5%, risk-free interest rate of 4.9% and an expected life of 4.7 years.
For purposes of calculating stock-based compensation expense for retirement-eligible employees, the service period is assumed to be met on the grant date or retirement-eligible date, whichever is later.
SFAS 123(R) requires the Company to recognize compensation expense for only the portion of restricted stock and stock units that is expected to vest, rather than record forfeitures when they occur, as previously permitted. If the actual number of forfeitures differs from those estimated by management, additional adjustments to compensation expense may be required in future periods.
SFAS 123(R) requires the cumulative effect of recognizing compensation expense to be recorded using estimated forfeitures rather than recording actual forfeitures as they occur. Upon adoption, the Company reviewed the cumula-tive effect of this change in accounting policy and determined it was not neces-sary to record a cumulative adjustment as the impact was immaterial.
Prior to January 1, 2006, the measurement date for employee performance-based grants was the date the performance criteria was met. As a result of adoption of SFAS 123(R), the Company no longer has employee stock awards subject to variable accounting treatment. Accordingly, compensation cost for all employee restricted stock and stock units is based on the fair market value of the Company’s stock on the date of grant and is recognized over the service period.
SFAS 123(R) no longer requires the recognition of deferred compensation upon grant of restricted stock. On January 1, 2006, deferred compensation related to awards issued prior to the adoption of SFAS 123(R) was reduced to zero with a corresponding decrease to capital surplus. In addition, SFAS 123(R) requires the Company to reflect the tax savings resulting from tax deductions in excess of expense reflected in its Financial Statements as a financing cash flow, which will impact the Company’s future reported cash flows from operating activities.
Stock-based compensation expense related to stock options recognized under SFAS 123(R) for the years ended December 31, 2007 and 2006 was $9.2 million and $17.6 million, respectively. As of December 31, 2007 and 2006, total unrecognized compensation cost, net of estimated forfeitures, was $4.7 million and $13.1 million, respectively, related to stock options and $100.6 million and $78.9 million, respectively, related to restricted stock and stock units. The unrecognized compensation cost is expected to be recognized over the next 4 years. There was no stock-based compensation expense related to stock options recognized during the year ended December 31, 2005.
The following table reflects activity under all stock plans from December 31, 2004 through December 31, 2007, and the weighted average exercise prices (in thousands, except per share amounts):
RESTRICTED STOCK PLANS STOCK OPTION PLANS
Weighted Weighted Number of Average Average Shares/ Grant Date Number of Exercise Price Units Fair Value Shares Per Share
Outstanding, December 31, 2004 3,444 $ 22.62 26,678 $ 17.67 Granted 1,490 $ 30.46 489 $ 30.55 Exercised — — (5,508) $ 13.98 Restrictions lapsed (1,030) $ 19.92 — — Forfeited (56) $ 26.03 (686) $ 23.04
Outstanding, December 31, 2005 3,848 $ 26.32 20,973 $ 18.77 Granted 1,953 $ 35.69 207 $ 32.36 Exercised — — (6,706) $ 15.71 Restrictions lapsed (1,152) $ 23.57 — — Forfeited (120) $ 31.78 (281) $ 25.04
Outstanding, December 31, 2006 4,529 $ 30.92 14,193 $ 20.29 Granted 1,688 $ 37.50 — — Exercised — — (2,748) $ 19.06 Restrictions lapsed (1,659) $ 29.36 — — Forfeited (180) $ 34.89 (169) $ 26.10
Outstanding, December 31, 2007 4,378 $ 33.88 11,276 $ 20.51
The total pre-tax intrinsic value of stock options exercised during the years ended December 31, 2007, 2006 and 2005 was $45.3 million, $150.9 million and $108.6 million, respectively. The total fair value of shares vested during the years ended December 31, 2007, 2006 and 2005 was $60.9 million, $42.8 million and $28.7 million, respectively.
The following table summarizes information about options outstanding as of December 31, 2007 (in thousands, except number of years and per share amounts):
OPTIONS OUTSTANDING OPTIONS EXERCISABLE
$ 10.41 to $ 14.28 2,360 1.99 $ 13.77 2,360 1.99 $ 13.77$ 14.37 to $ 16.95 2,035 4.91 $ 16.60 2,036 4.91 $ 16.60 $ 17.06 to $ 21.71 1,880 3.88 $ 20.47 1,880 3.88 $ 20.47 $ 22.24 to $ 22.85 2,097 3.64 $ 22.61 2,097 3.64 $ 22.61 $ 22.97 to $ 27.36 1,930 5.25 $ 25.87 1,636 4.96 $ 25.83 $ 27.42 to $ 34.75 974 5.98 $ 29.89 638 5.17 $ 29.43
11,276 4.04 $ 20.51 $ 73,634 10,647 3.85 $ 20.03 $ 74,637
The aggregate intrinsic value in the preceding table represents the total pre-tax intrinsic value, based on the Company’s closing stock price of $27.04 as of December 31, 2007, which would have been received by the option holders had all option holders exercised their options as of that date.
At December 31, 2007, the total number of available shares to grant under the plans (consisting of either restricted stock, stock units, stock appreciation rights or options to purchase common stock) was approximately 4.9 million. Of the 11.3 million options outstanding at December 31, 2007, 10.6 million options were exercisable with a weighted average exercise price of $20.03, and 0.7 million options were not exercisable with a weighted average exercise price of $28.61.
2007 ANNUAL REPORT Robert Half International 41
Range ofExercise Prices
Number Outstanding as of
December 31, 2007
Weighted Average
RemainingContractual Life
Weighted Average Exercise
Price
Number Exercisable as of
December 31, 2007
AggregateIntrinsic
Value
Weighted Average
RemainingContractual Life
Weighted Average Exercise
Price
AggregateIntrinsic
Value
NOTES TO CONSOLIDATED FINANCIAL STATEMENTS
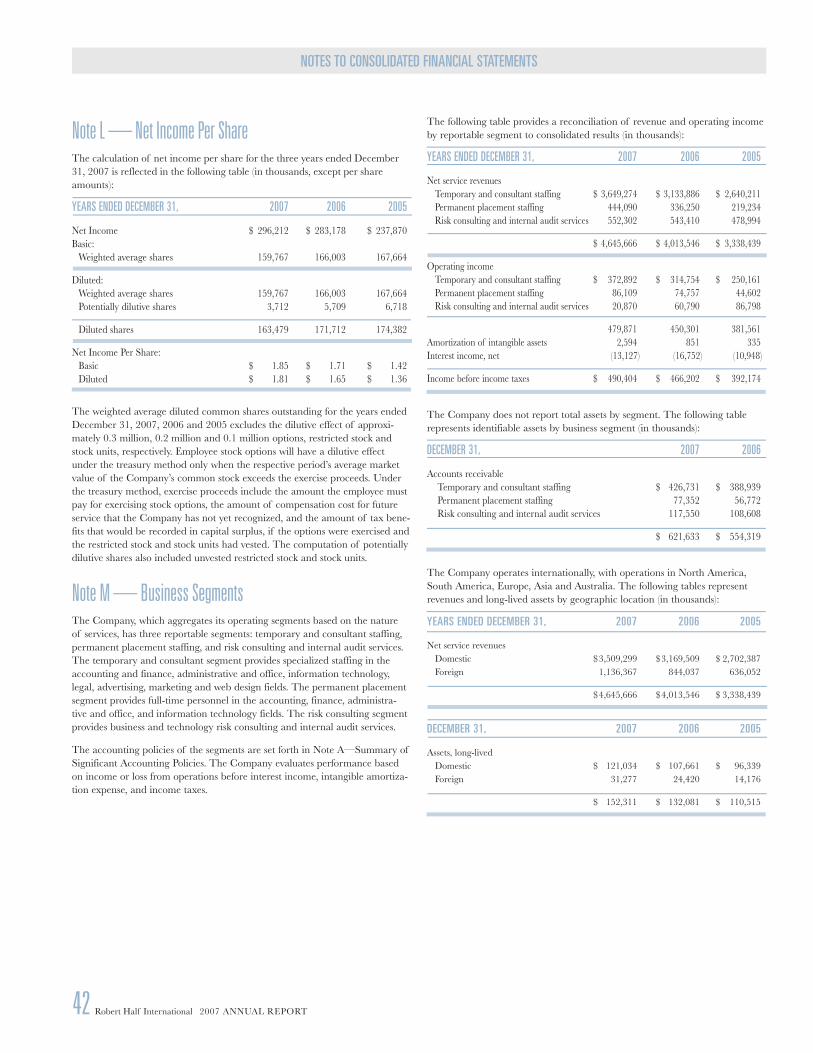
42 Robert Half International 2007 ANNUAL REPORT
NOTES TO CONSOLIDATED FINANCIAL STATEMENTS
Note L — Net Income Per ShareThe calculation of net income per share for the three years ended December 31, 2007 is reflected in the following table (in thousands, except per share amounts):
YEARS ENDED DECEMBER 31, 2007 2006 2005
Net Income $ 296,212 $ 283,178 $ 237,870Basic:
Weighted average shares 159,767 166,003 167,664
Diluted:Weighted average shares 159,767 166,003 167,664
Potentially dilutive shares 3,712 5,709 6,718
Diluted shares 163,479 171,712 174,382
Net Income Per Share:Basic $ 1.85 $ 1.71 $ 1.42Diluted $ 1.81 $ 1.65 $ 1.36
The weighted average diluted common shares outstanding for the years ended December 31, 2007, 2006 and 2005 excludes the dilutive effect of approxi-mately 0.3 million, 0.2 million and 0.1 million options, restricted stock and stock units, respectively. Employee stock options will have a dilutive effect under the treasury method only when the respective period’s average market value of the Company’s common stock exceeds the exercise proceeds. Underthe treasury method, exercise proceeds include the amount the employee must pay for exercising stock options, the amount of compensation cost for future service that the Company has not yet recognized, and the amount of tax bene-fits that would be recorded in capital surplus, if the options were exercised and the restricted stock and stock units had vested. The computation of potentially dilutive shares also included unvested restricted stock and stock units.
Note M — Business SegmentsThe Company, which aggregates its operating segments based on the nature of services, has three reportable segments: temporary and consultant staffing, permanent placement staffing, and risk consulting and internal audit services. The temporary and consultant segment provides specialized staffing in the accounting and finance, administrative and office, information technology, legal, advertising, marketing and web design fields. The permanent placement segment provides full-time personnel in the accounting, finance, administra-tive and office, and information technology fields. The risk consulting segment provides business and technology risk consulting and internal audit services.
The accounting policies of the segments are set forth in Note A—Summary of Significant Accounting Policies. The Company evaluates performance based on income or loss from operations before interest income, intangible amortiza-tion expense, and income taxes.
The following table provides a reconciliation of revenue and operating income by reportable segment to consolidated results (in thousands):
YEARS ENDED DECEMBER 31, 2007 2006 2005
Net service revenues Temporary and consultant staffing $ 3,649,274 $ 3,133,886 $ 2,640,211 Permanent placement staffing 444,090 336,250 219,234
Risk consulting and internal audit services 552,302 543,410 478,994
$ 4,645,666 $ 4,013,546 $ 3,338,439
Operating income Temporary and consultant staffing $ 372,892 $ 314,754 $ 250,161 Permanent placement staffing 86,109 74,757 44,602
Risk consulting and internal audit services 20,870 60,790 86,798
479,871 450,301 381,561Amortization of intangible assets 2,594 851 335Interest income, net (13,127) (16,752) (10,948)
Income before income taxes $ 490,404 $ 466,202 $ 392,174
The Company does not report total assets by segment. The following table represents identifiable assets by business segment (in thousands):
DECEMBER 31, 2007 2006
Accounts receivable Temporary and consultant staffing $ 426,731 $ 388,939 Permanent placement staffing 77,352 56,772 Risk consulting and internal audit services 117,550 108,608
$ 621,633 $ 554,319
The Company operates internationally, with operations in North America, South America, Europe, Asia and Australia. The following tables represent revenues and long-lived assets by geographic location (in thousands):
YEARS ENDED DECEMBER 31, 2007 2006 2005
Net service revenuesDomestic $3,509,299 $3,169,509 $ 2,702,387Foreign 1,136,367 844,037 636,052
$4,645,666 $4,013,546 $ 3,338,439
DECEMBER 31, 2007 2006 2005
Assets, long-livedDomestic $ 121,034 $ 107,661 $ 96,339Foreign 31,277 24,420 14,176
$ 152,311 $ 132,081 $ 110,515

NOTE N — Quarterly Financial Data (Unaudited) The following tabulation shows certain quarterly financial data for 2007 and 2006 (in thousands, except per share amounts):
QUARTER 2007 1 2 3 4
Net service revenues $ 1,097,425 $ 1,149,128 $ 1,179,045 $ 1,220,068 $ 4,645,666Gross margin $ 460,729 $ 492,685 $ 500,793 $ 523,621 $ 1,977,828Income before income taxes $ 116,093 $ 120,304 $ 122,139 $ 131,868 $ 490,404Net income $ 70,707 $ 72,726 $ 73,963 $ 78,816 $ 296,212Basic net income per share $ .43 $ .45 $ .47 $ .51 $ 1.85Diluted net income per share $ .42 $ .44 $ .46 $ .50 $ 1.81
QUARTER 2006 1 2 3 4
Net service revenues $ 943,924 $ 981,825 $ 1,027,563 $ 1,060,234 $ 4,013,546Gross margin $ 393,204 $ 418,002 $ 431,997 $ 451,050 $ 1,694,253 Income before income taxes $ 109,073 $ 113,730 $ 119,908 $ 123,491 $ 466,202Net income $ 65,503 $ 68,655 $ 73,647 $ 75,373 $ 283,178 Basic net income per share $ .39 $ .41 $ .45 $ .46 $ 1.71 Diluted net income per share $ .38 $ .39 $ .43 $ .45 $ 1.65
Note O — Subsequent EventOn February 13, 2008, the Company announced a quarterly dividend of $.11 per share to be paid to all shareholders of record on February 25, 2008. The dividend will be paid on March 14, 2008.
2007 ANNUAL REPORT Robert Half International 43
YEAR ENDEDDECEMBER 31,
YEAR ENDEDDECEMBER 31,
NOTES TO CONSOLIDATED FINANCIAL STATEMENTS
44 Robert Half International 2007 AnnuAl RepoRt
RepoRt of independent RegisteRed public accounting fiRm
to Board of Directors and Stockholders of Robert Half International Inc.:
In our opinion, the accompanying consolidated statements of financial position and the related consolidated statements of operations, stockholders’ equity and
cash flows present fairly, in all material respects, the financial position of Robert Half International Inc., and its subsidiaries at December 31, 2007 and 2006, and
the results of their operations and their cash flows for each of the three years in the period ended December 31, 2007 in conformity with accounting principles
generally accepted in the united States of America. Also in our opinion, the Company maintained, in all material respects, effective internal control over
financial reporting as of December 31, 2007, based on criteria established in Internal Control - Integrated Framework issued by the Committee of Sponsoring
Organizations of the Treadway Commission (COSO). The Company’s management is responsible for these financial statements, for maintaining effective internal
control over financial reporting and for its assessment of the effectiveness of internal control over financial reporting, included in the accompanying Management’s
Report on Internal Control over Financial Reporting. Our responsibility is to express opinions on these financial statements and on the Company’s internal control
over financial reporting based on our integrated audits. We conducted our audits in accordance with the standards of the Public Company Accounting Oversight
Board (United States). Those standards require that we plan and perform the audits to obtain reasonable assurance about whether the financial statements are
free of material misstatement and whether effective internal control over financial reporting was maintained in all material respects. Our audits of the financial
statements included examining, on a test basis, evidence supporting the amounts and disclosures in the financial statements, assessing the accounting principles
used and significant estimates made by management, and evaluating the overall financial statement presentation. Our audit of internal control over financial
reporting included obtaining an understanding of internal control over financial reporting, assessing the risk that a material weakness exists, and testing and
evaluating the design and operating effectiveness of internal control based on the assessed risk. Our audits also included performing such other procedures as we
considered necessary in the circumstances. We believe that our audits provide a reasonable basis for our opinions.
As discussed in Note A to the consolidated financial statements, the Company changed the manner in which it accounts for share-based compensation in 2006.
A company’s internal control over financial reporting is a process designed to provide reasonable assurance regarding the reliability of financial reporting and
the preparation of financial statements for external purposes in accordance with generally accepted accounting principles. A company’s internal control over
financial reporting includes those policies and procedures that (i) pertain to the maintenance of records that, in reasonable detail, accurately and fairly reflect the
transactions and dispositions of the assets of the company; (ii) provide reasonable assurance that transactions are recorded as necessary to permit preparation
of financial statements in accordance with generally accepted accounting principles, and that receipts and expenditures of the company are being made only in
accordance with authorizations of management and directors of the company; and (iii) provide reasonable assurance regarding prevention or timely detection of
unauthorized acquisition, use, or disposition of the company’s assets that could have a material effect on the financial statements.
Because of its inherent limitations, internal control over financial reporting may not prevent or detect misstatements. Also, projections of any evaluation of
effectiveness to future periods are subject to the risk that controls may become inadequate because of changes in conditions, or that the degree of compliance with
the policies or procedures may deteriorate.
San Francisco, California
February 19, 2008

Comparison of Cumulative Five-Year Total Return
12/31/2002 12/31/2003 12/31/2004 12/31/2005 12/31/2006 12/31/2007
$100
$150
$200
$250
Robert Half International Inc.
S&P 500 IndexPeer Group Index(a)
2007 AnnuAl RepoRt Robert Half International 45
notwithstanding anything to the contrary set forth in any of the Company’s previous or future filings under the Securities Act of 1933 or the Securities exchange Act of 1934 that might incorporate by reference this Annual Report or future filings with the Securities and exchange Commission, in whole or in part, the following performance Graph shall not be deemed to be incorporated by reference into any such filings.
the following graph compares, through December 31, 2007, the cumulative total return of the Company’s Common Stock, an index of certain publicly traded employment services companies and the S&p 500. the graph assumes the investment of $100 at the end of 2002 and reinvestment of all dividends. the information presented in the graph was obtained by the Company from outside sources it considers to be reliable but has not been independently veri-fied by the Company.
Management is responsible for establishing and maintaining adequate internal control over financial reporting (as defined in Rule 13a-15(f) under the Securities exchange Act of 1934, as amended). Management assessed the effectiveness of the Company’s internal control over financial reporting as of December 31, 2007, using criteria established in Internal Control-Integrated Framework issued by the Committee of Sponsoring organizations of the treadway Commission (CoSo) and concluded that the Company maintained effective internal control over financial reporting as of December 31, 2007.
Because of its inherent limitations, internal control over financial reporting may not prevent or detect misstatements. Also, projections of any evalua-tion of effectiveness to future periods are subject to the risk that controls may become inadequate because of changes in conditions, or that the degree of compliance with the policies and procedures may deteriorate.
the effectiveness of the Company’s internal control over financial reporting as of December 31, 2007 has been audited by pricewaterhouseCoopers llp, an independent registered public accounting firm, as stated in their report which is included herein.
MANAGEMENT’S REPORT ON INTERNAL CONTROL OVER FINANCIAL REPORTING
COMPARATIVE PERFORMANCE GRAPH
(a) this index represents the cumulative total return of the Company and the following corporations providing temporary or permanent employment services: CDI Corp.; Kelly Services, Inc.; Manpower Inc.; and Spherion Corp.

Board of DirectorsAndrew S. Berwick, Jr.
President and Chief Executive Officer of Berwick–Pacific Corporation, a real estate development company
Frederick P. FurthSenior Partner of The Furth Firm, a law firm
Edward W. GibbonsFounder and President of Gibbons & Co., Inc., a private merchant banking firm
Harold M. Messmer, Jr.Chairman of the Board and Chief Executive Officer of Robert Half International
Thomas J. RyanChairman of the Board and Chief Executive Officer of ISU International, a franchisor of independent insurance agents
J. Stephen SchaubPresident of J. S. Schaub & Co., Inc., a firm engaged in investments and financial consulting
M. Keith WaddellVice Chairman of the Board, President and Chief Financial Officer of Robert Half International
Corporate Headquarters2884 Sand Hill RoadMenlo Park, California 94025(650) 234-6000
Registrar and Stock Transfer Agent
BNY Mellon Shareholder Services480 Washington BoulevardJersey City, New Jersey 07310(800) 676-0894(800) 231-5469 (TDD)(201) 680-6578 (Foreign Shareholders)(201) 680-6610 (TDD Foreign Shareholders)www.melloninvestor.com/isd
ManagementEXECUTIVE OFFICERSHarold M. Messmer, Jr.
Chairman of the Board and Chief Executive Officer
M. Keith WaddellVice Chairman of the Board, President and Chief Financial Officer
Paul F. GentzkowPresident and Chief Operating Officer – Staffing Services
Robert W. GlassExecutive Vice President, Corporate Development
Michael BuckleyExecutive Vice President, Chief Administrative Officer and Treasurer
Steven KarelSenior Vice President, Secretary and General Counsel
OFFICERS Reesa M. Staten
Senior Vice President, Corporate Communications
Paula StreitSenior Vice President, Operational Finance and Accounting
Elena WestSenior Vice President, Marketing
Evelyn Crane-OliverVice President and Associate General Counsel
46 Robert Half International 2007 ANNUAL REPORT
FORM 10-KThe Company’s Form 10-K Annual Report to the Securities and Exchange Commission may be obtained free of charge online at www.rhi.com or upon written request to: Secretary Robert Half International 2884 Sand Hill Road Menlo Park, California 94025
MARKET FOR REGISTRANT’S COMMON EQUITY AND RELATED STOCKHOLDER MATTERSThe Company’s Common Stock is listed for trading on the New York Stock Exchange under the symbol “RHI”. On January 31, 2008, there were 5,097 holders of record of the Common Stock. Following is a list by fiscal quarter of the sales prices of the stock:
2007 HIGH LOW
4th Quarter $32.95 $24.413rd Quarter $38.24 $28.592nd Quarter $38.01 $32.781st Quarter $42.21 $35.91 2006 HIGH LOW
4th Quarter $39.50 $33.183rd Quarter $41.90 $29.912nd Quarter $43.94 $37.441st Quarter $39.81 $35.20
Cash dividends of $0.10 per share were declared and paid in each quarter of 2007. Cash dividends of $0.08 per share were declared and paid in each quarter of 2006.
NEW YORK STOCK EXCHANGE AND OTHER FILINGSThe Company submitted the Chief Executive Officer certification required by Section 303A.12(a) of the New York Stock Exchange corporate gover-nance rules, as required, within 30 days following its 2007 Annual Meeting of Stockholders. In addi-tion, the Company’s Chief Executive Officer and Chief Financial Offi cer have each fi led the certifi -cation required by Section 302 of the Sarbanes-Oxley Act as an exhibit to the Company’s Annual Report on Form 10-K for the year ended Decem-ber 31, 2007.
Robert Half International is an equal opportunity employer.
Cover 120# Utopia 1X Gloss Cover Pages 1 to 26 are printed on 100# Utopia 1X Gloss Book Balance of book is printed on 70# Finch Smooth Book
CORPORATE DIRECTORY