Embed Size (px)
Citation preview

4th August 2017
2017 Half-Yearly ResultsPresentation

2017 Half-Yearly Results 2
1. 2017 Half-Yearly Highlights
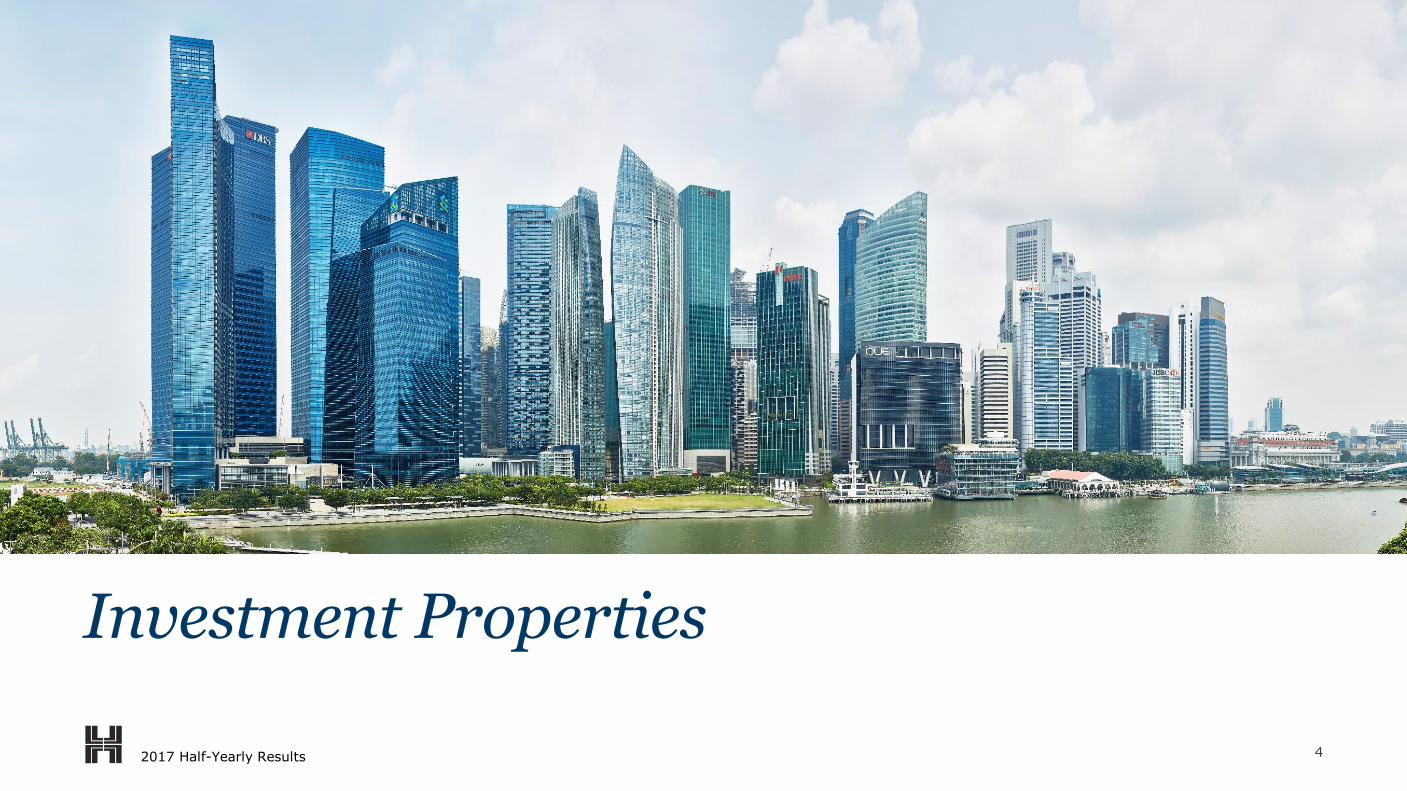
2. Investment Properties
3. Development Properties
4. Financial Highlights
5. Outlook
6. Q&A
Speakers: Robert Wong, Chief Executive & Simon Dixon, Chief Financial Officer
Agenda

2017 Half-Yearly Results 3
Key figures
Profit1: US$3,125m (1H 2016: US$1,263m)
Net debt: US$1.9bn (Dec 2016: US$2.0bn)
NAV per share: US$14.54 (Dec 2016: US$13.30)
Interim dividend per share: US¢6 (1H 2016: US¢6)
Highlights
Underlying 1H profit1 up 32% YoY and 14% HoH
Positive performance from investment properties
Higher sales completions of development properties in
mainland China and Singapore
New property developments in Singapore, Nanjing and
Wuhan
2017 Half-Yearly Highlights
US$517mUnderlying profit
US$34bnShareholders’ funds
393455
517
1H 2016 2H 2016 1H 2017
3031
34
Jun 2016 Dec 2016 Jun 2017
+32% YoY +9% HoH
1 Attributable to Shareholders of the Company
42017 Half-Yearly Results
Investment Properties

2017 Half-Yearly Results 5
Investment Properties Overview
Investment properties are primarily located in Hong Kong and Singapore
8,618*
Total
TOTAL COMPLETED AREA (HKL’s share)
6,810
1,202
606
Office
Retail
Hotel
(000’s sq. ft NFA)
446TOTAL
OTHERS
1,781Total
88TOTAL
HONG KONG
4,139
590
143
MACAU98
151
HANOI75
8
BANGKOK27
61
SINGAPORE1,652
129
70
161
215
249TOTAL
4,872TOTAL
83TOTAL
JAKARTA663
66
729TOTAL
PHNOM PENH184
89
97
370TOTAL
*Equivalent to 800,000 sq. m.

2017 Half-Yearly Results 6
Accounting
1H 2016 2H 2016 1H 2017
Average net rent(HK$ psf/month)
103 103 106
Period-end vacancy 3.1% 2.2% 1.5%
Weighted average lease expiry (years)
4.0 3.8 4.0
2H 2017 2018 2019
Total lettable office area subject to expiration/rent revisions(’000 sq. ft)
328 1,255 1,037
% of area subject to expiration/rent revisions
8% 30% 25%
- Expiration 5% 17% 19%
- Rent revisions 3% 13% 6%
Average expiring net rent(HK$ psf/month)
94.3 103.0 116.3
AVERAGE RENTS & VACANCY
EXPIRATION AND INTERIM RENT REVISIONS
Positive rental reversions and lower vacancy as market supply remained tight
Hong Kong Portfolio – Office
40%
30%
7%
6%
2%
1%
14%
OFFICE TENANT PROFILE
Trading
Banks and Other Financial Services
Legal
Government Others
Property

2017 Half-Yearly Results 7
1H 2016 2H 2016 1H 2017
Average net rent(HK$ psf/month)
216 220 224
Period-end vacancy 0% 0% 0.6%
Weighted average lease expiry (years)
2.6 2.8 2.7
AVERAGE RENTS & VACANCY
Higher rents due to positive 2016 reversions
Hong Kong Portfolio – Retail
49%
31%
15%
5%
RETAIL TENANT PROFILE
Fashion & Accessories
Jewellery & Watches Others
Food & Beverages

2017 Half-Yearly Results 8
2H 2017 2018 2019
HKL’s Share: Total lettable office area subject to expiration/rent revisions (’000 sq. ft)
23 713 318
% of area subject to expiration/rent revisions
1% 43% 19%
- Expiration 1% 5% 12%
- Rent revisions - 38% 7%
Average expiring gross rent(S$ psf/month)
10.1 9.0 9.8
Low vacancy rate
Singapore Portfolio – Office
1H 2016 2H 2016 1H 2017
Average gross rent(S$ psf/month)
9.4 9.2 9.1
Period-end vacancy 1.0% 0.1% 0.2%
Weighted average lease expiry (years)
5.3 4.9 4.5
73%
7%
5%
5%
3%2%
5%
OFFICE TENANT PROFILE EXPIRATION AND INTERIM RENT REVISIONS
AVERAGE RENTS & VACANCY
Banks and Other Financial Services
Legal
Natural Resources
Accounting
IT Services & Consultancy
Property
Others

2017 Half-Yearly Results 9
Rest of Asia Portfolio
Beijing – WF CENTRAL (84%-owned)
Prestigious retail centre, which includes an exclusive luxury hotel (Mandarin Oriental)
43,000 sq. m. NFA
Open: Q4 2017 (hotel in 2018)
Pre-leasing commitments from a diverse range of tenants
Jakarta – Jakarta Land (50%-owned)
Existing portfolio features 135,000 sq. m. NFA
Average gross rent: US$26 psm per month (1H 2016: US$25 psm per month)
Occupancy: 92%
WTC 3: On schedule to complete in 2018
Phnom Penh – EXCHANGE SQUARE (100%-owned)
Completed in early 2017
Space in the 26,000 sq. m. mixed-use complex is being taken up by tenants
MAINLAND CHINA SOUTHEAST ASIA
Modest exposure outside Hong Kong and Singapore

2017 Half-Yearly Results 10
JV with IOI Properties (33%-owned)
Located within the Marina Bay Financial District of Singapore
Site area: 1.1 ha
Two office towers
1.26 million sq. ft (117,000 sq. m.) NFA office
30,000 sq. ft (2,800 sq. m.) NFA retail podium
Connected to HKL’s existing portfolio in the district
New Project in Singapore
SINGAPORE
Expanding our portfolio of prime investment properties in Singapore’s Marina Bay Financial District
© Urban Redevelopment Authority. All rights reserved.

112017 Half-Yearly Results
Development Properties

2017 Half-Yearly Results 12
Development Properties Overview
The development properties portfolio spans six countries and 11 cities, with a key focus on mainland China and Singapore
824 TOTAL
THE PHILIPPINES163
661
667TOTAL
INDONESIA31
636
285TOTAL
SINGAPORE-
285
6,752Total
TOTAL DEVELOPABLE AREA (HKL’s share)
2,061
4,691
Constructed
Under construction/ to be developed
(000’s sq. m. GFA)4,941TOTAL
MAINLAND CHINA
1,867
3,074
19TOTAL
THAILAND-
19
16TOTAL
VIETNAM-
16

2017 Half-Yearly Results 13
CHENGDU
CHONGQING WUHAN
NANJING
SHANGHAI
Mainland China Portfolio – Overview
Six projects
Total GFA 6.1 million sq. m.
(HKL’s share: 4.1 million sq. m.)
WE City
Total GFA 898,000 sq. m.
(HKL’s share: 449,000 sq. m.)
BEIJING
Maple Place (90%-owned)
Central Park (40%-owned)
Parkville
Total GFA 227,000 sq. m.
(HKL’s share: 113,000 sq. m.)
Conditionally acquired
New 50% JV
Total GFA 494,000 sq. m.
(HKL’s share: 247,000 sq. m.)
New 33% JV
Total GFA 217,000 sq. m.
(HKL’s share: 72,000 sq. m.)
IMAGE TO BE CONFIRMED
IMAGE TO BE CONFIRMED

2017 Half-Yearly Results 14
REVENUE RECOGNISED* CONTRACTED SALES* SOLD BUT UNRECOGNISED SALES*
Mainland China Portfolio
Increase in overall contracted sales and improved profit contribution as a result of positive market sentiment and further completions
-
100
200
300
400
500
600
1H 2016 2H 2016 1H 2017
-
100
200
300
400
500
600
700
800
1H 2016 2H 2016 1H 2017
US$m US$m
-
200
400
600
800
1,000
1,200
1,400
1,600
30 Jun 16 31 Dec 16 30 Jun 17
US$m
$350m$326m
$520m
$432m
$673m$701m
$885m
$1,083m
$1,421m
Chongqing Chengdu
Shanghai Beijing
Sales to be recognised next 6 months
Sales to be recognised after next 6 months
Chongqing Chengdu
Shanghai Beijing
* The above analysis includes share of Joint Ventures & Associates

2017 Half-Yearly Results 15
SOL ACRES
Singapore Portfolio – Overview
LAKEVILLE
699 units
674,000 sq. ft. GFA (63,000 sq. m.)
Completed in 2017
100% sold
LAKE GRANDE
710 units
537,000 sq. ft. GFA(50,000 sq. m.)
Completion: 2019
Pre-sold: 87%
MARGARET DRIVE
315 units
238,000 sq. ft. GFA(22,000 sq. m.)
Completion: 2020
IMAGE TO BE UPDATED
EUNOSVILLE
Conditionally acquired
1,399 units (estimated)
1.05 million sq. ft. GFA (98,000 sq. m.)
Completion: 2021
1,327 units
1.24 million sq. ft. GFA (115,000 sq. m.)
Completion: 2018
Pre-sold: 73%
IMAGE TO BE UPDATED

2017 Half-Yearly Results 16
REVENUE RECOGNISED CONTRACTED SALES SOLD BUT UNRECOGNISED SALES
Singapore Portfolio
An increase in revenue and profit contribution arising from the 1H completion of LakeVille
0
100
200
300
400
500
600
700
1H 2016 2H 2016 1H 2017
0
100
200
300
400
500
600
1H 2016 2H 2016 1H 2017
0
200
400
600
800
1,000
1,200
1,400
30 Jun 16 31 Dec 16 30 Jun 17
$158m
$529m
$268m
$1,394m
$1,294m
$997m
US$m US$m US$m
$6m
$555m
$615m
Hallmark Residence J Gateway
LakeVille
Hallmark Residence LakeVille
Sol Acres Lake Grande
Sales to be recognised next 6 months
Sales to be recognised after next 6 months

2017 Half-Yearly Results 17
Rest of Asia Portfolio
Nava Park (49%-owned)
Site area: 67 ha; GFA: 802,000 sq. m.
653 units launched for sales (67% pre-sold)
Anandamaya (40%-owned)
Site area: 1.3 ha; GFA: 116,000 sq. m.
509 units, 94% pre-sold
Completion: 2018
Asya (25%-owned)
Previously known as Jakarta Garden City
Site area: 67 ha; GFA: 907,000 sq. m.
East of central Jakarta
Multiple phases
Construction start: 2017
The Nassim (50%-owned)
Site area: 0.6 ha; GFA: 31,000 sq. m.
238 units, 97% pre-sold
Completion: 2018
Two Roxas Triangle (40%-owned)
Site area: 0.5 ha; GFA: 98,000 sq. m.
182 units, 99% pre-sold
Completion: 2018
Mandani Bay (40%-owned)
Site area: 20 ha; GFA: 1.2 million sq. m.
Phase 1: 1,226 units, 78% pre-sold
Completion: 2035
INDONESIA VIETNAM THE PHILIPPINES
Performance within expectations

182017 Half-Yearly Results
New Projects
WUHAN NANJING SINGAPORE
Wuhan Salon Phase 2 (50%-owned)
Conditionally acquired
JV with Zall Group
Mixed-use project
GFA: 494,000 sq. m.
Completion: 2021
Nanjing (33%-owned)
JV with CMSK and Country Garden
Mixed-use project
GFA: 217,000 sq. m.
Completion: 2021
Eunosville, MCL Land
Conditionally acquired
Residential project
GFA: 1.05 million sq. ft. (98,000 sq. m.)
1,399 units
Completion: 2021
Four new projects have been added to the portfolio
BANGKOK
The Esse at Sukhumvit 36 (49%-owned)
JV with Singha Estate
Residential project
GFA: 38,000 sq. m.
338 units
Completion: 2020

192017 Half-Yearly Results
Financial Highlights

2017 Half-Yearly Results 20
FY2016 (US$m) 1H 2017 1H 2016 %YoY
1,994 Revenue 1,297 783 66
(1,023) Net operating costs (787) (327) 141
971 Operating profit 510 456 12
117 Share of results of joint ventures 135 60 125
(69) Net financing charges (36) (33) 9
(168) Tax (91) (89) 2
(3) Non-controlling interests (1) (1) -
848 Underlying profit 517 393 32
2,498 Non-trading items 2,608 870 200
3,346 Profit attributable to shareholders 3,125 1,263 147
1H Revenue and underlying profit up year-on-year
Consolidated Profit and Loss Account
2017 Half-Yearly Results 21
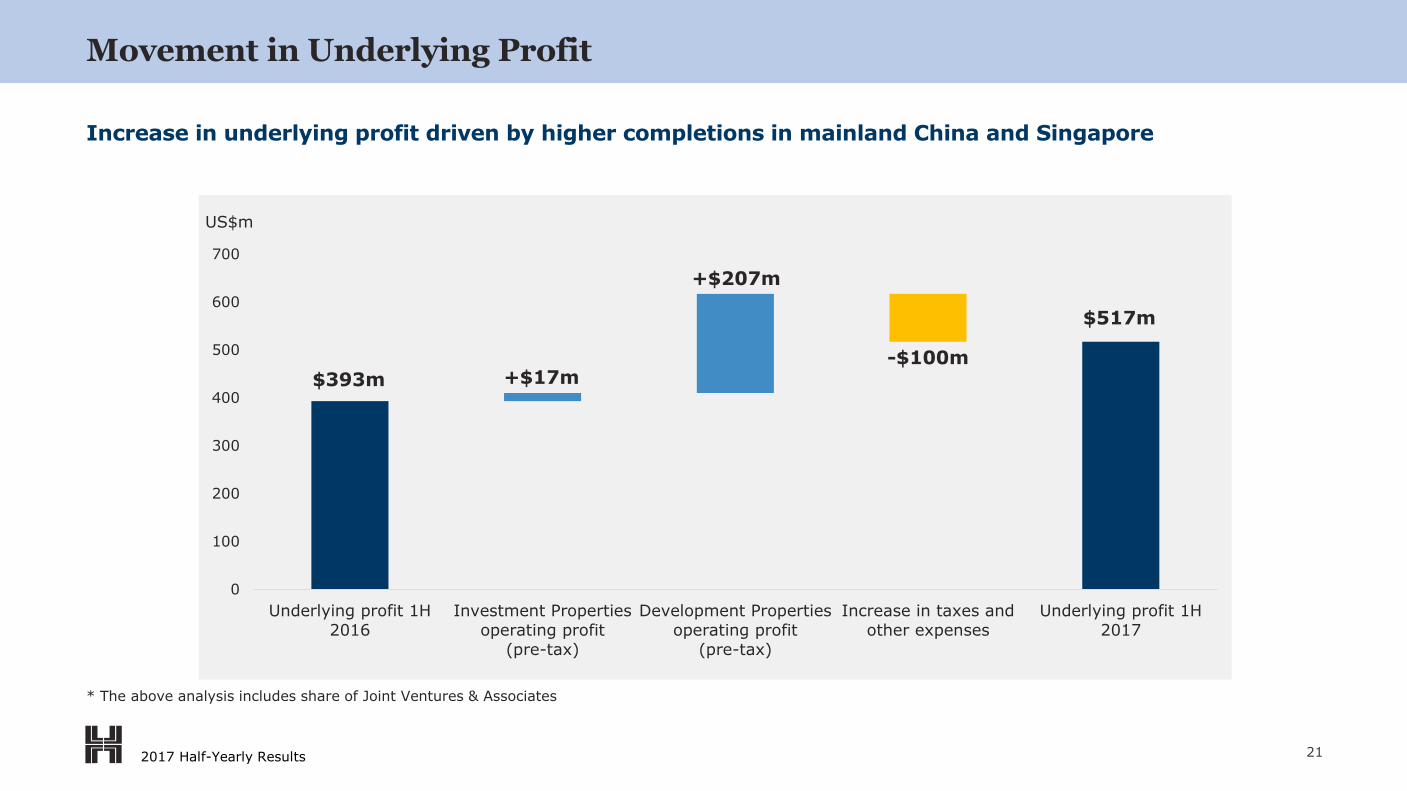
Movement in Underlying Profit
Increase in underlying profit driven by higher completions in mainland China and Singapore
US$m
$393m
$517m
+$17m
+$207m
-$100m
0
100
200
300
400
500
600
700
Underlying profit 1H
2016
Investment Properties
operating profit(pre-tax)
Development Properties
operating profit(pre-tax)
Increase in taxes and
other expenses
Underlying profit 1H
2017
* The above analysis includes share of Joint Ventures & Associates

2017 Half-Yearly Results 22
Operating Profit by Segment and Region
INVESTMENT PROPERTIES* DEVELOPMENT PROPERTIES*
Hong Kong and mainland China remain as the largest profit contributors
$404m
$6m
$62m
$15m
$487m
$430m
$5m
$59m
$10m
$504m
$0
$150
$300
$450
$600 1H 2016 1H 2017
US$m US$m
-$3m
$103m
$1m
-$2m
$99m
-$1m
$232m
$74m
$1m
$306m
-$100
$0
$100
$200
$300
$400
$500
$600 1H 2016 1H 2017
Hong Kong MainlandChina & Macau
Singapore Rest of Asia Total Hong Kong MainlandChina
Singapore Rest of Asia Total
* The above analysis includes share of Joint Ventures & Associates

2017 Half-Yearly Results 23
Consolidated Cash Flow
Strong operating cashflows
FY2016 (US$m) 1H 2017 1H 2016 %YoY
1,096 Operating activities 573 468 22%
(245) Investing activities (175) (81) 116%
(442) Financing activities (433) (372) 16%
409 Net cash inflow/(outflow) (35) 15 -333%
1,566Cash and cash equivalents atbeginning of the period
1,898 1,566 21%
(77) Effect of exchange rate changes 29 (22) -232%
1,898Cash and cash equivalents at end of the period
1,892 1,559 21%
(3,906)Gross debt (excluding bank overdrafts)
(3,774) (3,881) -3%
(2,008) Net debt at end of the period (1,882) (2,322) -19%

2017 Half-Yearly Results 24
-2,000
-1,000
0
1,000
2,000
3,000
4,000
5,000
0
5,000
10,000
15,000
20,000
25,000
30,000
35,000
40,000
30-Jun-16 31-Dec-16 1H 2017
Hong Kong Mainland China & Macau
Singapore Rest of Asia
Mainland China
Rest of Asia
Properties Carrying Values
INVESTMENT PROPERTIES - TOTAL VALUE* DEVELOPMENT PROPERTIES – NET INVESTMENT*
Cap rate compression and higher market rents in Hong Kong
30 Jun 2016
31 Dec 2016
30 Jun 2017
$30,390m$31,892m
$34,606m
US$m
30 Jun 2016
31 Dec 2016
30 Jun 2017
US$m
Pre-sale proceeds
Singapore
$3,067m
$2,416m$2,746m
* The above analysis includes share of Joint Ventures & Associates

2017 Half-Yearly Results 25
0
500
1,000
1,500
2,000
2,500
3,000
2017 2018 2019 2020 2021 2022+
Bank facilities (drawn & undrawn) Bonds*
Treasury Management
MATURITY PROFILE OF COMMITTED FACILITIES / BONDS (AS AT 30 JUN 17)
Financial position and liquidity remain strong
US$m
$574m
$1,095m
$665m
$302m
$790m
$2,841m
* Issued under MTN Programme which are at face value
31 DEC 2016 30 JUN 2017
Net debt (US$m) 2,008 1,882
Net gearing 6% 5%
Average tenor of debt (years)
6.4 6.1
Average interest cost
3.4% 3.6%
Credit ratings
- S&P A A
- Moody’s A3 A3

262017 Half-Yearly Results
Outlook

2017 Half-Yearly Results 27
Outlook
Investment properties are expected to continue to generate stable returns
Opening of WF Central in Beijing in 2H 2017
Continue to look for attractive opportunities to construct prime investment properties in key gateway cities in Asia
Strong mainland China contribution expected to continue
No further sales completions expected in Singapore until 2018
The Group remains active in seeking development opportunities in mainland China and Southeast Asia
Net gearing expected to increase due to recent investments
Balance sheet remains strong, with capacity to further invest in new projects
Maintain disciplined approach to assessing future opportunities
INVESTMENT PROPERTIES DEVELOPMENT PROPERTIES FINANCIAL
Solid full year performance expected

282017 Half-Yearly Results
Appendix
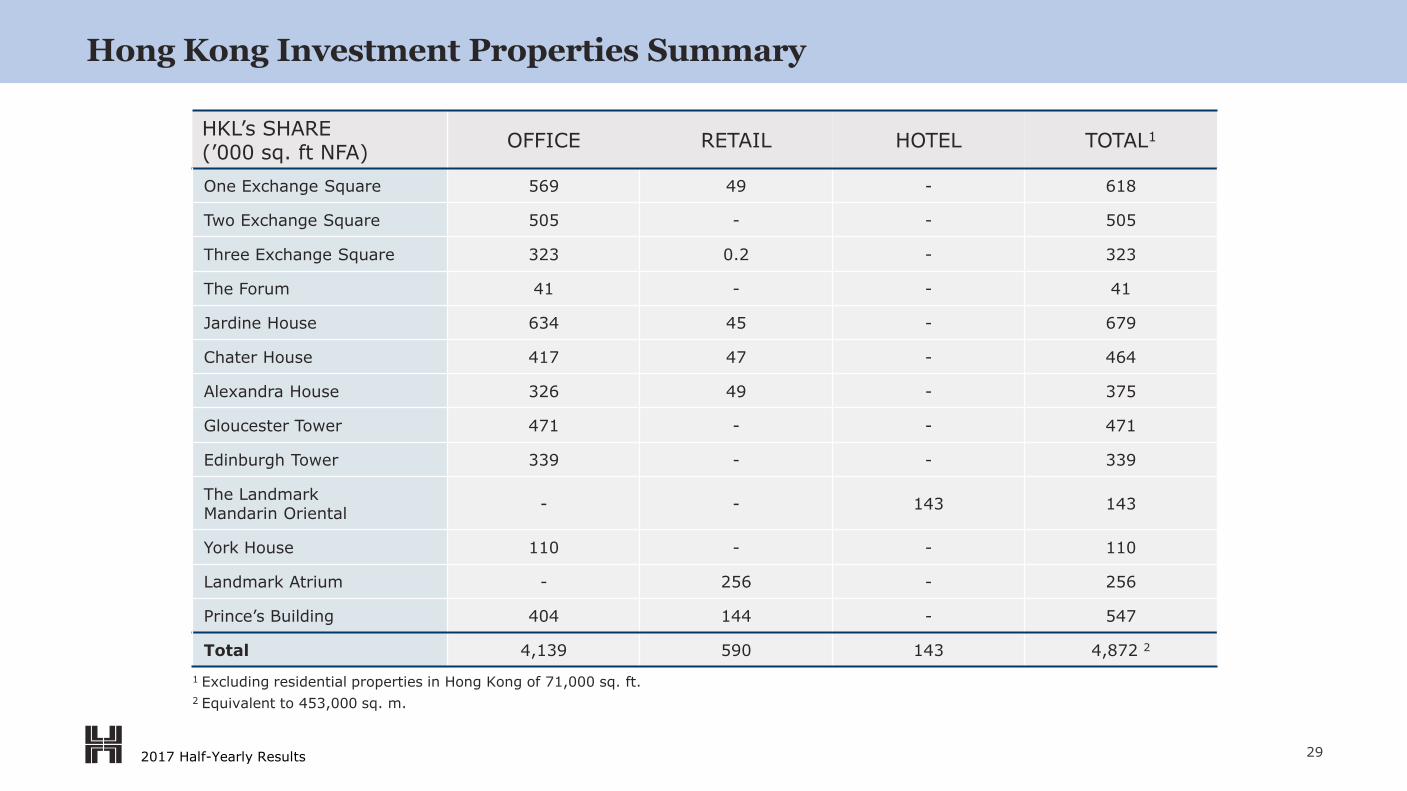
2017 Half-Yearly Results 29
HKL’s SHARE(’000 sq. ft NFA)
OFFICE RETAIL HOTEL TOTAL1
One Exchange Square 569 49 - 618
Two Exchange Square 505 - - 505
Three Exchange Square 323 0.2 - 323
The Forum 41 - - 41
Jardine House 634 45 - 679
Chater House 417 47 - 464
Alexandra House 326 49 - 375
Gloucester Tower 471 - - 471
Edinburgh Tower 339 - - 339
The LandmarkMandarin Oriental
- - 143 143
York House 110 - - 110
Landmark Atrium - 256 - 256
Prince’s Building 404 144 - 547
Total 4,139 590 143 4,872 2
Hong Kong Investment Properties Summary
1 Excluding residential properties in Hong Kong of 71,000 sq. ft.
2 Equivalent to 453,000 sq. m.
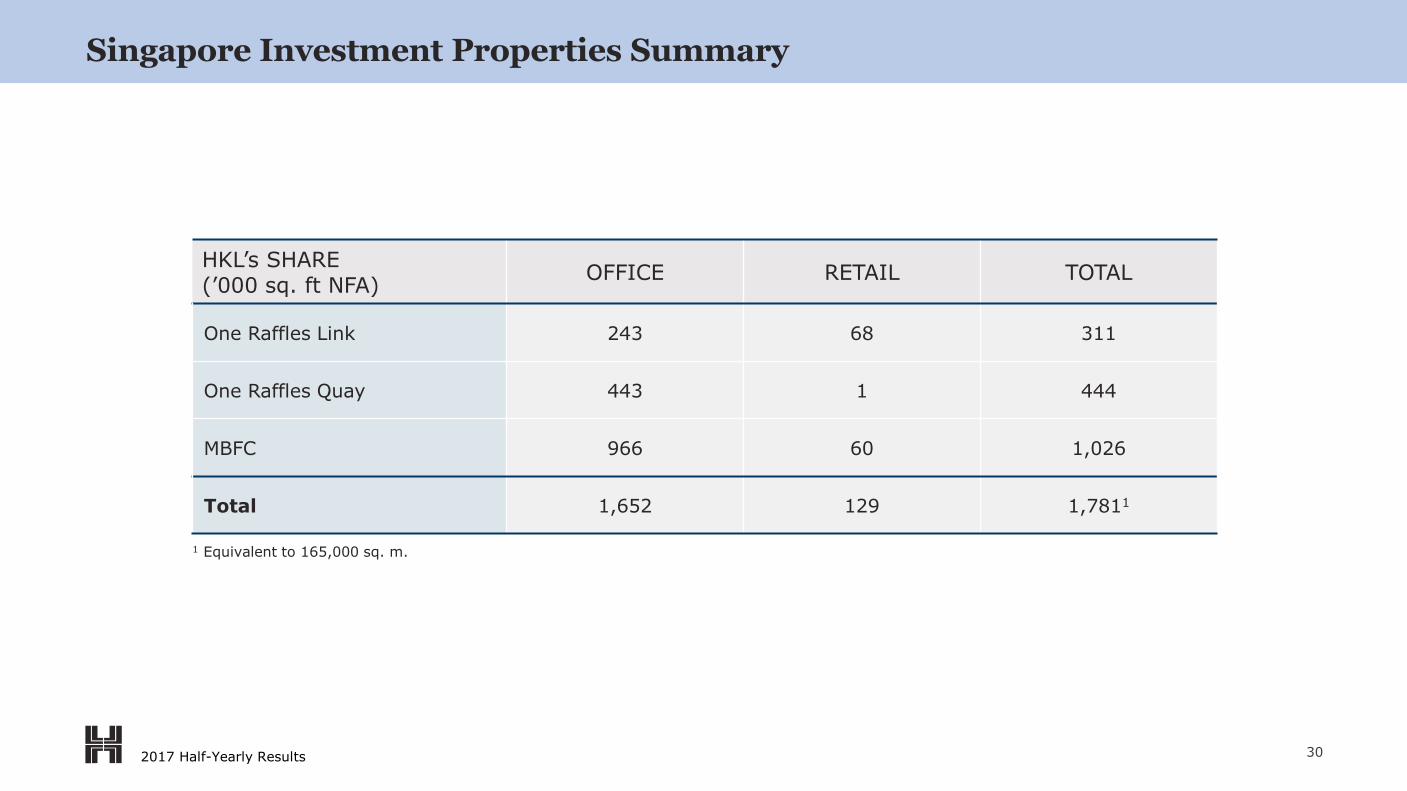
2017 Half-Yearly Results 30
Singapore Investment Properties Summary
HKL’s SHARE(’000 sq. ft NFA)
OFFICE RETAIL TOTAL
One Raffles Link 243 68 311
One Raffles Quay 443 1 444
MBFC 966 60 1,026
Total 1,652 129 1,7811
1 Equivalent to 165,000 sq. m.

2017 Half-Yearly Results 31
Other Investment Properties Summary
HKL’s SHARE(’000 sq. ft NFA)
OFFICE RETAIL HOTEL TOTAL
Macau - 98 151 249
Jakarta 663 66 - 729
Hanoi 75 8 - 83
Bangkok 27 61 - 88
Phnom Penh 184 89 97 370
Others 70 161 215 446
Total 1,019 483 463 1,9651
1 Equivalent to 182,000 sq. m.

2017 Half-Yearly Results 32
HKL’s SHARE
PROJECT INTERESTYEAR OF
ACQUISITIONSITE AREA
(ha)
DEVELOPABLE AREA
(m sq. m.)
CONSTRUCTED(m sq. m.)
UNDER CONSTRUCTION
(m sq. m.)
TO BE DEVELOPED(m sq. m.)
Yorkville South, Chongqing
100% 2010 38.6 0.88 0.51 0.16 0.21
Yorkville North, Chongqing
100% 2011 53.8 1.09 0.33 0.20 0.56
Bamboo Grove,Chongqing
50% 2005 77.9 0.72 0.66 0.06 -
New BambooGrove, Chongqing
50% 2015 34.8 0.32 - 0.20 0.12
Landmark Riverside, Chongqing
50% 2009 22.2 0.50 0.15 0.14 0.20
Central Avenue, Chongqing
50% 2013 40.2 0.55 0.04 0.16 0.36
WE City, Chengdu
50% 2010 19.0 0.45 0.15 0.12 0.17
Parkville, Shanghai
50% 2015 8.7 0.11 0.02 0.10 -
Wuhan1 50% 2017 16.4 0.25 - - 0.25
Nanjing 33% 2017 19.9 0.07 - - 0.07
Total 331.6 4.94 1.87 1.13 1.94
Mainland China Development Properties Summary
1 Conditionally acquired

2017 Half-Yearly Results 33
HKL’s SHARE
PROJECT INTERESTYEAR OF
ACQUISITIONSITE AREA
(ha)
DEVELOPABLE AREA
(m sq. m.)
CONSTRUCTED(m sq. m.)
UNDER CONSTRUCTION
(m sq. m.)
TO BE DEVELOPED(m sq. m.)
Sol Acres 100% 2014 3.3 0.12 - 0.12 -
Lake Grande 100% 2015 1.8 0.05 - 0.05 -
Margaret Drive 100% 2017 0.5 0.02 - - 0.02
Eunosville1 100% 2017 3.5 0.1 - - 0.10
Total 9.1 0.29 - 0.17 0.12
Singapore Development Properties Summary
1 Conditionally acquired

2017 Half-Yearly Results 34
HKL’s SHARE
PROJECT INTERESTYEAR OF
ACQUISITIONSITE AREA
DEVELOPABLE AREA
(m sq. m.)
CONSTRUCTED(m sq. m.)
UNDER CONSTRUCTION
(m sq. m.)
TO BE DEVELOPED(m sq. m.)
Nava Park, Indonesia
49% 2012 67.5 0.39 0.03 0.03 0.33
Anandamaya Residences, Indonesia
40% 2013 1.4 0.05 - 0.05 -
Asya, Indonesia 25% 2016 67.3 0.23 - - 0.23
Two Roxas Triangle, thePhilippines
40% 1995 0.4 0.04 - 0.04 -
Mandani Bay, the Philippines
40% 2013 19.6 0.48 - 0.03 0.44
Northpine, the Philippines
40% 1996-2016 150.7 0.31 0.16 0.01 0.13
The Nassim, Vietnam
50% 2014 0.6 0.02 - 0.02 -
The Esse at Sukhumvit 36, Thailand
49% 2017 0.4 0.02 - - 0.02
Total 307.9 1.52 0.19 0.18 1.15
Other Development Properties Summary
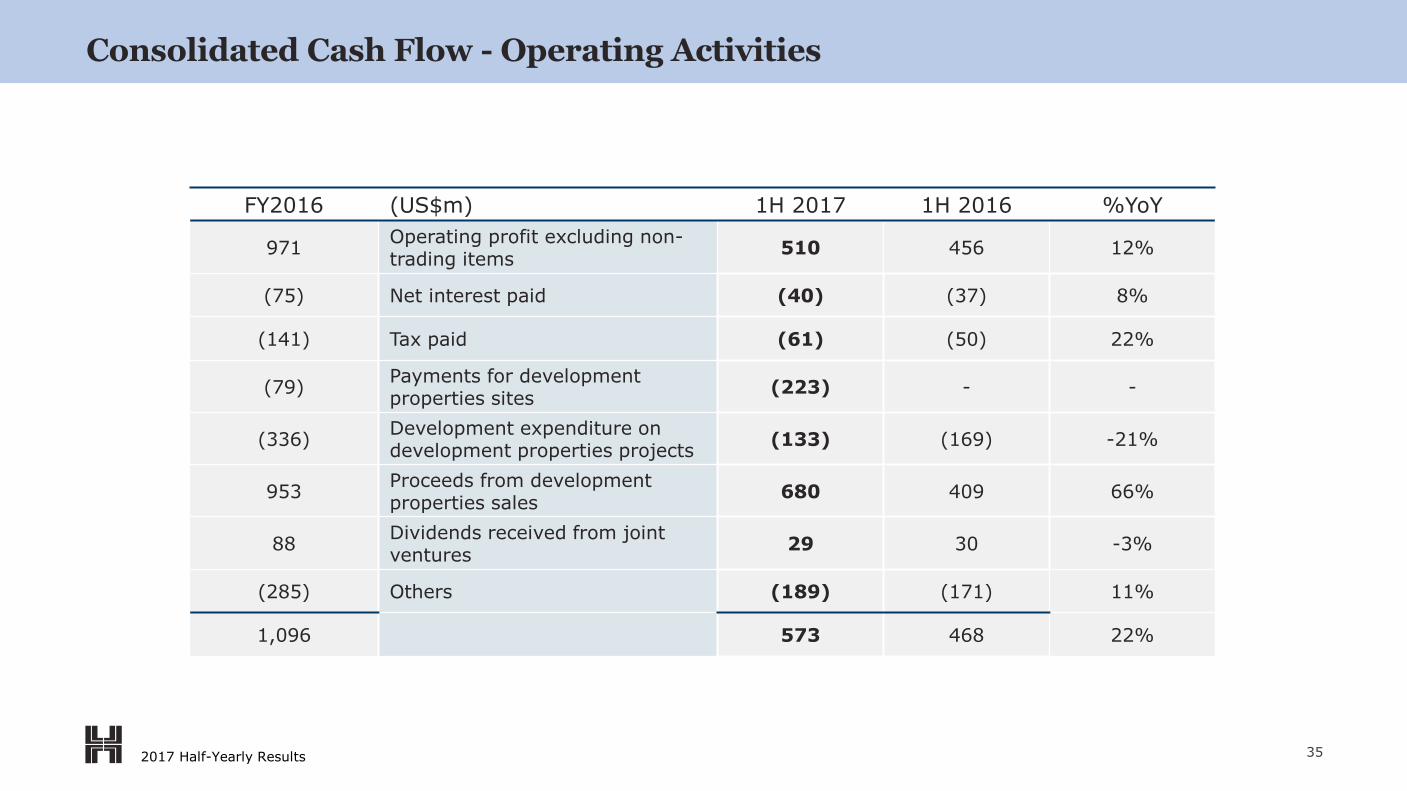
2017 Half-Yearly Results 35
Consolidated Cash Flow - Operating Activities
FY2016 (US$m) 1H 2017 1H 2016 %YoY
971Operating profit excluding non-trading items
510 456 12%
(75) Net interest paid (40) (37) 8%
(141) Tax paid (61) (50) 22%
(79) Payments for development properties sites
(223) - -
(336)Development expenditure on development properties projects
(133) (169) -21%
953Proceeds from development properties sales
680 409 66%
88Dividends received from joint ventures
29 30 -3%
(285) Others (189) (171) 11%
1,096 573 468 22%

2017 Half-Yearly Results 36
FY2016 (US$m) 1H 2017 1H 2016
Investment properties
27,712 - Subsidiaries 30,360 26,079
4,180 - Joint ventures 4,246 4,311
31,892 34,606 30,390
Development properties
2,218 - Subsidiaries 1,972 2,746
1,835 - Joint ventures 2,461 1,818
4,053 4,433 4,564
(2,623) Others (2,904) (2,858)
33,322 Gross assets (excluding cash) 36,135 32,096
Financed by:
31,314 - Total equity 34,253 29,774
2,008 - Net debt 1,882 2,322
33,322 36,135 32,096
Consolidated Balance Sheet

2017 Half-Yearly Results 37
1H 2016 2H 2016 1H 2017
Hong Kong Office –Exchange Square 1 & 2
3.60% 3.50% 3.25%
Hong Kong Retail –Landmark Atrium
4.50% 4.50% 4.50%
Singapore Office –MBFC
3.50% 3.50% 3.25%
CAPITALISATION RATES
Investment Property – Basis of Valuation

2017 Half-Yearly Results 38
Treasury Management
LIQUIDITY AS AT 30 JUN 2017 (All figures in US$ billion)
Liquidity as at 31 DEC 2016
HK$1 S$2 US$ RMB TOTAL
Committed lines 6.5 4.5 1.3 - 0.5 6.3
Gross debt 3.9 3.1 0.4 - 0.3 3.8
Available lines 2.6 1.4 0.9 - 0.2 2.5
Cash 1.9 - 0.4 0.5 1.0 1.9
Available liquidity
4.5 1.4 1.3 0.5 1.2 4.4
1 HK$ debt includes US$ debt swapped into HK$
2 S$ debt includes HK$ debt swapped into S$

2017 Half-Yearly Results 39
Treasury Management
DEBT MANAGEMENT AND HEDGING POLICIES AS AT 30 JUN 2017
0
10
20
30
40
50
60
70
80
90
100
Type of Facilities Currency Interest Rate
Banks 54%
Bonds 46%
Fixed 57%
Floating 43%
HK$82%
S$ 10%
%
RMB 8%
1


![4PNYH[PVU VY 4VKLYUPZH[PVU& - Intec Systems Limited · (un\shy1: 1h]h:jypw[ ?7(.,: 1h]h 1:- 1h]h :wypun 4=* 1h]h =hhkpu 1h]h 'sbnfxpsl -bohvbhf #btjt 'jstu 3fmfbtf,ocation!s better](https://img.pdfslide.us/doc/110x75/5f63751302c9503c893ede57/4pnyhpvu-vy-4vklyupzhpvu-intec-systems-limited-unshy1-1hhjypw-7.jpg)