Embed Size (px)
Citation preview
This article is protected by copyright. All rights reserved.
[UV-SI] 1
2
Title: Acclimation to UV-B radiation and visible light in Lactuca sativa 3
involves upregulation of photosynthetic performance and orchestration 4
of metabolome-wide responses1 5
6
Authors: Wargent J.J.1*, Nelson B.C.W.1, McGhie T.K.2, Barnes P.W.3 7
8
1Institute of Agriculture & Environment, Massey University, Palmerston North, New 9
Zealand 10
2The New Zealand Institute for Plant & Food Research, Palmerston North, New Zealand 11
3Department of Biological Sciences, Loyola University, New Orleans, USA 12
13
*Corresponding author: [email protected] 14
15
16
17
18
19
20
21
22
23
24
This article has been accepted for publication and undergone full peer review but has not been through the
copyediting, typesetting, pagination and proofreading process, which may lead to differences between this
version and the Version of Record. Please cite this article as doi: 10.1111/pce.12392
Acc
epte
d A
rticl
e
This article is protected by copyright. All rights reserved.
25
26
ABSTRACT 27
UV-B radiation is often viewed as a source of stress for higher plants. In particular, 28
photosynthetic function has been described as a common target for UV-B impairment, yet 29
as our understanding of UV-B photomorphogenesis increases, there are opportunities to 30
expand the emerging paradigm of regulatory UV response. Lactuca sativa is an important 31
dietary crop species, and is often subjected to rapid sunlight exposure at field transfer. 32
Acclimation to UV-B and visible light conditions in L. sativa was dissected using gas 33
exchange and chlorophyll fluorescence measurements, in addition to non-destructive 34
assessments of UV epidermal shielding (SUV). Following UV-B treatment, seedlings were 35
subjected to wide-range metabolomic analysis using LC-QTOF-HRMS. During the 36
acclimation period, net photosynthetic rate increased in UV-treated plants, epidermal UV 37
shielding increased in both sub-sets of plants transferred to the acclimatory conditions 38
(UV+/UV- plants) and Fv/Fm declined slightly in UV+/UV- plants. Metabolomic analysis 39
revealed that a key group of secondary compounds was upregulated by higher light 40
conditions, yet several of these compounds were elevated further by UV-B. In conclusion, 41
acclimation to UV-B involves co-protection from the effects of visible light, and responses 42
to UV-B radiation at a photosynthetic level may not be consistently viewed as damaging to 43
plant development. 44
45
Keyword index: UV-B radiation, Lactuca sativa, acclimation, photosynthesis, 46
photoprotection 47
48
49
50
Acc
epte
d A
rticl
e
This article is protected by copyright. All rights reserved.
51
52
INTRODUCTION 53
Ultraviolet (UV) radiation is an energetic driver of numerous components of plant function. 54
Despite routine reporting of injurious effects of UV-B radiation (290-320 nm) upon cellular 55
and molecular function (Frohnmeyer, 1999, Jordan, 1996), plants in nature rarely display 56
signs of significant damage routinely inflicted by UV-B. This is thought to be due to aspects 57
of the diverse and formidable suite of responses to UV plants have evolved (Jenkins, 58
2007), including wide-ranging up-regulation of phenolic metabolism (Rozema et al., 2002, 59
Stracke et al., 2010), thought to act as an effective sun-screen, and inhibition of leaf 60
elongation, plus other alterations in plant morphology (Hectors et al., 2010, Wargent et al., 61
2009b). Taken together with the recent confirmation of the UVR8-COP1-HY5 UV-B 62
photoreception pathway [UVR8: UV RESISTANCE LOCUS 8; COP1: CONSTITUTIVELY 63
PHOTOMORPHOGENIC 1; HY5: ELONGATED HYPOCOTYL 5] (Brown et al., 2005, 64
Christie et al., 2012, Favory et al., 2009, Rizzini et al., 2011), UV-B photobiology is 65
currently presented with an opportunity to extend our understanding of plant responses to 66
UV radiation into a new phase, where routine regulation of plant development by UV-B 67
photomorphogenesis can be considered in equal fashion to that of the day-to-day 68
adjustments mediated by red and blue light cues (Briggs & Christie, 2002, Franklin & 69
Whitelam, 2004). Equally, understanding the breadth of regulatory UV response may 70
underpin advances towards a sustained food security (Wargent & Jordan, 2013). 71
Contrary to past dogma that photosystem competence and ensuing photosynthetic 72
performance can be highly vulnerable to UV-B (Allen et al., 1997, Mackerness et al., 1998, 73
Takahashi et al., 2010), there is now growing evidence that under realistic exposure 74
fluxes, UV radiation can protect against limitations to photosynthetic performance. For 75
example, several studies have implicated the role of UV in the induction of enhanced 76 Acc
epte
d A
rticl
e

This article is protected by copyright. All rights reserved.
photoprotection against high-light or long-wave UV radiation (Bolink et al., 2001, Hakala-77
Yatkin et al., 2010, Poulson et al., 2002), and it has been suggested that UV-B exposure 78
may enhance recovery from a photoprotected state (Xu & Gao, 2010). Recently, we 79
showed that in the crop species Lactuca sativa, exposing seedlings to a moderately high 80
dose of UV-B increased net photosynthetic rate. In addition, maximum quantum efficiency 81
of PSII was elevated in UV-B treated plants following exposure to high-light and 82
temperature conditions, as compared to seedlings maintained under visible light (Wargent 83
et al., 2011). From a mechanistic perspective, it is known that the UV-B photoreceptor 84
UVR8 is required for the regulation of photosynthetic efficiency in Arabidopsis in response 85
to UV-B (Davey et al., 2012), yet the basic regulatory network which may underpin UV-86
mediated photosynthetic competency remains poorly described. One central component of 87
UV response which has been linked to photoprotection is that of stimulated secondary 88
metabolic activity. UV induces a broad range of plant metabolites (Bassman, 2004), yet 89
compounds have often been investigated individually in studies, with knowledge gaps still 90
evident (Jansen et al., 2008). For example, despite technological advances, there are still 91
very few larger-scale metabolomic studies of UV response to date. At the same time, 92
various roles of UV-induced metabolites have been suggested, largely focused on the 93
shikimate-derived phenylpropanoids, including UV-absorption (Bornman & Vogelmann, 94
1991, Day et al., 1993), herbivore feeding deterrence (Izaguirre et al., 2007), reactive 95
oxygen scavenging (Hideg et al., 2012), and induced resistance to fungal pathogen attack 96
(Demkura & Ballare, 2012). In terms of applying our understanding of UV-mediated effects 97
on primary and secondary metabolism to extend our knowledge of plant development, one 98
potential criticism of many UV-B photobiological studies is that exposure of plants to UV-B 99
often follows a ‘sudden shock’ approach, whereby no ‘acclimation’ phase of steadily 100
increased UV-B exposure is included. However, understanding inducible UV acclimation 101
provides valuable information within the context of agriculture. Many crops are initially 102 Acc
epte
d A
rticl
e
This article is protected by copyright. All rights reserved.
propagated in the complete absence of UV-B wavelengths, and are then transferred into 103
the field after a period of initial seedling growth, therefore leading to the constant sudden 104
exposure of many crop plants to UV. This aspect of UV photomorphogenesis is now 105
receiving some attention; for example, the UV-B photoreceptor UVR8 has a clear role in 106
orchestrating phenolic metabolism when plants are exposed to ambient sunlight (Morales 107
et al., 2013), and controlled exposure of Arabidopsis seedlings to narrowband UV-B 108
revealed rapid changes in expression profile of several hundred UVR8-dependent gene 109
transcripts, many of which are related to phenylpropanoid metabolism (Favory et al., 110
2009). Regardless, our understanding of the complex process of UV-B acclimation from a 111
temporal and whole-plant perspective is still limited. 112
Here, we extend our understanding of the rapid nature of UV-B plant response in a 113
dissection of physiological and metabolomic responses in Lactuca sativa, a species of 114
significant dietary nutritional importance. We show for the first time, the progression of 115
rapid UV-B and visible light acclimation at a leaf gas exchange and epidermal sun-116
screening level, as underpinned by metabolomic change. 117
118
MATERIALS & METHODS 119
Plant growth & UV treatments 120
Seeds of Lactuca sativa ‘Expedition’ (Rijk Zwaan) were germinated in vermiculite, and 121
then transferred after 9 d into a standard potting soil. Seedlings were grown to an age of 122
21 d under standard glasshouse conditions, where leaf size then allowed for gas exchange 123
measurements. Our standard glasshouse conditions consisted of a 160 m2 glasshouse 124
situated at the Massey University Plant Growth Unit, Palmerston North, New Zealand (-125
40.42, 175.58) where air temperature was maintained at 20°C±4, and relative humidity of 126
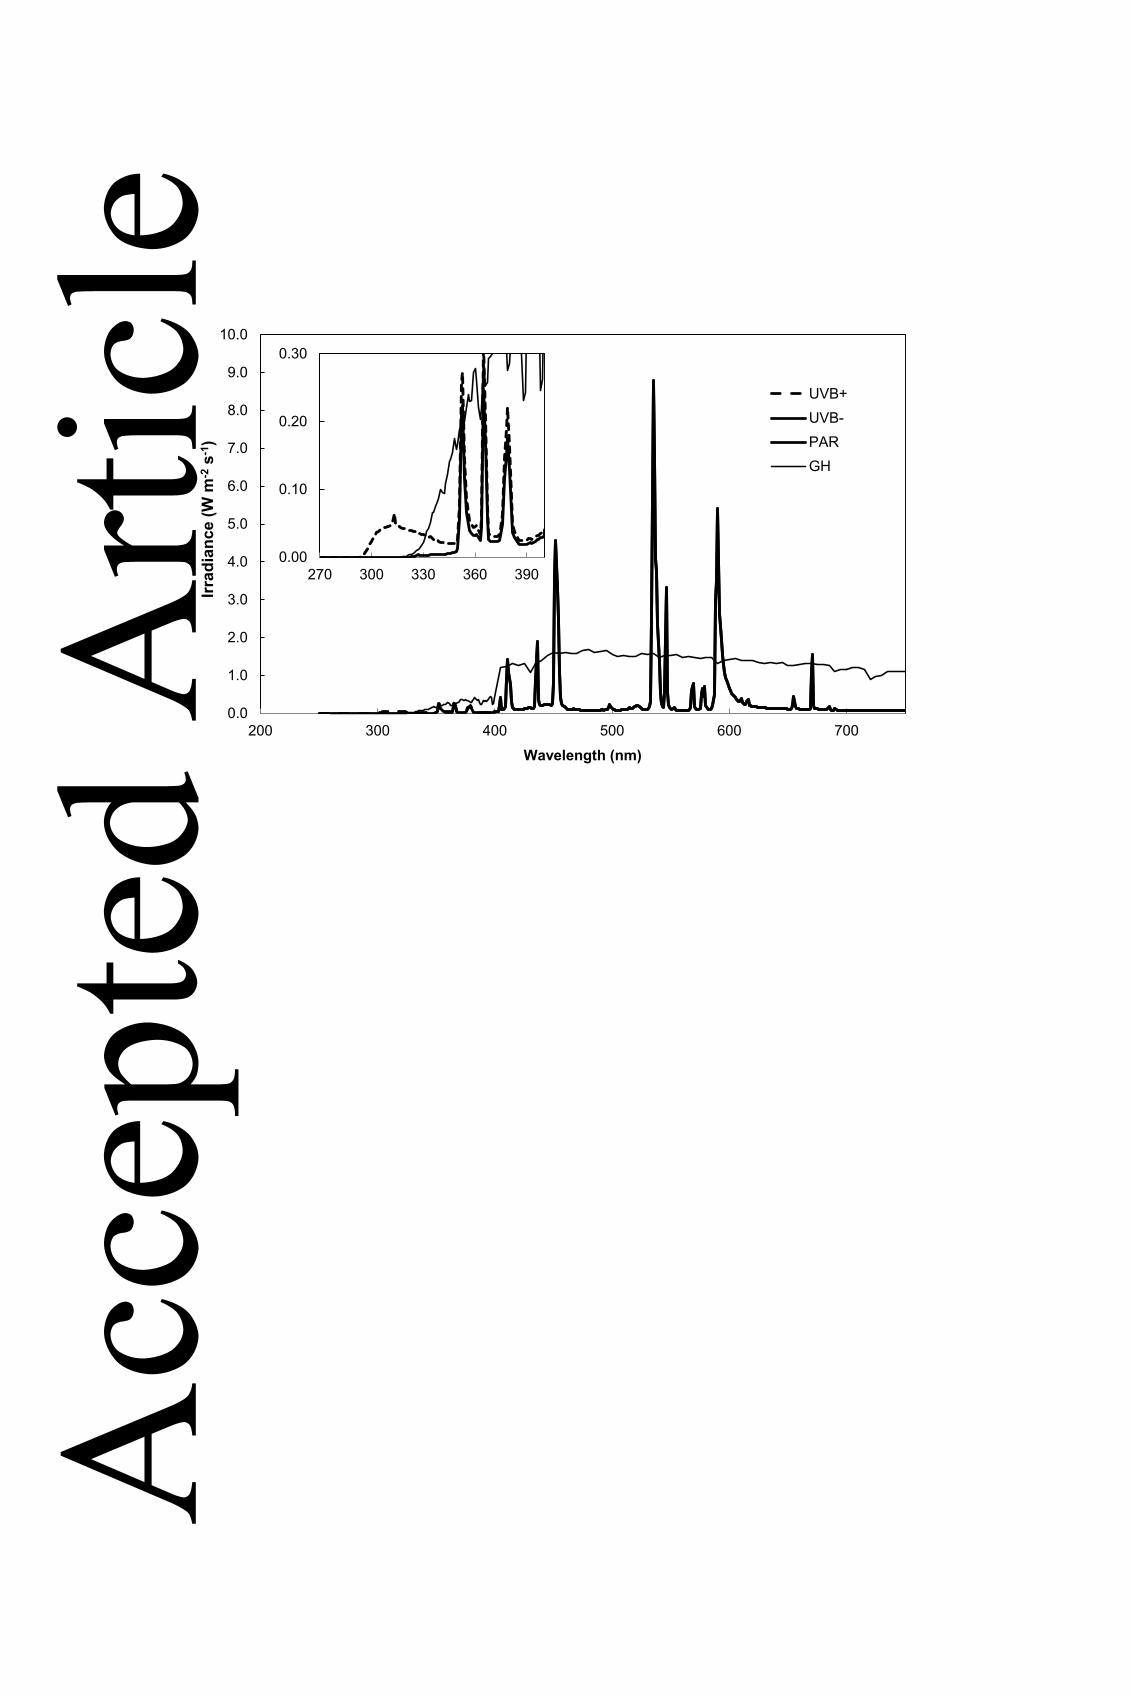
70%±10. No UV-B or substantial short-wave UV-A radiation penetrated the glass cladding 127
of the house (Fig. 1), and at the time of year the experiments were carried out (January-128 Acc
epte
d A
rticl
e
This article is protected by copyright. All rights reserved.
March), mean photoperiod for the glasshouse conditions was 14:10 hr day/night. 129
Photosynthetically active radiation (PAR: 400-700 nm) was quantified in both glasshouse 130
and controlled environment chamber environments using a datalogger equipped with four 131
LI-190SZ quantum PAR sensors (Li-Cor Inc, Lincoln, NE, USA). In total, three days 132
sampling of the PAR environment was undertaken in both experimental environments, with 133
additional checks as required. In glasshouse conditions, mean maximum PAR per day was 134
1999 µmol m-2 s-1 ± 56 (S.D.), and mean integrated PAR (total PAR day-1, to allow 135
comparison with growth chamber values) was 53 mol m-2 day-1 ± 11.2 (S.D.). For UV-B 136
exposure, plants were placed into a modified controlled environment chamber (Contherm 137
630, Contherm Scientific Ltd, Petone, New Zealand). Environmental conditions in the 138
chamber were maintained at: 14:10 hr day/night length; 21°C/18°C day/night temperature; 139
75% relative humidity. PAR light sources in the growth chamber consisted of a bank of 400 140
W metal halide lamps (Phillips HPI T Plus, Eindhoven, Netherlands). The PAR light system 141
was at a set-point of 750 µmol m-2 s-1, providing a mean integrated PAR at plant canopy 142
height of 54 mol m-2 day-1 ± 1.8 (S.D.), which was markedly close to the integrated PAR 143
level in the glasshouse conditions. The growth chamber was equipped with UV-B 144
fluorescent tubes (Q-Panel 313, Q-Lab Corp, Cleveland, USA), wrapped in filtered with 145
0.13-mm-thick cellulose diacetate (Clarifoil,Courtaulds Ltd, Derby, UK) to remove 146
wavelengths <290 nm (Fig. 1). The chamber was split into a UV+ zone and UV- zone 147
separated by a central curtain of UV-B opaque film (Fig. 1) (Lumivar, BPI Visqueen, 148
Ardeer, UK), with air allowed to circulate freely between the two zones. For the no UV 149
zone, those lengths of UV-B tubes were wrapped in the same UV-B opaque film, with UV+ 150
and UV- zones alternated regularly between experiments. UV-B treatments were 151
quantified at plant canopy height with an Optronics 756 spectroradiometer equipped with 152
integrating sphere, providing a biologically effective UV dose of 10 kJ m-2 day-1 as 153
weighted with the Caldwell (1971) generalized plant action spectrum, normalized to unity 154 Acc
epte
d A
rticl
e
This article is protected by copyright. All rights reserved.
at 300 nm, which would be typically observed under New Zealand summer conditions. 155
Spectroradiometric scans of the controlled environment chamber confirmed that the 156
biologically effective UV dose was <0.01 kJ m-2 day-1 in the UV- zone. In order to compare 157
changes in the plants between growth chamber conditions and the propagation 158
environment, a proportion of experimental plants were maintained throughout the 159
experiment under the standard glasshouse conditions. Under GH conditions, the 160
biologically effective UV dose was <0.01 kJ m-2 day-1. For metabolomic studies, the foliage 161
of entire seedlings was snap frozen in liquid N2, and stored at -80°C for subsequent 162
analysis, with sampling undertaken (1) immediately prior to the point of transfer into the 163
controlled environment chamber, 21 d after seed sowing [‘GH D0’], (2) 6 d after transfer of 164
seedlings into the chamber according to treatment [‘UV- D6’, ‘UV+ D6’], in addition to 165
those seedlings which had been maintained under standard glasshouse conditions [‘GH 166
D6’]. 167
168
Gas exchange & chlorophyll fluorescence 169
All measurements were non-destructively taken from the second true leaf of each 170
seedling, and were taken on several days between Day 0 (i.e. prior to transfer of seedlings 171
from the glasshouse to the growth chamber) to Day 6 following transfer of seedlings into 172
the growth chamber. Gas exchange measurements were carried out with an LI-6400 infra-173
red gas analyser (Li-Cor Inc, Lincoln, NE, USA); where cuvette conditions were maintained 174
at a saturating 1000 µmol m-2 s-1 PAR, 75% relative humidity, 20°C cuvette block 175
temperature, and 400 ppm of CO2. During measurements, PAR was provided by a LI-COR 176
RGB LED light source housed within the cuvette, and leaves were maintained in the 177
cuvette for at least five minutes to reach steady-state prior to measurement. Parameters 178
measured included light-saturated net exchange rate of CO2 (light-saturated net 179
photosynthetic rate or Pmax) and H2O (transpiration rate or E), stomatal conductance (gs), 180 Acc
epte
d A
rticl
e
This article is protected by copyright. All rights reserved.
and intercellular CO2 mole fraction (internal CO2 or Ci). Chlorophyll fluorescence analysis 181
of maximum quantum efficiency of PSII photochemistry (Fv/Fm) was spot-measured using 182
a Plant Efficiency Analyser (Hansatech, UK), with leaves allowed to dark-adapt for 20 183
minutes before measurement. Non‐invasive measurements of epidermal UV shielding 184
(SUV) were made with a portable pulse amplitude modulation (Xe-PAM) chlorophyll 185
fluorometer (UVA‐PAM; Gademann Instruments, Würzburg, Germany). This instrument 186
provides indirect estimates of epidermal UV-A transmittance/shielding by measuring the 187
fluorescence yield of chlorophyll (Fo; λ > 650 nm) induced by UV-A (UV; 375 nm) and blue 188
(BL; 470 nm) radiation, as outlined by Kolb et al. (2005) and following the precautions and 189
procedures of Barnes et al. (2008) and Barnes et al. (2013). 190
191
Our dataset is composed of two identical repeat experiments, with data analysed using 192
repeated measures Analysis of Variance (ANOVA) (SPSS statistics v20, IBM, US), where 193
effects of experimental treatment, experimental day, and experimental iteration were 194
analysed. All gas exchange, chlorophyll fluorescence, and epidermal UV shielding 195
measurements were taken concurrently and close to midday on each sampling day, with a 196
replicate from each treatment sampled in a rotated blocking pattern throughout. Ten plants 197
were measured on each sampling occasion from each of the three treatments. Individual 198
plants were the unit of replication within each experimental iteration within ANOVA (n per 199
iteration =10, total replicates within each treatment per day from both iterations: n=20). 200
Plants were routinely re-arranged under within each treatment on a regular basis. 201
202
Metabolomic analysis by LC-QTOF-HRMS 203
Metabolomic profiling was carried out using liquid chromatography high resolution mass 204
spectrometry (LC-HRMS). LC-HRMS grade acetonitrile and methanol was from Fischer 205
Scientific; dimethyl sulfoxide (DMSO) was from Sigma-Aldrich. Ultrapure water was 206 Acc
epte
d A
rticl
e
This article is protected by copyright. All rights reserved.
obtained from a Milli-Q Synthesis system (Millipore). Foliar material was homogenised in 207
liquid N2 and weighed out to an equal mass of 150 mg for each sample. Each of the 208
powdered leaf samples were extracted overnight at 1°C with 1.5 mL ethanol/MQ/formic 209
acid (80/20/1 v/v/v). Samples were diluted with methanol before analysis by LC-HRMS. 210
The LC-HRMS system was composed of a Dionex Ultimate® 3000 Rapid Separation LC 211
and a micrOTOF QII mass spectrometer (Bruker Daltonics, Bremen, Germany) fitted with 212
an electrospray ion source. The LC contained a SRD-3400 solvent rack/degasser, HPR-213
3400RS binary pump, WPS-3000RS thermostated autosampler, and a TCC-3000RS 214
thermostated column compartment. Metabolite separation was achieved using two UHPLC 215
columns connected in series. The columns were both ZorbaxTM SB-C18 2.1 x 100 mm, 216
1.8 µm (Agilent, Melbourne, Australia) and were maintained at 60 °C. The flow was 350 217
µL/min. Solvents were A = 100% acetronitrile, and B = 0.4% formic acid. The gradient 218
was: 10%A, 90% B, 0-0.5 min; linear gradient to 35% A, 65%B, 0.5-18 min; linear gradient 219
to 100% A, 18-25 min; composition held at 100% A, 25-28 min; linear gradient to 10% A, 220
90% B, 28-28.2 min; to return to the initial conditions before another sample injection at 31 221
min. The injection volume for samples and standards was 1 μL. The micrOTOF QII source 222
parameters were: temperature 225 ºC; drying N2 flow 6 L/min; nebulizer N2 1.5 bar, 223
endplate offset -500V, mass range 100-2000 Da, acquired were acquired at 2 scans/s. 224
Negative ion electrospray was used with a capillary voltage of +3500 V. Post-acquisition 225
internal mass calibration used sodium formate clusters with the sodium formate delivered 226
by a syringe pump at the start of each chromatographic analysis. 227
228
Metabolomic data analysis 229
The metabolites present in each analysis were extracted from the raw MS data files using 230
the Find Molecular Features algorithm contained in the DataAnalysis (Bruker Daltonics, 231
Bremen, Germany) software package. The molecular features detected for all analyses 232 Acc
epte
d A
rticl
e
This article is protected by copyright. All rights reserved.
were then combined into a single bucket table using ProfileAnalysis (Bruker Daltonics, 233
Bremen, Germany) (Supplementary File Appendix 1). This data table contains molecular 234
features, tagged with an accurate mass/retention time data, as rows with the analyses 235
arranged as columns. Following analysis, discrete molecular features were submitted to 236
Principle Component Analysis (PCA) in ProfileAnalysis for identification of treatment-237
dependent differences. To identify metabolites that differ between treatments, the t-test 238
function in ProfileAnalysis was used, and the results visualised using volcano plots. 239
Metabolites that had a fold change of greater than 1.5 with a P<0.05 were considered for 240
further investigation. To obtain more precise quantitative data for metabolites of interest, 241
the accurate masses and retention times were used with QuantAnalysis (Bruker Daltonics, 242
Bremen, Germany) software to obtain peak areas from exact ion chromatograms (EICs) 243
for each metabolite. Replicate data from each treatment were then analysed by one-way 244
ANOVA, along with Tukey post-hoc testing for homogeneity. For each analysis point 245
according to treatment and day, 6-7 replicate seedlings were collected and analysed as 246
above within a single experimental iteration. 247
248
RESULTS 249
Photosynthetic competency increases during UV-B acclimation 250
In order to dissect the process of UV-B acclimation, we transferred young L. sativa plants 251
from a standard glasshouse propagation environment into growth chamber conditions 252
which provided fixed PAR levels, and the presence or absence of supplementary UV-B 253
radiation. Prior to transfer of seedlings from our glasshouse environment [‘GH’] into the 254
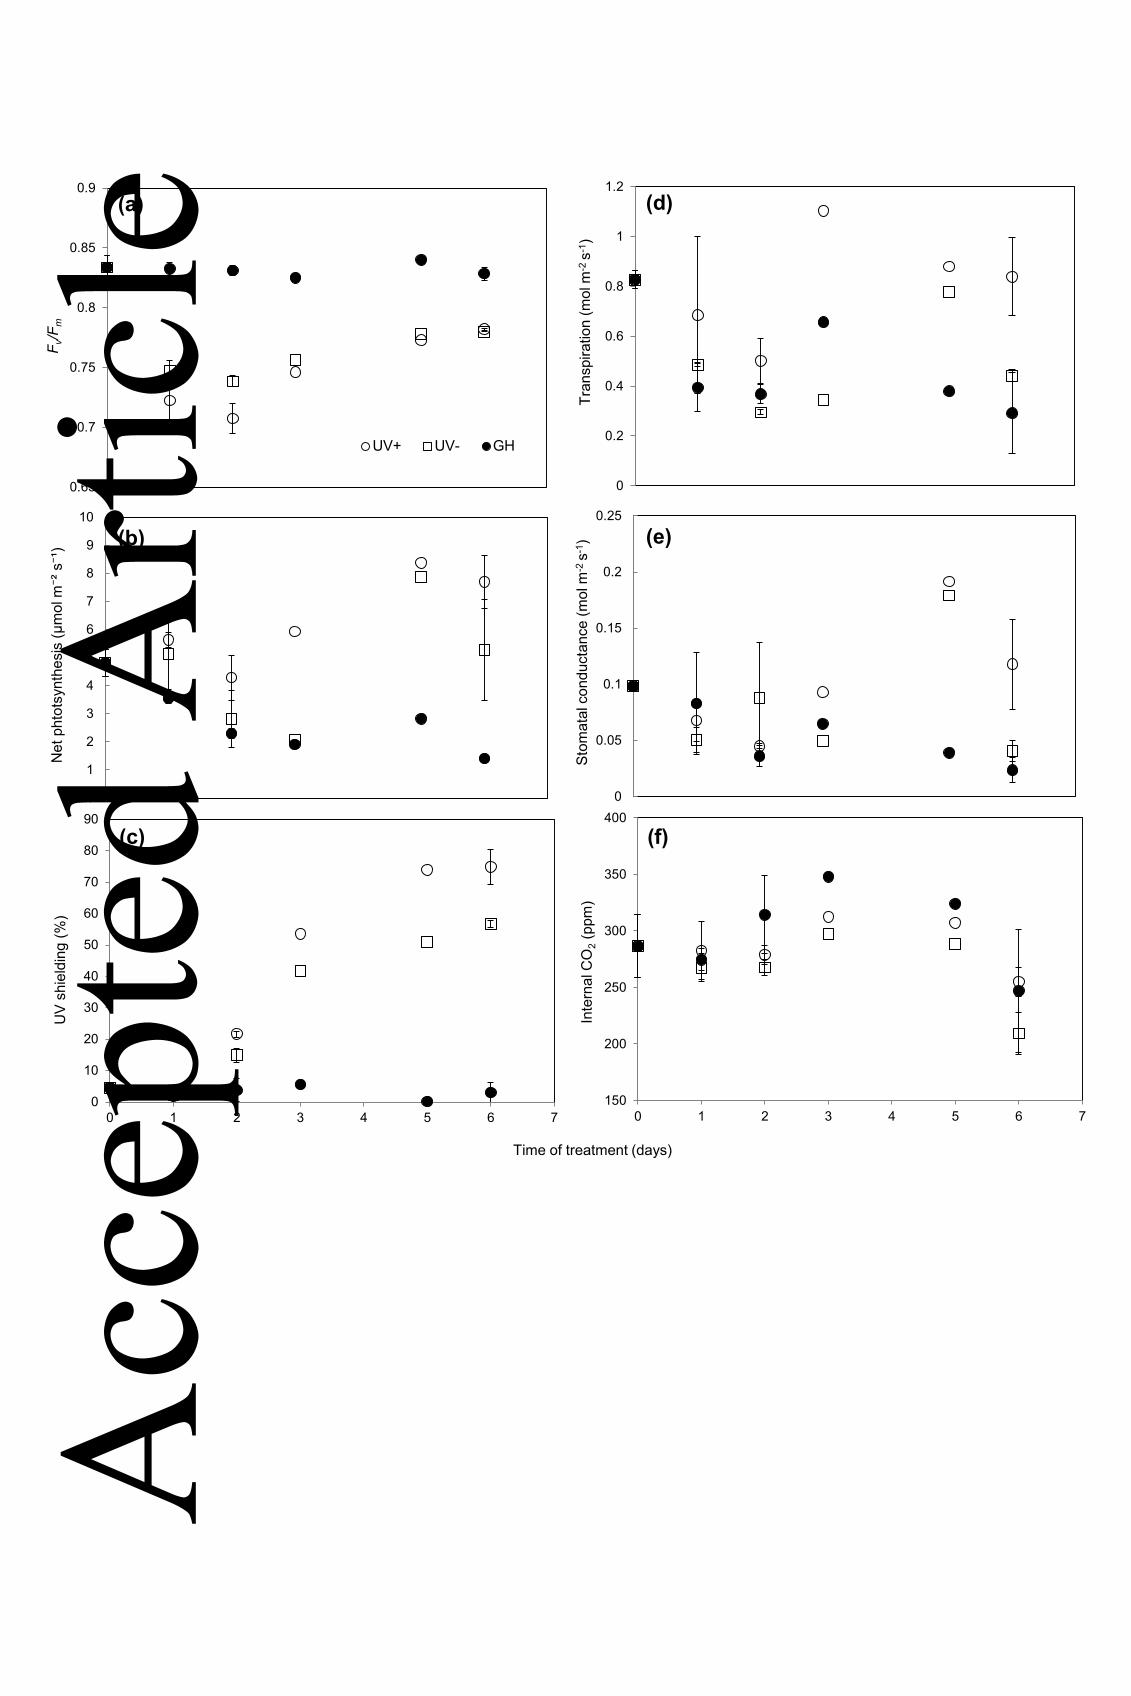
growth chamber, we observed values for maximum quantum efficiency of PSII 255
photochemistry (Fv/Fm) well within the normal range for healthy plants (~0.83; Figure 2A). 256
Also, in order to indirectly yet non-destructively monitor leaf UV-shielding, we employed a 257
Xe UVA-PAM fluorometer, which indicated that % UV shielding values were extremely low 258 Acc
epte
d A
rticl
e
This article is protected by copyright. All rights reserved.
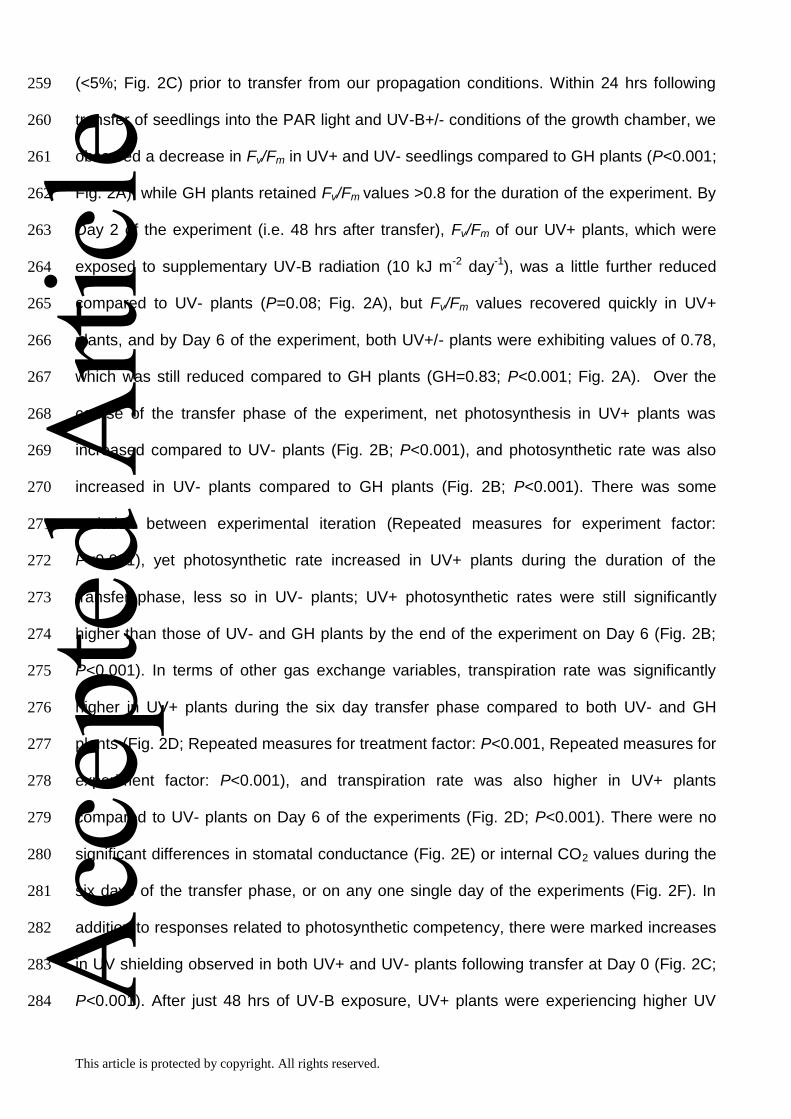
(<5%; Fig. 2C) prior to transfer from our propagation conditions. Within 24 hrs following 259
transfer of seedlings into the PAR light and UV-B+/- conditions of the growth chamber, we 260
observed a decrease in Fv/Fm in UV+ and UV- seedlings compared to GH plants (P<0.001; 261
Fig. 2A), while GH plants retained Fv/Fm values >0.8 for the duration of the experiment. By 262
Day 2 of the experiment (i.e. 48 hrs after transfer), Fv/Fm of our UV+ plants, which were 263
exposed to supplementary UV-B radiation (10 kJ m-2 day-1), was a little further reduced 264
compared to UV- plants (P=0.08; Fig. 2A), but Fv/Fm values recovered quickly in UV+ 265
plants, and by Day 6 of the experiment, both UV+/- plants were exhibiting values of 0.78, 266
which was still reduced compared to GH plants (GH=0.83; P<0.001; Fig. 2A). Over the 267
course of the transfer phase of the experiment, net photosynthesis in UV+ plants was 268
increased compared to UV- plants (Fig. 2B; P<0.001), and photosynthetic rate was also 269
increased in UV- plants compared to GH plants (Fig. 2B; P<0.001). There was some 270
variation between experimental iteration (Repeated measures for experiment factor: 271
P<0.001), yet photosynthetic rate increased in UV+ plants during the duration of the 272
transfer phase, less so in UV- plants; UV+ photosynthetic rates were still significantly 273
higher than those of UV- and GH plants by the end of the experiment on Day 6 (Fig. 2B; 274
P<0.001). In terms of other gas exchange variables, transpiration rate was significantly 275
higher in UV+ plants during the six day transfer phase compared to both UV- and GH 276
plants (Fig. 2D; Repeated measures for treatment factor: P<0.001, Repeated measures for 277
experiment factor: P<0.001), and transpiration rate was also higher in UV+ plants 278
compared to UV- plants on Day 6 of the experiments (Fig. 2D; P<0.001). There were no 279
significant differences in stomatal conductance (Fig. 2E) or internal CO2 values during the 280
six days of the transfer phase, or on any one single day of the experiments (Fig. 2F). In 281
addition to responses related to photosynthetic competency, there were marked increases 282
in UV shielding observed in both UV+ and UV- plants following transfer at Day 0 (Fig. 2C; 283
P<0.001). After just 48 hrs of UV-B exposure, UV+ plants were experiencing higher UV 284 Acc
epte
d A
rticl
e
This article is protected by copyright. All rights reserved.
shielding than UV- plants (Fig. 2C; P<0.001), and by the end of the transfer phase, % 285
shielding values were 75%, 57% and 3% for UV+, UV-, and GH plants respectively (Fig 286
2C; P<0.001). 287
288
Leaf metabolomic responses involve acclimation to visible light & UV-B radiation 289
In order to investigate the acclimation of plants to UV-B at a metabolomic level, foliar 290
material was snap frozen at D0 and D6 of the transfer phase of the study, according to 291
treatment, and was subjected to metabolomic investigation via LC-QTOF-HRMS. Our 292
metabolomic approach quantified >1300 discrete molecular features across our sample 293
pool in L. sativa seedlings, irrespective of treatment (Supplementary File Appendix 1). 294
Those discrete molecular features were then submitted to PCA analysis for identification of 295
treatment-dependent differences prior to further investigation. To initially screen for 296
metabolites that may differ between treatments, the t-test function in ProfileAnalysis was 297
used, and metabolites that had a fold change of greater than 1.5 with a P<0.05 were 298
considered for further investigation. Molecular features are listed according to treatment 299
comparison and p-value results in Supplementary File Appendix 1. Analysis by standard t-300
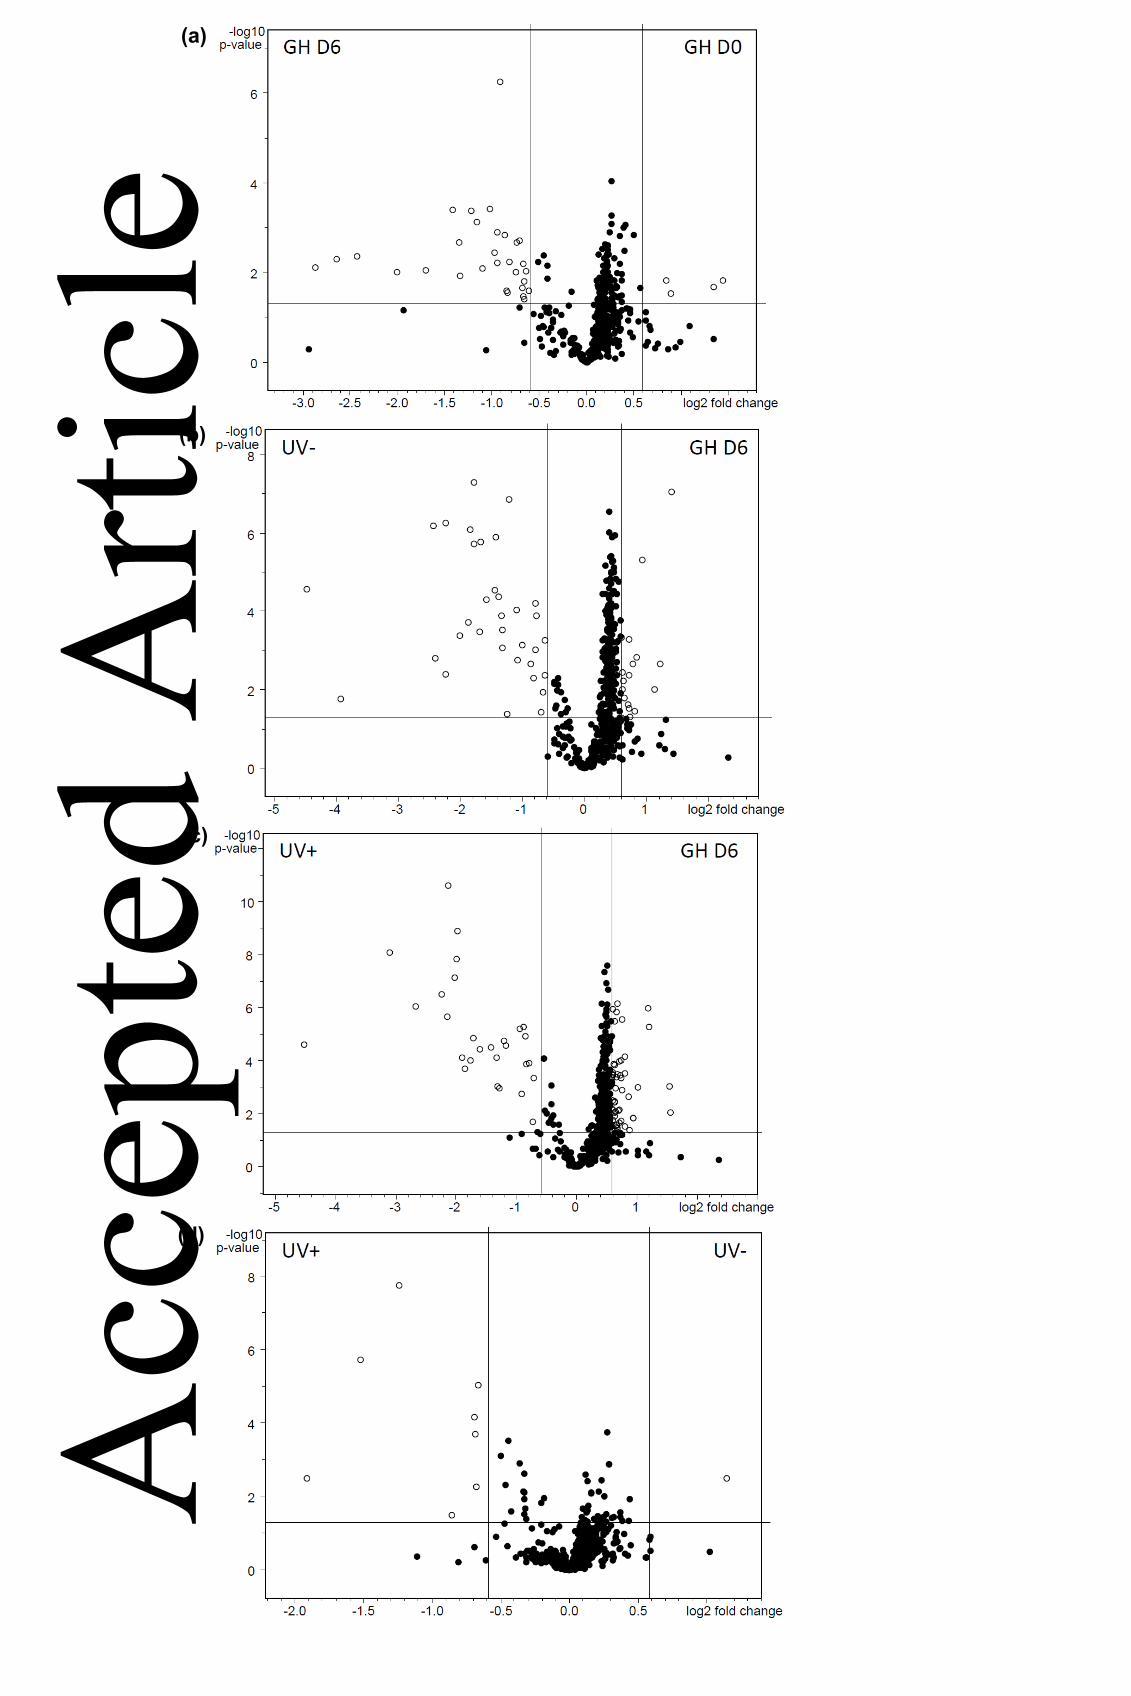
test revealed numbers of molecular features were subject to significant fold-change 301
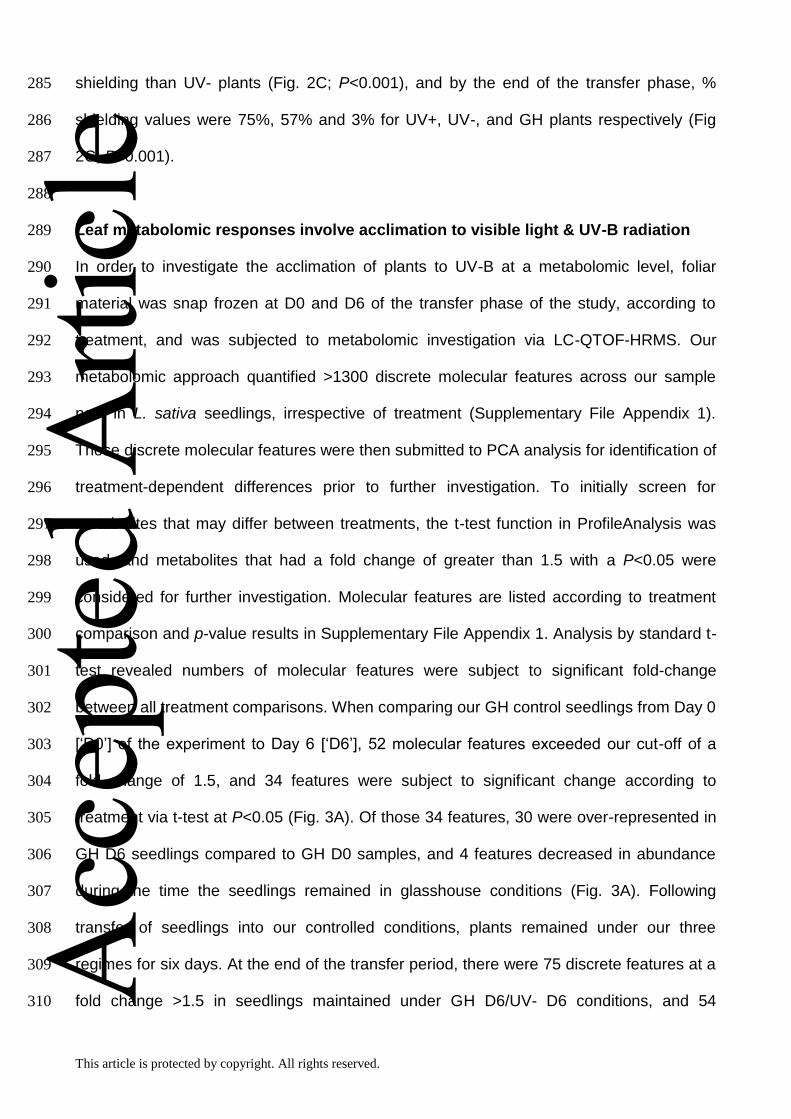
between all treatment comparisons. When comparing our GH control seedlings from Day 0 302
[‘D0’] of the experiment to Day 6 [‘D6’], 52 molecular features exceeded our cut-off of a 303
fold change of 1.5, and 34 features were subject to significant change according to 304
treatment via t-test at P<0.05 (Fig. 3A). Of those 34 features, 30 were over-represented in 305
GH D6 seedlings compared to GH D0 samples, and 4 features decreased in abundance 306
during the time the seedlings remained in glasshouse conditions (Fig. 3A). Following 307
transfer of seedlings into our controlled conditions, plants remained under our three 308
regimes for six days. At the end of the transfer period, there were 75 discrete features at a 309
fold change >1.5 in seedlings maintained under GH D6/UV- D6 conditions, and 54 310 Acc
epte
d A
rticl
e
This article is protected by copyright. All rights reserved.
features were significantly changed at P<0.05 (Fig. 3B). Of these, 34 features were 311
increased in UV- seedlings, and 20 features were over-represented in GH D6 plants (Fig. 312
3B). When comparing UV treated plants to those maintained in glasshouse conditions 313
during the six day experiment, there were 110 molecular features at a fold change of >1.5 314
[GH D6 vs UV+ D6], and 80 features significantly changed at P<0.05. Within that group, 28 315
features were relatively increased in UV+ D6 plants, and 52 features were increased in GH 316
D6 plants (Fig. 3C). Yet only 4 of those 52 features upregulated in GH D6 plants exceeded 317
a fold change of >2, as compared to 20 out of the 28 features in UV+ plants where fold 318
changes exceeded >2. When metabolites were compared purely on the basis of UV 319
treatment, there were 16 discrete molecular features at a fold change of >1.5 [UV- D6 vs 320
UV+ D6], and 9 features significantly changed at P<0.05. Of those, eight features were 321
over-represented in UV+ plants, as compared to just one feature in UV- plants (Fig. 3D). 322
Following this preliminary analysis, molecular features which were significantly 323
over-represented according to treatment comparison were filtered again to exclude those 324
features indistinguishable from signal noise. Accurate masses and retention times were 325
then used to obtain peak areas from exact ion chromatograms (EICs) for each metabolite. 326
We then undertook an identification procedure, based on assigning accurate masses to 327
elemental composition and thus elucidating molecular formulae. An emphasis was placed 328
on profiling compounds where an LC-QTOF-HRMS signal was detected for the majority or 329
preferably all replicate samples. Following this filtering and formulae assignment 330
procedure, ten metabolites were remaining in our pool for detailed examination (Table 1). 331
Nomenclature approaches were then carried out for those ten compounds, using the 332
database resource ChemSpider (www.ChemSpider.com), resulting in common names 333
being assigned to six of our ten metabolites (Table 1). There were clear fold increases in 334
the abundance of the majority of the metabolites when comparing Day 0 and GH D6 plants 335
with those transferred into UV- and UV+ conditions (Table 1), with the exception of 336 Acc
epte
d A
rticl
e
This article is protected by copyright. All rights reserved.
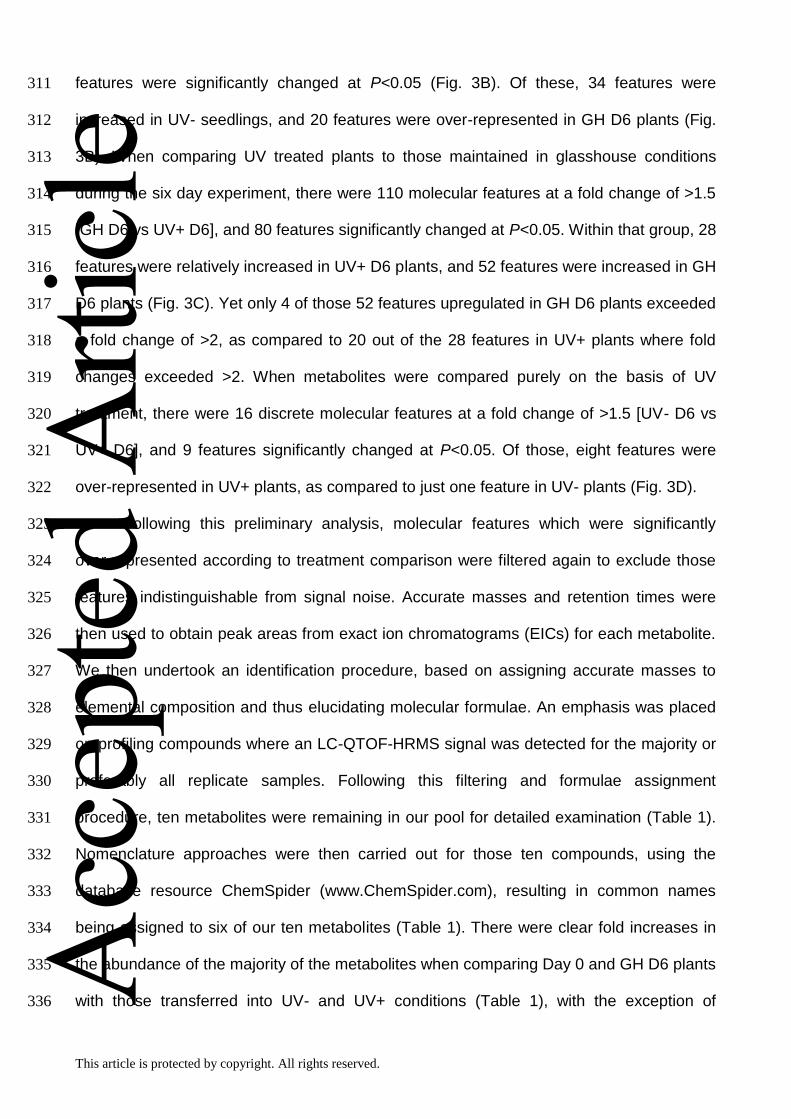
C22H18O11 and C41H72O9, where there was far less difference between GH D6 seedlings 337
and UV- /UV+ plants. In order to quantitatively examine the differences between the 338
effects of treatments by the end of the experiment [Day 6], replicate data from each 339
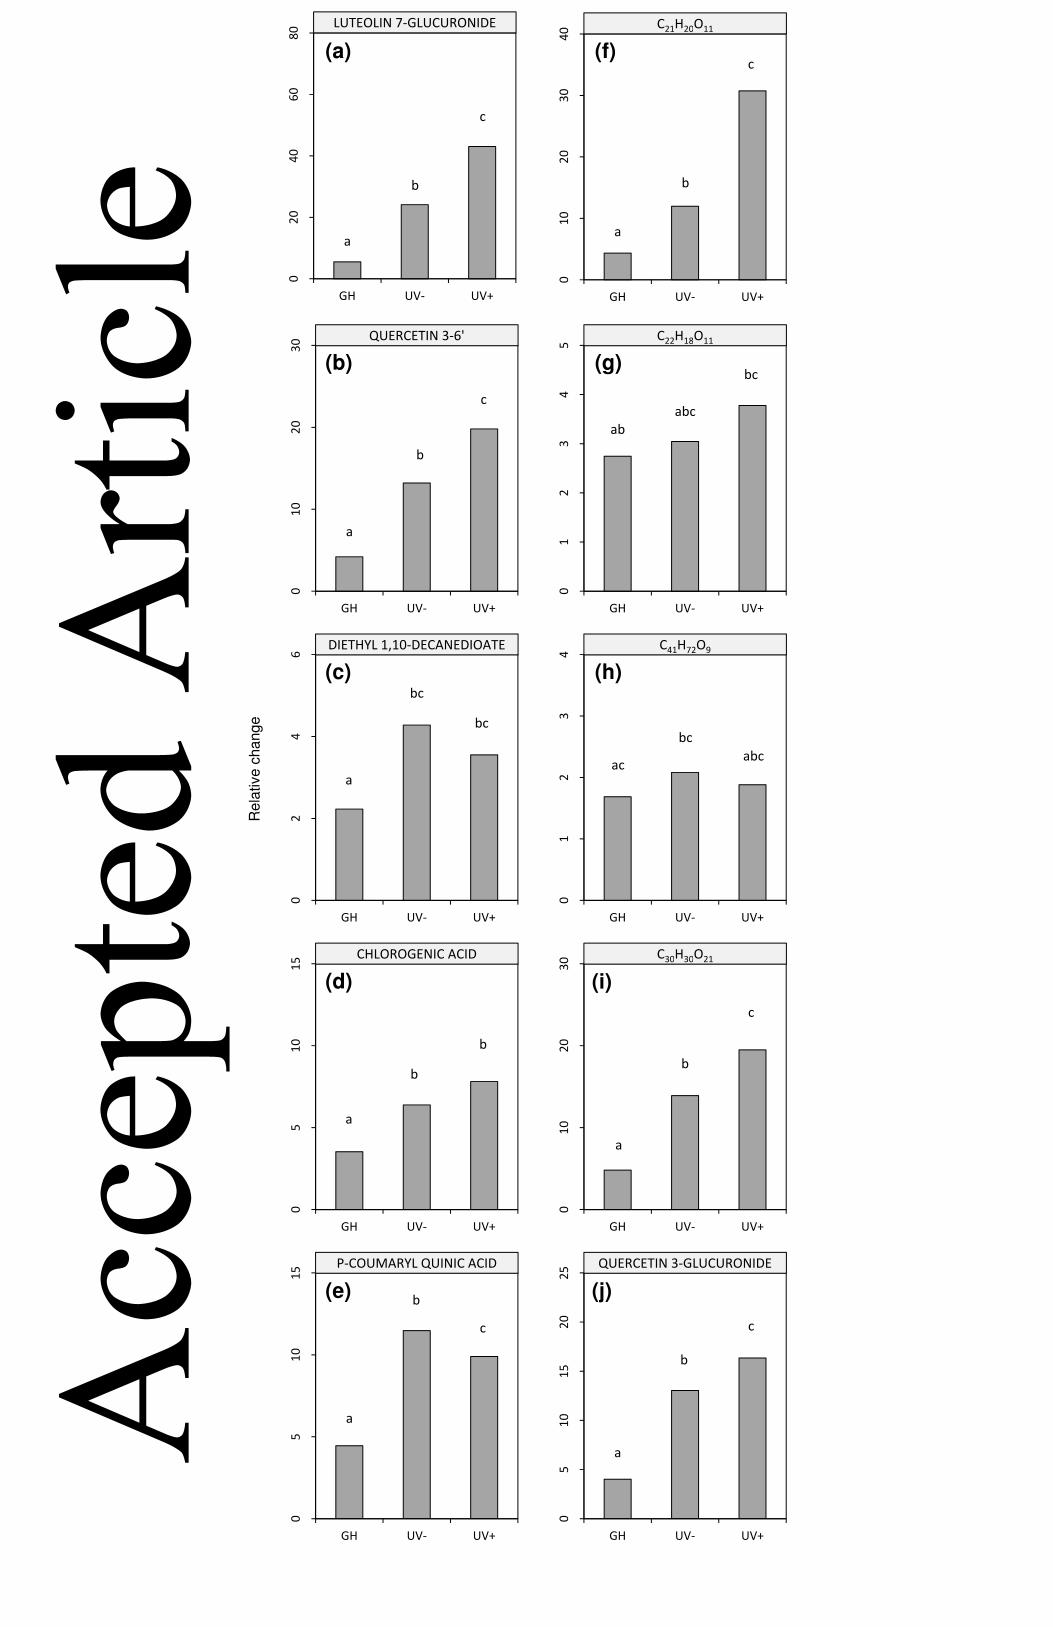
treatment were compared using one-way ANOVA (p-values are presented in Fig. 4). In 340
terms of responses to the UV-B treatment, there were significant increases in luteolin 7-341
glucuronide (Fig. 4A), quercetin 3-(6''-malonyl-glucoside) (Fig. 4B), and quercetin 3-342
glucuronide (Fig. 4J), in addition to the unnamed compounds C21H20O11 (Fig. 4F) and 343
C30H30O21 (Fig. 4I). Intriguingly, the unnamed C21H20O11 exhibited the largest fold change 344
in UV+ plants compared to the UV- treatment, and GH treatments. In comparison, two of 345
our final pool of metabolites were significantly elevated on the basis of the controlled 346
conditions (i.e. UV+/UV-) vs the glasshouse regime. These included diethyl 1,10-347
decanedioate (Fig. 4C), and chlorogenic acid (Fig. 4D). Only one of the compounds in the 348
pool was significantly increased in UV- plants compared to UV+ plants and GH plants; p-349
coumaryl quinic acid (Fig. 4E). The two unnamed compounds C22H18O11 (Fig. 4G) and 350
C41H72O9 (Fig. 4H) made large contributions to the overall metabolite pool in L. sativa 351
seedlings, but were not significantly different in terms of treatment effects. Both of these 352
compounds were elevated in all Day 6 samples compared to our Day 0 starting point. The 353
relative difference in the total sum of all peak areas for our metabolite pool at Day 6 354
between UV- and UV+ plants was 21% (Table 1), which compares closely to the 18% 355
difference in UV shielding values observed between UV- and UV+ plants by Day 6 of the 356
experiment (Fig. 2C). 357
358
DISCUSSION 359
Previously, we showed that realistic levels of UV-B radiation can potentially up-regulate 360
photosynthetic performance in an important vegetable species, and that such responses 361
may be linked to photoprotective processes when plants are challenged with high PAR 362 Acc
epte
d A
rticl
e
This article is protected by copyright. All rights reserved.
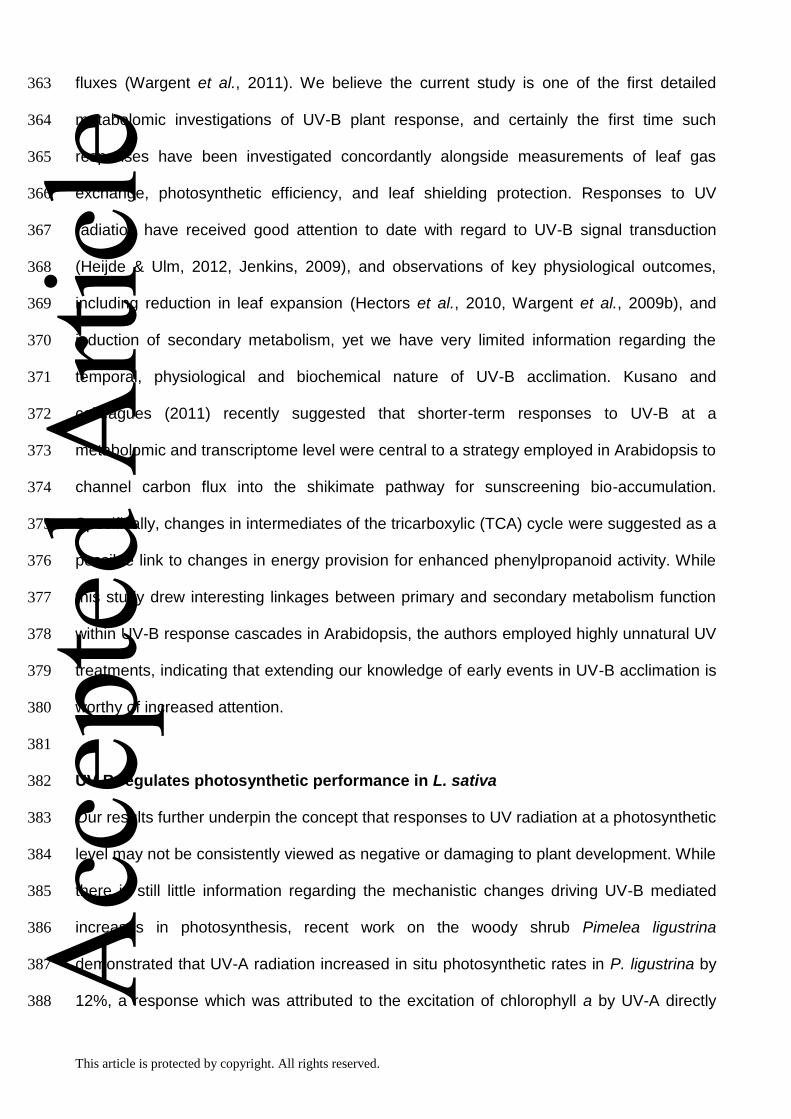
fluxes (Wargent et al., 2011). We believe the current study is one of the first detailed 363
metabolomic investigations of UV-B plant response, and certainly the first time such 364
responses have been investigated concordantly alongside measurements of leaf gas 365
exchange, photosynthetic efficiency, and leaf shielding protection. Responses to UV 366
radiation have received good attention to date with regard to UV-B signal transduction 367
(Heijde & Ulm, 2012, Jenkins, 2009), and observations of key physiological outcomes, 368
including reduction in leaf expansion (Hectors et al., 2010, Wargent et al., 2009b), and 369
induction of secondary metabolism, yet we have very limited information regarding the 370
temporal, physiological and biochemical nature of UV-B acclimation. Kusano and 371
colleagues (2011) recently suggested that shorter-term responses to UV-B at a 372
metabolomic and transcriptome level were central to a strategy employed in Arabidopsis to 373
channel carbon flux into the shikimate pathway for sunscreening bio-accumulation. 374
Specifically, changes in intermediates of the tricarboxylic (TCA) cycle were suggested as a 375
possible link to changes in energy provision for enhanced phenylpropanoid activity. While 376
this study drew interesting linkages between primary and secondary metabolism function 377
within UV-B response cascades in Arabidopsis, the authors employed highly unnatural UV 378
treatments, indicating that extending our knowledge of early events in UV-B acclimation is 379
worthy of increased attention. 380
381
UV-B regulates photosynthetic performance in L. sativa 382
Our results further underpin the concept that responses to UV radiation at a photosynthetic 383
level may not be consistently viewed as negative or damaging to plant development. While 384
there is still little information regarding the mechanistic changes driving UV-B mediated 385
increases in photosynthesis, recent work on the woody shrub Pimelea ligustrina 386
demonstrated that UV-A radiation increased in situ photosynthetic rates in P. ligustrina by 387
12%, a response which was attributed to the excitation of chlorophyll a by UV-A directly 388 Acc
epte
d A
rticl
e
This article is protected by copyright. All rights reserved.
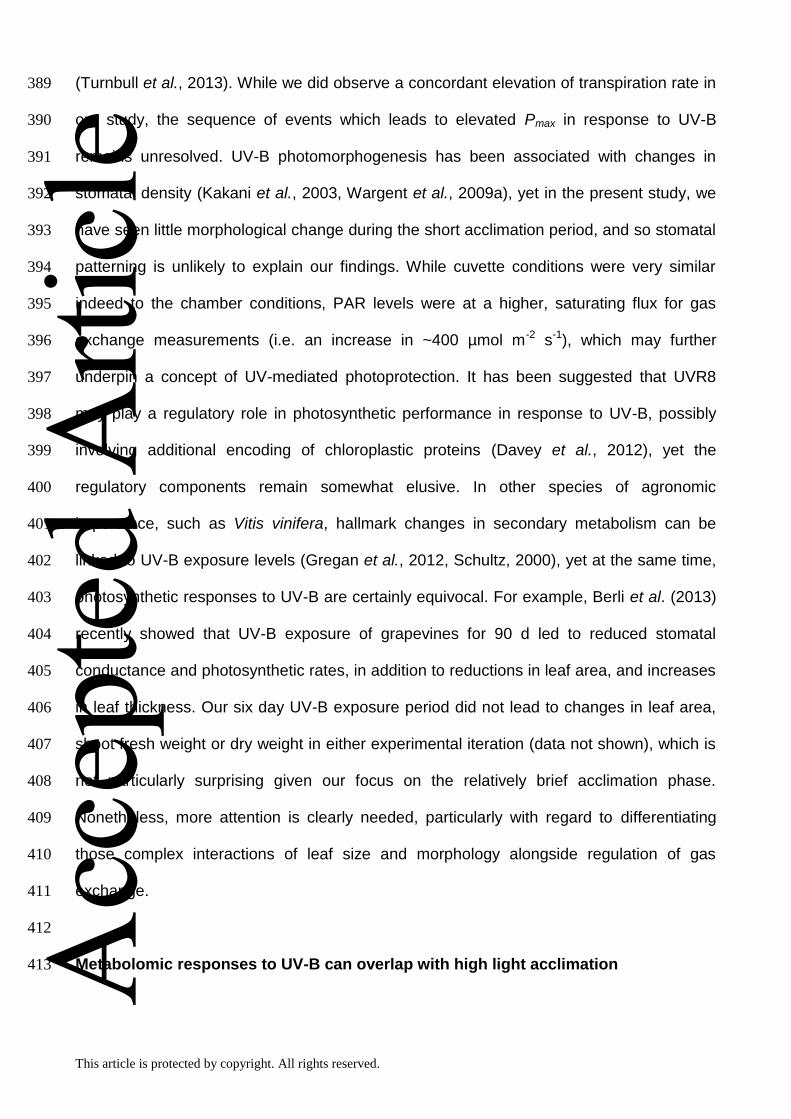
(Turnbull et al., 2013). While we did observe a concordant elevation of transpiration rate in 389
our study, the sequence of events which leads to elevated Pmax in response to UV-B 390
remains unresolved. UV-B photomorphogenesis has been associated with changes in 391
stomatal density (Kakani et al., 2003, Wargent et al., 2009a), yet in the present study, we 392
have seen little morphological change during the short acclimation period, and so stomatal 393
patterning is unlikely to explain our findings. While cuvette conditions were very similar 394
indeed to the chamber conditions, PAR levels were at a higher, saturating flux for gas 395
exchange measurements (i.e. an increase in ~400 µmol m-2 s-1), which may further 396
underpin a concept of UV-mediated photoprotection. It has been suggested that UVR8 397
may play a regulatory role in photosynthetic performance in response to UV-B, possibly 398
involving additional encoding of chloroplastic proteins (Davey et al., 2012), yet the 399
regulatory components remain somewhat elusive. In other species of agronomic 400
importance, such as Vitis vinifera, hallmark changes in secondary metabolism can be 401
linked to UV-B exposure levels (Gregan et al., 2012, Schultz, 2000), yet at the same time, 402
photosynthetic responses to UV-B are certainly equivocal. For example, Berli et al. (2013) 403
recently showed that UV-B exposure of grapevines for 90 d led to reduced stomatal 404
conductance and photosynthetic rates, in addition to reductions in leaf area, and increases 405
in leaf thickness. Our six day UV-B exposure period did not lead to changes in leaf area, 406
shoot fresh weight or dry weight in either experimental iteration (data not shown), which is 407
not particularly surprising given our focus on the relatively brief acclimation phase. 408
Nonetheless, more attention is clearly needed, particularly with regard to differentiating 409
those complex interactions of leaf size and morphology alongside regulation of gas 410
exchange. 411
412
Metabolomic responses to UV-B can overlap with high light acclimation 413 Acc
epte
d A
rticl
e
This article is protected by copyright. All rights reserved.
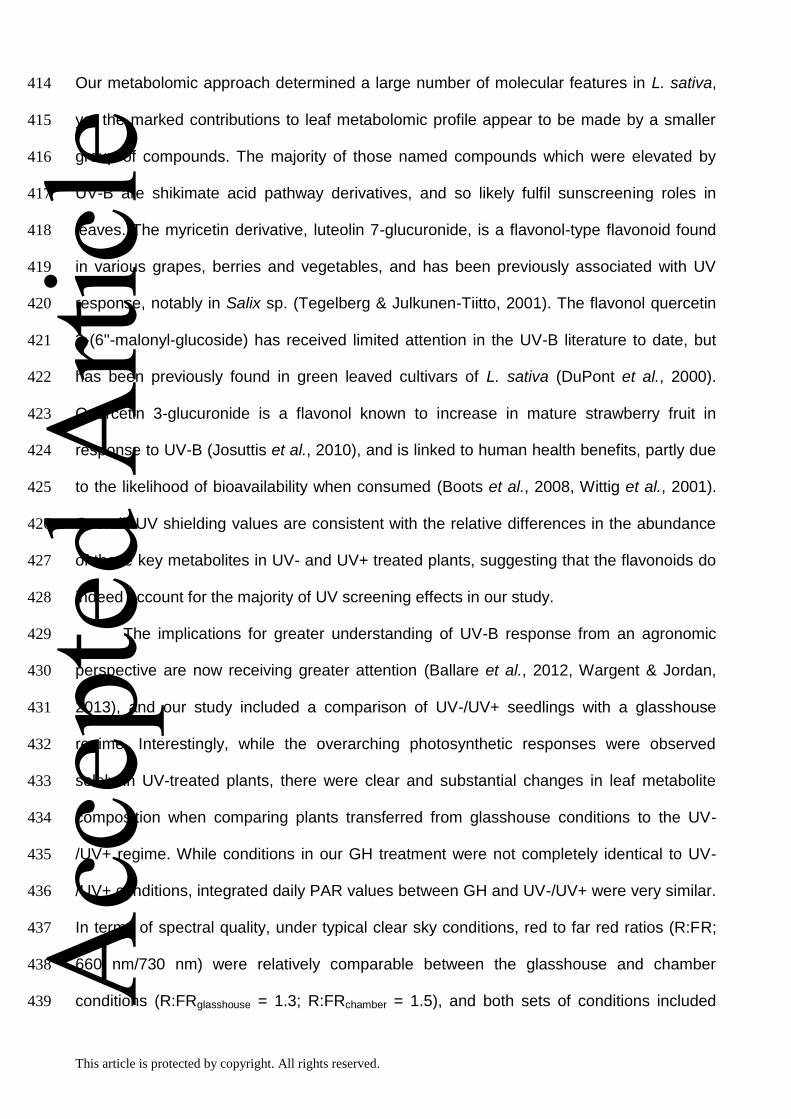
Our metabolomic approach determined a large number of molecular features in L. sativa, 414
yet the marked contributions to leaf metabolomic profile appear to be made by a smaller 415
group of compounds. The majority of those named compounds which were elevated by 416
UV-B are shikimate acid pathway derivatives, and so likely fulfil sunscreening roles in 417
leaves. The myricetin derivative, luteolin 7-glucuronide, is a flavonol-type flavonoid found 418
in various grapes, berries and vegetables, and has been previously associated with UV 419
response, notably in Salix sp. (Tegelberg & Julkunen-Tiitto, 2001). The flavonol quercetin 420
3-(6''-malonyl-glucoside) has received limited attention in the UV-B literature to date, but 421
has been previously found in green leaved cultivars of L. sativa (DuPont et al., 2000). 422
Quercetin 3-glucuronide is a flavonol known to increase in mature strawberry fruit in 423
response to UV-B (Josuttis et al., 2010), and is linked to human health benefits, partly due 424
to the likelihood of bioavailability when consumed (Boots et al., 2008, Wittig et al., 2001). 425
Overall, UV shielding values are consistent with the relative differences in the abundance 426
of these key metabolites in UV- and UV+ treated plants, suggesting that the flavonoids do 427
indeed account for the majority of UV screening effects in our study. 428
The implications for greater understanding of UV-B response from an agronomic 429
perspective are now receiving greater attention (Ballare et al., 2012, Wargent & Jordan, 430
2013), and our study included a comparison of UV-/UV+ seedlings with a glasshouse 431
regime. Interestingly, while the overarching photosynthetic responses were observed 432
solely in UV-treated plants, there were clear and substantial changes in leaf metabolite 433
composition when comparing plants transferred from glasshouse conditions to the UV-434
/UV+ regime. While conditions in our GH treatment were not completely identical to UV-435
/UV+ conditions, integrated daily PAR values between GH and UV-/UV+ were very similar. 436
In terms of spectral quality, under typical clear sky conditions, red to far red ratios (R:FR; 437
660 nm/730 nm) were relatively comparable between the glasshouse and chamber 438
conditions (R:FRglasshouse = 1.3; R:FRchamber = 1.5), and both sets of conditions included 439 Acc
epte
d A
rticl
e
This article is protected by copyright. All rights reserved.
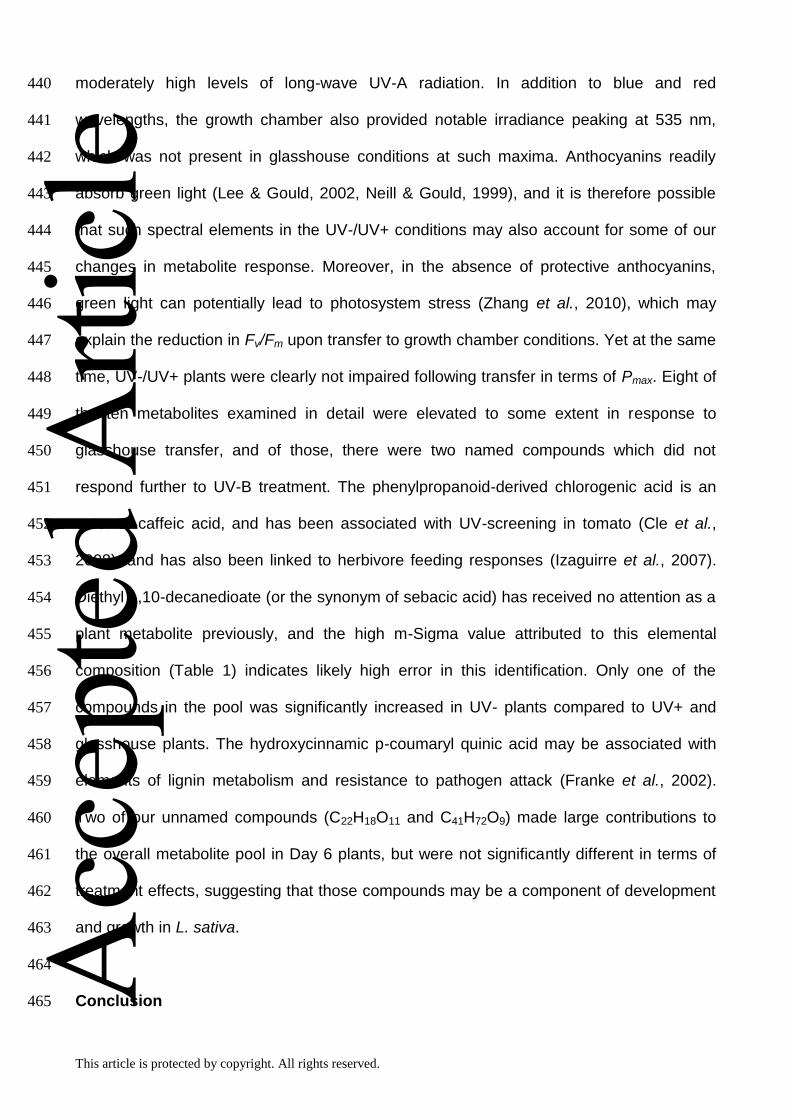
moderately high levels of long-wave UV-A radiation. In addition to blue and red 440
wavelengths, the growth chamber also provided notable irradiance peaking at 535 nm, 441
which was not present in glasshouse conditions at such maxima. Anthocyanins readily 442
absorb green light (Lee & Gould, 2002, Neill & Gould, 1999), and it is therefore possible 443
that such spectral elements in the UV-/UV+ conditions may also account for some of our 444
changes in metabolite response. Moreover, in the absence of protective anthocyanins, 445
green light can potentially lead to photosystem stress (Zhang et al., 2010), which may 446
explain the reduction in Fv/Fm upon transfer to growth chamber conditions. Yet at the same 447
time, UV-/UV+ plants were clearly not impaired following transfer in terms of Pmax. Eight of 448
the ten metabolites examined in detail were elevated to some extent in response to 449
glasshouse transfer, and of those, there were two named compounds which did not 450
respond further to UV-B treatment. The phenylpropanoid-derived chlorogenic acid is an 451
ester of caffeic acid, and has been associated with UV-screening in tomato (Cle et al., 452
2008), and has also been linked to herbivore feeding responses (Izaguirre et al., 2007). 453
Diethyl 1,10-decanedioate (or the synonym of sebacic acid) has received no attention as a 454
plant metabolite previously, and the high m-Sigma value attributed to this elemental 455
composition (Table 1) indicates likely high error in this identification. Only one of the 456
compounds in the pool was significantly increased in UV- plants compared to UV+ and 457
glasshouse plants. The hydroxycinnamic p-coumaryl quinic acid may be associated with 458
elements of lignin metabolism and resistance to pathogen attack (Franke et al., 2002). 459
Two of our unnamed compounds (C22H18O11 and C41H72O9) made large contributions to 460
the overall metabolite pool in Day 6 plants, but were not significantly different in terms of 461
treatment effects, suggesting that those compounds may be a component of development 462
and growth in L. sativa. 463
464
Conclusion 465 Acc
epte
d A
rticl
e
This article is protected by copyright. All rights reserved.
Overall, our results indicate that those secondary compounds responsible for the 466
acclimation response to UV-B partly share a role in acclimating to changes in the PAR 467
environment. This conclusion adds support to the concept that large discrete pools of 468
metabolites may not be mobilized in response to environmental cues such as UV radiation, 469
but rather that compounds may be multi-purpose in nature. In a recent field survey of UV 470
shielding in response to differing UV and PAR conditions, overall PAR levels were seen as 471
the main determinant of UV shielding levels as compared to effects attributable to UV 472
radiation alone (Barnes et al., 2013). At the same time, the authors observed that both UV-473
A and UV-B were required for maximal sun acclimation in previously unexposed leaves. 474
Certainly, dynamic control of secondary metabolism in response to environmental factors 475
and plant productivity levels would provide an efficient strategy for plants, and while 476
plasticity of metabolite biosynthesis and availability is evident in those systems studies to 477
date (Vogt, 2010), more integrated understanding of plant UV-B response is needed. From 478
an agricultural perspective, many vegetable crops are initially cultivated within indoor 479
environments, or are transplanted outside following young growth indoors. Understanding 480
UV-B acclimation can arguably provide greater prediction of plant responses to sudden 481
sunlight exposure, or the ability to induce desired responses for food production. In 482
conclusion, our findings support the new paradigm of agronomically exploitative benefits 483
related to UV-B plant response, and offers a new sequence of physiological and metabolic 484
change driven by UV-B in young unexposed plants. This suggests that an as-yet 485
unidentified mechanism rapidly promotes photosynthetic performance following UV-B 486
exposure, and it could be speculated that increased availability of resources may then be 487
used for metabolite synthesis and subsequent UV-B acclimation. Future investigation of 488
this chain of events could offer further mechanistic understanding of UV-B 489
photomorphogenesis, and provide markers for enhanced food crop stress resilience and 490
productivity. 491 Acc
epte
d A
rticl
e
This article is protected by copyright. All rights reserved.
492
493
ACKNOWLEDGEMENTS 494
We are grateful to the Institute of Agriculture and Environment, Massey University, for 495
sponsoring this work with a summer scholarship to B.C.W.N., and to the Massey 496
University Research Fund for an award to J.J.W. Support to P.W.B. was provided by the 497
J.H. Mullahy Endowment in Environmental Biology at Loyola University New Orleans. We 498
also thank two anonymous referees for their constructive comments on our manuscript. 499
500
REFERENCES 501
Allen D.J., McKee I.F., Farage P.K. & Baker N.R. (1997) Analysis of limitations to CO2 502
assimilation on exposure of leaves of two Brassica napus cultivars to UV-B. Plant 503
Cell and Environment, 20, 633-640. 504
Ballare C.L., Mazza C.A., Austin A.T. & Pierik R. (2012) Canopy light and plant health. 505
Plant Physiology, 160, 145-155. 506
Barnes P.W., Flint S.D., Slusser J.R., Gao W. & Ryel R.J. (2008) Diurnal changes in 507
epidermal UV transmittance of plants in naturally high UV environments. 508
Physiologia Plantarum, 133, 363-372. 509
Barnes P.W., Kersting A.R., Flint S.D., Beyschlag W. & Ryel R.J. (2013) Adjustments in 510
epidermal UV-transmittance of leaves in sun-shade transitions. Physiologia 511
Plantarum, 149, 200-213. 512
Bassman J.H. (2004) Ecosystem consequences of enhanced solar ultraviolet radiation: 513
Secondary plant metabolites as mediators of multiple trophic interactions in 514
terrestrial plant communities. Photochemistry and Photobiology, 79, 382-398. 515 Acc
epte
d A
rticl
e
This article is protected by copyright. All rights reserved.
Berli F.J., Alonso R., Bressan-Smith R. & Bottini R. (2013) UV-B impairs growth and gas 516
exchange in grapevines grown in high altitude. Physiologia Plantarum, 149, 127-517
140. 518
Bolink E.M., van Schalkwijk I., Posthumus F. & van Hasselt P.R. (2001) Growth under UV-519
B radiation increases tolerance to high-light stress in pea and bean plants. Plant 520
Ecology, 154, 149-156. 521
Boots A.W., Haenen G. & Bast A. (2008) Health effects of quercetin: From antioxidant to 522
nutraceutical. European Journal of Pharmacology, 585, 325-337. 523
Bornman J.F. & Vogelmann T.C. (1991) Effect of UV-B radiation on leaf optical-properties 524
measured with fiber optics. Journal of Experimental Botany, 42, 547-554. 525
Briggs W.R. & Christie J.M. (2002) Phototropins 1 and 2: versatile plant blue-light 526
receptors. Trends in Plant Science, 7, 204-210. 527
Brown B.A., Cloix C., Jiang G.H., Kaiserli E., Herzyk P., Kliebenstein D.J. & Jenkins G.I. 528
(2005) A UV-B-specific signaling component orchestrates plant UV protection. 529
Proceedings of the National Academy of Sciences of the United States of America, 530
102, 18225-18230. 531
Caldwell M.M. (1971) Solar UV radiation and the growth and development of higher plants. 532
Academic Press, New York. 533
Christie J.M., Arvai A.S., Baxter K.J., Heilmann M., Pratt A.J., O'Hara A., Kelly S.M., 534
Hothorn M., Smith B.O., Hitomi K., Jenkins G.I. & Getzoff E.D. (2012) Plant UVR8 535
photoreceptor senses UV-B by tryptophan-mediated disruption of cross-dimer salt 536
bridges. Science, 335, 1492-1496. 537
Cle C., Hill L.M., Niggeweg R., Martin C.R., Guisez Y., Prinsen E. & Jansen M.A.K. (2008) 538
Modulation of chlorogenic acid biosynthesis in Solanum lycopersicum; 539
consequences for phenolic accumulation and UV-tolerance. Phytochemistry, 69, 540
2149-2156. 541 Acc
epte
d A
rticl
e
This article is protected by copyright. All rights reserved.
Davey M.P., Susanti N.I., Wargent J.J., Findlay J.E., Quick W.P., Paul N.D. & Jenkins G.I. 542
(2012) The UV-B photoreceptor UVR8 promotes photosynthetic efficiency in 543
Arabidopsis thaliana exposed to elevated levels of UV-B. Photosynthesis Research, 544
114, 121-131. 545
Day T.A., Martin G. & Vogelmann T.C. (1993) Penetration of UV-B radiation in foliage - 546
evidence that the epidermis behaves as a nonuniform Filter. Plant Cell and 547
Environment, 16, 735-741. 548
Demkura P.V. & Ballare C.L. (2012) UVR8 mediates UV-B-induced Arabidopsis defense 549
responses against Botrytis cinerea by controlling sinapate accumulation. Molecular 550
Plant, 5, 642-652. 551
DuPont M.S., Mondin Z., Williamson G. & Price K.R. (2000) Effect of variety, processing, 552
and storage on the flavonoid glycoside content and composition of lettuce and 553
endive. Journal of Agricultural and Food Chemistry, 48, 3957-3964. 554
Favory J.J., Stec A., Gruber H., Rizzini L., Oravecz A., Funk M., Albert A., Cloix C., 555
Jenkins G.I., Oakeley E.J., Seidlitz H.K., Nagy F. & Ulm R. (2009) Interaction of 556
COP1 and UVR8 regulates UV-B-induced photomorphogenesis and stress 557
acclimation in Arabidopsis. Embo Journal, 28, 591-601. 558
Franke R., Hemm M.R., Denault J.W., Ruegger M.O., Humphreys J.M. & Chapple C. 559
(2002) Changes in secondary metabolism and deposition of an unusual lignin in the 560
ref8 mutant of Arabidopsis. Plant Journal, 30, 47-59. 561
Franklin K.A. & Whitelam G.C. (2004) Light signals, phytochromes and cross-talk with 562
other environmental cues. Journal of Experimental Botany, 55, 271-276. 563
Frohnmeyer H. (1999) In or out - photoreceptors in motion. Trends in Plant Science, 4, 564
294-295. 565
Gregan S.M., Wargent J.J., Liu L., Shinkle J., Hofmann R., Winefield C., Trought M. & 566
Jordan B. (2012) Effects of solar ultraviolet radiation and canopy manipulation on 567 Acc
epte
d A
rticl
e
This article is protected by copyright. All rights reserved.
the biochemical composition of Sauvignon Blanc grapes. Australian Journal of 568
Grape and Wine Research, 18, 227-238. 569
Hakala-Yatkin M., Mantysaari M., Mattila H. & Tyystjarvi E. (2010) Contributions of visible 570
and ultraviolet parts of sunlight to photoinhibition. Plant and Cell Physiology, 51, 571
1745-1753. 572
Hectors K., Jacques E., Prinsen E., Guisez Y., Verbelen J.P., Jansen M.A.K. & Vissenberg 573
K. (2010) UV radiation reduces epidermal cell expansion in leaves of Arabidopsis 574
thaliana. Journal of Experimental Botany, 61, 4339-4349. 575
Heijde M. & Ulm R. (2012) UV-B photoreceptor-mediated signalling in plants. Trends in 576
Plant Science, 17, 230-237. 577
Hideg É., Jansen M.A.K. & Strid Å. (2012) UV-B exposure, ROS, and stress: inseparable 578
companions or loosely linked associates? Trends in Plant Science. 579
Izaguirre M.M., Mazza C.A., Svatos A., Baldwin I.T. & Ballare C.L. (2007) Solar ultraviolet-580
B radiation and insect herbivory trigger partially overlapping phenolic responses in 581
Nicotiana attenuata and Nicotiana longiflora. Annals of Botany, 99, 103-109. 582
Jansen M.A.K., Hectors K., O'Brien N.M., Guisez Y. & Potters G. (2008) Plant stress and 583
human health: Do human consumers benefit from UV-B acclimated crops? Plant 584
Science, 175, 449-458. 585
Jenkins G.I. (2009) Signal transduction in responses to UV-B radiation. Annual Review of 586
Plant Biology, 60, 407-431. 587
Jenkins G.I., Brown, B.A. (2007) UV-B perception and signal transduction. Blackwell 588
Publishing, Oxford. 589
Jordan B.R. (1996) The effects of ultraviolet-B radiation on plants: A molecular 590
perspective. In: Advances in Botanical Research, Vol 22: Incorporating Advances in 591
Plant Pathology (ed J.A. Callow), pp. 97-162. 592 Acc
epte
d A
rticl
e
This article is protected by copyright. All rights reserved.
Josuttis M., Dietrich H., Treutter D., Will F., Linnemannstons L. & Kruger E. (2010) Solar 593
UVB response of bioactives in strawberry (Fragaria x ananassa Duch. L.): A 594
comparison of protected and open-field cultivation. Journal of Agricultural and Food 595
Chemistry, 58, 12692-12702. 596
Kakani V.G., Reddy K.R., Zhao D. & Mohammed A.R. (2003) Effects of ultraviolet-B 597
radiation on cotton (Gossypium hirsutum L.) morphology and anatomy. Annals of 598
Botany, 91, 817-826. 599
Kolb C.A., Schreiber U., Gademann R. & Pfundel E.E. (2005) UV-A screening in plants 600
determined using a new portable fluorimeter. Photosynthetica, 43, 371-377. 601
Kusano M., Tohge T., Fukushima A., Kobayashi M., Hayashi N., Otsuki H., Kondou Y., 602
Goto H., Kawashima M., Matsuda F., Niida R., Matsui M., Saito K. & Fernie A.R. 603
(2011) Metabolomics reveals comprehensive reprogramming involving two 604
independent metabolic responses of Arabidopsis to UV-B light. Plant Journal, 67, 605
354-369. 606
Lee D.W. & Gould K.S. (2002) Why leaves turn red: pigments called anthocyanins 607
probably protect leaves from light damage by direct shielding and by scavenging 608
free radicals, American Scientist, 90, 524–531. 609
Mackerness S.A.H., Surplus S.L., Jordan B.R. & Thomas B. (1998) Effects of 610
supplementary ultraviolet-B radiation on photosynthetic transcripts af different 611
stages of leaf development and light levels in pea (Pisum sativum L.: Role of active 612
oxygen species and antioxidant enzymes. Photochemistry and Photobiology, 68, 613
88-96. 614
Morales L.O., Brosché M., Vainonen J., Jenkins G.I., Wargent J.J., Sipari N., Strid Å., 615
Lindfors A.V., Tegelberg R. & Aphalo P.J. (2013) Multiple roles for UV 616
RESISTANCE LOCUS8 in regulating gene expression and metabolite accumulation 617
in Arabidopsis under solar ultraviolet radiation. Plant Physiology, 161, 744-759. 618 Acc
epte
d A
rticl
e
This article is protected by copyright. All rights reserved.
Neill S.O. & Gould K.S. (1999) Optical properties of leaves in relation to anthocyanin 619
concentration and distribution. Canadian Journal of Botany, 77, 1777–1782. 620
Poulson M.E., Donahue R.A., Konvalinka J. & Boeger M.R.T. (2002) Enhanced tolerance 621
of photosynthesis to high-light and drought stress in Pseudotsuga menziesii 622
seedlings grown in ultraviolet-B radiation. Tree Physiology, 22, 829-838. 623
Rizzini L., Favory J.-J., Cloix C., Faggionato D., O'Hara A., Kaiserli E., Baumeister R., 624
Schaefer E., Nagy F., Jenkins G.I. & Ulm R. (2011) Perception of UV-B by the 625
Arabidopsis UVR8 protein. Science, 332, 103-106. 626
Rozema J., Bjorn L.O., Bornman J.F., Gaberscik A., Hader D.P., Trost T., Germ M., Klisch 627
M., Groniger A., Sinha R.P., Lebert M., He Y.Y., Buffoni-Hall R., de Bakker N.V.J., 628
van de Staaij J. & Meijkamp B.B. (2002) The role of UV-B radiation in aquatic and 629
terrestrial ecosystems - an experimental and functional analysis of the evolution of 630
UV-absorbing compounds. Journal of Photochemistry and Photobiology B-Biology, 631
66, 2-12. 632
Schultz H.R. (2000) Climate change and viticulture: a European perspective on 633
climatology, carbon dioxide and UV-B effects. Australian Journal of Grape and Wine 634
Research, 6, 2-12. 635
Stracke R., Favory J.J., Gruber H., Bartelniewoehner L., Bartels S., Binkert M., Funk M., 636
Weisshaar B. & Ulm R. (2010) The Arabidopsis bZIP transcription factor HY5 637
regulates expression of the PFG1/MYB12 gene in response to light and ultraviolet-B 638
radiation. Plant Cell and Environment, 33, 88-103. 639
Takahashi S., Milward S.E., Yamori W., Evans J.R., Hillier W. & Badger M.R. (2010) The 640
solar action spectrum of Photosystem II Damage. Plant Physiology, 153, 988-993. 641
Tegelberg R. & Julkunen-Tiitto R. (2001) Quantitative changes in secondary metabolites of 642
dark-leaved willow (Salix myrsinifolia) exposed to enhanced ultraviolet-B radiation. 643
Physiologia Plantarum, 113, 541-547. 644 Acc
epte
d A
rticl
e
This article is protected by copyright. All rights reserved.
Turnbull T.L., Barlow A.M. & Adams M.A. (2013) Photosynthetic benefits of ultraviolet-A to 645
Pimelea ligustrina, a woody shrub of sub-alpine Australia. Oecologia, 173, 375-385. 646
Vogt T. (2010) Phenylpropanoid Biosynthesis. Molecular Plant, 3, 2-20. 647
Wargent J.J., Elfadly E.M., Moore J.P. & Paul N.D. (2011) Increased exposure to UV-B 648
radiation during early development leads to enhanced photoprotection and 649
improved long-term performance in Lactuca sativa. Plant Cell and Environment, 34, 650
1401-1413. 651
Wargent J.J., Gegas V.C., Jenkins G.I., Doonan J.H. & Paul N.D. (2009a) UVR8 in 652
Arabidopsis thaliana regulates multiple aspects of cellular differentiation during leaf 653
development in response to ultraviolet B radiation. New Phytologist, 183, 315-326. 654
Wargent J.J. & Jordan B.R. (2013) From ozone depletion to agriculture: understanding the 655
role of UV radiation in sustainable crop production. New Phytologist, 197, 1058-656
1076. 657
Wargent J.J., Moore J.P., Roland Ennos A. & Paul N.D. (2009b) Ultraviolet radiation as a 658
limiting factor in leaf expansion and development. Photochemistry and 659
Photobiology, 85, 279-286. 660
Wittig J., Herderich M., Graefe E.U. & Veit M. (2001) Identification of quercetin 661
glucuronides in human plasma by high-performance liquid chromatography-tandem 662
mass spectrometry. Journal of Chromatography B, 753, 237-243. 663
Xu J.T. & Gao K.S. (2010) UV-A enhanced growth and UV-B induced positive effects in 664
the recovery of photochemical yield in Gracilaria lemaneiformis (Rhodophyta). 665
Journal of Photochemistry and Photobiology B-Biology, 100, 117-122. 666
Zhang, K.M., Yu, H.J., Shi, K., Zhou, Y.H., Yu, J.Q. & Xia, X.J. (2010) Photoprotective 667
roles of anthocyanins in Begonia semperflorens. Plant Science. 179, 202-208. 668
669
670 Acc
epte
d A
rticl
e
This article is protected by copyright. All rights reserved.
671
672
SUPPORTING INFORMATION 673
Appendix 1. Bucket tables for LC-QTOF-HRMS analysis of foliar metabolites. Tables are 674
presented according to each two treatment comparison, fold change according to 675
comparison, t-test values, and signal counts for each replicate seedling sample per 676
treatment. 677
678
679
680
Acc
epte
d A
rticl
e
This article is protected by copyright. All rights reserved.
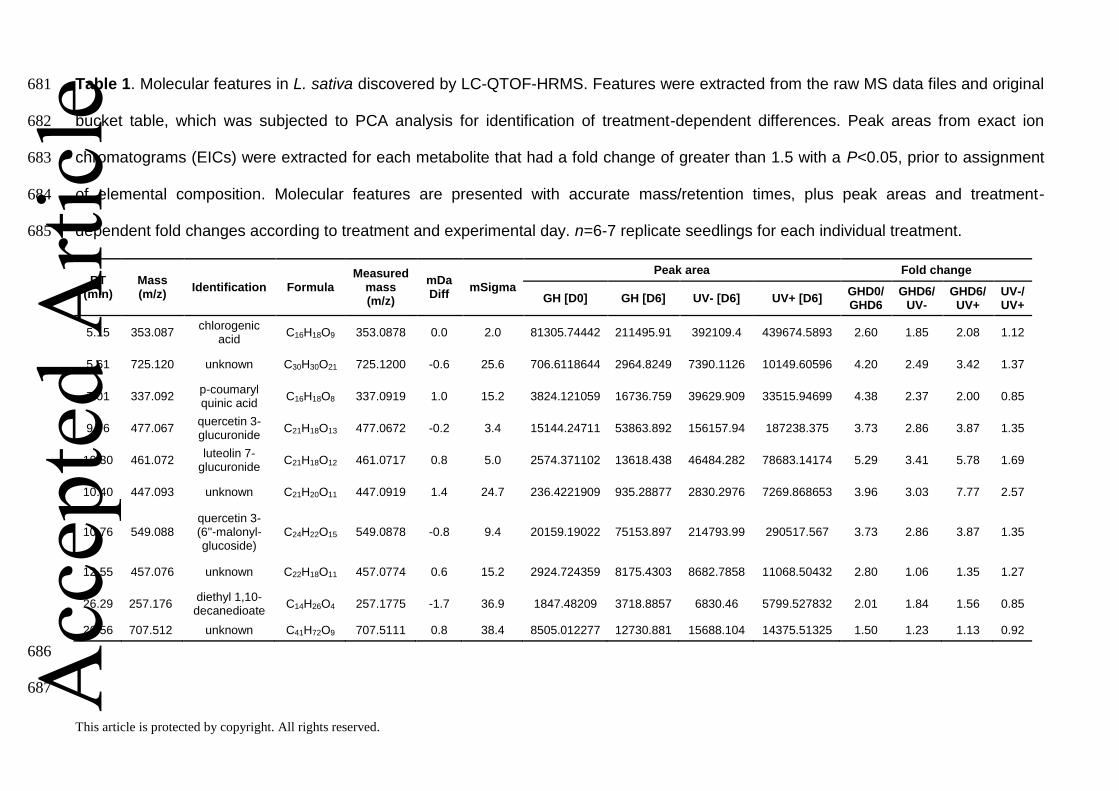
Table 1. Molecular features in L. sativa discovered by LC-QTOF-HRMS. Features were extracted from the raw MS data files and original 681
bucket table, which was subjected to PCA analysis for identification of treatment-dependent differences. Peak areas from exact ion 682
chromatograms (EICs) were extracted for each metabolite that had a fold change of greater than 1.5 with a P<0.05, prior to assignment 683
of elemental composition. Molecular features are presented with accurate mass/retention times, plus peak areas and treatment-684
dependent fold changes according to treatment and experimental day. n=6-7 replicate seedlings for each individual treatment. 685
RT (min)
Mass (m/z)
Identification Formula Measured
mass (m/z)
mDa Diff
mSigma
Peak area Fold change
GH [D0] GH [D6] UV- [D6] UV+ [D6] GHD0/ GHD6
GHD6/ UV-
GHD6/ UV+
UV-/ UV+
5.15 353.087 chlorogenic
acid C16H18O9 353.0878 0.0 2.0 81305.74442 211495.91 392109.4 439674.5893 2.60 1.85 2.08 1.12
5.61 725.120 unknown C30H30O21 725.1200 -0.6 25.6 706.6118644 2964.8249 7390.1126 10149.60596 4.20 2.49 3.42 1.37
7.01 337.092 p-coumaryl quinic acid
C16H18O8 337.0919 1.0 15.2 3824.121059 16736.759 39629.909 33515.94699 4.38 2.37 2.00 0.85
9.76 477.067 quercetin 3-glucuronide
C21H18O13 477.0672 -0.2 3.4 15144.24711 53863.892 156157.94 187238.375 3.73 2.86 3.87 1.35
10.30 461.072 luteolin 7-
glucuronide C21H18O12 461.0717 0.8 5.0 2574.371102 13618.438 46484.282 78683.14174 5.29 3.41 5.78 1.69
10.40 447.093 unknown C21H20O11 447.0919 1.4 24.7 236.4221909 935.28877 2830.2976 7269.868653 3.96 3.03 7.77 2.57
10.76 549.088 quercetin 3-(6''-malonyl-glucoside)
C24H22O15 549.0878 -0.8 9.4 20159.19022 75153.897 214793.99 290517.567 3.73 2.86 3.87 1.35
12.55 457.076 unknown C22H18O11 457.0774 0.6 15.2 2924.724359 8175.4303 8682.7858 11068.50432 2.80 1.06 1.35 1.27
26.29 257.176 diethyl 1,10-decanedioate
C14H26O4 257.1775 -1.7 36.9 1847.48209 3718.8857 6830.46 5799.527832 2.01 1.84 1.56 0.85
26.56 707.512 unknown C41H72O9 707.5111 0.8 38.4 8505.012277 12730.881 15688.104 14375.51325 1.50 1.23 1.13 0.92
686
687 Acc
epte
d A
rticl
e
This article is protected by copyright. All rights reserved.
Figure legends 688
689
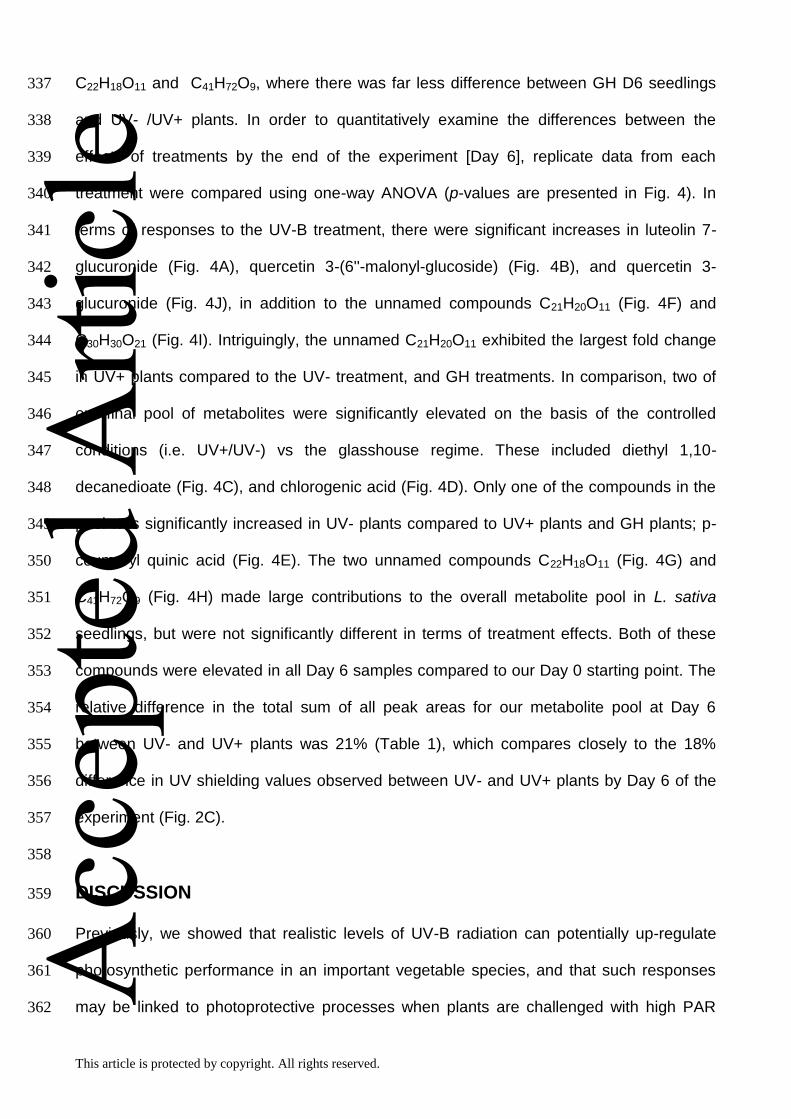
Figure 1. Spectral irradiances of experimental conditions. Irradiance measurements were 690
made with a double-scanning spectroradiometer, and describe visible light spectra (main 691
graph) and the UV region (inset graph). Spectra are labeled according to experimental 692
treatment; UVB+ (‘UV+’; dashed line); UVB- (‘UV-‘; unbroken line); glasshouse (‘GH’; thin 693
line); PAR (visible light spectrum for UV+ and UV- conditions; unbroken line). PAR 694
conditions are described by the unbroken line in the main graph at wavelengths >400 nm 695
only. Glasshouse conditions were measured under clear sky conditions. 696
697
Figure 2. Gas exchange parameters, photosynthetic competency, and UV shielding in L. 698
sativa seedlings. Measurements were taken at timed intervals from the day plants were 699
transferred into UV+/UV- conditions (‘Day 0’) for six days. Plants maintained in glasshouse 700
conditions were also sampled during the transfer phase. UV+, open circles; UV-, open 701
squares; GH (glasshouse), closed circles. (a) Quantum efficiency of Photosystem II, 702
(Fv/Fm); (b) net photosynthesis; (c) UV shielding (SUV); (d) transpiration rate; (e) stomatal 703
conductance; (f) internal CO2 concentration. Values are means of two repeated 704
experiments (n=2) ± 1 S.E., where each measurement point consisted of ten plants per 705
treatment per replicate experiment. Days 3 and 5 were sampled once only in different 706
replicate experiments therefore standard errors are not presented. 707
708
Figure 3. Fold change of metabolomic features according to LC-QTOF-HRMS analysis. 709
Following bucket table extraction, molecular features were submitted to Principle 710
Component Analysis (PCA) in ProfileAnalysis for identification of treatment-dependent 711
differences. Volcano plots show relative fold changes (log2) versus standard t-test p-712
values (log10) between paired treatments; (a) GH (glasshouse) Day0/GH D6; (b) GH 713 Acc
epte
d A
rticl
e
This article is protected by copyright. All rights reserved.
D6/UV- D6; (c) GH D6/UV+ D6; (d) UV- D6/UV+ D6. Metabolites with a fold change 714
greater than 1.5 where P<0.05 are represented by open circles, and labels denote the 715
subject treatment for each comparison. Values are means of 6-7 replicate seedlings for 716
each treatment. 717
718
Figure 4. Metabolites in L. sativa in response to UV-B radiation. Following assignment of 719
elemental compositions, metabolites analysed by LC-QTOF-HRMS were compared using 720
one-way ANOVA on the basis of relative change in metabolite abundance according to 721
treatment. Relative change values are from comparisons of treatment metabolite values to 722
GH D0 seedlings at the start of the experiment. (a) luteolin 7-glucuronide; (b) quercetin 3-723
(6''-malonyl-glucoside); (c) diethyl 1,10-decanedioate; (d) chlorogenic acid; (e) p-coumaryl 724
quinic acid; (f) C21H20O11; (g) C22H18O11; (h) C41H72O9; (i) C30H30O21; (j) quercetin 3-725
glucuronide. Values are means of 6-7 replicate seedlings per treatment, and different 726
letters indicate significance according to Tukey at P<0.05. 727
Acc
epte
d A
rticl
e
0.0
1.0
2.0
3.0
4.0
5.0
6.0
7.0
8.0
9.0
10.0
200 300 400 500 600 700
Irrad
ianc
e (W
m-2
s-1
)
Wavelength (nm)
UVB+UVB-PARGH
0.00
0.10
0.20
0.30
270 300 330 360 390
Acc
epte
d A
rticl
e
0
10
20
30
40
50
60
70
80
90
0 1 2 3 4 5 6 7
UV
shie
ldin
g (%
)
0
1
2
3
4
5
6
7
8
9
10
Net
pht
otsy
nthe
sis
(µm
ol m⁻²
s⁻¹
)
0.65
0.7
0.75
0.8
0.85
0.9
F v/F
m
UV+ UV- GH
(a)
(c)
(b)
150
200
250
300
350
400
0 1 2 3 4 5 6 7
Inte
rnal
CO
2 (pp
m)
0
0.05
0.1
0.15
0.2
0.25
Stom
atal
con
duct
ance
(mol
m-2
s-1
)
0
0.2
0.4
0.6
0.8
1
1.2
Tran
spira
tion
(mol
m-2
s-1
)
(d)
(f)
(e)
Time of treatment (days)
Acc
epte
d A
rticl
e
(c)
(b)
(a)
(d)
Acc
epte
d A
rticl
e
02
04
06
08
0GH UV- UV+
LUTEOLIN 7-GLUCURONIDE
b
c
a
01
02
03
04
0
GH UV- UV+
C21H20O11
b
c
a
01
02
03
0
GH UV- UV+
QUERCETIN 3-6'
b
c
a
01
23
45
GH UV- UV+
C22H18O11
abc
bc
ab
02
46
GH UV- UV+
DIETHYL 1,10-DECANEDIOATE
bc
bc
a
01
23
4
GH UV- UV+
C41H72O9
bc
abcac
05
10
15
GH UV- UV+
CHLOROGENIC ACID
b
b
a
01
02
03
0
GH UV- UV+
C30H30O21
b
c
a
05
10
15
GH UV- UV+
P-COUMARYL QUINIC ACID
b
c
a
05
10
15
20
25
GH UV- UV+
QUERCETIN 3-GLUCURONIDE
b
c
a
Re
lative c
hange
(a)
(b)
(c)
(d)
(e)
(f)
(g)
(h)
(i)
(j)
Acc
epte
d A
rticl
e