Embed Size (px)
Citation preview
918 J. AMER. SOC. HORT. SCI. 130(6):918–927. 2005.
J. AMER. SOC. HORT. SCI. 130(6):918–927. 2005.
Acclimation of Plant Populations to Shade: Photosynthesis, Respiration, and Carbon Use Effi ciencyJonathan M. Frantz1
USDA, ARS, Application Technology Research Unit, 2801 W. Bancroft, Mail Stop 604, Toledo, OH 43606
Bruce BugbeeCrop Physiology Laboratory, Department of Plants, Soils, and Biometeorology, Utah State University, Logan, UT 84322-4820
ADDITIONAL INDEX WORDS. R:P ratio, whole plant CO2 gas-exchange, hydroponics, low light, quantum yield, Lactuca sativa, Lycopersicon esculentum
ABSTRACT. Cloudy days cause an abrupt reduction in daily photosynthetic photon fl ux (PPF), but we have a poor un-derstanding of how plants acclimate to this change. We used a unique 10-chamber, steady-state, gas-exchange system to continuously measure daily photosynthesis and night respiration of populations of a starch accumulator [tomato (Lycopersicon esculentum Mill. cv. Micro-Tina)] and a sucrose accumulator [lettuce (Lactuca sativa L. cv. Grand Rap-ids)] over 42 days. All measurements were done at elevated CO2 (1200 μmol·mol–1) to avoid any CO2 limitations and included both shoots and roots. We integrated photosynthesis and respiration measurements separately to determine daily net carbon gain and carbon use effi ciency (CUE) as the ratio of daily net C gain to total day-time C fi xed over the 42-day period. After 16 to 20 days of growth in constant PPF, plants in some chambers were subjected to an abrupt PPF reduction to simulate shade or a series of cloudy days. The immediate effect and the long term acclimation rate were assessed from canopy quantum yield and carbon use effi ciency. The effect of shade on carbon use effi ciency and acclimation was much slower than predicted by widely used growth models. It took 12 days for tomato populations to recover their original CUE and lettuce CUE never completely acclimated. Tomatoes, the starch accumulator, ac-climated to low light more rapidly than lettuce, the sucrose accumulator. Plant growth models should be modifi ed to include the photosynthesis/respiration imbalance and resulting ineffi ciency of carbon gain associated with changing PPF conditions on cloudy days.
Received for publication 4 Apr. 2005. Accepted for publication 14 July 2005. This research was supported by the National Aeronautics and Space Administration Advanced Life Support Program, the National Aeronautics and Space Administra-tion Graduate Student Research Program, and by the Utah Agricultural Experiment Station, Utah State Univ. Approved by Utah Agricultural Experiment Station as journal paper no. 7548. We would like to thank Julia Nielsen and Jayne Silvester for hydroponic system maintenance, James Cavazzoni for running simulations using modifi ed CROPGRO models and subsequent discussions, and Marc van Iersel and Julie Chard for helpful comments and discussion. Mention of a trade-mark, proprietary product, or vendor does not constitute a guarantee or warranty of the product by the USDA, and does not imply its approval to the exclusion of other products or vendors that also may be suitable.1Corresponding author [email protected]
Plants can acclimate to extremes of temperature (Hjelm and Ögren, 2003), water stress (Liu et al., 2004), and shade stress that would be detrimental to growth in the short term. Cloudy days cause light levels to change by an order of magnitude from day to day during the growing season. Long-term low light stress can be caused by extended cloud cover, and more commonly, shade from competing, adjacent plants. Competition also spectrally alters the light environment, but acclimation of photosynthesis to reduced quantity of photosynthetically active radiation is similar in slightly different spectral environments (Warren and Adams, 2001). Photosynthesis of single leaves immediately declines in reduced light, and eventually there are changes in pigment ratios, leaf anatomy, and photosynthetic responses to light including in-creased quantum yield (QY), the ratio of carbon fi xed to photons absorbed (Lambers et al., 1998; Logan et al., 1998).
Much less is known about the respiratory response of plant populations to reduced PPF and the balance between photo-synthesis and respiration. Most of what we know is based on short-term measurements made on plant parts rather than whole plants, populations, or plant communities. It is diffi cult to predict whole plant photosynthesis from short-term measurements on single leaves, and it is almost impossible to predict whole plant respiration from commonly measured plant parts (Frantz et al., 2004a).
Respiration is considered to be dependent on both supply of carbohydrate and its demand for growth and allocation (Amthor, 1989). If a plant has inadequate photosynthesis and is supply limited, carbon use effi ciency (CUE) should acclimate quickly to changes in PPF to optimize this balance. If a plant is demand dependent, respiration should remain high after an abrupt PPF change and CUE would decrease or remain low until the demand decreased. The relationship between respiration and temperature is generally well described (Amthor, 1989), and a strong cor-relation between respiration and carbohydrate content has been established in single leaves in several studies (Moser et al., 1982). For example, Azcón-Bieto and Osmond (1983) studied respiration in single leaves of wheat (Triticum aestivum L.) during a night and concluded that the higher rate of respiration at the beginning of the night was due to an increase of carbohydrate immediately following photosynthesis. Similar conclusions were made for intact spinach (Spinacia oleracea L.) and pea (Pisum sativum L.) leaves or leaf segments of wheat (Azcón-Bieto et al., 1983). Although there are some exceptions (Groninger et al., 1996), there is a general consensus that dark respiration of single leaves
577.indd 918577.indd 918 10/14/05 5:36:07 PM10/14/05 5:36:07 PM
919J. AMER. SOC. HORT. SCI. 130(6):918–927. 2005.
increases with carbohydrate content, although the magnitude of increased respiration may depend on carbohydrate type. These measurements all suggest a supply limitation to respiration, but the effect of carbohydrate supply on whole plant respiration has not been well characterized.
Predicting whole plant and plant population gas exchange (defi ned herein as both photosynthesis and respiration) from single leaf measurements is extremely diffi cult because photosynthesis and respiration rates derived from one leaf poorly represent the other leaves on the same plant much as a single plant may not adequately represent a population of plants. Ecosystem- and fi eld-scale C-fl ux measurements are becoming increasingly common (Ellsworth et al., 2004; Hamilton et al., 2002) with the popularity of Eddy-fl ux and isotope measurements, but they lack the high control afforded by a controlled environment to allow for assessing responses to specifi c environmental conditions and changes.
Many crop growth models do not describe an imposition of shade. Those that do incorporate shade effects on growth show an immediate acclimation to shade among species (DSSAT ver-sion 3.5; Univ. of Hawaii, Honolulu). The common assumption in such models is that respiration rates decrease concomitantly with growth rates and photosynthesis. Thus, if growth is low the respiration rate must also be low as observed for pea (Hole and Scott, 1984), alfalfa (Medicago sativa L.; Hendershot and Volenec, 1989), tall fescue (Festuca arundinacea L.; Moser et al., 1982), and tomato fruit (Grange and Andrews, 1995). However, Gary et al. (2003) found that tomato fruit respiration remained relatively stable regardless of carbohydrate availability or growth in the rest of the plant. They also found that vegetative plant parts may take longer than 24 h to consume starch and other carbohydrate reserves, thus slowing acclimation in response to rapidly chang-ing environmental conditions.
Nemali and van Iersel (2004) evaluated the effect of a change in daily light integral on growth, respiration, and carbon use ef-fi ciency of whole plant wax begonias (Begonia semperfl orens-cultorum Hort.). In their study, CO2 gas exchange measurements began immediately after begonia seedlings were transplanted into the different light environments. The plants grown in the lowest light integral (5.3 mol·m–2·d–1) required 14 d before photosyn-thesis exceeded respiration and never reached the CUE achieved by the plants in the higher PPF environments. They explained this in part by a large maintenance respiration coeffi cient that did not acclimate to lower PPF thereby leading to an imbalance of respiratory demand compared to carbohydrate supply (pho-tosynthesis). It is not known how other species react to changes in PPF and if elevated CO2 can alleviate the supply and demand imbalance at low PPF.
We continuously monitored CO2 gas exchange of plant popula-tions before and after the imposition of shade. We hypothesized that the application of shade would immediately reduce the photosynthetic rate, but that the respiration rate would decrease more slowly because of the mobilization of stored carbohydrates. This should result in lower CUE than values immediately prior to shade for several days. To test the effects of the form of stored carbohydrate, lettuce, a sucrose accumulator (Forney and Austin, 1988) was compared to tomato, a starch accumulator (Hocking and Steer, 1994). We hypothesized that lettuce would acclimate faster than tomato because of its simpler, more mobile carbohy-drates, as well as its lack of fruit, which have larger respiratory demands than leaves (Gary et al., 2003).
Materials and Methods
PLANT GROWTH ENVIRONMENT. Two experiments were con-ducted, each with a single species of fi ve PPFs. Lettuce and tomato were germinated and transplanted after 5 d into a 10-chamber gas exchange system previously described by van Iersel and Bugbee (2000). Each chamber was 0.5 m long × 0.4 m wide 0.9 m high, made of plexiglas, and fully enclosed the hydroponic rootzone. All chambers were housed within a walk-in growth room with a common temperature environment. Root and shoot zone tem-peratures within the individual chambers were maintained by activating electric heaters when the temperature fell below the set point. Air temperature was measured with an aspirated, type-E (0.5 mm diameter) thermocouple and controlled to within ±0.2 °C of set point, and CO2 was controlled to within ±2% of a set point of 1200 μmol·mol–1. These experiments were performed at elevated CO2 to ensure that photosynthesis would not be CO2 limited and to test the supply and demand balance idea from Nemali and van Iersel (2004) when photosynthetic responses were light limited. Root temperature was measured with a type-E (0.5 mm diameter) thermocouple coated in water-resistant silicon caulking compound to prevent corrosion of the exposed wire from the nutrient solution. Hydroponic solution was bubbled with the same CO2-enriched air as that used in the canopy.
Lettuce was grown at a density of 106 plants/m2. The dwarf tomato used in this study was grown at a density of 88 plants/m2, which is necessary to get canopy closure before fl owering. Both crops were grown at constant 25 °C day/night temperature including the roots for the duration of the trial. The pH of the hydroponic solution was maintained between 4 and 5 by daily additions of 1 M HNO3, which forced 90% to 99% of the CO2 out of solution. Relative humidity was maintained between 60% and 85% for the duration of the trials, but the chambers differed with each other by <10% at any given time. The PPF was provided by water-fi ltered high-pressure-sodium lamps that provided a PPF of 600 μmol·m–2·s–1 (±5%) for lettuce and 650 μmol·m–2·s–1 (±5%) for tomato. A 16-h photoperiod provided an integrated PPF of 34.6 mol·m–2·d–1 for lettuce and 37.4 mol·m–2·d–1 for tomato. These PPF levels provided about as much light as plants grown in the fi eld would commonly receive in the summer, depending on cloud cover and exact location, for much of the United States and would encourage rapid growth.
Shade was applied 2 d after canopies closed, which occurred 14 d after transplanting for lettuce and 18 d after transplanting for tomato. A range of shade from 0% to 80% shading was obtained in each trial. Shade was applied using a variable amount of neutral-density window screening (10-mesh, each hole was 1.6 × 1.6 mm) positioned on the top of the chambers below the lamps. PPF was reduced 50% with each complete layer of screening. Less than 50% shade was obtained using incomplete layers of screen. PPF was measured twice weekly with a line-quantum sensor (model LQSV-ELEC; Apogee Instruments, Logan, Utah) that averaged PPF across the top of the canopy. The screening was adjusted twice weekly to maintain shade at the predetermined set-point. Shade continued until a typical cropping duration for lettuce, which was 9 d after shade application. Shade continued for tomatoes for 18 d, during which time fl owering began. Refl ective mylar material was wrapped around each chamber and was adjusted daily to the top of the canopy to minimize side lighting.
CALIBRATING AND OPERATION OF THE CO2 GAS EXCHANGE SYSTEM. CO2 gas exchange systems are usually only tested with empty chambers to ensure that photosynthesis was zero. In addition to
577.indd 919577.indd 919 10/14/05 5:36:10 PM10/14/05 5:36:10 PM
920 J. AMER. SOC. HORT. SCI. 130(6):918–927. 2005.
a zero test, we did a “span” test on the entire system by placing a precisely measured mass of dried CaCO3 in each chamber and slowly reacting it with dilute acid. This caused a slow, steady effl ux of CO2, which was measured with the differential and absolute gas analyzers. When the reaction was complete, the moles of CO2 evolved from the CaCO3 were compared to the moles of CO2 determined from the gas analyzers and fl ow me-ters. This test was useful in fi nding small system leaks, errors in calibrations, and errors in software. After conducting several replicate span tests we were able to achieve a mass balance for CO2 of 100% ± 2%.
CO2 gas exchange rates of each of the 10 separate chambers (individual plant populations) were monitored for one minute every 10 min throughout both experiments. These data were used to calculate photosynthetic and respiration rates as well as daily total carbon gain. As a fi nal test of gas-exchange accuracy, total biomass was calculated based on the gas exchange data and measured C fraction of the tissues, then compared to the harvested dry mass. The gas-exchange predicted the fi nal dry mass to within 3% in all chambers.
Gas exchange measurements included both autotrophic and heterotrophic respiration. Since the study was performed in hydroponics, the carbon substrate used by microorganisms was primarily derived from root exudation and sloughing. Because of this, inclusion of heterotrophic respiration should be included in population gas exchange rates because that carbon was originally fi xed by the plants (van Iersel, 1999). The small difference between the measured dry matter at harvest and predicted dry mass based on the accumulated gas exchange data suggests that the error resulting from the inclusion of both types of respiration has little effect on the environmental effects of the population. However, care must be taken when comparing these results from those that investigate gas-exchange from purely autotrophic sources.
CALCULATIONS. Carbon use effi ciency is a calculated term that measures the amount of carbon incorporated into the plants divided by the total amount of carbon fi xed in photosynthesis. CUE is a term describing how effi ciently plants incorporate the carbon fi xed during the day into biomass gain and can be calculated as:
CUE = DCG / Pgross [1]
where Pgross is gross photosynthesis and DCG is daily carbon gain. Using the measured CO2 exchange rates of Pnet (net photosynthesis, mol C per m2·d–1) and Rn (nighttime respiration, mol C per m2 per night; night is the night period following the photosynthesis period), DCG can be calculated as: DCG = Pnet – Rn [2]
Pgross is a calculated term that incorporates both the net C fi xed (Pnet) and the C that is simultaneously being respired. Since it is extremely diffi cult to measure daytime respiration (Rd) directly, Pgross is calculated as the sum of Pnet and a percentage of nighttime respiration rate. Previous studies have indicated that Rd increases during the day in intact plants due to higher carbohydrate content (Azcón-Bieto and Osmond, 1983), or can be lower due to light inhibition of respiration in leaves (Atkin et al., 2000; Sharp et al., 1984). With only 15% to 30% of the respiration occurring in the leaves, even a 50% decrease in respiration in the light still leaves most of the respiration unaccounted for and can lead to signifi cant errors when assumed to represent the whole plant (26% error in Raulier et al., 1999). Monje and Bugbee
(1996) found that root respiration, at a constant temperature, is increased in the day presumably due to increased carbohydrate supply. We assume that the rate of Rd and Rn (μmol·mground
–2·s–1) are equal when temperatures are constant (van Iersel, 1999). The constant temperatures eliminated the errors associated with correcting for day/night temperature differences using some Q10 value for respiration. In a 12-h photoperiod, Rd (mol·mground
–2·d-1) then equals Rn. In a 16-h light/8-h dark photoperiod, Rd = Rn × 2.
In these equations, respiration assumes a positive value (i.e., C mass respired). Pgross can, therefore, be calculated as:
Pgross = Pnet + Rd [3]
Sensitivity analysis of CUE to the assumption of Rd to cal-culate Pgross indicates that Rd can increase or decrease by 50% compared to Rn and change CUE by only 12% (0.08; assuming a typical CUE of 0.65). Therefore, the assumption of constant day and night respiration rate has relatively little impact on the calculated value of CUE. Small changes in CUE can be important on a day-to-day basis, but relative changes are more important than absolute values. Furthermore, changes in CUE relative to the control are more important than absolute changes to CUE after shade application.
QY was calculated for each canopy after canopy closure. Inci-dent PPF was measured and, based on measurements in previous trials (Frantz et al., 2004b; Klassen et al., 2003), 95% of that was assumed to be absorbed. The Pgross for the day period (mol C per m2·d–1) was then divided by total photons absorbed (mol per m2·d–1) to give QY (mol C fi xed per mol photons absorbed). This is analogous to estimating QY from the initial slope of light saturation-photosynthesis curves (Lambers et al., 1998). Relative growth rate (RGR) was measured by dividing the moles of C in existing biomass by the DCG.
DATA ANALYSIS AND EXPERIMENTAL DESIGN. For each experiment, shade treatments were arranged in a randomized block design and analyzed using linear regression. There were four levels of shade per trial, each replicated once (n = 2 for each PPF level). The control had 600 μmol·m–2·s–1 in the lettuce experiment and 650 μmol·m–2·s–1 in the tomato experiment. ANOVA was performed to test for signifi cant differences between chambers before treat-ments were applied.
Treatment effects were expressed as a percent of their initial value, then normalized to the unshaded control in each species in the following manner:
(post-treatmenta dayb/pretreatmenta value) ÷ (post-treatmentcontrol dayb/pretreatment valuecontrol) × 100(%) [4]
where “post-treatmenta” indicates the post-treatment value of a parameter (CUE, Pnet, or Rn) on “dayb”, “pretreatmenta value” is the value of the parameter on the day before the shade was im-posed, “post-treatmentcontrol dayb” is the post-treatment value of the parameter for the control on dayb, and “pretreatment valuecontrol” is the pretreatment value of the parameter for the control the day before treatments began. This data treatment results in determining the shade effects through time relative to the treatment plants in the numerator, and the effects through time relative to the control in the denominator.
Normalized data were analyzed with linear regression to determine the effect of shade on each parameter for each day after treatment began. Slopes of lines on different days were compared to see if their slopes were equal using the test statistic
577.indd 920577.indd 920 10/14/05 5:36:14 PM10/14/05 5:36:14 PM
921J. AMER. SOC. HORT. SCI. 130(6):918–927. 2005.
(slope a – slope b)/(variance of slope a) = t (degrees of freedom of slope a)
(Neter et al., 1996).
Results
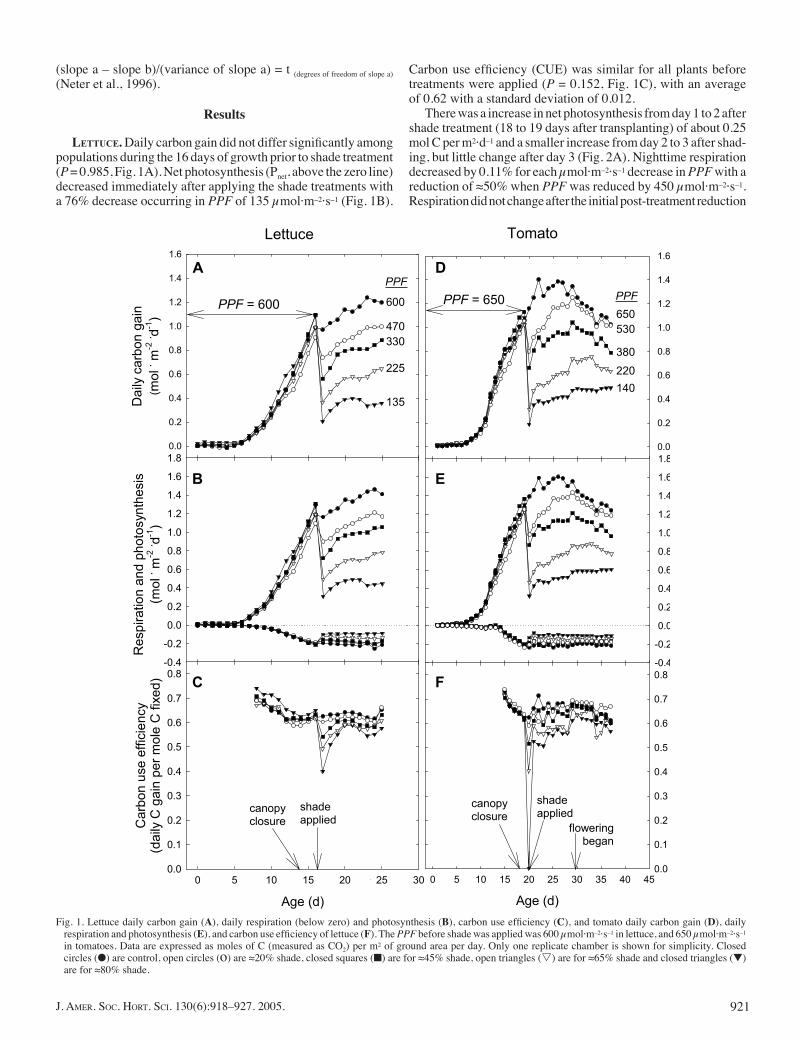
LETTUCE. Daily carbon gain did not differ signifi cantly among populations during the 16 days of growth prior to shade treatment (P = 0.985, Fig. 1A). Net photosynthesis (Pnet, above the zero line) decreased immediately after applying the shade treatments with a 76% decrease occurring in PPF of 135 μmol·m–2·s–1 (Fig. 1B).
Carbon use effi ciency (CUE) was similar for all plants before treatments were applied (P = 0.152, Fig. 1C), with an average of 0.62 with a standard deviation of 0.012.
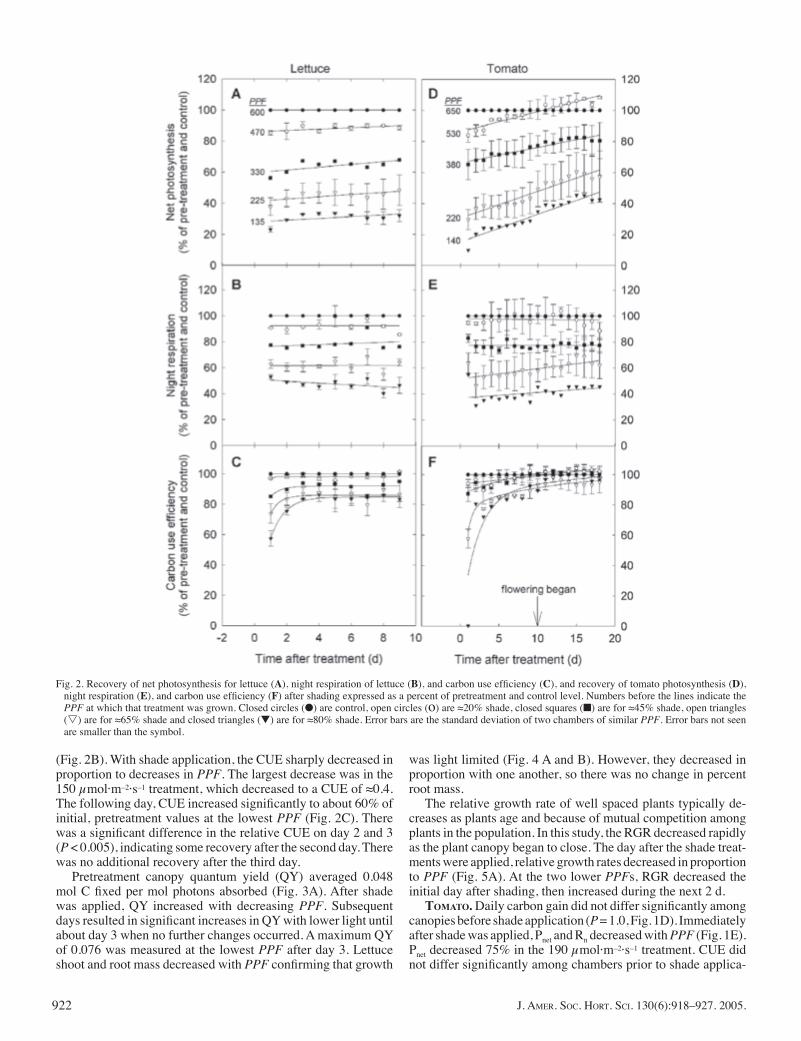
There was a increase in net photosynthesis from day 1 to 2 after shade treatment (18 to 19 days after transplanting) of about 0.25 mol C per m2·d–1 and a smaller increase from day 2 to 3 after shad-ing, but little change after day 3 (Fig. 2A). Nighttime respiration decreased by 0.11% for each μmol·m–2·s–1 decrease in PPF with a reduction of ≈50% when PPF was reduced by 450 μmol·m–2·s–1. Respiration did not change after the initial post-treatment reduction
Fig. 1. Lettuce daily carbon gain (A), daily respiration (below zero) and photosynthesis (B), carbon use effi ciency (C), and tomato daily carbon gain (D), daily respiration and photosynthesis (E), and carbon use effi ciency of lettuce (F). The PPF before shade was applied was 600 μmol·m–2·s–1 in lettuce, and 650 μmol·m–2·s–1 in tomatoes. Data are expressed as moles of C (measured as CO2) per m2 of ground area per day. Only one replicate chamber is shown for simplicity. Closed circles (●) are control, open circles (o) are ≈20% shade, closed squares (■) are for ≈45% shade, open triangles (s) are for ≈65% shade and closed triangles (▼) are for ≈80% shade.
0.0
0.2
0.4
0.6
0.8
1.0
1.2
1.4
1.6
Dai
ly c
arbo
n ga
in( m
ol. m
-2. d-1
)
0.0
0.2
0.4
0.6
0.8
1.0
1.2
1.4
1.6
Res
pira
tion
and
phot
osyn
thes
is(m
ol. m
-2. d-1
)
-0.4
-0.2
0.0
0.2
0.4
0.6
0.8
1.0
1.2
1.4
1.6
1.8
600
470330
225
135
Age (d)
0 5 10 15 20 25 300.0
0.1
0.2
0.3
0.4
0.5
0.6
0.7
0.8
shade applied
A
C
Car
bon
use
effic
ienc
y(d
aily
C g
ain
per m
ole
C fi
xed)
Lettuce
PPF = 600
PPF
-0.4
-0.2
0.0
0.2
0.4
0.6
0.8
1.0
1.2
1.4
1.6
1.8
Tomato
Age (d)
0 5 10 15 20 25 30 35 40 450.0
0.1
0.2
0.3
0.4
0.5
0.6
0.7
0.8
650
220380
530
140
B
PPFPPF = 650
shade applied
D
E
F
canopy closure
canopy closure
floweringbegan
577.indd 921577.indd 921 10/14/05 5:36:19 PM10/14/05 5:36:19 PM
922 J. AMER. SOC. HORT. SCI. 130(6):918–927. 2005.
(Fig. 2B). With shade application, the CUE sharply decreased in proportion to decreases in PPF. The largest decrease was in the 150 μmol·m–2·s–1 treatment, which decreased to a CUE of ≈0.4. The following day, CUE increased signifi cantly to about 60% of initial, pretreatment values at the lowest PPF (Fig. 2C). There was a signifi cant difference in the relative CUE on day 2 and 3 (P < 0.005), indicating some recovery after the second day. There was no additional recovery after the third day.
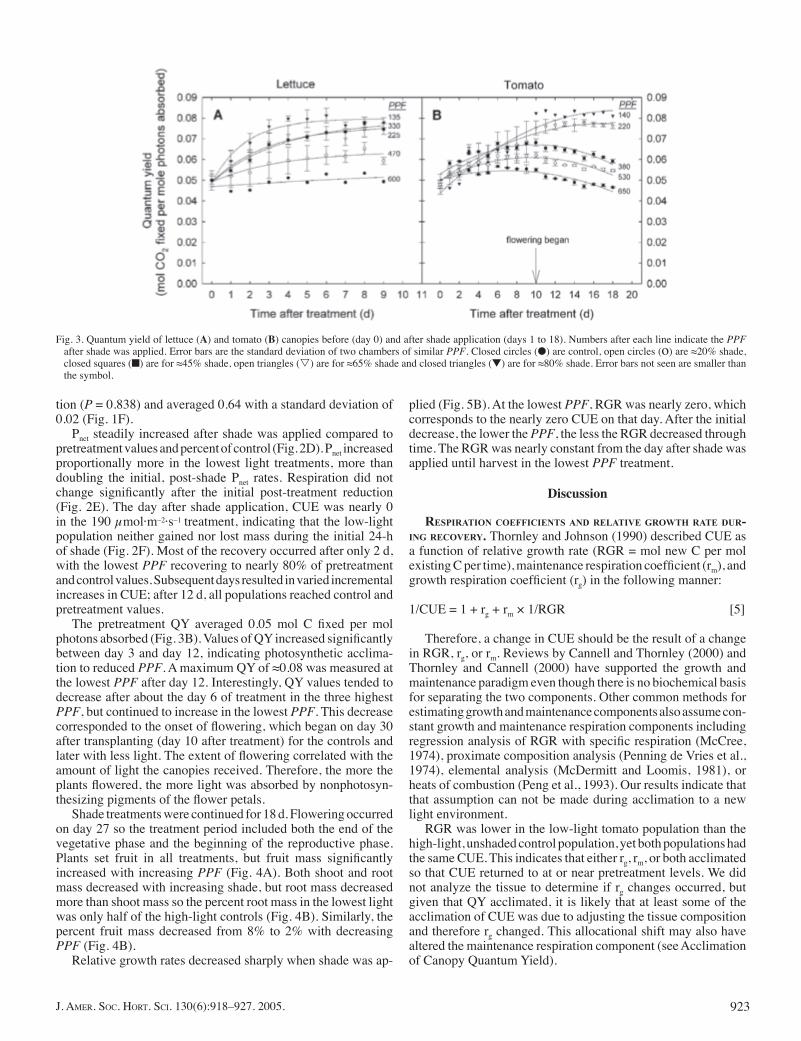
Pretreatment canopy quantum yield (QY) averaged 0.048 mol C fi xed per mol photons absorbed (Fig. 3A). After shade was applied, QY increased with decreasing PPF. Subsequent days resulted in signifi cant increases in QY with lower light until about day 3 when no further changes occurred. A maximum QY of 0.076 was measured at the lowest PPF after day 3. Lettuce shoot and root mass decreased with PPF confi rming that growth
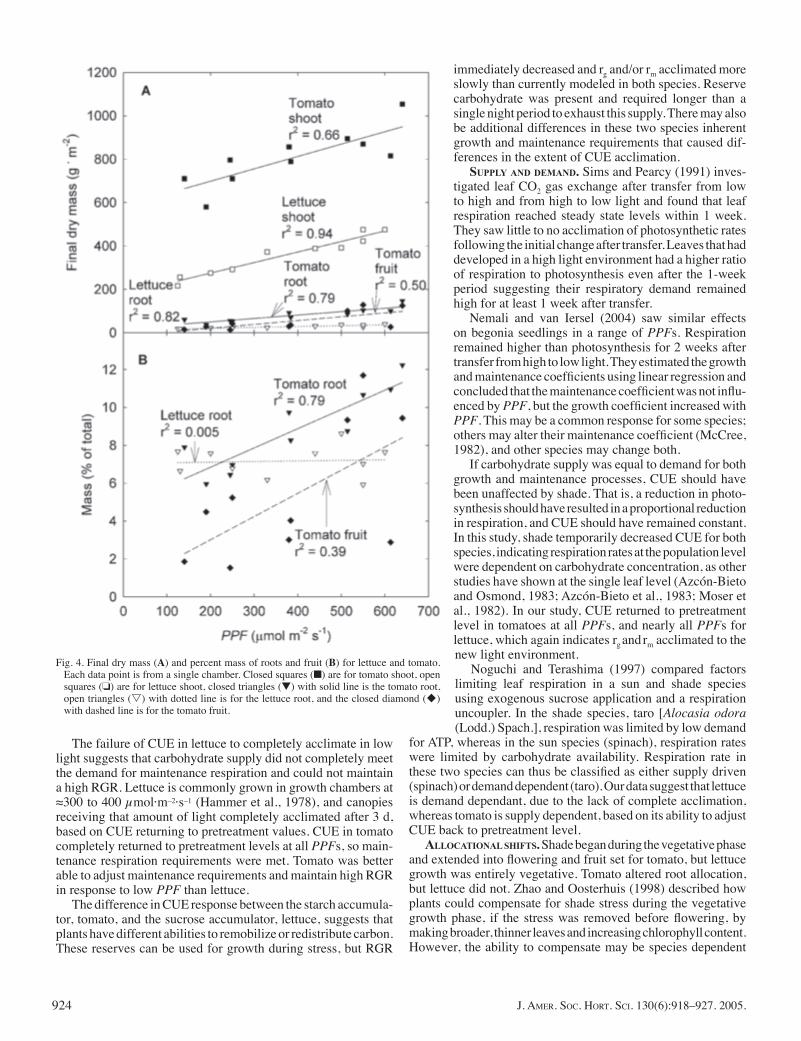
was light limited (Fig. 4 A and B). However, they decreased in proportion with one another, so there was no change in percent root mass.
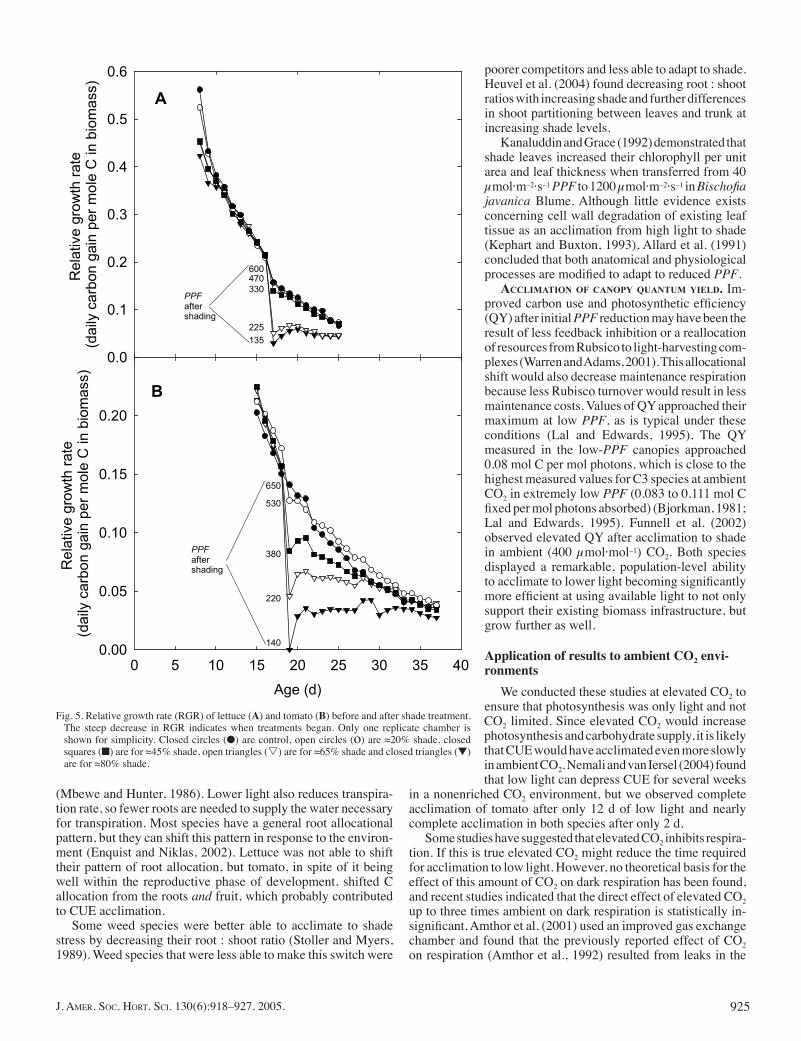
The relative growth rate of well spaced plants typically de-creases as plants age and because of mutual competition among plants in the population. In this study, the RGR decreased rapidly as the plant canopy began to close. The day after the shade treat-ments were applied, relative growth rates decreased in proportion to PPF (Fig. 5A). At the two lower PPFs, RGR decreased the initial day after shading, then increased during the next 2 d.
TOMATO. Daily carbon gain did not differ signifi cantly among canopies before shade application (P = 1.0, Fig. 1D). Immediately after shade was applied, Pnet and Rn decreased with PPF (Fig. 1E). Pnet decreased 75% in the 190 μmol·m–2·s–1 treatment. CUE did not differ signifi cantly among chambers prior to shade applica-
Fig. 2. Recovery of net photosynthesis for lettuce (A), night respiration of lettuce (B), and carbon use effi ciency (C), and recovery of tomato photosynthesis (D), night respiration (E), and carbon use effi ciency (F) after shading expressed as a percent of pretreatment and control level. Numbers before the lines indicate the PPF at which that treatment was grown. Closed circles (●) are control, open circles (o) are ≈20% shade, closed squares (■) are for ≈45% shade, open triangles (s) are for ≈65% shade and closed triangles (▼) are for ≈80% shade. Error bars are the standard deviation of two chambers of similar PPF. Error bars not seen are smaller than the symbol.
577.indd 922577.indd 922 10/14/05 5:36:20 PM10/14/05 5:36:20 PM
923J. AMER. SOC. HORT. SCI. 130(6):918–927. 2005.
tion (P = 0.838) and averaged 0.64 with a standard deviation of 0.02 (Fig. 1F).
Pnet steadily increased after shade was applied compared to pretreatment values and percent of control (Fig. 2D). Pnet increased proportionally more in the lowest light treatments, more than doubling the initial, post-shade Pnet rates. Respiration did not change signifi cantly after the initial post-treatment reduction (Fig. 2E). The day after shade application, CUE was nearly 0 in the 190 μmol·m–2·s–1 treatment, indicating that the low-light population neither gained nor lost mass during the initial 24-h of shade (Fig. 2F). Most of the recovery occurred after only 2 d, with the lowest PPF recovering to nearly 80% of pretreatment and control values. Subsequent days resulted in varied incremental increases in CUE; after 12 d, all populations reached control and pretreatment values.
The pretreatment QY averaged 0.05 mol C fi xed per mol photons absorbed (Fig. 3B). Values of QY increased signifi cantly between day 3 and day 12, indicating photosynthetic acclima-tion to reduced PPF. A maximum QY of ≈0.08 was measured at the lowest PPF after day 12. Interestingly, QY values tended to decrease after about the day 6 of treatment in the three highest PPF, but continued to increase in the lowest PPF. This decrease corresponded to the onset of fl owering, which began on day 30 after transplanting (day 10 after treatment) for the controls and later with less light. The extent of fl owering correlated with the amount of light the canopies received. Therefore, the more the plants fl owered, the more light was absorbed by nonphotosyn-thesizing pigments of the fl ower petals.
Shade treatments were continued for 18 d. Flowering occurred on day 27 so the treatment period included both the end of the vegetative phase and the beginning of the reproductive phase. Plants set fruit in all treatments, but fruit mass signifi cantly increased with increasing PPF (Fig. 4A). Both shoot and root mass decreased with increasing shade, but root mass decreased more than shoot mass so the percent root mass in the lowest light was only half of the high-light controls (Fig. 4B). Similarly, the percent fruit mass decreased from 8% to 2% with decreasing PPF (Fig. 4B).
Relative growth rates decreased sharply when shade was ap-
plied (Fig. 5B). At the lowest PPF, RGR was nearly zero, which corresponds to the nearly zero CUE on that day. After the initial decrease, the lower the PPF, the less the RGR decreased through time. The RGR was nearly constant from the day after shade was applied until harvest in the lowest PPF treatment.
Discussion
RESPIRATION COEFFICIENTS AND RELATIVE GROWTH RATE DUR-ING RECOVERY. Thornley and Johnson (1990) described CUE as a function of relative growth rate (RGR = mol new C per mol existing C per time), maintenance respiration coeffi cient (rm), and growth respiration coeffi cient (rg) in the following manner:
1/CUE = 1 + rg + rm × 1/RGR [5]
Therefore, a change in CUE should be the result of a change in RGR, rg, or rm. Reviews by Cannell and Thornley (2000) and Thornley and Cannell (2000) have supported the growth and maintenance paradigm even though there is no biochemical basis for separating the two components. Other common methods for estimating growth and maintenance components also assume con-stant growth and maintenance respiration components including regression analysis of RGR with specifi c respiration (McCree, 1974), proximate composition analysis (Penning de Vries et al., 1974), elemental analysis (McDermitt and Loomis, 1981), or heats of combustion (Peng et al., 1993). Our results indicate that that assumption can not be made during acclimation to a new light environment.
RGR was lower in the low-light tomato population than the high-light, unshaded control population, yet both populations had the same CUE. This indicates that either rg, rm, or both acclimated so that CUE returned to at or near pretreatment levels. We did not analyze the tissue to determine if rg changes occurred, but given that QY acclimated, it is likely that at least some of the acclimation of CUE was due to adjusting the tissue composition and therefore rg changed. This allocational shift may also have altered the maintenance respiration component (see Acclimation of Canopy Quantum Yield).
Fig. 3. Quantum yield of lettuce (A) and tomato (B) canopies before (day 0) and after shade application (days 1 to 18). Numbers after each line indicate the PPF after shade was applied. Error bars are the standard deviation of two chambers of similar PPF. Closed circles (●) are control, open circles (o) are ≈20% shade, closed squares (■) are for ≈45% shade, open triangles (s) are for ≈65% shade and closed triangles (▼) are for ≈80% shade. Error bars not seen are smaller than the symbol.
577.indd 923577.indd 923 10/14/05 5:36:22 PM10/14/05 5:36:22 PM
924 J. AMER. SOC. HORT. SCI. 130(6):918–927. 2005.
The failure of CUE in lettuce to completely acclimate in low light suggests that carbohydrate supply did not completely meet the demand for maintenance respiration and could not maintain a high RGR. Lettuce is commonly grown in growth chambers at ≈300 to 400 μmol·m–2·s–1 (Hammer et al., 1978), and canopies receiving that amount of light completely acclimated after 3 d, based on CUE returning to pretreatment values. CUE in tomato completely returned to pretreatment levels at all PPFs, so main-tenance respiration requirements were met. Tomato was better able to adjust maintenance requirements and maintain high RGR in response to low PPF than lettuce.
The difference in CUE response between the starch accumula-tor, tomato, and the sucrose accumulator, lettuce, suggests that plants have different abilities to remobilize or redistribute carbon. These reserves can be used for growth during stress, but RGR
immediately decreased and rg and/or rm acclimated more slowly than currently modeled in both species. Reserve carbohydrate was present and required longer than a single night period to exhaust this supply. There may also be additional differences in these two species inherent growth and maintenance requirements that caused dif-ferences in the extent of CUE acclimation.
SUPPLY AND DEMAND. Sims and Pearcy (1991) inves-tigated leaf CO2 gas exchange after transfer from low to high and from high to low light and found that leaf respiration reached steady state levels within 1 week. They saw little to no acclimation of photosynthetic rates following the initial change after transfer. Leaves that had developed in a high light environment had a higher ratio of respiration to photosynthesis even after the 1-week period suggesting their respiratory demand remained high for at least 1 week after transfer.
Nemali and van Iersel (2004) saw similar effects on begonia seedlings in a range of PPFs. Respiration remained higher than photosynthesis for 2 weeks after transfer from high to low light. They estimated the growth and maintenance coeffi cients using linear regression and concluded that the maintenance coeffi cient was not infl u-enced by PPF, but the growth coeffi cient increased with PPF. This may be a common response for some species; others may alter their maintenance coeffi cient (McCree, 1982), and other species may change both.
If carbohydrate supply was equal to demand for both growth and maintenance processes, CUE should have been unaffected by shade. That is, a reduction in photo-synthesis should have resulted in a proportional reduction in respiration, and CUE should have remained constant. In this study, shade temporarily decreased CUE for both species, indicating respiration rates at the population level were dependent on carbohydrate concentration, as other studies have shown at the single leaf level (Azcón-Bieto and Osmond, 1983; Azcón-Bieto et al., 1983; Moser et al., 1982). In our study, CUE returned to pretreatment level in tomatoes at all PPFs, and nearly all PPFs for lettuce, which again indicates rg and rm acclimated to the new light environment.
Noguchi and Terashima (1997) compared factors limiting leaf respiration in a sun and shade species using exogenous sucrose application and a respiration uncoupler. In the shade species, taro [Alocasia odora (Lodd.) Spach.], respiration was limited by low demand
for ATP, whereas in the sun species (spinach), respiration rates were limited by carbohydrate availability. Respiration rate in these two species can thus be classifi ed as either supply driven (spinach) or demand dependent (taro). Our data suggest that lettuce is demand dependant, due to the lack of complete acclimation, whereas tomato is supply dependent, based on its ability to adjust CUE back to pretreatment level.
ALLOCATIONAL SHIFTS. Shade began during the vegetative phase and extended into fl owering and fruit set for tomato, but lettuce growth was entirely vegetative. Tomato altered root allocation, but lettuce did not. Zhao and Oosterhuis (1998) described how plants could compensate for shade stress during the vegetative growth phase, if the stress was removed before fl owering, by making broader, thinner leaves and increasing chlorophyll content. However, the ability to compensate may be species dependent
Fig. 4. Final dry mass (A) and percent mass of roots and fruit (B) for lettuce and tomato. Each data point is from a single chamber. Closed squares (■) are for tomato shoot, open squares (❏) are for lettuce shoot, closed triangles (▼) with solid line is the tomato root, open triangles (s) with dotted line is for the lettuce root, and the closed diamond (u) with dashed line is for the tomato fruit.
577.indd 924577.indd 924 10/14/05 5:36:27 PM10/14/05 5:36:27 PM
925J. AMER. SOC. HORT. SCI. 130(6):918–927. 2005.
(Mbewe and Hunter, 1986). Lower light also reduces transpira-tion rate, so fewer roots are needed to supply the water necessary for transpiration. Most species have a general root allocational pattern, but they can shift this pattern in response to the environ-ment (Enquist and Niklas, 2002). Lettuce was not able to shift their pattern of root allocation, but tomato, in spite of it being well within the reproductive phase of development, shifted C allocation from the roots and fruit, which probably contributed to CUE acclimation.
Some weed species were better able to acclimate to shade stress by decreasing their root : shoot ratio (Stoller and Myers, 1989). Weed species that were less able to make this switch were
Rela
tive g
row
th r
ate
(d
aily
ca
rbon
gain
pe
r m
ole
C in
bio
ma
ss)
0.0
0.1
0.2
0.3
0.4
0.5
0.6
135
225
330
470600
PPF
after shading
Age (d)
0 5 10 15 20 25 30 35 40
Rela
tive g
row
th r
ate
(d
aily
carb
on g
ain
per
mole
C in b
iom
ass)
0.00
0.05
0.10
0.15
0.20
140
220
380
530
650
PPF
after shading
A
B
Fig. 5. Relative growth rate (RGR) of lettuce (A) and tomato (B) before and after shade treatment. The steep decrease in RGR indicates when treatments began. Only one replicate chamber is shown for simplicity. Closed circles (●) are control, open circles (o) are ≈20% shade, closed squares (■) are for ≈45% shade, open triangles (s) are for ≈65% shade and closed triangles (▼) are for ≈80% shade.
poorer competitors and less able to adapt to shade. Heuvel et al. (2004) found decreasing root : shoot ratios with increasing shade and further differences in shoot partitioning between leaves and trunk at increasing shade levels.
Kanaluddin and Grace (1992) demonstrated that shade leaves increased their chlorophyll per unit area and leaf thickness when transferred from 40 μmol·m–2·s–1 PPF to 1200 μmol·m–2·s–1 in Bischofi a javanica Blume. Although little evidence exists concerning cell wall degradation of existing leaf tissue as an acclimation from high light to shade (Kephart and Buxton, 1993), Allard et al. (1991) concluded that both anatomical and physiological processes are modifi ed to adapt to reduced PPF.
ACCLIMATION OF CANOPY QUANTUM YIELD. Im-proved carbon use and photosynthetic effi ciency (QY) after initial PPF reduction may have been the result of less feedback inhibition or a reallocation of resources from Rubsico to light-harvesting com-plexes (Warren and Adams, 2001). This allocational shift would also decrease maintenance respiration because less Rubisco turnover would result in less maintenance costs. Values of QY approached their maximum at low PPF, as is typical under these conditions (Lal and Edwards, 1995). The QY measured in the low-PPF canopies approached 0.08 mol C per mol photons, which is close to the highest measured values for C3 species at ambient CO2 in extremely low PPF (0.083 to 0.111 mol C fi xed per mol photons absorbed) (Bjorkman, 1981; Lal and Edwards, 1995). Funnell et al. (2002) observed elevated QY after acclimation to shade in ambient (400 μmol·mol–1) CO2. Both species displayed a remarkable, population-level ability to acclimate to lower light becoming signifi cantly more effi cient at using available light to not only support their existing biomass infrastructure, but grow further as well.
Application of results to ambient CO2 envi-ronments
We conducted these studies at elevated CO2 to ensure that photosynthesis was only light and not CO2 limited. Since elevated CO2 would increase photosynthesis and carbohydrate supply, it is likely that CUE would have acclimated even more slowly in ambient CO2. Nemali and van Iersel (2004) found that low light can depress CUE for several weeks
in a nonenriched CO2 environment, but we observed complete acclimation of tomato after only 12 d of low light and nearly complete acclimation in both species after only 2 d.
Some studies have suggested that elevated CO2 inhibits respira-tion. If this is true elevated CO2 might reduce the time required for acclimation to low light. However, no theoretical basis for the effect of this amount of CO2 on dark respiration has been found, and recent studies indicated that the direct effect of elevated CO2 up to three times ambient on dark respiration is statistically in-signifi cant. Amthor et al. (2001) used an improved gas exchange chamber and found that the previously reported effect of CO2 on respiration (Amthor et al., 1992) resulted from leaks in the
577.indd 925577.indd 925 10/14/05 5:36:30 PM10/14/05 5:36:30 PM
926 J. AMER. SOC. HORT. SCI. 130(6):918–927. 2005.
original chamber. Indeed, using fi ve gas exchange measurement approaches, he consistently found that respiration was insensitive to short-term changes in CO2 concentration.
Conclusions
These data show that there are signifi cant species differences in acclimation potential to reduced light environments, and there are differences in factors that determine respiration rates. Sup-ply and demand of substrates may be a good working model in which to view respiration responses to different light environ-ments, but a better understanding of the carbohydrate demand that determines growth and maintenance requirements is needed. Additionally, these data show that current models that have an instantaneous acclimation of respiration and carbon retention (CUE) in response to reduced PPF overestimate the rate at which acclimation occurs in plants and the extent to which acclimation occurs in some species.
Literature Cited
Allard, G., C.J. Nelsen, and S.G. Pallardy. 1991. Shade effect on growth of tall fescue: II. Leaf gas exchange characteristics. Crop Sci. 31:167–172.
Amthor, J.S. 1989. Respiration and crop productivity. Springer-Verlag. New York.
Amthor, J.S., A.J. Boom, and G.W. Koch. 1992. CO2 inhibits respiration in leaves of Rumex crispus L. Plant Physiol. 98:757–760.
Amthor, J.S., G.W. Koch, J.R. Williams, and D.B. Layzell. 2001. Leaf O2 uptake in the dark is independent of coincident CO2 partial pressure. J. Expt. Bot. 52:2235–2238.
Atkin, O.K., J.R. Evans, M.C. Ball, H. Lambers, and T.L. Pons. 2000. Leaf respiration of snow gum in the light and dark. Interactions between temperature and irradiance. Plant Physiol. 122:915–923.
Azcón-Bieto, J., H. Lambers, and D.D. Day. 1983. Effect of photosynthesis and carbohydrate status on respiratory rates and the involvement of the alternative pathway in leaf respiration. Plant Physiol. 72:598–603.
Azcón-Bieto, J. and C.B. Osmond. 1983. Relationship between photo-synthesis and respiration. The effect of carbohydrate status on the rate of CO2 production by respiration in darkened and illuminated wheat leaves. Plant Physiol. 71:574–581.
Björkman, O. 1981. Responses to different quantum fl ux densities: Plants, light and its effects on photosynthesis. Encyc. of Plant Physiol. New Ser. 12:57–107.
Blazier, M.A., T.C. Hennessey, T.B. Lynch, R.F. Wittwer, and M.E. Pay-ton. 2004. Productivity, crown architecture, and gas exchange of North Carolina and Oklahoma/Arkansas loblolly pine families growing on a droughty site in southeastern Oklahoma. For. Ecol. Mgt. 194:83–94.
Burton, A.J. and K.S. Pregitzer. 2002. Measurement of carbon dioxide concentration does not affect root respiration of nine tree species in the fi eld. Tree Physiol. 22:67.
Burton, A.J., K.S. Preigitzer, G.P. Zogg, and D.R. Zak. 1996. Latitu-dinal variation in sugar maple fi ne root respiration. Can. J. For. Res. 26:1761–1768.
Cannell, M.G.R. and J.H.M. Thornley. 2000. Modelling the components of plant respiration: Some guiding principles. Ann. Bot. 85:45–54.
Ellsworth, J.W., R.A. Harrington, and J.H. Fownes. 2004. Survival, growth and gas exchange of Celastrus orbiculatus seedlings in sun and shade. Amer. Midland Naturalist 151:233–240.
Enquist, B.J. and K.J. Niklas. 2002. Global allocation rules for patterns of biomass partitioning in seed plants. Science 295:1517–1520.
Forney, C.F. and R.K. Austin. 1988. Time of day at harvest infl uences carbohydrate concentration in crisphead lettuce and its sensitivity to high CO2 levels after harvest. J. Amer. Soc. Hort. Sci. 113:581–583.
Funnell, K.A., E.W. Hewett, J.A. Plummer, and I.J. Warrington. 2002. Acclimation of photosynthetic activity of Zandeschia ʻBest Gold ̓in
response to temperature and photosynthetic photon fl ux. J. Amer. Soc. Hort. Sci. 127:290–296.
Frantz, J.M., G. Ritchie, N.N. Cometti, J. Robinson, and B. Bugbee. 2004b. Exploring the limits of crop productivity: Beyond the limits of tipburn in lettuce. J. Amer. Soc. Hort. Sci. 129:331–338.
Frantz, J.M., N.N. Cometti, and B. Bugbee. 2004a. Night temperature has a minimal effect on growth and respiration in fast growing plants. Ann. Bot. 94:155–166.
Gary, C., P. Baldet, N. Bertin, C. Devaux, M. Tchamitchian, and P. Ray-mond. 2003. Time-course of tomato whole plant respiration and fruit and stem growth during prolonged darkness in relation to carbohydrate reserves. Ann. Bot. 91:429–438.
Gifford, R.M. 1994. The global carbon cycle: A viewpoint on the missing sink. Austral. J. Plant Physiol. 21:1–15
Grange, R.I. and J. Andrews. 1995. Respiration and growth of tomato fruit. Plant Cell Environ. 18:925–930.
Groninger, J.W., J.R. Seiler, J.A. Peterson, and R.E. Kreh. 1996. Growth and photosynthetic responses of four Virginia Piedmont tree species to shade. Tree Physiol. 16:773–778.
Hamilton, J.G., E.H. DeLucia, K. George, S.L. Naidu, A.C. Finzi, and W.H. Schlesinger. 2002. Forest carbon balance under elevated CO2. Oecologia 131:250–260.
Hammer, P.A., T.W. Tibbitts, R.W. Langhans, and J.C. McFralane. 1978. Base-line growth studies of ̒ Grand Rapids ̓lettuce in controlled environments. J. Amer. Soc. Hort. Sci. 103:649–655.
Hansen, L.D., R.S. Criddle, B.N. Smith, and C. MacFarlane. 2002. Growth-maintenance component models are an inaccurate representa-tion of plant respiration. Crop Sci. 42:659.
Hendershot, K.L. and J.J. Volenec. 1989. Shoot growth, dark respiration and nonstructural carbohydrates of contrasting alfalfa genotypes. Crop Sci. 29:1271–1275.
Hjelm, U. and E. Ögren. 2003. Is photosynthetic acclimation to low temperature controlled by capacities for storage and growth at low temperature? Results from comparative studies of grasses and trees. Physiol. Planta. 119:113–120.
Hocking, P.J. and B.T. Steer. 1994. The distribution and identity of assimilates in tomato with species reference to stem reserves. Ann. Bot. 73:315–325.
Hole, C.C. and P.A. Scott. 1984. Pea fruit extension rate. I. Effect of light, dark and temperature in controlled environments. J. Expt. Bot. 35:790–802.
Kamaluddin, M. and J. Grace. 1992. Photoinhibition and light acclima-tion in seedlings of Bischofi a javanica, a tropical forest tree from Asia. Ann. Bot. 69:47–52.
Kephart, K.D. and D.R. Buxton. 1993. Forage quality responses of C3 and C4 perennial grasses to shade. Crop Sci. 33:831–837.
Kiniry, J.R., C.R. Tischler, W.D. Rosenthal, and T.J. Gerik. 1992. Nonstructural carbohydrate utilization by sorghum and maize shaded during grain growth. Crop Sci. 32:131–137.
Klassen, S.L., G. Rithcie, J.M. Frantz, D. Pinnock, and B. Bugbee. 2003. Real-time imaging of ground cover: Relationships with radiation capture, canopy photosynthesis, and daily growth rate, p. 1–12. In: T. Van Toai, D. Major, M. McDonald, J. Schepers, L. Tarpley, K.A. Barbarick, J.J. Volenec, W.A. Dick, and D.M. Kral (eds.). Digital imaging and spectral techniques: Applications to precision agriculture and crop physiology. Amer. Soc. Agron. Spec. Publ. 66, ASA, Madison, Wis.
Lal, A. and G.E. Edwards. 1995. Maximum quantum yields of O2 evolution in C4 plants under high CO2. Plant Cell Physiol. 36:1311–1317.
Lambers, H., F.S. Chapin III, and T.L. Pons. 1998. Plant physiological ecology. Springer-Verlag. New York.
Levy, P.E., J.B. Moncrieff, J.M. Massheder, P.G. Jarvis, S.L. Scott, and J. Brouwer. 1997. CO2 fl uxes at leaf and canopy scale in millet, fallow and tiger bush vegetation at the HAPEX-Sahel southern super-site. J. Hydrology 188/189:612–632.
Liu, H., F. Li, and H. Xu. 2004. Defi ciency of water can enhance root respiration rate of drought-sensitive but not drought-tolerant spring wheat. Agr. Water Mgt. 64:41–48.
577.indd 926577.indd 926 10/14/05 5:36:32 PM10/14/05 5:36:32 PM
927J. AMER. SOC. HORT. SCI. 130(6):918–927. 2005.
Logan, B.A., B. Demmig-Adams, W.W. Adams, and S.C. Grace. 1998. Antioxidants and xanthophyll cycle-dependent energy dissipation in Cucurbita pepo L. and Vinca major L. acclimated to four growth PPFDs in the fi eld. J. Expt. Bot. 49:1869–1879.
Mbewe, D.M.N. and R.B. Hunter. 1986. The effect of shade stress on the performance of corn for silage versus grain. Can. J. Plant Sci. 66:53–60.
McCree, K.J. 1974. Equations for the rate of dark respiration of white clover and grain sorghum, as a function of dry weight, photosynthetic rate, and temperature. Crop Sci. 14:509–514.
McCree, K.J. 1982. Maintenance requirements of white clover at high and low growth rates. Crop Sci. 22:345–351.
McDermitt, D.K. and R.S. Loomis. 1981. Elemental composition of biomass and its relation to energy content, growth effi ciency, and growth yield. Ann. Bot. 48:275–290.
Monje, O. and B. Bugbee. 1996. Characterizing photosynthesis and transpiration of plant communities in controlled environments. Acta Hort. 440:123–128.
Moser, L.E., J.J. Volenec, and C.J. Nelson. 1982. Respiration, carbohydrate content, and leaf growth of tall fescue. Crop Sci. 22:781–786.
Nemali, K.S. and M.W. van Iersel. 2004. Light effects on wax begonia: Photosynthesis, growth respiration, maintenance respiration, and carbon use effi ciency. J. Amer. Soc. Hort. Sci. 129:416–424.
Neter, J., M.H. Kutner, C.J. Nachsheim, and W. Wasserman. 1996. Ap-plied linear statistical models. 4th ed. Irwin, Chicago.
Noguchi, K. and I. Terashima. 1997. Different regulation of leaf respira-tion between Spinacia oleracea, a sun species, and Alocasia odora, a shade species. Physiol. Planta. 101:1–7.
Norman, J.M. and T.J. Arkebauer. 1991. Predicting canopy photosynthesis and light-use effi ciency from leaf characteristics, p. 75–94. In: K.J. Boote, R.S. Loomis, C.W. Stuber, G.A. Peterson, S.H. Mickelson, and P. Kasper (eds.) Modeling crop photosynthesis-from biochemistry to canopy. Crop Sci. Soc. Amer. Spec. Pub. 19, CSSA, Madison, Wis.
Pearman, I., S.M. Thomas, and G.N. Thorne. 1981. Dark respiration of several varieties of winter wheat given different amounts of nitrogen fertilizer. Ann. Bot. 47:535–546.
Peng, S., D.M. Eissenstat, J.H. Graham, K. Williams, and N.C. Hodge. 1993. Growth depression in mycorrhizal citrus at high-phosphorus supply: Analysis of carbon costs. Plant Physiol. 101:1063–1071.
Penning de Vries, F.W.T., A.H.M. Brunsting, and H.H. van Laar. 1974. Products, requirements and effi ciency of biosynthesis: A quantitative approach. J. Theor. Biol. 45:339–377.
Raulier, F., P.Y. Bernier, and C. Ung. 1999. Canopy photosynthesis of sugar maple (Acer saccarum): Comparing big-leaf and multilayer ex-trapolations of leaf-level measurements. Tree Physiol. 19:407–420.
Sharp, R.E., M.A. Matthews, and J.S. Boyer. 1984. Kok effect and the quantum yield of photosynthesis. Light partially inhibits dark respira-tion. Plant Physiol. 75:95–101.
Sims, D.A. and R.W. Pearcy. 1991. Photosynthesis and respiration in Alocasia macrorrhiza following transfers to high and low light. Oecologia 86:447–453.
Stoller, E.W. and R.A. Myers. 1989. Response of soybeans (Glycine max) and four broadleaf weeds to reduced irradiance. Weed Sci. 37:570–574.
Thornley, J.M.H. 2002. Response to growth-maintenance component models are an inaccurate representation of plant respiration. Crop Sci. 42:660.
Thornley, J.H.M. and M.G.R. Cannell. 2000. Modelling the compo-nents of plant respiration: Representation and realism. Ann. Bot. 85:55–67.
Thornley, J.H.M. and I.R. Johnson. 1990. Whole plant respiration and growth energetics, p. 264–285. In: Plant and crop modeling. Clarendon Press, Oxford, U.K.
Vanden Heuvel, J.E., J.T.A. Proctor, K.H. Fischer, and J.A. Sullivan. 2004. Shading affects morphology, dry matter partitioning, and photosynthetic response of greenhouse-grown ʻChardonnay ̓grapes. HortScience 39:65–70.
van Iersel, M.W. 1999. Auxin applications affect posttransplant CO2 exchange rate and growth of bare-rooted vinca [Catharanthus roseus (L.) G. Don] seedlings. J. Amer. Soc. Hort. Sci. 124:234–238.
van Iersel, M.W. and B. Bugbee. 2000. A multiple chamber, semicontinu-ous, crop carbon dioxide exchange system: Design, calibration, and data interpretation. J. Amer. Soc. Hort. Sci. 125:86–92.
Warren, C.R. and M.A. Adams. 2001. Distribution of N, Rubisco, and photosynthesis in Pinus pinaster and acclimation to light. Plant Cell Environ. 24:597–609.
Will, R.E., G.A. Barron, E.C. Burkes, B. Shiver, and R.O. Teskey. 2001. Relationship between intercepted radiation, net photosynthesis, respira-tion, and rate of stem volume growth of Pinus taeda and Pinus elliottii stands of different densities. For. Ecol. Management 154:155–163.
Witowski, J. 1997. Gas exchange of the lowest branches of young scots pine: A cost-benefi t analysis of seasonal branch carbon budget. Tree Physiol. 17:757–765.
Wullschleger, S.D. and R.J. Norby. 1992. Respiratory cost of leaf growth and maintenance in white oak saplings exposed to atmospheric CO2 enrichment. Can. J. For. Res. 22:1717–1721.
Wullschleger, S.D., R.J. Norby, and C.A. Gunderson. 1992. Growth and maintenance respiration in leaves of Liriodendron tulipifera L. Exposed to long-term carbon dioxide enrichment in the fi eld. New Phytol. 121:515–523.
Zha, T.S., S. Kellomaki, and K.Y. Wang. 2003. Seasonal variation in respiration of 1-year-old shoots of scots pine exposed to elevated carbon dioxide and temperature for 4 years. Ann. Bot. 92:89–96.
Zhao, D. and D. Oosterhuis. 1998. Cotton responses to shade at dif-ferent growth stages: Nonstructural carbohydrate composition. Crop Sci. 38:1196–1203.
577.indd 927577.indd 927 10/14/05 5:36:37 PM10/14/05 5:36:37 PM