Embed Size (px)
Citation preview
Accessibility for wheelchair users and the
capability model: implications for planning and
modelling
Catherine Holloway
Email: [email protected]
Twitter:cathyholloway1
ESRC Modelling on the Move 5: Participatory Modelling
University of Birmingham 20th November 2013
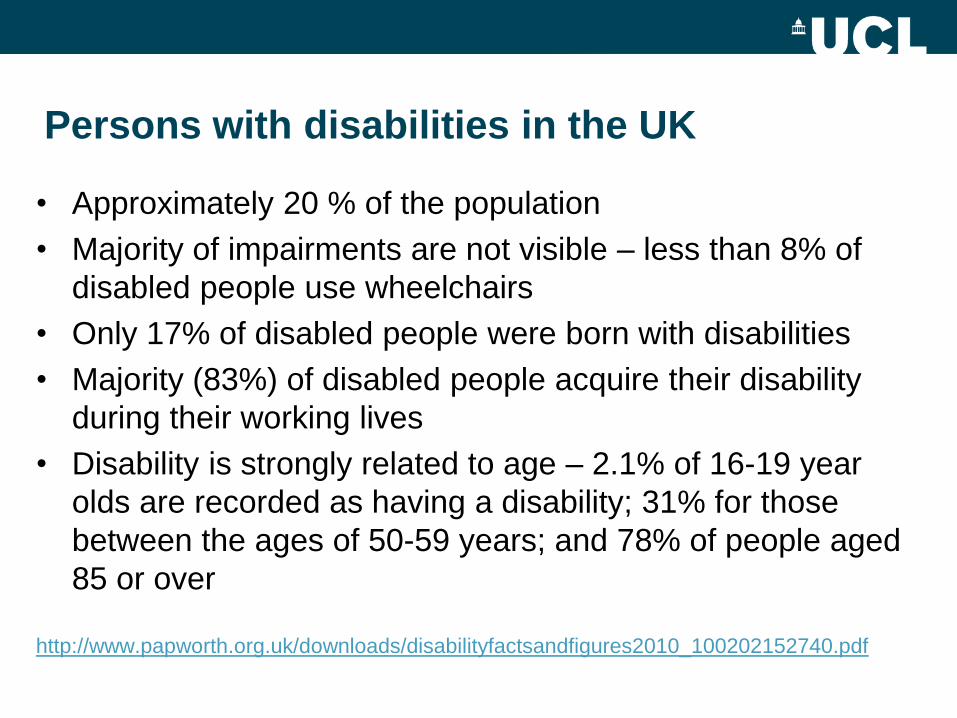
Persons with disabilities in the UK
• Approximately 20 % of the population
• Majority of impairments are not visible – less than 8% of
disabled people use wheelchairs
• Only 17% of disabled people were born with disabilities
• Majority (83%) of disabled people acquire their disability
during their working lives
• Disability is strongly related to age – 2.1% of 16-19 year
olds are recorded as having a disability; 31% for those
between the ages of 50-59 years; and 78% of people aged
85 or over
http://www.papworth.org.uk/downloads/disabilityfactsandfigures2010_100202152740.pdf
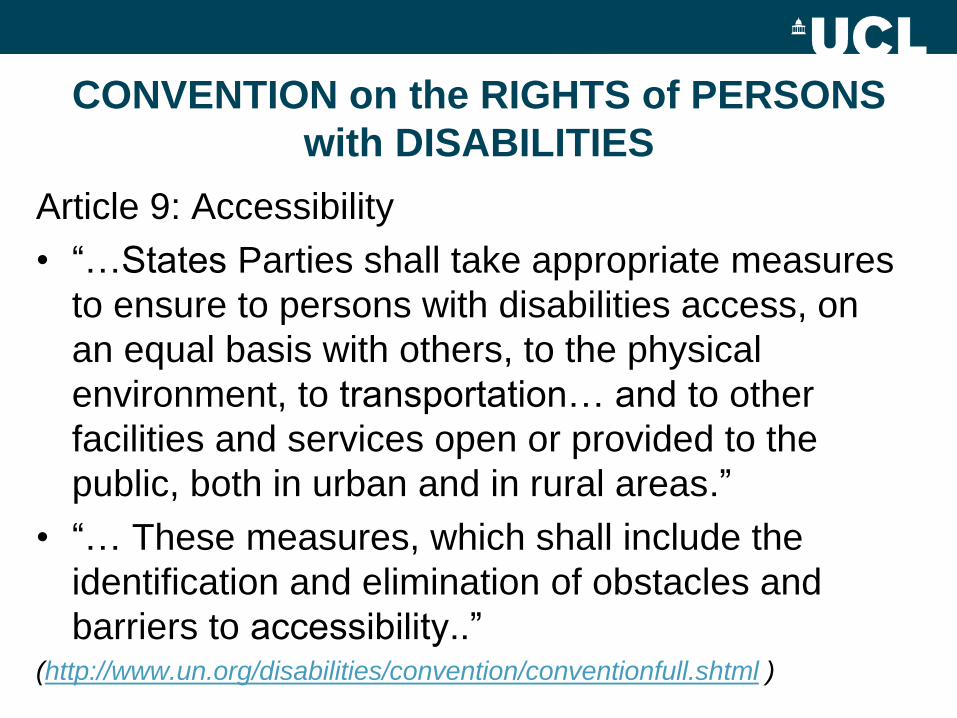
CONVENTION on the RIGHTS of PERSONS
with DISABILITIES
Article 9: Accessibility
• “…States Parties shall take appropriate measures
to ensure to persons with disabilities access, on
an equal basis with others, to the physical
environment, to transportation… and to other
facilities and services open or provided to the
public, both in urban and in rural areas.”
• “… These measures, which shall include the
identification and elimination of obstacles and
barriers to accessibility..” (http://www.un.org/disabilities/convention/conventionfull.shtml )
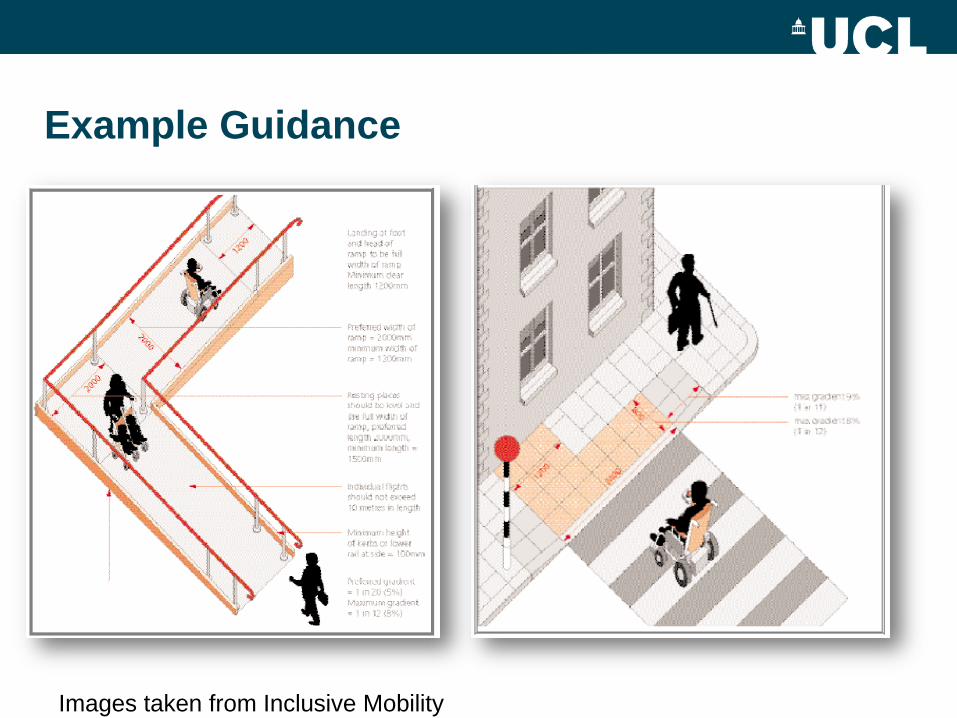
Example Guidance
Images taken from Inclusive Mobility
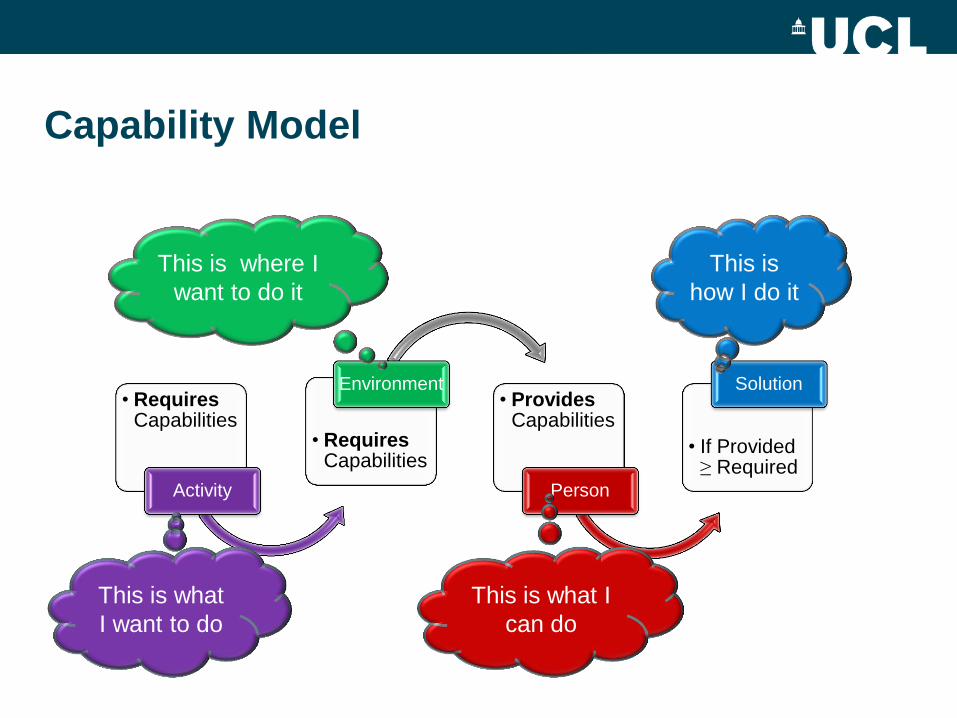
Capability Model
• Requires Capabilities
Activity
• Requires Capabilities
Environment • Provides
Capabilities
Person
• If Provided ≥ Required
Solution
This is what
I want to do
This is where I
want to do it
This is what I
can do
This is
how I do it
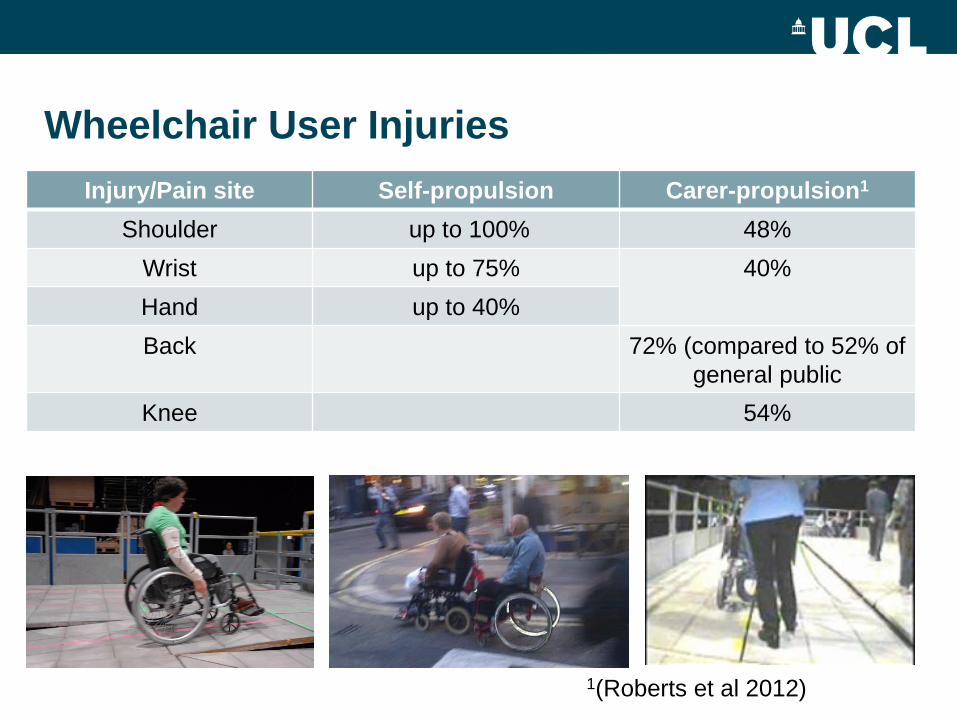
Wheelchair User Injuries
Injury/Pain site Self-propulsion Carer-propulsion1
Shoulder up to 100% 48%
Wrist up to 75% 40%
Hand up to 40%
Back 72% (compared to 52% of
general public
Knee 54%
1(Roberts et al 2012)
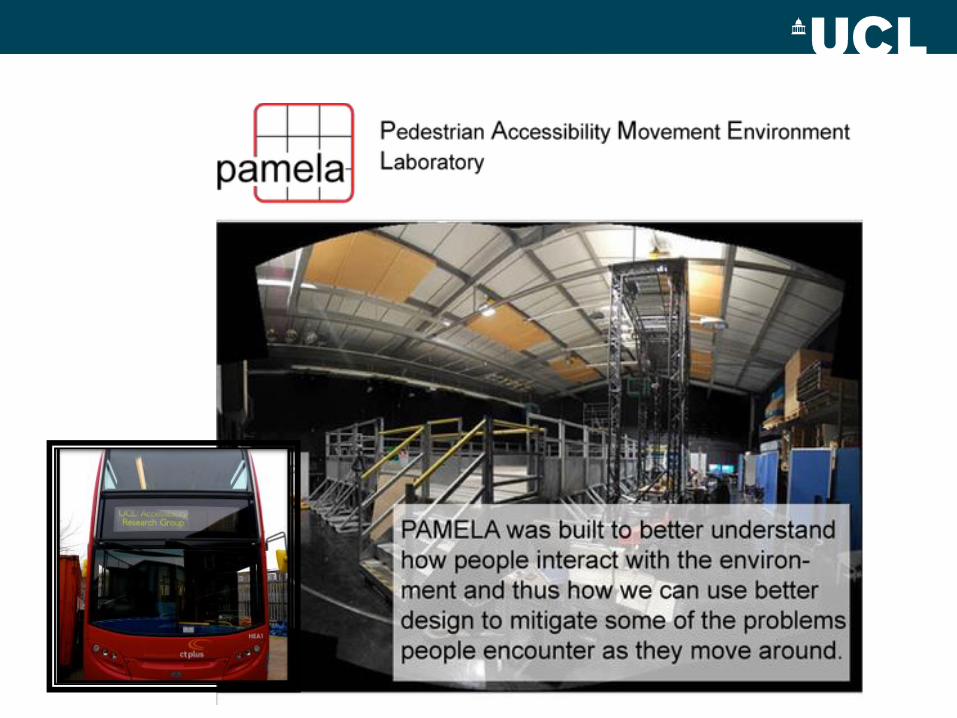
HOW CAN WE MEASURE
MICRO-ACCESSIBILITY?
GETTING ON THE BUS
Wheelchair accessibility
Footways
"Almost all journeys start and finish by walking or
wheeling. No matter how accessible transport
itself may be, if the walking [or wheeling]
environment contains barriers to movement than
the usability of transport services is largely
negated"
(European Conference of Ministers of Transport 1999, Pg. 19)
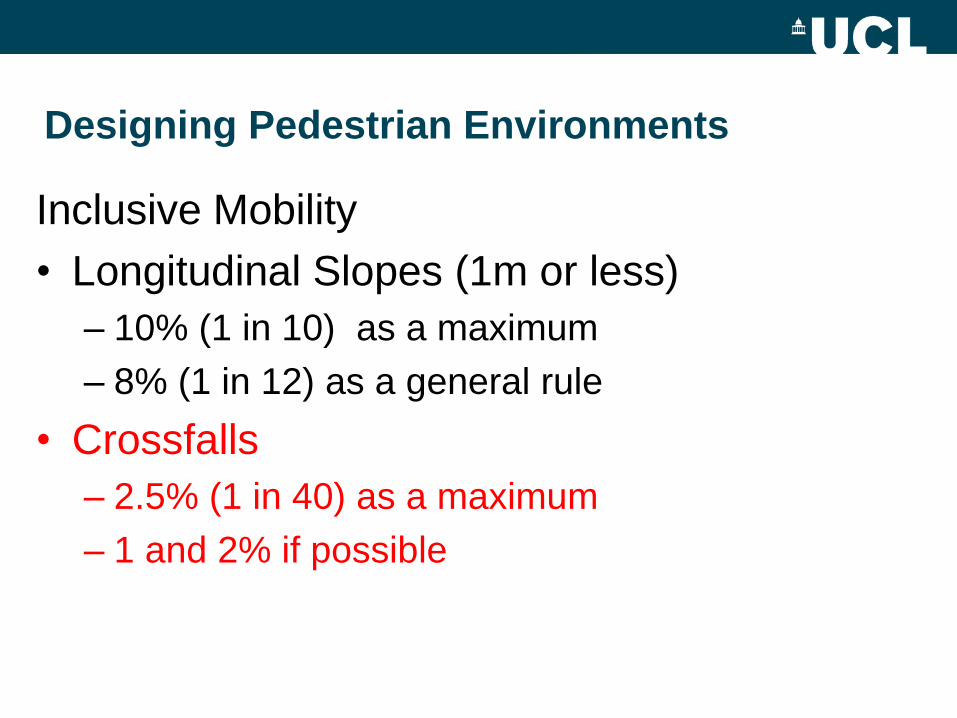
Designing Pedestrian Environments
Inclusive Mobility
• Longitudinal Slopes (1m or less)
– 10% (1 in 10) as a maximum
– 8% (1 in 12) as a general rule
• Crossfalls
– 2.5% (1 in 40) as a maximum
– 1 and 2% if possible
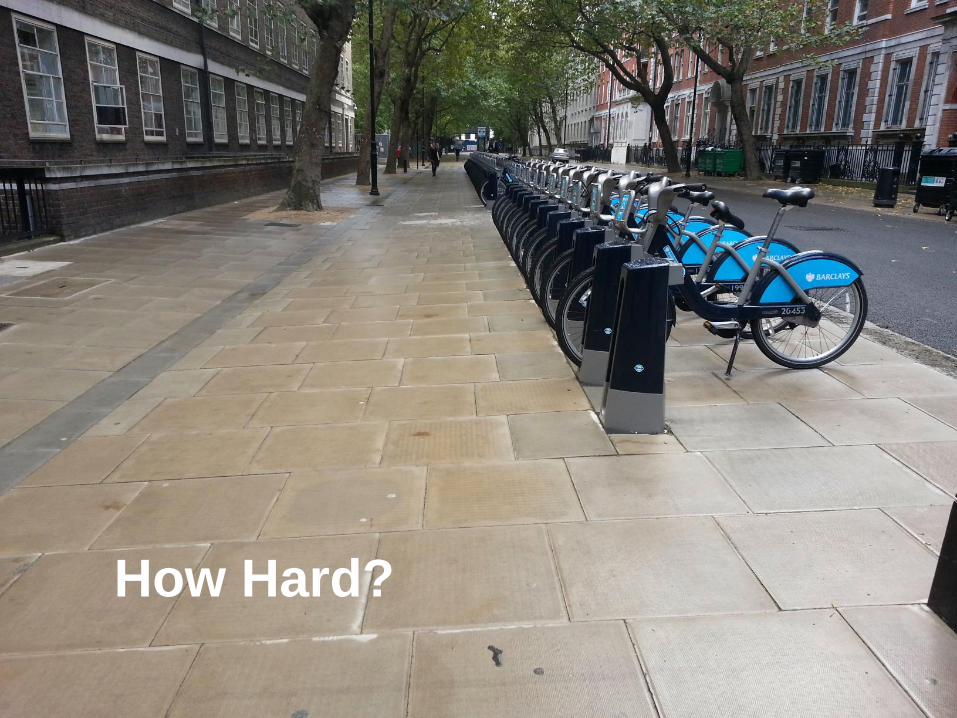
How Hard?
Research Question
What capabilities are required by a wheelchair
user when travelling on a footway
Phone: +81 (0) 6 6368 0803 Phone: +81 (0) 6 6368 0803
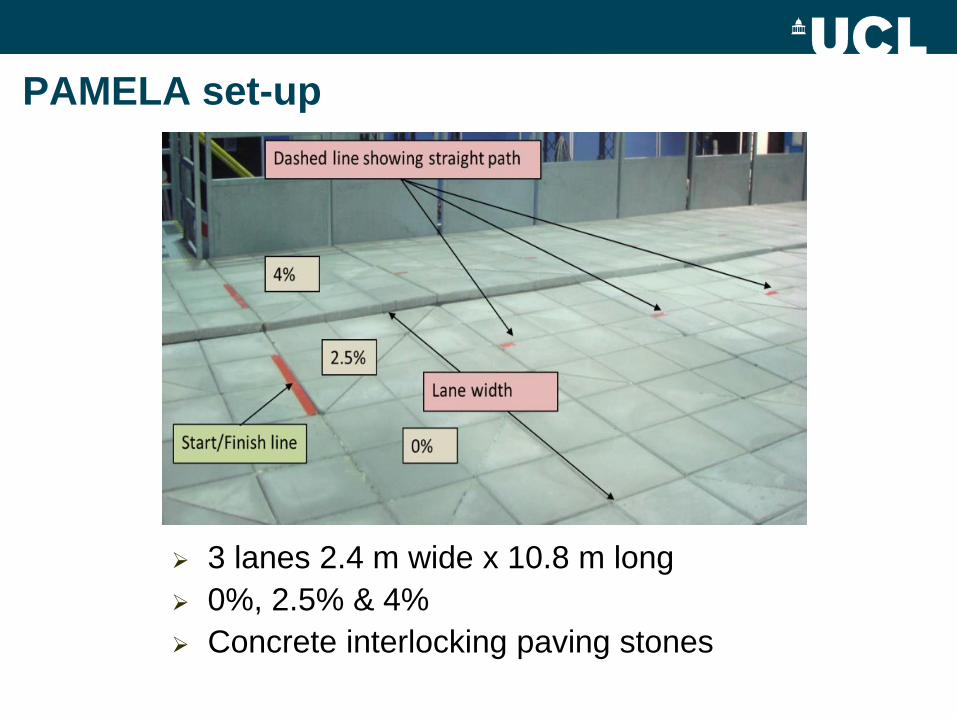
PAMELA set-up
3 lanes 2.4 m wide x 10.8 m long
0%, 2.5% & 4%
Concrete interlocking paving stones
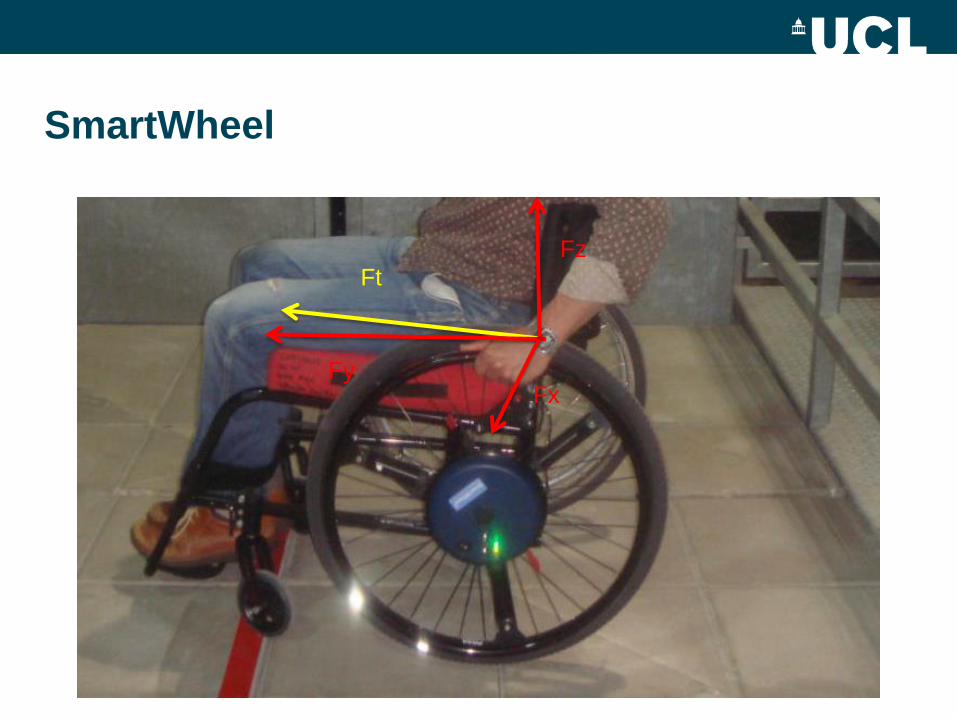
SmartWheel
Fx Fy
Fz
Ft
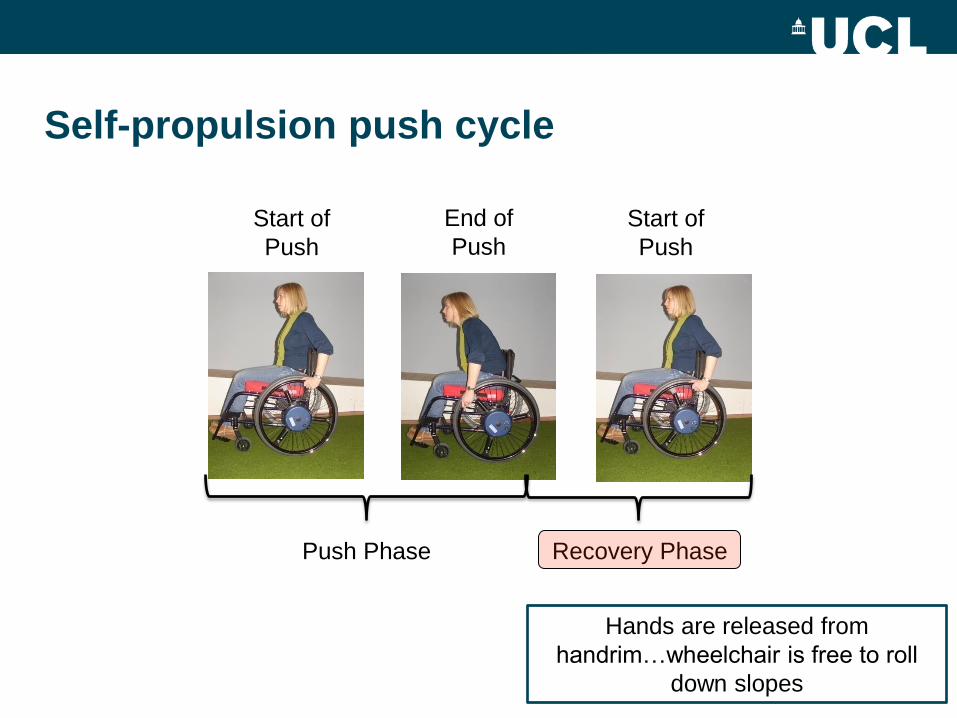
Self-propulsion push cycle
Start of
Push
End of
Push
Start of
Push
Push Phase Recovery Phase
Hands are released from
handrim…wheelchair is free to roll
down slopes
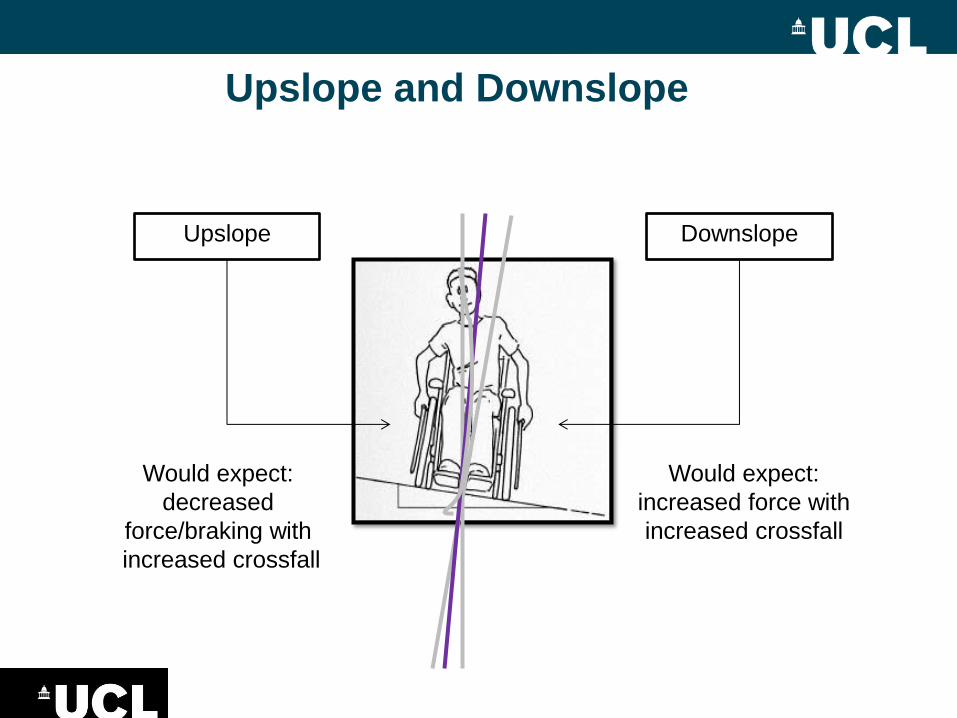
Upslope and Downslope
Upslope Downslope
Would expect:
decreased
force/braking with
increased crossfall
Would expect:
increased force with
increased crossfall
`
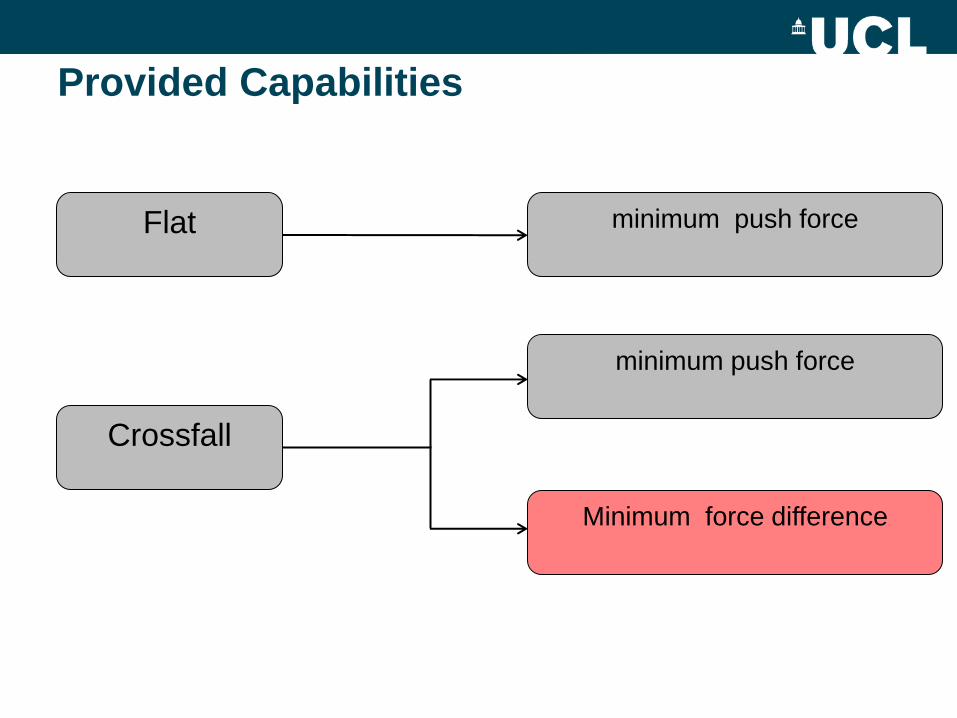
Provided Capabilities
Flat minimum push force
Crossfall
minimum push force
Minimum force difference
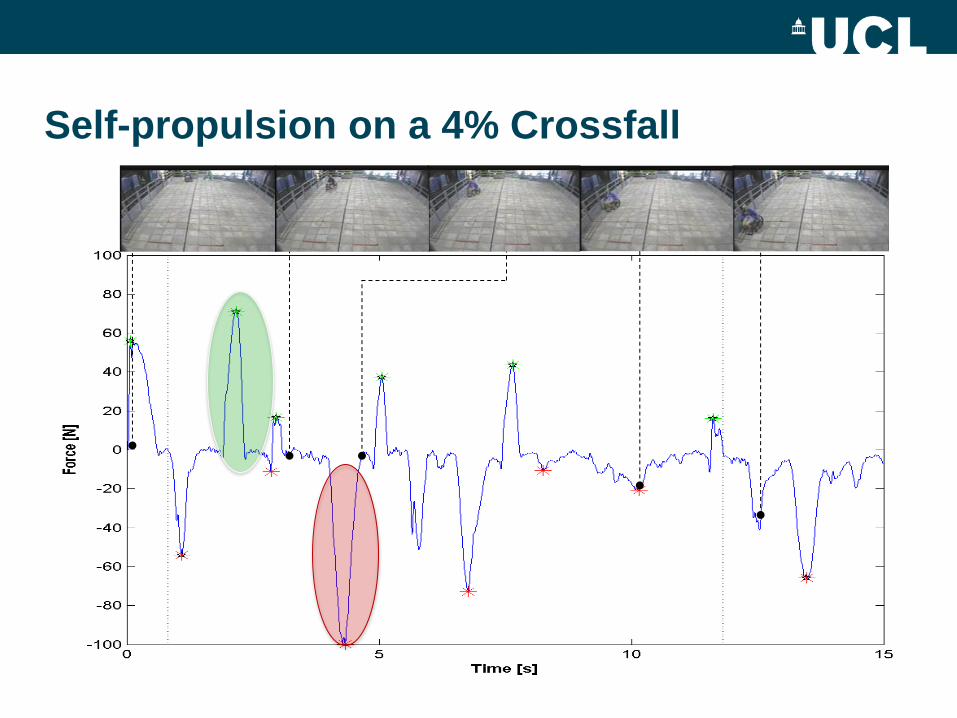
Self-propulsion on a 4% Crossfall
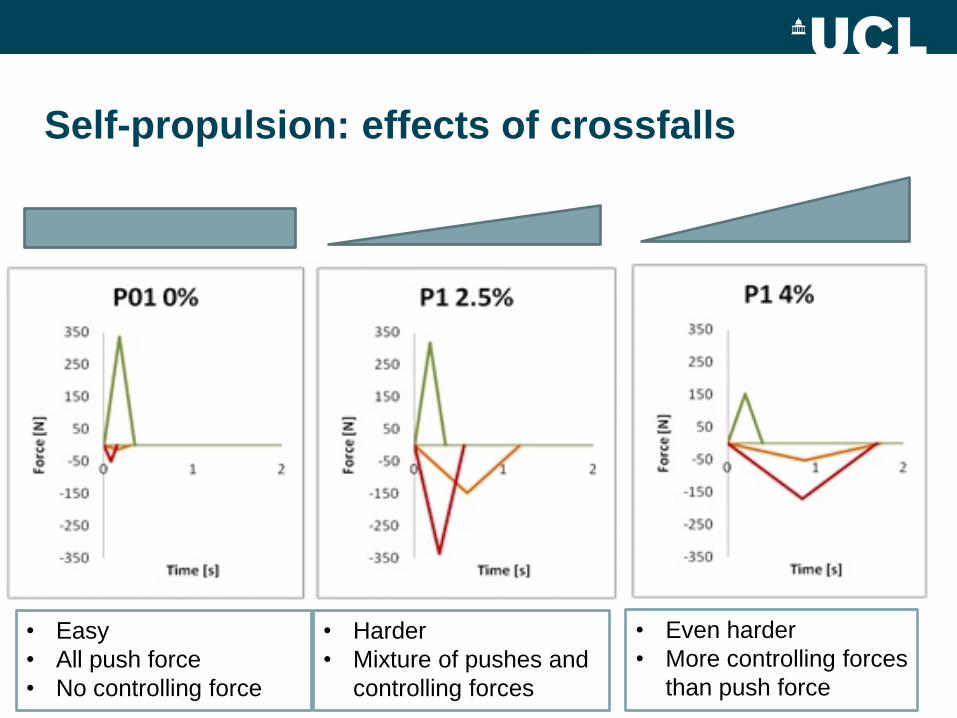
Self-propulsion: effects of crossfalls
• Easy
• All push force
• No controlling force
• Harder
• Mixture of pushes and
controlling forces
• Even harder
• More controlling forces
than push force

Sapey, Stewart, Donaldson .”The Social Implications of Increases in Wheelchair Use”
Attendant Wheelchair Propulsion
408,000

Provided Capabilities
Flat minimum push force
Crossfall
minimum push force
Minimum force difference
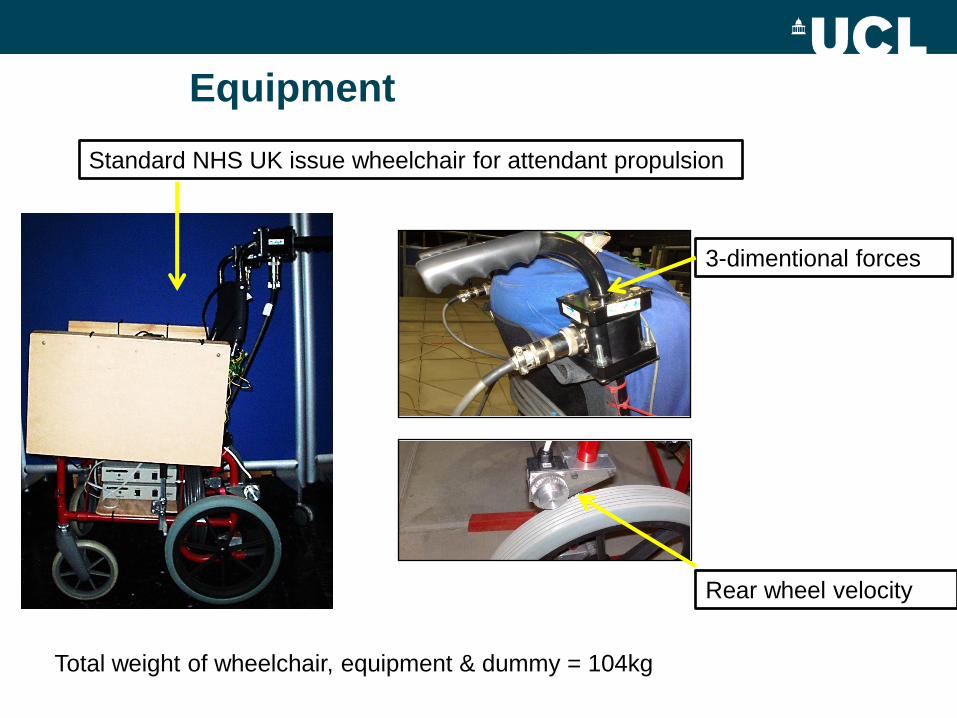
Equipment
Standard NHS UK issue wheelchair for attendant propulsion
3-dimentional forces
Rear wheel velocity
Total weight of wheelchair, equipment & dummy = 104kg
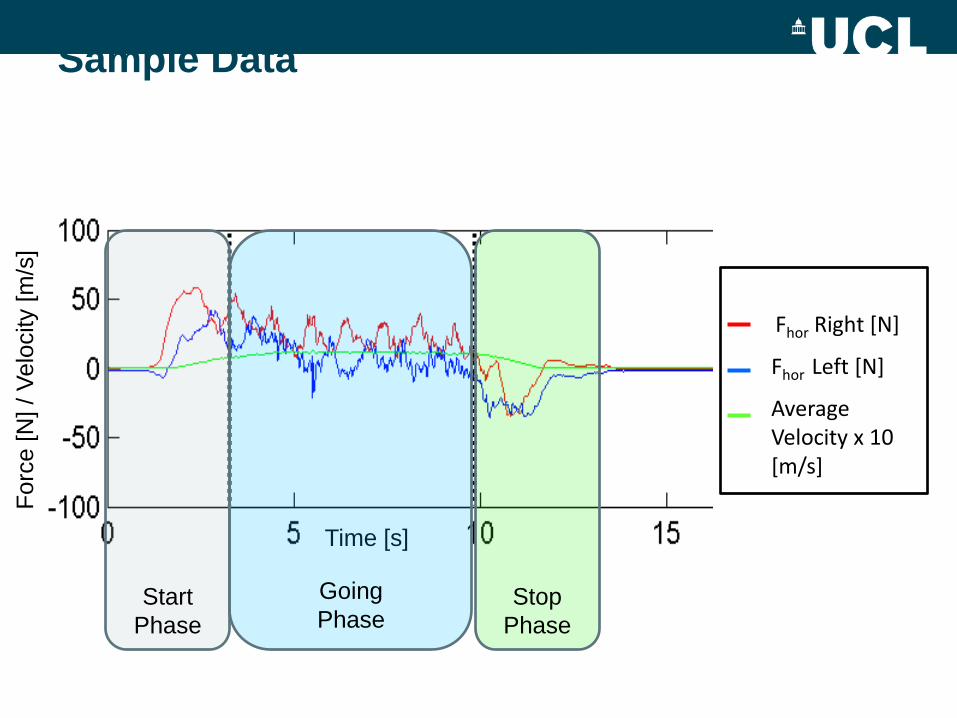
Sample Data
Fhor Right [N]
Fhor Left [N]
Average Velocity x 10 [m/s]
Forc
e [N
] /
Velo
city [
m/s
]
Time [s]
Start
Phase
Stop
Phase
Going
Phase
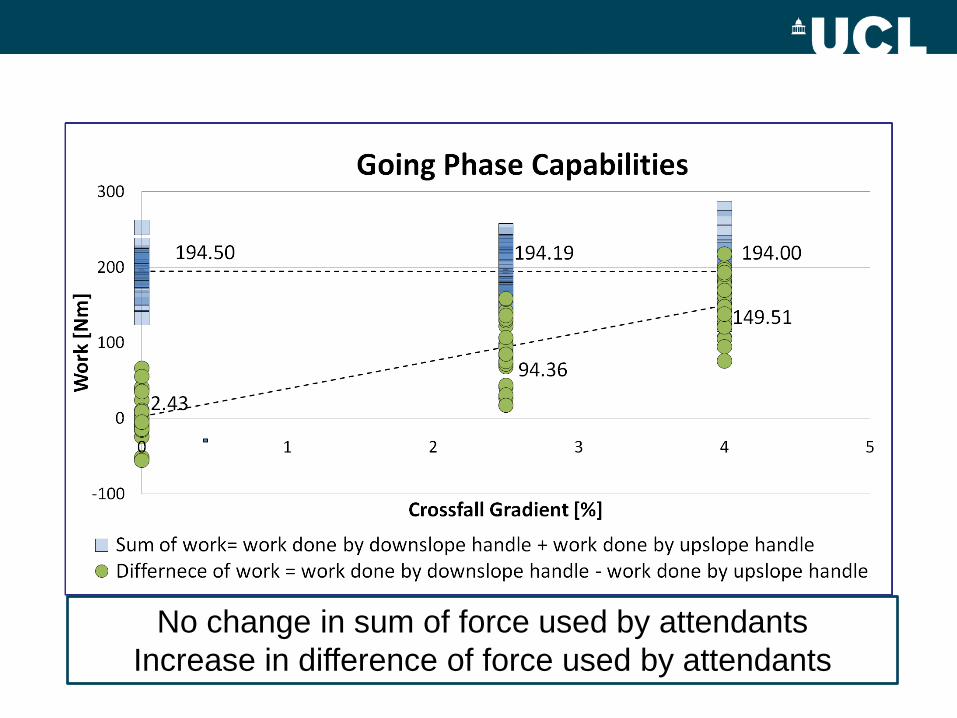
No change in sum of force used by attendants
Increase in difference of force used by attendants
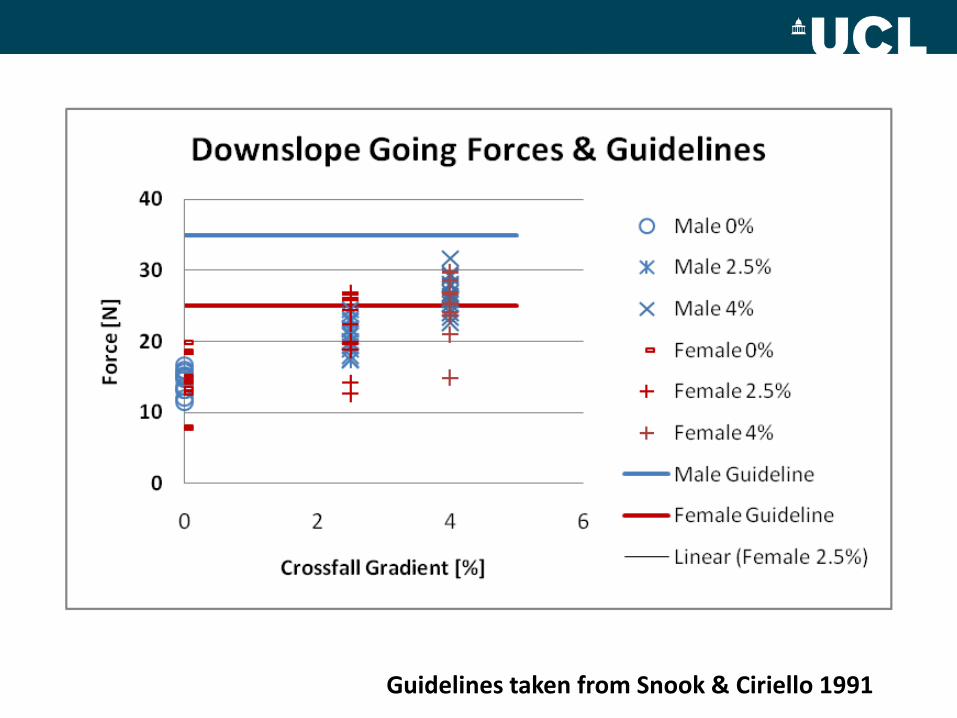
Guidelines taken from Snook & Ciriello 1991
GETTING ON THE BUS
Bus Accessibility
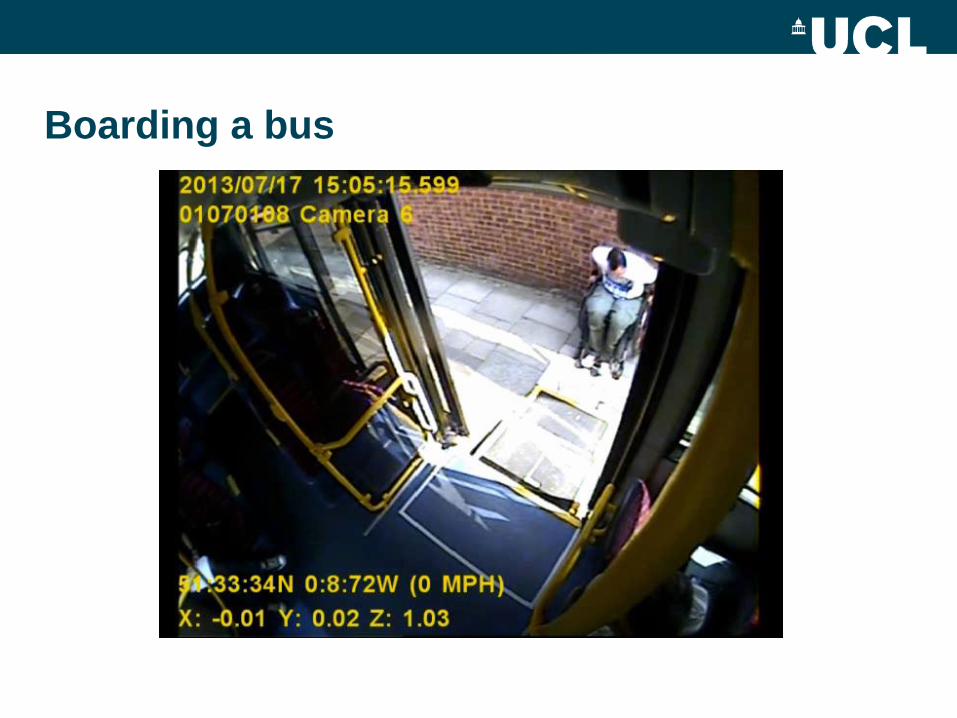
Boarding a bus
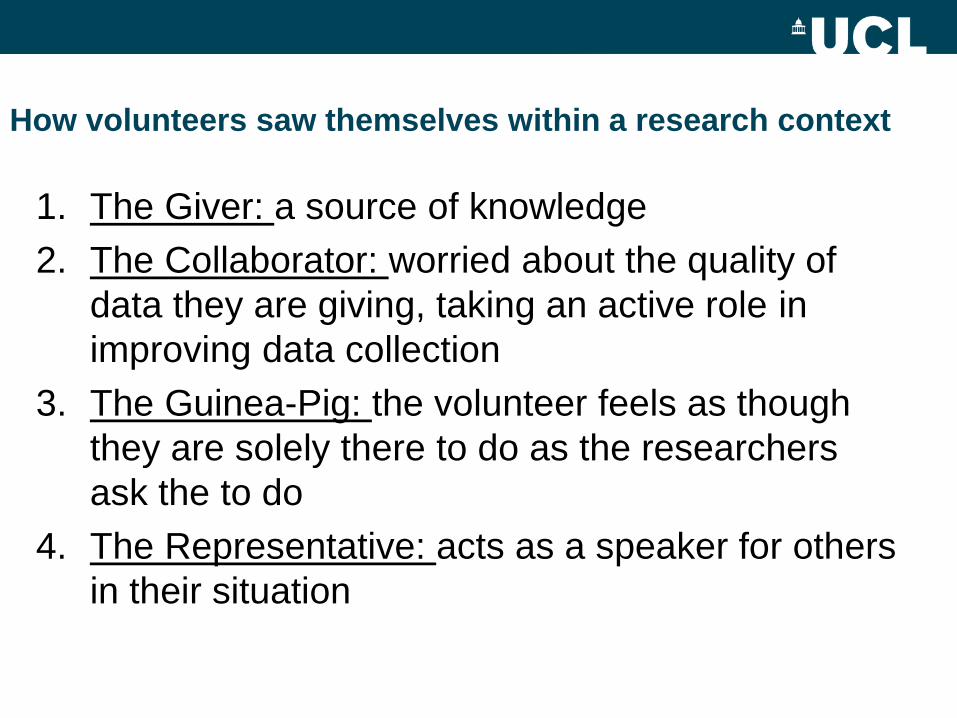
How volunteers saw themselves within a research context
1. The Giver: a source of knowledge
2. The Collaborator: worried about the quality of
data they are giving, taking an active role in
improving data collection
3. The Guinea-Pig: the volunteer feels as though
they are solely there to do as the researchers
ask the to do
4. The Representative: acts as a speaker for others
in their situation
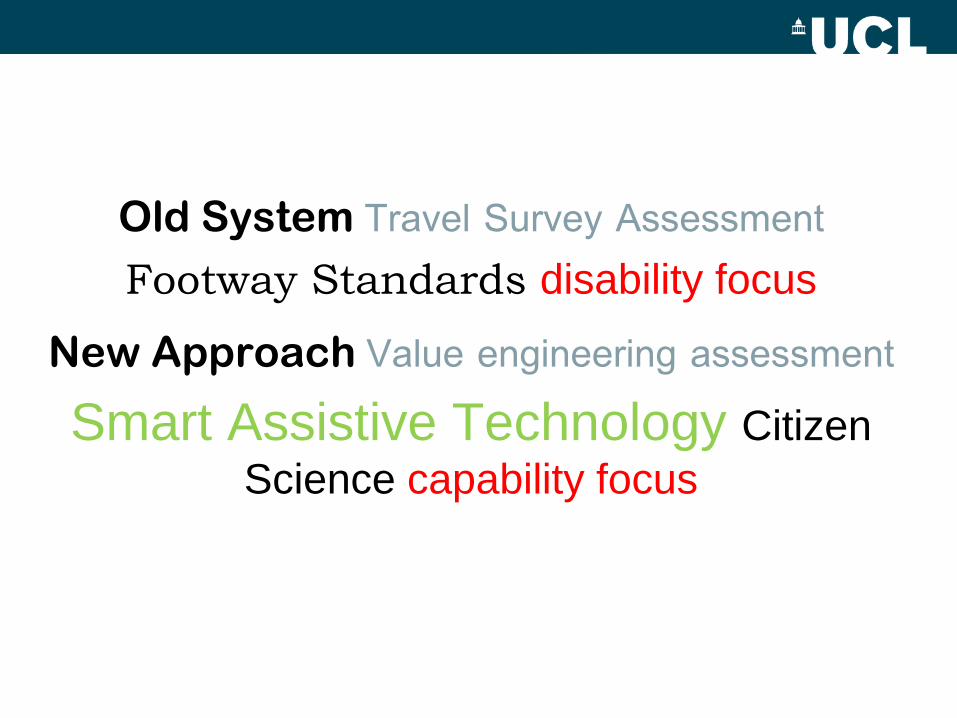
Old System Travel Survey Assessment Footway Standards disability focus
New Approach Value engineering assessment Smart Assistive Technology Citizen
Science capability focus
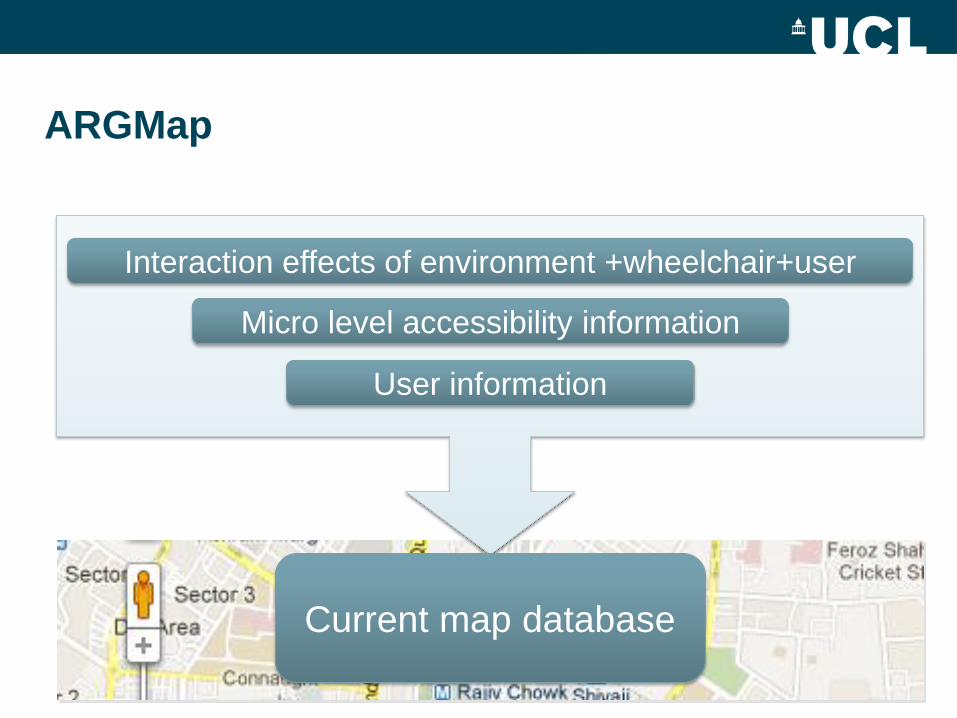
ARGMap
Current map database
Micro level accessibility information
User information
Interaction effects of environment +wheelchair+user
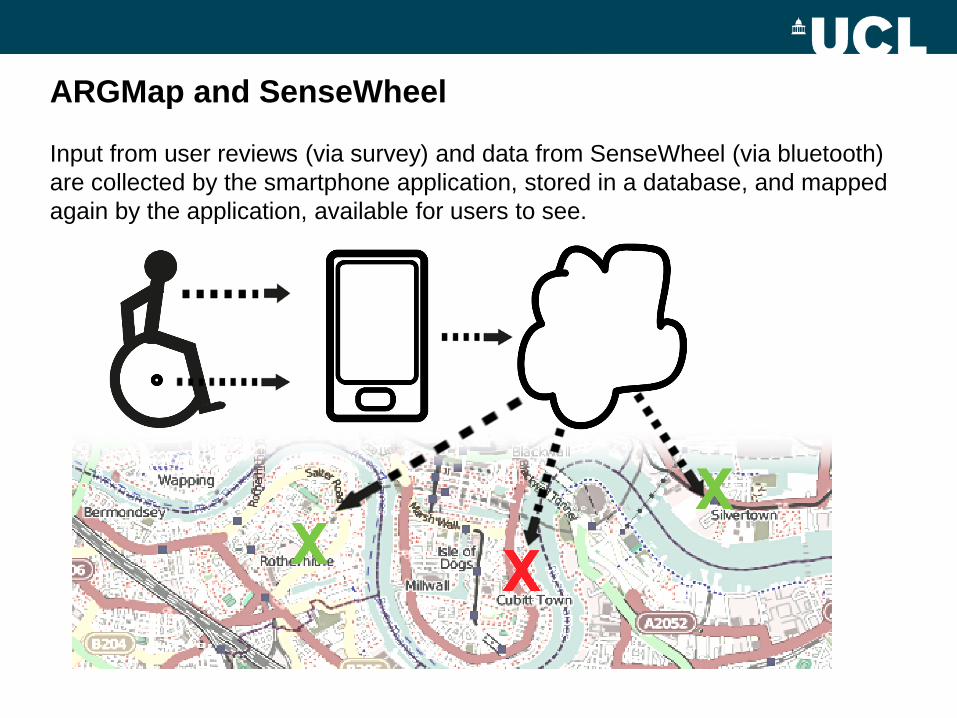
ARGMap and SenseWheel
Input from user reviews (via survey) and data from SenseWheel (via bluetooth)
are collected by the smartphone application, stored in a database, and mapped
again by the application, available for users to see.
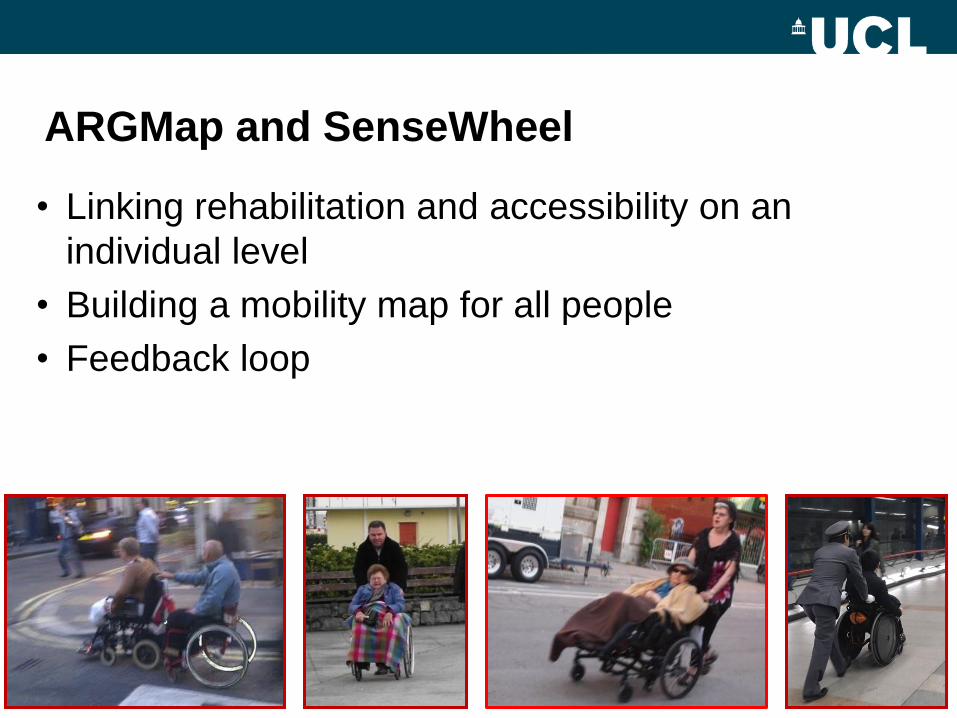
ARGMap and SenseWheel
• Linking rehabilitation and accessibility on an
individual level
• Building a mobility map for all people
• Feedback loop
http://www.cege.ucl.ac.uk/arg/Pages/TARSAN.aspx
Thank you for your attention…
…Any Questions?