Embed Size (px)
Citation preview

Algebra II/Intermediate Algebra,
Precalculus, and (Non-STEM) Statistics
with Embedded Real World Applications
in Assignments and Assessments
Version 1.0
Curricula Guide for ACCESS

M a t h e m a t i c s • A C C E S S C u r r i c u l a G u i d e
1
Version 1.0
Algebra II/Intermediate Algebra,
Precalculus, and (Non-STEM) Statistics
with Embedded Real World Applications
in Assignments and Assessments
Curricula Guide for ACCESS
Aligning Curricula and Career Education
for Student Success (ACCESS)

A C C E S S C u r r i c u l a G u i d e • M a t h e m a t i c s
2
This project was made possible through the generous support of
The William and Flora Hewlett Foundation
The James Irvine Foundation
The Evelyn and Walter Haas Jr. Fund
The Girard Foundation

M a t h e m a t i c s • A C C E S S C u r r i c u l a G u i d e
3T a b l e o f C o n t e n t s
Introduction ......................................................................................................................................................... Page 4
Career Clusters ................................................................................................................................................... Page 9
How to Use This Guide ...................................................................................................................................Page 10
List of ACCESS Math Competencies ......................................................................................................... Page 11
ACCESS Math Competencies ...................................................................................................................... Page 17
Algebra II/Intermediate Algebra Model Assessments for Competencies .......................... Page 17
Precalculus Model Assessments for Competencies ...................................................................Page 87
Statistics (Non-STEM) Model Assessments for Competencies ............................................Page 153
Acknowledgements/Contributors ......................................................................................................... Page 207
Appendix: Mapping ACCESS Competencies to California Content Standards and Common Core Standards .............................................................................................Page 216
For more information, contact Shelly Valdez, EdD, at [email protected].
ACCESS Curricula Guide for

A C C E S S C u r r i c u l a G u i d e • M a t h e m a t i c s
I n t r o d u c t i o n4
I N T R O D U C T I O N
The ACCESS Curricula Guide for Mathematics is the result of many passionate discussions
about Intermediate Algebra (Algebra II), Precalculus, and non-STEM Statistics among
more than 100 K–12 and postsecondary math faculty and Career Technical Education
(CTE) instructors throughout California. These courses were chosen for discussion because
data on math course enrollment at a number
of K–12s, community colleges, and universities
across California indicated that large numbers
of students enroll in them, often to complete
prerequisites for other math courses offered at
those institutions. The goal of these discussions
was to define the exit and entrance competencies
that students should possess in these three
math courses. CTE instructors worked with math
faculty to develop assessments that teachers can
use to measure whether students are meeting
expectations, and make these assessments apply
to real world experiences.
This effort, called ACCESS (Aligning Curricula
and Career Education for Student Success),
launched in September 2008 with the backing
of foundation leaders who believe in the type of
intersegmental work that distinguishes Cal-PASS
from other educational initiatives. The foundations are: The William and Flora Hewlett Foundation,
The James Irvine Foundation, The Evelyn and Walter Haas Jr. Fund, and The Girard Foundation.
Thirteen regions around the state played a role in defining core competencies in
Algebra II, Precalculus, and non-STEM Statistics, and developing assessments to measure
achievement in each course. Based on the experience of the math faculty and their
knowledge of the California State Standards and Community College Student Learning
Outcomes, topics and skills were identified that the faculty felt were important for
students to know upon completing the courses. Once these important topics and skills
This guide is unique in three
distinct ways:
1) It takes an important step
beyond listing the gaps
between high school and
college math skills by
providing sample assessments
that measure mastery of the
core competencies.
2) It is the result of educational
segments working in unison.
3) It answers the often-asked
question from students:
“Where will I ever have to
use this?”

M a t h e m a t i c s • A C C E S S C u r r i c u l a G u i d e
I n t r o d u c t i o n 5
were identified and worded as measurable competencies, they were mapped relative to the
California Content Standards and Common Core Standards for alignment. (See Appendix:
Mapping ACCESS Competencies to California Content Standards and Common Core
Standards, page 216.)
T h e P r o b l e m
California high school graduates leave high school believing they are ready for college, but
the data demonstrate that even successful high school students are often ill-prepared for
college. Research over the past 10 years points to specific areas that are needed — both in
class and in the home — to prepare students for the rigors and habits needed to succeed in
college and beyond.
The messages most California high school students receive about standards for
attending a broad-access university or open-access community college are confusing.
Because it is generally perceived that it is easy to enter the community college and
California State University (CSU) systems, there are few intrinsic incentives to work hard
in high school.* Once students enroll in these colleges,
however, they face challenging placement exams, faculty
and university expectations, and graduation requirements
of which they are likely unaware.
Unlike messages students receive from competitive four-
year universities, messages received by students aiming for
what are perceived as less-selective universities provide
little information about the educational level at which they
should achieve. This lack of information is represented by the
number of college freshmen who must remediate in math and/or English and those who drop out.
Remediation rates in college are staggering: 53 percent of students matriculating into the CSU
system and as high as 90 percent at some community colleges.† While a majority of high school
graduates enter college, fewer than half leave with a degree. Many factors influence this attrition,
* Michael Kirst and Andrea Venezia, From High School to College: Improving Opportunities for Success in Post-Secondary Education, San Francisco: Jossey-Bass, 2004.
† Robert Johnstone, “Community College Pre-collegiate Research Across California: Findings, Implications, and the Future,” iJournal, no. 9, 2004.
Remediation rates in
college are staggering:
53 percent of students
matriculating into the
CSU system and as high
as 90 percent at some
community colleges.†

A C C E S S C u r r i c u l a G u i d e • M a t h e m a t i c s
I n t r o d u c t i o n6
but a report by the American Diploma Project states that the preparation students receive in
high school has been found to be the greatest predictor of bachelor’s degree attainment.‡
Although remediation rates at postsecondary institutions have remained steady for 30
years, the population going to college is rising, and the number of students needing remediation
is putting a strain on budgets and making the college experience longer and more arduous.
Students who are unprepared are often unaware of
this fact until they matriculate as freshmen. Already
accepted or registered, they are given placement
tests to determine if they are ready for college-
level work. The CSU accepts students who, by all
indicators, are ready (have taken necessary college-
prep courses), but once at the university, these
students must contend with their lack of preparedness for college-level work. Community
colleges accept all students, regardless of courses taken in high school.
The main source of this disconnect is the lack of communication and collaboration between
high school and higher education.§ High school teachers and college professors rarely talk
to each other about curriculum, learning issues, and expectations. This leads to confusion by
high school students and administrators regarding what it means to be prepared for college.
H e a d i n g To w a r d a S o l u t i o n
With specific instructions from ACCESS project managers, 13 Cal-PASS math Professional
Learning Councils (regional councils made up of teams of discipline-based faculty from
elementary, middle school, high school, community college, and university segments) from
around California deconstructed what they teach in the classroom. Conversation was not
always smooth, as opinions surfaced about what students really need to know in Algebra II,
Precalculus, and (non-STEM) Statistics to prepare them for college and careers.
‡ American Diploma Project, Ready or Not: Creating a High School Diploma that Counts, 2004, www.achieve.org/files/ADPreport_7.pdf.§ David T. Conley, College Knowledge: What It Really Takes for Students to Succeed and What We Can Do to Get
Them Ready, San Francisco: Jossey-Bass, 2005.
The main source of this
disconnect is the lack
of communication and
collaboration between high
school and higher education.§

M a t h e m a t i c s • A C C E S S C u r r i c u l a G u i d e
I n t r o d u c t i o n 7
Research and documents (like those from the math deconstruction project led by Cal-
PASS participants**) ignited passionate discourse among math faculty from high schools,
community colleges, and universities in California. Gathering math faculty from across
educational segments is something Cal-PASS does often,
and is a feat unto itself. The vision of this project was
already realized when 200 math and English teachers
gathered for three days to debate, challenge, argue, and
— finally — come to consensus. Cal-PASS groups worked
tirelessly to articulate what students should know when
they walk into, and then out of, math and English classes
from 11th grade to transfer-level at community college.
Under the ACCESS grant, Cal-PASS Professional
Learning Councils worked throughout the second year of the grant to refine and align the
competencies and begin the work of designing assessments for each competency. They
designed these assessments specifically to be of high interest to students and to apply to real
world work situations with the intention of linking math to careers (contextualized learning).
During the summer of 2010, a convening was held for both teachers and CTE instructors
to embed CTE examples and assessments into the competencies. They used the career
clusters provided by the California Community Colleges Chancellor’s Office to guide them
in this CTE crossover effort.
T h e F i n a l P r o d u c t
This ACCESS Curricula Guide for Mathematics is the summation of math faculty ACCESS
work and represents newly aligned, contextually relevant, and collaboratively developed
curricula. This document is intended to supplement — not supplant — statewide or
institution-based curricula and expectations for multiple audiences, including high school
and postsecondary faculty, curriculum and instruction professionals, and campus-level or
statewide educational leaders.
The vision of this
project was already
realized when 200
English and math teachers
gathered for three days
to debate, challenge,
argue, and — finally —
come to consensus.
** Cal-PASS, Algebra I California Content Standards, Standards Deconstruction Project v. 2.0, 2008; Algebra II California Content Standards, Standards Deconstruction Project v. 2.0, 2008; Geometry California Content Standards, Standards Deconstruction Project v. 1.0, 2008; Pre-Calculus California Content Standards, Standards Deconstruction Project v. 1.0, 2008. www.cal-pass.org/Councils.aspx.

8
A C C E S S C u r r i c u l a G u i d e • M a t h e m a t i c s
I n t r o d u c t i o n
Specifically, this guide
1. documents the necessary competencies of three subsequent levels of math (spanning
from high school to college);
2. provides assessment examples for how faculty can evaluate student competency levels;
3. embeds real world applications into assignments and assessments to contextualize
materials outside of academia; and
4. maps the relationship between ACCESS curricula and California-based and nationally
based standards.
It is our hope that K–12 teachers, as well as math instructors at community colleges
and universities, will find the curricula and assessments in this guide both user-friendly
and useful. Further, those in math teacher preparation programs could use this guide as a
textbook supplement to provide concrete examples of what should be practiced regularly
in the classroom to help students prepare for college and careers.

9
M a t h e m a t i c s • A C C E S S C u r r i c u l a G u i d e
C a r e e r C l u s t e r s
Engin
eeri
ng &
Desig
n:
• A
rch
ite
ctu
ral &
Str
uc
tura
l E
ng
ine
eri
ng
• C
om
pu
ter
Ha
rdw
are
, E
lec
tric
al,
& N
etw
ork
ing
En
gin
ee
rin
g•
En
gin
ee
rin
g D
esi
gn
• E
ng
ine
eri
ng
Te
ch
no
log
y•
En
viro
nm
en
tal &
Na
tura
l S
cie
nc
e E
ng
ine
eri
ng
All A
sp
ects
of
Ind
ustr
y:
Bu
sin
ess
Pla
nn
ing
Ma
na
ge
me
nt
He
alt
h, S
afe
ty &
En
viro
nm
en
tC
om
mu
nit
y Is
sue
sP
rin
cip
les
of
Tec
hn
olo
gy
Pe
rso
na
l Wo
rk H
ab
its
Tec
hn
olo
gy
Pro
du
cti
on
Sk
ills
La
bo
rF
ina
nc
e
Healt
h S
cie
nce &
Medic
al
Technolo
gy:
• B
iote
ch
no
log
y R
ese
arc
h &
D
eve
lop
me
nt
• D
iag
no
stic
Se
rvic
es
• H
ea
lth
In
form
ati
cs
• S
up
po
rt S
erv
ice
s•
Th
era
pe
uti
c S
erv
ice
s
Mark
eti
ng,
Sale
s,
& S
erv
ice:
• E
-co
mm
erc
e•
En
tre
pre
ne
urs
hip
• In
tern
ati
on
al T
rad
e•
Pro
fess
ion
al S
ale
s &
Ma
rke
tin
g Art
s,
Media
, &
E
nte
rtain
ment:
• M
ed
ia &
De
sig
n A
rts
• P
erf
orm
ing
Art
s•
Pro
du
cti
on
&
Ma
na
ge
ria
l Art
s
Hospit
ality
, To
uri
sm
, &
R
ecre
ati
on:
• F
oo
d S
cie
nc
e,
Die
teti
cs,
&
Nu
trit
ion
• F
oo
d S
erv
ice
& H
osp
ita
lity
• H
osp
ita
lity,
To
uri
sm,
& R
ec
rea
tio
n
Public S
erv
ices:Ê
• H
um
an
Se
rvic
es
• L
eg
al &
Go
vern
me
nt
Se
rvic
es
• P
rote
cti
ve S
erv
ice
s
Buildin
g T
rades &
C
onstr
ucti
on:
• C
ab
ine
tma
kin
g &
Wo
od
P
rod
uc
ts•
En
gin
ee
rin
g &
He
avy
C
on
stru
cti
on
• M
ec
ha
nic
al C
on
stru
cti
on
• R
esi
de
nti
al &
Co
mm
erc
ial
Co
nst
ruc
tio
n
Fashio
n
& Inte
rior
Desig
n:
• F
ash
ion
De
sig
n,
Ma
nu
fac
turi
ng
, &
M
erc
ha
nd
isin
g•
Inte
rio
r D
esi
gn
, F
urn
ish
ing
s,
& M
ain
ten
an
ce
Info
rmati
on
Technolo
gy:
• In
form
ati
on
Su
pp
ort
&
Se
rvic
es
• M
ed
ia S
up
po
rt &
Se
rvic
es
• N
etw
ork
Co
mm
un
ica
tio
ns
• P
rog
ram
min
g &
Sys
tem
s D
eve
lop
me
nt
Tra
nsport
ati
on:
• A
via
tio
n &
Ae
rosp
ac
e
Tra
nsp
ort
ati
on
Se
rvic
es
• C
olli
sio
n R
ep
air
&
Re
fin
ish
ing
• V
eh
icle
Ma
inte
na
nc
e,
Se
rvic
e,
& R
ep
air
Educati
on,
Child
Deve
lopm
ent,
& F
am
ily
Serv
ices:
• C
hild
De
velo
pm
en
t•
Co
nsu
me
r S
erv
ice
s•
Ed
uc
ati
on
• F
am
ily &
Hu
ma
n
Se
rvic
es
Fin
ance &
Busin
ess:
• A
cc
ou
nti
ng
Se
rvic
es
• B
an
kin
g &
Re
late
d S
erv
ice
s•
Bu
sin
ess
Fin
an
cia
l M
an
ag
em
en
t
CA
LIF
OR
NIA
IN
DU
STR
Y
SEC
TO
R P
AT
HW
AY
S
Manufa
ctu
ring &
Pro
duct
Deve
lopm
ent:
• G
rap
hic
Art
s Te
ch
no
log
y•
Inte
gra
ted
Gra
ph
ics
Tec
hn
olo
gy
• M
ac
hin
e &
Fo
rmin
g
Tec
hn
olo
gy
• W
eld
ing
Te
ch
no
log
y
Agri
cult
ure
& N
atu
ral
Resourc
es:
• A
gri
cu
ltu
ral B
usi
ne
ss•
Ag
ric
ult
ura
l Me
ch
an
ics
• A
gri
scie
nc
e•
An
ima
l Sc
ien
ce
• F
ore
stry
& N
atu
ral R
eso
urc
es
• O
rna
me
nta
l Ho
rtic
ult
ure
• P
lan
t &
So
il S
cie
nc
e
Energ
y &
Uti
liti
es:
• E
lec
tro
me
ch
an
ica
l In
sta
llati
on
& M
ain
ten
an
ce
• E
ne
rgy
& E
nvi
ron
me
nta
l Te
ch
no
log
y•
Pu
blic
Uti
litie
s•
Re
sid
en
tia
l & C
om
me
rcia
l E
ne
rgy
an
d U
tilit
ies
Thi
s g
rap
hic
serv
ed a
s a
pri
mar
y so
urce
of
dis
cuss
ion
dur
ing
the
tw
o s
umm
er A
CC
ES
S c
onv
enin
gs
of
mat
h an
d E
nglis
h fa
cult
y. It
gui
ded
gro
ups
in d
eter
min
ing
how
bes
t to
ass
ess
stud
ents
usi
ng r
eal w
orl
d a
pp
licat
ions
.

10
A C C E S S C u r r i c u l a G u i d e • M a t h e m a t i c s
H O W T O U S E T H I S G U I D E
The intended use of the ACCESS Curricula Guide for Mathematics is to be a supplement to
course materials and lesson plans. Math faculty from around the state identified competencies
in Algebra II, Precalculus, and (non-STEM) Statistics that they believe are essential to the goals
of college attainment and success. The competencies are not necessarily organized in the
same way as the California State Standards or Common Core Standards for Algebra II and
Precalculus, nor are they necessarily in the order in which one would teach them in the course.
Each of the competencies includes one or more model assessment items. In no way are
these model assessment items exhaustive, but they are intended to indicate the level of
knowledge and skills expected of the students.
Many competencies include real world example assessments. The provided real world
assessments are just samples; they do not address all possibilities in terms of the CTE
pathways. The purpose of including real world example assessments was to give the
reader examples of how the competencies might apply to various professions. Real world
assessments are not included with every competency; some of the competencies are
prerequisites for the next level of skills or courses and do not lend themselves to real world
examples. Real world assessments are included where appropriate.
One way to use this guide is to first identify the topic in which you are interested
and locate the corresponding competency. Readers also can look at the corresponding
California State or Common Core Standard to identify the relevant competency, and then
use the model assessment items to gauge the level of understanding expected of students.
Teachers should feel free to modify these assessment items as they see fit.
H o w t o U s e T h i s G u i d e

M a t h e m a t i c s • A C C E S S C u r r i c u l a G u i d e
11L i s t o f A C C E S S M a t h C o m p e t e n c i e s
List of ACCESS Math Competencies
Algebra II/Intermediate Algebra ACCESS Competencies
1. Use properties of absolute values to solve multistep equations and inequalities.
2. Solve systems of linear equations in both two and three variables by substitution, elimination/addition, graphs, and matrices.
3. Factor polynomials by grouping.
4. Factor polynomials by using the sum/difference of cubes pattern.
5. Factor polynomials by extending the difference of squares pattern to polynomials of degree higher than 2.
6. Solve quadratic equations in the real and complex number systems by factoring.
7. Solve quadratic equations in the real and complex number systems by completing the square.
8. Solve quadratic equations in the real and complex number systems by using the quadratic formula.
9. Use multiple representations (tables, graphs, and equations) to solve contextualized problems that result in quadratic equations.
10. Add and subtract complex numbers.
11. Multiply complex numbers.
12. Perform division with complex numbers.
13. Simplify rational expressions with higher order polynomials in the denominator by canceling common factors in the numerator and denominator.
14. Add and subtract rational expressions with higher order polynomials in the denominator.
15. Multiply and divide rational expressions with higher order polynomials in the denominator.
16. Divide polynomials by binomials using long division and synthetic division.
17. Simplify a fraction where the numerator, denominator, or both contain a fraction (complex fractions).
18. Use multiple representations (tables, graphs, and equations) to solve contextualized problems that result in equations involving rational expressions.
19. Use the properties of exponents to simplify expressions with rational exponents.
20. Use the properties of exponents to solve equations with rational exponents.
21. Simplify radical expressions by removing repeated factors and performing addition and subtraction operations.

A C C E S S C u r r i c u l a G u i d e • M a t h e m a t i c s
12 L i s t o f A C C E S S M a t h C o m p e t e n c i e s
22. Simplify radical expressions by removing repeated factors and performing multiplication operations.
23. Rationalize the denominator of radical expressions.
24. Use multiple representations (tables, graphs, and equations) to solve problems that result in radical equations.
25. Apply and graph transformations of parent functions (quadratic, cubic, square root, absolute value, exponential, and logarithmic).
26. Identify the parent function (quadratic, cubic, square root, absolute value, exponential, and logarithmic) and transformations for a given transformed function in algebraic or graphical form.
27. Compose two linear, quadratic, cubic, square root, absolute value, exponential, or logarithmic functions.
28. Find the inverse of linear, quadratic, cubic, square root, absolute value, exponential, and logarithmic functions algebraically and graphically.
29. Find the equation of an exponential function given two points on the graph.
30. Use multiple representations (tables, graphs, and equations) to solve contextualized problems that result in one- and two-step exponential and logarithmic equations.
31. Graph simple conics, including:
• acirclegivenitsequation(centeredanywhere)
• anellipsegivenitsequation(centeredattheorigin)
• ahyperbolagivenitsequation(centeredattheorigin)
32. Solve statistical problems:
• Computepermutationsusingfundamentalcountingprinciple.
• Computecombinations.
• Computeprobabilitiesusingcombinations.
• Computeprobabilitiesusingpermutations.
• Expandbinomialexpressionsusingthebinomialtheorem.
33. Compute the general term and sums of arithmetic series, finite geometric series, and infinite geometric series.

M a t h e m a t i c s • A C C E S S C u r r i c u l a G u i d e
13L i s t o f A C C E S S M a t h C o m p e t e n c i e s
Precalculus ACCESS Competencies
1. Perform matrix operations, including addition and multiplication, and calculate the determinants of 2x2 and 3x3 matrices.
2. Describe different types of functions (polynomial, exponential, logarithmic, and trigonometric) using a table, a graph, an equation, and a verbal description.
3. Graph piecewise-defined functions.
4. Find all real zeros (roots) of polynomial functions exactly using the rational root theorem.
5. Find all the zeros (roots) of a polynomial function.
6. Solve polynomial inequalities.
7. Solve rational inequalities.
8. Find the composition of two or more functions, each containing two or more operations (such as linear, quadratic, rational, cubic, square root, cube root, and trigonometric functions).
9. Given a function, determine if an inverse function exists. If so:
• Findtheinverseofthefunctionalgebraicallyandgraphically.
• Identifythedomainandrangeoftheoriginalandinversefunctions.
10. Simplify expressions involving exponents.
11. Expand logarithmic expressions.
12. Condense logarithmic expressions.
13. Solve multistep exponential equations.
14. Solve multistep logarithmic equations.
15. Sketch the graph of a conic, identifying center, vertices, foci, and asymptotes (if present).
16. Graph trigonometric functions of the form ( ) .y A f Bx C k= + +
• Determinetheamplitudeofasineorcosinefunctionfromitsequation.
• Determinetheperiodofasine,cosine,ortangentfunctionfromitsequation.
• Determinetheverticalshiftofasine,cosine,ortangentfunctionfromitsequation.
• Determinethephaseshiftofasine,cosine,ortangentfunctionfromitsequation.
• Sketchbyhandthegraphofasine,cosine,ortangentfunction.
17. Given the graph of a trigonometric function, write the equation (sine, cosine, tangent).
18. Graph inverse trigonometric functions.
19. Prove trigonometric identities.
20. Solve trigonometry equations.

A C C E S S C u r r i c u l a G u i d e • M a t h e m a t i c s
14 L i s t o f A C C E S S M a t h C o m p e t e n c i e s
21. Solve for all unknown parts of a given triangle:
• byusingrighttriangletrigonometry
• byusingtheLawofSines
• byusingtheLawofCosines
22. Convert between polar and rectangular coordinates.
23. Graph equations written in polar form.
24. Graph equations written in parametric form.
25. Given the components of a two-dimensional vector, determine the magnitude and direction of the vector.
26. Perform the vector operations of addition, subtraction, and scalar multiplication.
27. Use factorial notation.
28. Expand binomial expressions.

M a t h e m a t i c s • A C C E S S C u r r i c u l a G u i d e
15L i s t o f A C C E S S M a t h C o m p e t e n c i e s
Statistics (Non-STEM) ACCESS Competencies
1. Determine whether a variable is categorical or quantitative, given a situation.
2. Identify the sampling method used (random, systematic, convenience, stratified, cluster, or voluntary response), given a scenario in which data were collected from a population.
3. Identify the basic terminology of experimental design used in a given scenario.
4. Identify biases in experimental designs or in the creation of a sample.
5. Determine an appropriate experimental design for a given scenario.
6. Construct and describe an appropriate visual display given a data set (histogram, bar graph, stem plot, scatter plot, box and whisker plot, and pie chart).
7. Identify which measure of the center (mean, median, or mode) is most appropriate for a given situation and what the relationship between the mean, median, and mode indicates about the distribution of the data.
8. Determine standard deviation from multiple representations of data (table, graph, and word problems) and explain standard deviation in the context of a given situation.
9. Use the normal distribution to solve for the probability of an event or solve for the boundaries for a particular event.
10. Determine the size of a sample space using counting principles, permutations, and combinations.
11. Compute basic probability of independent events and solve problems involving the binomial distribution:
• DeterminesituationsthatareBernoullitrials.
• Calculatetheprobabilityofanevent(success)and itscomplementaryprobability(failure).
• Discern thedifferencebetweengeometricprobabilityandbinomialprobabilityofBernoulli trials.
• Applytheformulaforbinomialprobabilityforx successes in n trials
( ) .x n xn rP x C p q −=
• Use the normal model ( , )N µ σ , where npµ = and npqσ = to approximate a binomial probability when the number of trials and desired successes is inordinately large.
12. Apply the Central Limit Theorem to sampling distributions.
13. Estimate population parameters using confidence intervals for means and proportions.

A C C E S S C u r r i c u l a G u i d e • M a t h e m a t i c s
16 L i s t o f A C C E S S M a t h C o m p e t e n c i e s
14. Perform appropriate hypothesis test (state the hypotheses, determine the significance level, check conditions/criteria, calculate the test statistic, determine the p-value, make a decision and interpret it in the context of the problem) for a given situation.
15. Explain the relationship between parameters and statistics.
16. Given a p-value, interpret its meaning in the context of the variables of a problem:
• Definethep-value.
• Identifytheappropriatenullandalternativehypotheses,andusethepropernotationof H0 and Ha.
• Interpretagivenp-value in the context of a hypothesis testing situation as it relates to the rejection of or failure to reject H0.
17. Find and apply the equation of the regression line when linear regression is appropriate:
• Determinewhenlinearregressionisappropriateforasetofbivariatedata.
• Findthelinearcorrelationcoefficientr and the coefficient of determination r 2.
• Usetheregressionlinetomakeappropriatepredictions.
• Interpretr, r 2, and slope in the context of a given situation.

M a t h e m a t i c s • A C C E S S C u r r i c u l a G u i d e
A l g e b r a I I / I n t e r m e d i a t e A l g e b r a C o m p e t e n c i e s 17
Algebra II/Intermediate
AlgebraCompetencies

A C C E S S C u r r i c u l a G u i d e • M a t h e m a t i c s
A l g e b r a I I / I n t e r m e d i a t e A l g e b r a C o m p e t e n c i e s18
C O M P E T E N C Y 1
Use properties of absolute values to solve multistep equations and inequalities.
Prior Knowledge:
• Solvealgebraicequations.• Solvealgebraicinequalities.• Evaluateabsolutevalueexpressionsforagivenvalueofthevariable.• Graphsolutionsofaninequalityontherealnumberline.• Interprettheabsolutevalueofanumberasadistancefromzeroonanumberline.• Representsolutionsetsusinginequalities.• Convertsolutionsetswritteninintervalnotationtoinequalitynotationandviceversa.• Solvecompoundinequalities.• Translateabsolutevalueinequalitiesintocompoundinequalities.• Identifyabsolutevalueequationsthathavenosolution(e.g., − = −3 9x ).• Identifyabsolutevalueinequalitiesthathavenosolution(e.g.,
+ <2 0x ).
Model Assessments
Assessment Example 1:
Aperson’sbodytemperature,t,isconsiderednormalifitfallswithin1.5°Fof98.6°F.Writeanabsolutevalueinequalitytoexpressthisfact.
Model Assessment Answer(s):
− ≤98.6 1.5.t
Assessment Example 2:
Expressthefactthatxdiffersfrom-3bymorethan5asaninequalityinvolvinganabsolutevalue.Solvetheinequalityforx.
Model Assessment Answer(s):
+ >3 5.x
Solution: < − >8or 2.x x
Real World Application Reference:
• BuildingTradesandConstruction• EngineeringandDesign

M a t h e m a t i c s • A C C E S S C u r r i c u l a G u i d e
A l g e b r a I I / I n t e r m e d i a t e A l g e b r a C o m p e t e n c i e s 19
Assessment Example 3:
Solveforx: − − + < −2 3 5 1 7.x
Model Assessment Answer(s):
> <1
3or .3
x x
Assessment Example 4:
a) Aconstructioncompanyisbuildinghouses.Theframingcrewneedstoplacestuds3feetapart with a tolerance of a quarter inch to pass inspection.Write an absolute valueinequalityforthissolutionsetandsolve.Explainyourreasoningtotheforemanoftheproject.
b) ABCManufacturingmakesdoorsandwindows.Eachdoormustbe42inchesinwidthwithatoleranceofhalfanincheitherwayinordertofitintheframe.Writeaninequalitytosolvethisproblem.Explainyourreasoning.Ifdoorsare84inchestall,whatisthedifferenceinmaterialsthatwouldbenecessarytoconstruct1,000doorsatthetwoextremes?
Model Assessment Answer(s):
a) Let xbethedistancebetweenthestuds.Thentheinequalitythatmustbesolvedis
136
4,x − ≤
andthesolutionsetis
3 136 ,
4 435 x≤ ≤
sothedistancebetweenthestudsmustbeatleast35inchesbutnomorethan36inches.

A C C E S S C u r r i c u l a G u i d e • M a t h e m a t i c s
A l g e b r a I I / I n t e r m e d i a t e A l g e b r a C o m p e t e n c i e s20
b) Let xbetheactualwidthofthedoor.Thentheinequalitythatmustbesolvedis
142
2,x − ≤
andthesolutionsetis
≤ ≤83 85
,2 2
x
sothedoor’swidthmustmeasureatleast41½inchesbutnomorethan42½inches.Ifwelet ybetheheightofthedoors,thentheinequalityis
184
2,y − ≤
andthesolutionsetis
≤ ≤167 169
,2 2
y
sothedoor’sheightmustmeasureatleast83½inchesbutnomorethan84½inches.Theamountofmaterialinthesmallestallowabledoorwouldbe
41½in.x83½in.=3,465.25sq.in.(about24.064sq.ft.).
Thematerialinthelargestallowabledoorwouldbe
42½in.x84½in.=3,591.25sq.in.(about24.939sq.ft.).
The difference is 0.875 square feet, so multiplying that by 1,000 doors would be875squarefeetofadditionalmaterialifallofthedoorsareaslargeaspossibleratherthanassmallaspossible.

M a t h e m a t i c s • A C C E S S C u r r i c u l a G u i d e
A l g e b r a I I / I n t e r m e d i a t e A l g e b r a C o m p e t e n c i e s 21
C O M P E T E N C Y 2
Solve systems of linear equations in both two and three variables by substitution, elimination/addition, graphs, and matrices.
Prior Knowledge:
• Solveandgraphalinearequationintwovariables.• Solveandgraphalinearinequalityintwovariables.• Substitutearationalnumberorexpressionforavariable.• Identifythecoefficientsfromanequationinstandardform.
Model Assessments
Assessment Example 1:
Apopularnewbandwillbeperformingatalocalconcertvenue.Thereare800ticketsavailable.Tickets for reservedseatscost$100,general admission ticketscost$70,and tickets forlawnseatingcost$50.Ifallthelawnandreservedseatsandhalfthegeneraladmissionseatsaresold,thetotalcollectedwouldbe$49,000.Ifalltheticketsaresold,thetotalwouldbe$63,000.HowmanyseatsofeachtypeareavailableatthePavilion?
Model Assessment Answer(s):
Let x=numberofreservedseattickets,y=numberofgeneraladmissiontickets,andz=numberoflawnseatingtickets.Thesystemofequationsthatmustbesolvedis:
800100 70 50 63000
100 70(0.5 ) 50 49000
x y zx y z
x y z
+ + =+ + =
+ + =
Solution:300reserved,400general,and100lawnseats.
Assessment Example 2:
Solveusingsubstitution:2 11,
3 2 13.x yx y
− + = − = −
Model Assessment Answer(s):
(–1,5).
Real World Application Reference:
• FinanceandBusiness

A C C E S S C u r r i c u l a G u i d e • M a t h e m a t i c s
A l g e b r a I I / I n t e r m e d i a t e A l g e b r a C o m p e t e n c i e s22
Assessment Example 3:
Solveusingmatrices:2 3 2,5 2 11,
2 4 0.
x y zx y zx y z
− + =− − + = − − − =
Model Assessment Answer(s):
Writetheaugmentedmatrixfortheabovesystemofequations.UseGaussianeliminationtotransformtheaugmentedmatrixintorow-echelonform(byhand)orusetheGauss-Jordanmethod to transform the augmentedmatrix into reduced row-echelon form (by handorusingacalculator).Theaugmentedmatrixand reduced row-echelon form(RREF)of thesystemofequationsis:
1 2 3 21 5 2 112 1 4 0
A
− = − − − − −
and
1 0 0 3( ) 0 1 0 2 .
0 0 1 1rref A
=
Answer:x =3,y =2,z =1.Solutionshouldbewrittenasanorderedtriple:(3,2,1).
Assessment Example 4:
Solvethesystemusingthegraphingmethod:3,5.
x yx y
+ =− + = −
Figure A2-4
-8 -6 -4 -2 2 4 6 8
-8
-6
-4
-2
2
4
6
8
Model Assessment Answer(s):
(4,–1).

M a t h e m a t i c s • A C C E S S C u r r i c u l a G u i d e
A l g e b r a I I / I n t e r m e d i a t e A l g e b r a C o m p e t e n c i e s 23
Assessment Example 5:
a) Forever Bloom Florist is placing an order for roses, lilies, and tulips. At the nearbywholesale flowermarket, 4 dozen lilies, 3 dozen roses, and 2 dozen tulips cost $124;1dozenlilies,2dozenroses,and3dozentulipscost$76;2dozenlilies,4dozenroses,and3dozentulipscost$128.Howmuchdoeseachindividualtypeofflowercostperdozen?
b) Youhave$12,800toinvestina401K.Youplantodiversifyyourmoneybetweenamoneymarketaccount,anincomefund,andagrowthfund.Youhavedecidedtoputtwiceasmuchmoneyinthegrowthfundasthemoneymarketaccountinordertomaximizeyourpotentialearnings.Thegrowthfundearns10%interest,theincomefundearns7%,andthemoneymarketaccountearns5%.Howmuchshouldyouinvest ineachaccounttoearn$1,000annuallyinsimpleinterest?
Model Assessment Answer(s):
a) Let x=costperdozenroses,y=costperdozenlilies,andz=costperdozentulips.Thesystemofequationsthatmustbesolvedis:
+ + =+ + =
+ + =
3 4 2 124,2 3 76,4 2 3 128.
x y zx y z
x y z
Thecostperdozenrosesis$20;thecostperdozenliliesis$12,andthecostperdozentulipsis$8.
b) Let x=theamountofmoneyinthemoneymarketaccount,y=theamountofmoneyin the income fund,andz= theamountofmoney in thegrowth fund.Thesystemofequationsthatmustbesolvedis:
12800,2 0,
0.05 0.07 0.10 1000.
x y zx z
x y x
+ + =− =
+ + =
Put$2,600inthemoneymarketaccount,$5,000intheincomefund,and$5,200inthegrowthfund.

A C C E S S C u r r i c u l a G u i d e • M a t h e m a t i c s
A l g e b r a I I / I n t e r m e d i a t e A l g e b r a C o m p e t e n c i e s24
C O M P E T E N C Y 3
Factor polynomials by grouping. (This is a prerequisite skill that is used in Precalculus and Calculus.)
Prior Knowledge:
• ApplytheLawsofExponentstoalgebraicexpressions.• Recognizenumbersasbeingperfectsquaresorperfectcubes.• Recognizebinomialsasthedifferenceoftwosquareterms.• Factoroutacommonmonomialfromapolynomial.
Model Assessments
Assessment Example 1:
Factorbygrouping: + + +22 4 3 6.x x x
Model Assessment Answer(s):
+ +(2 3)( 2).x x
Assessment Example 2:
Factorbygrouping: − + −4 3 1.x x x
Model Assessment Answer(s):
+ − − +2( 1)( 1)( 1).x x x x

M a t h e m a t i c s • A C C E S S C u r r i c u l a G u i d e
A l g e b r a I I / I n t e r m e d i a t e A l g e b r a C o m p e t e n c i e s 25
C O M P E T E N C Y 4
Factor polynomials by using the sum/difference of cubes pattern.
Prior Knowledge:
• ApplytheLawsofExponentstoalgebraicexpressions.• Recognizenumbersasbeingperfectsquaresorperfectcubes.• Recognizebinomialsasthedifferenceoftwosquareterms.• Factorasecond-degreepolynomialastheproductoftwobinomialsusingstandard
factoringtechniques.• Factoroutacommonmonomialfromapolynomial.• Recognizethatapolynomialisaperfectsquaretrinomial.
Model Assessments
Assessment Example 1:
Amanufacturingcompanyorders5ft.x5ft.x5ft.foamcubes.Thecompanycustomizessmallercubesbasedontheircustomer’sorder.However,tosaveonwaste,theywanttoselltheremainingthreefoamblocksandneedtohavethedimensionslistedfortheirWebsite.Whatarethedimensionsofthethreefoamblocks?
Model Assessment Answer(s):
Amountremainingis 3 35 ,a− whereaisthesidelengthoftheorderedcube.
Whenfactoredusingthedifferenceofsquarespattern,theresultis 2(5 )(25 5 ).a a a− + +
Bydistributing,thesizeofeachrectangularprismisasfollows:
Thefirstpieceis ( )( ) ( )5 25 or 5 ft. 5 ft. 5 ft.a a− − × ×
Thesecondpieceis ( ) ( )5 5 or 5 ft. 5 ft. ft.a a a a− − × ×
Thethirdpieceis ( ) ( )25 or 5 ft. ft. ft.a a a a a− − × ×
Real World Application Reference:
• EngineeringandDesign• ManufacturingandProduct
Development

A C C E S S C u r r i c u l a G u i d e • M a t h e m a t i c s
A l g e b r a I I / I n t e r m e d i a t e A l g e b r a C o m p e t e n c i e s26
Assessment Example 2:
Factor: +3125 64.x
Model Assessment Answer(s):
+ − +2(5 4)(25 20 16).x x x
Assessment Example 3:
Factor: −327 8.x
Model Assessment Answer(s):
− + +2(3 2)(9 6 4).x x x
Assessment Example 4:
Factor: − −3(3 2) 27.x
Model Assessment Answer(s):
− − +2(3 5)(9 3 7).x x x

M a t h e m a t i c s • A C C E S S C u r r i c u l a G u i d e
A l g e b r a I I / I n t e r m e d i a t e A l g e b r a C o m p e t e n c i e s 27
C O M P E T E N C Y 5
Factor polynomials by extending the difference of squares pattern to polynomials of degree higher than 2. (This a prerequisite skill that is used in Precalculus and Calculus.)
Prior Knowledge:
• Applystandardfactoringtechniquestofactoringseconddegreepolynomials.
Model Assessments
Assessment Example 1:
Factor: −4 81.x
Model Assessment Answer(s):
+ − +2( 3)( 3)( 9).x x x
Assessment Example 2:
Factor: − −2 4( 5) 16 .x y
Model Assessment Answer(s):
− − − +2 2( 5 4 )( 5 4 ).x y x y

A C C E S S C u r r i c u l a G u i d e • M a t h e m a t i c s
A l g e b r a I I / I n t e r m e d i a t e A l g e b r a C o m p e t e n c i e s28
C O M P E T E N C Y 6
Solve quadratic equations in the real and complex number systems by factoring.
Prior Knowledge:
• Factorquadraticexpressions.• Simplifyradicals.• Solveaquadraticequationusingfactoring,completingthesquare,orthequadraticformula.• Simplifyaradicalwhentheradicandisnegative.• Findtherootsofanequation.• Findthex-andy-interceptsofanequation.• Findthevertexofaparabola.• Determineifaparabolawillopenupwardordownward.
Model Assessments
Assessment Example 1:
Your construction company has just contracted with the owners of a condemned buildingdowntowntodemolishthepresentbuildinganderectanewoneinitsplace.Youhave300metersoffencingavailabletoenclosethebuildingandsurroundingarea,whichis5,000 squaremeters.Findthedimensionsoftherectangularareathatcanbeencompassedbytheavailablefencing.
Model Assessment Answer(s):
Writetheperimeterequation2 2 300L W+ = andsolveforL. = −(300 2 ) / 2L W .Substitutethisintotheareaequation
300 25000.
2W
A W− = =
Solvethepolynomialequation 2 150 5000 0.W W− + = Solution:50m.x100m.
Assessment Example 2:
Solve: 3 2 1 .x x x− = −
Model Assessment Answer(s):
1.x i or x= ± =
Real World Application Reference:
• BuildingTradesandConstruction

M a t h e m a t i c s • A C C E S S C u r r i c u l a G u i d e
A l g e b r a I I / I n t e r m e d i a t e A l g e b r a C o m p e t e n c i e s 29
C O M P E T E N C Y 7
Solve quadratic equations in the real and complex number systems by completing the square.
Prior Knowledge:
• Factorquadraticexpressions.• Simplifyradicals.• Solveaquadraticequationusingfactoring,completingthesquare,orthequadraticformula.• Simplifyaradicalwhentheradicandisnegative.• Findtherootsofanequation.• Findthex- and y-interceptsofanequation.• Findthevertexofaparabola.• Determineifaparabolawillopenupordown.
Model Assessments
Assessment Example 1:
Adesigncompanyhasdecideditisaestheticallypleasingfromanaerialviewiftheareaofapoolisequaltotheareaoftheborderaroundthepool.Givenapoolthatis6meterswideand10meterslongthatissurroundedbyaborderthatisofuniformwidth,determinethewidthoftheborder.
Model Assessment Answer(s):
4 31 1.57 m.− + ≅
Assessment Example 2:
Solvetheequationbycompletingthesquare: − =2 6 13.x x
Model Assessment Answer(s):
= ±3 22.x
Assessment Example 3:
Solve: 2 4 20.x x+ = −
Model Assessment Answer(s):
2 4 .x i= − ±
Real World Application Reference:
• BuildingTradesandConstruction• EngineeringandDesign

A C C E S S C u r r i c u l a G u i d e • M a t h e m a t i c s
A l g e b r a I I / I n t e r m e d i a t e A l g e b r a C o m p e t e n c i e s30
C O M P E T E N C Y 8
Solve quadratic equations in the real and complex number systems by using the quadratic formula.
Prior Knowledge:
• Factorquadraticexpressions.• Simplifyradicals.• Solveaquadraticequationusingfactoring,completingthesquare,orthequadraticformula.• Simplifyaradicalwhentheradicandisnegative.• Findtherootsofanequation.• Findthex- and y-interceptsofanequation.• Findthevertexofaparabola.• Determineifaparabolawillopenupordown.
Model Assessments
Assessment Example 1:
Robin, a Calculus student at the local university, throws her Calculus book out of her
dormitorywindowstraightupintotheairwithavelocityof48feetpersecond.Assuming
thatherdormitoryroomis40feetabovetheground,andignoringairresistance,theheight
ofherbookaftertsecondswillbe: = − + +2( ) 16 48 40.s t t t Howlongdoesittakebeforethe
bookhitsthefootofthepersonstandingdirectlybelowherwindow?
Model Assessment Answer(s):
t=3.7seconds.
Assessment Example 2:
Solve: − − =2 4 1 0.x x
Model Assessment Answer(s):
±2 5.
Real World Application Reference:
• EngineeringandDesign

M a t h e m a t i c s • A C C E S S C u r r i c u l a G u i d e
A l g e b r a I I / I n t e r m e d i a t e A l g e b r a C o m p e t e n c i e s 31
Assessment Example 3:
Solve: − − =2
1 24 0.
x x
Model Assessment Answer(s):
Eventhoughtheequationisarationalequationandnottechnicallyaquadraticequation,once both sides of the equation are multiplied by the least common denominator, theresultingequationisquadraticandcanbesolved.
±1 33.
8
Assessment Example 4:
Solve: 22 5 11.x x+ = −
Model Assessment Answer(s):
5 3 74
ix
− ±= or 5 3 7
.4
ix
− ±=

A C C E S S C u r r i c u l a G u i d e • M a t h e m a t i c s
A l g e b r a I I / I n t e r m e d i a t e A l g e b r a C o m p e t e n c i e s32
C O M P E T E N C Y 9
Use multiple representations (tables, graphs, and equations) to solve contextualized problems that result in quadratic equations.
Prior Knowledge:
• Factorquadraticexpressions.• Simplifyradicals.• Solveaquadraticequationusingfactoring,completingthesquare,orthequadraticformula.• Simplifyaradicalwhentheradicandisnegative.• Findtherootsofanequation.• Findthex- and y-interceptsofanequation.• Findthevertexofaparabola.• Determineifaparabolawillopenupordown.• Recognizethatthegraphofanyquadraticequationisaparabola.• Recognizewhatthegraphofy=x 2lookslike.
Model Assessments
Assessment Example 1:
Atoycompanyisdevelopingawaterballoonlauncher.Whentheballoonisshotstraightup,theheightoftheballoonatanytimet(measuredinseconds)canbedescribedbytheequation
( ) 20 016 ,h t t v t h= − + +
where v0 represents the initial velocity and h0 represents the initial height of the waterballoon.Ifyouknowthattheinitialvelocityis48feetpersecondandtheballoonislaunchedfromapoint64feetofftheground:
a) Writetheequationthatdescribestheheightatanytime.
b) Determinetheheightoftheballoonfromthegroundatt =1second,then2seconds,etc.;createatableshowingthecorrespondingheights.
c) Determinethetimeittakesfortheballoontoreachmaximumheight.
d) Determinethetimeatwhichtheballoonhitstheground.Ifyourfriendistalkingonhisphonedirectlybelow the launchareaand it takeshim5 seconds to realizeyouhavelaunchedawaterballoon,willithithimbeforehehastimetomove?
e) Graphthepathofthewaterballoon’sheightwithrespecttotime.
Real World Application Reference:
• ManufacturingandProductDevelopment

M a t h e m a t i c s • A C C E S S C u r r i c u l a G u i d e
A l g e b r a I I / I n t e r m e d i a t e A l g e b r a C o m p e t e n c i e s 33
Model Assessment Answer(s):
a) = − + +2( ) 16 48 64.h t t t
b) Seethetablebelow.
Time (secs)
Height h(t)(ft)
1 0 64
2 0.5 84
3 1 96
4 1.5 100
5 2 96
6 2.5 84
7 3 64
8 3.5 36
9 4 0
10 4.5 -44
11 5 -96
c) Theballoonreachedamaximumheightof100feetat1.5secondsafteritwaslaunched.
d) Itwilltake4secondsfortheballoontohittheground.Thefriendwillgetwet.
e) Graph:
Figure A5-1e
0.5 1 1.5 2 2.5 3 3.5 4 4.5 5
10
2030
40
5060
70
80
90100
110
Time (seconds)
Hei
ght (
ft)

A C C E S S C u r r i c u l a G u i d e • M a t h e m a t i c s
A l g e b r a I I / I n t e r m e d i a t e A l g e b r a C o m p e t e n c i e s34
C O M P E T E N C Y 1 0
Add and subtract complex numbers.
Prior Knowledge:
• Addandsubtractalgebraicexpressionsinvolvingvariables.• Usethedistributivepropertyinalgebraicexpressionsinvolvingvariables.• Simplifyalgebraicexpressionsinvolvingpositiveintegerexponents.• Simplifysquarerootsofintegers.• Multiplybinomials.• Rationalizeamonomialorbinomialdenominator.• Identifyconjugatesandcalculatetheir
products.• Multiplytwonumberswithexponents
havingthesamebase.
Model Assessments
Assessment Example 1:
InanACcircuitwithtwoparallelpathways,thetotalimpedanceZ,inohms,satisfiestheformula
= +1 2
1 1 1,
Z Z Z
whereZ1 is the impedance of the first pathway andZ2 is the impedance of the secondpathway.DeterminethetotalimpedanceiftheimpedancesofthetwopathwaysareZ1=1+i and Z2=2–3i.
Model Assessment Answer(s):
+17 713 13
i ohms.
Assessment Example 2:
Simplify:(8+2i)+(4–i).
Model Assessment Answer(s):
12+i.
Assessment Example 3:
Simplify:(2–5i)–(8+6i).
Model Assessment Answer(s):
–6–11i.
Real World Application Reference:
• EnergyandUtilities• EngineeringandDesign

M a t h e m a t i c s • A C C E S S C u r r i c u l a G u i d e
A l g e b r a I I / I n t e r m e d i a t e A l g e b r a C o m p e t e n c i e s 35
C O M P E T E N C Y 1 1
Multiply complex numbers.
Prior Knowledge:
• Addandsubtractalgebraicexpressionsinvolvingvariables.• Usethedistributivepropertyinalgebraicexpressionsinvolvingvariables.• Simplifyalgebraicexpressionsinvolvingpositiveintegerexponents.• Simplifysquarerootsofintegers.• Multiplybinomials.• Rationalizeamonomialorbinomialdenominator.• Identifyconjugatesandcalculatetheirproducts.• Multiplytwonumberswithexponentshavingthesamebase.
Model Assessments
Assessment Example 1:
Inanelectricalcircuit,thevoltage(E)involts,thecurrent(I)inamps,andtheoppositiontotheflowofcurrent—calledimpedance—(Z)inohmsarerelatedbytheequationE=IZ.Acircuithasacurrentof(3+2i)ampsandanimpedanceof(6–4i)ohms.Determinethevoltage.
Model Assessment Answer(s):
E=(3+2i)(6–4i)=26volts.
Assessment Example 2:
Multiplyandcombineliketerms:(2i+3)(4–5i)+(–2i)5.
Model Assessment Answer(s):
22–39i.
Real World Application Reference:
• EnergyandUtilities• EngineeringandDesign

A C C E S S C u r r i c u l a G u i d e • M a t h e m a t i c s
A l g e b r a I I / I n t e r m e d i a t e A l g e b r a C o m p e t e n c i e s36
Assessment Example 3:
Simplify: i(7–3i)(2+10i).
Model Assessment Answer(s):
–64+44i.
Assessment Example 4:
Simplify:2
2 3.
2 4i
+
Model Assessment Answer(s):
− +1 3 2
.16 4
i

M a t h e m a t i c s • A C C E S S C u r r i c u l a G u i d e
A l g e b r a I I / I n t e r m e d i a t e A l g e b r a C o m p e t e n c i e s 37
C O M P E T E N C Y 1 2
Perform division with complex numbers.
Prior Knowledge:
• Addandsubtractalgebraicexpressionsinvolvingvariables.• Usethedistributivepropertyinalgebraicexpressionsinvolvingvariables.• Simplifyalgebraicexpressionsinvolvingpositiveintegerexponents.• Simplifysquarerootsofintegers.• Multiplybinomials.• Rationalizeamonomialorbinomialdenominator.• Identifyconjugatesandcalculatetheirproducts.• Multiplytwonumberswithexponentshavingthesamebase.
Model Assessments
Assessment Example 1:
Electricalcircuitscanbeconnectedinseries,oneafteranother,orinparallelcircuitsthatbranchoffamainline.Ifthecircuitsarehookedupinparallel,thetotalimpedanceisgivenby:
Figure A10-1
R1R R2
1 2
1 2
.
R RR
R R=
+
FindthetotalimpedanceconnectedinparalleliftheimpedanceofthefirstresistorisR1=5+2iohmsandtheimpedanceofthesecondresistorisR2=3–iohms.
Model Assessment Answer(s):
−137 9
.65 65
i
Real World Application Reference:
• EnergyandUtilities• EngineeringandDesign

A C C E S S C u r r i c u l a G u i d e • M a t h e m a t i c s
A l g e b r a I I / I n t e r m e d i a t e A l g e b r a C o m p e t e n c i e s38
Assessment Example 2:
Dividetoidentifyrealandimaginaryparts:−3
.2 i
Model Assessment Answer(s):
+6 3
.5 5
i
Assessment Example 3:
Simplify: 4 2.
7 3ii
+−
Model Assessment Answer(s):
+11 13
.29 29
i

M a t h e m a t i c s • A C C E S S C u r r i c u l a G u i d e
A l g e b r a I I / I n t e r m e d i a t e A l g e b r a C o m p e t e n c i e s 39
C O M P E T E N C Y 1 3
Simplify rational expressions with higher order polynomials in the denominator by canceling common factors in the numerator and denominator. (This is a prerequisite skill that is used in Precalculus and Calculus.)
Prior Knowledge:
• Usethepropertiesofexponents.• Add,subtract,multiply,divide,andsimplifyrationalexpressions.• Add,subtract,multiply,anddividepolynomials.• Factorpolynomials.• Identifywhenarationalexpressionisundefined.• Simplifyarationalexpressionbycancelingcommonfactorsinthenumeratorandthe
denominator.• Multiplyanddividerationalexpressionswithmonomialandpolynomialdenominators.• Findthelowestcommondenominatorbetweentwoormoremonomialorpolynomial
denominators.• Addandsubtractrationalexpressions.• Identifycomplexrationalexpressions.
Model Assessments
Assessment Example 1:
Simplify:
a) ( )( )
41 3
12 2
2.
4
a b
a b
−
−−
b) 3
3 2
8.
3 10x
x x x+
− −
c) 2
2
6.
7 12x x
x x− −
− +
Model Assessment Answer(s):
a) 10
2
64.
ba
b) ( )2 2 4
.5
x xx x
− +−
c) 2.
4xx
+−

A C C E S S C u r r i c u l a G u i d e • M a t h e m a t i c s
A l g e b r a I I / I n t e r m e d i a t e A l g e b r a C o m p e t e n c i e s40
C O M P E T E N C Y 1 4
Add and subtract rational expressions with higher order polynomials in the denominator. (This is a prerequisite skill that is used in Precalculus and Calculus.)
Prior Knowledge:
• Usethepropertiesofexponents.• Add,subtract,multiply,divide,andsimplifyrationalexpressions.• Add,subtract,multiply,anddividepolynomials.• Factorpolynomials.• Identifywhenarationalexpressionisundefined.• Simplifyarationalexpressionbycancelingcommonfactorsinthenumeratorandthe
denominator.• Multiplyanddividerationalexpressionswithmonomialandpolynomialdenominators.• Findthelowestcommondenominatorbetweentwoormoremonomialorpolynomial
denominators.• Addandsubtractrationalexpressions.• Identifycomplexrationalexpressions.
Model Assessments
Assessment Example 1:
Simplify:
a) 2
1 4 6.
2 2 4x xx x x
−+ +
+ − −
b) 2 2
1 2.
6 4 3x x
x x x x− −
−+ − + +
c) 2
2
3 2 4 7 24 28.
5 3 4 3 11 20y y yy y y y
+ + ++ −
− + − −
Model Assessment Answer(s):
a) 3.
2xx
−−
b) ( )( )( )
4 5.
3 1 2x
x x x−
+ + −
c) ( )2 4
.3 4
y
y
+
+

M a t h e m a t i c s • A C C E S S C u r r i c u l a G u i d e
A l g e b r a I I / I n t e r m e d i a t e A l g e b r a C o m p e t e n c i e s 41
C O M P E T E N C Y 1 5
Multiply and divide rational expressions with higher order polynomials in the denominator. (This is a prerequisite skill that is used in Precalculus and Calculus.)
Prior Knowledge:
• Usethepropertiesofexponents.• Add,subtract,multiply,divide,andsimplifyrationalexpressions.• Add,subtract,multiply,anddividepolynomials.• Factorpolynomials.• Identifywhenarationalexpressionisundefined.• Simplifyarationalexpressionbycancelingcommonfactorsinthenumeratorandthe
denominator.• Multiplyanddividerationalexpressionswithmonomialandpolynomialdenominators.• Findthelowestcommondenominatorbetweentwoormoremonomialorpolynomial
denominators.• Addandsubtractrationalexpressions.• Identifycomplexrationalexpressions.
Model Assessments
Assessment Example 1:
Simplify:
a) 2 2 2
2 2
2 2 5 3 5 6.
2 41 2 4x x x x x x
xx x x− − − − − +
÷−− −
b) 2 2 2
2 2 2
5.
3 4 20 2 11 5 6 17 10a b b a a ab
a a a a a a+ +
÷− − + + − −
c) 2 2 2 2
2 2 2 2
2 3 2 3 2.
3 4 6x xy y x xy yx xy y x xy y
− − − −
− + + −
Model Assessment Answer(s):
a) ( )2 1
.1
x x
x
+
−
b) ( )
2 1.
2a
b a++
c) ( )( )( )( )2 3
.3 3
x y x y
x y x y
+ +
− +

A C C E S S C u r r i c u l a G u i d e • M a t h e m a t i c s
A l g e b r a I I / I n t e r m e d i a t e A l g e b r a C o m p e t e n c i e s42
C O M P E T E N C Y 1 6
Divide polynomials by binomials using long division and synthetic division. (This is a prerequisite skill that is used in Precalculus and Calculus.)
Prior Knowledge:
• Addandsubtractpolynomials.• Usethedistributivepropertytomultiplypolynomials.• Applytheappropriateexponentialrulestosimplifyalgebraicexpressions.• Dividepolynomialsbyamonomial.• Dividepolynomialsbybinomialsusinglongdivision.• Translateandsolvemultistepwordproblemsinvolvingpolynomials.
Model Assessments
Assessment Example 1:
Usesyntheticdivisiontofindthequotientof
( ) ( )5 32 10 2 1 .y y y y− + − ÷ +
Model Assessment Answer(s):
4 3 2 52 2 8 8 7 .
1y y y y
y− − + − +
+
Assessment Example 2:
Simplify: ( ) ( )− + ÷ +3 212 4 3 2 .x x x
Model Assessment Answer(s):
− +24 3 2.x x
Assessment Example 3:
Simplify:− + −
−
3 2 2 312 26 19 15.
3 5x x y xy y
x y
Model Assessment Answer(s):
− +2 24 2 3 .x xy y

M a t h e m a t i c s • A C C E S S C u r r i c u l a G u i d e
A l g e b r a I I / I n t e r m e d i a t e A l g e b r a C o m p e t e n c i e s 43
C O M P E T E N C Y 1 7
Simplify a fraction where the numerator, denominator, or both contain a fraction (complex fractions).
Prior Knowledge:
• Usethepropertiesofexponents.• Add,subtract,multiply,divide,andsimplifyrationalexpressions.• Add,subtract,multiply,anddividepolynomials.• Factorpolynomials.• Identifywhenarationalexpressionisundefined.• Simplifyarationalexpressionbycancelingcommonfactorsinthenumeratorandthe
denominator.• Multiplyanddividerationalexpressionswithmonomialandpolynomialdenominators.• Findthelowestcommondenominatorbetweentwoormoremonomialorpolynomial
denominators.• Addandsubtractrationalexpressions.• Identifycomplexrationalexpressions.
Model Assessments
Assessment Example 1:
Simplify:+
+ −
+
1 11 1 .
1
x xx
x
Model Assessment Answer(s):
2.1x −
Real World Application Reference:
• Transportation

A C C E S S C u r r i c u l a G u i d e • M a t h e m a t i c s
A l g e b r a I I / I n t e r m e d i a t e A l g e b r a C o m p e t e n c i e s44
Assessment Example 2:
Simplify:− −+
−
1 1
2 2.
x yx y
xy
Model Assessment Answer(s):
1.
x y−
Assessment Example 3:
Theaveragerateonaround-tripdeliveryroutethathasaone-waydistanceofdisgivenbythecomplexrationalexpression
+1 2
2,
dd dr r
wherer1 and r2aretheratesontheoutgoingandreturntrips,respectively.
a) Simplifythecomplexrationalexpression.
b) Findtheaveragerateiftheoutboundtriphasanaveragerateof30mph.andthereturntriphasanaveragerateof40mph.
Model Assessment Answer(s):
a) 1 2
2 1
2.
r rr r+
b) 240034.3 mph.
70≈

M a t h e m a t i c s • A C C E S S C u r r i c u l a G u i d e
A l g e b r a I I / I n t e r m e d i a t e A l g e b r a C o m p e t e n c i e s 45
C O M P E T E N C Y 1 8
Use multiple representations (tables, graphs, and equations) to solve contextualized problems that result in equations involving rational expressions.
Prior Knowledge:
• Addandsubtractalgebraicexpressionsinvolvingvariables.• Usethedistributivepropertyinalgebraicexpressionsinvolvingvariables.• Simplifyalgebraicexpressionsinvolvingpositiveintegerexponents.• Simplifysquarerootsofintegers.• Multiplybinomials.• Rationalizeamonomialorbinomialdenominator.• Identifyconjugatesandcalculatetheirproducts.• Multiplytwonumberswithexponentshavingthesamebase.
Model Assessments
Assessment Example 1:
Electricalcircuitscanbeconnected inseries,oneafteranother,or inparallelcircuitsthatbranchoffamain line. If thecircuitsarehookedup inparallel, thereciprocalof thetotalresistanceinthecircuitisfoundbyaddingthereciprocalofeachresistance,asshownbelow.
Figure A10-1
R1R R2
+ =1 2
1 1 1.
R R R
IfR1=x and R2=x+4,andthetotalresistanceRis1.5Ω(ohms),findthepositivevalueofR1.
Model Assessment Answer(s):
Solve: + =+
1 1 1;
4 1.5x xsolutionisx=2Ω.
Real World Application Reference:
• EnergyandUtilities• EngineeringandDesign

A C C E S S C u r r i c u l a G u i d e • M a t h e m a t i c s
A l g e b r a I I / I n t e r m e d i a t e A l g e b r a C o m p e t e n c i e s46
Assessment Example 2:
Simplify: + =1 1 1
.4 5x x
Model Assessment Answer(s):
= −16.
5x
Assessment Example 3:
Simplify:− −
− =+ + + +2
1 2 8 10.
4 5 9 20x x
x x x x
Model Assessment Answer(s):
5, 3.
2x = −

M a t h e m a t i c s • A C C E S S C u r r i c u l a G u i d e
A l g e b r a I I / I n t e r m e d i a t e A l g e b r a C o m p e t e n c i e s 47
C O M P E T E N C Y 1 9
Use the properties of exponents to simplify expressions with rational exponents.
Prior Knowledge:
• Applythepropertiesofexponents.• Usethebasicnotationoffractionalexponents.• Simplifyradicals.
Model Assessments
Assessment Example 1:
Thehalf-lifeofaspirininaperson’sbloodstreamisabout15minutes: ( ) 0t
A t A e τ−
= whereA(t)istheamountremainingaftertimet,A0istheinitialamount,andτ isthemeanlifetime.Determine themean lifetimeofaspirin in thebloodstream. (HINT: themean lifetime, ,τ is definedas half-lifedividedby ln 2.) Simplify the rational exponent in the exponentialequationandrewritetheequation.
Model Assessment Answer(s):
Themeanlifetime, ,τ is21.64seconds.Theresultingsimplifiedexponentialequationis
( ) 0.046210 .tA t A e−=
Assessment Example 2:
Neglecting overlapping regions, howmuch cardboardwould be needed to construct anopencube-shapedboxwithvolumeV?Writeanexpressionfortheamountofmaterial intermsofVusingrationalexponents.
Model Assessment Answer(s):
Let xbethelengthofthesideofthecube.IfthevolumeisVcubicunits,then 3.V x= So
13 .x V= Thismeans thateach faceof thecubehasanareaof
232 ,x V= so theopenbox
requires2
35V squareunitsofcardboard.
Real World Application Reference:
• HealthScienceandMedicalTechnology• ManufacturingandProduct
Development
A C C E S S C u r r i c u l a G u i d e • M a t h e m a t i c s
A l g e b r a I I / I n t e r m e d i a t e A l g e b r a C o m p e t e n c i e s48
Assessment Example 3:
Evaluatethefollowingexpressions:
a) ( )2
3.27−
b) 34.16−
Model Assessment Answer(s):
a) 9.
b) 18.
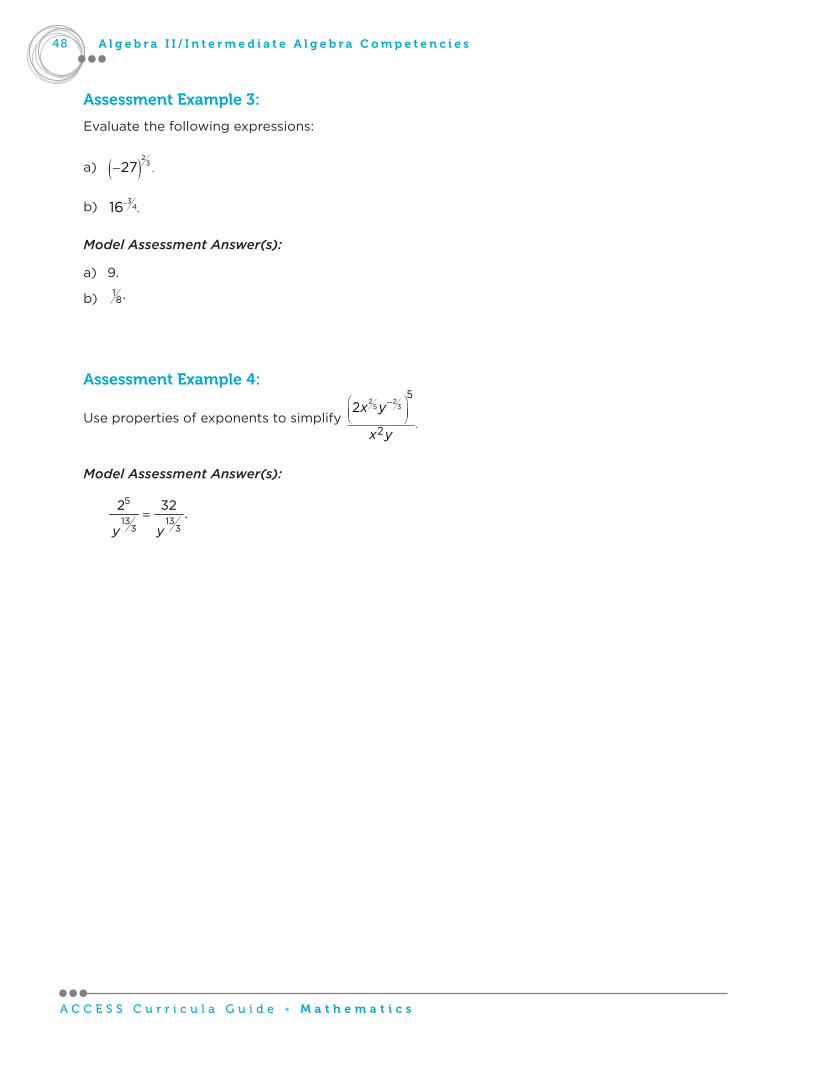
Assessment Example 4:
Usepropertiesofexponentstosimplify2 25 3
.
5
2
2x y
x y
−
Model Assessment Answer(s):
5
13 133 3
2 32.
y y=

M a t h e m a t i c s • A C C E S S C u r r i c u l a G u i d e
A l g e b r a I I / I n t e r m e d i a t e A l g e b r a C o m p e t e n c i e s 49
C O M P E T E N C Y 2 0
Use the properties of exponents to solve equations with rational exponents.
Prior Knowledge:
• Applythepropertiesofexponents.• Usethebasicnotationoffractionalexponents.• Simplifyradicals.
Model Assessments
Assessment Example 1:
Solve: + =32 3 19.x
Model Assessment Answer(s):
2, 1 3.x i= − ±
Assessment Example 2:
Solve: − =45 4 401.x
Model Assessment Answer(s):
3, 3 .x i= ± ±
Assessment Example 3:
Theamountofmaterialneededforanopencube-shapedboxwithvolumeVisgivenbytheexpression
235 .V Findthecostofproducing144boxes,eachofwhichhasavolumeof3,000
cubiccentimeters,giventhatthecardboardcosts$1.60persquaremeter.
Model Assessment Answer(s):
Each box requires ( )22 33 25 5 3000 1040cm.V = ≈ of cardboard, so 144 boxes require
about 150,000 square centimeters, or 15 squaremeters, of cardboard. The total cost is
( )15 $1.60 $24.00.=
Real World Application Reference:
• ManufacturingandProductDevelopment• FinanceandBusiness
A C C E S S C u r r i c u l a G u i d e • M a t h e m a t i c s
A l g e b r a I I / I n t e r m e d i a t e A l g e b r a C o m p e t e n c i e s50
C O M P E T E N C Y 2 1
Simplify radical expressions by removing repeated factors and performing addition and subtraction operations. (This is a prerequisite skill that is used in Precalculus and Calculus.)
Prior Knowledge:
• Usethepropertiesofexponents.• Simplifysquarerootsofintegers.• Simplifyalgebraicexpressions.
Model Assessments
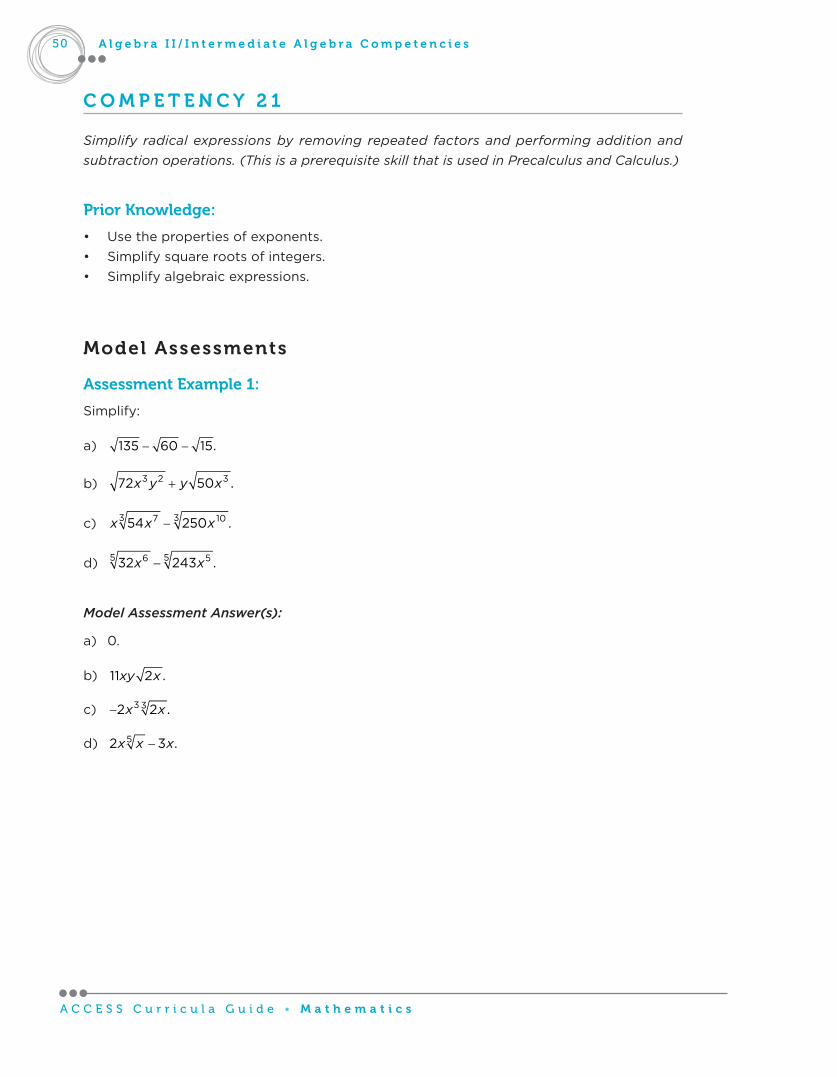
Assessment Example 1:
Simplify:
a) − −135 60 15.
b) +3 2 372 50 .x y y x
c) −3 37 1054 250 .x x x
d) −5 56 532 243 .x x
Model Assessment Answer(s):
a) 0.
b) 11 2 .xy x
c) − 3 32 2 .x x
d) −52 3 .x x x

M a t h e m a t i c s • A C C E S S C u r r i c u l a G u i d e
A l g e b r a I I / I n t e r m e d i a t e A l g e b r a C o m p e t e n c i e s 51
C O M P E T E N C Y 2 2
Simplify radical expressions by removing repeated factors and performing multiplication operations. (This is a prerequisite skill that is used in Precalculus and Calculus.)
Prior Knowledge:
• Usethepropertiesofexponents.• Simplifythesquarerootsofintegers.• Add,subtract,andmultiplypolynomials.
Model Assessments
Assessment Example 1:
Findtheproduct:
a) ( )( )− +4 2 3 5 5 2 .
b) ( )−3 7 2 6 5 .
Model Assessment Answer(s):
a) − +7 10.
b) −6 7 18 35.

A C C E S S C u r r i c u l a G u i d e • M a t h e m a t i c s
A l g e b r a I I / I n t e r m e d i a t e A l g e b r a C o m p e t e n c i e s52
C O M P E T E N C Y 2 3
Rationalize the denominator of radical expressions. (This is a prerequisite skill that is used in Precalculus and Calculus.)
Prior Knowledge:
• Usethepropertiesofexponents.• Simplifysquarerootsofintegers.• Add,subtract,andmultiplypolynomials.• Add,subtract,andmultiplyradicalexpressions.
Model Assessments
Assessment Example 1:
Simplify:
a) 4
12.
24
b) 3 2
3.
3x
c) +
−
2 3 5.
7 2
Model Assessment Answer(s):
a) 42 54.
b) 3 9
.x
x
c) + + +14 3 2 6 35 5 2.
47

M a t h e m a t i c s • A C C E S S C u r r i c u l a G u i d e
A l g e b r a I I / I n t e r m e d i a t e A l g e b r a C o m p e t e n c i e s 53
Assessment Example 2:
Thetimet(d),inseconds,ittakesforanobjecttofalldfeetcanbemodeledbytheequation
( ) 2.
dt d
g=
Simplifytheright-handsideofthemodel’sequation,i.e.,rationalizethedenominator.
Model Assessment Answer(s):
( ) 2.
dgt d
g=
Assessment Example 3:
Thedistanced(h),inmiles,tothehorizonatanaltitudeofhfeetabovesealevelisgivenbytheequation
( ) 3.
2h
d h =
Simplifytheright-handsideofthemodel’sequation,i.e.,rationalizethedenominator.
Model Assessment Answer(s):
( ) 6.
2h
d h =

A C C E S S C u r r i c u l a G u i d e • M a t h e m a t i c s
A l g e b r a I I / I n t e r m e d i a t e A l g e b r a C o m p e t e n c i e s54
C O M P E T E N C Y 2 4
Use multiple representations (tables, graphs, and equations) to solve problems that result in radical equations.
Prior Knowledge:
• Applypropertiesofradicalexpressions.• Add,subtract,andmultiplyradicalexpressions.• Applypropertiesofexponents.• Multiplypolynomials.
Model Assessments
Assessment Example 1:
Solve:
a) 2 2 6.x x+ = +
b) Usingagraph,explainwhy 3 8x + = − hasnosolution.
Model Assessment Answer(s):a) 31.94.x ≈
b) Therangeofthegraphoftheequation 3y x= + isgreaterthan0;therefore, itwillnevercross.
Assessment Example 2:
Body surface area (BSA)mustbe calculated formanymedical reasons, including renalkidneyfunction,cardiacinputandindex,andchemotherapyandglucocorticoiddosing.Theformula,developedin1987byR.D.Mosteller††,is:
2cm kgheight weight
BSA .3600m =
NurseReynoldshasapatientwhoseBSAhasbeen recordedon themedicationchartat2.04squaremeters.Ifthepatient’sheightis157centimeters(5ft.,2in.),whatisthepatient’sweightinkilograms(roundedtothenearesttenth)?
Model Assessment Answer(s):
2
cm kg157 weight2.04 .
3600m =
Weight=95.4kg.(roundedtothenearesttenth).
†† Mosteller, R. D., “Simplified Calculation of Body-Surface Area.” The New England Journal of Medicine 1098, no. 317,
1987: 17.
Real World Application Reference:
• HealthScienceandMedicalTechnology

M a t h e m a t i c s • A C C E S S C u r r i c u l a G u i d e
A l g e b r a I I / I n t e r m e d i a t e A l g e b r a C o m p e t e n c i e s 55
C O M P E T E N C Y 2 5
Apply and graph transformations of parent functions (quadratic, cubic, square root, absolute value, exponential, and logarithmic).
Prior Knowledge:
• Recognizethegraphof 2.y x=
• Recognizethegraphof 3.y x=
• Recognizethegraphof .y x=
• Recognizethegraphof .y x=
• Recognizethegraphof .xy a=
• Recognizethegraphof ln .y x=
• Findthex-andy-interceptsofanequation.
• Findthevertexofaparabola.
• Determineifthegraphofaparabolaopensupordown.
• Applythepropertiesoflogarithms.
• Applythepropertiesofexponents.
Model Assessments
Assessment Example 1:
Identifythetransformationsusedtographthefollowingfromtheirparentgraphs:
a) = − −2( ) ( 3) 2.f x x
b) = − +3( ) 2.f x x
c) =+1
( ) .4
f xx
Model Assessment Answer(s):
a) = − −2( ) ( 3) 2;f x x parentgraphshiftedright3unitsanddown2units.
b) = − +3( ) 2;f x x parentgraphshiftedleft2unitsandreflectedoverthex-axis.
c) =+1
( ) ;4
f xx
parentgraphshiftedleft4units.
Real World Application Reference:
• AgricultureandNaturalResources• EngineeringandDesign
A C C E S S C u r r i c u l a G u i d e • M a t h e m a t i c s
A l g e b r a I I / I n t e r m e d i a t e A l g e b r a C o m p e t e n c i e s56
Assessment Example 2:
Solve:
a) = − − +( ) 2 5 4.f x x
b) −= ( 1)( ) 2 .xf x
c) = +2( ) log ( 4).f x x
Model Assessment Answer(s):
a) = − − +( ) 2 5 4;f x x parentgraphshiftedright5units,verticallystretchedbyfactorof2,reflectedoverx-axisandshiftedup4units.
b) −= ( 1)( ) 2 ;xf x parentgraphshiftedright1unit.
c) = +2( ) log ( 4);f x x parentgraphshiftedleft4units.
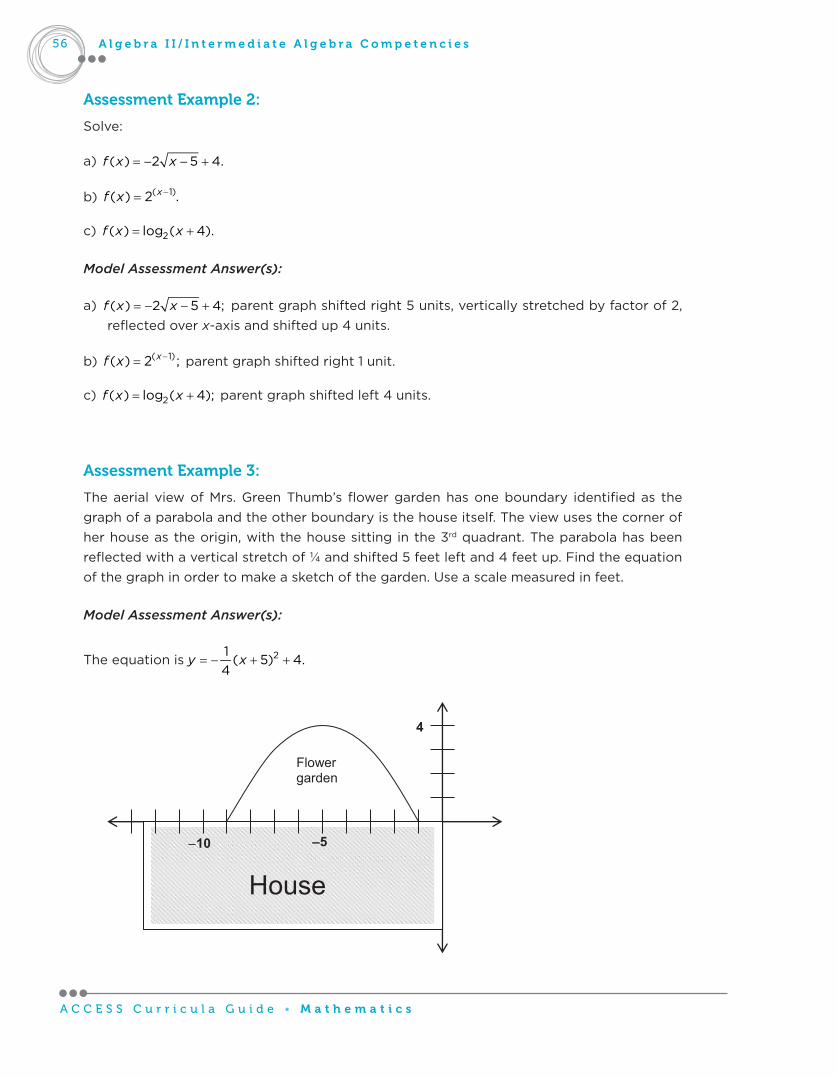
Assessment Example 3:
TheaerialviewofMrs.GreenThumb’sflowergardenhasoneboundary identifiedas thegraphofaparabolaandtheotherboundaryisthehouseitself.Theviewusesthecornerofherhouseastheorigin,withthehousesittinginthe3rdquadrant.Theparabolahasbeenreflectedwithaverticalstretchof¼andshifted5feetleftand4feetup.Findtheequationofthegraphinordertomakeasketchofthegarden.Useascalemeasuredinfeet.
Model Assessment Answer(s):
Theequationis = − + +21( 5) 4.
4y x
Figure A16-3
House
5
Flower garden
10
4

M a t h e m a t i c s • A C C E S S C u r r i c u l a G u i d e
A l g e b r a I I / I n t e r m e d i a t e A l g e b r a C o m p e t e n c i e s 57
C O M P E T E N C Y 2 6
Identify the parent function (quadratic, cubic, square root, absolute value, exponential, and logarithmic) and transformations for a given transformed function in algebraic or graphical form.
Prior Knowledge:
• Recognizeandidentifythegraphof 2.y x=
• Recognizeandidentifythegraphof 3.y x=
• Recognizeandidentifythegraphof .y x=
• Recognizeandidentifythegraphof .y x=
• Recognizeandidentifythegraphof .xy a=
• Recognizeandidentifythegraphof ln .y x=
• Graphpolynomialfunctions.
• Identifythex-andy-interceptsofagraphofafunction.
Model Assessments
Assessment Example 1:
Youaredesigningaheaderforyourcompany’sstationery. Itrequiresaparabolicarcthatbeginsandends1.5inchesbelowthetopedgeofthepaper,andpeaksinthemiddleofthepage1inchbelowthetopofthepaper.Findanequationforthisparabola.
Model Assessment Answer(s):
Transformtheparabolay=x2,whichpassesthroughthepoints(-1,1),(0,0),and(1,1).Ifx and y are bothmeasuredininches,thenthisarchasawidthof2inchesandaheightof1inch.Assumingthepagemeasures8½x11inchesandalldistancesaremeasuredfromthebottomleft-handcornerofthepage,thetargetarchasawidthof8½inchesandaheightof½inch.Stretchtheparabolahorizontallybyafactorof4.25andcompressitverticallybyafactorof0.5inordertomatchthetargetmeasurements.Reflectthearcacrossthex-axissothatitopensdownward,andtranslate4.25inchesrightand10inchesupsothatitsvertexisintherightplace.Itsequationwillbe:
− − − =
24.25( 10) 0.5 ,
4.25x
y or = − − +
240.5 1 10,
17x
y or = − + +28 4
9.5.289 17
x xy
Analternativesolutionwouldbetowritey=ax2+bx+c,usethepoints(0,9.5),(4.25,10),and(8.5,9.5)tobuilda3x3linearsystemina,b,andc,andsolvethatsystem.
Real World Application Reference:
• Marketing,Sales,andService

A C C E S S C u r r i c u l a G u i d e • M a t h e m a t i c s
A l g e b r a I I / I n t e r m e d i a t e A l g e b r a C o m p e t e n c i e s58
Assessment Example 2:
Aparabola has an equation of y = –3x 2 + 18x – 11. Complete the square to convert thisequationtovertexform;thenidentifyasequenceoftransformationsthatturnthegraphofy=x 2intothegraphofy=–3x 2+18x–11.
Model Assessment Answer(s):
Completethesquaretoobtainvertexformequation: ( )23 3 16.y x= − − +
Sequenceoftransformations:
y=x 2.
Horizontaltranslation3unitsright(replacevariablexwithx–3):y=(x–3)2.
Verticalstretchbyfactorof3(multiplyright-handsideby3or,equivalently,replaceywith3y):
y=3(x–3)2.
Reflectionacrossx-axis(multiplyright-handsideby-1or,equivalently,replaceywith–y):y=–3(x–3)2.
Verticaltranslation16unitsup(add16toright-handsideor,equivalently,replacey withy–16):y=–3(x–3)2+16.
Assessment Example 3:
Paireach function in thefirstcolumnwith itsparent function in thesecondcolumn,andidentifyasequenceoftransformationstoturnoneintotheother:
( ) ( )( )
( )
( ) ( )
4
4 1
1. 5 1 3.
2. 3 7.
13. 4 2.
24. 2ln 3 2 .
x
f x x
g x e
h x x
p x x
+
= + −
= −
= − +
= +
4
A. ln .
B. .
C. .
D. .
x
y x
y x
y e
y x
=
=
=
=
Model Assessment Answer(s):
1. D.Startwithy=x 4;translate1lefttogety=(x+1)4;verticallystretchbyafactorof5toget y=5(x+1)4;translate3downtogety=5(x+1)4–3.
2. C.Startwithy=ex;horizontallycompress(fixingthey-axis)byafactorof¼togety=e4x;translateleft¼togety=e4x +1;verticallystretch(fixingthex-axis)byafactorof3 to get y=3e4x +1;translate7downtogety=3e4x +1–7.
3. B.Startwith = ;y x translate4lefttoget = +4;y x reflectacrossthey-axistoget
= − + = −4 4 ;y x x compressverticallybyafactorof½toget = −14 ;
2y x translate
2uptoget = − +14 2.
2y x
4. A.Startwithy=lnx;horizontallycompress(fixingthey-axis)byfactor½togety=ln(3x);
translateleft23 to get y=ln3(x+2);verticallystretchbyafactorof2togety=2ln(3x+2).

M a t h e m a t i c s • A C C E S S C u r r i c u l a G u i d e
A l g e b r a I I / I n t e r m e d i a t e A l g e b r a C o m p e t e n c i e s 59
Assessment Example 4:
Namethetransformation(s)shownineachpicture.Giventhatthefunctionshownbythesolidcurveisrepresentedbytheequationf(x)=x3,findanequationforthefunctionrepresentedbythedashedcurve.
a)
Figure A17-4a
-4 -3 -2 -1 1 2 3 4
-4
-3
-2
-1
1
2
3
4
5
6
b)
Figure A17-4b
-4 -3 -2 -1 1 2 3 4
-4
-3
-2
-1
1
2
3
4

A C C E S S C u r r i c u l a G u i d e • M a t h e m a t i c s
A l g e b r a I I / I n t e r m e d i a t e A l g e b r a C o m p e t e n c i e s60
c)
Figure A17-4c
-4 -3 -2 -1 1 2 3 4
-4
-3
-2
-1
1
2
3
4
d)
Figure A17-4d
-2 -1 1 2
-3
-2
-1
1
2
3
e)
Figure A17-4e
-3 -2 -1 1 2 3
-3-2-1
123456789
10

M a t h e m a t i c s • A C C E S S C u r r i c u l a G u i d e
A l g e b r a I I / I n t e r m e d i a t e A l g e b r a C o m p e t e n c i e s 61
Model Assessment Answer(s):
a) Thisisaverticaltranslation,slidingeachpoint3unitsup.Thedashedfunctionhastheequationg(x)=x3+3.Thisisreasonablebecauseg(0)=3andg(1)=4.
b) Thisisahorizontaltranslation,slidingeachpoint2unitstotheright.Thedashedfunctionhastheequationg(x)=(x–2)3.Thisisreasonablebecauseg(2)=0andg(3)=1.
c) Thisisadiagonaltranslation,slidingeachpoint1unitrightand2unitsdown.(Equivalently,itisthecompositionoftwotranslations:oneofthemslidingallpoints1unittotherightandtheotherslidingallpoints2unitsdown.)Thedashedfunctionhastheequationg(x)=(x–1)3–2.Thisisreasonablebecauseg(1)=–2andg(2)=–1.
d) Thisisahorizontalcompressionbyafactorof½.Thedashedfunctionhastheequationg(x)=(2x)3.Thisisreasonablebecauseg(0)=0andg(½)=1.
e) Thisisaverticalstretchbyafactorof8.Thedashedfunctionhastheequationg(x)=8x3.Thisisreasonablebecauseg(0)=0andg(1)=8.Notethat(2x)3=8x3,sothisfigureandthepreviousonehavethesamedashedfunction,eventhoughthetransformationsandviewingwindowsaredifferent.

A C C E S S C u r r i c u l a G u i d e • M a t h e m a t i c s
A l g e b r a I I / I n t e r m e d i a t e A l g e b r a C o m p e t e n c i e s62
C O M P E T E N C Y 2 7
Compose two linear, quadratic, cubic, square root, absolute value, exponential, or logarithmic functions.
Prior Knowledge:
• Defineafunction.• Usefunctionnotation.• Add,subtract,multiply,anddividepolynomialstographfunctions.• Recognizetheconceptofreflectioningraphicalterms.
Model Assessments
Assessment Example 1:
If = −2( ) 6 2f x x and = −( ) 5,g x x
a) find ( )( )6 .f g
b) find .f g
�
Model Assessment Answer(s):
a) ( (6)) 4.f g =
b) ( )( ) ( ( )) 6 32.f g x f g x x= = −
Assessment Example 2:
Let −
=2 1
( )3
xh x and = −( ) 3 7 .g x x Find ( (4)).g h
Model Assessment Answer(s):
( )( )4 0.g h =
Real World Application Reference:
• AgricultureandNaturalResources• EngineeringandDesign• PublicServices• Transportation

M a t h e m a t i c s • A C C E S S C u r r i c u l a G u i d e
A l g e b r a I I / I n t e r m e d i a t e A l g e b r a C o m p e t e n c i e s 63
Assessment Example 3:
Anoiltankerstruckasubmergedrockastheresultofanavigationerror.Therockrippedaholeinthebottomofthetanker,spillingoilfromtheoilstoragebunkers.Thespreadofoilleakingfromthetankerisintheshapeofacircle.Theradiusoftheleakagezone(infeet)afterthoursis ( ) = 200 .r t t FindtheareaAoftheleakagezoneasafunctionoftime.
Model Assessment Answer(s):
Use π= 2( )A r r torepresenttheareaofthecircleandgiven =( ) 200 .r t t
( )( ) ( ( )) 40000 .A r t A r t tπ= =

A C C E S S C u r r i c u l a G u i d e • M a t h e m a t i c s
A l g e b r a I I / I n t e r m e d i a t e A l g e b r a C o m p e t e n c i e s64
C O M P E T E N C Y 2 8
Find the inverse of linear, quadratic, cubic, square root, absolute value, exponential, and logarithmic functions algebraically and graphically.
Prior Knowledge:
• Usefunctionnotation.• Add,subtract,multiply,anddividepolynomials.• Identifythegraphsoftheparentfunctionslistedinthecompetency.• Applytheconceptofareflectionacrosstheliney=x.• Applypropertiesofexponents.
Model Assessments
Assessment Example 1:
Findtheinverseofthefunction:
−= +2( 4)
( ) 1.5
xg x
Model Assessment Answer(s):
− +=1 5 3
( ) .2
xg x
Assessment Example 2:
Findtheinverseofthefunction: = − −3( ) 2( 7) 32.f x x
Model Assessment Answer(s):
− + = +
131 32
( ) 7.2
xf x
Real World Application Reference:
• FinanceandBusiness

M a t h e m a t i c s • A C C E S S C u r r i c u l a G u i d e
A l g e b r a I I / I n t e r m e d i a t e A l g e b r a C o m p e t e n c i e s 65
Assessment Example 3:
Given: ( ) −= 3
7 48
xp x ,find: ( )−1 .p x
Model Assessment Answer(s):
( )3
1 8 4.
7x
p x− +=
Assessment Example 4:
Theprofitmadebyacompanymanufacturingshoesisgivenby = + −2( ) 0.01 0.5 100,P x x x wherexrepresentsthenumberofpairsofshoesproduced.
a) FindtheinverseofP(x), −1( )P x for ≥ 0.x
b) Approximatelyhowmanypairsofshoeswouldthecompanyhavetoproducetomakeaprofitof$10,000?
Model Assessment Answer(s):
a) Tofindtheinverse,let = + −20.01 0.5 100.y x x
−
= + −
+ = +
+ + = + +
+ = +
+ = +
= + −
= + −
2
2
2
2
1
100 50 10000,
100 10000 50 ,
100 10000 625 50 625,
100 10625 ( 25) ,
100 10625 25,
100 10625 25,
( ) 100 10625 25.
x y y
x y y
x y y
x y
x y
y x
P x x
b) Tomakeaprofitof$10,000,findP-1(10000),whichisapproximately981pairsofshoes.

A C C E S S C u r r i c u l a G u i d e • M a t h e m a t i c s
A l g e b r a I I / I n t e r m e d i a t e A l g e b r a C o m p e t e n c i e s66
C O M P E T E N C Y 2 9
Find the equation of an exponential function given two points on the graph.
Prior Knowledge:
• Applythepropertiesofexponents.• Usethebasicnotationoffractional
exponents.• Simplifyradicals.
Model Assessments
Assessment Example 1:
Findtheequationofanexponentialfunctionthatpassesthroughthepoints(2,264)and(6,4044)andhasahorizontalasymptoteaty=12.
Model Assessment Answer(s):
= + .xy ab c
Sincey=12 isanasymptote,y=abx+12.
Sincethegraphpassesthrough(2,264),2
2
2
264 12,
252 ,252
,
ab
ab
ab
= +
=
=
2
252So, 12.xy b
b= +
Sincethegraphpassesthrough(6,4044),
62
4
4
2
2524044 12,
4032 252 ,
16 ,2 ,
252,
263 .
bb
b
bb
a
a
= +
=
==
=
=
Sothesolutionis (63)2 12.xy = +
Real World Application Reference:
• FinanceandBusiness• PublicServices• HealthScienceandMedical Technology

M a t h e m a t i c s • A C C E S S C u r r i c u l a G u i d e
A l g e b r a I I / I n t e r m e d i a t e A l g e b r a C o m p e t e n c i e s 67
Assessment Example 2:
Findtheexponentialfunctionthatpassesthrough(2,252)and(6,4032).
Model Assessment Answer(s):
= .xy ab
Thesolutionis (63)2 .xy =
Assessment Example 3:
IfthepopulationofMathvillewas3,020in1926and5,955in1939,determinethepopulationofMathvillein1984givensteadyexponentialgrowth.
Model Assessment Answer(s):
(1926,3020)and(1939,5955)→ (0,3020)and(13,5955).Using = ,xy ab weknowthat = 3020.a
=
=
=
= =
=
13
13
113
,
5955 3020( ) ,
1.9719 ,
(1.9719 ) 1.054,
3020(1.054) .
x
x
y ab
b
b
b
y
Theyear1984is58yearsafter1926,whichiswhywewillusex=58.
So,y=3020(1.054)58=63791.
ThepopulationinMathvillein1984was63,791.
Assessment Example 4:
Fiveyearsago,Sam’scarwasworth$15,400.Fiveyearsfromnowitwillbeworth$4,600.Assumingthedepreciationisexponential,whatisitworthnow?(Roundyouranswertothenearestdollar).
Model Assessment Answer(s):
-5 15400
5 4600
,0.8862,8416,$8,416.
xy abbay
=≈==
Sam’scariscurrentlyworth$8,416.

A C C E S S C u r r i c u l a G u i d e • M a t h e m a t i c s
A l g e b r a I I / I n t e r m e d i a t e A l g e b r a C o m p e t e n c i e s68
C O M P E T E N C Y 3 0
Use multiple representations (tables, graphs, and equations) to solve contextualized problems that result in one- and two-step exponential and logarithmic equations.
Prior Knowledge:
• Recognizeinversefunctionsandtheirproperties.
• Usepropertiesofexponents.• Usepropertiesofrealnumbers.• Applythepropertiesofexponents.• Usethebasicnotationoffractional
exponents.• Simplifyradicals.• Applythepropertiesoflogarithms.• Applythepropertiesofexponents.• Applythedefinition/propertiesoflogarithms.• Applythelawsofexponents.• Factornumbersintotheirprimefactorizationswithappropriateexponentiation.• Recognizethatasinglelogarithmicexpressioncanbeexpandedintoanequivalentexpression.• Simplifyorexpandlogarithmicexpressions.
Model Assessments
Assessment Example 1:
Findtheparticularexponentialequationforthegraphshown.
Figure A30-1
-4 -3 -2 -1 1 2 3 4 5
-60
-50
-40
-30
-20
-10
10
(-1, -2)
(4, -64)
Real World Application Reference:
• AgricultureandNaturalResources• FinanceandBusiness• HealthScienceandMedicalTechnology• PublicServices

M a t h e m a t i c s • A C C E S S C u r r i c u l a G u i d e
A l g e b r a I I / I n t e r m e d i a t e A l g e b r a C o m p e t e n c i e s 69
Model Assessment Answer(s):
Theequationofthisgraphisoftheform ( ) ,xy c b= − whichpassesthroughthetwopoints(–1,–2)and(4,–64).
Theequationofthegraphis 4(2) .xy = −
Assessment Example 2:
Onanostrichfarm,assumethenumberofostrichesinapopulationdoublesapproximatelyevery10months,andthefarmbeginswith6ostriches.
a) Writeanequationtomodelthenumberofostrichesatagiventime.
b) Howmanyostricheswilltherebeafter5years?
c) Whenwillthenumberofostrichesreach10,000?
Model Assessment Answer(s):
a) Equationis:P=6(2)xwherexrepresents10-monthperiods.
b) 5years=60months⇒ 6ten-monthperiods,sox=6andP=384ostriches.
c) P=10,000, 10.7,x ≈ so107monthsor8years,11months.
Assessment Example 3:
Ateacherhasjustcontractedabaldingbacterialvirus.Hecurrentlyhassixbacteriapresentinhissystemandthebacteriadoubleevery4.5hours.Whenthebacteriareach1billion,theteacherwillbeforcedtofacebaldness.
a) Howlongdoestheteacherhavebeforethebacteriahitthecriticallevel?
b) Afterthreedays,theteachershowsthefirstsignsofthedreadeddisease.Hestartstakingantibioticstokilloffthevirus.Theantibioticswillstoptheproductionofanynewbacteriaandwillkill20%oftheviruseveryhour.Whenthenumberofbacteriadropsbelowone,heiscured.Whenwillhebecured?
Model Assessment Answer(s):
a) Findthegrowthrateofthebacteriabyusingtheexponentialfunction = 0ktP P e whereP
isthepopulationatagiventime,t;P0istheinitialpopulation;kisthegrowthrate;andt
isthetime(inhours).Weknowthat =0 6P andthatwhen 4.5t = hours,Pwillbe12.122.9t ≈ hours,orabout5days.

A C C E S S C u r r i c u l a G u i d e • M a t h e m a t i c s
A l g e b r a I I / I n t e r m e d i a t e A l g e b r a C o m p e t e n c i e s70
b) Thepopulationofthebacteriaafterthreedayswillbewhen 3(24) 72t = = hours.
= =ln2 (72)4.56 393,216P e bacteriaafter3days.
Adifferentexponentialmodelisneededtoaccountforthedeathof20%oftheviruseveryhour.After1hour,thebacteriacountwillbe:
393216 (0.2)(393216) (0.8)(393216).− =
Usethistofindthedecayrate,k: ( )1(0.8)(393216) 393216 ,ke=
ln0.8 ln ln .ke k e k= = =
Tofindoutwhenhewillbecured,let 1P = andsolvefort: (ln0.8)1 383216 .te=
57.6t ≈ hours,orabout2.4days.
Assessment Example 4:
Theequation120.06
112
t
A P = +
modelstheamountofmoneyinabankaccountbalanceafter
tyears,withinterestcompoundedmonthly.
a) DoesP represent thepopulation, interest rate,finalbalance, startingbalance,or timeelapsed?
b) Whatdoes0.06represent?
Model Assessment Answer(s):
a) Prepresentsthestartingbalance.
b) 0.06representsthe6%annualinterestrate.
Assessment Example 5:
ThevalueofMr.Investor’sstocksisplummeting.Eachmonthhisportfolio(thesumofhisstocks)loses4%ofitsvalue.Currentlytheportfolioisworth$512,342.
a) Atthisrate,whatwillhisportfoliobeworthinayear?
b) Whatwashisportfolioworth8monthsago?

M a t h e m a t i c s • A C C E S S C u r r i c u l a G u i d e
A l g e b r a I I / I n t e r m e d i a t e A l g e b r a C o m p e t e n c i e s 71
Model Assessment Answer(s):
Thegeneralformoftheequationis
( )( ) ,toA t A r=
whereA0istheinitialamountintheportfolioandristhepercentagerate.Sincethestockloses
4%ofitsvalueeverymonth,thepercentagerateremainingeachperiodis96%.Thespecific
formoftheequationforthisproblemis:
( )( ) 512342 0.96 ,tA t =
whereA(t)istheamounthisportfolioisworthaftertmonths.
a) Tofindoutwhattheportfoliowillbeworthinayear, 12t = (sincetisinmonths)and
( ) ( )1212 512342 0.96 $313,916.94.A = ≈
b) Todeterminewhathisportfoliowasworth8monthsago,
( ) 8( 8) 512342 0.96 $710,215.42.A −− = ≈
Assessment Example 6:
Jenniferhad$1,250inasavingsaccount3yearsago.Theannual interestrateatthetimeofdepositwas6%,compoundedquarterly.
a) Writeanequationtorepresenttheamountofmoneyintheaccount.
b) Howmuchmoneyisintheaccounttoday?
c) Howmanyyearswillittakeforthemoneyintheaccounttodouble?
Model Assessment Answer(s):
a) ( ) 1250(1.015) ,tA t = t=#ofquarters.b) 3years=12quarters,t=12and $1494.52.A ≈
c) 46.56t = quarters,sotheamountwilldoublein11.6years.

A C C E S S C u r r i c u l a G u i d e • M a t h e m a t i c s
A l g e b r a I I / I n t e r m e d i a t e A l g e b r a C o m p e t e n c i e s72
Assessment Example 7:
a) Writeinexponentialform: =2log 64 .y
b) Writeinlogarithmicform: + =2 1 59 3 .x x
c) Application:Buildatableofvaluestofindfourpointsonthegraphof ( ) 3 .xf x =
d) Usethistabletographthefunction.
e) Usethetabletobuildacorrespondingtablefor ( )−1 .f x
f) Graphthatinverse.Writethedomainandrangeofeach.
g) Explainhowthedomainandrangeofexponentialand logarithmic functions relate toeachother.
h) Betweenwhichtwointegersmust 5log 21lie?
Model Assessment Answer(s):
a) =2 64.y
b) = +59log 3 2 1.x x
c)
x 0 1 2 3
y 1 3 9 27
d) Graph = 3xy (below);domain ( ), ;−∞ ∞ range ( )0, .∞
Figure A21-8d
-6 -5 -4 -3 -2 -1 1 2 3 4 5 6
-5-4-3-2-1
12345678
e)
x 1 3 9 27
y 0 1 2 3

M a t h e m a t i c s • A C C E S S C u r r i c u l a G u i d e
A l g e b r a I I / I n t e r m e d i a t e A l g e b r a C o m p e t e n c i e s 73
f) Graphoftheinverseof = 3xy (below);domain: ( )0, ;∞ range: ( ), .−∞ ∞
Figure A21-8f
-6 -5 -4 -3 -2 -1 1 2 3 4 5 6 7 8
-5
-4
-3
-2
-1
1
2
3
4
5
g) Foranyexponentialequationanditsinverselogarithmicequation,thedomainandrangewilltradeplaces.
h) Between1and2.
Assessment Example 8:
Solveforx:
a) ( )4.2 3.7 2 26.46.x − =
b) =log (5,280) 8.x
c) ( )( )+= 318 2 3 .x
d) ( ) ( )+ + − =3 3log 3 log 5 2.x x
e) ( )− − =2 2 2log log 6 log 21.x x
f) ( )+ + =2 2log 10 log 8 1.x

A C C E S S C u r r i c u l a G u i d e • M a t h e m a t i c s
A l g e b r a I I / I n t e r m e d i a t e A l g e b r a C o m p e t e n c i e s74
Model Assessment Answer(s):
a) 28.46
log4.2
,log3.7
1.4625.
x
x
=
≈
b) 2.9196.x ≈
c) ( )( )
( )( )
( )( )
+
+
+
=
=
=
= +− =
3
3
32
18 2 3 ,
9 3 ,
3 3 ,
2 3,1 .
x
x
x
xx
d) 6.x =
e) 63/10.
f) -39/5.
Assessment Example 9:
Choosetheexpressionthatisnotequivalentto: + −log log log :x y z
a)
log .xyz
b) ( )+ +log .x y z
c) −log log .xy z
d) +
log log .y
xz
Model Assessment Answer(s):
b) isnotequivalent.

M a t h e m a t i c s • A C C E S S C u r r i c u l a G u i d e
A l g e b r a I I / I n t e r m e d i a t e A l g e b r a C o m p e t e n c i e s 75
Assessment Example 10:
Ascientistlefta32-gramsampleofaradioactivesubstanceoutanditwasexposedtotheair.Thesubstancedecaysatanexponentialrate;after30minutes,only26gramsremained.
a) Howmuchofthesubstancewasleftwhenthejanitorfoundit8hoursafterthescientistleft?
b) Whatisthehalf-lifeofthesubstance?
Model Assessment Answer(s):
( ) = 0 ,ktA t A e
a) 1.15gramsleftafter8hours.
b) Half-lifeisabout1.670hours.
Assessment Example 11:
Inanursinghome,thestaffmustmakesurethatthecleaningsolutionwillnotbeharmfultothepatients.IfthepHislowerthan5,itwillbetooacidicandcouldbedangerous.TheconcentratedsolutionavailablehasapHof4andneedstobediluteduntilthepHis5.ThepHscaledefines thepHofa solutionas = −
+pH log H where
+H is theconcentrationofhydrogenionsinthesolutioninunitsofmolesperliter.If1literofcleaningsolutionofpH4isaddedto9litersofwater,whatwillbetheresultingpHofthesolution?
Model Assessment Answer(s):
ThepHofthestartingsolutionis4,sowehave:+4 log H . = −
Multiplybothsidesby-1:+4 log H , − =
thenrewriteinexponentialform:4 +10 H ,− =
sotheconcentrationofhydrogenionsis10-4moles/liter.
Thisneedstobemultipliedbythe1literofstartingsolutiontogive:
− −=4 4(10 moles/liter)(1liter) 10 moles.
When9litersofwaterareadded,the10-4molesofhydrogenionsarenowin10litersofsolution,sotheconcentrationis:
−−=
4510 moles
10 moles/liter.10liters
TofindtheresultingpH,pH=–log(10–5)=–(–5)=5,sothesolutionwillbesafe.

A C C E S S C u r r i c u l a G u i d e • M a t h e m a t i c s
A l g e b r a I I / I n t e r m e d i a t e A l g e b r a C o m p e t e n c i e s76
Assessment Example 12:
Carbon-14isusedindatingorganismsthathavedied.Thehalf-lifeforCarbon-14todecaytoNitrogen-14is5,730years.FindtheequationthatcanbeusedtodeterminetheamountofCarbon-14,C(t),remainingaftertyears.
Model Assessment Answer(s):
Thehalf-lifeofaradioactivedecaycanbedeterminedfromtheexponentialdecayequation
0( ) .rtC t C e=
Theequationis 0.000120968( ) 100 .tC t e−=

M a t h e m a t i c s • A C C E S S C u r r i c u l a G u i d e
A l g e b r a I I / I n t e r m e d i a t e A l g e b r a C o m p e t e n c i e s 77
C O M P E T E N C Y 3 1
Graph simple conics, including:
• a circle given its equation (centered anywhere)
• an ellipse given its equation (centered at the origin)
• a hyperbola given its equation (centered at the origin)
Prior Knowledge:
• Performarithmeticcomputationswithrationalnumbers.
• Graphalinearequation.• Graphaquadraticequation.• Convertbetweengeneralquadratic
equationandstandardform.• Interprettheconceptofasymptote.• Drawarectanglethroughfourgivenorderedpairs.• UsethePythagoreanTheorem.• Usethedistanceformula.
Model Assessments
Assessment Example 1:
Graph:x2+(y –1)2=4.
Model Assessment Answer(s):
center=(0,1),radius=2
Figure A22-1
-6 -5 -4 -3 -2 -1 1 2 3 4 5 6
-6-5-4-3-2-1
123456
Real World Application Reference:
• EngineeringandDesign• Transportation

A C C E S S C u r r i c u l a G u i d e • M a t h e m a t i c s
A l g e b r a I I / I n t e r m e d i a t e A l g e b r a C o m p e t e n c i e s78
Assessment Example 2:
Graph:x2+y2+4x–6y+12=0.
Model Assessment Answer(s):
(x+2)2+(y–3)2=1.
center=(-2,3),radius=1
Figure A22-2
-6 -5 -4 -3 -2 -1 1 2 3 4 5 6
-6-5-4-3-2-1
123456
Assessment Example 3:
Thereisanexplosioninapipelineinanurbanneighborhood.Theareaofthedamageisroughlycircular,andtheouterlimitisdescribedbytheequationx 2+y 2+2x+4y–20=0,withthepoint(0,0) locatedat the localfire station.Find the locationof theexplosion (locatedat thecenterofthecircle)andtheblastradius.
Model Assessment Answer(s):
(x+1)2+(y+2)2=25.
Thecenterofthecircle(thesiteoftheexplosion)is1unitwestand2unitssouthofthefirestation.Theblastradiusis5units.

M a t h e m a t i c s • A C C E S S C u r r i c u l a G u i d e
A l g e b r a I I / I n t e r m e d i a t e A l g e b r a C o m p e t e n c i e s 79
Assessment Example 4:
Findthecoordinatesoftheverticesandfocioftheellipse,thengraphtheellipse: + =2 2
1.9 4x y
Model Assessment Answer(s):
Figure A22-4
-6 -5 -4 -3 -2 -1 1 2 3 4 5 6
-6-5-4-3-2-1
123456
Vertex (3, 0)
Vertex (-3, 0)
Foci
center=(0,0)
vertices=(3,0)(-3,0)
foci= ( )5, 0±
Assessment Example 5:
Anarchintheshapeoftheupperhalfofanellipseisusedtosupportabridgespanningariverthatis20meterswide.Thecenterofthearchis6metersabovethecenteroftheriver.Writeanequationfortheellipseinwhichthex-axiscoincideswiththewaterlevelandthey-axispassesthroughthecenterofthearch.Makeagraphtorepresentthissituation.
Model Assessment Answer(s):
Theriveris20meterswide,soa=10meters;thebridgeis6metersoverthewater,sob=6meters:
= − → = − → = → = ±2 2 2 2 236 100 64 8.b a c c c c Equationis: + =2 2
2 21.
10 6x y
Figure A22-5
-12-10 -8 -6 -4 -2 2 4 6 8 10 12-1
12
3
4
5
6
78
9
10

A C C E S S C u r r i c u l a G u i d e • M a t h e m a t i c s
A l g e b r a I I / I n t e r m e d i a t e A l g e b r a C o m p e t e n c i e s80
Assessment Example 6 :
Graphthehyperbolaandshowtheasymptotes:
− =2 2
1.16 4x y
Model Assessment Answer(s):
asymptotes: =12
y x and = −1.
2y x
Figure A22-6
-10 -8 -6 -4 -2 2 4 6 8 10
-8
-6
-4
-2
2
4
6
8
Assessment Example 7:
TheLORANsystem(LongRangeNavigation)useshyperbolastodetermineaship’spositionatsea.Twostationstransmitradiopulsestotheship.Thedifferenceinthetimesofarrivalofthesepulsestotheshipisaconstantonthehyperbolawiththestationsasthefoci.
Supposetwostations(AtowestofcenterandBtoeast)are300milesapartalongastraightsectionofshore.Ashipapproachingtheshoredeterminesthatitis80milesfartherfromstationAthanitisfromstationB.
a) Findtheequationofthehyperbolaonwhichtheshipislocated.
b) Iftheshipis50milesoffshore,findthecoordinatesforitslocation.

M a t h e m a t i c s • A C C E S S C u r r i c u l a G u i d e
A l g e b r a I I / I n t e r m e d i a t e A l g e b r a C o m p e t e n c i e s 81
Model Assessment Answer(s):
Graph:
Figure A22-7
-200 -150 -100 -50 50 100 150 200
-200
-150
-100
-50
50
100
150
200
Station B (150, 0)
Station A (-150, 0)
Ship
a) Ifstationsare300milesapart,thecoordinatesofthefociare(-150,0)and(150,0)andc=150.Bydefinitionofahyperbola,thedifferenceindistancesfromapointtothefociisequalto 2a,so2a =80anda=40.
Forahyperbola,b2=c2–a2,sob2=22500–1600,or20900.
Theequationofthehyperbolais: − =2 2
1.1600 20900
x y
b) Iftheshipis50milesfromshore,theny=50.
2
2
25001,
1600 209002500
1600 1 ,20900
1791.1388,42.32.
x
x
xx
− =
= +
≈ ±≈ ±
BecausetheshipisclosertostationB,wewouldusethepositivexvalue.
Thecoordinatesoftheshipare(42.32,50).

A C C E S S C u r r i c u l a G u i d e • M a t h e m a t i c s
A l g e b r a I I / I n t e r m e d i a t e A l g e b r a C o m p e t e n c i e s82
C O M P E T E N C Y 3 2
Solve statistical problems:
• Computepermutationsusingfundamentalcountingprinciple.• Computecombinations.• Computeprobabilitiesusingcombinations.• Computeprobabilitiesusingpermutations.• Expandbinomialexpressionsusingthebinomialtheorem.
Prior Knowledge:
• Defineanduseafactorial.• Applypropertiesofexponents.
Model Assessments
Assessment Example 1:
Abankmanagerassignspasswordstoeachemployee.Howmanypasswordscanbeassignedusingthreelettersandfivedigits:
a) withrepetitions?
b) withoutrepetitions?
Model Assessment Answer(s):
Permutationsusethefundamentalcountingprinciple.Abankmanagercanassign:
a) withrepetitions,3 3 3 5 5 5 5 16,875passwords.=
b) withoutrepetitions,3 2 1 5 4 3 2 720passwords.=
Assessment Example 2:
Arestaurantmanageroffersavaluecombomealwithachoiceof12varietiesofsandwiches,6varietiesofdrinks,and5varietiesofchips.Howmanypossiblecombomealsareavailabletocustomers?
Model Assessment Answer(s):
12 6 5 360= possiblecombomeals.
Real World Application Reference:
• FinanceandBusiness• Hospitality,Tourism,andRecreation• AgricultureandNaturalResources

M a t h e m a t i c s • A C C E S S C u r r i c u l a G u i d e
A l g e b r a I I / I n t e r m e d i a t e A l g e b r a C o m p e t e n c i e s 83
Assessment Example 3:
a) Theteammanagerofthelocalcoffeeshophastopickfouremployeestorepresenttheirstoreattheregionalsalesmeeting.Howmanycombinationsofemployeesarepossibleifthereare15employeesfromwhichtochoose?
b) Therearethreepositionsopenat the localnewspaper. If thereare 12applicants,howmanystaffingassignmentsarepossible?
Model Assessment Answer(s):
Combinationsusethefundamentalcountingprinciple:
a) 15 415
1,3654
C
= =
combinations.
b) 12 312
2203
C
= =
staffingassignmentsifthesethreepositionsarethesame,and
12 3 12 11 10 1,320P = = staffingassignmentsifthesethreepositionsarealldifferent.
Assessment Example 4:
Thereare12peopleatXYZCompanywhowanttoattendaconference.WhatistheprobabilitythatJoseandAliciawillbethetwochosen?
Model Assessment Answer(s):
12 212
662
C
= =
waystochoose2peoplefrom12.
2 22
12
C
= =
wayforJoseandAliciatobechosentogether.
Theprobabilityis1/66=0.01515.
Assessment Example 5:
Amediafirmishavingacompany-widecontesttoseewhocancreatethebestcommercialtomarkettheirservices.Theywillbeawardingprizesforfirst,second,andthirdplacewinners.There are five departments in the firm and each department has 10 employees. If eachemployeesubmitsacommercial,whatistheprobabilitythatthethreewinningcommercialswillcomefromonedepartment?

A C C E S S C u r r i c u l a G u i d e • M a t h e m a t i c s
A l g e b r a I I / I n t e r m e d i a t e A l g e b r a C o m p e t e n c i e s84
Model Assessment Answer(s):
Thereare(5)(10)=50totalemployees.
Thereare 50 3 117,600P = waystoawardthreeprizes.
Thereare 8 3 336P = waysforaspecificdepartmenttowinallthreeprizes.
Theprobabilityforaspecificdepartmenttowinallthreeprizesis:
= =
8 7 6 3360.002857.
50 49 48 117600
Anyoneofthefivedepartmentscouldbethewinningdepartment,sotheprobabilitythatthethreewinningcommercialscomefromanyonedepartmentis:
( ) =
3365 0.01429.
117600
Assessment Example 6:
Adogbreedermatesablacklab(b)andagoldenretriever(g).Theprobabilityofhavingblackfuris0.6.Writethetermintheexpansionof(b+g)6 foreachofthefollowingoutcomes:
a) exactlytwoblack-furredpuppies.
b) exactlythreegolden-furredpuppies.
Model Assessment Answer(s):
( ) ( )= = − =0.6and 1 0.6 0.4.P b P g
Intheexpansionof(b+g)6foratotalof6puppies,theprobabilityofgetting
a) exactlytwoblack-furredpuppiesis:2 4 2 4
6 2[ ( )] [ ( )] 15(0.6) (0.4) 0.1382;C P b P g = =
b) exactlythreegolden-furredpuppiesis:3 3 3 3
6 3[ ( )] [ ( )] 20(0.6) (0.4) 0.2765.C P b P g = =
Assessment Example 7:
Usethebinomialtheoremtoexpandtheexpression 5(2 3) .x +
Model Assessment Answer(s):
( ) ( ) ( ) ( ) ( ) ( ) ( ) ( ) ( )( ) ( ) ( )5 0 4 3 2 2 3 4 0 5
5 4 3 2
5 5 5 5 5 52 3 2 3 2 3 2 3 2 3 2 3
0 1 2 3 4 5
32 240 720 1080 810 243.
x x x x x x
x x x x x
= + + + + +
= + + + + +

M a t h e m a t i c s • A C C E S S C u r r i c u l a G u i d e
A l g e b r a I I / I n t e r m e d i a t e A l g e b r a C o m p e t e n c i e s 85
C O M P E T E N C Y 3 3
Compute the general term and sums of arithmetic series, finite geometric series, and infinite geometric series.
Prior Knowledge:
• Evaluatealgebraicexpressions.• Simplifyexpressionspriortosolvinglinearequations.• Solvemultistepproblemsincludingwordproblemsinvolvinglinearandnonlinear
equations.• Usenotationinvolvingsubscriptsandexponents.• Differentiatebetweenafiniteset
ofnumbersvs.aninfinitesetofnumbers.
Model Assessments
Assessment Example 1:
Aclientofacontractorwantsabrickpatiofloorinthebackofhishouse.Hewants36brickstobethefirstrowofhispatiofloorandeachsuccessiverowtohavetwofewerbricks.
a) Writearuleforthenumberofbricksinthenthrow.
b) Whatisthetotalnumberofbricksneededforthispatiodeck,ifthelastrowhas10bricks?
Model Assessment Answer(s):
a) an=36–2(n–1).
b) S14=322bricks.
Assessment Example 2:
In2000,about680homesweresoldinalocalcommunity.From2000to2010,thenumberofhomessolddecreasedby7%eachyear.
a) Writearuleforthetotalnumberofhomessoldintermsoftheyear(n=1fortheyear2000).
b) Whatwasthetotalnumberofhomessoldfrom2000to2010(inclusive)?
Model Assessment Answer(s):
a) an=680(0.93)n–1.
b) S11=5,342homes.
Real World Application Reference:
• BuildingTradesandConstruction• FinanceandBusiness• Marketing,Sales,andService

A C C E S S C u r r i c u l a G u i d e • M a t h e m a t i c s
A l g e b r a I I / I n t e r m e d i a t e A l g e b r a C o m p e t e n c i e s86
Assessment Example 3:
Anofficesupplystorehadaprofitof$84,000thefirstyearitopened.Withthedepressionoftoday’seconomy,theirprofithasdecreasedby15%peryear.
a) Writearuleforeachyear’sprofitfortheofficesupplystore.
b) Withthedepressionoftheeconomy,whatisthetotalprofittheofficesupplystorecanmakeoverthecourseofitslifetime?
Model Assessment Answer(s):
a) an=84000(0.85)n–1.
b) S=$560,000.

M a t h e m a t i c s • A C C E S S C u r r i c u l a G u i d e
P r e c a l c u l u s C o m p e t e n c i e s 87
Precalculus Competencies

A C C E S S C u r r i c u l a G u i d e • M a t h e m a t i c s
P r e c a l c u l u s C o m p e t e n c i e s88
C O M P E T E N C Y 1
Perform matrix operations, including addition and multiplication, and calculate the determinants of 2x2 and 3x3 matrices.
Prior Knowledge:
• Solvesystemsofequationsintwoandthreevariablesusingsubstitutionandaddition/eliminationmethods.
• Writeasystemoflinearequationsinmatrixform.
• Performbasicmatrixrowoperations.
• Identifythedimensionsofamatrix.
• Identifytheelementsofamatrix(a11, b23,etc.).
Model Assessments
Assessment Example 1:
Addthefollowingmatrices,ifpossible.Ifnotpossible,explainwhynot.
Giventhesematrices,
2 16 4 10 3 5 2, , 5 3 ,5 2 10 1 4 7
0 43 3 1 9 3 0A B C
− − = = = −− − −
−− − − −
addthefollowing:
a) A+C
b) B+A
Model Assessment Answer(s):
a) A+CcannotbeperformedbecausethedimensionsofAandCaredifferent.
b)9 1 8
.4 2 312 0 1
B A−
+ = − − − − −
Real World Application Reference:
• BuildingTradesandConstruction• FinanceandBusiness

M a t h e m a t i c s • A C C E S S C u r r i c u l a G u i d e
P r e c a l c u l u s C o m p e t e n c i e s 89
Assessment Example 2:
Applymatrixoperationstosolveproblemsinvolvingmultiplication.Multiplythefollowingmatrices,ifpossible.Ifnotpossible,explainwhynot.
a)12
23
43 2 5.
5 1 63
− − −
b)12
23
4 5 3 2.
5 163
− − −
Model Assessment Answer(s):
a)
9 323
2 3 .11 62
312 3
− −
b) Matricescannotbemultipliedbecausetheinnerdimensionsdonotmatch.
Assessment Example 3:
Acontractor isdevelopingabudget forhercurrentconstructionprojects.Hercompanyisbuildingsingle-familyhomes,duplexes,andcondominiumcomplexes.Thecostsforthevarious categoriesofbuilding supplies are as follows: lumber costs $5,000 for a single-familyhome,$8,000 foraduplex, and$125,000 foracondominiumcomplex.Thecostsforwindowsare$3,000forasingle-familyhome,$5,000foraduplex,and$75,000foracondominiumcomplex.Concretecosts$7,500forasingle-familyhome,$12,000foraduplex,and$170,000foracondominiumcomplex.Plumbingsuppliesforeachrun$2,500,$3,500,and$50,000forthesingle-familyhome,duplex,andcondominiumcomplex,respectively.Roofingmaterialsforeachrun$5,000,$8,000,and$100,000forthesingle-familyhome,duplex,andcondominiumcomplex,respectively.
Thisyearsheisplanningtobuild10single-familyhomes,4duplexes,and7condominiumcomplexes. Use matrices to determine her total costs this year for each category ofconstructionmaterials.
Model Assessment Answer(s):
5000 8000 1250003000 5000 75000 107500 12000 170000 4 ,
72500 3500 500005000 8000 100000
Lumber 957000Windows 575000Concrete 1313000 .Plumbing 389000Roofing 782000
=

A C C E S S C u r r i c u l a G u i d e • M a t h e m a t i c s
P r e c a l c u l u s C o m p e t e n c i e s90
Assessment Example 4:
Applymatrixoperationstosolveproblemsinvolvingdeterminants.Findthedeterminantofthefollowingmatrices,iftheyexist:
a) 3 2.
5 1−
b)12
23
4 5.
63
− −
c)−
− −
4 2 12 1 2 .5 10 0.5
Model Assessment Answer(s):
a) -13.
b) Determinantdoesnotexist;notasquarematrix.
c) 75.
Assessment Example 5:
Clarisseinvestedatotalof$60,000inmoneymarketaccountsatthreedifferentbanks.BankApays2%interestperyear,BankBpays2.5%,andBankCpays3%.ShedecidedtoinvesttwiceasmuchinBankBasintheothertwobankscombined.After1year,Clarissehadearned$1,575ininterest.Howmuchdidsheinvestineachbank?UseCramer’sRuletosolvethissystemofequations.
Model Assessment Answer(s):
+ + = 60000,A B C
2 2 0,A B C− + =
0.02 0.025 0.03 1575.A B C+ + =
BankA=$2,500
BankB=$40,000
BankC=$17,500

M a t h e m a t i c s • A C C E S S C u r r i c u l a G u i d e
P r e c a l c u l u s C o m p e t e n c i e s 91
C O M P E T E N C Y 2
Describe different types of functions (polynomial, exponential, logarithmic, and trigonometric) using a table, a graph, an equation, and a verbal description.
Prior Knowledge:
• Determinethezeros(x-intercepts)ofpolynomialfunctions.
• Factorpolynomialsusingstandardfactoringtechniques.
• Apply appropriate function vocabulary (domain, range, asymptotes, etc.) todescribepropertiesoffunctions.
Model Assessments
Assessment Example 1:
ACCESSFoodServiceispreparingpiestoservefordessertinthediningcommons.Theywanttoservethepiesassoonaspossible,butneedthemtocoolafterremovingthemfromtheoven.Toavoidinjuries,thepiesneedtohaveaninternaltemperatureof120°Forlower.Therateofcoolingwillfollowadecreasingexponentialfunctionthatapproachestheambienttemperatureoftheroom,whichis75°F.Apieistakenoutoftheovenanditstemperatureismeasured.
• After2minutes,thepie’stemperatureis311°F.
• After5minutes,thepie’stemperaturehasdroppedto276°F.
a) Sketchagraphthatshowshoweachpie’stemperaturedecreasesovertimeafterbeingtakenoutoftheoven.Includeallimportantfeaturesofthegraph.
b) Temperature can be modeled by the function ( ) .tT t am k−= + The constant a is thetemperaturedifferencebetweenthepieandtheambientroomtemperatureatt=0andmisthetemperaturedecayrate.Whatisthevalueofk?
c) Usingthedatafromabove,findthefunctionforthepietemperature.
d) Whattemperatureisthepiewhenitfirstcomesoutoftheoven(time=0)?
e) Whenisitsafetoservethepies?
Real World Application Reference:
• AgricultureandNaturalResources
• BuildingTradesandConstruction
• EngineeringandDesign
• FinanceandBusiness
• Hospitality,Tourism,andRecreation

A C C E S S C u r r i c u l a G u i d e • M a t h e m a t i c s
P r e c a l c u l u s C o m p e t e n c i e s92
Model Assessment Answer(s):
Figure P2-1
10 20 30 40 50 60 70 80 90
255075
100125150175200225250275300325350
Time (min)
Tem
p (o F)
a) Thegraphstartsatthey-interceptofthetemperatureatwhichitisremovedfromtheoven.Thehorizontalasymptoteisattheroomtemperature,whichis75°.
b) Thefunctionis ( ) ,tT t am k−= + sothevalueofkisroomtemperature,whichis75°.
c) Theequationis ( ) (262.7)(1.055) 75.tT t −= +
d) (0) 337.7;T = thepiecomesoutoftheovenat337.7°F.
e) Tofindwhenthepiecanbeserved,setthetemperatureto120°andsolvefort.
Thepiecanbeservedafter33minutes.
Assessment Example 2:
Acabinetmakerneedstomakearectangulardrawerthatwouldhaveavolumeof4,500cubiccentimeters.Becauseofwhatthedrawerwillhold,thelengthofthedrawerneedstobetwicethewidth.
a) Determinetheformulaforthesurfaceareaasafunctionofthewidthofthedrawer.
b) Makeatableofthesurfaceareaasafunctionofthewidthofthedrawer.
c) Drawagraphofthesurfaceareaasafunctionofthewidthofthedrawer.
d) Useagraphingcalculatortofindtheheightsothatthesurfacearea isassmallaspossibletousetheleastamountofwood.
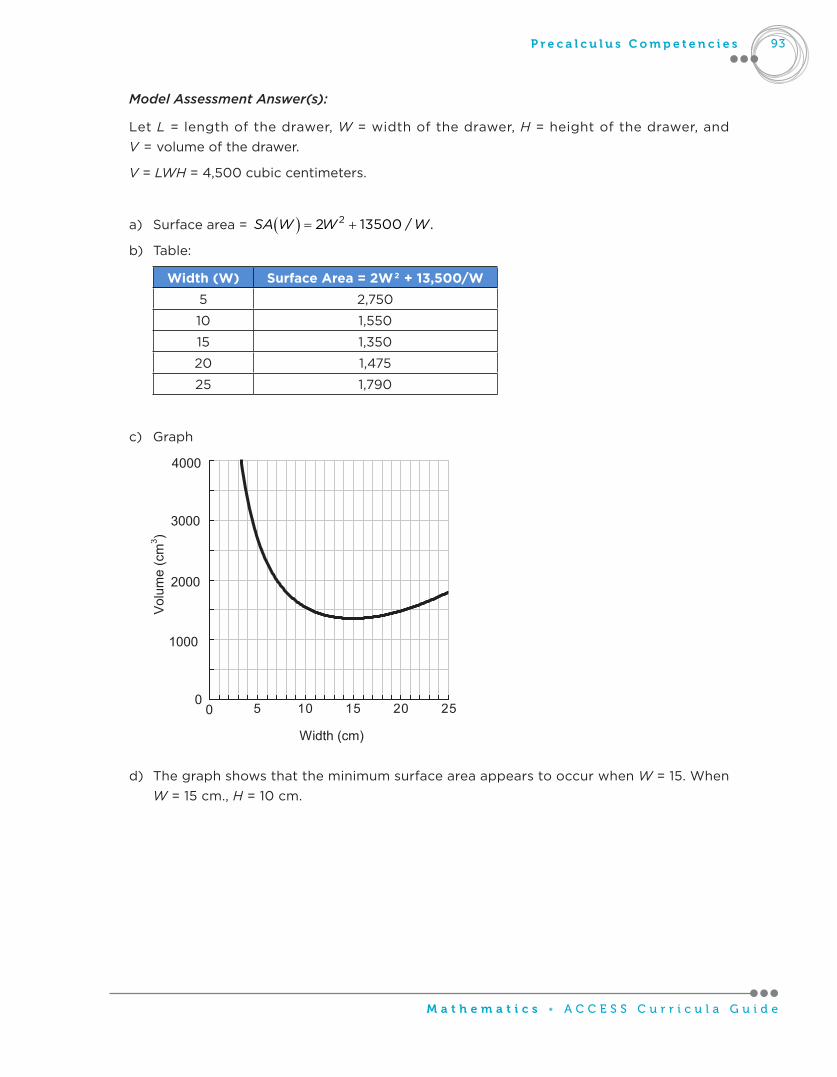
M a t h e m a t i c s • A C C E S S C u r r i c u l a G u i d e
P r e c a l c u l u s C o m p e t e n c i e s 93
Model Assessment Answer(s):
Let L =lengthofthedrawer,W =widthofthedrawer,H =heightofthedrawer,andV =volumeofthedrawer.
V=LWH=4,500cubiccentimeters.
a) Surfacearea= ( ) 22 13500 / .SA W W W= +
b) Table:
Width (W) Surface Area = 2W2 + 13,500/W5 2,750
10 1,550
15 1,350
20 1,475
25 1,790
c) Graph
Figure P2-2
5 10 15 20 25
Width (cm)
Volu
me
(cm
3 )
4000
3000
2000
1000
0 0
d) ThegraphshowsthattheminimumsurfaceareaappearstooccurwhenW =15.WhenW =15cm.,H=10cm.

A C C E S S C u r r i c u l a G u i d e • M a t h e m a t i c s
P r e c a l c u l u s C o m p e t e n c i e s94
Assessment Example 3:
Ifthecost,indollars,ofcleaningupanoilspillisgivenbythefunction 2,000,000( ) ,
100f x
x=
−
wherexisthepercentofthespillthathasbeencleanedup:
a) Howmuchwillitcosttocleanup50%ofthespill?80%?90%?
b) Drawagraphofthecostfunction.Describethebehaviorofthegraph.
c) Ifthecompanyisgoingtospend$4,000,000cleaningupthespill,whatpercentwillbecleanedup?
d) Will 100% of the spill be cleaned up?What feature of the graph leads you to thisconclusion?
Model Assessment Answer(s):
a) Findthevaluesofthefunctionwherex=50,then80,then90.
(50) 40000, (80) 100000, (90) 200000.f f f= = =
Itwillcost$40,000tocleanup50%ofthespill,$100,000tocleanup80%,and$200,000tocleanup90%.
b) Graph
Figure P2-3
10 20 30 40 50 60 70 80 90 100
Percent of spill (%)
Cos
t of c
lean
up ($
)
800K
600K
400K
200K
0K 0
1000K
c) Setf(x)=4,000,000andsolveforx.
Soifyouspend$4,000,000,youwillbeabletocleanup99.5%ofthespill.
d) It’simpossibletocleanuptheentirespill.Theamountofmoneyapproachesinfinityasx approaches100%.

M a t h e m a t i c s • A C C E S S C u r r i c u l a G u i d e
P r e c a l c u l u s C o m p e t e n c i e s 95
Assessment Example 4:
As sand isbeingunloaded fromahopper at a construction site, the risingpile is in theshapeofacone.Asmoreandmoresandpoursontothepile,thepilegrowsbuttheconesatdifferentstagesarealwayssimilar.After1minute,theheightoftheconeis5feetandtheradiusofthebaseis9feet.After3minutes,theheightis12feet.
a) Findanequationfortheareaofthebaseasafunctionoftime.
b) Howmuchareaonthegrounddoesthepilecoverafter3minutes?
Model Assessment Answer(s):
a) Findtheareaofthebaseasafunctionoftime.
Volumeformulaforarightcircularcone: 213 ,V r hπ= wherer=radiusofthecircularbase
andh=heightofthecone.Assumingthatthesandispouringoutataconstantrate,the
radiusofthebasewillchangeatalinearrate.
Areaofacircle: ( ) ( )22 6.3 2.7 .A r t A tπ π= = + =
b) Areacoveredatt=3.
( ) ( ) ( )2 23 6.3 3 2.7 21.6A π π = + = sq.ft.

A C C E S S C u r r i c u l a G u i d e • M a t h e m a t i c s
P r e c a l c u l u s C o m p e t e n c i e s96
C O M P E T E N C Y 3
Graph piecewise-defined functions.
Prior Knowledge:
• Graphlinear,quadratic,andradicalfunctions.
• Identifythedomainandrangeofafunction.
Model Assessments
Assessment Example 1:
a) Graph: − ≤=
+
214 for 2< 2,
( )for >2.2
x xf x
xx
b) Graph: ( )−
= − ≤ ≤
2ifx<0,
1 if0 x 2,1 ifx>2.
x
f x x
Model Assessment Answer(s):
a)
Figure P3-1a
-5 -4 -3 -2 -1 1 2 3 4 5 6 7 8
-5
-4
-3
-2
-1
1
2
3
4
5
Real World Application Reference:
• EnergyandUtilities• FinanceandBusiness

M a t h e m a t i c s • A C C E S S C u r r i c u l a G u i d e
P r e c a l c u l u s C o m p e t e n c i e s 97
b)
Figure P3-1b
-6 -5 -4 -3 -2 -1 1 2 3 4 5 6
-5
-4
-3-2
-1
1
2
34
5
6
Assessment Example 2:
HonestAbeFinancehad to revalue theirportfolio inmid-2008.Theirmonthlyprofit formonthtof2008isgivenby:
+= − ≥
25000 500000, 0< <6,( )
75000 50000 , 6.t t
P tt t
Graphthisfunctionfor2008.
Model Assessment Answer(s):
Figure P3-2
1 2 3 4 5 6 7 8 9 10 11 12
Month in 2008
Mon
thly
Pro
fit ($
100K
)
0 100
300
500
700
-200
-400
-600

A C C E S S C u r r i c u l a G u i d e • M a t h e m a t i c s
P r e c a l c u l u s C o m p e t e n c i e s98
Assessment Example 3:
SanCalpassiaGas & Electric charges its residential customers a base rate of $7.00 permonthplus$0.06perkilowatt-hour(kWh)forthefirst491kWh,and$0.111perkWhforallusageabovethatamount.Thereisanadditionalsurchargeof$0.02perkWhforelectricusageduringpeak-demandhours.
a) Graphtheenergychargefunction(amountcustomershavetopay)fornormalusage,notincludingthepeak-demandsurcharge,upto1,000kWhofelectricityusage.
b) DuringthemonthofAugust2008,yourenergyusagewas753kWh.Ofthat753kWh,75kWhwereusedduringthepeak-demandtimeperiod.DeterminethetotalcostoftheenergybillforthemonthofAugust2008,excludingtaxesandadditionalsurcharges.
Model Assessment Answer(s):
( ) ( )7.00 0.06 for 491 ,36.46 0.111 491 for 491 .
x x kWhC x
x x kWh+ ≤= + − >
a) EnergychargefunctionforSanCalpassiaGas&Electric:
Figure P3-3
200 400 600 800 1000
102030405060708090
100110120
0 Energy usage (kWh)
Ener
gy c
harg
e ($
)
b) ( ) ( )+ =753 0.02 75 $67.04.C

M a t h e m a t i c s • A C C E S S C u r r i c u l a G u i d e
P r e c a l c u l u s C o m p e t e n c i e s 99
C O M P E T E N C Y 4
Find all real zeros (roots) of polynomial functions exactly using the rational root theorem.
Prior Knowledge:
• Applystandardfactoringtechniquestopolynomials.
• Dividepolynomialsusinglongdivisionandsyntheticdivision.
• Solvepolynomialequations.
Model Assessments
Assessment Example 1:
Listthepossiblerationalzeros;findallrealzeros:
= + − −3 2( ) 4 10.f x x x x
Model Assessment Answer(s):
Possiblerationalzeros: 1, 2, 5, 10.± ± ± ±
Realzeros:1
2, 6.2
− − ±
Assessment Example 2:
Listthepossiblerationalzeros;findallrealzeros:
= − + −3 2( ) 3 3 9.f x x x x
Model Assessment Answer(s):
Possiblerationalzeros: 1, 3, 9.± ± ±
Realzeros:3.
Real World Application Reference:
• ManufacturingandProductDevelopment

A C C E S S C u r r i c u l a G u i d e • M a t h e m a t i c s
P r e c a l c u l u s C o m p e t e n c i e s100
Assessment Example 3:
Inmetalshop,youhavebeentaskedwithcreatingaprototypemetaltraythatisopenontop.Yourstartingmaterialisarectangularsheetoftinthatis22centimetersby28centimeters.Youaretocutsquaresofequalsizesfromeachcornerandfoldtheresultingflapsuponeachsidetoformthetray.
a) FindaformulaforthevolumeV(x).
b) Whatisthedomainofthisfunction?
c) SketchthegraphofV(x).
d) Forwhichvalue(s)ofxdoesthetrayhaveavolumeof1,080squaredcentimeters?
Model Assessment Answer(s):
a) ( ) ( )( )= − − = − +3 228 2 22 2 4 100 616 .V x x x x x x x
b) ∈ (0,11).x
c) GraphofV(x):
Figure P4-3c
5 10 15 20-200
0
200
400
600
800
1000
1200
1400
d) Twosolutions: 5 cm. or 3.2 cm.x x= ≈

M a t h e m a t i c s • A C C E S S C u r r i c u l a G u i d e
P r e c a l c u l u s C o m p e t e n c i e s 101
C O M P E T E N C Y 5
Find all the zeros (roots) of a polynomial function.
Prior Knowledge:
• Dividepolynomialsusinglongdivisionandsyntheticdivision.
• Applystandardfactoringtechniquestopolynomials.
• Solvepolynomialequations.
• Identifyrealandcomplexsolutionstopolynomialequations.
Model Assessments
Assessment Example 1:
Findallthezeros(roots)ofthefunctionsbelow.
a) ( ) = − + −3 23 3 9.f x x x x
b) = − − − −4 3 2( ) 2 2 2 3.g x x x x x
c) = − + − + −5 4 3 2( ) 2 2 4 2.h x x x x x x
Model Assessment Answer(s):
a) f(x)are 3, 3.x i= ±
b) g(x)are = − ±1, 3, .x i
c) h(x)arex=2,+i(multiplicityof2),-i(multiplicityof2).
Real World Application Reference:
• EngineeringandDesign• FinanceandBusiness• ManufacturingandProductDevelopment• Marketing,Sales,andService

A C C E S S C u r r i c u l a G u i d e • M a t h e m a t i c s
P r e c a l c u l u s C o m p e t e n c i e s102
Assessment Example 2:
Youhavebeentaskedtodesignaboxforshippinganewproduct.Theboxistobemadefromasinglesheetofcardboardthatis30centimetersby60centimeters.Theboxistobeformedbycuttingoutequalsizesquarepiecesfromeachcornerandfoldingupthesides.Theresultingboxformedhastohaveavolumeof2,400cubiccentimeters.Whatarethedimensionsofthecutoutsectionsofthecardboardtothenearestcentimeter?
Model Assessment Answer(s):
Therearetwosolutionstotheproblem: ( ) ( )( )= − −60 2 30 2V x x x x wherexisthedimensionofasideofthecutoutsquare.
Solution1:1.57cm.
Solution2:12.24cm.
Assessment Example 3:
Youandyour friendshavedecided thatall thecurrentenergydrinkson themarketarelackinginaspecialingredientthatyouhavefoundmakesasignificantdifferenceintermsofperformanceandlackof“crashing”astheeffectswearoff.YouhavedonesomepreliminarymarketinganalysisanddeterminedthatthedemandfunctionD(x),whichrelatesthenumberofcasesconsumerswillpurchaseataspecificpricex,isgivenbythefollowingpolynomial:
= − +2( ) 200 10000D x x x for0 100.x≤ ≤ ThesupplyfunctionS(x)givesthenumberofcasesyoucanmakeifyouaresellingthematapriceofxdollarsandisgivenbythefollowing:
( ) = + + −3 23 500 5000S x x x x for 0 100.x≤ ≤ Thebusinessexpertssaythatyoushouldsetthepriceofyourproductsothatthesupplyequalsdemand,i.e.,S(x)=D(x).
a) Whatpricedoyouhavetochargejusttomakethefirstcase?(HINT:S(x)=0.)
b) Atthatprice,howmanycasesdoyouexpecttosell?
c) Whatpriceshouldyouchargeforthebusinessexpertstobehappy?
Model Assessment Answer(s):
a) $8.39.
b) 8,392cases.
c) $15.46.

M a t h e m a t i c s • A C C E S S C u r r i c u l a G u i d e
P r e c a l c u l u s C o m p e t e n c i e s 103
C O M P E T E N C Y 6
Solve polynomial inequalities.
Prior Knowledge:
• Solvelinearinequalitiesandgraphthesolutionspace.
• Solvepolynomialequations.
Model Assessments
Assessment Example 1:
Solveforx: − + <3 25 6 0.x x x
Model Assessment Answer(s):
( )− + <2 5 6 0,x x x
( )( )− − <3 2 0.x x x
Thiswillbetrueforx <0or2<x<3or ( ) ( ), 0 2, 3−∞ inintervalnotation.
Assessment Example 2:
Solveforx: − − >3 22 3 0.x x x
Model Assessment Answer(s):
( )− − ≥2 2 3 0,x x x
( )( )− + ≥3 1 0.x x x
Thiswillbetruefor − ≤ ≤1 0x andfor ≥ 3x or [ 1, 0] [3, )− ∞ inintervalnotation.
Real World Application Reference:
• BuildingTradesandConstruction

A C C E S S C u r r i c u l a G u i d e • M a t h e m a t i c s
P r e c a l c u l u s C o m p e t e n c i e s104
Assessment Example 3:
Arectangularenclosureforstoringconstructionequipmentmusthaveanareaofatleast3,200squareyards.Ifthereare240yardsoffencingavailable,andthewidthcannotexceedthelength,withinwhatlimitsmustthewidthoftheenclosurelie?
Model Assessment Answer(s):
Thewidthmustbebetween40and60yards,inclusive.

M a t h e m a t i c s • A C C E S S C u r r i c u l a G u i d e
P r e c a l c u l u s C o m p e t e n c i e s 105
C O M P E T E N C Y 7
Solve rational inequalities.
Prior Knowledge:
• Solvelinearinequalities.
• Solverationalequations.
Model Assessments
Assessment Example 1:
Solveforx:+
>+
40.
2xx
Model Assessment Answer(s):
( ) ( ), 4 2, .−∞ − − ∞
Assessment Example 2:
Solveforx: + ≥ −−5 4
2.1x x
Model Assessment Answer(s):
5 42 0
1x x+ + ≥
− simplifies to
( )( )( )
2 1 40.
1
x x
x x
− +≥
−
Criticalnumbersare:½,-4,0,1.
Thesolutionsetis ( ( ( )12, 4 0, 1, .−∞ − ∞
Real World Application Reference:
• FinanceandBusiness• ManufacturingandProduct
Development• Marketing,Sales,andService

A C C E S S C u r r i c u l a G u i d e • M a t h e m a t i c s
P r e c a l c u l u s C o m p e t e n c i e s106
Assessment Example 3:
The set-up cost for manufacturing a roller for a large printer is $2,000. The cost tomanufactureeachroller is$1,050.Writeaformulaforthecost,C(x),asafunctionofthenumberofrollersproduced.Theaveragecostisgivenby ( ) .C x x Ifthecustomeriswillingtopaynomorethan$1,200foreachroller,whatwouldtheminimumorderneedtobe?
Model Assessment Answer(s):
Solution:
C(x)=2000+1050x,
>40
.3
x
However,because theanswermustbeanatural number (thequestion is aboutdiscreteobjects),theminimumorderwouldbe14rollers.

M a t h e m a t i c s • A C C E S S C u r r i c u l a G u i d e
P r e c a l c u l u s C o m p e t e n c i e s 107
C O M P E T E N C Y 8
Find the composition of two or more functions, each containing two or more operations (such as linear, quadratic, rational, cubic, square root, cube root, and trigonometric functions).
Prior Knowledge:
• Evaluatefunctions.
• Identifythedomainandrangeoffunctions.
• Identifyanalgebraicexpressionaseitherafunctionorarelation.
Model Assessments
Assessment Example 1:
a) Letf(x)=4x2+6andg(x)=3x–7.Findf(g(x))andf(f(x)).
b) Let ( ) = 3f x
xand
4( ) .
5x
g xx+
=−
Findf(g(x)).
c) Let 2( ) 4.h x x= − Findtwofunctionsfandgsuchthath(x)=f(g(x)).
Model Assessment Answer(s):
a) 2 2( ( )) (3 7) 4(3 7) 6 36 168 202,f g x f x x x x= − = − + = − +
2 2 2 4 2( ( )) (4 6) 4(4 6) 6 64 192 150.f f x f x x x x= + = + + = + +
b) 4 3( 5) 3 15( ( )) or .
5 4 4x x x
f g x fx x x+ − − = = − + +
c) Letgbethe“inside”function: 2( ) 4.g x x= −
Let f bethe“outside”function: ( ) .f x x=
Real World Application Reference:
• BuildingTradesandConstruction• FashionandInteriorDesign

A C C E S S C u r r i c u l a G u i d e • M a t h e m a t i c s
P r e c a l c u l u s C o m p e t e n c i e s108
Assessment Example 2:
Afloorrefinishingcompanychargespersquarefoottorefinishahardwoodfloor.TheareaofacertainsquarefloorisgivenbyA(s),wheresisthelengthofasideofthefloor.Agallonofvarnishcosts$45andwillcover300squarefeetofhardwoodfloor.
a) ExpressthecostC(A)asafunctionofs.
b) Findthecostofrefinishingaroomwithlength25feet.
Model Assessment Answer(s):
a) TheareaofasquarefloorisA(s)=s2,wheresisthelengthofasideofthefloor.
Thevarnishcosts$45per300squarefeet,so ( ) 45 .300
AC A =
So2
2( ( )) ( ) 45 ( ).300s
C A s C s C s
= = =
b)
= =
225(25) 45 $93.75,
300C
or,assumingthatthecompanychargesbythegallonofvarnishused:
A(25)=252=625.
1625 300 2 ,
12÷ = so3gallonsofvarnishareneeded.
( )45 3 $135.=

M a t h e m a t i c s • A C C E S S C u r r i c u l a G u i d e
P r e c a l c u l u s C o m p e t e n c i e s 109
C O M P E T E N C Y 9
Given a function, determine if an inverse function exists. If so:
• Findtheinverseofthefunctionalgebraicallyandgraphically.
• Identifythedomainandrangeoftheoriginalandinversefunctions.
Prior Knowledge:
• Identifyifarelationisafunction.
• Graphlinear,polynomial,andradicalfunctions.
• Identifythedomainandrangeoffunctionsandrelations.
• Applytransformationstothegraphsoffunctions,includingreflection.
Model Assessments
Assessment Example 1:
Giventhefollowingfunctions,determineiftheinversefunctionexists.Ifso,findtheinversefunctionandidentifythedomainandrangeoftheoriginalandinversefunctions.
a) += +12 4.xy
b) =( ) 3sin2 .g x x
c) −= 11( ) tan .
2h x x
d) = +( ) 2 3.f x x
Sketcheachfunctionanditsinverse:
e)−
=+
5( ) .
2x
f xx
f) ( ) = 4 .xh x
Real World Application Reference:
• Hospitality,Tourism,andRecreation

A C C E S S C u r r i c u l a G u i d e • M a t h e m a t i c s
P r e c a l c u l u s C o m p e t e n c i e s110
Model Assessment Answer(s):
a) For > 4x , ( ) ( )− = − −12log 4 1,f x x
domainof ( ) { }: ,f x x x ∈ rangeof ( ) { }>: 4 ;f x y y
domainof ( ) { }1 : 4 ,f x x x− > rangeof ( ) { }− ∈1 : .f x y y
b) ( )1 11sin ,
2 3x
g x− − =
domainof ( ) : ,4 4
g x x xπ π
− ≤ ≤
rangeof ( ) { }− ≤ ≤: 3 3 ;g x y y
domainof ( ) { }1 : 3 3 ,g x x x− − ≤ ≤ rangeof ( ) π π− − ≤ ≤
1 : .
4 4g x y y
c) ( )1 tan2 ,h x x− =
domainof ( ) { }: ,h x x x ∈ rangeof ( ) π π − < <
: ;
4 4h x y y
domainof ( )1 : ,4 4
h x x xπ π−
− < <
rangeof ( ) { }− ∈1 : .h x y y
d) ( )2
1 3,2x
f x− = −
domainof ( ) { }: 3 ,f x x x ≥ − rangeof ( ) { }≥: 0 ;f x y y
domainof ( ) { }1 : 0 ,f x x x− ≥ rangeof ( ) { }− ≥ −1 : 3 .f x y y

M a t h e m a t i c s • A C C E S S C u r r i c u l a G u i d e
P r e c a l c u l u s C o m p e t e n c i e s 111
e) Graphof −=
+5.
2x
yx
Figure P9-1e
-12 -9 -6 -3 3 6 9 12
-10
-5
5
10
f(x)
f-1(x)
Findtheinverseofthefunction: 5,
2x
yx−
=+
( )1 2 5.
1x
f xx
− +=
−
f) Graphof ( ) 4xh x = and ( )14
loglog .
log4x
h x x− = =
Figure P9-1f
-3 -2 -1 1 2 3 4 5
-6
-4
-2
2
4
6
8
1012
14
16
h(x)
h-1(x)

A C C E S S C u r r i c u l a G u i d e • M a t h e m a t i c s
P r e c a l c u l u s C o m p e t e n c i e s112
Assessment Example 2:
Youhavebeenasked toprovide thegroundbeef for abarbecueat a local festival.Youneedatotalof50poundsoftwotypesofgroundbeefcosting$1.25and$1.60perpound,respectively.AmodelforthetotalcostC(x)ofthetwotypesofbeefis:
C(x)=1.25x+1.60(50–x), ≤ ≤0 50,x
wherexisthenumberofpoundsofthelessexpensivegroundbeef.
a) Findtheinverseofthecostfunction.Whatdoeseachvariablerepresentintheinversefunction?
b) Usethecontextoftheproblemtodeterminethedomainoftheinversefunction.
Model Assessment Answer(s):
a) ( )1 20 1600.
7 7C x x− = − + Inthisfunction,xisthetotalcost.Ifyouknowthetotalcost,you
cancalculatehowmanypoundsofthelessexpensivegroundbeefyouneed.
b) Thedomainoftheinversefunctionwouldbe ≤ ≤62.50 80x (dollars).

M a t h e m a t i c s • A C C E S S C u r r i c u l a G u i d e
P r e c a l c u l u s C o m p e t e n c i e s 113
C O M P E T E N C Y 1 0
Simplify expressions involving exponents. (This is a prerequisite skill that is used in Calculus.)
Prior Knowledge:
• Applythepropertiesofexponents.
• Convertbetweenrationalexponentsandtheircorrespondingradicalforms.
Model Assessments
Assessment Example 1:
Simplify:
a)−
−
3 5 6
5 20 15
5.
a b ca b c
b)
253
447 .32
c)− −
− −
+
−
1 1
2 2.
x yx y
d) + +− −7 5 5 2 9[(3 2) ] (3 2) .m nx x
Model Assessment Answer(s):
a)8
15 21
5.
ab c
b)6
72 .
c) .xy
y x−
d) ( )35 2 343 2 .m nx + +−

A C C E S S C u r r i c u l a G u i d e • M a t h e m a t i c s
P r e c a l c u l u s C o m p e t e n c i e s114
C O M P E T E N C Y 1 1
Expand logarithmic expressions. (This is a prerequisite skill that is used in Calculus.)
Prior Knowledge:
• Applythelawsofexponents.
• Expandsimplelogarithmicexpressionsintoequivalentexpressions.
• Convertexpressionsbetweenrationalexponentsandtheircorrespondingradicalforms.
Model Assessments
Assessment Example 1:
Write the following expression as a sumand/ordifferenceof logarithmsormultiples oflogarithms:
( )( )
+ +
+ +
523
8
2 3 3ln .
2 3 5
x x
x x
Model Assessment Answer(s):
( ) ( ) ( ) ( )+ + + − + − +21 1ln 2 3 5ln 3 ln 2 8ln 3 5 .
3 2x x x x
Assessment Example 2:
Writetheexpressionasasumand/ordifferenceoflogarithmsormultiplesoflogarithms:
23
5log .25x y
Model Assessment Answer(s):
5 52 1 2log log .
3 3 3x y+ −

M a t h e m a t i c s • A C C E S S C u r r i c u l a G u i d e
P r e c a l c u l u s C o m p e t e n c i e s 115
Assessment Example 3:
Writetheexpressionasasumand/ordifferenceoflogarithmsormultiplesoflogarithms:
( ) − 41 2log 1 .x x
Model Assessment Answer(s):
( )1log 4log 1 .
2x x+ −

A C C E S S C u r r i c u l a G u i d e • M a t h e m a t i c s
P r e c a l c u l u s C o m p e t e n c i e s116
C O M P E T E N C Y 1 2
Condense logarithmic expressions. (This is a prerequisite skill that is used in Calculus.)
Prior Knowledge:
• Applythelawsofexponents.
• Expandsimplelogarithmicexpressionsintoequivalentexpressions.
• Convertexpressionsbetweenrationalexponentsandtheircorrespondingradicalforms.
Model Assessments
Assessment Example 1:
Writethefollowingexpressionsasasinglelogarithmicexpression:
a) −
− − +
2 1log 1 log .
1x
xx
b) + + + 3 3ln ln 2 ln 2ln .x y y z
c) − −1
4log 2log 6 log .2b b bx y
Model Assessment Answer(s):
a)1
log .1x
−
b) ( )9 5 4ln .x y z
c)4
log .36
bx
y

M a t h e m a t i c s • A C C E S S C u r r i c u l a G u i d e
P r e c a l c u l u s C o m p e t e n c i e s 117
C O M P E T E N C Y 1 3
Solve multistep exponential equations.
Prior Knowledge:
• Applypropertiesofexponentsinsimplifyingexpressions.
• Applypropertiesoflogarithmsinsimplifyingexpressions.
• Convertbetweenexponentialandlogarithmicformsofanequation.
Model Assessments
Assessment Example 1:
Solvethefollowingexactly: + =2 1 5 .x xe
Model Assessment Answer(s):
( )=
−1
.ln 5 2
x
Assessment Example 2:
At7%interest,compoundedannually,howmanyyearswouldittakeaninitialinvestmentof$6,000toreach$11,802.91?(Roundtothenearestyear.)
Model Assessment Answer(s):
= ≈
11802.91ln6000
10years.ln1.07
x
Real World Application Reference:
• FinanceandBusiness• Marketing,Sales,andService• AgricultureandNaturalResources

A C C E S S C u r r i c u l a G u i d e • M a t h e m a t i c s
P r e c a l c u l u s C o m p e t e n c i e s118
Assessment Example 3:
YouhavebeengivenabonusatworkandyouwanttoinvestitinaCDormoneymarketfund.Youhavetwooptions:amoneymarketfundthatpays7%interest,compoundedmonthly,andaCDthatpays5%,compoundedcontinuously.Inordertoevaluatetheeffectivenessofeachoption,youwanttocomparethedoublingtimeforeach.Calculatethedoublingtimeofeachinvestment(roundtothenearestyear):
a) $14,500at7%interest,compoundedmonthly.
b) $14,500at5%interest,compoundedcontinuously.
Model Assessment Answer(s):
a) = +
120.0729000 14500 1 ,
12
x
= ≈ +
29000ln14500
10years.0.0712ln 1
12
x
b) = 0.0529000 14500 ,xe
= ≈
29000ln14500
14years.0.05
x
Assessment Example 4:
Youareconductingresearchintothedeclineofaverylargeforestedareathatconsistsofabout2.6milliontrees.Somekindofdiseaseisattackingthetreescausingthemtodieattherateof3%peryear.Howmanyyearsfromnowwilltheforesthaveshrunkto1.5milliontrees?
Model Assessment Answer(s):
( )= −1.5 2.6 1 0.03 ,x
( )
= ≈
1.5ln
2.618yearsfromnow.
ln 0.97x

M a t h e m a t i c s • A C C E S S C u r r i c u l a G u i d e
P r e c a l c u l u s C o m p e t e n c i e s 119
C O M P E T E N C Y 1 4
Solve multistep logarithmic equations.
Prior Knowledge:
• Convertexponentialequationstologarithmicequationsandviceversa.
• Applythepropertiesoflogarithmsinsimplifyingexpressionsandequations.
• Applythepropertiesofexponentsinsimplifyingexpressionsandequations.
Model Assessments
Assessment Example 1:
Solve:
a) + + − =2 2log ( 2) log ( 5) 3.x x
b) − + + = +3 3 3log ( 1) log ( 1) log ( 5).x x x
Model Assessment Answer(s):
a) Solution:x=6.
b) Solution:x=3.
Assessment Example 2:
Aspart of a research team investigating the effects of a newdrug,Calpassia, you are
chargedwithcreatingamathematicalmodelthatdescribeshowmuchofthedrugremains
inthebodyatanygiventime.Itisknownthat15%ofCalpassiaismetabolized(usedup)by
thebodyeachhour.Ifadoseof45milligramsisgivenattimet=0,writeanexponential
function thatgives theamount remainingafter thours.Atwhat timewill 12milligrams
remain?Roundyouranswertothenearesthundredth.
Model Assessment Answer(s):
Thegeneralformofthefunctionis ( ) 0 ,ktA t A e= whereA(t)istheamountremainingafter
t hours,A0 is the initial amount,k is thedecay constant, and t is time in hours. For this
particularproblem,thefunctionis ( ) (ln0.85) 0.162545 45 .t tA t e e−= =
At t=8.13hours,12milligramsofCalpassiawillremaininthebody.
Real World Application Reference:
• HealthScienceandMedicalTechnology

A C C E S S C u r r i c u l a G u i d e • M a t h e m a t i c s
P r e c a l c u l u s C o m p e t e n c i e s120
C O M P E T E N C Y 1 5
Sketch the graph of a conic, identifying center, vertices, foci, and asymptotes (if present).
Prior Knowledge:
• Graphlinear,polynomial,andradicalequations.
• Usecompletingthesquaretosolvequadraticequations.
Model Assessments
Assessment Example 1:
Sketchthegraphof4(x +1)2 –9(y –5)2 =36andidentifythevertices,foci,andasymptotes.
Model Assessment Answer(s):
Equationinstandardformis:( ) ( )2 21 5
1,9 4
x y+ −− = hyperbola,centerat(–1,5).
Verticesare:(-4,5)and(2,5);fociare: ( 1 13, 5)− − and ( 1 13, 5);− + asymptotesare:
2 17 2 13, .
3 3 3 3y x y x= + = − +
Figure P15-1
-10 -8 -6 -4 -2 2 4 6 8
-6
-4
-2
2
4
6
8
10
Foci
Vertices
Real World Application Reference:
• EngineeringandDesign

M a t h e m a t i c s • A C C E S S C u r r i c u l a G u i d e
P r e c a l c u l u s C o m p e t e n c i e s 121
Assessment Example 2:
AcometisduetoreturntoEarthspaceinthenearfuture.Youaretaskedwithpresentingadescriptionofthecomet’spath.Thepathofthecometinitsellipticalorbitaroundthesuncanbemodeledbytheequation:9x2 + 16y2=144.
a) Sketchthegraphofthecomet’sorbit.
b) Thesunislocatedatoneofthefocioftheellipse.Identifyoneofthepossiblelocationsofthesunonyourgraph.
Model Assessment Answer(s):
a)
Figure P15-2
-5 -4 -3 -2 -1 1 2 3 4 5
-5
-4
-3
-2
-1
1
2
3
4
5
Foci
b) Thesuncouldbelocatedatoneoftwofoci: ( 7, 0)− or ( 7, 0).

A C C E S S C u r r i c u l a G u i d e • M a t h e m a t i c s
P r e c a l c u l u s C o m p e t e n c i e s122
C O M P E T E N C Y 1 6
Graph trigonometric functions of the form ( ) .y A f Bx C k= + +
• Determinetheamplitudeofasineorcosinefunctionfromitsequation.
• Determinetheperiodofasine,cosine,ortangentfunctionfromitsequation.
• Determinetheverticalshiftofasine,cosine,ortangentfunctionfromitsequation.
• Determinethephaseshiftofasine,cosine,ortangentfunctionfromitsequation.
• Sketchbyhandthegraphofasine,cosine,ortangentfunction.
Prior Knowledge:
• Graphlinear,polynomial,andradicalequations.
• Describegraphsoftransformedfunctionsintermsofthetransformationsappliedtoparentfunctions.
Model Assessments
Assessment Example 1:
Giventheequation ( )3sin 2 4 :y x π= − + −
a) Determine the amplitude, period, vertical shift, and phase shift without using a
calculator;thensketchthegraphbyhandinthecoordinateplane.
b) Nowwritetheequationofthesamegraphintermsofcosineinsteadofsine.
Real World Application Reference:
• EngineeringandDesign

M a t h e m a t i c s • A C C E S S C u r r i c u l a G u i d e
P r e c a l c u l u s C o m p e t e n c i e s 123
Model Assessment Answer(s):
a) Reflectiononx-axis:amplitude=3,period= ,π verticalshift=–4,phaseshift= .2π
−
Figure P16-1
-8
-7
-6
-5
-4
-3
-2
-1
1
2
b) π = − + −
3cos 2 4.2
y x
Assessment Example 2:
TheUSAirForcerecentlylaunchedasatellitetokeeptabsonotherspacecraftandalsoto
keepaneyeonthegrowingproblemoforbitingspacejunk.ThissatelliteisorbitingtheEarth
sothatitsdisplacementDnorthoftheequatorisgivenbytheequation sin( ).D A tω α= +
SketchtwocyclesofDasafunctionoftifA=500km., 3.60ω = rad./hr.and 0.α =
Model Assessment Answer(s):
D=500sin(3.6t).
Figure P16-2
-600-500-400-300-200-100
100200300400500600

A C C E S S C u r r i c u l a G u i d e • M a t h e m a t i c s
P r e c a l c u l u s C o m p e t e n c i e s124
Assessment Example 3:
Graphthefollowingequations,aandb,onseparateaxes.
a)π = −
1sin 2 .
2 4y x
b)π = + −
3 tan 2 .
4y x
Model Assessment Answer(s):
a)
Figure P16-3a
-1
-0.75
-0.5
-0.25
0.25
0.5
0.75
1
b)
Figure P16-3b
-10
-8
-6
-4
-2
2
4
6
8
10

M a t h e m a t i c s • A C C E S S C u r r i c u l a G u i d e
P r e c a l c u l u s C o m p e t e n c i e s 125
C O M P E T E N C Y 1 7
Given the graph of a trigonometric function, write the equation (sine, cosine, tangent).
Prior Knowledge:
• Identifygraphsofperiodicfunctionsasgraphsofsine,cosine,ortangentfunctions.
• Identifytheperiod,amplitude,andfrequencyofsine,cosine,andtangentfunctions.
• Identifytransformationsappliedtoparentfunctions.
Model Assessments
Assessment Example 1:
ThetableshowsthemaximumdailyhightemperaturesforDaytonaBeachformontht,witht=1correspondingtoJanuary.
tDaytona Beach high
temperatures1 64.8
2 68.4
3 75.0
4 81.0
5 87.5
6 91.9
7 93.0
8 92.5
9 89.5
10 82.2
11 73.9
12 66.8
a) Plotthepointsonagraph.
b) Usingthedataandthegraph,findanequationforthehightemperatureatmontht.
c) Mostpeopleplantheirvacationswhenthehightemperaturesarebetween76°and82°.Thetourismindustryneedstobeginmarketingonemonthbeforethisperiod.Duringwhatmonthsshouldtheyimplementtheirmarketingcampaign?
Real World Application Reference:
• Hospitality,Tourism,andRecreation

A C C E S S C u r r i c u l a G u i d e • M a t h e m a t i c s
P r e c a l c u l u s C o m p e t e n c i e s126
Model Assessment Answer(s):
a)
Figure P17-1a
1 2 3 4 5 6 7 8 9 10 11 12
10
20
30
40
50
60
70
80
90
100
Month
Hig
h Te
mpe
ratu
re (o F)
0 0
b) Usingagraphingcalculator,thedataisenteredintolists.Sincethedataisfor12months,thedataisrepeatedinthelistscreatingaperiodof24monthsforanalysis.UsingtheSinRegL1,L2,12,Y1,theresultingequationis:
( ) 14.193sin(0.520 2.065) 80.447T t t= − + for 1 12t≤ ≤ months.
Figure P17-1b
1 2 3 4 5 6 7 8 9 10 11 1250
55
60
65
70
75
80
85
90
95
100
Month
Hig
h Te
mpe
ratu
re (o F)
0
Regression function
76 oF
82 oF
Data points
c) The tourism industry needs to runmarketing campaigns beginning in February andSeptember.

M a t h e m a t i c s • A C C E S S C u r r i c u l a G u i d e
P r e c a l c u l u s C o m p e t e n c i e s 127
Assessment Example 2:
Giventhegraphbelow,writetheequationforthegraphasasinefunctionandasacosinefunction.
Figure P17-2
-8
-7
-6
-5
-4
-3
-2
-1
1
2
Model Assessment Answer(s):
( )π= − + −3sin 2 4,y x
or π = − + −
3cos 2 4.
2y x
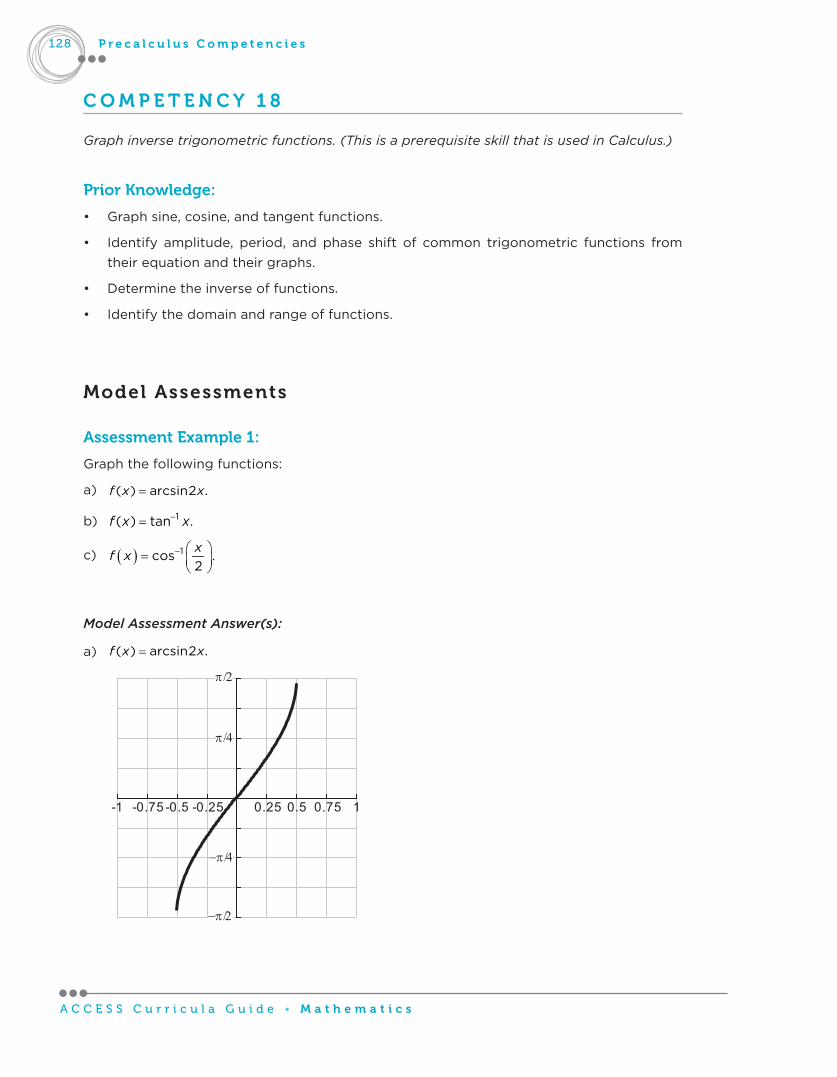
A C C E S S C u r r i c u l a G u i d e • M a t h e m a t i c s
P r e c a l c u l u s C o m p e t e n c i e s128
C O M P E T E N C Y 1 8
Graph inverse trigonometric functions. (This is a prerequisite skill that is used in Calculus.)
Prior Knowledge:
• Graphsine,cosine,andtangentfunctions.
• Identify amplitude, period, andphase shift of common trigonometric functions fromtheirequationandtheirgraphs.
• Determinetheinverseoffunctions.
• Identifythedomainandrangeoffunctions.
Model Assessments
Assessment Example 1:
Graphthefollowingfunctions:
a) =( ) arcsin2 .f x x
b) −= 1( ) tan .f x x
c) ( ) 1cos .2x
f x − =
Model Assessment Answer(s):
a) =( ) arcsin2 .f x x
a) =( ) arcsin2 .f x x
Figure P18-1a
-1 -0.75 -0.5 -0.25 0.25 0.5 0.75 1

M a t h e m a t i c s • A C C E S S C u r r i c u l a G u i d e
P r e c a l c u l u s C o m p e t e n c i e s 129
b) −= 1( ) tan .f x x
Figure P18-1b
-10 -8 -6 -4 -2 2 4 6 8 10
c) ( ) 1arccos cos .2 2x x
f x − = =
Figure P18-1c
-2.5 -2 -1.5 -1 -0.5 0.5 1 1.5 2 2.5

A C C E S S C u r r i c u l a G u i d e • M a t h e m a t i c s
P r e c a l c u l u s C o m p e t e n c i e s130
C O M P E T E N C Y 1 9
Prove trigonometric identities. (This is a prerequisite skill that is used in Calculus.)
Prior Knowledge:• Definebasictrigonometricfunctions.
• Solvetrigonometricequations.
• Applypolynomialfactoringtechniques.
• ApplythePythagoreanTheorem.
Model Assessments
Assessment Example 1:
Showthat:sin(x + y)+sin(x – y)=2sinx cos y.
Model Assessment Answer(s):
sin(x + y)+sin(x – y)=2sinx cos y,
sin x cos y + cos x sin y + sin x cos y – cos x sin y = 2 sin x cos y.
Assessment Example 2:
Showthat:cos
1 sin .sec tan
xx
x x= −
+
Model Assessment Answer(s):
( )( )
= −+
= −+
= −+
= −+
−= −
+
− += −
+
− = −
2
2
cos1 sin ,
sec tan
cos1 sin ,
1 sincos cos
cos1 sin ,
1 sincos
cos1 sin ,
1 sin
1 sin1 sin ,
1 sin
1 sin 1 sin1 sin ,
1 sin
1 sin 1 sin .
xx
x x
xx
xx x
xx
xx
xx
x
xx
x
x xx
x
x x

M a t h e m a t i c s • A C C E S S C u r r i c u l a G u i d e
P r e c a l c u l u s C o m p e t e n c i e s 131
Assessment Example 3:
Showthat:−
=+sin 1 cos
.1 cos sin
x xx x
Model Assessment Answer(s):
−=
+
− −=
+ −
− −=
−
− −=
− −=
2
2
sin 1 cos,
1 cos sin
sin (1 cos ) 1 cos,
(1 cos )(1 cos ) sin
sin (1 cos ) 1 cos,
sin(1 cos )
sin (1 cos ) 1 cos,
sinsin
1 cos 1 cos.
sin sin
x xx x
x x xx x x
x x xxx
x x xxx
x xx x

A C C E S S C u r r i c u l a G u i d e • M a t h e m a t i c s
P r e c a l c u l u s C o m p e t e n c i e s132
C O M P E T E N C Y 2 0
Solve trigonometry equations.
Prior Knowledge:
• Identifythevaluesoftrigonometricfunctionsatstandardpointsaroundtheunitcircle.
• Determinethevaluesofinversetrigonometricfunctionsgivenvaluescorrespondingtostandardpointsontheunitcircle.
• Identifythedomainandrangeoffunctions.
• Identifythedomainandrangeofinversetrigonometricfunctions.
• Identifytheperiodoftrigonometricfunctions.
• Convertbetweenanglemeasuresinradiansanddegrees.
Model Assessments
Assessment Example 1:
a) Solvetheequation =3
cos2 2x
forxontheinterval π≤ <0 2 .x
b) Findallsolutionsfortheequation =3
sin2 .2
x
c) Solvetheequationsinx + sin3x=2sinx cos2 x forxontheinterval π≤ <0 2 .x
Model Assessment Answer(s):
a) π= .
3x
b) Therearetwofamiliesofsolutions:π π= +6
x k and ,3
x kπ π= + wherekisaninteger.
c)5 7 11, , , .
6 6 6 6x
π π π π=
Real World Application Reference:
• Marketing,Sales,andService

M a t h e m a t i c s • A C C E S S C u r r i c u l a G u i d e
P r e c a l c u l u s C o m p e t e n c i e s 133
Assessment Example 2:
Solvethefollowingequations(roundedtotwodecimalplaces,answersindegrees):
a) = ° ≤ < °sin 0.3for0 360 .x x
b) = ° ≤ < °tan 1.5for0 360 .x x
Model Assessment Answer(s):
a) −= ≈ ° °1sin 0.3 17.46 or162.54 .x
b) −= ≈ ° °1tan 1.5 56.31 or236.31 .x
Assessment Example 3:
Asnowboardmanufacturerfindsthatsalesoftheirnewestmodelofsnowboardfollowsaseasonalpattern,withsalesgivenby:
6320 2850cos ,6t
Sπ = +
whereS is thenumberofboards soldduringagivenmonth t, and t = 1corresponds toJanuary.Aslocalstoresdeveloptheirinventory,theyneedtoestimatesalesbymonth.Forwhichmonthsoftheyeararesalesgreaterthan5,000boards?
Model Assessment Answer(s):
Solvetheinequality6320 2850cos 5000.6tπ + >
2850cos 1320,6tπ > −
π > −
cos 0.46316.6t
Findcriticalvalues(i.e.,whenπ = −
cos 0.46316
6t
).
Thesewillbewhen 1cos ( 0.46316),6tπ −= −
orwhenπ
−= −16cos ( 0.46316).t
Thisgivesustwovaluesoft, ≈ 3.9t and ≈ 8.1.t Whentisbetweenthesetwovalues(forexample,whent =6)wegetafalsestatement,sowemustwantthevaluesoftthatfalloutsideoftheinterval(3.9,8.1).Therefore,weknowthatsalesaregreaterthan5,000boardswhen < 3.9t andwhen > 8.1.t
That wouldmean that in themonths of January, February, March, September, October,November,andDecember,saleswillbegreaterthan5,000boards.

A C C E S S C u r r i c u l a G u i d e • M a t h e m a t i c s
P r e c a l c u l u s C o m p e t e n c i e s134
C O M P E T E N C Y 2 1
Solve for all unknown parts of a given triangle:
a) by using right triangle trigonometry
b) by using the Law of Sines
c) by using the Law of Cosines
Prior Knowledge:
• Definesine,cosine,andtangentintermsofthesidesofarighttriangle.
• Solvepolynomialequations.
• UsethePythagoreanTheoremtofindthemissinglengthsofasideofarighttriangle.
• Determinethereferenceanglegivenitssineorcosinevalue.
Model Assessments
Assessment Example 1:
Findthemeasureof∠A ,thelengthofAC,andthelengthofBC.
Figure PC21-1
30°
b
a5
B
CA
Model Assessment Answer(s):
UsingTriangleSum:∠ = °60 .A UsingSpecialTriangles: 5 3; 10.a b= =
Usingtrigonometry:5 5
tan30 ; 8.6603andsin30 ; 10.a ba b
° = ≈ ° = =
Real World Application Reference:
• Hospitality,Tourism,andRecreation• PublicServices

M a t h e m a t i c s • A C C E S S C u r r i c u l a G u i d e
P r e c a l c u l u s C o m p e t e n c i e s 135
Assessment Example 2:
Findthemeasuresofalloftheanglesinthetrianglebelow.
Figure PC21-2
B
1517
28A C
Model Assessment Answer(s):
UsingLawofCosines: 31.00 .A ≈ ° UsingLawofCosinesagain: 121.97 .B ≈ °
UsingTriangleSum: 27.03 .C ≈ °
Assessment Example 3:
Findthemeasureof∠ ∠, C B ,andthelengthofBC.
a
Figure P21-3
21
30 A
B
C 42o
Model Assessment Answer(s):
UsingLawofCosines: 20.12.a ≈ UsingLawofCosinesagain: 93.69 .B ≈ °
UsingTriangleSum: 66.19 .C ≈ °

A C C E S S C u r r i c u l a G u i d e • M a t h e m a t i c s
P r e c a l c u l u s C o m p e t e n c i e s136
Assessment Example 4:
Asearchandrescueteamneedstoestimatetheheightofacliffinordertoplantheirrescueattempt. To estimate the height, two sightingswere taken 50 feet apart. The angles ofelevationwere40degreesand31degrees.Findtheheightofthecliff,h(seefigure).
Model Assessment Answer(s):
UsingTriangleSum:Theanglesoftheobtusetriangleare9°and140°.
UsingLawofSines: 205.45feet.a ≈
UsingRightTriangleTrig.: 105.81feet.h ≈
Figure PC21-4
40°
h
9°
31°
140° a
50 ft.

M a t h e m a t i c s • A C C E S S C u r r i c u l a G u i d e
P r e c a l c u l u s C o m p e t e n c i e s 137
C O M P E T E N C Y 2 2
Convert between polar and rectangular coordinates.
Prior Knowledge:
• Convertbetweenanglemeasuresindegreesandradians.
• UsethePythagoreanTheoremtofindamissingsideofarighttriangle.
• Usetrigonometrytodetermineunknownsidesoranglesinarighttriangle.
• Computethevaluesoftrigonometricfunctionsandinversetrigonometricfunctionsatvariousstandardpoints.
Model Assessments
Assessment Example 1:
ConvertthefollowingCartesian(rectangular)pointstopolarcoordinates ( , ) :r θ
a) ( 3, 3).−
b) ( )2, 2 3 .−
ConvertthefollowingpolarcoordinatestoCartesian(rectangular)coordinates:
c)5
8, .3π
d) ( )4, 30 .− °
Real World Application Reference:
• AgricultureandNaturalResources

A C C E S S C u r r i c u l a G u i d e • M a t h e m a t i c s
P r e c a l c u l u s C o m p e t e n c i e s138
Model Assessment Answer(s):
Figure P22-1
1 2 3 4
1
2
3
4
x
r
y
θ
Givenanoverlapofthepolargridandtherectangulargrid,fourequationsarisetodotheseconversions:
θ
θ θ
+ = =
= =
2 2 2 cos
tan sin
x y r x ry
y rx
Rectangulartopolarcoordinates:
a) (-3,3)wouldbeinQII.Twopossiblepolaranswersfor(-3,3)are
( ) 3, 3 2 , 3 2 , .
4 4r or
π πθ = − −
b) ( )2, 2 3− wouldbeinQIV.Twopossiblepolaranswersfor ( )2, 2 3− are
( ) ( ) ( ), 4, 60 4, 120 .r orθ = − ° − °
Polartorectangularcoordinates:
c) 58, :
3π
( ) ( ), 4, 4 3 .x y = −
d) ( )4, 30 :− ° ( ) ( ), 2 3, 2 .x y = − −

M a t h e m a t i c s • A C C E S S C u r r i c u l a G u i d e
P r e c a l c u l u s C o m p e t e n c i e s 139
Assessment Example 2:
Aforestsurveytechnicianiscompletingasurveyofdiseasedtrees.Heplanstoplotthelocationofallinfectedtreesonarectangulargrid.Standingattheorigin,hetakesabearing(40°EofN)onthenearestinfectedtree.Hemeasuresthedistancefromhislocationtothetreetobe45meters.AtwhatlocationshouldhemarkthetreeinCartesiancoordinatesonhisgrid?
Model Assessment Answer(s):
Figure P22-2
Origin
45 m
40o
N
E
Usingtheangleof50°madewiththex-axis: ( ) ( ), 28.9 m.,34.5m. .x y =
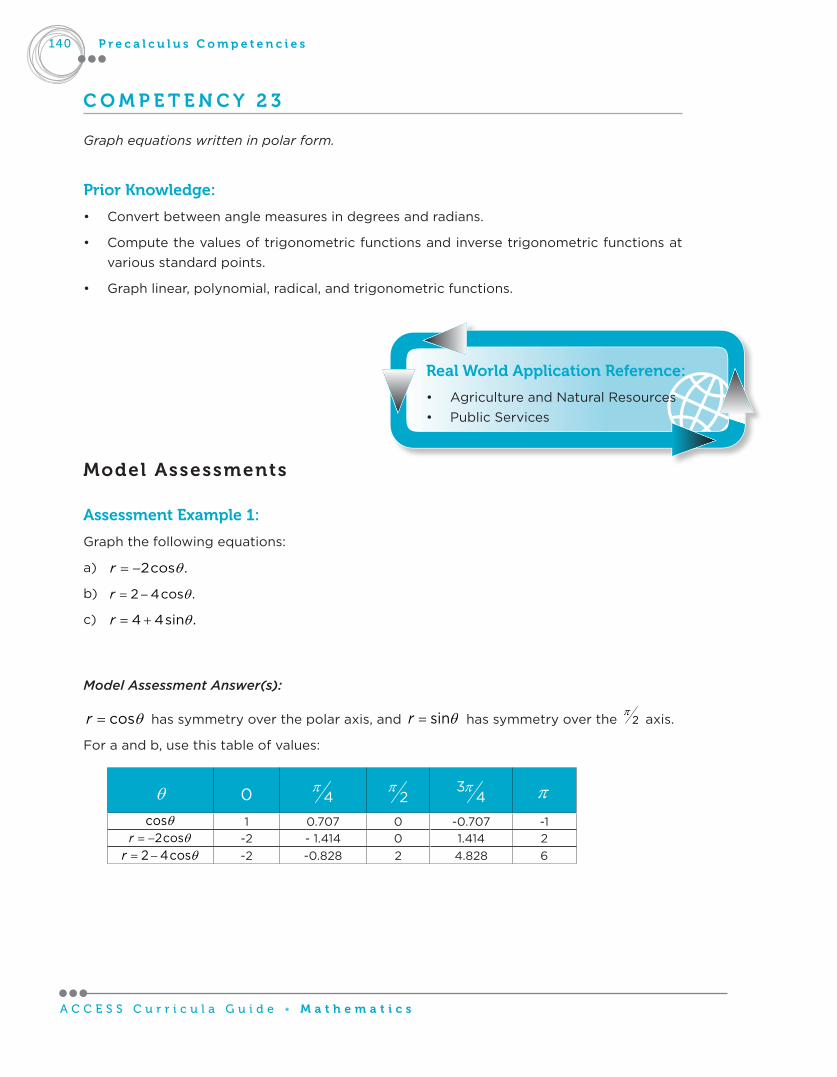
A C C E S S C u r r i c u l a G u i d e • M a t h e m a t i c s
P r e c a l c u l u s C o m p e t e n c i e s140
C O M P E T E N C Y 2 3
Graph equations written in polar form.
Prior Knowledge:
• Convertbetweenanglemeasuresindegreesandradians.
• Computethevaluesoftrigonometricfunctionsandinversetrigonometricfunctionsatvariousstandardpoints.
• Graphlinear,polynomial,radical,andtrigonometricfunctions.
Model Assessments
Assessment Example 1:
Graphthefollowingequations:
a) θ= −2cos .r
b) θ= −2 4cos .r
c) θ= +4 4sin .r
Model Assessment Answer(s):
θ= cosr hassymmetryoverthepolaraxis,and θ= sinr hassymmetryoverthe 2π
axis.
Foraandb,usethistableofvalues:
θ 0 4π
2π
3
4π π
θcos 1 0.707 0 -0.707 -1θ= −2cosr -2 -1.414 0 1.414 2θ= −2 4cosr -2 -0.828 2 4.828 6
Real World Application Reference:
• AgricultureandNaturalResources• PublicServices

M a t h e m a t i c s • A C C E S S C u r r i c u l a G u i d e
P r e c a l c u l u s C o m p e t e n c i e s 141
a)
Figure P23-1a
-3 -2 -1 1 2 3
-3
-2
-1
1
2
3
b)
Figure P23-1b
-7 -6 -5 -4 -3 -2 -1 1 2 3 4 5 6 7
-7-6-5-4-3-2-1
1234567

A C C E S S C u r r i c u l a G u i d e • M a t h e m a t i c s
P r e c a l c u l u s C o m p e t e n c i e s142
Forc,usethistableofvalues:
θ 2π− 4
π− 0 4π
2π
θsin -1 -0.707 0 0.707 1θ= +4 4sinr 0 1.2 4 6.8 8
c)
Figure P23-1c
-8 -7 -6 -5 -4 -3 -2 -1 1 2 3 4 5 6 7 8
-8
-6
-4
-2
2
4
6
8
Assessment Example 2:
Afireinvestigatorisanalyzingarecentbrushfireinwhichaperpetratorpropelledafieryobjectintoafield.Thepathoftheobjectisgivenbytheequation:
θθ
=+20
( ) ,1 sin
r
whererismeasuredinmeters.Tohelptheinvestigatorlocatethelaunchpoint,graphthepathoftheobjectfor θ π≤ ≤0 .

M a t h e m a t i c s • A C C E S S C u r r i c u l a G u i d e
P r e c a l c u l u s C o m p e t e n c i e s 143
Model Assessment Answer(s):
θ 0 4π
2π 3
4π π
θsin 0 0.707 1 0.707 0
θ=
+20
1 sinr 20 11.7 10 11.7 20
Figure P23-2
-20 -18 -16 -14 -12 -10 -8 -6 -4 -2 2 4 6 8 10 12 14 16 18 20
123456789
101112

A C C E S S C u r r i c u l a G u i d e • M a t h e m a t i c s
P r e c a l c u l u s C o m p e t e n c i e s144
C O M P E T E N C Y 2 4
Graph equations written in parametric form.
Prior Knowledge:
• Graphlinear,polynomial,radical,andtrigonometricfunctions.
• Graphpolarequations.
• Solveproblemsinvolvingcompositionoffunctions.
• Identifygeometricpropertiesofconicsectionsfromtheirquadraticequations.
• Graphconicsectionsincludingtranslations.
• Simplifyequationsusingtrigonometricidentities.
• Evaluatetrigonometricfunctions.
Model Assessments
Assessment Example 1:
Graph;showorientation:
a) = =cos , sin .x t y t
b) = −2 3x t for ≤ <0 10t and = − +5.y t
Model Assessment Answer(s):
a) Pointsareplottedandarrows indicate thedirection inwhich thepointsarebeingsweptout.
Figure P24-1a
-3 -2 -1 1 2 3
-3
-2
-1
1
2
3
Real World Application Reference:
• AgricultureandNaturalResources
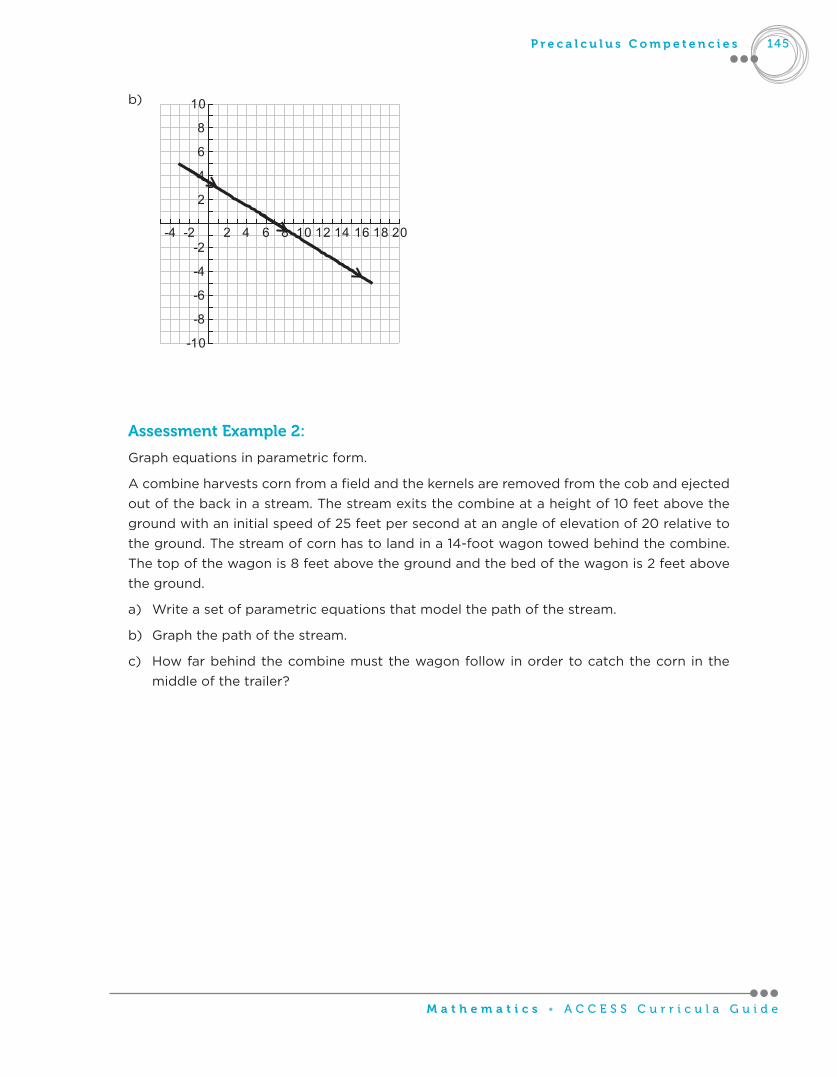
M a t h e m a t i c s • A C C E S S C u r r i c u l a G u i d e
P r e c a l c u l u s C o m p e t e n c i e s 145
b)
Figure P24-1b
-4 -2 2 4 6 8 10 12 14 16 18 20
-10
-8
-6
-4
-2
2
4
6
8
10
Assessment Example 2:
Graphequationsinparametricform.
Acombineharvestscornfromafieldandthekernelsareremovedfromthecobandejectedoutofthebackinastream.Thestreamexitsthecombineataheightof10feetabovethegroundwithaninitialspeedof25feetpersecondatanangleofelevationof20relativetotheground.Thestreamofcornhastolandina14-footwagontowedbehindthecombine.Thetopofthewagonis8feetabovethegroundandthebedofthewagonis2feetabovetheground.
a) Writeasetofparametricequationsthatmodelthepathofthestream.
b) Graphthepathofthestream.
c) Howfarbehindthecombinemustthewagonfollowinordertocatchthecorninthemiddleofthetrailer?

A C C E S S C u r r i c u l a G u i d e • M a t h e m a t i c s
P r e c a l c u l u s C o m p e t e n c i e s146
Model Assessment Answer(s):
Thedrawingillustrateswhatisoccurring(notnecessarilydrawntoscale):
Figure P24-2a
0
10 ft20o
V0 = 25 ft/sec
7 ft
d
a) Inthex-direction,ignoringfriction,D=rt.Soxisequaltothespeedinthex-directionmultipliedbytime;x =25cos20°t,measuredinfeet.
In they-direction,wemust take intoconsideration the forceofgravitypullingon the
corn aswell as the speed acting in they direction and the elevation fromwhich the
cornisbeingpropelled.So ( )2125 sin20 10
2y gt t= − + ° + measuredinfeet,wheregisthe
accelerationduetogravity(32.2ft./sec.2).
b)
Figure P24-2b
5 10 15 20 25 30
5
10
15
Distance from combine (ft)
Hei
ght a
bove
the
grou
nd (f
t)
Bed of wagon = 2 ft
0
c) Solvingtheequationinthey-directionfortheheightofthebedofthewagon,thecornwouldhit thebedof the trailer about23.9 feetbehind thecombine.Therefore, thetrailershouldbeabout16.5feetbehindthewagonforthecorntoclearthesidesofthewagonandlandnearthemiddle.

M a t h e m a t i c s • A C C E S S C u r r i c u l a G u i d e
P r e c a l c u l u s C o m p e t e n c i e s 147
C O M P E T E N C Y 2 5
Given the components of a two-dimensional vector, determine the magnitude and direction of the vector.
Prior Knowledge:
• Solveproblemsinvolvingexponentsandsquareroots.
• ApplythePythagoreanTheorem.
• Computeinversetrigonometricfunctions.
Model Assessments
Assessment Example 1:
Findthemagnitudeanddirectionofthefollowingvectors:
7, 7 3− or − +7 7 3i j or ˆ ˆ7 7 3 ,i j− + where ,i j or ˆ ˆ,i j aretheunitvectorsinthexandy
directions,respectively.
Model Assessment Answer(s):
Magnitude:14.
Direction: 60rθ = − ° instandardposition.However,sincethevectorisgoingintheoppositedirection,thedirectionangleinstandardpositionisθ = °120 .
Assessment Example 2:
Let point PbeP=(–2,5)andletpointQbeQ=(3,2).
ExpressPQincomponentform.
Model Assessment Answer(s):
5 3 5, 3 .= − = −PQ i j
Real World Application Reference:
• AgricultureandNaturalResources• Transportation

A C C E S S C u r r i c u l a G u i d e • M a t h e m a t i c s
P r e c a l c u l u s C o m p e t e n c i e s148
Assessment Example 3:
WhatisthemagnitudeanddirectionofthevectorPQabove?
Model Assessment Answer(s):
Magnitude: 34.=PQ
Direction:θ − − = ≈ − °
1 3tan 30.96
5instandardposition.
Assessment Example 4:
Acropduster(smallairplane)istakingoff.Thereisa179-foot-tallgrainstoragesilothatis355feetawayfromthetake-offpoint.Findtheangleofelevationthepilotneedsinordertoclearthesiloby10feet,andwriteanexpressionforthedeparturevector.Howfarhasthecropdustertraveledwhenitisdirectlyabovethesilo?
Model Assessment Answer(s):
Cropdusterpathvector: = +355 189 .v i j
Distancetraveled: 2 2355 189 402.18ft.= + ≈v
Angleofelevation:θ − = ≈ °
1 189tan 28.03 .
355r

M a t h e m a t i c s • A C C E S S C u r r i c u l a G u i d e
P r e c a l c u l u s C o m p e t e n c i e s 149
C O M P E T E N C Y 2 6
Perform the vector operations of addition, subtraction, and scalar multiplication.
Prior Knowledge:
• Usematrixnotation.
• Identifythedimensionsofamatrix.
• Identifythepositionsofeachentryinamatrix.
Model Assessments
Assessment Example 1:
Given: 2, 5 , 3, 7 , 1, 4 ,= − = = − −a b c find:
a) a + b.
b) 2a – 3c.
c) 7c + b – 5a.
Model Assessment Answer(s):
a) 1, 12 .+ =a b
b) 2 3 1, 22 .− = −a c
c) 7 5 6, 46 .+ − = −c b a
Assessment Example 2:
Aplaneflies250milesperhouronacompassheadingorbearingof300degrees.Theairismovingwithawindspeedof50milesperhouronabearingof195degrees.Findtheplane’sresultantvelocity(speedandbearing)byaddingthesetwovelocityvectors.
Real World Application Reference:
• Transportation
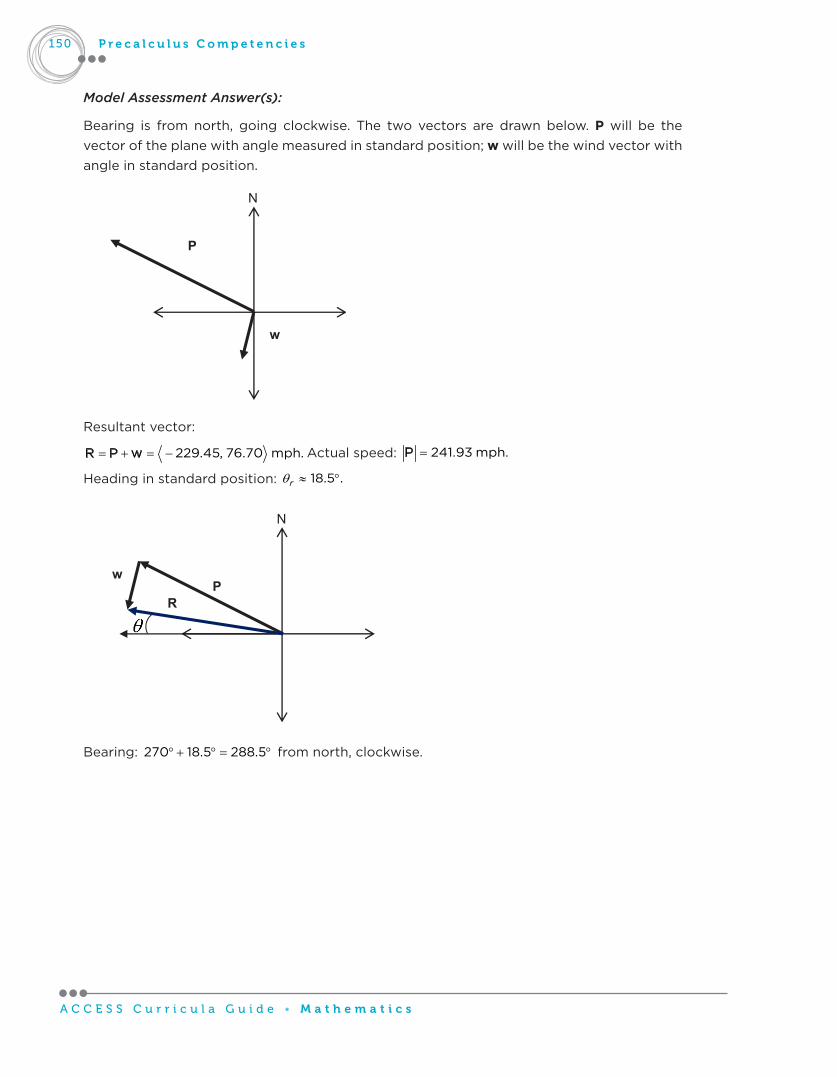
A C C E S S C u r r i c u l a G u i d e • M a t h e m a t i c s
P r e c a l c u l u s C o m p e t e n c i e s150
Model Assessment Answer(s):
Bearing is fromnorth, going clockwise. The twovectors aredrawnbelow.Pwill be thevectoroftheplanewithanglemeasuredinstandardposition;wwillbethewindvectorwithangleinstandardposition.
Figure P26-2
P
w
N
Resultantvector:
229.45, 76.70 mph.= + = −R P w Actualspeed: 241.93 mph.=P
Headinginstandardposition: 18.5 .rθ ≈ °
Figure P26-2(2)
N
R
w P
Bearing: 270 18.5 288.5° + ° = ° fromnorth,clockwise.

M a t h e m a t i c s • A C C E S S C u r r i c u l a G u i d e
P r e c a l c u l u s C o m p e t e n c i e s 151
C O M P E T E N C Y 2 7
Use factorial notation.
Prior Knowledge:
• Usesimplemathematicalconceptssuchasmultiplicationandorderofoperations.
Model Assessments
Assessment Example 1:
Fivefriendswenttothemovies.Inhowmanydifferentarrangementscouldtheybeseatedinarowtogether?
Model Assessment Answer(s):
5!=120differentarrangementsarepossible.
Assessment Example 2:
Thereare100songsonyouriPod.Ifthesongsareshuffledwithnorepeats,inhowmanydifferentorderscouldtheybeplayed?
Model Assessment Answer(s):
100!differentarrangements(thatwouldbeapproximately 1579.333 10 ).
Assessment Example 3:
Aconcertpromoterhas20bandsparticipating in aweekendconcert event.Howmanydifferentordersarepossibleforthebandsduringtheconcert?
Model Assessment Answer(s):
Thereare 1820! 2.43 10≈ differentorderspossible.
Real World Application Reference:
• Arts,Media,andEntertainment

A C C E S S C u r r i c u l a G u i d e • M a t h e m a t i c s
P r e c a l c u l u s C o m p e t e n c i e s152
C O M P E T E N C Y 2 8
Expand binomial expressions. (This is a prerequisite skill that is used in Calculus.)
Prior Knowledge:
• Multiplybinomialsandpolynomials.
• Simplifypolynomialexpressions.
• Applypropertiesofexponents.
• Computecombinations.
Model Assessments
Assessment Example 1:
Expand ( )− 52 .a b
Model Assessment Answer(s):
UsingtheBinomialTheorem,weget:
( )5 5 4 3 2 2 3 4 52 32 80 80 40 10 .a b a a b a b a b ab b− = − + − + −
Assessment Example 2:
Intheexpansionof ( )+ 16 ,x y whatisthetermcontainingx 7?
Model Assessment Answer(s):
11440x 7y 9.
Assessment Example 3:
Simplify ( )+ −4 4x h x
husingtheBinomialTheorem.
Model Assessment Answer(s):
3 2 2 34 6 4 .x x h xh h+ + +

M a t h e m a t i c s • A C C E S S C u r r i c u l a G u i d e
S t a t i s t i c s C o m p e t e n c i e s 153
Statistics(Non-STEM)
Competencies

A C C E S S C u r r i c u l a G u i d e • M a t h e m a t i c s
S t a t i s t i c s C o m p e t e n c i e s154
C O M P E T E N C Y 1
Determine whether a variable is categorical or quantitative, given a situation.
Prior Knowledge:
• Identifythevariableinanexperiment.
• Organize,represent,andinterpretnumericalandcategoricaldata.
Model Assessments
Assessment Example 1:
Asamemberof themathdepartment at the local community college, youneed tomakeapresentationonthedatacollectedaboutthestudentsinthestatisticsclassesattheschool.Inordertoperformanykindofanalysisonthedata,youhavetoidentifywhattypeofdatayouhave;thisdictatesthemethodsofanalysisthatcanbeemployed.Determinewhetherthefollowingvariablesarecategoricalorquantitativeifstudentsinastatisticsclassaretheobservationalunits:
a) howmanyclassesastudenttakes
b) thestudents’eyecolor
c) averageweeklysleeptime
Model Assessment Answer(s):
a) quantitative
b) categorical
c) quantitative
Assessment Example 2:
Astheheadofnursingforthehospital,youhavecollecteddataregardingthenursesandtheirfunctions.Youareanalyzingthisdata,andinordertoperformtheanalysescorrectly,you have to know the types of variables that are represented.Determinewhether eachvariableiscategoricalorquantitativeifnursesinahospitalaretheobservationalunits:
a) thenumberofpatientsunderanurse’scare
b) theamountsofantibioticsadministeredtopatients
c) theyearanursebeganworkingatthehospital
Real World Application Reference:
• Education,ChildDevelopment,andFamilyServices
• HealthScienceandMedicalTechnology• PublicServices

M a t h e m a t i c s • A C C E S S C u r r i c u l a G u i d e
S t a t i s t i c s C o m p e t e n c i e s 155
Model Assessment Answer(s):
a) quantitative
b) quantitative
c) categorical
Assessment Example 3:
Yourcityisseekingareasinthebudgetwherecostscanbereduced.Oneareaidentifiedforpotentialcutsinthebudgetisthefiredepartment.Datahavebeencollectedtoanalyzethispossibility.Inordertodeterminethepropermethodofanalysis,you(astheanalyst)havetoidentifythevariabletypes.Determinewhethereachvariableiscategoricalorquantitativeiffirefightersatafirestationaretheobservationalunits:
a) thenumberoffirestowhichafirefighterhasbeencalled
b) thedaysoftheweekafirefighterreportstoafirestation
c) thestreetnumbersofbuildingstowhichafirefighterhasbeencalled
Model Assessment Answer(s):
a) quantitative
b) categorical
c) categorical

A C C E S S C u r r i c u l a G u i d e • M a t h e m a t i c s
S t a t i s t i c s C o m p e t e n c i e s156
C O M P E T E N C Y 2
Identify the sampling method used (random, systematic, convenience, stratified, cluster, or voluntary response), given a scenario in which data were collected from a population.
Prior Knowledge:
• Readandinterpretpolls.• Interpretsurveysandtheirresults.• Definerandomsamples.
Model Assessments
Assessment Example 1:
Identifywhichtypeofsamplingisused:random,systematic,convenience,stratified,cluster,orvoluntaryresponse:
a) Alocalcollegeconductsastudyonstudentcheatingandplagiarismbyrandomlyselecting30differentclassesandgivingallofthestudentsineachofthoseclassesasurveyformtocomplete.
b) Atelevisionstationwantstosolicititsviewers’opiniononthecurrentstateoftheeconomybyaskingthemtogotoitsWebsitetocompleteasurvey.
c) Amarketingexecutiveforatelevisionnetworkisplanningtosurvey1,500ofitsyoungviewers.The1,500viewerswillberandomlyselectedfromeachagegroupof8–12,13–17,and18–22.
Model Assessment Answer(s):
a) cluster
b) voluntaryresponse
c) stratified
Real World Application Reference:
• HealthScienceandMedicalTechnology• Marketing,Sales,andService

M a t h e m a t i c s • A C C E S S C u r r i c u l a G u i d e
S t a t i s t i c s C o m p e t e n c i e s 157
Assessment Example 2:
Identifywhichtypeofsamplingisused:random,systematic,convenience,stratified,cluster,orvoluntaryresponse:
a) Acellphoneproviderconductsacustomersatisfactionsurveyandusesacomputertorandomlygenerate1,000telephonenumberstocall.
b) Amilitarybasesetsupasobrietycheckpointinwhichevery10thdriverisstoppedandinterviewed.
c) Astatisticsstudentconductsresearchontheamountoftimepeoplespendtextingperdaybypollingherfamily,friends,andclassmates.
Model Assessment Answer(s):
a) random
b) systematic
c) convenience
Assessment Example 3:
Identifywhichtypeofsamplingisused:random,systematic,convenience,stratified,cluster,orvoluntaryresponse:
a) Auniversitymedicalcenterresearchersurveysallcancerpatientsineachof25randomlyselectedhospitals.
b) A radio station conducts a popularity survey and asks its listeners to call in statingwhethertheyareonTeamXorTeamY.
Model Assessment Answer(s):
a) cluster
b) voluntaryresponse

A C C E S S C u r r i c u l a G u i d e • M a t h e m a t i c s
S t a t i s t i c s C o m p e t e n c i e s158
C O M P E T E N C Y 3
Identify the basic terminology of experimental design used in a given scenario.
Prior Knowledge:
• Identifythedifferentmethodsofsamplingdata.• Identifythevariablethatismeasuredinanexperiment.
Model Assessments
Assessment Example 1:
Asvideogamingbecomesmorepopular, researchers are interested in the effectof lowlightingoneyesight.Onesuchresearchgroupconductsanexperimentonlabratsinwhichextendedexposuretolowlightingwillbeadministered.Fiftywhitelabratsareavailablefortesting.Researchersnumbertheratsfrom01to50andusearandomdigittabletoselect25rats.These25willreceivethetreatment;theremaining25willbethecontrolgroup.Resultswillbecomparedattheendoftheexperiment.Whichexperimentaldesigndidtheresearchersuse?
Model Assessment Answer(s):
completelyrandomizeddesign
Assessment Example 2:
Amanufacturerofgolfclubsfieldtestsanewproduct.Thecompanywouldliketoadvertisethatusingthisproductwillincreasetheeffectivenessofagolfer’sswing,butmustobtainsuchresultsfirst.Onehundredvolunteersareavailabletotestthenewproduct.Aresearcherdecidestohaveeachvolunteertryacoursetwice,oncewiththenewproductandoncewithout.Theorderinwhicheachgolferreceivesthetreatmentisdecidedrandomly.Whichexperimentaldesigndoestheresearcheruse?
Model Assessment Answer(s):
matched-pairsdesign
Real World Application Reference:
• AgricultureandNaturalResources• Arts,Media,andEntertainment• HealthScienceandMedicalTechnology• ManufacturingandProductDevelopment

M a t h e m a t i c s • A C C E S S C u r r i c u l a G u i d e
S t a t i s t i c s C o m p e t e n c i e s 159
Assessment Example 3:
Anewpesticideistobetestedonalargesampleofgreenbeans.Frompastexperience,researchers have reason to believe that a new hybrid type of green bean might reactdifferentlytopesticidesthanthetraditionalgreenbean.Therefore,allplantsofthehybridtypeofgreenbeanaregrowntogether inoneplotof land;theregularplantsaregrowntogetherinaseparateplot.Thepesticideisappliedtohalfofeachplot;theotherhalf isleftpesticide-free(forcontrolpurposes).Afterafewweeks,resultsarecompared.Whichexperimentaldesigndidtheresearchersuse?
Model Assessment Answer(s):
blockdesign

A C C E S S C u r r i c u l a G u i d e • M a t h e m a t i c s
S t a t i s t i c s C o m p e t e n c i e s160
C O M P E T E N C Y 4
Identify biases in experimental designs or in the creation of a sample.
Prior Knowledge:
• Identifythedifferentmethodsofsampling.• Recognizethetypeofexperimentaldesignemployedinagivensituation.• Identifythevariablethatismeasuredintheexperiment.• Identifydatathatrepresentsamplingerrors.• Explainwhyasamplemightbebiased.
Model Assessments
Assessment Example 1:
In order to determinewhether regular exercise reduces the risk of a heart attack, twomethodsareemployed.Whichdesignwillproducemoreaccuratedataandwhy?
Design 1:Aresearcherfinds2,000middle-agedmenwhoexerciseregularlyandhavenothadheartattacks.Shematcheseachwithasimilarmanwhodoesnotexerciseregularly,andshefollowsbothgroupsfor5years.After5years,shecomparesthenumberofheartattacksinbothgroups.
Design 2:Anotherresearcherfinds4,000middle-agedmenwhohavenothadheartattacksandarewillingtoparticipateinastudy.Sherandomlyassigns2,000ofthementoaregularprogramofsupervisedexercise.Theother2,000continuetheirusualhabits.Theresearcherfollowsbothgroupsfor5years.
Model Assessment Answer(s):
Design2willproducemoreaccuratedatabecause it isadesignedexperimentandcanestablish causal relationships, whereas Design 1 is an observational study and can beaffectedbyotherfactors.
Real World Application Reference:
• HealthScienceandMedicalTechnology• Marketing,Sales,andService• PublicServices

M a t h e m a t i c s • A C C E S S C u r r i c u l a G u i d e
S t a t i s t i c s C o m p e t e n c i e s 161
Assessment Example 2:
Aquestionnairewassentto10,000peopleaskingabouticecream.Fivethousandpeopleresponded to thequestionnaire.Three thousandof the respondents indicated that they“lovechocolateicecream.”Itisconcludedthat60%ofpeoplelovechocolateicecream.Inthissituation,whatiswrongwiththesurveymethodandconclusion?
Model Assessment Answer(s):
Thisisavoluntaryresponsesample.Thesurveyisbasedonvoluntary,self-selectedresponsesand,therefore,haspotentialforbias. Inaddition,the5,000peoplewhodidnotrespondmaynotlikechocolateicecream.
Assessment Example 3:
Aresearcherwishedtogaugepublicopiniononguncontrol.Herandomlyselected1,000people fromamong registeredvotersandasked them the followingquestion: “DoyoubelievethatguncontrollawsthatrestricttheabilityofAmericanstoprotecttheirfamiliesshouldbeeliminated?”Identifyhowtheresearcher’smethodscouldbeimproved.
Model Assessment Answer(s):
Thereisresponsebiasbecausethequestionleadsrespondentstoanswerinacertainway.Amoreneutralwaytophrasethequestionwouldbe:“Doyoubelievethatguncontrollawsshouldbestrengthened,weakened,orleftintheircurrentform?”

A C C E S S C u r r i c u l a G u i d e • M a t h e m a t i c s
S t a t i s t i c s C o m p e t e n c i e s162
C O M P E T E N C Y 5
Determine an appropriate experimental design for a given scenario.
Prior Knowledge:
• Determinewhetheravariableiscategoricalorquantitative.• Identifydifferentmethodsofsampling.• Identifythebasicterminologyofexperimentaldesign.
Model Assessments
Assessment Example 1:
Asvideogamingbecomesmorepopular, researchers are interested in the effectof lowlightingoneyesight.Onesuchresearchgroupconductsanexperimentonlabratsinwhichextendedexposuretolowlightingwillbeadministered.Fiftywhitelabratsareavailablefortesting.Determinetheappropriateexperimentaldesignforthisscenario.
Model Assessment Answer(s):
Researchersshoulduseacompletelyrandomizeddesign.Numbertheratsfrom01to50andusearandomdigittabletoselect25rats.These25willreceivethetreatment;theremaining25willbethecontrolgroup.Resultsshouldbecomparedattheendoftheexperiment.
Assessment Example 2:
Amanufacturerofgolfclubs isfield-testinganewproduct.Thecompanywould liketoadvertisethatusingthisproductwillincreasetheeffectivenessofagolfer’sswing,butmustobtainsuch resultsfirst.Onehundredvolunteersareavailable to test thenewproduct.Determinetheappropriateexperimentaldesignforthisscenario.
Model Assessment Answer(s):
Researchersshoulduseamatched-pairsdesignatadrivingrange.Haveeachvolunteerhit10golfballswithhis/herownequipmentand10golfballswiththenewproduct,measuringtheball’sdistanceforeachhit.Theorderinwhicheachgolferreceivesthetreatmentshouldbedecided randomly.Thispairingallows researchers tocollectdataon theproduct’seffectiveness.
Real World Application Reference:
• AgricultureandNaturalResources• Arts,Media,andEntertainment• HealthScienceandMedicalTechnology• ManufacturingandProductDevelopment

M a t h e m a t i c s • A C C E S S C u r r i c u l a G u i d e
S t a t i s t i c s C o m p e t e n c i e s 163
Assessment Example 3:
Anewpesticideistobetestedonalargesampleofgreenbeans.Frompastexperience,researchers have reason to believe that a new hybrid type of green bean might reactdifferently to pesticides than the traditional green bean. Determine the appropriateexperimentaldesign.
Model Assessment Answer(s):
Since therehasbeenacharacteristic identifiedaheadof time that isexpected toaffectresults,researchersshoulduseablockdesign.Therefore,alltheplantsofthehybridtypeofgreenbeanshouldbegrowntogetherinoneplotoflandandtheregularplantsgrowntogetherinaseparateplot.Thepesticideshouldbeappliedtohalfofeachplot;theotherhalfshouldbeleftpesticide-free(forcontrolpurposes).Afterafewweeks,resultsshouldbecompared.

A C C E S S C u r r i c u l a G u i d e • M a t h e m a t i c s
S t a t i s t i c s C o m p e t e n c i e s164
C O M P E T E N C Y 6
Construct and describe an appropriate visual display given a data set (histogram, bar graph, stem plot, scatter plot, box and whisker plot, and pie chart).
Prior Knowledge:
• Calculatemeanandmedian.• Calculatepercentage.• Graphpointsonacoordinateplane.
Model Assessments
Assessment Example 1:
Thenumberofyearsofteachingexperienceofteachersatalocalhighschoolislistedbelow. Constructanappropriatevisualdisplayofthedata:
0,3,8,14,26,0,4,9,17,23,4,9,1,18,21,2,21,7,32,9.
Model Assessment Answer(s):
Oneofthefollowingwouldbeappropriate:
a) boxandwhiskerplot
Figure S6-1a
Years
Real World Application Reference:
• Education,ChildDevelopment,andFamilyServices
• Marketing,Sales,andService

M a t h e m a t i c s • A C C E S S C u r r i c u l a G u i d e
S t a t i s t i c s C o m p e t e n c i e s 165
b) histogram
Number of years of experience
Frequency
0–5 7
6–11 5
12–17 2
18–23 4
24–29 1
30–35 1
Teaching experience at local high school
Figure S6-1b
0
1
2
3
4
5
6
7
8
Number of years of teaching experience
Freq
uenc
y
5.5 11.5 17.5 23.5 29.5 34.5

A C C E S S C u r r i c u l a G u i d e • M a t h e m a t i c s
S t a t i s t i c s C o m p e t e n c i e s166
Assessment Example 2:
Suppose200seniorsatthelocalhighschoolhaveafter-schooljobs.Thetypeofjobsandrespectivenumberofstudentswhoholdthemaredetailedbelow.Constructanappropriatevisualdisplayofthedata.
retail,65
food,72
manuallabor,8
healthandhumanservices,38
business/office,5
other,12
Model Assessment Answer(s):
Oneofthefollowingwouldbeappropriate:
a) bargraph
Jobs held by seniors at the local high school
0
10
20
30
40
50
60
70
80
Retail Food Manuallabor
Health andhuman
services
Business/office Other
Num
ber o
f stu
dent
s
Jobs held by seniors at the local high school

M a t h e m a t i c s • A C C E S S C u r r i c u l a G u i d e
S t a t i s t i c s C o m p e t e n c i e s 167
b) piechart
Jobs held by seniors at the local high school
Assessment Example 3:
Datahasbeengatheredatabookstoreformanyyears.Analystswanttostudyhowanauthor’spopularityhaschangedovertheyears.Belowisatablethatprovidesdataofinterest.Createagraphtoshowtheauthor’spopularityovertime.
Number of years since author’s debut book
Number of fans at author’s book signing
0 3981 2842 1893 1524 1025 776 527 398 259 1810 10911 1312 7
Retail32.5%
Food36%
Manuallabor4%
Health andhuman
services19%
Business/office2.5%
Other6%
Jobs held by seniors at the local high school
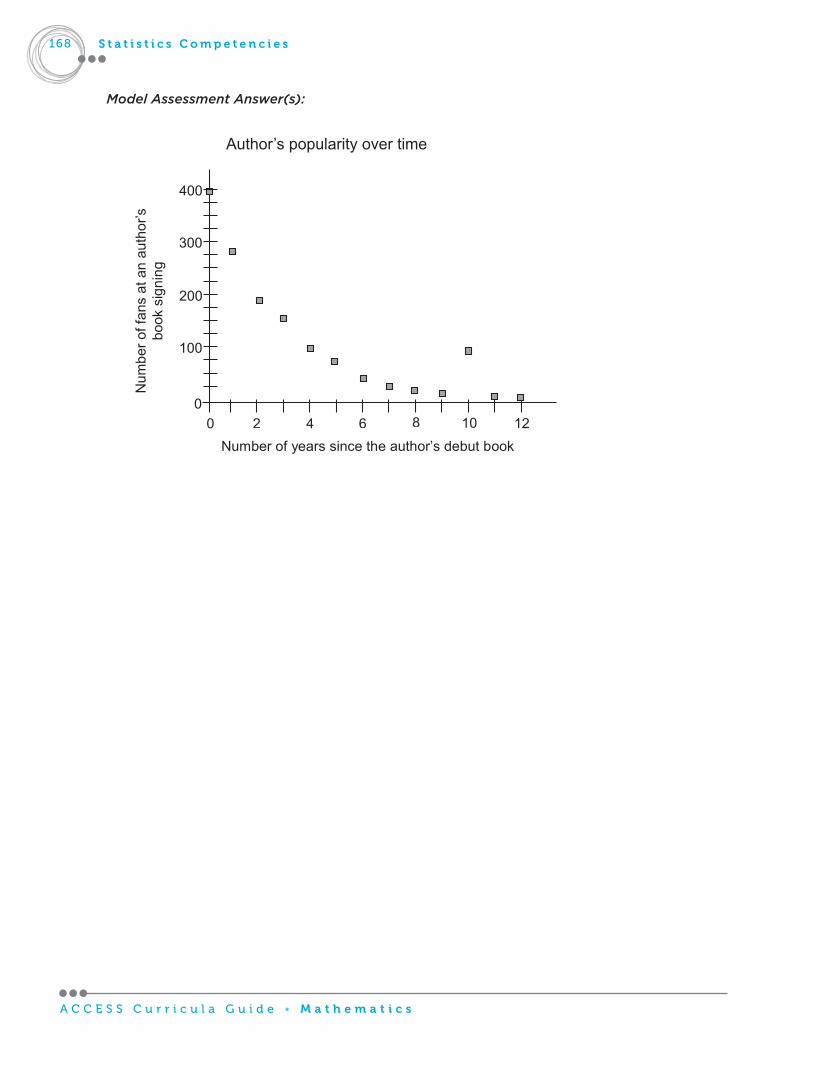
A C C E S S C u r r i c u l a G u i d e • M a t h e m a t i c s
S t a t i s t i c s C o m p e t e n c i e s168
Model Assessment Answer(s):
Author’s popularity over time
Figure S6-3
0
100
200
300
400
2 0 6 4 8 12 10 Number of years since the author’s debut book
Num
ber o
f fan
s at
an
auth
or’s
bo
ok s
igni
ng

M a t h e m a t i c s • A C C E S S C u r r i c u l a G u i d e
S t a t i s t i c s C o m p e t e n c i e s 169
C O M P E T E N C Y 7
Identify which measure of the center (mean, median, or mode) is most appropriate for a given situation and what the relationship between the mean, median, and mode indicates about the distribution of the data.
Prior Knowledge:
• Calculatethemean,median,andmodeofadataset.• Identifytheshapeofdifferentdatadistributionsfromtheirgraph(i.e.,histogram,
curve,scatterplot,etc.).
Model Assessments
Assessment Example 1:
Thecoachofalittleleagueteamissuspiciousoftheagesofhisrivalteambasedontheplayers’heights.Thecoachobtainstherosteroftheopposingteamandfindsthesereportedheights(roundedtothenearestinch):
50,69,50,55,50,54,49,47,50,49,70,56,58,50,57,50.
a) Whichmeasureofcentersupportsthecoach’ssuspicion?Explainandsupportyourreasoningwithnumericalproof.
b) Whichmeasure(s)ofcenterdefend(s)theopposingteam’slegitimacyoftheirplayers’agesbasedontheirheights?Explainyourreasoningwithnumericalevidence.
Model Assessment Answer(s):
a) mean=54.0inches,median=50.0inches,mode=50inches
Themeansupportsthecoach’ssuspicion.Themeanisanonresistantmeasureofcenterandisbeingpulledafull4incheshigherthanboththemedianandmode.Thisresultsfrom twounusually tall kids; thedistributionofheights is skewed right,orpositivelyskewed. Four inches in height difference could make an impact on players’ speed,strength,andathleticability.
Real World Application Reference:
• Education,ChildDevelopment,andFamilyServices
• ManufacturingandProductDevelopment• PublicServices

A C C E S S C u r r i c u l a G u i d e • M a t h e m a t i c s
S t a t i s t i c s C o m p e t e n c i e s170
b) mean=54.0inches,median=50.0inches,mode=50inches
Boththemedianandthemodehelpdefendtheopposingteam’splayers.
Themeanheightisfairlyhigh,butthemediandemonstratesamoretypicalheight.Thefactthatthemedian is50.0 inches—afull4 inchesshorterthanthemean—showsthatthetypicalplayerontheteamisaboutthatheight. Inaddition,thefactthatthemodealsois50inchesemphasizestheheightoftheteamasnotbeingunusuallytall.Moreplayers on the team are 50 inches tall than any other height. Since themostfrequentlyoccurring(6players)heightis50inches,therewouldbelittledifferenceinspeed,strength,orathleticabilityinthesechildrenbasedonheight.
Assessment Example 2:
Adistrictattorneyisrunningforre-electioninyourcity.Hiscampaignstrategyistofocusonhis“toughoncrime”approachbyprovidingdataabouttheamountoftimetheconvictsheprosecutedhavespentinjail.Jailtimesfromlastyear’scourtcaseswere(inmonths):
4,18,7,2,0.5,12,3,6,6,6,9,6,10,84,6,1,2,8,6,8.
Whichmeasureofcentershouldthedistrictattorneychoosetohelphis“toughoncrime”appearancethemost?Supportyouranswerwithnumericalevidence.
Model Assessment Answer(s):
mean=10.23months,median=6.00months,mode=6months
Themeanwouldgive theappearance thatcriminalsprosecutedby thisattorney receivelongerjailsentences.Themeanisanonresistantmeasureofcenter,andis,therefore,pulledhigherthanthemedian(themore“typical”jailtime)bythe18-and84-monthsentences.Todemonstratejusthoweasilyinfluencedthemeanis,onemightlookattheaveragejailsentencewiththe84-monthvalueremovedfromthedata. Insodoing, themean isnowapproximately6.34months,whichisquiteadifference!Comparingthemedianandmodewiththemeanvaluealsoindicatesthatthedistributionofthedataisskewedpositively(orskewedright),whichalsoshowstheeffectofthosetwosentencesonthemeanvalue.

M a t h e m a t i c s • A C C E S S C u r r i c u l a G u i d e
S t a t i s t i c s C o m p e t e n c i e s 171
Assessment Example 3:
Acompanythatmanufacturesenergy-savinglightbulbsforlampsguarantees3,000hoursofuseforeachbulb.Everymajorrunofbulbsfromtheprevious6-monthperiodwassampletested,andthebulbfailuresarelistedinthetablebelow:
Date Batch number Number of bulbs tested
Number of bulb failures
1/15 2381 20,000 501/30 2549 20,000 952/15 2711 20,000 552/28 2908 20,000 613/15 3175 20,000 573/30 3318 20,000 554/15 3560 20,000 634/30 3795 20,000 795/15 3953 20,000 555/30 4150 20,000 726/15 4308 20,000 546/30 4511 20,000 57
Considerthenumberofbulbfailures.Calculatethemean,median,andmodeofthenumberoffailuresperrun.Explainwhythemeanissignificantlyhigherthantheothermeasures.Asamanagerofmanufacturing,doesthedatasupportamajoroverhauloftheprocessinordertoreducefailures?
Model Assessment Answer(s):
Themeanis753/12=62.8failures.
Themedianis57.0.
Themodeis55(themostfrequentlyoccurringnumber).
The mean is significantly higher because of one outstanding run of failures. On 1/30,therewerealmosttwiceasmanyfailuresasthepreviousrun.Therewerealsotwootherrunswithhighnumbersoffailures,whichoccurredon4/30and5/30.Itseemsthattheproblemsoccurinthesecondhalfofthemonth(in5outof6months).Amajoroverhauldoesnotseemwarranted,yetthereshouldbesomeinvestigationintoanyprocessthatseemstogeneratemorefailuresattheendofthemonthwithfrequency.Lookingatthedistributionofthedata,whichisskewedpositively(orskewedright),alsoindicatesthatthereissomethingaffectingthedatafromthesecondhalfofthemonth.

A C C E S S C u r r i c u l a G u i d e • M a t h e m a t i c s
S t a t i s t i c s C o m p e t e n c i e s172
Assessment Example 4:
TheadministrationofalocalhighschooldistrictisconsideringapushtoincreaseenrollmentinAP(AdvancedPlacement)coursesatallschoolsites.TheadministrationisbasingtheirinitiativeonthecurrentaverageAPtestpassingrateoftheirstudents.Theadministratorshireyouasastatisticaladvisortohelpthemmaketherightdecision.Whatwouldyouadvisethemtoconsiderintermsofmeasuresofcenterbeforemakingtheirdecision?
Model Assessment Answer(s):
AdvisetheadministratortolookatthemedianAPtestscoreaswellasthemode.Thesemeasures of center are both resistant to outliers and, therefore, can provide a more“honest”lookatAPtestscoresaroundthedistrict.Forexample,ifthemedianscorewasa1(ona1–5scale)andsomestudentshadscoreda5,themeanwouldbepulledhigherthan1.Thiswouldgiveafalsesenseofachievement.Theeffectofthefew5sonthemeanvaluemaynotbethatgreat,butitissomethingtoconsider.Bylookingatthemode,theadministratorwouldfindthescorereceivedbythemajorityofthestudentstakingthetest.Themodecanberevealingandmightshowthatthereshouldbemoreofapushtoimprovethescoresforthestudentscurrentlyenrolledbeforepushingtoaddmorestudents.Attheveryleast,showingtheadministratorthedifferentmeasuresofcentercanhelphim/hertomakeaneducateddecision.Acomparisonofthemean,median,andmodealsowouldrevealtheshapeofthedistributionofthedata,indicatingwhetherornotasmallgroupofhighscoresmaybeadverselyaffectingtheaverage,givingtheadministratorsafalsepictureofthetrueresults.

M a t h e m a t i c s • A C C E S S C u r r i c u l a G u i d e
S t a t i s t i c s C o m p e t e n c i e s 173
C O M P E T E N C Y 8
Determine standard deviation from multiple representations of data (table, graph, and word problems) and explain standard deviation in the context of a given situation.
Prior Knowledge:
• Calculatethemeanofadataset.• Recognizeandapplysummation
notation.
Model Assessments
Assessment Example 1:
Astudentisconcernedthathercarisnotrunningoptimallyanddecidestocollectsomedata.Shemeasuresthemilespergallonshegetseachmonthfor12months.Belowisthegathereddata.
29,28,29,37,27,30,30,31,31,32,30,28.
Afterdoingsomeresearch,shefindsthatanoptimallyrunningcarhasastandarddeviationof1.6milespergallon.Ishercarrunningoptimallybasedonthestandarddeviation?Whatwouldthestandarddeviationbeifsheremovedtheoutlierinherdataset?Explain.
Model Assessment Answer(s):
Accordingtothedata,thesamplestandarddeviationis2.6mpg.(whichindicateshercarisnotrunningoptimally).However,sheseesthatbyremovingthe37mpg.datapoint,s =1.5,whichcouldchangeherconclusion.Therefore,shedecidestolookmorecloselyatthe37mpg.outlier.
Assessment Example 2:
NorthHighSchoolisinterestedinthespreadofNorthfansfromgametogameforjuniorvarsity(JV)andvarsity(V)football.Theteammanagercountsthenumberoffansfor10at-homegames.Thecountsaregivenasfollows.
JVfans:95,75,42,61,79,87,95,108,109,129;
Varsityfans:215,201,186,175,192,184,199,213,220,232.
Determine if standarddeviation isanappropriatechoiceofmeasurementof spreadandcomparethespreadofthetwodistributionsoffans.Whichteamappearstohavealargerstandarddeviationoffansattendingthegames?
Model Assessment Answer(s):
Ahistogramorboxplotforeachdatasetrevealsthedataisroughlynormal.Oncenormalityisverified,thecalculatedsamplestandarddeviationsares(JV)=25.2ands(V)=18.1.Thevarsityteamhasatighterspreadoffansattendingthegame.
Real World Application Reference:
• Hospitality,Tourism,andRecreation• ManufacturingandProduct
Development

A C C E S S C u r r i c u l a G u i d e • M a t h e m a t i c s
S t a t i s t i c s C o m p e t e n c i e s174
Assessment Example 3:
CompanyA andCompany Bmanufacture tractor brakes. Both companies recorded thehoursofbrakeusageuntilthebrakesfailed.Thedataisasfollows:
A:998,1023,974,911,928,981,974,1108,1064,959;
B:1005,1000,1001,979,1004,1014,1003,966.
Youarethepurchasingagentforyourfarm.WithconsistencyasyourNo.1priority,fromwhich company would you buy brakes for your tractors and why? Demonstrate yourreasoningwithanappropriategraphortable.
Model Assessment Answer(s):
Agraph(suchasaboxplot)canbeconstructedandthestandarddeviationscalculated.Itcanbesuggestedthatthepurchasingagentrecognizethedifferencesinvariation.Thepurchasingagentcouldshowtheresultstoher/hispurchasingteam,butfurthercomparetheresults:
CompanyA’sstandarddeviationis59.7;itsmeanis991.9.
CompanyB’sstandarddeviationis15.7;itsmeanis996.4.
CompanyBshowsmoreconsistencybecauseofitssmallstandarddeviation.
Figure S8-3
900 950 1000 1050 1100 1150
Company B
Company A

M a t h e m a t i c s • A C C E S S C u r r i c u l a G u i d e
S t a t i s t i c s C o m p e t e n c i e s 175
C O M P E T E N C Y 9
Use the normal distribution to solve for the probability of an event or solve for the boundaries for a particular event.
Prior Knowledge:
• Translateprobabilitiestopercentagesandpercentagestoprobabilities.• Solveequationsinvolvingrationalnumbers.
Model Assessments
Assessment Example 1:
Studentslivingawayfromhomeforthefirsttimeoftenfacemanystressesand,therefore,change their dietary and exercise habits. It is reported that freshmen living away fromhomeforthefirsttimeandeatingatypicalcollegedietusuallygainweightwithameanof15poundsandastandarddeviationof10pounds.Assumethechangeinstudentweightisnormallydistributed.
a) Findtheapproximateprobabilitythatagivenstudentwillnotgainweight.
b) Inwhatrangedothemiddle95%ofallweightchangeslie?
c) For 25 randomly selected students, find the probability that the change in studentweightwillhaveameangreaterthan10pounds.
Model Assessment Answer(s):
a) Wewanttofindtheprobabilitythatastudentdoesnotgainweight.
( )1.50 0.0668.P z < − =
6.68%ofalltypicalfreshmancollegestudentsdonotgainweight.
Real World Application Reference:
• AgricultureandNaturalResources• Education,ChildDevelopment,and
FamilyServices

A C C E S S C u r r i c u l a G u i d e • M a t h e m a t i c s
S t a t i s t i c s C o m p e t e n c i e s176
Figure S9-1b
b) Themiddle95%fallwithin2standarddeviationsofthemean,
so 2 15 2 10 5 and35.µ σ± = ± = −
Themiddle95%ofallweightchangesarefromlosing5poundstogaining35pounds.
c) ( ) ( )10 2.50 0.9938.P x P z≥ = ≥ − =
Theprobabilityfor25randomlyselectedstudentstohavemeanweightchangegreaterthan10poundsis99.38%.
Assessment Example 2:
TheStanford-BinetIntelligenceScale(atypeofIQtest)wasoriginallydevelopedtohelpplacestudentsinappropriateeducationalsettings.Scoresarenormallyandapproximatelydistributedwithamean µ = 100 andastandarddeviationσ = 15.
a) WhatpercentofstudentshaveIQscoresabove115?
b) Whatpercenthavescoresbelow93?
c) TheTripleNineSocietyisamembershipassociationofpeoplewhohavescoredatthe99.9thpercentile.WhatscoreontheStanford-Binet IntelligenceScalewouldqualifyapersonformembership?

M a t h e m a t i c s • A C C E S S C u r r i c u l a G u i d e
S t a t i s t i c s C o m p e t e n c i e s 177
Model Assessment Answer(s):
a) ( 115) ( 1.00) 1 0.8413 0.1587,P x P z> = > = − =
so15.87%ofstudentshaveIQscoresabove115.
b) ( 93) ( 0.47) 0.3192,P x P z< = < − =
so31.92%ofstudentshaveIQscoresbelow93.
c) Thez-scorecorrespondingtothe99.9thpercentileis 3.1.z =
Ascoreof146.5(or147)wouldqualifyapersonformembershipintheTripleNineSociety.
Assessment Example 3:
One June day at a large nursery, the temperature was taken at 100 locations. Thetemperaturesarenormallydistributedwithanaveragetemperatureof62degreesandastandarddeviationof2degrees.Whatistheprobabilitythatarandomsite’stemperatureismorethan65degrees?
Model Assessment Answer(s):
p =0.0668.

A C C E S S C u r r i c u l a G u i d e • M a t h e m a t i c s
S t a t i s t i c s C o m p e t e n c i e s178
C O M P E T E N C Y 1 0
Determine the size of a sample space using counting principles, permutations, and combinations.
Prior Knowledge:
• ApplytheFundamentalCountingPrinciple.• Applytheformulasforcombinationsandpermutations.
Model Assessments
Assessment Example 1:
Adaycare currently has three different activities offered in themorning, afternoon, andevening.Achildcanengageinoneactivitypertimeperiod.Becausethefacilityisincreasinginsize,thedirectorhiresadditionalemployeeswhohelpcreateanadditionalfiveactivitiesper time period. The director then wishes to advertise the total number of possiblearrangementsofdailyactivitiesachildcanexperience.Howmanyoptionsdoeseachchildhave,assumingthatthereisnoduplicationofactivities?
Model Assessment Answer(s):
Thereare8 7 6 336= options.
Assessment Example 2:
a) Astatisticsclasshas6nursingmajors,7environmentalsciencemajors,35mathmajors,and1statisticsmajor.Howmanywayscouldadelegationof4studentsbechosen?
b) Ifeachmajorhastoberepresented,howmanywayscouldadelegationbechosen?
Model Assessment Answer(s):
a) 211,876.
b) 1,470.
Assessment Example 3:
Yourolladiethreetimes.Howmanypossibleoutcomescanyouhave?
Model Assessment Answer(s):
216differentoutcomes.
Real World Application Reference:
• Education,ChildDevelopment,andFamilyServices

M a t h e m a t i c s • A C C E S S C u r r i c u l a G u i d e
S t a t i s t i c s C o m p e t e n c i e s 179
C O M P E T E N C Y 1 1
Compute basic probability of independent events and solve problems involving the binomial distribution:
• Determine situations that are Bernoulli trials.
• Calculate the probability of an event (success) and its complementary probability (failure).
• Discern the difference between geometric probability and binomial probability of
Bernoulli trials.
• Apply the formula for binomial probability for x successes in n trials ( ) .x n xn rP x C p q −=
• Use the normal model µ σN( , ), where µ = np and σ = npq to approximate a binomial
probability when the number of trials and desired successes is inordinately large.
Prior Knowledge:
• Applythepropertiesofexponents.• Applytheformulasforcombinationsandpermutations.• Usenotationtorepresenttheprobabilityofanevent.
Model Assessments
Assessment Example 1:
Pop-upadsareanannoyancethatmostInternetsurfershaveencountered.Aninternetadfirmreportsthattheprobabilitythatapersonclicksanadis0.02.Assumethatclicksareindependent.
a) AparticularWebsitewithpop-upadsgets100visitors.Whatistheprobabilitythatnoonewillclickonanad?
b) Whatistheprobabilitythatfivepeoplewillclickonanad?
Real World Application Reference:
• HealthScienceandMedicalTechnology• ManufacturingandProduct
Development• Marketing,Sales,andService
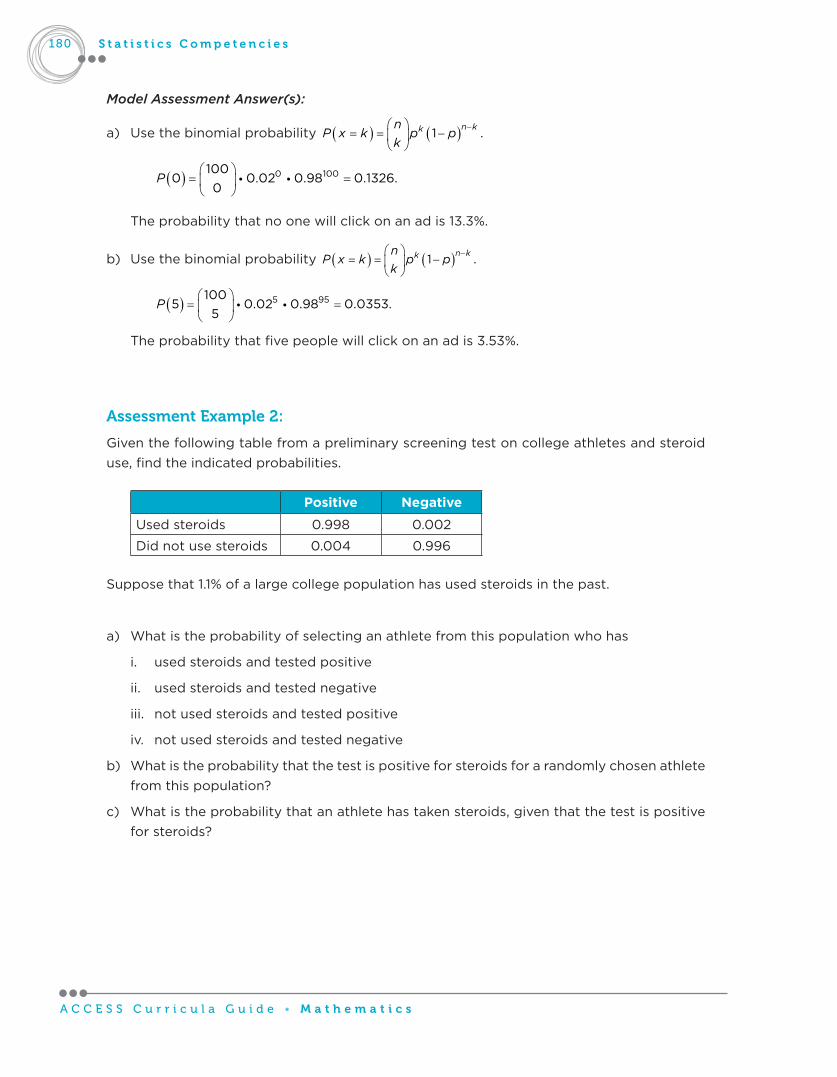
A C C E S S C u r r i c u l a G u i d e • M a t h e m a t i c s
S t a t i s t i c s C o m p e t e n c i e s180
Model Assessment Answer(s):
a) Usethebinomialprobability ( ) ( )1 .n kknP x k p p
k−
= = −
( ) 0 1001000 0.02 0.98 0.1326.
0P
= =
Theprobabilitythatnoonewillclickonanadis13.3%.
b) Usethebinomialprobability ( ) ( )1 .n kknP x k p p
k−
= = −
( ) 5 951005 0.02 0.98 0.0353.
5P
= =
Theprobabilitythatfivepeoplewillclickonanadis3.53%.
Assessment Example 2:
Giventhefollowingtablefromapreliminaryscreeningtestoncollegeathletesandsteroiduse,findtheindicatedprobabilities.
Positive Negative
Usedsteroids 0.998 0.002
Didnotusesteroids 0.004 0.996
Supposethat1.1%ofalargecollegepopulationhasusedsteroidsinthepast.
a) Whatistheprobabilityofselectinganathletefromthispopulationwhohas
i. usedsteroidsandtestedpositive
ii. usedsteroidsandtestednegative
iii. notusedsteroidsandtestedpositive
iv. notusedsteroidsandtestednegative
b) Whatistheprobabilitythatthetestispositiveforsteroidsforarandomlychosenathletefromthispopulation?
c) Whatistheprobabilitythatanathletehastakensteroids,giventhatthetestispositiveforsteroids?

M a t h e m a t i c s • A C C E S S C u r r i c u l a G u i d e
S t a t i s t i c s C o m p e t e n c i e s 181
Model Assessment Answer(s):
a) Theprobabilityofselectinganathletefromthispopulationwhohas:
i. usedsteroidsandtestedpositiveis0.010978
ii. usedsteroidsandtestednegativeis0.00002
iii. notusedsteroidsandtestedpositiveis0.003956
iv. notusedsteroidsandtestednegativeis0.985044
b) P (testedpositive)=P (usedandtestedpositive)+P (didnotuseandtestedpositive)=
(0.011 0.998) (0.989 0.004) 0.010978 0.003956 0.014934.+ = + =
c) P(usedandtestedpositive)
=(usedandtestedpositive)
(testedpositive)P
P
= 0.0109780.014934
=0.74.
Assessment Example 3:
Testsbyanationallaboratoryshowthatthequalityofwidgetsfromalargemanufacturerhasimprovedfrom30%defectivewidgetsin2006to13%in2010.Giventhattheprobabilitythatanyrandomlyselectedwidgetwillbedefectiveis13%,whatistheprobabilitythatasampleof6widgetswillNOTcontainadefectivewidget?
Model Assessment Answer(s):
0.4336,or43.36%.
Assessment Example 4:
a) DetermineifthefollowingsituationsdescribeaBernoullitrial:
i. Pick15cardsfromadeckof52cardswithoutreplacement.Letxbethenumberofblackcardspicked.
ii. Pickacardfromadeckof52,replacethecardandpickanothercard.Repeatthisprocess15times.Letxbethenumberofheartspicked.
b) Inquestion iiabove,determinetheprobabilityofselecting8hearts ifyourepeattheprocess15times.Inthisexample,whateventisconsidereda“success”andwhateventisconsidereda“failure”?Identifythenumberoftrials,theprobabilityofsuccess,andtheprobabilityoffailure.

A C C E S S C u r r i c u l a G u i d e • M a t h e m a t i c s
S t a t i s t i c s C o m p e t e n c i e s182
Model Assessment Answer(s):
a) DotheabovesituationsdescribeaBernoullitrial?
i. In this example there is sampling without replacement, so the selections aredependent.This isnotaBernoulli trial.Note that theprobabilityof thefirstcardbeingblackis0.5,butitkeepschangingwitheachcardthatisselected.
ii. ThisexampleisaBernoullitrialbecausethenumberoftrialsis15,p=0.25,andeachtrialisindependentoftheothers.
b) Asuccessisselectingaheart;afailureisselectinganycardthatisnotaheart,i.e.,clubs,spades,ordiamonds.Thenumberofindependenttrialsis15;theprobabilityofsuccessis0.25andtheprobabilityoffailureis1–0.25,or0.75.
( ) 8 7158 hearts 0.25 0.75 0.0131.
8P
= =
Theprobabilityofselecting8heartsin15trialsis1.31%.
Assessment Example 5:
a) Supposeinagameyourollasingledieuntilyougeta6.Whatistheprobabilitythatittakesfourrollsbeforeyourolla6?
b) Whatistheprobabilitythatyouwillrolla6withinthefirstfourrolls?
c) Supposeinadifferentgameyourollasingledie10timesandcountthenumberoftimesyourolla6.Whatistheprobabilitythatyouwillrollexactly4sixes?
Model Assessment Answer(s):
a) ThefirstquestionisaBernoullitrialwithageometricdistribution.
( )( )4 15 1
4 0.096, or9.6%.6 6
P x−
= = =
b) Theprobabilitythatyouseea6withinthefirstfourrollsis:
0 1 2 35 1 5 1 5 1 5 10.518, or5.2%.
6 6 6 6 6 6 6 6 + + + =
c) ThisexampleisaBernoullitrialwithabinomialdistribution,wheren=10,x=4,
p=16andq = (1–p)=
56.
Solution:0.054,or5.4%.

M a t h e m a t i c s • A C C E S S C u r r i c u l a G u i d e
S t a t i s t i c s C o m p e t e n c i e s 183
Assessment Example 6:
Acompanymanufactures250,000packagesofjellybeanseachweek.Onaverage,3%ofthepackagesdonotsealproperly.Arandomsampleof400packagesisselectedattheendoftheweek.Whatistheprobabilitythatinthissamplebetween8and15packagesarenotproperlysealed?
Model Assessment Answer(s):
ItisappropriatetouseaNormalmodeltoapproximatethebinomialdistributionbecause
thesamplesize(n=400)isverylarge.Inthiscase,p=0.03,q=(1–p)=0.97,np=12,
3.41.npqσ = = Correct for continuity by subtracting0.5 from the lower limit of 8 and
adding0.5totheupperlimitof15.
Solution:0.754,or75.4%.
Assessment Example 7:
Anairlinehasapolicyofbookingasmanyas15peopleonanairplanethatcanseatonly14.Theairlinehasdeterminedthat85%ofthebookedpassengersactuallyarrivefortheflight.Findtheprobabilitythatiftheairlinebooks15passengers,therewon’tbeenoughseats.
Model Assessment Answer(s):
n =15,p =0.85,x =15.
Ifallthebookedpersonsarrive,therewon’tbeenoughseats,thusx =15inthiscase.
p(15)=0.0873,sothereisan8.73%chancethattherewon’tbeenoughseats.
Assessment Example 8:
Adepartmentstorehasexperienceda3.2%rateofcustomercomplaintsandwantstolowerthisratewithanemployeetrainingprogram.Aftertheprogram,850customersaresurveyedand7filedcomplaints.
a) Findthemeanandstandarddeviationforthenumberofcomplaintsin850customers.
b) Is it unusual to have 7 complaints out of 850 customers?Was the trainingprogrameffective?
Model Assessment Answer(s):
a) 850(0.032) 27.2,
850(0.032)(0.968) 5.13.
np
npq
µ
σ
= = =
= = =
b) Theminimumusualvalueis2standarddeviationsbelowthemean:
µ σ− = − =2 27.2 2(5.13) 16.94.
Sincethesevencomplaints is lessthan2standarddeviationsbelowthemean,sevencomplaintsoutof850customersisunusuallylow.Thusthetrainingwaseffective.

A C C E S S C u r r i c u l a G u i d e • M a t h e m a t i c s
S t a t i s t i c s C o m p e t e n c i e s184
C O M P E T E N C Y 1 2
Apply the Central Limit Theorem to sampling distributions.
Prior Knowledge:
• Identifythesamplemeanandthesamplestandarddeviation.• Identifythepopulationmeanandthepopulationstandarddeviation.
Model Assessments
Assessment Example 1:
A bank wants to apply the Central Limit Theorem to estimate the total income fromtheirATMcharges.Theydecidetotakeasimplerandomsample.WhichofthefollowingstatementsaretrueaccordingtotheCentralLimitTheorem?Selectallthatapply.
a) Anincreaseinsamplesizefromn=16ton=25willproduceasamplingdistributionwithasmallerstandarddeviation.
b) Themeanofasamplingdistributionofsamplemeansisequaltothepopulationmeandividedbythesquarerootofthesamplesize.
c) The larger the sample size, the more the sampling distribution of sample meansresemblestheshapeofthepopulation.
d) Themeanofthesamplingdistributionofsamplemeansforsamplesofsizen=15willbethesameasthemeanofthesamplingdistributionforsamplesofsizen =100.
e) The larger the sample size, themore the samplingdistributionof samplemeanswillresembleanormaldistribution.
Model Assessment Answer(s):
a) Thestandarddeviation(SD)ofthesamplingdistributionofsamplemeansisthestandarddeviationofthepopulationSDdividedbythesquarerootofthesamplesize.Sowhensamplesizesincrease,theSDwilldecrease.
d) Themeanofthesamplingdistributionofsamplemeansisthemeanofthepopulation(regardlessofthesamplesize).
e) ThisisbythedefinitionoftheCentralLimitTheorem.
Real World Application Reference:
• FashionandInteriorDesign• FinanceandBusiness• ManufacturingandProductDevelopment• Marketing,Sales,andService

M a t h e m a t i c s • A C C E S S C u r r i c u l a G u i d e
S t a t i s t i c s C o m p e t e n c i e s 185
Assessment Example 2:
Adesignerofexerciseequipmentforwomenneedstoestimatethemeanheightofwomentomanufactureanewpieceofequipment.TheheightofAmericanadultwomenisdistributedalmostexactlyasanormaldistribution,withameanof63.5inchesandastandarddeviationof 2.5 inches. Imagine that all possible random samples of size 25 are taken from thepopulationofAmericanadultwomen’sheights.Themeansfromeachsamplewouldthenbegraphedtoformthesamplingdistributionofsamplemeans.Drawandlabelthesamplingdistribution.Indicatethemeanandstandarddeviation.
Model Assessment Answer(s):
PopulationdistributionofAmericanadultwomen’sheights;meanis63.5inchesandSDis2.5inches.
Figure S12-2(1)
54 56 58 60 62 64 66 68 70 72 74
0.05
0.1
0.15
0.2
Height (inches)
Prob
abilit
y
µ = 63.5
SD = 2.5
Samplingdistributionof samplemeans froma randomsampleof25adultAmericanwomen’sheights;meanis63.5inchesandSDis0.5inches.
Figure S12-2(2)
54 56 58 60 62 64 66 68 70 72 74
0.1
0.2
0.3
0.4
0.5
0.6
0.7
0.8
0.9
Height (inches)
Prob
abilit
y
µ = 63.5
SD = 0.5

A C C E S S C u r r i c u l a G u i d e • M a t h e m a t i c s
S t a t i s t i c s C o m p e t e n c i e s186
Assessment Example 3:
Atalocalretailstore,therehasbeenanincreaseincomplaintsaboutemployees’inattentionto customer service due to the use of electronic devices. The number of personal textmessagesreceivedinthelast3minutesbyemployeeswasthree,two,andfive.Assumethatsamplesofsizetwoarerandomlyselected,withreplacementfromthispopulationofthreevalues.Listthedifferentpossiblesamplesandfindthemeanofeachofthem.Describethemeanandstandarddeviationofsamplingdistributionofsamplemeans.
Model Assessment Answer(s):
Thepossiblesamplesare3-3;3-2;3-5;2-3;2-2;2-5;5-3;5-2;5-5.Theircorrespondingmeansare3,2.5,4,2.5,2,3.5,4,3.5,5,givingadistributionof
Mean Probability2.0 1/9
2.5 2/9
3.0 1/9
3.5 2/9
4.0 2/9
5.0 1/9
withameanof3.33andastandarddeviationof0.88.

M a t h e m a t i c s • A C C E S S C u r r i c u l a G u i d e
S t a t i s t i c s C o m p e t e n c i e s 187
C O M P E T E N C Y 1 3
Estimate population parameters using confidence intervals for means and proportions.
Prior Knowledge:
• Identifythesamplemeanandthesamplestandarddeviation.
• Identifythepopulationmeanandthepopulationstandarddeviation.
Model Assessments
Assessment Example 1:
Aboatmanufacturerhasaproblemwithfiberglasscrackingwhenitsboatsencounterroughwaters.Theytryanewmaterialandtest50boats.Theresultisthat5boatscrack.
a) Whatisthe95%confidenceintervalestimatingthetrueproportionofboatsthatwillcrack?
b) Boatsusingthecurrentmaterialcrack15%ofthetime.Isthisnewmaterialbetter?
Model Assessment Answer(s):
a) (0.01685, 0.18315). We are 95% confident that the interval from 0.01685 to 0.18315containsthetrueproportionofboatsthatwillcrack.
b) No,thenewmaterialisnotbetterbecausethecurrentmaterialcracks15%ofthetime,whichisbetween1.7%and18.3%.
Assessment Example 2:
Toperformaz-confidenceinterval,whatthreesimpleconditionsmustbemet?
Model Assessment Answer(s):
SimpleRandomSample(SRS),normallydistributed,knownpopulationstandarddeviation.
Assessment Example 3:
Forastatisticsprojectatyourhighschool,yourecordthenumberofhoursofsleepthat10randomstudentsgetonagivennight:7.6,6.7,7.5,6.7,7.1,6.5,7.7,6.7,7.5,7.0.
Find the 95% confidence interval formean amounts of sleep the students at your highschoolgetpernight.Interpretthisintervalinthecontextoftheproblem.
Model Assessment Answer(s):
Weare95%confidentthattheintervalbetween6.78and7.42hourscontainsthetrueamountofsleepahighschoolstudentreceives.
Real World Application Reference:
• Hospitality,Tourism,andRecreation• ManufacturingandProduct
Development

A C C E S S C u r r i c u l a G u i d e • M a t h e m a t i c s
S t a t i s t i c s C o m p e t e n c i e s188
C O M P E T E N C Y 1 4
Perform appropriate hypothesis test (state the hypotheses, determine the significance level, check conditions/criteria, calculate the test statistic, determine the p-value, make a decision and interpret it in the context of the problem) for a given situation.
Prior Knowledge:
• Calculateaproportiongivenpercentagesandvalues.• Calculatenormalizedvalues(z-ort-values).• Calculatetheprobabilityofaparticulareventusinganormalizeddistribution.
Model Assessments
Assessment Example 1:
Asoftdrinkcompanycomesoutwithanewflavor.Theygivetheiroriginalsoftdrinktoagroupof23consumersandthenewsoftdrinktoanothergroupof23consumers.Theythenaskeachgrouptoratehowmuchtheylikethesoftdrinkonascaleof1–10.Determinetheappropriatehypothesistest.
Model Assessment Answer(s):
Two-samplet-test.
Real World Application Reference:
• HealthScienceandMedicalTechnology• ManufacturingandProductDevelopment• PublicServices• Transportation

M a t h e m a t i c s • A C C E S S C u r r i c u l a G u i d e
S t a t i s t i c s C o m p e t e n c i e s 189
Assessment Example 2:
Anexperimentwasperformedonthesideeffectsofanewcosmeticsurgeryprocedure.Ofthe445patientswhounderwenttheprocedure,25sufferedan“adversesymptom.”Doesthisexperimentprovidestrongevidencethatfewerthan10%ofpatientswhounderwentthisprocedurehaveadversesymptoms?Performanappropriatetestatthe 0.01α = significancelevel.
Model Assessment Answer(s):
Hypotheses:Wewanttotestaclaimaboutp,thetrueproportionofpatientswhosufferedanadversesymptom.Ourhypothesesare:
H0:p=0.10,
Ha:p<0.10.
Conditions: Weshoulduseaone-proportionz-testiftheconditionsaremet.
• SRS:Weareassumingthata“randomsample”ofpatientsundergoinganewcosmeticsurgeryprocedurewasanalyzed.IfthesamplingdesignwasnotanSRS,ourcalculationsmaynotbeaccurate.
• Normality: Theexpectednumberof“yes”and“no”responsesare(445)(0.10)=44.5and(445)(0.90)=400.5,respectively.Bothareatleast10,sowecanusethez-test.
• Independence: Sincewearesamplingwithoutreplacement,thishospitalmusthaveatleast(10)(445)=4,450patientsundergoingthenewprocedure.
Test-statistic: Theone-proportionz-statisticis
(1 ) 0.0562(0.9488)445
ˆ 0.0562 0.103.02.
p pn
p pz
−
− −= = = −
P-value: ( 3.02) 0.0010.P z ≤ − =
Interpretation: There is a 0.10% chance of obtaining a sample result as unusual as orevenmoreunusual thanwedid ( )=ˆ 0.0562p whenthenullhypothesis is true.Sinceour
p-valueof0.0010islessthan 0.01,α = rejectH0.Wehavesignificantevidencetosaythattheproportionofpatientsundergoingthisnewcosmeticsurgeryprocedurewhosufferanadversesymptomislessthan10%.

A C C E S S C u r r i c u l a G u i d e • M a t h e m a t i c s
S t a t i s t i c s C o m p e t e n c i e s190
Assessment Example 3:
A school newspaper reported on a study of bacteria found on teachers’ keyboards in ahighschool.Atotalof50keyboardsweresampledandanalyzedforbacteria.Thebacterialconcentrationofeachspecimenwasdeterminedusinganinfraredmicroscopicmethod.Thesampleresultedinameanbacteriallevelof84ug/mLandastandarddeviationof80ug/mL.Testthehypothesisthatthetruemeanbacterialevelinteachers’keyboardsfallsbelow100ug/mL.Use 0.01.α =
Model Assessment Answer(s):
Hypotheses: Wewanttotestaclaimaboutthetruepopulationmeanbacterialevelfoundonteachers’keyboards.Ourhypothesesare
0: 100,H µ =
: 100.aH µ <
Conditions:Sincewedonotknowthestandarddeviationofthebacterialevelfoundonallteachers’keyboards,wemustuseaone-samplet-test.
• SRS: Wemustbewillingtotreatour50keyboardsasanSRSfromthepopulationofall teachers’keyboards ifwewant todrawconclusionsabout teachers’keyboards ingeneral.Thisisajudgmentcall.
• Normality: Useofthet-procedureisjustifiedbecausethesamplesizeisreasonablylarge
(n=50)andthusthedistributionof x willbeapproximatelyNormalbytheCentralLimitTheorem.
• Independence:Wearesamplingwithoutreplacementandthepopulationsizeismuchlargerthan 10 50 500.=
Test statistic: Thet-teststatisticis
8084
84 1001.412.
sn
xt
µ− −= = = −
P-value:Althoughthedegreesoffreedomaredf=n–1,sodf=50–1=49,weusethemoreconservativedf=40fromastandardt-table.Fort=–1.412,theuppertailprobabilityisbetween0.10and0.05.Usingthecalculator,p=0.0818.
Interpretation:Sinceourp-value(0.0818)isnotlessthanα = 0.01, wefailtorejectH0.Wedonothavesufficientevidencetosaythatthemeanlevelofbacteriafoundonteachers’keyboardsislessthan100ug/mL.

M a t h e m a t i c s • A C C E S S C u r r i c u l a G u i d e
S t a t i s t i c s C o m p e t e n c i e s 191
Assessment Example 4:
Accordingtoareport,therateoffirearmdeathsper100,000peoplefortheUnitedStateswas10.34.Therateoffirearmdeathsper100,000forKansaswas10.51.Testthehypothesisthattherateoffirearmdeathsper100,000inKansasissignificantlydifferentfromtheratefortheUnitedStates.Useα = 0.05.
Model Assessment Answer(s):
Hypotheses:Wewanttotestaclaimaboutp1,thetrueproportionoffirearmdeathsinKansas,andp2,thetrueproportionoffirearmdeathsintheUnitedStates.Ourhypothesesare
0 1 2: ,H p p= 1 2: .aH p p≠
Test-statistic:Thetwo-proportionz-statisticisz=-0.37.
P-value: p=0.7097.
Interpretation:Thereisa71.0%chanceofobtainingasampleresultasunusualasorevenmoreunusualthanwedid,sowedonothaveenoughevidencetosaythatthefirearmdeathratesaredifferent.
Assessment Example 5:
AlocalmunicipalairportconductedastudyoverseveralyearsofpiloterrorsandthenumberofDWIs(drivingwhileintoxicated).Thefollowingtableshowsthedatacollected.
No DWIs 1 or more DWIsPilotswithno
pilot-erroraccidents 21,588 608
Pilotswithpilot-erroraccidents 199 11
Test the hypothesis that there is no relationship between the number of DWIs and thenumberofpilot-erroraccidents.Useα = 0.05.
Model Assessment Answer(s):
H0:ThereisnoassociationbetweenthenumberofDWIsandthenumberofpilot-erroraccidents.
H1:ThereisanassociationbetweenthenumberofDWIsandthenumberofpilot-erroraccidents.
Test-statistic: 2 4.836.χ =
P-value:p=0.0279.
Interpretation: Thereisa2.79%chanceofobtainingasampleresultasunusualasorevenmoreunusualthanwedid,sowerejectthenullhypothesis.TheevidenceappearstosuggestthatthereisanassociationbetweenthenumberofDWIsandthenumberofpilot-erroraccidents.

A C C E S S C u r r i c u l a G u i d e • M a t h e m a t i c s
S t a t i s t i c s C o m p e t e n c i e s192
Assessment Example 6:
Supposethat fourcoughsyrupsarecompared inanexperiment,withthehoursof relieffromcoughingasthemeasuredvariable.Dothesecoughsyrupshavethesamemeanhoursofrelief?
Cough Syrup A Cough Syrup B Cough Syrup C Cough Syrup D
Hoursofrelief
0.53 9.80 5.79 19.19
0.77 1.90 1.91 7.17
12.99 11.45 1.97 8.96
7.41 4.97 8.73 5.28
8.82 1.76 11.13 17.18
4.40 11.18 13.01 0.20
16.35 9.49 3.86 4.23
- 17.55 8.77 10.85
- 2.34 - 6.73
- 12.99 - 2.49
- 17.86 - 9.06
- - - 9.99
- - - 3.48
Model Assessment Answer(s):
0 1 2 3 4: .H µ µ µ µ= = =
H1:Thepopulationmeansarenotallequal.
Test statistic:F=0.3269.
P-value:p =0.8059.
We fail to reject thenull hypothesis. Themean timeof relief for the four syrupsdonotappeartobestatisticallydifferent.

M a t h e m a t i c s • A C C E S S C u r r i c u l a G u i d e
S t a t i s t i c s C o m p e t e n c i e s 193
C O M P E T E N C Y 1 5
Explain the relationship between parameters and statistics.
Prior Knowledge:
• Usebasicstatisticsterminology.• Calculatethemeanandstandarddeviationforagivendataset.• Identifythepopulationandsampleinagivenscenario.
Model Assessments
Assessment Example 1:
Anovicebusinesspersonhasabusinessideaandisinterestedinobtainingaloan.Afriendwhoworksatabanktellsherthattheaveragebusinessloanrateinthisareais8.25%.Shedoessomeresearchandfindsfivebanksthatgiveanaveragerateof 10.25%.Determinewhichpercentageisaparameterandwhichisastatistic.
Model Assessment Answer(s):
8.25%isaparameterand10.25%isastatistic.
Assessment Example 2:
The public health agency worker has been concerned about the ever-increasing foodcontaminationissuesinhercity.Afterinspecting55,000kilogramsofmeatstoredatalocalsausagecompany,shefoundthat45,000kilogramsofthemeatwasspoiled.Identifythesample,population,statistic,andparameter(ifpresent).
Model Assessment Answer(s):
Thesampleis55,000kilogramsofmeatstoredatthesausagecompany,andthestatisticisthe45,000kilogramsofspoiledmeat.Inthisquestion,thepopulationisconsideredtobeallpossiblemeatproducedinthiscity,andtheparameteristhetotalkilogramsofspoiledmeatfromthecity.
Real World Application Reference:
• FinanceandBusiness• HealthSciencesandMedicalTechnology• Hospitality,Tourism,andRecreation• PublicServices
A C C E S S C u r r i c u l a G u i d e • M a t h e m a t i c s
S t a t i s t i c s C o m p e t e n c i e s194
Assessment Example 3:
Ahealthandfitnessclubmanagersurveys40randomlyselectedmembersregardingtheidealdimensionsofthenewswimmingpool.Hefoundthattheaverageidealdimensionsofthosequestionedtobe100yardsby25yards.Identifythesample,population,statistic,andparameter(ifpresent).
Model Assessment Answer(s):
Thesampleis40randomlyselectedmembersandthestatisticistheaverageidealdimensionsof100yardsby25yards.Thepopulationisconsideredtobeallpossiblemembersofthisclub,andtheparameteristhemeanofallidealdimensionsfromallclubmembers.
Assessment Example 4:
Apollwasdoneforanelectionandarandomselectionof1,000citizenswasaskediftheywereinfavorofanationaluniversalhealthcarebill.Ofthosepolled,175citizensindicatedthat they believed the health care bill was a necessity. Identify the sample, population,statistic,andparameter(ifpresent).
Model Assessment Answer(s):
Thesampleisthe1,000citizensrandomlyselectedandthestatisticistheproportion(0.175)ofcitizensinfavorofthebill.Thepopulationisconsideredtobeallcitizensofthisnation,andtheparameteristheproportionofallthecitizensofthisnationinfavorofthebill.

M a t h e m a t i c s • A C C E S S C u r r i c u l a G u i d e
S t a t i s t i c s C o m p e t e n c i e s 195
C O M P E T E N C Y 1 6
Given a p-value, interpret its meaning in the context of the variables of a problem:
• Define the p-value.• Identify the appropriate null and alternative hypotheses, and use the proper notation of
H0 and Ha .• Interpret a given p-value in the context of a hypothesis testing situation as it relates to
the rejection of or failure to reject H0 .
Prior Knowledge:
• Identifytheprobabilityofaneventusingastandardizednormaldistribution.• Identifytheparameterandstatisticforagivenscenario.• Calculatez-andt-valuesforagivenscenario.
Model Assessments
Assessment Example 1:
AtourismservicewishestodetermineifmorepeoplecontactthemtheweekbeforeNewYear’sDayortheweekbeforeLaborDay.Astudentinterngathersdatafromtheprevious35monthsanddeterminesthesampleaveragenumberofpeoplecontactingthemaweekbeforeeachholiday.Theythenrunatwo-samplet-testusingthesampleaverages.Theyobtainap-valueof0.1325.Whatcanbeconcluded?
Model Assessment Answer(s):
ThereisnostatisticaldifferencebetweentheaveragenumberofpeoplewhocontactthetourismservicetheweekbeforeNewYear’sDayandtheweekbeforeLaborDay.
Real World Application Reference:
• FashionandInteriorDesign• HealthScienceandMedicalTechnology• Hospitality,Tourism,andRecreation

A C C E S S C u r r i c u l a G u i d e • M a t h e m a t i c s
S t a t i s t i c s C o m p e t e n c i e s196
Assessment Example 2:
A fashionmerchandiser wants to know if increasing the price on theirmost purchaseddress increasedthetotalsales.Theyrandomlychoose30storesandperformamatchedpaircomparison,comparingtheaveragetotalsalesofdressesbeforeandafterthepriceincrease.Theyobtainap-valueof.003556.Whatcanbeconcluded?
Model Assessment Answer(s):
The fashion merchandiser should increase the price in all of her/his stores. There is astatisticallysignificantincreaseintheaveragetotalsalesofdressesafterthepriceincrease.
Assessment Example 3:
AnewdrugisbeingtestedbytheFDAthatreducesthedurationofmigrainestolessthan2hours.Thisobservationhasap-value=0.032.Interpretthemeaningofthep-valueinthecontextoftheproblem.
Model Assessment Answer(s):
Thep-value=0.032 indicates that thenewdrug, indeed, has an effecton reducing thedurationofmigrainestolessthan2hours.Thereisastatisticallysignificantreductioninthedurationofmigraines.

M a t h e m a t i c s • A C C E S S C u r r i c u l a G u i d e
S t a t i s t i c s C o m p e t e n c i e s 197
C O M P E T E N C Y 1 7
Find and apply the equation of the regression line when linear regression is appropriate:
• Determine when linear regression is appropriate for a set of bivariate data. • Find the linear correlation coefficient r and the coefficient of determination r 2.• Use the regression line to make appropriate predictions.• Interpret r, r 2, and slope in the context of a given situation.
Prior Knowledge:
• Graphlinearequations.• Findtheslopeandy-interceptofaline.
Model Assessments
Assessment Example 1:
Yourfriendrecentlybecamethenewmanagerofapizzarestaurant.Hewantstodetermineifthecurrentpricesforcheesepizzasareconsistentwiththeirsize.Pricesforcheesepizzaareshowninthetablebelow.
Size Diameter (inches) CostPersonal 6.5 $4.69
Small 9.5 $9.00
Medium 12.0 $13.25
Large 14.0 $15.99
ExtraLarge 15.0 $20.25
a) Makeascatterplotofthesedata.
b) Explainhowyouwoulddetermineifthereisalinearrelationshipbetweenthediameterandcost.
Real World Application Reference:
• Education,ChildDevelopment,andFamilyServices
• EnergyandUtilities• FinanceandBusiness• HealthScienceandMedicalTechnology• InformationTechnology

A C C E S S C u r r i c u l a G u i d e • M a t h e m a t i c s
S t a t i s t i c s C o m p e t e n c i e s198
Model Assessment Answer(s):
a) scatterplot
Figure S17-1a
0
5
10
15
20
25
4 6 8 10 12 14 16 18 20
Cos
t (do
llars
)
Diameter (inches)
b) Thereisacurveintheresidualplot,soalinearrelationshipisnotappropriate.Apowermodelwouldbebetter.Accordingtothenewpowermodel −= 0.697 1.684ˆ (10) ( ) ,y x thepredictedcostof thefivedifferent sizesofpizzaare$4.70,$8.91, $13.20,$17.12, and$19.22.Itappearsthataslightadjustmentinthechargesforlargeandextralargepizzasmightbewarranted.
Assessment Example 2:
Typically,thetemperatureinPhoenix,AZ,ishighinJuly.ThetemperatureismoremoderateinJanuary.PlannersatthePhoenixElectricCompanywouldliketouseJanuary’saveragetemperaturestopredictJuly’saveragetemperature.ThefollowingtableshowstheaveragetemperaturesinFahrenheitforJanuaryandJulyinPhoenixfrom2001to2009(dataavailableatwww.noaa.gov).
YearJanuary temperatures in degrees Fahrenheit
July temperatures in degrees Fahrenheit
2001 54.1 94.4
2002 56.0 96.0
2003 62.0 97.7
2004 57.5 94.5
2005 57.8 97.3
2006 57.7 96.5
2007 52.9 95.8
2008 54.7 94.9
2009 58.7 98.3

M a t h e m a t i c s • A C C E S S C u r r i c u l a G u i d e
S t a t i s t i c s C o m p e t e n c i e s 199
a) Createascatterplotwith the January temperatures on the x-axis and the July temperaturesonthey-axis.
b) Findtheequationoftheleast-squaresregressionline.
c) WhatisthecorrelationbetweenJulyweatherandJanuaryweather?
Model Assessment Answer(s):
a) scatterplot
Figure S17-2a
94.0
94.5
95.0
95.5
96.0
96.5
97.0
97.5
98.0
98.5
52 54 56 58 60 62 64
July
tem
pera
ture
s (d
egre
es F
)
January temperatures (degrees F)
b) = +ˆ 76.159 0.352 .y xc) r=0.685.(NOTE:Thecorrelationisstatisticallysignificantat 0.05,α = butitisnotat
0.01.α = .)
Assessment Example 3:
Thewinningtimes(inseconds)inthemen’s100-meterdashintheOlympicsfrom1972to2008aregiveninthefollowingtable:
Year Athlete Country Winning times in seconds1972 ValeryBorzov URS 10.14
1976 HaselyCrawford TRI 10.06
1980 AllanWells GBR 10.25
1984 CarlLewis USA 9.99
1988 CarlLewis USA 9.92
1992 LinfordChristie GBR 9.96
1996 DonovanBailey CAN 9.84
2000 MauriceGreene USA 9.87
2004 JustinGatlin USA 9.85
2008 UsainBolt JAM 9.69

A C C E S S C u r r i c u l a G u i d e • M a t h e m a t i c s
S t a t i s t i c s C o m p e t e n c i e s200
a) Makeascatterplotofthedatawherex representsthenumberofyearssince1972andyrepresentsthewinningtimes.
b) Findtheequationfortheleastsquareslineforthisdata.
c) Interprettheslopeincontextofthequestion.
d) Howcanyoudetermineiftheleastsquareslineisanappropriatemodelforthedata?
Model Assessment Answer(s):
a) scatterplot
Figure S17-3a
9.6
9.7
9.8
9.9
10.0
10.1
10.2
10.3
0 10 20 30 40
Win
ning
tim
es in
sec
onds
Years since 1972
b) = −ˆ 10.1705 0.0119 .y x
c) Foreachincreaseofoneyear,theOlympicrecorddecreasesby0.0119seconds.
d) Aresidualplotrevealsarandomscatteringofpoints.Theresidualsvaryfrom–0.06to0.17,soaleastsquareslineisanappropriatemodel.

M a t h e m a t i c s • A C C E S S C u r r i c u l a G u i d e
S t a t i s t i c s C o m p e t e n c i e s 201
Assessment Example 4:
Sincebonestructurevariesinsizefrompersontoperson,researchershaveaddedframesizeasafactorinhelpingtodetermineaperson’sidealweight.Knowingone’sframesizecanhelpapersonsetreasonableweightgoals.
The students in a statistics class measured their wrist circumference and height incentimeters.Thefollowingdatawerefound.
NameWrist circumference
(in cm.) Height (in cm.)Karen 15.0 163
Chris 17.0 191
Colleen 15.5 168
Cayley 15.5 173
Ethan 16.0 183
Alex 16.5 175
Krizza 14.5 156
Julia 16.0 172
Carrie 17.5 176
Gissel 17.0 163
Natalie 15.5 162
Jeff 17.0 188
Ms.Statsky 14.0 168
a) Makeascatterplotofthedata.Doestherelationshipappeartobeapproximatelylinear?
b) Determinetheequationoftheleastsquaresregressionline.
c) Computetheresidualsandmakeaplotoftheresidualsagainstx.Describethepatterndisplayedbytheresiduals.
d) What is r 2? Interpret this value in context.What does this value indicate about thesuccessofthelinearregressioninpredictingastudent’sheight?

A C C E S S C u r r i c u l a G u i d e • M a t h e m a t i c s
S t a t i s t i c s C o m p e t e n c i e s202
Model Assessment Answer(s):
a) scatterplot
Figure S17-4a
150155160165170175180185190195200
12.0 14.0 16.0 18.0 20.0
Hei
ght
(cm
)
Wrist circumference (cm)
Yes,itlooksapproximatelylinear.
b) ˆ 76.89 6.05 .y x= +
c) scatterplot
Figure S17-4c
-20
-15
-10
-5
0
5
10
15
20
12 13 14 15 16 17 18
x
Res
idua
ls
Theyarescatteredabouttheliney=0,withsomepointsfarfromthisline.Thereisnodistinctpattern.

M a t h e m a t i c s • A C C E S S C u r r i c u l a G u i d e
S t a t i s t i c s C o m p e t e n c i e s 203
Residuals-3.573
12.335
-1.596
3.404
10.381
-0.642
-7.55
-0.619
-5.688
-15.66
-7.596
9.335
7.473
Assessment Example 5:
Twentystudentsarerandomlyselectedfromacollegestatisticsclassof80students.Theirmostrecenthomeworkandexamscoresarecompared.
Homework scores (points out of 10 possible points)
Exam scores (points out of 100 possible points)
10.0 79.0
7.5 79.0
9.5 91.0
9.0 78.5
8.0 75.5
9.0 64.5
10.0 75.0
8.0 80.0
8.5 85.5
7.5 68.0
10.0 89.0
10.0 73.5
8.5 55.0
9.0 76.0
6.5 81.0
10.0 85.5
8.0 71.5
9.5 64.0
9.0 78.0
8.5 89.5
d) r 2=0.3735,so37.35%ofthevariationinheightisexplainedbytheleastsquaresregressionlineof height onwrist circumference. This value isnotverygood; fromthetablewecanseethatthis regression linewasoffby 15.7centimetersforonestudent.

A C C E S S C u r r i c u l a G u i d e • M a t h e m a t i c s
S t a t i s t i c s C o m p e t e n c i e s204
a) Identifytheexplanatoryandresponsevariables.
b) Createascatterplotandfindtheequationfortheleastsquaresline.
c) State the slopeof the least squares regression lineand interpret themeaningof theslopeintermsofthepredictedresponsevariableandtheexplanatoryvariable.
d) Ifastudentscoresa7onhomework,whatisthepredictedexamscoreforthatstudent?
Model Assessment Answer(s):
a) Theexplanatoryvariableishomeworkscoresandtheresponsevariableisexamscores.
b) scatterplot
Figure S17-5b
50
55
60
65
70
75
80
85
90
95
5 6 7 8 9 10 11
Exam
sco
res
(poi
nts)
Homework scores (points)
Predictedexamscore 66.73 1.16 homeworkscore.= +
c) Theslopeis1.1615,anditcanbeinterpretedinthefollowingway:Forevery1pointgaininhomeworkscore,thepredictedexamscoreis1.1615pointshigheronaverage.
d) Thepredictedexamscoreis77.0.Sincer=0.127,thelinearcorrelationisnotstatisticallysignificant.Hence,thebestpredictedexamscoreistheaverageexamscore,76.95.
Assessment Example 6:
Solarpanelsimproveenergyefficiency.Iftheybecomedirty,efficiencycandropby10–15%.Hamatwantstoseeifthereisarelationshipbetweenthenumberoftimeshecleanshissolarpanelseachyearandthetotalpoweroutput.Afterperforminga linearregressiononthedata,heobtainsacorrelationcoefficientof0.345.Interpretthissolutioninthecontextofthesituation.
Model Assessment Answer(s):
Thervalueislow,suggestingthatthereisaweaklinearrelationshipbetweenthenumberoftimeshecleanshissolarpanelseachyearandthetotalpoweroutput.

M a t h e m a t i c s • A C C E S S C u r r i c u l a G u i d e
S t a t i s t i c s C o m p e t e n c i e s 205
Assessment Example 7:
Thedirectorofaqualitydepartmentinanetworkcommunicationscompanywantstoknowhowmanybugseachpersonfixesperday.Hisnetworkdoesnotinformhimofthenumberofbugseachpersonfixes,butratherthetotalnumberofbugsfixedperdayofallemployees.However,hedoeshaveahistoryofdataandisabletoplotthetotalnumberofbugsfixedperdayfordifferenttotalnumbersofemployees.Thegraphhasaslopeof1.32,acorrelationcoefficientof0.9,andacoefficientofdeterminationof0.81.Interpreteachofthesenumbers.
Model Assessment Answer(s):
Foreachadditionalemployee,1.32morebugsarefixedonaverageperday.Theveryhighrvaluesuggeststhattherelationshipisstronglylinear.Ther 2valuestatesthat81%ofthevariabilityinthebugsfixedperdaycanbeexplainedbythenumberofemployees.
Assessment Example 8:
Listedbelowarethebudgets(inmillionsofdollars)andthegrossreceipts(inmillionsofdollars)forrandomlyselectedmovies.
Budget 62 90 50 35 200 100 90
Gross receipts 65 64 48 57 601 146 47
a) Makeascatterplotofthisdata.
b) Istherealinearrelationshipbetweenbudgetandgrossreceipts?
Model Assessment Answer(s):
a) scatterplot
Figure S17-8a
0
100
200
300
400
500
600
700
0 50 100 150 200
Gro
ss re
ceip
ts
(milli
ons
of d
olla
rs)
Budget (millions of dollars)
b) Eventhoughthecorrelationcoefficientisr=0.926,whichisindicativeofastronglinearrelationship,theplotoftheresiduals isnotrandom.This indicatesthatthere isnotalinearrelationshipbetweenbudgetandgrossreceipts.Eventhoughthereisnotalinearrelationship,thereissomeotherkindofrelationship(exponential,quadratic,orother)asshownbythedata.

A C C E S S C u r r i c u l a G u i d e • M a t h e m a t i c s
206
This pag
e
left
blank
inte
ntional
ly.

M a t h e m a t i c s • A C C E S S C u r r i c u l a G u i d e
A c k n o w l e d g e m e n t s / C o n t r i b u t o r s 207
A C K N O W L E D G E M E N T S / C O N T R I B U T O R S
Math faculty from 13 Cal-PASS Professional Learning Councils collaborated toward the common
goal of aligning curricula from high school through transfer-level coursework in postsecondary
education in the mathematics subject areas of Algebra II/Intermediate Algebra, Precalculus, and
(non-STEM) Statistics. The 13 Cal-PASS math Professional Learning Councils that participated in
the ACCESS initiative were from the following regions:
Contra CostaEast San Diego County
Los AngelesMerced
North BayNorth Coast
Placer-NevadaSan Francisco
San MateoSanta Barbara
Siskiyou CountyWest Fresno Region
West San Bernardino County
Several Cal-PASS Professional Learning Councils began this type of alignment work in their
local regions prior to the ACCESS Initiative, and their experience helped Cal-PASS develop a model
for aligning exit and entrance competencies for sequential coursework. This initiative is unique in
that it brought together a collaboration of high school and postsecondary faculty from around the
state to discuss curriculum and build a clearly articulated curricula guide chronicling what students
are expected to know upon completing one course and to be prepared for subsequent courses. The
names of Cal-PASS Professional Learning Council faculty participants who graciously volunteered
their time and expertise for this project are listed on the following pages.
The ACCESS initiative was made possible through partnerships between Cal-PASS and The
William and Flora Hewlett Foundation, The James Irvine Foundation, The Evelyn and Walter Haas
Jr. Fund, and The Girard Foundation. This far-reaching project could not have come to fruition
without the keen vision and generous funding of these partners.

A C C E S S C u r r i c u l a G u i d e • M a t h e m a t i c s
A c k n o w l e d g e m e n t s / C o n t r i b u t o r s208
The coordination and management of this statewide endeavor was the accomplishment
of Eden Dahlstrom, ACCESS project director, who traveled around the state over a 2-year
period to meet with the Cal-PASS Professional Learning Councils and keep the project
relevant and on track. She also headed up the summer workshops, where faculty from
around the state came together to specify competencies and assessments. Cal-PASS
leaders Michelle Kalina and Shelly Valdez also traveled to Cal-PASS Professional Learning
Council meetings and offered collegial guidance and assistance to keep this project
energized and relevant.
After hundreds of pages of math assessments and equations were compiled, the guide
was handed over to math instructors Debbie Hill and Kentaro Iwasaki to handle the initial
editing process. Following several rounds of edits, Cal-PASS’s Katheryn Horton stepped up
to oversee the editing process. Math instructor Michael Orr took over the reins as content
editor and created most graphs and figures. Finally, the math team of Michael Orr, Tina
Shinsato, and Diane Murillo edited and honed the content into its final form. Throughout
the editing process, freelance copyeditor Cindi Patton (www.thefinaledit.com) handled
copyediting and formatting as well as production and print manangement. Patton Brothers
Illustration & Design, Inc., (www.pattonbros.com) created the design. Math instructors
Michelle McGinity, Sherry Wallin, Vanson Nguyen, and Gary Remiker also contributed to the
editing and proofing of this guide.
For more information, please contact Dr. Shelly Valdez, EdD, at [email protected].

M a t h e m a t i c s • A C C E S S C u r r i c u l a G u i d e
A c k n o w l e d g e m e n t s / C o n t r i b u t o r s 209
Math Faculty Participants
Name: Region:
Adam, Brianna Santa Barbara
Ahlgren, Joyce San Bernardino - West
Althaus-Cressman, Alana Siskiyou
Ambrozich, Jo Anna San Bernardino - West
Ashlock, James Santa Barbara
Asp, Steve San Mateo
Bader, Sandy Sonoma (North Bay)
Ballinger, Brad North Coast
Barbour, Renee Los Angeles
Barelka, Bridget San Diego - East
Barron, Maile Placer–Nevada
Beemer, Beverly San Bernardino - West
Biesecker, Luke North Coast
Birrell, Jameson Fresno - West
Boyd, Linda Los Angeles
Bridge, Jan San Bernardino - West
Brown, Anna Sonoma (North Bay)
Brubaker, Donny San Bernardino - West
Bruketta, Sandy Contra Costa
Calhoun, Bernadette Sonoma (North Bay)
Cavagnaro, Deann San Mateo
Chamberlain, Paula San Bernardino - West
Chao, Jack Placer–Nevada
Chen, Eileen Contra Costa
Cherrington, April San Mateo
Clark, Julie Merced
Cole, Wayne Santa Barbara
Collins, Bei San Bernardino - West
Conard, Roger San Bernardino - West
Connich, Brian Sonoma (North Bay)
Conway, Teri Santa Barbara
Coppin, Cheryl Siskiyou

A C C E S S C u r r i c u l a G u i d e • M a t h e m a t i c s
A c k n o w l e d g e m e n t s / C o n t r i b u t o r s210
Name: Region:
Creech, Teresa North Coast
Crosby, Bauea Contra Costa
Cubillo, Judy Contra Costa
Davis, Lloyd San Mateo
De La Rosa, Angelica Los Angeles
De Palma, Rose Merced
De Primo, Guy San Francisco
De Torre-Ozeki, Jeanne San Mateo
Delcroix, Stefaan Fresno - West
Derksen, Jared San Bernardino - West
Derochers, Debbie Siskiyou
DiJay, Carol San Bernardino - West
Dirksen, Jenn San Mateo
Drake, Lisa San Diego - East
Easton, Paula San Bernardino - West
Eramya, Heddy San Bernardino - West
Fauble, Patty Placer–Nevada
Ferrel, Galen Siskiyou
Francis, Steve Los Angeles
Frenken, Kathryn San Bernardino - West
Fuentes, Iyara Merced
Fuste, Beth Santa Barbara
Garcia, Cathy Placer–Nevada
Gazarian, Kaspar Los Angeles
Gentile, Scott San Francisco
Gipson, AnnMaree Fresno - West
Goodrich-Jones, Mariah Siskiyou
Griffith, Leah Los Angeles
Grybinas, Dalia San Mateo
Guenther, Pamela Santa Barbara
Hampton, Joel San Bernardino - West
Hapeman, Natlee Santa Barbara
Harvey, Derril San Bernardino - West

M a t h e m a t i c s • A C C E S S C u r r i c u l a G u i d e
211A c k n o w l e d g e m e n t s / C o n t r i b u t o r s
Name: Region:
Hasson, Daniel San Mateo
Hayden, Davis Santa Barbara
Hays, Christine Fresno - West
Heinrich, Paul Los Angeles
Heitz, Judi San Diego - East
Helterbran, Stacey Sonoma (North Bay)
Hemphill, Vickie Los Angeles
Hill, Debbie Placer–Nevada
Hoffman, Michael San Mateo
Holmes, Jim Santa Barbara
Hull, Amy San Diego - East
Hum, Denise San Mateo
Iacopetti, Laura San Bernardino - West
Iniguez, Vanessa Los Angeles
Iwasaki, Kentaro San Francisco
Jenkins, Ted San Bernardino - West
Johnson, Ken Placer–Nevada
Johnson, Sue Santa Barbara
Kalbag, Anaroopa Santa Barbara
Kato, Kim Los Angeles
Koos, Karen Los Angeles
Krebs, Michael Los Angeles
Laabs, Kim Sonoma (North Bay)
Lenaburg, Lubi Santa Barbara
Lu, Peter San Francisco
Lum, Lily San Francisco
Lyon, Ann San Francisco
Mantel, Ava Los Angeles
Margala, Julie San Bernardino - West
Marshall, Rob North Coast
Mathiesen, Lauren San Bernardino - West
Mathieson, Christina San Bernardino - West
Matsumoto, Tami North Coast

A C C E S S C u r r i c u l a G u i d e • M a t h e m a t i c s
A c k n o w l e d g e m e n t s / C o n t r i b u t o r s212
Name: Region:
McClung, John Placer–Nevada
McGinity, Michelle Sonoma (North Bay)
Metlitzky, Lilian A. San Bernardino - West
Mikhail, Maggie Santa Barbara
Miner, Jason Santa Barbara
Montgomery, John Placer–Nevada
Moore, Bronwen Santa Barbara
Morales, Manuel Los Angeles
Morris, Kristi Santa Barbara
Munton, Dan Sonoma (North Bay)
Murillo, Diane San Bernardino - West
Nguyen, Ho Contra Costa and San Francisco
Nguyen, Vanson San Francisco and San Mateo
Nordman, Jennifer Merced
Odegard, Barbara Siskiyou
Okelberrry, Lydia Los Angeles
Olivieri Llewellyn, Tami San Bernardino - West
Ormseth, Tor Los Angeles
Orr, Michael San Diego - East
Pahl-Martinez, Sabrina San Bernardino - West
Patterson, Kathleen Placer–Nevada
Pender, Karen San Bernardino - West
Perry, Catharine San Bernardino - West
Piontkowski, Dennis San Francisco
Pompa, Jerry Siskiyou
Poulsen, Chrissy Placer–Nevada
Prapavessi, Despina Contra Costa
Protti, Toni Los Angeles
Randall, David Los Angeles
Raychaudhuri, Debasree Los Angeles
Rebman, Josephine Fresno - West
Ritchie-Reese, Patricia Placer-Nevada
Rivera, Jose San Bernardino - West

213
M a t h e m a t i c s • A C C E S S C u r r i c u l a G u i d e
A c k n o w l e d g e m e n t s / C o n t r i b u t o r s
Name: Region:
Roberts, Kristen San Bernardino - West
Romero, Marty Los Angeles
Rust, Tue Contra Costa
Schlinger, Charles Merced
Seeley, Susan Contra Costa
Sheffield, Kevin Santa Barbara
Simon, Debra San Bernardino - West
Simutis, Jean Contra Costa
Smith, Brenda North Coast
Solis, Monica Los Angeles
Soupcoff, Bri San Bernardino - West
Spaventa, Marilynn Santa Barbara
Stachniak, Don San Bernardino - West
Stamper, Forrest North Coast
Stapleton, Denise Los Angeles
Stevens, Harriette Contra Costa
Thomas, Candy San Bernardino - West
Throop, Ryan Santa Barbara
Tomkins, Phil Fresno - West
Torre, Ken Sonoma (North Bay)
Trapp, Roland San Bernardino - West
Turner, Carole San Francisco
Usher-Staats, Lisa Los Angeles
Utter, Barbara Sonoma (North Bay)
Uy, Fred Los Angeles
Valdez, Luz Merced
Veater, Carl Fresno - West
Villeneve, Jeanne Placer–Nevada
Wagner, Bruce North Coast
Walton, Jennifer San Mateo
Ward, Tiffany Contra Costa
Westlake, Rachel Contra Costa
White, Cynthia Santa Barbara
White, Wes Los Angeles

A C C E S S C u r r i c u l a G u i d e • M a t h e m a t i c s
214 A c k n o w l e d g e m e n t s / C o n t r i b u t o r s
Name: Region:
Whitley, Sheila Merced
Wigert, Scot Sonoma (North Bay)
Willis, Kelly San Bernardino - West
Witt, Robin San Bernardino - West
Wu, Ai-Chu Sonoma (North Bay)
Yokoyama, Kevin North Coast
Zimmerman, Andrea Placer–Nevada

215A c k n o w l e d g e m e n t s / C o n t r i b u t o r s
Career and Technical Education Participants
Name: Region:
Davis, Bill Fresno Area
Harvey, Elizabeth Riverside Area
Hollems, Diane Santa Barbara Area
Kellar, Raymond Siskiyou Area
Miller, Jerald Santa Rosa Area
White, Kathleen San Francisco Area
Cal-PASS Regional Coordinators
Name: Region:
Ceaser, Lisbeth Santa Barbara
Dahlstrom, Eden Siskiyou
Horowitz, Virginia Placer–Nevada
Horton, Katheryn Sonoma (North Bay)
Iwasaki, Kentaro San Francisco
Lachmayr, Lucia San Mateo
Linfor, Cali San Diego - East
Mahar, Kate San Francisco and Contra Costa
Owens, Rae Merced
Schneider, Garry Los Angeles
Schneider, Katy San Bernardino - West
Sizoo, Bob North Coast
Sutherland, Camilla Fresno - West
Tyberg, Alana San Diego - East
Wintermeyer, Lauren Santa Barbara
M a t h e m a t i c s • A C C E S S C u r r i c u l a G u i d e

A C C E S S C u r r i c u l a G u i d e • M a t h e m a t i c s
216 A p p e n d i x • M a p p i n g A C C E S S C o m p e t e n c i e s
A P P E N D I X
Mapping ACCESS Competencies to California Content Standards and Common Core Standards
The tables on the following pages map the relationship between ACCESS competencies and California-based and nationally based standards. The competencies are not necessarily organized in the same way as the California State Standards or Common Core Standards, nor are they necessarily in the order in which one would teach them in the course. Additionally, some of the ACCESS competencies do not have a corresponding map to California Content Standards or Common Core Standards. However, the faculty involved in this project felt that these skills were important enough that they be included as ACCESS competencies because they are necessary for the next level of coursework.
The California State Standards were designed by appointees of the State Board of Education. This document does not retain the official input of California’s public colleges and universities. The document was adopted by the State Board of Education and mandated for all public K–12 schools. These standards are available online at www.cde.ca.gov/board/.
The Common Core State Standards Initiative is a state-led effort launched in 2009 by state leaders, including governors and state commissioners of education from 48 states through membership in the National Governors Association Center for Best Practices (NGA Center) and Council of Chief State School Officers (CCSSO). The process used to write the standards was informed by:
• thebestofstatestandards
• theexperienceofteachers,contentexperts,states,andleadingthinkers
• feedbackfromthegeneralpublic
To write the standards, the NGA Center and CCSSO brought together content experts, teachers, researchers, and others.
The Common Core standards, which can be found online at www.corestandards.org, are divided into two categories:
• collegeandcareerreadinessstandards,whichaddresswhatstudentsareexpectedtolearn when they have graduated from high school
• K–12standards,whichaddressexpectationsforelementarythroughhighschool

M a t h e m a t i c s • A C C E S S C u r r i c u l a G u i d e
217M a p p i n g A C C E S S C o m p e t e n c i e s • A p p e n d i x
The California Education RoundTable Content Standards (called the CERT Standards) were published just prior to the state’s content standards for mathematics in 1997. The standards were designed by a task sponsored by the RoundTable. The RoundTable comprised, in part, the heads of the California Department of Education, the California Community Colleges, the California State Universities, and the University of California. Serving on the task force were K–12 faculty, administrators, public participants, and academic Senate-appointed postsecondary faculty. While these standards have no official status under the Board of Education, they provide a point of contrast, noting competencies that are not addressed in the California mathematics standards. These standards can be found at www.certicc.org.
CERT Mathematics Standards for California High School Graduates (not included in the rubric on the following pages): This report identifies the kinds of activities that should be promoted in the classroom. We include them here in summary form:
• Becoming Fluent in Mathematics — Effective classes will provide experiences that lead to students’ acquisition of facility with the basic techniques of mathematics. There are certain necessary skills that students will need to be able to call upon without hesitation.
• Modeling Mathematical Thinking — Effective classes will reflect the enthusiasm that comes in learning with a teacher and others who get excited about mathematics, who work as a team, who experiment and form conjectures.
• Solving Problems — Effective classes will reflect the notion that problem solving is best conveyed by giving students appropriate experience in solving unfamiliar problems, by then engaging them in discussion of their various attempts at solutions, and by reflecting on these processes.
• Developing Analytic Ability and Logic — Effective teachers will emphasize a thorough understanding of the subject matter and the development of logical reasoning. A classroom full of discourse and interaction that focuses on reasoning is a classroom in which analytic ability and logic are being developed.
• Experiencing Mathematics in Depth — Students must delve deeply into well-chosen areas of mathematics. A shallow exploration of a broad range of topics will not contribute to the ability to understand and independently use mathematics.
• Appreciating the Beauty and Fascination of Mathematics — Effective teachers must nurture the appreciation for the inherent beauty of mathematics.
• Building Confidence — Effective teachers must create situations in which students are rewarded for being inquisitive, for experimenting, for taking risks, and for persisting in finding solutions they fully understand. This will help students generate confidence in their mathematical ability.
• Communicating — Effective classes will reflect a student’s ability to explain with confidence not only the answer to the problem but the process by which the problem was solved. Students need extensive experience in oral and written communication with extensive feedback in order to develop these skills.

A C C E S S C u r r i c u l a G u i d e • M a t h e m a t i c s
218 A p p e n d i x • M a p p i n g A C C E S S C o m p e t e n c i e s
Competency Statement(Algebra II/Intermediate
Algebra)
ACCESS Competency
Number
CA Content Standard
National Common Core
Standard
Use properties of absolute values to solve multistep equations and inequalities.
1 1.0 A-CED 1A-REI 3
Solve systems of linear equations in both two and three variables by substitution, elimination/addition, graphs, and matrices.
2 2.0A-REI 5–9A-CED 3N-VM 6
Factor polynomials by grouping. 3 4.0 A-SSE 2
Factor polynomials by using the sum/difference of cubes pattern. 4 4.0 A-SSE 2
Factor polynomials by extending the difference of squares pattern to polynomials of degree higher than 2.
5 4.0 A-SSE 2
Solve quadratic equations in the real and complex number systems by factoring.
6 8.0N-CN 7
A-SSE 3aF-IF 8a
Solve quadratic equations in the real and complex number systems by completing the square.
7 8.0A-SSE 3b
A-REI 4a and 4bF-IF 8a
Solve quadratic equations in the real and complex number systems by using the quadratic formula.
8 8.0 A-REI 4b
Use multiple representations (tables, graphs, and equations) to solve contextualized problems that result in quadratic equations.
9 8.0 and 9.0A-CED 1
F-IF 7a and 8aF-LE 3
Add and subtract complex numbers. 10 6.0 N-CN 2
Multiply complex numbers. 11 7.0 N-CN 2 and 5
Mapping ACCESS Algebra II/Intermediate Algebra Competencies to Standards

M a t h e m a t i c s • A C C E S S C u r r i c u l a G u i d e
219M a p p i n g A C C E S S C o m p e t e n c i e s • A p p e n d i x
Competency Statement(Algebra II/Intermediate
Algebra)
ACCESS Competency
Number
CA Content Standard
National Common Core
Standard
Perform division with complex numbers. 12 7.0 N-CN 3
Simplify rational expressions with higher order polynomials in the denominator by canceling common factors in the numerator and denominator.
13 3.0 A-APR 1, 6, and 7
Add and subtract rational expressions with higher order polynomials in the denominator.
14 7.0 A-APR 7
Multiply and divide rational expressions with higher order polynomials in the denominator.
15 6.0 A-APR 6 and 7
Divide polynomials by binomials using long division and synthetic division.
16 12.0 A-APR 6
Simplify a fraction where the numerator, denominator, or both contain a fraction (complex fractions).
17 12.0 A-APR 6
Use multiple representations (tables, graphs, and equations) to solve contextualized problems that result in equations involving rational expressions.
18 15.0 A-REI 2A-APR 6
Use the properties of exponents to simplify expressions with rational exponents.
19 15.0 N-RN 1 and 2
Use the properties of exponents to solve equations with rational exponents.
20 15.0 N-RN 1 and 2A-REI 2
Simplify radical expressions by removing repeated factors and performing addition and subtraction operations.
21 1.0, 9.0, 10.0, 12.0, 13.0, 16.0, and 17.0 A-REI 2

A C C E S S C u r r i c u l a G u i d e • M a t h e m a t i c s
220 A p p e n d i x • M a p p i n g A C C E S S C o m p e t e n c i e s
Competency Statement(Algebra II/Intermediate
Algebra)
ACCESS Competency
Number
CA Content Standard
National Common Core
Standard
Simplify radical expressions by removing repeated factors and performing multiplication operations.
22 1.0, 9.0, 10.0, 12.0, 13.0, 16.0, and 17.0 A-REI 2
Rationalize the denominator of radical expressions. 23 24.0 No corresponding
standard
Use multiple representations (tables, graphs, and equations) to solve problems that result in radical equations.
24 24.0 No corresponding standard
Apply and graph transformations of parent functions (quadratic, cubic, square root, absolute value, exponential, and logarithmic).
25 12.0 F-LE 2 and 3F-IF 7
Identify the parent function (quadratic, cubic, square root, absolute value, exponential, and logarithmic) and transformations for a given transformed function in algebraic or graphical form.
26 11.0–14.0 F-LE 2F-BF 5
Compose two linear, quadratic, cubic, square root, absolute value, exponential, or logarithmic functions.
27 16.0 F-BF 1c
Find the inverse of linear, quadratic, cubic, square root, absolute value, exponential, and logarithmic functions algebraically and graphically.
28 18.0–20.0 F-BF 4 and 5
Find the equation of an exponential function given two points on the graph.
29 22.0–23.0 F-BF 2F-LE 2
Use multiple representations (tables, graphs, and equations) to solve contextualized problems that result in one- and two-step exponential and logarithmic equations.
30 Linear Algebra 1–12 F-BF 1 and 5

M a t h e m a t i c s • A C C E S S C u r r i c u l a G u i d e
221M a p p i n g A C C E S S C o m p e t e n c i e s • A p p e n d i x
Competency Statement(Algebra II/Intermediate
Algebra)
ACCESS Competency
Number
CA Content Standard
National Common Core
Standard
Graph simple conics, including: • acirclegivenitsequation
(centered anywhere) • anellipsegivenitsequation
(centered at the origin)• ahyperbolagivenitsequation
(centered at the origin)
31
Trigonometry 4.0, 8.0, and 19.0;
Math Analysis 6.0 and 7.0
G-GPE 1, 2, and 3
Solve statistical problems: • Computepermutationsusing
fundamental counting principle.• Computecombinations.• Computeprobabilitiesusing
combinations.• Computeprobabilitiesusing
permutations.• Expandbinomialexpressions
using the binomial theorem.
32Embedded in
Algebra I and Algebra II standards
A-APR 5S-CP 9
Compute the general term and sums of arithmetic series, finite geometric series, and infinite geometric series.
33 Algebra II 22.0 and 23.0 F-BF 2

A C C E S S C u r r i c u l a G u i d e • M a t h e m a t i c s
222 A p p e n d i x • M a p p i n g A C C E S S C o m p e t e n c i e s
Competency Statement(Precalculus)
ACCESS Competency
Number
CA Content Standard
National Common Core
Standard
Perform matrix operations, including addition and multiplication, and calculate the determinants of 2x2 and 3x3 matrices.
1 Linear Algebra 1.0–12.0 N-VM 6 and 8
Describe different types of functions (polynomial, exponential, logarithmic, and trigonometric) using a table, a graph, an equation, and a verbal description..
2
Trigonometry 4.0, 8.0, and 19.0;
Math Analysis 6.0 and 7.0
F-IF 1, 2, 4, 5, 7, 8a, and 9
Graph piecewise-defined functions. 3 No corresponding
standard F-IF 7a, 7b, and 7c
Find all real zeros (roots) of polynomial functions exactly using the rational root theorem.
4 No corresponding standard A-APR 3
Find all the zeros (roots) of a polynomial function. 5 No corresponding
standard N-CN 7 and 8
Solve polynomial inequalities. 6 No corresponding standard
F-IF 7c A-APR 3
Solve rational inequalities. 7 No corresponding standard
No corresponding standard
Find the composition of two or more functions, each containing two or more operations (such as linear, quadratic, rational, cubic, square root, cube root, and trigonometric functions).
8Higher level
complexity than Algebra II 24.0
F-BF 1, 3, and 4
Given a function, determine if an inverse function exists. If so:• Findtheinverseofthefunction
algebraically and graphically.• Identifythedomainandrangeof
the original and inverse functions.
9
Higher level complexity than
Algebra II11.0 and 24.0
F-BF 4F-IF 5
Mapping ACCESS Precalculus Competencies to Standards

M a t h e m a t i c s • A C C E S S C u r r i c u l a G u i d e
223M a p p i n g A C C E S S C o m p e t e n c i e s • A p p e n d i x
Competency Statement(Precalculus)
ACCESS Competency
Number
CA Content Standard
National Common Core
Standard
Simplify expressions involving exponents. 10 No corresponding
standardNo corresponding
standard
Expand logarithmic expressions. 11 No corresponding standard
No corresponding standard
Condense logarithmic expressions. 12 No corresponding standard
No corresponding standard
Solve multistep exponential equations. 13
Higher level complexity than Algebra II 12.0
No corresponding standard
Solve multistep logarithmic equations. 14 No corresponding
standardNo corresponding
standard
Sketch the graph of a conic, identifying center, vertices, foci, and asymptotes (if present).
15 Math Analysis 5.0, 5.1, and 5.2 G-GPE 1, 2, and 3
Graph trigonometric functions of the form
( ) .y A f Bx C k= + +
• Determinetheamplitudeofasine or cosine function from its equation.
• Determinetheperiodofasine,cosine, or tangent function from its equation.
• Determinetheverticalshiftofasine, cosine, or tangent function from its equation.
• Determinethephaseshiftofasine, cosine, or tangent function from its equation.
• Sketchbyhandthegraphofasine, cosine, or tangent function.
16 Trigonometry 2.0, 4.0, 5.0, and 9.0 F-TF 5
Given the graph of a trigonometric function, write the equation (sine, cosine, tangent).
17 Trigonometry 4.0 F-IF 7F-TF 5
Graph inverse trigonometric functions. 18 No corresponding
standard F-TF 6
Prove trigonometric identities. 19 Trigonometry 3.0, 3.1, 3.2, 10.0, and 11.0 F-TF 8, 9, and 10

A C C E S S C u r r i c u l a G u i d e • M a t h e m a t i c s
224 A p p e n d i x • M a p p i n g A C C E S S C o m p e t e n c i e s
Competency Statement(Precalculus)
ACCESS Competency
Number
CA Content Standard
National Common Core
Standard
Solve trigonometry equations. 20 Trigonometry 19.0 F-TF 7
Solve for all unknown parts of a given triangle:• byusingrighttriangle
trigonometry• byusingtheLawofSines• byusingtheLawofCosines
21 Trigonometry 12.0 and 13.0 G-SRT 8–11
Convert between polar and rectangular coordinates. 22 Math Analysis 1.0
G-PCC 1 and 2(CA add-on standard)
Graph equations written in polar form. 23 Trigonometry
15.0 and 16.0
G-PCC 1 and 2(CA add-on standard)
Graph equations written in parametric form. 24 Math Analysis 7.0
G-PCC 3(CA add-on standard)
Given the components of a two-dimensional vector, determine the magnitude and direction of the vector.
25 Math Analysis 7.0 N-VM 1, 2, 3, and 4
Perform the vector operations of addition, subtraction, and scalar multiplication.
26 Linear Algebra 4.0, 5.0, and 7.0 N-VM 4 and 5
Use factorial notation. 27 No corresponding standard
No corresponding standard
Expand binomial expressions. 28Higher level
compexity than Algebra II 20.0
A-APR 5

M a t h e m a t i c s • A C C E S S C u r r i c u l a G u i d e
225M a p p i n g A C C E S S C o m p e t e n c i e s • A p p e n d i x
Mapping ACCESS (Non-STEM) Statistics Competencies to Standards
Competency Statement(Non-STEM Statistics)
ACCESS Competency
Number
CA Content Standard
National Common Core
Standard
Determine whether a variable is categorical or quantitative, given a situation.
1 Not explicitly stated, but implied in 8.0
Not explicitly stated, but
implied in S-ID
Identify the sampling method used (random, systematic, convenience, stratified, cluster, or voluntary response), given a scenario in which data were collected from a population.
2 No corresponding standard
Not explicitly stated, but
implied in S-IC 3
Identify the basic terminology of experimental design used in a given scenario.
3 No corresponding standard
Not explicitly stated, but
implied in S-IC
Identify biases in experimental designs or in the creation of a sample.
4 No corresponding standard S-IC 3
Determine an appropriate experimental design for a given scenario.
5 No corresponding standard S-IC 3
Construct and describe an appropriate visual display given a data set (histogram, bar graph, stem plot, scatter plot, box and whisker plot, and pie chart).
6 8.0 S-ID 1 and 6
Identify which measure of the center (mean, median, or mode) is most appropriate for a given situation and what the relationship between the mean, median, and mode indicates about the distribution of the data.
7 6.0 S-ID 2
Determine standard deviation from multiple representations of data (table, graph, and word problems) and explain standard deviation in the context of a given situation.
8 5.0 and 7.0 S-ID 2

A C C E S S C u r r i c u l a G u i d e • M a t h e m a t i c s
226 A p p e n d i x • M a p p i n g A C C E S S C o m p e t e n c i e s
Competency Statement(Non-STEM Statistics)
ACCESS Competency
Number
CA Content Standard
National Common Core
Standard
Use the normal distribution to solve for the probability of an event or solve for the boundaries for a particular event.
9 4.0 S-ID 4
Determine the size of a sample space using counting principles, permutations, and combinations.
10 1.0 and 2.0 S-CP 9
Compute basic probability of independent events and solve problems involving the binomial distribution:• Determinesituationsthatare
Bernoulli trials.• Calculatetheprobabilityof
an event (success) and its complementary probability (failure).
• Discernthedifferencebetweengeometric probability and binomial probability of Bernoulli trials.
• Applytheformulaforbinomialprobability for x successes in n trials ( ) .x n x
n rP x C p q −=
• Usethenormalmodel ( , ),N µ σ
where npµ = and npqσ =
to approximate a binomial
probability when the number of
trials and desired successes is
inordinately large.
11 1.0 and 4.0Not explicitly
stated, but implied in S-MD
Apply the Central Limit Theorem to sampling distributions. 12 No corresponding
standard
Not explicitly stated, but
implied in S-IC
Estimate population parameters using confidence intervals for means and proportions.
13 No corresponding standard S-IC 4

M a t h e m a t i c s • A C C E S S C u r r i c u l a G u i d e
227M a p p i n g A C C E S S C o m p e t e n c i e s • A p p e n d i x
Competency Statement(Non-STEM Statistics)
ACCESS Competency
Number
CA Content Standard
National Common Core
Standard
Perform appropriate hypothesis test (state the hypotheses, determine the significance level, check conditions/criteria, calculate the test statistic, determine the p-value, make a decision and interpret it in the context of the problem) for a given situation.
14 No corresponding standard
Not explicitly stated, but implied in
S-IC 4 and 5
Explain the relationship between parameters and statistics. 15 No corresponding
standard S-IC 1
Given a p-value, interpret its meaning in the context of the variables of a problem: • Definethep-value. • Identifytheappropriatenulland
alternative hypotheses, and use the proper notation of H0 and Ha.
• Interpretagivenp-value in the context of a hypothesis testing situation as it relates to the rejection of or failure to reject H0.
16 No corresponding standard
Not explicitly stated, but implied in
S-IC 4 and 5
Find and apply the equation of the regression line when linear regression is appropriate:• Determinewhenlinear
regression is appropriate for a set of bivariate data.
• Findthelinearcorrelationcoefficient r and the coefficient of determination r 2.
• Usetheregressionlinetomakeappropriate predictions.
• Interpretr, r 2, and slope in the context of a given situation.
17 No corresponding standard S-ID 6, 7, and 8