Embed Size (px)
Citation preview
Accepted Manuscript
Development and Validation of a Scoring System to Predict Outcomes of PatientsWith Primary Biliary Cirrhosis Receiving Ursodeoxycholic Acid Therapy
Willem J. Lammers, Gideon M. Hirschfield, Christophe Corpechot, FrederikNevens, Keith D. Lindor, Harry L.A. Janssen, Annarosa Floreani, Cyriel Y.Ponsioen, Marlyn J. Mayo, Pietro Invernizzi, Pier M. Battezzati, Albert Parés,Andrew K. Burroughs, Andrew L. Mason, Kris V. Kowdley, Teru Kumagi, MarenH. Harms, Palak J. Trivedi, Raoul Poupon, Angela Cheung, Ana Lleo, LlorençCaballeria, Bettina E. Hansen, Henk R. van Buuren
PII: S0016-5085(15)01094-XDOI: 10.1053/j.gastro.2015.07.061Reference: YGAST 59952
To appear in: GastroenterologyAccepted Date: 30 July 2015
Please cite this article as: Lammers WJ, Hirschfield GM, Corpechot C, Nevens F, Lindor KD, JanssenHLA, Floreani A, Ponsioen CY, Mayo MJ, Invernizzi P, Battezzati PM, Parés A, Burroughs AK, MasonAL, Kowdley KV, Kumagi T, Harms MH, Trivedi PJ, Poupon R, Cheung A, Lleo A, Caballeria L, HansenBE, van Buuren HR, on behalf of the Global PBC Study Group, Development and Validation of a ScoringSystem to Predict Outcomes of Patients With Primary Biliary Cirrhosis Receiving Ursodeoxycholic AcidTherapy, Gastroenterology (2015), doi: 10.1053/j.gastro.2015.07.061.
This is a PDF file of an unedited manuscript that has been accepted for publication. As a service toour customers we are providing this early version of the manuscript. The manuscript will undergocopyediting, typesetting, and review of the resulting proof before it is published in its final form. Pleasenote that during the production process errors may be discovered which could affect the content, and alllegal disclaimers that apply to the journal pertain.
All studies published in Gastroenterology are embargoed until 3PM ET of the day they are published ascorrected proofs on-line. Studies cannot be publicized as accepted manuscripts or uncorrected proofs.
MANUSCRIP
T
ACCEPTED
ACCEPTED MANUSCRIPT
Development and Validation of a Scoring System to Predict Outcomes of Patients With Primary
Biliary Cirrhosis Receiving Ursodeoxycholic Acid Therapy
Short title:
Identification of PBC patients in need of new therapies
Willem J. Lammers1; Gideon M. Hirschfield2; Christophe Corpechot3; Frederik Nevens
4; Keith D.
Lindor5,6
; Harry L.A. Janssen7; Annarosa Floreani8; Cyriel Y. Ponsioen9; Marlyn J. Mayo10; Pietro
Invernizzi11; Pier M. Battezzati12; Albert Parés13
; Andrew K. Burroughs14 ,*; Andrew L. Mason15; Kris
V. Kowdley16; Teru Kumagi17; Maren H. Harms1; Palak J. Trivedi2; Raoul Poupon3; Angela Cheung7;
Ana Lleo11; Llorenç Caballeria13
; Bettina E. Hansen1**
; Henk R. van Buuren1**
– on behalf of the
Global PBC Study Group
1
Dept of Gastroenterology and Hepatology, Erasmus University Medical Centre, Rotterdam, The
Netherlands; 2
NIHR Biomedical Research Unit and Centre for Liver Research, University of
Birmingham, Birmingham, UK; 3
Centre de Référence des Maladies Inflammatoires des
VoiesBiliaires, Hôpital Saint-Antoine, APHP, Paris, France; 4
Dept of Hepatology, University
Hospitals Leuven, KULeuven, Leuven, Belgium; 5
Dept Gastroenterology and Hepatology, Mayo
Clinic, Rochester, MN, USA; 6
Arizona State University, College of Health Solutions, Phoenix, AZ, USA;
7
Liver Clinic, Toronto Western & General Hospital, University Health Network, Toronto, ON,
Canada; 8
Department of Surgery, Oncology and Gastroenterology, University of Padua, Padua, Italy;
9
Dept of Gastroenterology and Hepatology, Academic Medical Center, Amsterdam, The
Netherlands; 10
Digestive and Liver diseases, UT Southwestern Medical Center, Dallas, TX, USA;
11Liver Unit and Center for Autoimmune Liver Diseases, Humanitas Clinical and Research Center,
Rozzano (MI), Italy; 12
Department of Health Sciences, Università degli Studi di Milano, Milan, Italy;
MANUSCRIP
T
ACCEPTED
ACCEPTED MANUSCRIPT13
Liver Unit, Hospital Clínic, CIBERehd, IDIBAPS, University of Barcelona, Barcelona, Spain; 14
The
Sheila Sherlock Liver Centre, The Royal Free Hospital, London, United Kingdom; 15
Divison of
Gastroenterology and Hepatology, University of Alberta, Edmonton, AB, Canada; 16
Liver Care
Network and Organ Care Research, Swedish Medical Center, Seattle, WA, USA; 17
Department of
Gastroenterology and Metabology, Ehime University graduate School of Medicine, Ehime, Japan
*deceased, ** joint senior authors
Funding
This investigator-initiated study was supported by unrestricted grants from Intercept
Pharmaceuticals and Zambon Nederland B.V., and was funded by the Foundation for Liver and
Gastrointestinal Research (a not-for-profit foundation) in Rotterdam, the Netherlands. The
supporting parties had no influence on the study design, data collection and analyses, writing of the
manuscript, or on the decision to submit the manuscript for publication.
List of abbreviations
PBC, primary biliary cirrhosis; UDCA, ursodeoxycholic acid; ULN, upper limit of normal; LLN, lower
limit of normal; ALT, alanine aminotransferase; AST, aspartate aminotransferase; APRI, AST to
platelet ratio index; NL, natural logarithm; IQR, interquartile range; NRI, net reclassification
improvement
Corresponding author
Henk R. van Buuren, MD, PhD
Erasmus MC, University Medical Center
Department of Gastroenterology and Hepatology
‘s-Gravendijkwal 230, Room Ha 203
MANUSCRIP
T
ACCEPTED
ACCEPTED MANUSCRIPT
3015 CE Rotterdam, the Netherlands
Tel: +31 10 703 2261
Fax: +31 10 436 5916
Email: [email protected]
Disclosure of potential conflicts of interest
The following authors declared that they have no conflicts of interest: W.J. Lammers, M.H. Harms, R.
Poupon, C. Corpechot, A. Floreani, A. Lleo, P.M. Battezzati, A. Cheung
H.R. van Buuren received unrestricted grants from Intercept Pharmaceuticals and Zambon
Nederland B.V.; B.E. Hansen received unrestricted grants from and is consultant for Intercept
Pharmaceuticals and Roche; G.M. Hirschfield is study Investigator for Intercept, FalkPharma, Gilead,
Lumena, FF Pharma, GSK, Janssen, and he has consulted for Intercept, Lumena, NGM Bio and FF
Pharma. He is supported in part by the UK Medical Research Council Stratified Medicine Grant, UK-
PBC; H.L.A. Janssen received grants from and is consultant for: Bristol Myers Squibb, Gilead Sciences,
Novartis, Roche, Merck, Innogenetics, Abbott, Santaris, Medtronic, Tibotec; P. Invernizzi is
consultant for Menarini Diagnostics, Instrumentation laboratories, Medigene; A.L. Mason received
funding from the Canadian Institutes for Health Research, Canadian Liver Foundation, Alberta
Heritage Foundation for Medical research, and Alberta Cancer Foundation. Abbvie and Gilead have
provided medications for ongoing clinical trials; C.Y. Ponsioen received unrestricted grants from
Abbvie, Dr. Falk Pharma, and Takeda. He received consultancy fees from Abbvie, GSK, and Takeda,
and speaker's fees from Abbvie, MSD, Takeda, and Ferring; M.J. Mayo received Grant support in the
form of carrying out sponsor-initiated clinical trials: Intercept, Gilead, Salix, Lumena, NGM; A. Parés
is consultant for Lumena Pharmaceuticals, Inc.; K.V. Kowdley received grants and research support
from AbbVie, Beckman, BMS, Boeringer Ingelheim, Gilead, Ikaria, Intercept, Janssen, Merck,
Mochida, Vertex; He received consultancy fees from Novartis and Tekmira (honorarium payable to
Institution); and he participated in advisory boards for AbbVie , Boeringer Ingelheim, Gilead, Ikaria ,
MANUSCRIP
T
ACCEPTED
ACCEPTED MANUSCRIPT
Janssen , Merck , Trio Health (honorarium payable to Institution); P.J. Trivedi is the recipient of a
Wellcome Trust Clinical Research Fellowship; T. Kumagi received fellowship support from an
unrestricted grant from Axcan Pharma; K.D. Lindor is affliliated as AASLD Governing Board member
and primary author PSC guidelines (to be completed this year) and he is unpaid advisor of Intercept
Pharmaceuticals and Lumena Pharmaceuticals. F. Nevens received research grants from Roche,
Astellas, Ferring, Novartis, Janssen-Cilag, Abbvie and he has consultancy agreements with CAF,
Intercept, Gore, BMS, Abbvie, Novartis, MSD, Janssen-Cilag, Promethera Biosciences.
Authors contributions
Willem J. Lammers, Bettina E. Hansen and Henk R. van Buuren had full access to all the data in the
study and take responsibility for the integrity of the data and the accuracy of the data analysis.
Study concept and design: Willem J. Lammers, Gideon M. Hirschfield, Christophe Corpechot, Frederik
Nevens, Keith D. Lindor, Harry L.A. Janssen, Annarosa Floreani, Cyriel Y. Ponsioen, Marlyn J. Mayo,
Pietro Invernizzi, Pier M. Battezzati, Albert Parés, Andrew K. Burroughs, Andrew L. Mason, Kris V.
Kowdley, Teru Kumagi, Maren H. Harms, Palak J. Trivedi, Raoul Poupon, Angela Cheung, Ana Lleo,
Llorenç Caballeria, Bettina E. Hansen, Henk R. van Buuren
Acquisition of data: Willem J. Lammers, Gideon M. Hirschfield, Christophe Corpechot, Frederik
Nevens, Keith D. Lindor, Harry L.A. Janssen, Annarosa Floreani, Cyriel Y. Ponsioen, Marlyn J. Mayo,
Pietro Invernizzi, Pier M. Battezzati, Albert Parés, Andrew K. Burroughs, Andrew L. Mason, Kris V.
Kowdley, Teru Kumagi, Maren H. Harms, Palak J. Trivedi, Raoul Poupon, Angela Cheung, Ana Lleo,
Llorenç Caballeria, Bettina E. Hansen, Henk R. van Buuren
Analysis and interpretation of data: Willem J. Lammers, Henk R. van Buuren, Bettina E. Hansen,
Gideon M. Hirschfield, Christophe Corpechot and Frederik Nevens
Drafting of the manuscript: Willem J. Lammers, Henk R. van Buuren, Bettina E. Hansen, Gideon M.
Hirschfield, Christophe Corpechot and Frederik Nevens
MANUSCRIP
T
ACCEPTED
ACCEPTED MANUSCRIPT
Critical revision of the manuscript for important intellectual content: Willem J. Lammers, Gideon M.
Hirschfield, Christophe Corpechot, Frederik Nevens, Keith D. Lindor, Harry L.A. Janssen, Annarosa
Floreani, Cyriel Y. Ponsioen, Marlyn J. Mayo, Pietro Invernizzi, Pier M. Battezzati, Albert Parés,
Andrew L. Mason, Kris V. Kowdley, Teru Kumagi, Maren H. Harms, Palak J. Trivedi, Raoul Poupon,
Angela Cheung, Ana Lleo, Llorenç Caballeria, Bettina E. Hansen, Henk R. van Buuren
Statistical analysis: Willem J. Lammers, Bettina E. Hansen
Administrative, technical or material support: NA
Obtained funding: Henk R. van Buuren, Bettina E. Hansen and Harry L.A. Janssen
Study supervision: Willem J. Lammers, Gideon M. Hirschfield, Christophe Corpechot, Frederik Nevens,
Keith D. Lindor, Harry L.A. Janssen, Annarosa Floreani, Cyriel Y. Ponsioen, Marlyn J. Mayo, Pietro
Invernizzi, Pier M. Battezzati, Albert Parés, Andrew L. Mason, Kris V. Kowdley, Teru Kumagi, Maren H.
Harms, Palak J. Trivedi, Raoul Poupon, Angela Cheung, Ana Lleo, Llorenç Caballeria, Bettina E.
Hansen, Henk R. van Buuren
MANUSCRIP
T
ACCEPTED
ACCEPTED MANUSCRIPT
ABSTRACT
Background & Aims: Approaches to risk stratification for patients with primary biliary cirrhosis (PBC)
are limited, single-center based, and often dichotomous. We aimed to develop and validate a better
model for determining prognoses of patients with PBC.
Methods: We performed an international, multicenter meta-analysis of 4119 patients with PBC
treated with ursodeoxycholic acid (UDCA) at liver centers in 8 European and North American
countries. Patients were randomly assigned to derivation (n=2488, 60%) and validation cohorts
(n=1631, 40%). A risk score (GLOBE score) to predict transplantation-free survival was developed and
validated with univariate and multivariable Cox regression analyses using clinical and biochemical
variables obtained after 1 y UDCA therapy. Risk score outcomes were compared with the survival of
age-, sex-, and calendar time-matched members of the general population. The prognostic ability of
the GLOBE score was evaluated alongside those of the Barcelona, Paris-1, Rotterdam, Toronto, and
Paris-2 criteria.
Results: Age (hazard ratio [HR], 1.05; 95% confidence interval [CI], 1.04–1.06; P<.0001); levels of
bilirubin (HR, 2.56; 95% CI, 2.22–2.95; P<.0001), albumin (HR, 0.10; 95% CI, 0.05–0.24; P<.0001), and
alkaline phosphatase (HR, 1.40; 95% CI, 1.18–1.67; P=.0002); and platelet count (HR/10 units
decrease, 0.97; 95% CI, 0.96–0.99; P<.0001) were all independently associated with death or liver
transplantation (C statistic derivation, 0.81; 95% CI, 0.79–0.83, and validation cohort, 0.82; 95% CI,
0.79–0.84). Patients with risk scores >0.30 had significantly shorter times of transplant-free survival
than matched healthy individuals (P<.0001). The GLOBE score identified patients who would survive
for 5 y and 10 y (responders) with positive predictive values of 98% and 88%, respectively. Up to 22%
and 21% of events and non-events, respectively, 10 y after initiation of treatment were correctly
reclassified in comparison with earlier proposed criteria. In subgroups of patients <45 y, 45–52 y, 52–
MANUSCRIP
T
ACCEPTED
ACCEPTED MANUSCRIPT
58 y, 58–66 y, and ≥66 y old, age-specific GLOBE-score thresholds beyond which survival significantly
deviated from matched healthy individuals were –0.52, 0.01, 0.60, 1.01 and 1.69, respectively.
Transplant-free survival could still be accurately calculated by the GLOBE score with laboratory
values collected at 2–5 y after treatment.
Conclusions: We developed and validated scoring system (the GLOBE score) to predict transplant-
free survival of UDCA-treated patients with PBC. This score might be used to select strategies for
treatment and care.
KEYWORDS: cholestasis; autoimmune liver disease; prognosis; predictive factor
MANUSCRIP
T
ACCEPTED
ACCEPTED MANUSCRIPT
INTRODUCTION
Primary biliary cirrhosis (PBC) is the most common of the autoimmune liver diseases, with 1 in 1000
women over the age of 40 affected.1 Prognosis largely depends on the development of liver cirrhosis
and its complications.2 Presently, treatment with ursodeoxycholic acid (UDCA) represents the global
standard of care,2, 3
and can delay histological progression4-6
and can improve long-term survival.7, 8
However, UDCA is not an uniformly effective drug and the prognosis of patients insufficiently
responding to treatment is markedly worse compared with the general population.9 Reliable
identification of such individuals is of key importance to clinical management, particularly for
selecting those who could benefit from additional second-line medical therapies, but equally for
identification of patients at low risk of developing end-stage liver disease.
A number of existing stratification tools, using biochemical liver tests applied after one or
two years of UDCA exposure, will readily identify patients with or without sufficient treatment
response.9-13
Paris-1 criteria is generally considered as the one with best predictability of transplant-
free survival as validated in large studies, such as the UK-PBC consortium and our own group.11, 14-16
However, Paris-1 and other criteria were all based on dichotomized variables, potentially leading to
loss of important predictive information. And even more important there is a relatively high
disagreement between the different criteria in classifying someone among low- and high risk
groups.17
The Global PBC Study Group has representative data from an international PBC research
collaboration that has already evaluated biochemical surrogates of disease progression and liver
cancer risk.16, 18
The aim of present study was to utilise our unique dataset, alongside representative
healthy population data, to develop a new unifying score with optimal ability to identify UDCA
treated patients with an insufficient treatment effect, based on readily obtainable, biochemical and
clinical variables.
MANUSCRIP
T
ACCEPTED
ACCEPTED MANUSCRIPT
METHODS
Study population and design
Patients were derived from the Global PBC Study Group database. This study group is an
international and multicenter collaboration between 15 liver centers from 8 North American and
European countries, which combined individual patient data from major long-term follow-up
cohorts. Most cohorts included prospectively collected follow-up data. All patients had an
established diagnosis of PBC2, 3
and characteristics of the study population have been previously
described elsewhere.18
For the current study only those patients treated with UDCA were included.
Patients were excluded if follow-up data were insufficient or unavailable, the start date of treatment
or the exact date of major clinical events was unknown or in case of concomitant liver disease.
Collected clinical and laboratory data included gender, age, PBC diagnosis, liver histology, treatment
(type of medication, dosage and duration), duration and last date of follow-up, baseline
antimitochondrial antibody status, baseline and yearly laboratory values (serum alkaline
phosphatase, total bilirubin, albumin, aspartate aminotransferase (AST), alanine aminotransferase
(ALT) and platelets and outcomes (death and cause of death, liver transplantation, hepatocellular
carcinoma, ascites and variceal bleeding).
Ethical approval
This study was conducted in accordance with the protocol and the principles of the Declaration of
Helsinki. The protocol was approved by the Institutional Research Board of the corresponding
center, and at each participating center, in accordance with local regulations.
Statistical analysis
The study population was divided into a two cohorts, a derivation series comprising a randomly
selected group of 2488 patients (60%), with the remainder serving as of a validation cohort (n=1631,
MANUSCRIP
T
ACCEPTED
ACCEPTED MANUSCRIPT
40%). Follow-up commenced at the start of UDCA therapy. Clinical outcome consisted of a
composite endpoint of liver transplantation and all-cause mortality with the first event considered.
Patients failing to reach a clinical endpoint were censored at time of last follow-up.
For development of our risk score only easily and readily available clinical and laboratory
variables were considered: sex, baseline age, and serum bilirubin, alkaline phosphatase, AST, ALT,
albumin, platelet count, AST/ALT ratio, and AST to platelet ratio index (APRI) at one year follow-up.
Where indicated, continuous variables underwent natural logarithmic transformation to correct for
non-linearity. Multiple imputation was also applied to account for missing data wherein ten
complete datasets were constructed by imputing missing values (SAS Proc MI, MCMC method; SAS
9.3).19
Time-to-event analysis was conducted using univariate and multivariable cox proportional
hazard regression, and a final model was selected by comparing the goodness of fit criteria (Akaike
Information Criteria and maximum-likelihood estimation). The final model was checked for potential
confounding factors and interactions between the included variables. A penalised maximum
likelihood estimation was used to account for over fitting of the model.20
21
A prognostic index (GLOBE score) was calculated with the beta coefficients of variables
included in the final penalized multivariable model, along with a baseline survival estimate S0(t),
t=time. The GLOBE score was centered on the median in the derivation set.
The overall discriminative ability of the GLOBE score was measured with C statistic in both
the derivation and validation cohort. To visualise the discriminate ability Kaplan-Meier curves were
plotted of 5 risk groups according to the 10th
, 40th
, 60th
and 90th
percentiles of the GLOBE score.
Calibration of the GLOBE score was tested within the validation set.22
The calibration slope
was calculated by estimating the regression coefficient on the GLOBE score. The necessity of
recalibration was further tested by performing a Cox regression analysis on the variables included in
the final model and including the GLOBE score with the regression coefficient constrained to 1. A
good model fit was reached when the joint test of all beta coefficients did not significantly differ
MANUSCRIP
T
ACCEPTED
ACCEPTED MANUSCRIPT
from 0. The accuracy of the baseline survival estimate S0(t) was investigated by comparing the
predicted survival probabilities of the 5 risk groups as defined above in the validation set with the
observed Kaplan-Meier survival probabilities.
In order to identify patients in whom prognosis significantly deviates from normal, the score
was calculated beyond which prognosis was significantly worse than of a normal population. To
determine this threshold, survival of patients with GLOBE scores below the tenth percentile was
compared with that of an age-, sex- and calendar time matched Dutch population. During
subsequent steps patients with scores within the next ten percentiles were added to the population
and calculations were repeated until survival significantly deviated from that of the matched normal
population (non-responders). Data of the matched population, a population with a life-expectancy
comparable with that of the other participating countries, were retrieved from a Dutch registry
(Statistics Netherlands, www.cbs.nl). The performance of the GLOBE score using this threshold was
assessed with sensitivity, specificity, negative predictive value and positive predictive value at 5- and
10-year follow-up. For this purpose a GLOBE score below the aforementioned threshold was
considered as a positive test and the absence of adverse outcome was considered as an event.
The overall predictive performance of previously reported tools (the Barcelona,9 Paris-1,
10
Rotterdam,11
Toronto12
and Paris-2 criteria13
) was assessed with C statistic. To quantify the
improvement in discriminative ability the net reclassification improvement (NRI) for both events and
non-events23, 24
during the first 5 and 10 years follow-up was calculated.
All analyses were 2 sided. P <.05 was considered statistically significant if not otherwise
specified. Statistical analyses were performed with IBM SPSS Statistics 22.0 (SPSS Inc, Chicago, IL,
USA) and SAS 9.3 (SAS institute, Cary, NC, USA).
MANUSCRIP
T
ACCEPTED
ACCEPTED MANUSCRIPT
RESULTS
Clinical characteristics of the derivation cohort
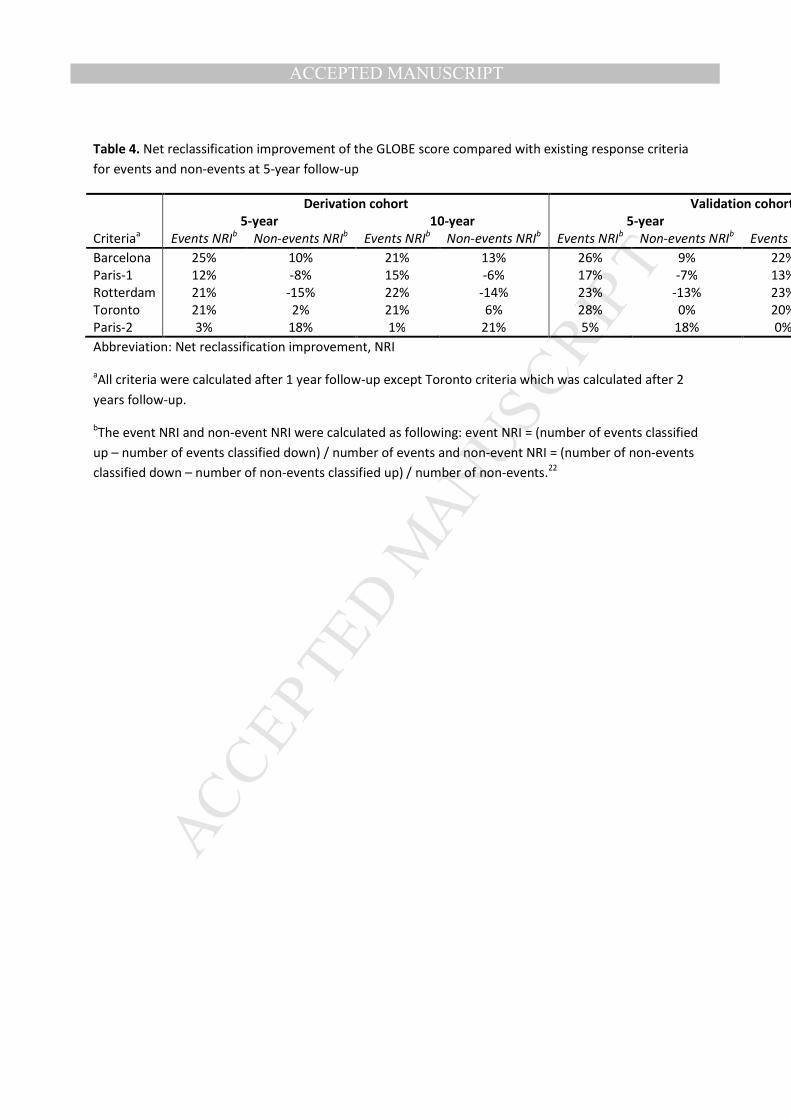
The derivation cohort consisted of 2488 subjects with PBC, with a median age of 54.6 years at the
time of diagnosis (Table 1). During a median follow-up of 7.8 years (interquartile range (IQR) 4.0-
12.1) 558 patients reached a clinical endpoint; 369 patients died and 189 patients underwent liver
transplantation (center specific characteristics are described in Supplementary Table 1). The 5-, 10-
and 15-year transplant-free survival rates were 90.0%, 77.5% and 65.6% respectively, as shown in
Figure 1.
Construction of the GLOBE score
Following univariate Cox regression analyses older age at start of UDCA therapy, male sex, elevated
serum bilirubin, alkaline phosphatase, AST and ALT levels, lower serum albumin levels and
thrombocytopenia and higher AST/ALT and APRI ratios after one year of UDCA therapy were all
associated with higher risk of liver transplantation or death (Table 2). The final penalized
multivariable model comprised age, bilirubin, albumin, alkaline phosphatase and platelet count as
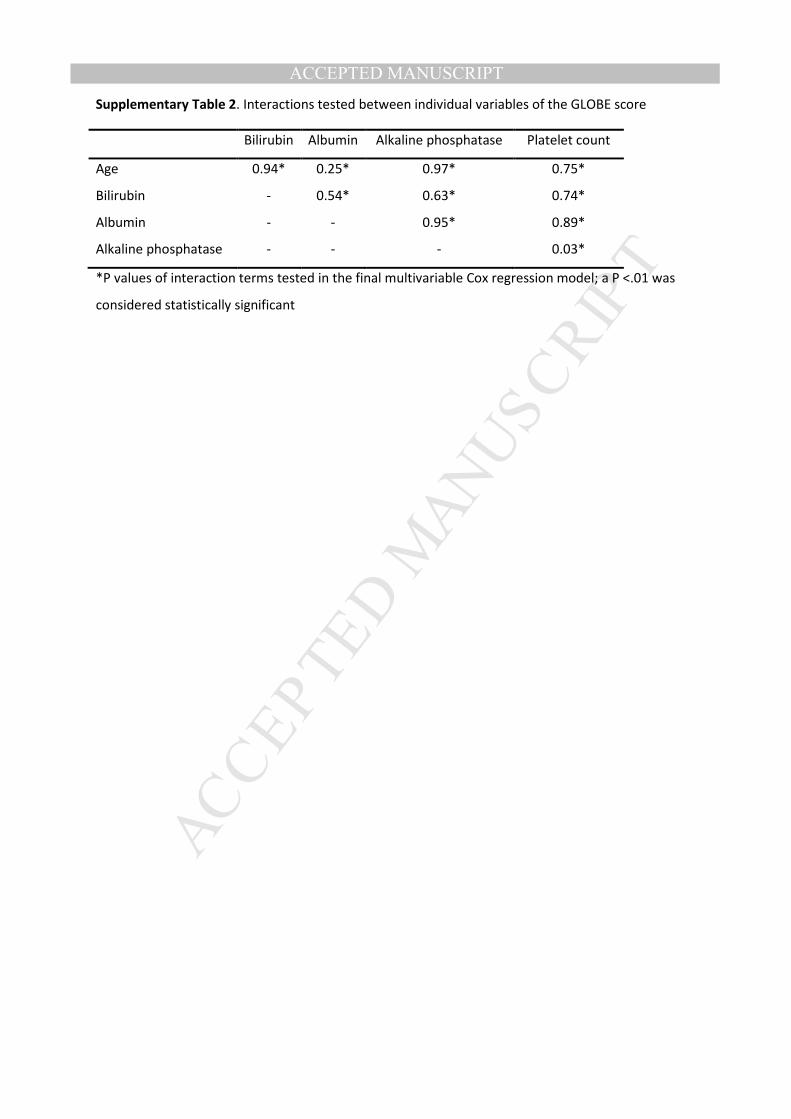
independent predictors of liver transplantation or death (Table 2). No significant interactions were
found between these variables (Supplementary Table 2).
The GLOBE score was calculated as follows:
GLOBE score = (0.044378 * age at start of UDCA therapy + 0.93982 * LN(bilirubin times the upper
limit of normal (ULN) at 1 year follow-up)) + (0.335648 * LN(alkaline phosphatase times the ULN at 1
year follow-up)) – 2.266708 * albumin level times the lower limit of normal (LLN) at 1 year follow-up
– 0.002581 * platelet count per 109/L at 1 year follow-up) + 1.216865.
MANUSCRIP
T
ACCEPTED
ACCEPTED MANUSCRIPT
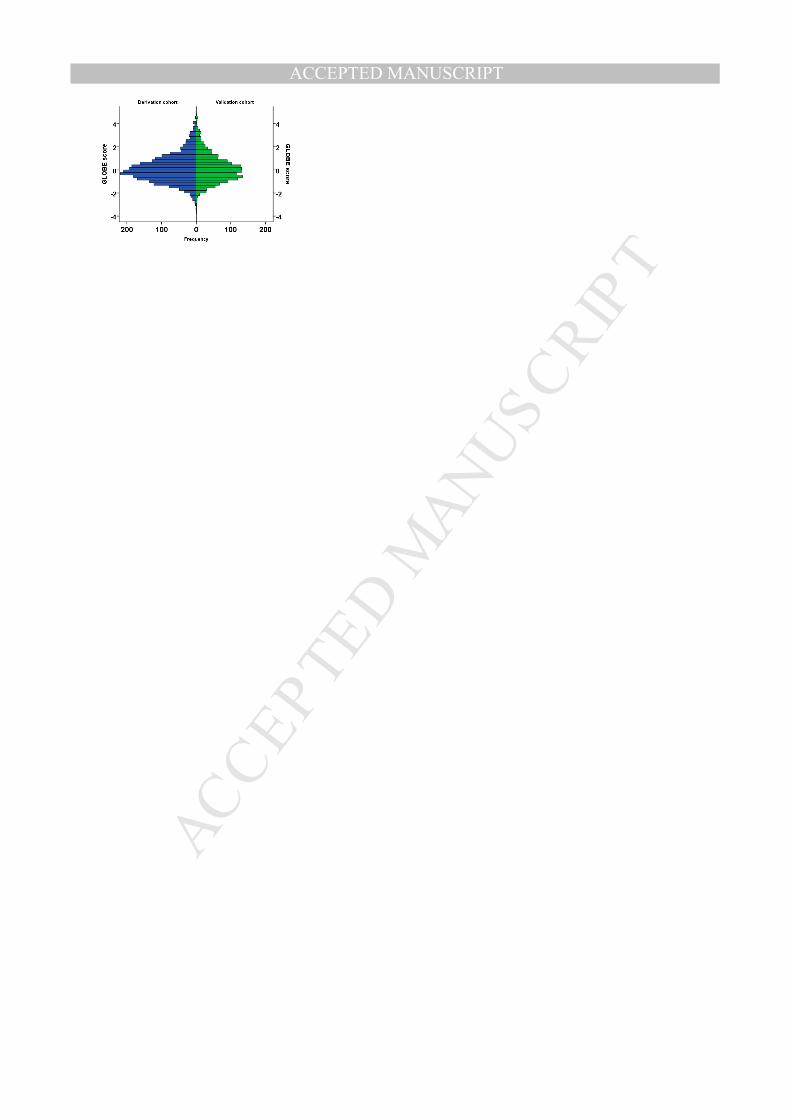
The distribution of the GLOBE score is plotted in Supplementary Figure 1. The baseline survival
curve at the mean GLOBE score S0(t) was: 0.9652, 0.9385, 0.8429, 0.7361 at 3-, 5-, 10- and 15-year
follow-up respectively. The survival S(t) for any given patients was then calculated by S(t) = S0(t)
exp(GLOBE score).
Example:
For a 50-year old patient with a bilirubin level of 1 time the ULN, an alkaline phosphatase level of 3
times the ULN, an albumin level of 1.5 time the LLN and a platelet count of 250 per 109/L:
GLOBE score = 0.64; transplant-free survival at 5-year, S(5) = 88.6% and at 10-year, S(10) = 72.2%.
The overall predictive ability of the GLOBE score for transplantation or death, calculated with C
statistic, was 0.81 (95% CI, 0.79-0.83).
Validation of the GLOBE score
The clinical characteristics of the validation cohort (n=1631) are described in Table 1. During a
median follow-up time of 7.5 years (IQR 3.8-11.8) 328 patients reached a clinical endpoint; 197 died
and 131 received a liver transplant (center specific characteristics are described in Supplementary
Table 1). The 5-, 10- and 15-year transplant-free survival rates were 90.0%, 79.6% and 66.3%
respectively and not significantly different from those observed in the derivation cohort (Figure 1).
A comparable overall discriminative ability was found as in the derivation cohort (C statistic
0.82, 95% CI 0.79-0.84). To explore to what extent the GLOBE score might be influenced by the
imputation process for missing variables, the discriminative ability of the GLOBE score was
additionally tested in cases with complete data. These analysis showed comparable results (C
statistic derivation cohort: 0.82, 95% CI 0.78-0.86 and validation: 0.83, 95% CI 0.79-0.86).
MANUSCRIP
T
ACCEPTED
ACCEPTED MANUSCRIPT
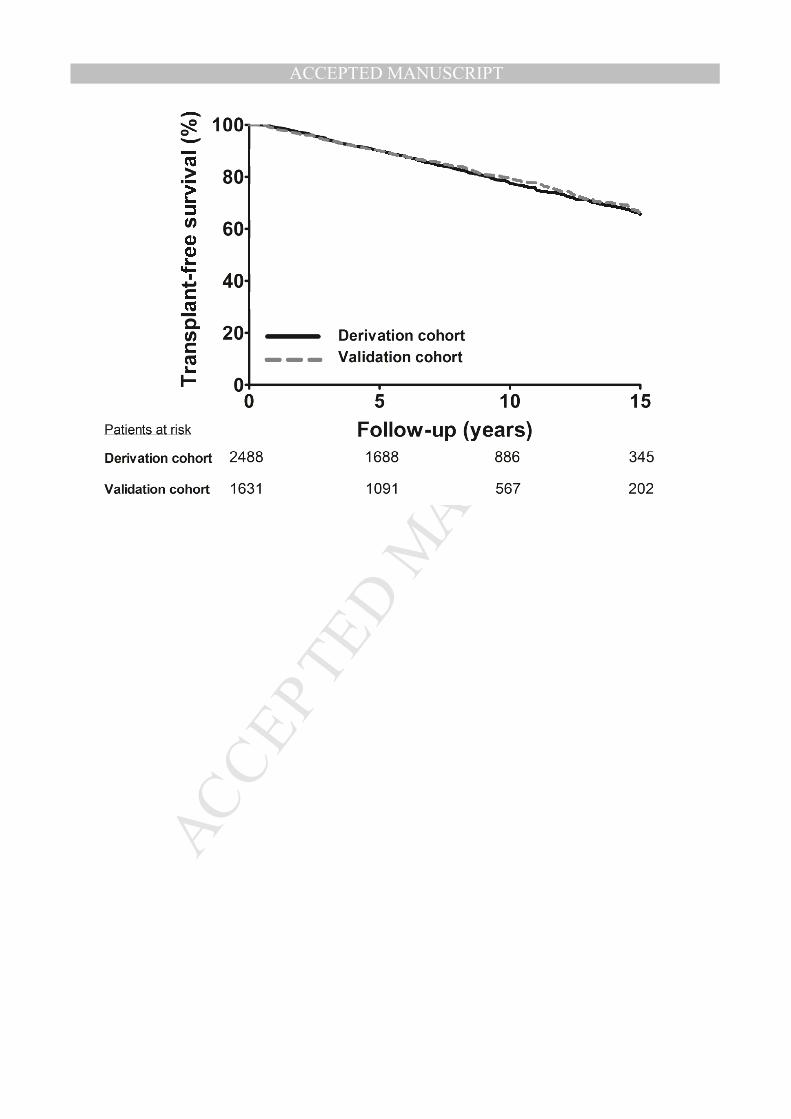
The discriminative ability of the GLOBE score was visualised by plotting the transplant-free
survival curves for 5 risk groups according to the 10th
, 40th
, 60th
and 90th
percentiles of the score
(Figure 2). Good separation was shown for the survival curves of the 5 risk groups.
There was a good agreement between the curves in the derivation and validation cohort as
shown in Figure 2, with a good model fit (calibration slope, P value=0.64). No re-calibration of the
GLOBE score was necessary, when calculating the regression coefficient on the prognostic index (P
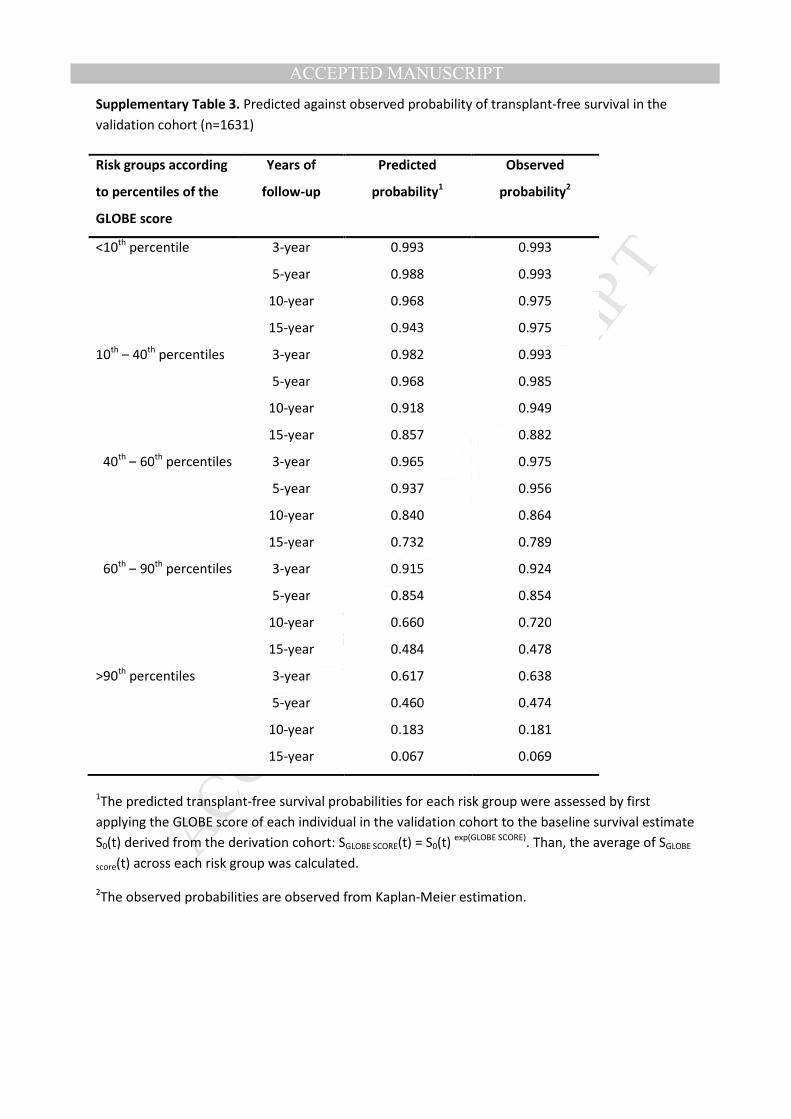
value=0.22). Further, the predicted survival probabilities corresponded well with the observed
survival probabilities (Supplementary Table 3).
Application of the GLOBE score
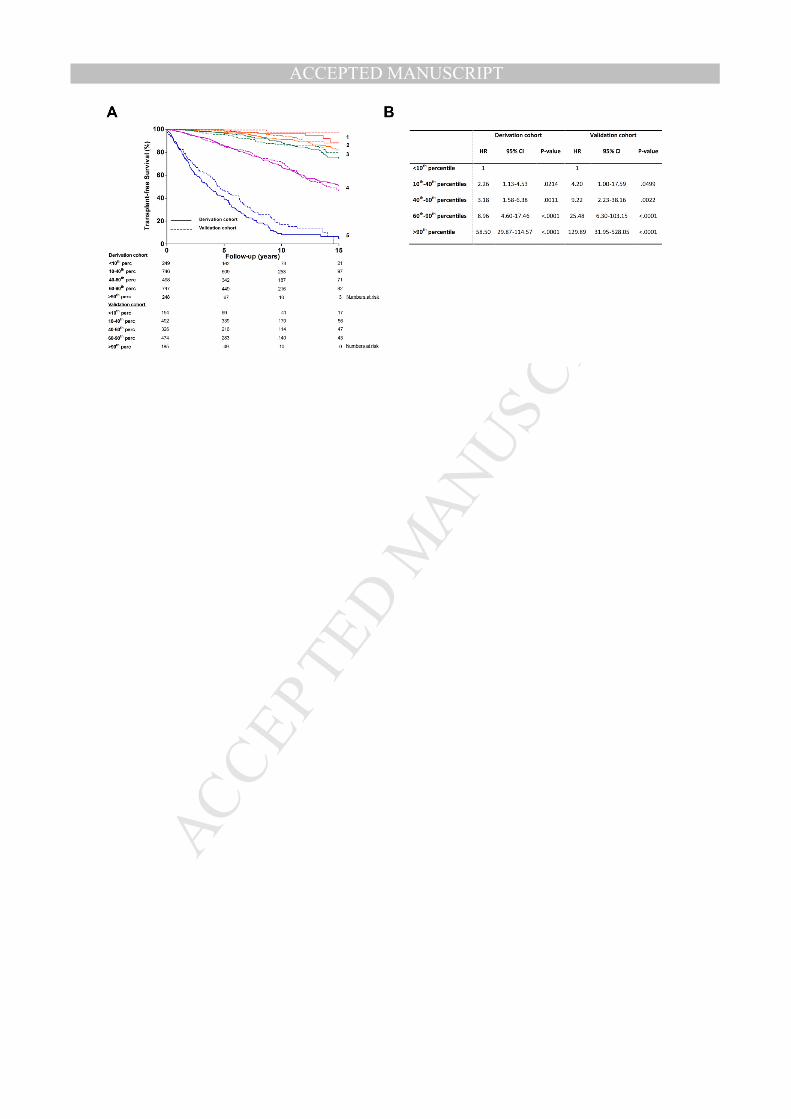
An overall threshold was determined for the GLOBE score in the derivation cohort beyond which
prognosis of patients significantly deviated from a normal life-expectancy (non-responders). Patients
with a GLOBE score above 0.30, which applied to 40% of cases, had a significantly diminished
survival compared with a matched general population (HR 5.51, 95%CI 4.52-6.72, P value <.0001),
with 5-, 10- and 15-year transplant-free survival rates of 79.7%, 57.4%, 42.5% respectively. Patients
with a GLOBE score of 0.30 or less (responders) had a life-expectancy comparable with a matched
general population; the 5-, 10- and 15-year transplant-free survival rates were 98.0%, 92.0%, 82.3%
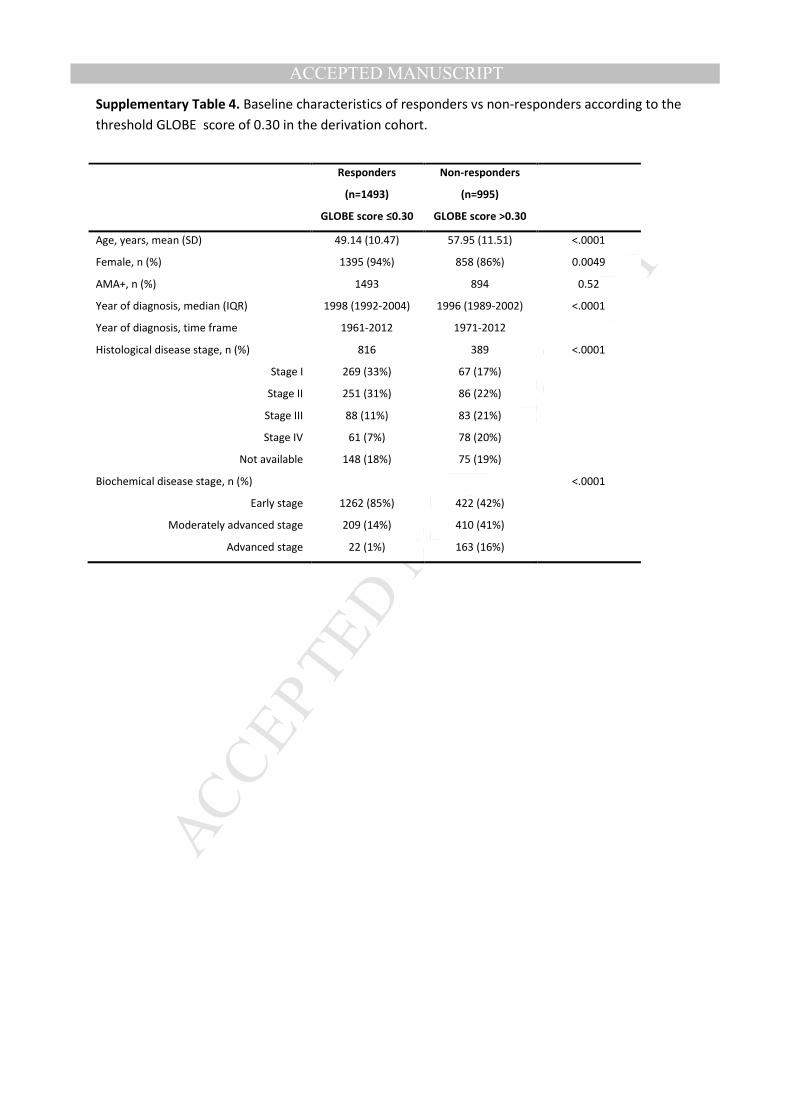
respectively (p-value: <.0001) (Figure 3). Non-responders were significantly more often at a late
stage of disease at baseline than responders (Supplementary Table 4).
The performance of the GLOBE score was assessed using the aforementioned threshold. A
high positive predictive value was found at 5-year follow-up (1057/1084, 98%) and at 10-year follow-
up (588/669, 88%), implying that the probability of reaching an adverse outcome is very low for
patients identified as a responder. Also a high specificity was found at 5-year follow-up (193/220,
88%) and 10-year follow-up (328/409, 80%) which means that the majority of patients with an
adverse outcome were identified as non-responder. Additionally, we found a sensitivity of 65%
MANUSCRIP
T
ACCEPTED
ACCEPTED MANUSCRIPT
(1057/1623) at 5-year and 69% at 10-year (588/857) follow-up and a low negative predictive value at
5-year (193/759, 25%) and at 10-year (328/597, 55%) follow-up.
The performance of the GLOBE score compared with other criteria
The overall discriminative ability of the GLOBE score was superior in comparison with previously
proposed stratification tools9-13
(Table 3). To quantify the improvement in discriminative ability the
NRI for both events and non-events in the validation set was calculated.23
The percentage of patients
with an event at 5- and 10-year follow-up that were correctly reclassified with the GLOBE score as
compared with existing criteria ranged from 3% to 25% and 1% to 22% respectively, and in patients
without an event at 5- and 10-year follow-up the NRI ranged from -15% to 18% and -14% to 21%
respectively (Table 4).
The performance of the GLOBE score among different age groups, disease severity groups and at
different time points
Additionally, we created five equal age groups (<45, 45-52, 52-58, 58-66 and ≥66 years), to perform
an in-depth analysis of the threshold per age group. Patients within these groups were separately
matched with an age- and sex-matched population and thresholds of -0.52, 0.01, 0.60, 1.01 and 1.69
respectively were determined. When using these thresholds 70%, 50%, 30%, 20% and 10%
respectively of patients had a diminished survival compared with a matched population.
Importantly, this implies that older patients inevitably may derive les impact ultimately from
additional therapies.
Within the derivation cohort the performance of the GLOBE score was tested within a
subgroup of patients with histological early stage PBC (n=673), defined as stage I or II and a
subgroup of patients with histological late stage PBC (n=309), defined as stage III or IV. In the early
stage subgroup 280/1090 (26%) patients had a survival significantly deviating from that of a matched
population and this were 373/540 (69%) patients in the advanced stage subgroup. In both subgroups
MANUSCRIP
T
ACCEPTED
ACCEPTED MANUSCRIPT
the predictive ability of the score was satisfactory with a C statistic of 0.81 (95% CI 0.76-0.86) in the
early stage subgroup and 0.78 (95% CI 0.74-0.83) in the late stage. Comparable results were found
when repeating these analyses in the validation cohort; with a C statistic in the early stage (n=448) of
0.85 (0.79-0.91) and in the late stage (n=212) of 0.79 (0.72-0.86).
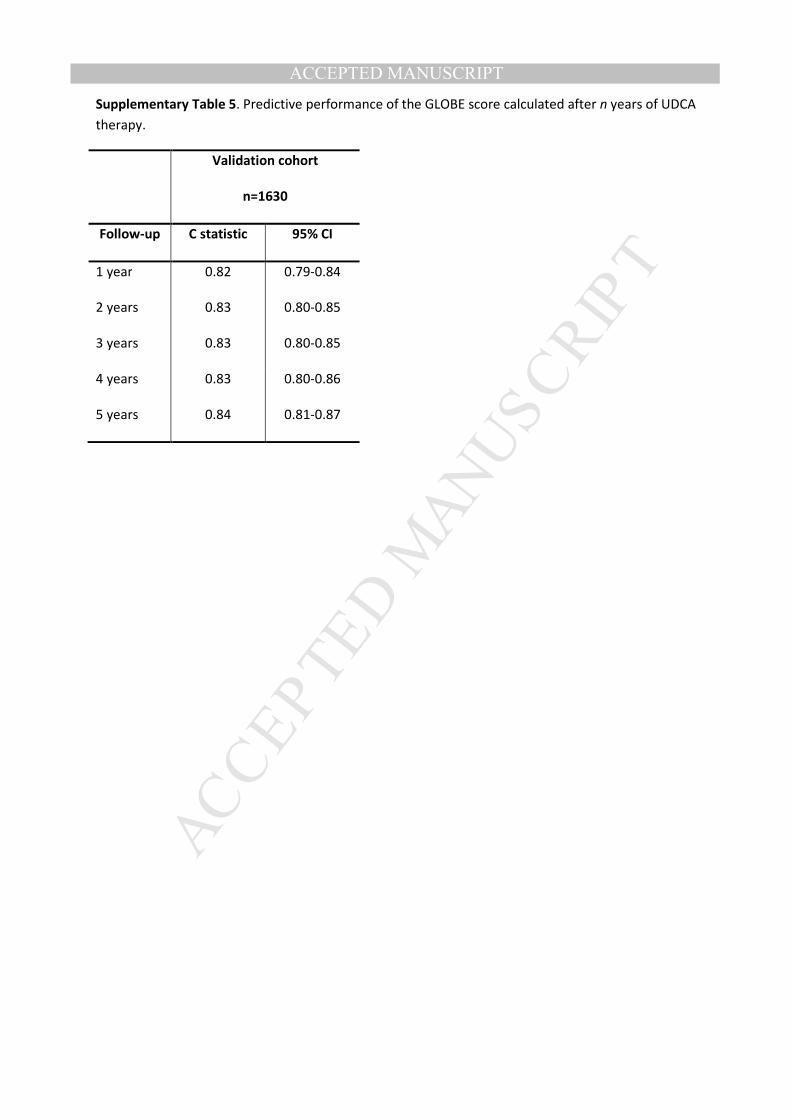
Importantly, the risk score was calculated based on lab values collected 1 y after UDCA
therapy, but transplant-free survival could still be accurately calculated by the GLOBE score with
laboratory values collected at 2–5 y after treatment (Supplementary Table 5).
MANUSCRIP
T
ACCEPTED
ACCEPTED MANUSCRIPT
DISCUSSION
In this study of over 4000 UDCA treated patients with PBC from across Europe and North America
we present the GLOBE score, an internationally relevant and validated risk assessment tool, able to
accurately stratify patients to high and low risk. The score comprises five simple, readily available
and objective variables: age, bilirubin, albumin, alkaline phosphatase and platelet count. Moreover,
through robust evaluation and validation we demonstrate appropriate test characteristics in
subgroups with early and advanced disease. Most importantly, the prognostic ability of the score
was found to be markedly superior to previously proposed criteria for (non-)response to UDCA. The
score has utility for patients managed with PBC internationally, as a means to more readily stratify
risk of adverse outcomes, and hence tailor patient education. In particular, in an era of potential new
therapies the GLOBE score is better able than current stratification tools to highlight patients at
greatest need for new therapies. Of further relevance to the health economics of PBC, the GLOBE
score improves capacity to identify individuals in whom UDCA mono-therapy should be continued,
with opportunities to de-escalate care back to their primary care provider.
Previous studies have extensively documented the prognostic importance of the individual
components of the GLOBE score. In particular, age, bilirubin and albumin have been recognized as
important predictors of survival in PBC, irrespective of UDCA treatment7, 8, 25, 26
In general, age and
mortality are strongly correlated and not surprisingly age proved to be an independent predictor of
liver transplantation or death in present study. Serum bilirubin is generally considered the strongest
and most independent predictor of outcome in PBC,18, 27-29
and is a main component of prognostic
models25, 30-32
and response criteria in PBC.10, 11, 13, 33
Serum bilirubin levels normally increase
relatively late in the course of disease. However, its predictive value is not limited to late stage
disease, as suggested by our previous finding that even in patients with normal levels, prognosis
improves as levels fall.18
Alkaline phosphatase levels are of key importance in establishing the
diagnosis PBC.2, 3
Changes in alkaline phosphatase levels have previously been documented to
MANUSCRIP
T
ACCEPTED
ACCEPTED MANUSCRIPT
provide significant prognostic information, both in UDCA treated9, 10, 12, 13, 18, 34
and untreated PBC.18
Finally, the platelet count, generally considered as a marker of portal hypertension,35
has been
validated as an independent predictor of outcome in addition to current biochemical response
criteria.15, 36
Although some of the factors comprising the score, such as bilirubin and albumin, will
change relatively late in the course of disease, the GLOBE score performed well in patients with early
stage disease. This is probably largely explained by the well-documented strong predictive
significance of alkaline phosphatase values, even in cases with normal bilirubin.18
Our score provides improved identification of patients insufficiently responding to UDCA in
comparison with previously reported criteria (Table 3). As reflected by the high positive predictive
value, responders to UDCA according to the GLOBE score are at low risk for future adverse events.
Therefore these patients can reliably be advised to continue with UDCA mono-therapy. The GLOBE
score also allows more reliable identification of patients likely to have a future unfavourable health
outcome. Thus, for healthcare providers the GLOBE score provides an improved instrument for
selecting candidate patients for additional, second-line therapies. The superior performance of our
score is likely attributable to the effect of dichotomization of every single variable in previously
proposed response criteria. Dichotomization of continuous variables inevitably will have led to loss
of predictive ability.37
Moreover, age, as a recognized major predictor of survival, was included in our
score. Importantly, we confirm that younger patients have the potential to benefit more from
additional PBC therapies than older patients.14
Finally, the methodological approach to base the
score on a prognostic index, corresponding with a continuum of possible outcomes, is an important
factor explaining improved ability to reliably estimate prognosis using the GLOBE score.
Other predictors of outcome in PBC have been suggested, including liver histology and
elastography.38, 39
Liver histology has important prognostic meaning,38
but in the majority of cases
liver biopsy is not considered necessary for diagnosis.3 Moreover, given other disadvantages, such as
its invasive character, sampling error and inter-observer variation, liver biopsy is no longer routinely
MANUSCRIP
T
ACCEPTED
ACCEPTED MANUSCRIPT
performed in the management of PBC patients. Non-invasive assessment of liver fibrosis with
transient elastography is an interesting alternative,39
but data supporting this technique as an
important clinical tool are still limited and further validation is required. Elastography may be less
suitable for assessing the response to medical treatment, especially after a relatively short duration
of treatment, as PBC is a slowly progressive disease, suggesting it might take longer before reliably
detectable changes in liver stiffness will ensue.4-6
Biochemical markers are routinely checked during
yearly check-up of PBC patients, and levels of biochemical variables after a short period of UDCA
treatment are strongly associated with long-term outcome.9-13, 18, 34
Considering the fact that
biochemical markers are easily obtainable and readily available, they seem more attractive and
preferable for first-line patient stratification.
A potential limitation to our study is the use of reference population data originating from
only one country, namely the Netherlands, for developing the Global PBC Study Group Score.
However, according to life table data of the World Health Organisation (WHO) life expectancy was
comparable among the countries involved in this study.40
Therefore, this may not be a factor of
major relevance. Further, we were not able to take into account other laboratory variables of
potential interest in PBC, such as gamma-GT, IgM, IgG and prothrombin time. Due to the nature of
our study laboratory data were also not always fully complete, especially when inclusion in the
original cohort studies occurred more than 15-20 years ago. However, considering the exceptionally
large dataset, we believe our results are sufficiently robust, as well as notably representative. Finally,
the reliability of our findings is supported by the validation of the prognostic model in a separate
population of considerable size. The complex calculation of the GLOBE score has been simplified by
the development of a web application to improve its usage in clinical practice (www.globalpbc.com).
In conclusion, we demonstrate that the prognosis of patients with PBC, irrespective of the
stage of disease, who have been treated with UDCA for one year can be readily determined using a
de novo derived and validated, risk calculation. Our score performs significantly better than thus far
proposed criteria for response to UDCA thereby providing internationally representative data to
MANUSCRIP
T
ACCEPTED
ACCEPTED MANUSCRIPT
quantify the needs of low- and high-risk patients with PBC. The GLOBE score therefore complements
efforts to develop and implement a more stratified, evidence-based, approach to the care of
patients with PBC.
MANUSCRIP
T
ACCEPTED
ACCEPTED MANUSCRIPT
REFERENCES
1. Selmi C, Bowlus CL, Gershwin ME, et al. Primary biliary cirrhosis. Lancet 2011;377:1600-9.
2. Lindor KD, Gershwin ME, Poupon R, et al. Primary biliary cirrhosis. Hepatology 2009;50:291-
308.
3. European Association for the Study of the L. EASL Clinical Practice Guidelines: management
of cholestatic liver diseases. J Hepatol 2009;51:237-67.
4. Angulo P, Batts KP, Therneau TM, et al. Long-term ursodeoxycholic acid delays histological
progression in primary biliary cirrhosis. Hepatology 1999;29:644-7.
5. Corpechot C, Carrat F, Bonnand AM, et al. The effect of ursodeoxycholic acid therapy on liver
fibrosis progression in primary biliary cirrhosis. Hepatology 2000;32:1196-9.
6. Poupon RE, Lindor KD, Pares A, et al. Combined analysis of the effect of treatment with
ursodeoxycholic acid on histologic progression in primary biliary cirrhosis. J Hepatol
2003;39:12-6.
7. Corpechot C, Carrat F, Bahr A, et al. The effect of ursodeoxycholic acid therapy on the
natural course of primary biliary cirrhosis. Gastroenterology 2005;128:297-303.
8. ter Borg PC, Schalm SW, Hansen BE, et al. Prognosis of ursodeoxycholic Acid-treated patients
with primary biliary cirrhosis. Results of a 10-yr cohort study involving 297 patients. Am J
Gastroenterol 2006;101:2044-50.
9. Pares A, Caballeria L, Rodes J. Excellent long-term survival in patients with primary biliary
cirrhosis and biochemical response to ursodeoxycholic Acid. Gastroenterology
2006;130:715-20.
10. Corpechot C, Abenavoli L, Rabahi N, et al. Biochemical response to ursodeoxycholic acid and
long-term prognosis in primary biliary cirrhosis. Hepatology 2008;48:871-7.
11. Kuiper EM, Hansen BE, de Vries RA, et al. Improved prognosis of patients with primary biliary
cirrhosis that have a biochemical response to ursodeoxycholic acid. Gastroenterology
2009;136:1281-7.
MANUSCRIP
T
ACCEPTED
ACCEPTED MANUSCRIPT
12. Kumagi T, Guindi M, Fischer SE, et al. Baseline ductopenia and treatment response predict
long-term histological progression in primary biliary cirrhosis. Am J Gastroenterol
2010;105:2186-94.
13. Corpechot C, Chazouilleres O, Poupon R. Early primary biliary cirrhosis: biochemical response
to treatment and prediction of long-term outcome. J Hepatol 2011;55:1361-7.
14. Carbone M, Mells GF, Pells G, et al. Sex and age are determinants of the clinical phenotype
of primary biliary cirrhosis and response to ursodeoxycholic acid. Gastroenterology
2013;144:560-569 e7; quiz e13-4.
15. Trivedi PJ, Bruns T, Cheung A, et al. Optimising risk stratification in primary biliary cirrhosis:
AST/platelet ratio index predicts outcome independent of ursodeoxycholic acid response. J
Hepatol 2014;60:1249-58.
16. Trivedi PJ, Lammers WJ, van Buuren HR, et al. Stratification of hepatocellular carcinoma risk
in primary biliary cirrhosis: a multicentre international study. Gut 2015.
17. Lammers WJ, van Buuren HR, Pares A, et al. Defining optimal laboratory response cirteria in
UDCA treated primary biliary cirrhosis. Results of an international multicenter long-term
follow-up study. Hepatology 2013;58:249A.
18. Lammers WJ, van Buuren HR, Hirschfield GM, et al. Levels of Alkaline Phosphatase and
Bilirubin Are Surrogate End Points of Outcomes of Patients With Primary Biliary Cirrhosis: An
International Follow-up Study. Gastroenterology 2014;147:1338-49.
19. Little R, Rubin D. Statistical analysis with missing data. New York, NY: John Wiley & Sons, Inc.,
1987.
20. Goeman JJ. L1 penalized estimation in the Cox proportional hazards model. Biom J
2010;52:70-84.
21. Steyerberg EW. Clinical prediction models: a practical approach to development, validation,
and updating. New York: Springer, 2009.
MANUSCRIP
T
ACCEPTED
ACCEPTED MANUSCRIPT
22. Royston P, Altman DG. External validation of a Cox prognostic model: principles and
methods. BMC Med Res Methodol 2013;13:33.
23. Pencina MJ, D'Agostino RB, Sr., D'Agostino RB, Jr., et al. Evaluating the added predictive
ability of a new marker: from area under the ROC curve to reclassification and beyond. Stat
Med 2008;27:157-72; discussion 207-12.
24. Leening MJ, Vedder MM, Witteman JC, et al. Net reclassification improvement:
computation, interpretation, and controversies: a literature review and clinician's guide. Ann
Intern Med 2014;160:122-31.
25. Dickson ER, Grambsch PM, Fleming TR, et al. Prognosis in primary biliary cirrhosis: model for
decision making. Hepatology 1989;10:1-7.
26. Christensen E, Neuberger J, Crowe J, et al. Beneficial effect of azathioprine and prediction of
prognosis in primary biliary cirrhosis. Final results of an international trial. Gastroenterology
1985;89:1084-91.
27. Shapiro JM, Smith H, Schaffner F. Serum bilirubin: a prognostic factor in primary biliary
cirrhosis. Gut 1979;20:137-40.
28. Krzeski P, Zych W, Kraszewska E, et al. Is serum bilirubin concentration the only valid
prognostic marker in primary biliary cirrhosis? Hepatology 1999;30:865-9.
29. Bonnand AM, Heathcote EJ, Lindor KD, et al. Clinical significance of serum bilirubin levels
under ursodeoxycholic acid therapy in patients with primary biliary cirrhosis. Hepatology
1999;29:39-43.
30. Child CG, Turcotte JG. Surgery and portal hypertension. Major Probl Clin Surg 1964;1:1-85.
31. Pugh RN, Murray-Lyon IM, Dawson JL, et al. Transection of the oesophagus for bleeding
oesophageal varices. Br J Surg 1973;60:646-9.
32. Kamath PS, Wiesner RH, Malinchoc M, et al. A model to predict survival in patients with end-
stage liver disease. Hepatology 2001;33:464-70.
MANUSCRIP
T
ACCEPTED
ACCEPTED MANUSCRIPT
33. Momah N, Silveira MG, Jorgensen R, et al. Optimizing biochemical markers as endpoints for
clinical trials in primary biliary cirrhosis. Liver Int 2012;32:790-5.
34. Angulo P, Lindor KD, Therneau TM, et al. Utilization of the Mayo risk score in patients with
primary biliary cirrhosis receiving ursodeoxycholic acid. Liver 1999;19:115-21.
35. Patanwala I, McMeekin P, Walters R, et al. A validated clinical tool for the prediction of
varices in PBC: The Newcastle Varices in PBC Score. J Hepatol 2013;59:327-35.
36. Joshita S, Umemura T, Ota M, et al. AST/platelet ratio index associates with progression to
hepatic failure and correlates with histological fibrosis stage in Japanese patients with
primary biliary cirrhosis. J Hepatol 2014.
37. Royston P, Altman DG, Sauerbrei W. Dichotomizing continuous predictors in multiple
regression: a bad idea. Stat Med 2006;25:127-41.
38. Roll J, Boyer JL, Barry D, et al. The prognostic importance of clinical and histologic features in
asymptomatic and symptomatic primary biliary cirrhosis. N Engl J Med 1983;308:1-7.
39. Corpechot C, Carrat F, Poujol-Robert A, et al. Noninvasive elastography-based assessment of
liver fibrosis progression and prognosis in primary biliary cirrhosis. Hepatology 2012;56:198-
208.
40. http://www.who.int/.
Authors names in bold designate shared co-first authors
MANUSCRIP
T
ACCEPTED
ACCEPTED MANUSCRIPT
FIGURE LEGENDS
Figure 1. Liver transplant-free survival probability.
Transplant-free survival probability of patients with primary biliary cirrhosis in the derivation cohort
(N = 2488, solid line) and the validation cohort (N = 1631,dotted line).
Figure 2. Liver transplant-free survival probability of risk groups according to the GLOBE score.
A). Transplant-free survival probability of 5 predefined risk groups according to percentiles of the
GLOBE score: (1) <10th
, (2) 10th
-40th
, (3) 40th
-60th
, (4) 60th
-90th
and (5) >90th
, and B). accompanying
hazard ratios between the risk groups in the derivation (N = 2488, solid line) and validation cohort (N
= 1631, dotted line).
Figure 3. Liver transplant-free survival probability using a GLOBE score threshold.
Transplant-free survival probability of patients with a GLOBE score of 0.30 or less compared with an
age-, sex- and calendar-time matched population for patients within (A) the derivation and (C) the
validation cohort, and for those with a GLOBE score greater than 0.30 this probability significantly
deviated for patients within (B) the derivation and (D) the validation cohort.
MANUSCRIP
T
ACCEPTED
ACCEPTED MANUSCRIPT
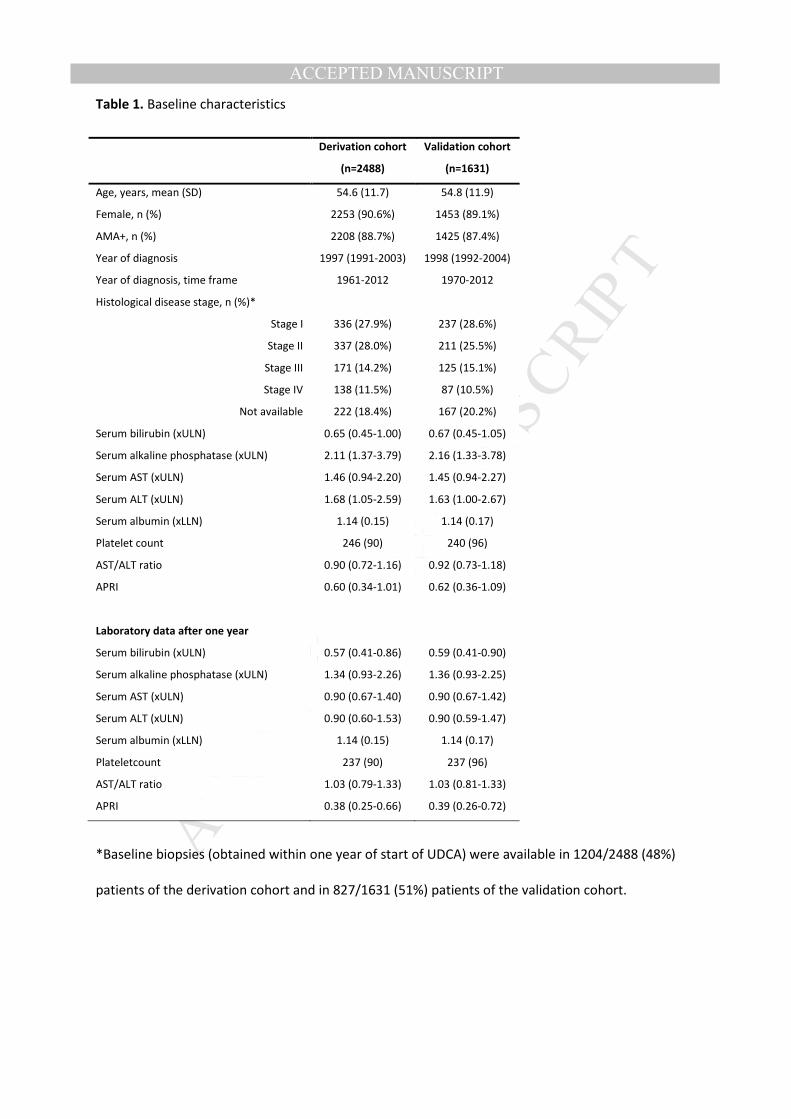
Table 1. Baseline characteristics
*Baseline biopsies (obtained within one year of start of UDCA) were available in 1204/2488 (48%)
patients of the derivation cohort and in 827/1631 (51%) patients of the validation cohort.
Derivation cohort
(n=2488)
Validation cohort
(n=1631)
Age, years, mean (SD) 54.6 (11.7) 54.8 (11.9)
Female, n (%) 2253 (90.6%) 1453 (89.1%)
AMA+, n (%) 2208 (88.7%) 1425 (87.4%)
Year of diagnosis 1997 (1991-2003) 1998 (1992-2004)
Year of diagnosis, time frame 1961-2012 1970-2012
Histological disease stage, n (%)*
Stage I 336 (27.9%) 237 (28.6%)
Stage II 337 (28.0%) 211 (25.5%)
Stage III 171 (14.2%) 125 (15.1%)
Stage IV 138 (11.5%) 87 (10.5%)
Not available 222 (18.4%) 167 (20.2%)
Serum bilirubin (xULN) 0.65 (0.45-1.00) 0.67 (0.45-1.05)
Serum alkaline phosphatase (xULN) 2.11 (1.37-3.79) 2.16 (1.33-3.78)
Serum AST (xULN) 1.46 (0.94-2.20) 1.45 (0.94-2.27)
Serum ALT (xULN) 1.68 (1.05-2.59) 1.63 (1.00-2.67)
Serum albumin (xLLN) 1.14 (0.15) 1.14 (0.17)
Platelet count 246 (90) 240 (96)
AST/ALT ratio 0.90 (0.72-1.16) 0.92 (0.73-1.18)
APRI 0.60 (0.34-1.01) 0.62 (0.36-1.09)
Laboratory data after one year
Serum bilirubin (xULN) 0.57 (0.41-0.86) 0.59 (0.41-0.90)
Serum alkaline phosphatase (xULN) 1.34 (0.93-2.26) 1.36 (0.93-2.25)
Serum AST (xULN) 0.90 (0.67-1.40) 0.90 (0.67-1.42)
Serum ALT (xULN) 0.90 (0.60-1.53) 0.90 (0.59-1.47)
Serum albumin (xLLN) 1.14 (0.15) 1.14 (0.17)
Plateletcount 237 (90) 237 (96)
AST/ALT ratio 1.03 (0.79-1.33) 1.03 (0.81-1.33)
APRI 0.38 (0.25-0.66) 0.39 (0.26-0.72)
MANUSCRIP
T
ACCEPTED
ACCEPTED MANUSCRIPT
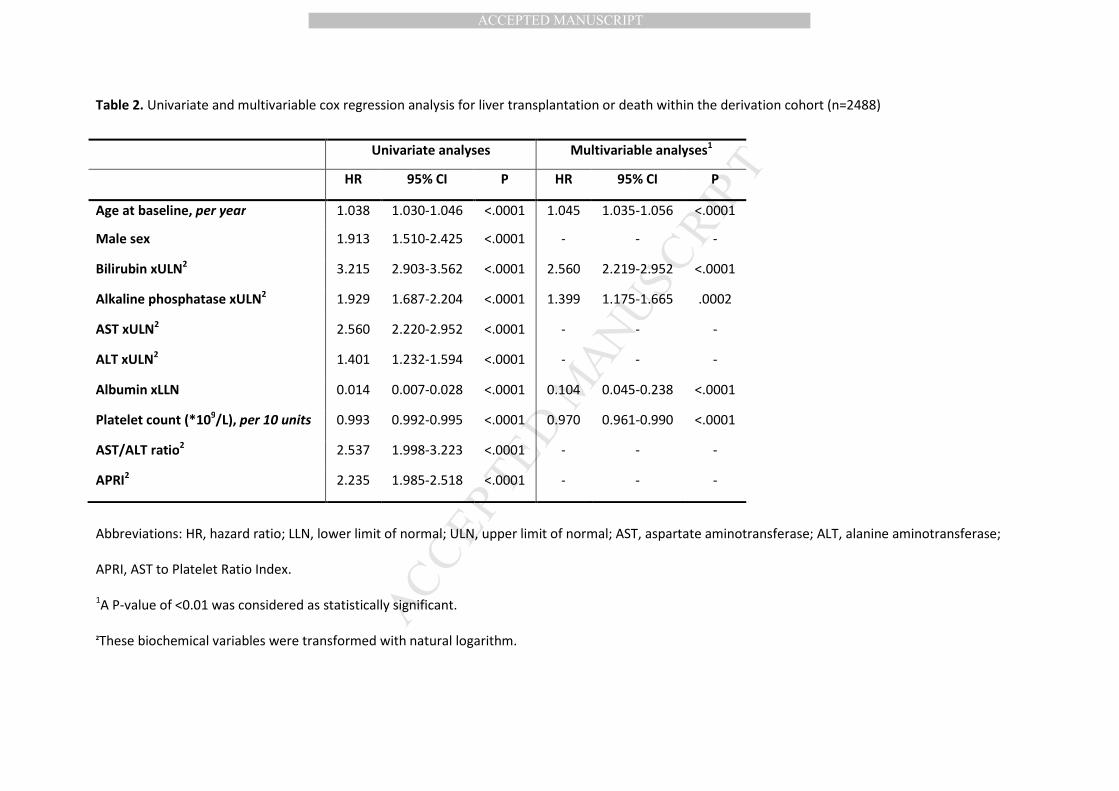
Table 2. Univariate and multivariable cox regression analysis for liver transplantation or death within the derivation cohort (n=2488)
Abbreviations: HR, hazard ratio; LLN, lower limit of normal; ULN, upper limit of normal; AST, aspartate aminotransferase; ALT, alanine aminotransferase;
APRI, AST to Platelet Ratio Index.
1A P-value of <0.01 was considered as statistically significant.
2These biochemical variables were transformed with natural logarithm.
Univariate analyses Multivariable analyses1
HR 95% CI P HR 95% CI P
Age at baseline, per year 1.038 1.030-1.046 <.0001 1.045 1.035-1.056 <.0001
Male sex 1.913 1.510-2.425 <.0001 - - -
Bilirubin xULN2 3.215 2.903-3.562 <.0001 2.560 2.219-2.952 <.0001
Alkaline phosphatase xULN2 1.929 1.687-2.204 <.0001 1.399 1.175-1.665 .0002
AST xULN2 2.560 2.220-2.952 <.0001 - - -
ALT xULN2 1.401 1.232-1.594 <.0001 - - -
Albumin xLLN 0.014 0.007-0.028 <.0001 0.104 0.045-0.238 <.0001
Platelet count (*109/L), per 10 units 0.993 0.992-0.995 <.0001 0.970 0.961-0.990 <.0001
AST/ALT ratio2 2.537 1.998-3.223 <.0001 - - -
APRI2 2.235 1.985-2.518 <.0001 - - -
MANUSCRIP
T
ACCEPTED
ACCEPTED MANUSCRIPT
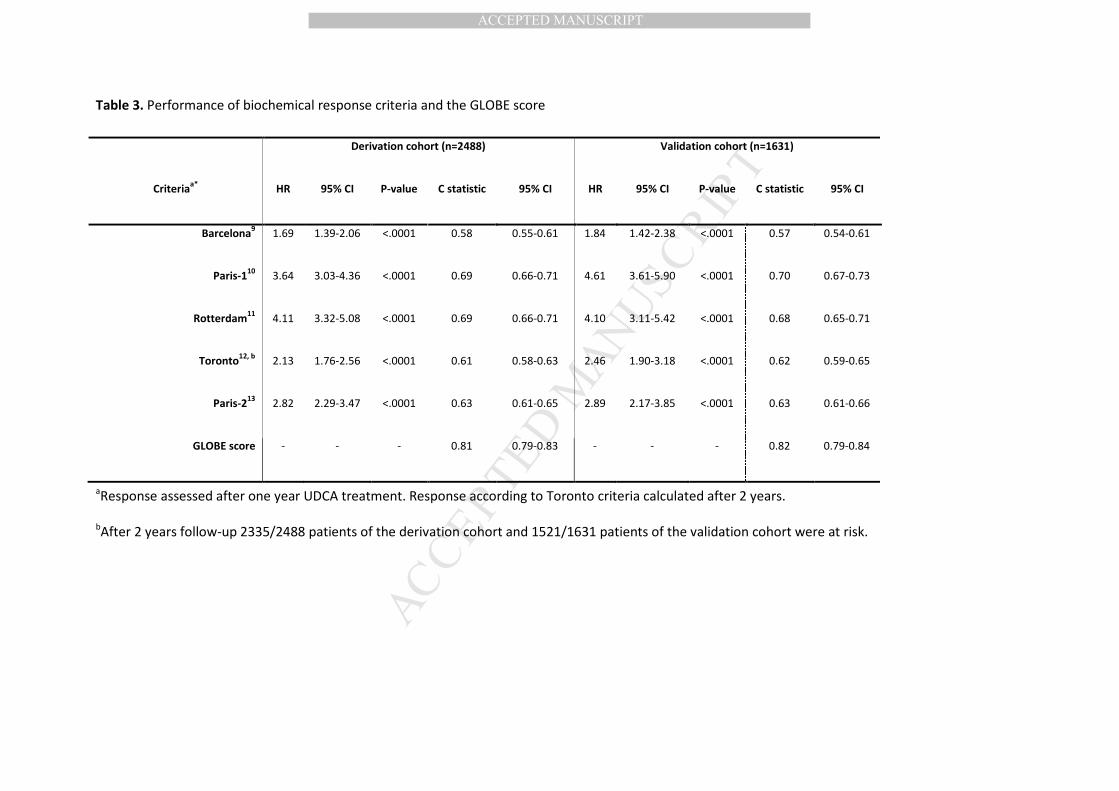
Table 3. Performance of biochemical response criteria and the GLOBE score
aResponse assessed after one year UDCA treatment. Response according to Toronto criteria calculated after 2 years.
bAfter 2 years follow-up 2335/2488 patients of the derivation cohort and 1521/1631 patients of the validation cohort were at risk.
Derivation cohort (n=2488) Validation cohort (n=1631)
Criteriaa*
HR 95% CI P-value C statistic 95% CI HR 95% CI P-value C statistic 95% CI
Barcelona9 1.69 1.39-2.06 <.0001 0.58 0.55-0.61 1.84 1.42-2.38 <.0001 0.57 0.54-0.61
Paris-110
3.64 3.03-4.36 <.0001 0.69 0.66-0.71 4.61 3.61-5.90 <.0001 0.70 0.67-0.73
Rotterdam11
4.11 3.32-5.08 <.0001 0.69 0.66-0.71 4.10 3.11-5.42 <.0001 0.68 0.65-0.71
Toronto12, b
2.13 1.76-2.56 <.0001 0.61 0.58-0.63 2.46 1.90-3.18 <.0001 0.62 0.59-0.65
Paris-213
2.82 2.29-3.47 <.0001 0.63 0.61-0.65 2.89 2.17-3.85 <.0001 0.63 0.61-0.66
GLOBE score - - - 0.81 0.79-0.83 - - - 0.82 0.79-0.84
MANUSCRIP
T
ACCEPTED
ACCEPTED MANUSCRIPT
Table 4. Net reclassification improvement of the GLOBE score compared with existing response criteria
for events and non-events at 5-year follow-up
Derivation cohort Validation cohort
5-year 10-year 5-year
Criteriaa Events NRI
b Non-events NRI
b Events NRI
b Non-events NRI
b Events NRI
b Non-events NRI
b Events NRI
Barcelona 25% 10% 21% 13% 26% 9% 22%
Paris-1 12% -8% 15% -6% 17% -7% 13%
Rotterdam 21% -15% 22% -14% 23% -13% 23%
Toronto 21% 2% 21% 6% 28% 0% 20%
Paris-2 3% 18% 1% 21% 5% 18% 0%
Abbreviation: Net reclassification improvement, NRI
aAll criteria were calculated after 1 year follow-up except Toronto criteria which was calculated after 2
years follow-up.
bThe event NRI and non-event NRI were calculated as following: event NRI = (number of events classified
up – number of events classified down) / number of events and non-event NRI = (number of non-events
classified down – number of non-events classified up) / number of non-events.22
MANUSCRIP
T
ACCEPTED
ACCEPTED MANUSCRIPT
MANUSCRIP
T
ACCEPTED
ACCEPTED MANUSCRIPT
MANUSCRIP
T
ACCEPTED
ACCEPTED MANUSCRIPT
MANUSCRIP
T
ACCEPTED
ACCEPTED MANUSCRIPT
CONTENTS
Supplementary Figure 1. Distribution of the GLOBE score within the derivation and validation
cohort.
Supplementary Table 1. Center specific characteristics of the study population.
Supplementary Table 2. Interactions tested between individual variables of the GLOBE score.
Supplementary Table 3. Predicted against observed probability of transplant-free survival in the
validation cohort (n=1631).
Supplementary Table 4. Baseline characteristics of responders vs non-responders according to the
threshold GLOBE score in the validation cohort.
Supplementary Table 5. Predictive performance of the GLOBE score calculated after n years of UDCA
therapy.
MANUSCRIP
T
ACCEPTED
ACCEPTED MANUSCRIPT
FIGURE LEGENDS
Supplementary Figure 1. Distribution of the GLOBE score within the derivation and validation cohort
MANUSCRIP
T
ACCEPTED
ACCEPTED MANUSCRIPT
TABLES
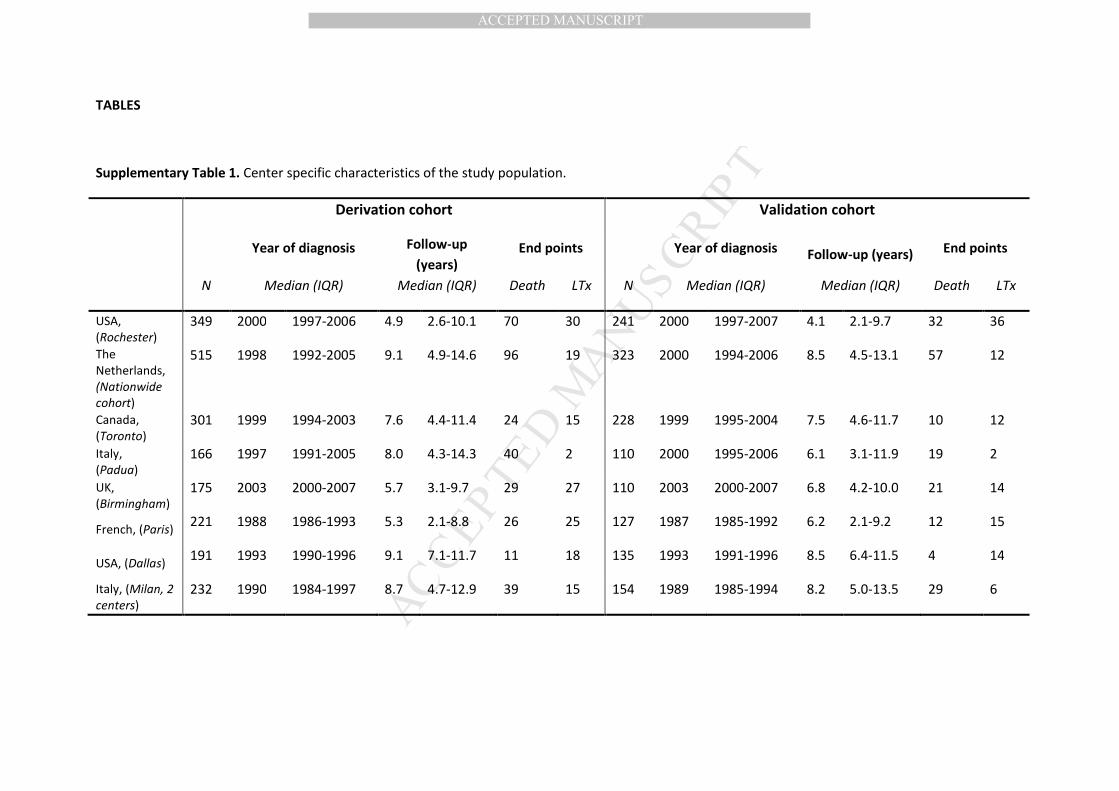
Supplementary Table 1. Center specific characteristics of the study population.
Derivation cohort Validation cohort
Year of diagnosis Follow-up
(years)
End points Year of diagnosis Follow-up (years)
End points
N Median (IQR) Median (IQR) Death LTx N Median (IQR) Median (IQR) Death LTx
USA,
(Rochester)
349 2000 1997-2006 4.9 2.6-10.1 70 30 241 2000 1997-2007 4.1 2.1-9.7 32 36
The
Netherlands,
(Nationwide
cohort)
515 1998 1992-2005 9.1 4.9-14.6 96 19 323 2000 1994-2006 8.5 4.5-13.1 57 12
Canada,
(Toronto)
301 1999 1994-2003 7.6 4.4-11.4 24 15 228 1999 1995-2004 7.5 4.6-11.7 10 12
Italy,
(Padua)
166 1997 1991-2005 8.0 4.3-14.3 40 2 110 2000 1995-2006 6.1 3.1-11.9 19 2
UK,
(Birmingham)
175 2003 2000-2007 5.7 3.1-9.7 29 27 110 2003 2000-2007 6.8 4.2-10.0 21 14
French, (Paris) 221 1988 1986-1993 5.3 2.1-8.8 26 25 127 1987 1985-1992 6.2 2.1-9.2 12 15
USA, (Dallas) 191 1993 1990-1996 9.1 7.1-11.7 11 18 135 1993 1991-1996 8.5 6.4-11.5 4 14
Italy, (Milan, 2
centers)
232 1990 1984-1997 8.7 4.7-12.9 39 15 154 1989 1985-1994 8.2 5.0-13.5 29 6
MANUSCRIP
T
ACCEPTED
ACCEPTED MANUSCRIPT
Supplementary Table 1 (continued). Center specific characteristics of the study population.
Derivation cohort Validation cohort
Year of diagnosis Follow-up
(years)
End points Year of diagnosis Follow-up
(years)
End points
N Median (IQR) Median (IQR) Death LTx N Median (IQR) Median (IQR) Death LTx
Spain,
(Barcelona)
156 1995 1991-2000 12.3 7.7-16.5 22 16 110 1996 1992-2000 12.2 8.1-16.3 9 7
Belgium,
(Leuven)
95 2000 1992-2006 7.9 3.9-13.1 9 15 41 2004 1995-2009 5.3 2.6-11.1 2 4
UK,
(London)
36 1994 1990-1999 9.0 4.8-13.7 1 4 20 1996 1991-2001 8.8 5.1-11.1 1 3
Canada,
(Edmonton)
30 2004 2001-2006 5.9 4.9-8.3 2 3 23 2003 1995-2006 6.5 3.8-9.2 1 6
USA, (Seattle) 21 2008 2002-2010 2.7 1.6-9.5 0 0 9 2008 2006-2010 2.9 1.6-6.2 0 0
Total 2488 1997 1991-2003 7.8 4.0-12.1 369 189 1631 1998 1992-2004 7.5 3.8-11.8 197 131
MANUSCRIP
T
ACCEPTED
ACCEPTED MANUSCRIPT
Supplementary Table 2. Interactions tested between individual variables of the GLOBE score
Bilirubin Albumin Alkaline phosphatase Platelet count
Age 0.94* 0.25* 0.97* 0.75*
Bilirubin - 0.54* 0.63* 0.74*
Albumin - - 0.95* 0.89*
Alkaline phosphatase - - - 0.03*
*P values of interaction terms tested in the final multivariable Cox regression model; a P <.01 was
considered statistically significant
MANUSCRIP
T
ACCEPTED
ACCEPTED MANUSCRIPT
Supplementary Table 3. Predicted against observed probability of transplant-free survival in the
validation cohort (n=1631)
1The predicted transplant-free survival probabilities for each risk group were assessed by first
applying the GLOBE score of each individual in the validation cohort to the baseline survival estimate
S0(t) derived from the derivation cohort: SGLOBE SCORE(t) = S0(t) exp(GLOBE SCORE)
. Than, the average of SGLOBE
score(t) across each risk group was calculated.
2The observed probabilities are observed from Kaplan-Meier estimation.
Risk groups according
to percentiles of the
GLOBE score
Years of
follow-up
Predicted
probability1
Observed
probability2
<10th
percentile 3-year 0.993 0.993
5-year 0.988 0.993
10-year 0.968 0.975
15-year 0.943 0.975
10th
– 40th
percentiles 3-year 0.982 0.993
5-year 0.968 0.985
10-year 0.918 0.949
15-year 0.857 0.882
40th
– 60th
percentiles 3-year 0.965 0.975
5-year 0.937 0.956
10-year 0.840 0.864
15-year 0.732 0.789
60th
– 90th
percentiles 3-year 0.915 0.924
5-year 0.854 0.854
10-year 0.660 0.720
15-year 0.484 0.478
>90th
percentiles 3-year 0.617 0.638
5-year 0.460 0.474
10-year 0.183 0.181
15-year 0.067 0.069
MANUSCRIP
T
ACCEPTED
ACCEPTED MANUSCRIPT
Supplementary Table 4. Baseline characteristics of responders vs non-responders according to the
threshold GLOBE score of 0.30 in the derivation cohort.
Responders
(n=1493)
GLOBE score ≤0.30
Non-responders
(n=995)
GLOBE score >0.30
Age, years, mean (SD) 49.14 (10.47) 57.95 (11.51) <.0001
Female, n (%) 1395 (94%) 858 (86%) 0.0049
AMA+, n (%) 1493 894 0.52
Year of diagnosis, median (IQR) 1998 (1992-2004) 1996 (1989-2002) <.0001
Year of diagnosis, time frame 1961-2012 1971-2012
Histological disease stage, n (%) 816 389 <.0001
Stage I 269 (33%) 67 (17%)
Stage II 251 (31%) 86 (22%)
Stage III 88 (11%) 83 (21%)
Stage IV 61 (7%) 78 (20%)
Not available 148 (18%) 75 (19%)
Biochemical disease stage, n (%) <.0001
Early stage 1262 (85%) 422 (42%)
Moderately advanced stage 209 (14%) 410 (41%)
Advanced stage 22 (1%) 163 (16%)
MANUSCRIP
T
ACCEPTED
ACCEPTED MANUSCRIPT
Supplementary Table 5. Predictive performance of the GLOBE score calculated after n years of UDCA
therapy.
Validation cohort
n=1630
Follow-up C statistic 95% CI
1 year 0.82 0.79-0.84
2 years 0.83 0.80-0.85
3 years 0.83 0.80-0.85
4 years 0.83 0.80-0.86
5 years 0.84 0.81-0.87
MANUSCRIP
T
ACCEPTED
ACCEPTED MANUSCRIPT


![[XLS]misfms.icar.gov.inmisfms.icar.gov.in/CodeList/ICAR_FMS MIS_Code_list... · Web viewProfessional Tax (Employer Contribution) f. Fees & Honorarium Fees and Honorarium e. Staff](https://img.pdfslide.us/doc/110x75/5af802a27f8b9ae94890e3e0/xls-miscodelistweb-viewprofessional-tax-employer-contribution-f-fees-honorarium.jpg)