Embed Size (px)
Citation preview

Flood Footprint: Method and Applications
Dabo GuanSchool of International Development
University of East [email protected]
Flood footprint definition
Flooding in one location can impact the whole UK economy. Neglecting these knock-on costs (i.e. the true footprint of the flood) means we might be ignoring the economic benefits and beneficiaries of flood risk management interventions. In 2007, for example, floods cost the economy about £3.2 bn directly, but the wider effect might actually add another 50% to 250% to that.
We aim at gaining an improved understanding of the economic impacts of floods in urban areas, and of the knock-on effects of these on the wider economies. Taken together, these can be described as the flood footprint.
Flood footprint is a measure of the exclusive total (socio)economic impact that is directly and indirectly caused by a flood event to the flooding region and wider economic systems (and social networks). Flood footprint is measured by £ or percentage of regional GVA / national GDP.
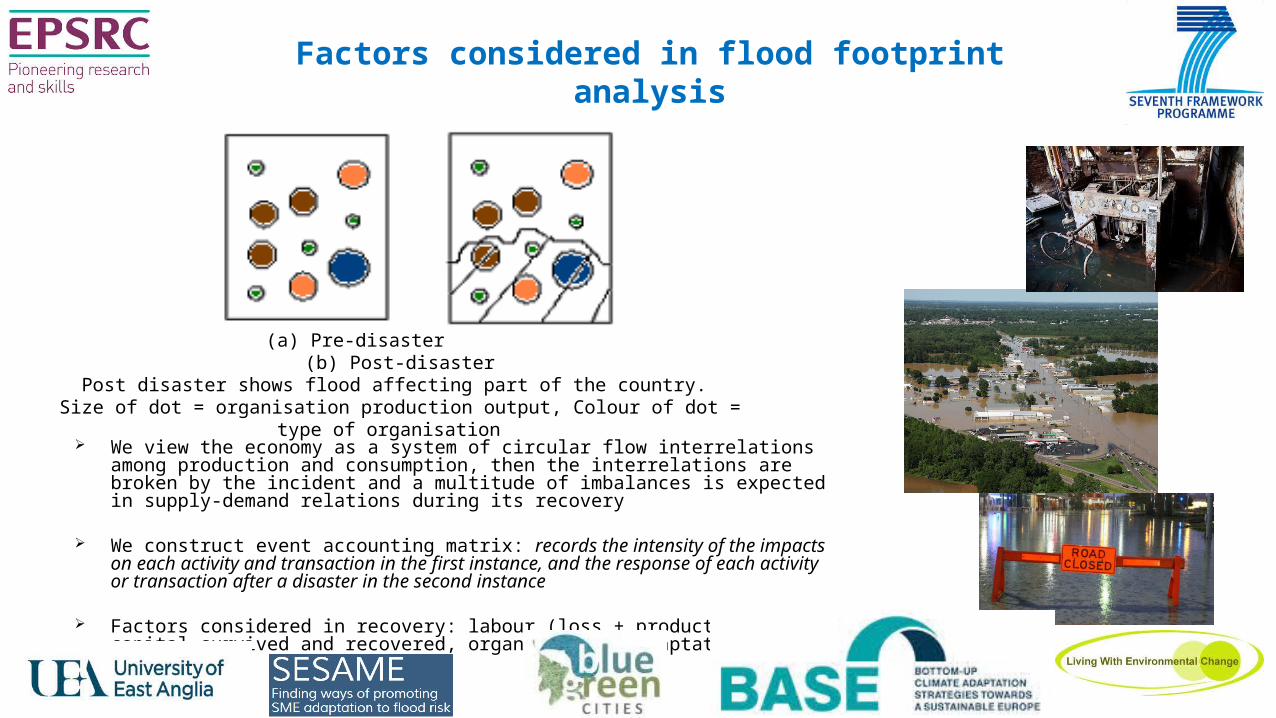
(a) Pre-disaster (b) Post-disasterPost disaster shows flood affecting part of the country.
Size of dot = organisation production output, Colour of dot = type of organisation
We view the economy as a system of circular flow interrelations among production and consumption, then the interrelations are broken by the incident and a multitude of imbalances is expected in supply-demand relations during its recovery
We construct event accounting matrix: records the intensity of the impacts on each activity and transaction in the first instance, and the response of each activity or transaction after a disaster in the second instance
Factors considered in recovery: labour (loss + productivity), capital survived and recovered, organisations’ adaptation capacities.
Factors considered in flood footprint analysis

• Wassily Leontief’s PhD dissertation in Germany on Kreislaufwirtschaft,
• developed input-output analysis in the 1930s
• Will there be unemployment after war?
• Environmental Repercussion and the economic system (1970)
• Nobel Prize in 1973
Using input-output analysis framework
Using input-output analysis framework
• IO analysis is grounded in the technological relations of production and provides a full accounting for all inputs into production.
• IO analysis is a powerful tool to assess the economic effect of a natural catastrophe at a regional and sectoral level through intermediate consumption and demand.
• Although IO analysis is mainly a model of production, it’s fully capable of analyzing households and other institutions.
• IO model’s simplicity and integration ability with engineering models and data
Using input-output analysis framework
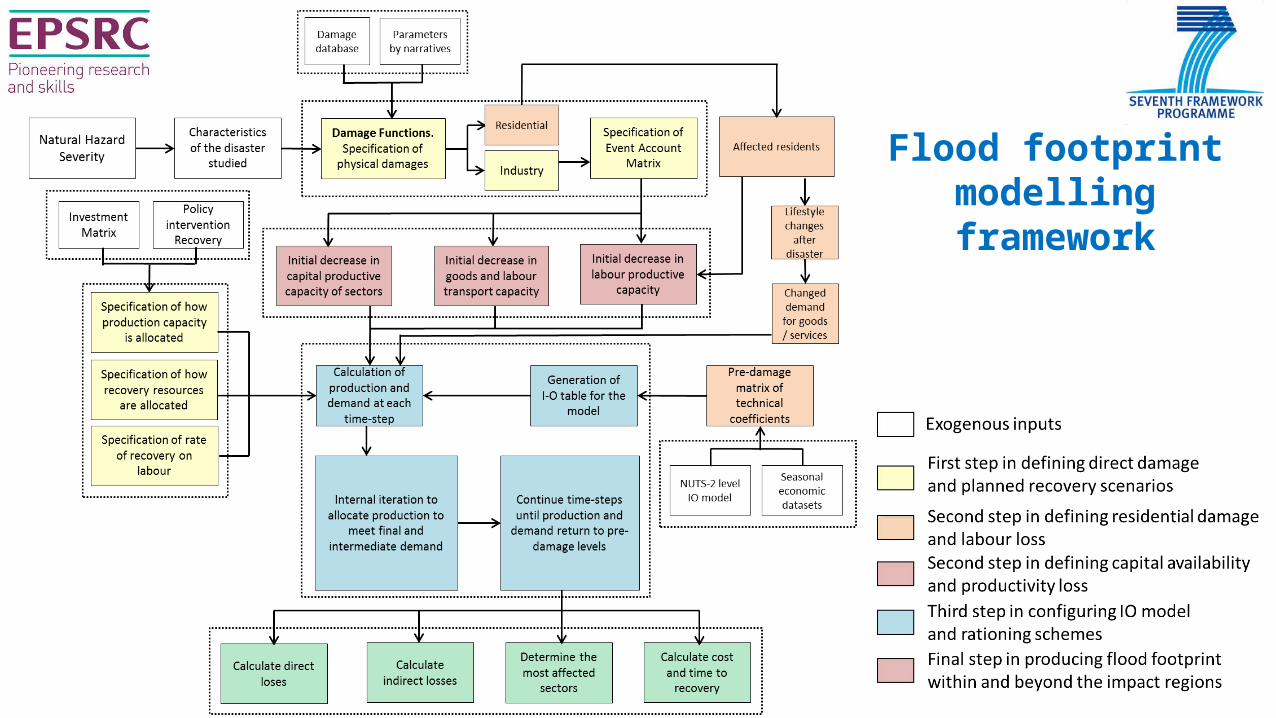
Flood footprint modelling framework
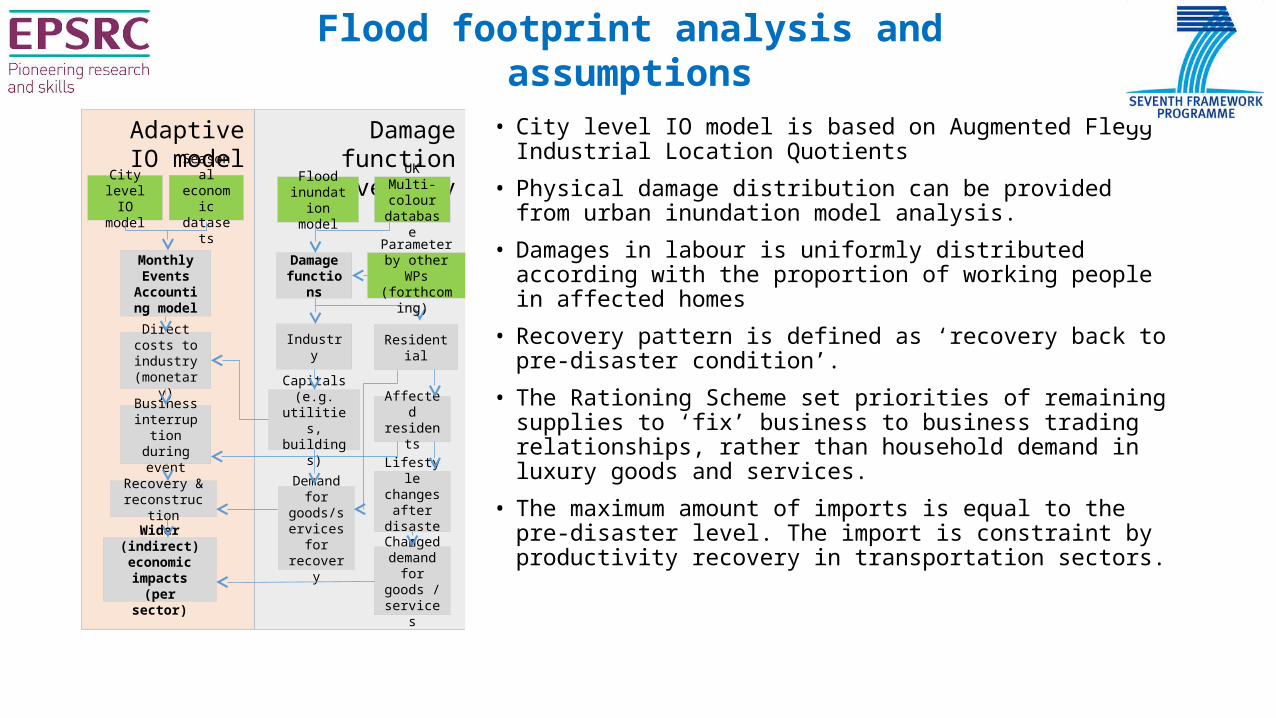
• City level IO model is based on Augmented Flegg Industrial Location Quotients
• Physical damage distribution can be provided from urban inundation model analysis.
• Damages in labour is uniformly distributed according with the proportion of working people in affected homes
• Recovery pattern is defined as ‘recovery back to pre-disaster condition’.
• The Rationing Scheme set priorities of remaining supplies to ‘fix’ business to business trading relationships, rather than household demand in luxury goods and services.
• The maximum amount of imports is equal to the pre-disaster level. The import is constraint by productivity recovery in transportation sectors.
Adaptive IO model
Damage function inventory
Damage functions
Industry Residential
Capitals (e.g. utilities,
buildings)
Affected residents
Demand for
goods/services for recovery
Lifestyle changes
after disaster
Changed demand
for goods / services
UK Multi-colour
database
Flood inundation
model
City level IO model
Seasonal economic datasets
Monthly Events
Accounting model
Direct costs to industry (monetary)
Business interruption during event
Recovery & reconstruction
Wider (indirect) economic
impacts (per sector)
Parameter by other WPs
(forthcoming)
Flood footprint analysis and assumptions
Flood footprint analysis for 2007 flooding in Sheffield
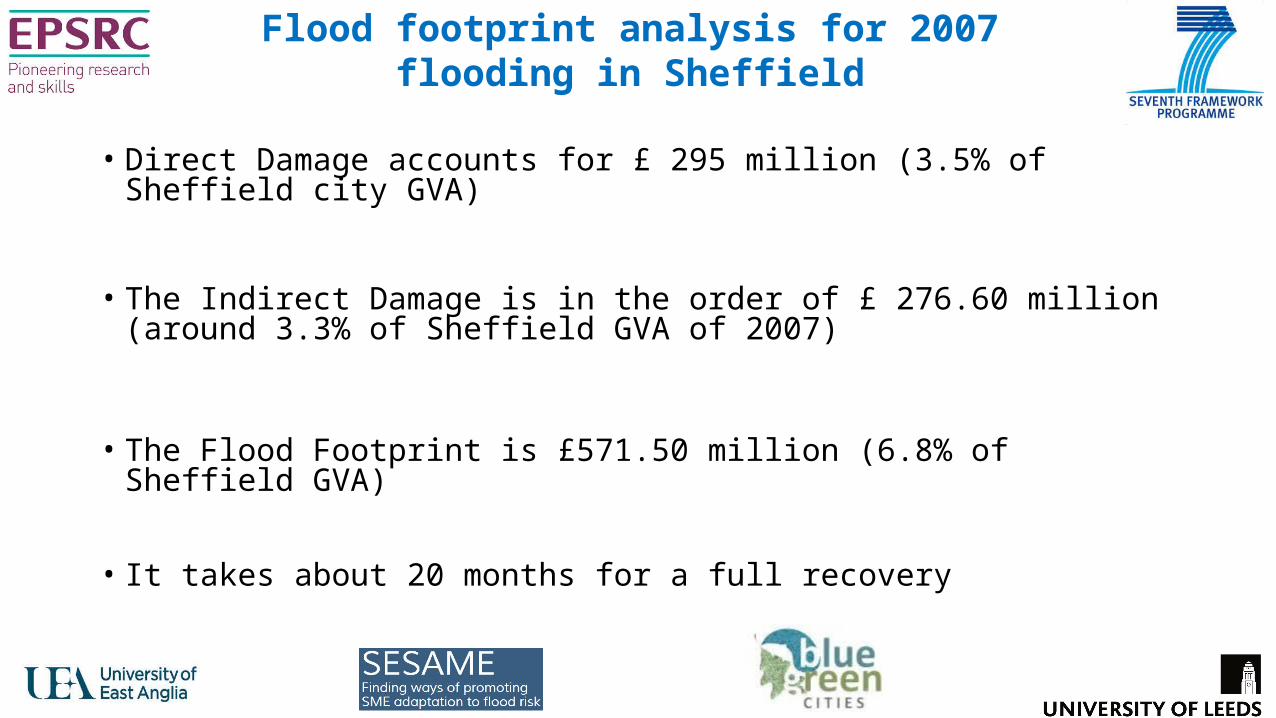
• Direct Damage accounts for £ 295 million (3.5% of Sheffield city GVA)
• The Indirect Damage is in the order of £ 276.60 million (around 3.3% of Sheffield GVA of 2007)
• The Flood Footprint is £571.50 million (6.8% of Sheffield GVA)
• It takes about 20 months for a full recovery
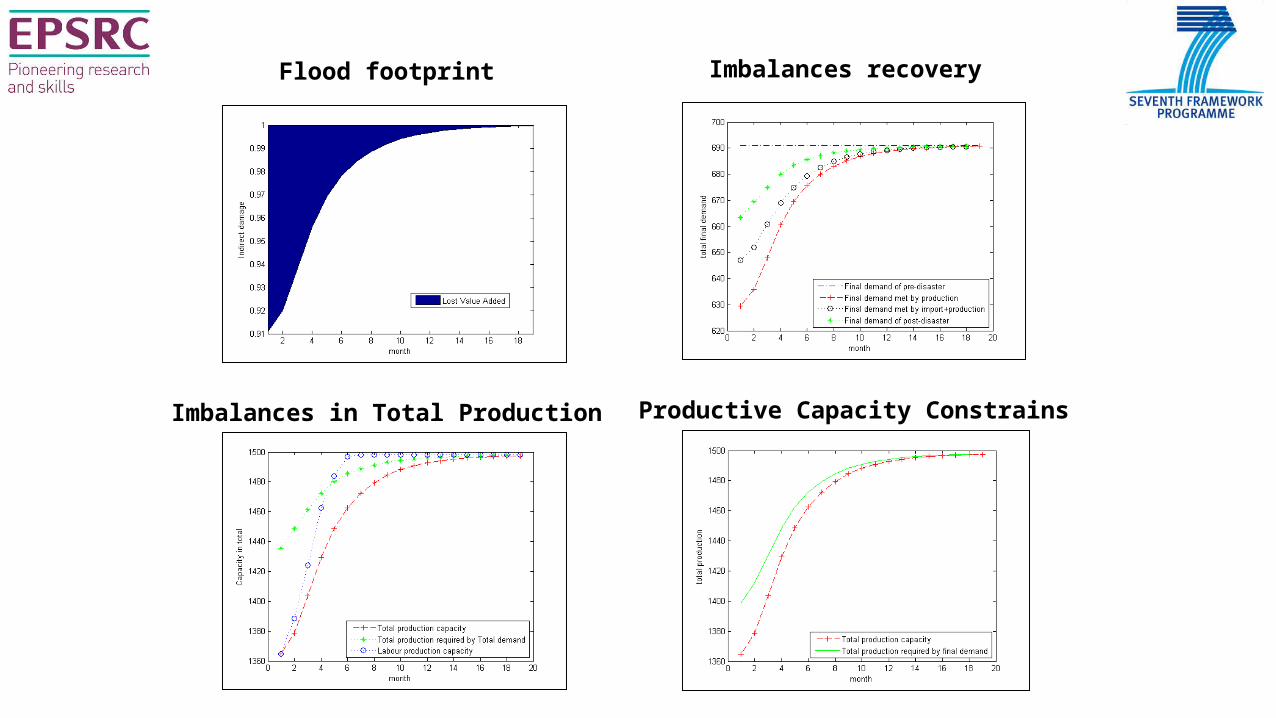
Flood footprint Imbalances recovery
Imbalances in Total Production Productive Capacity Constrains
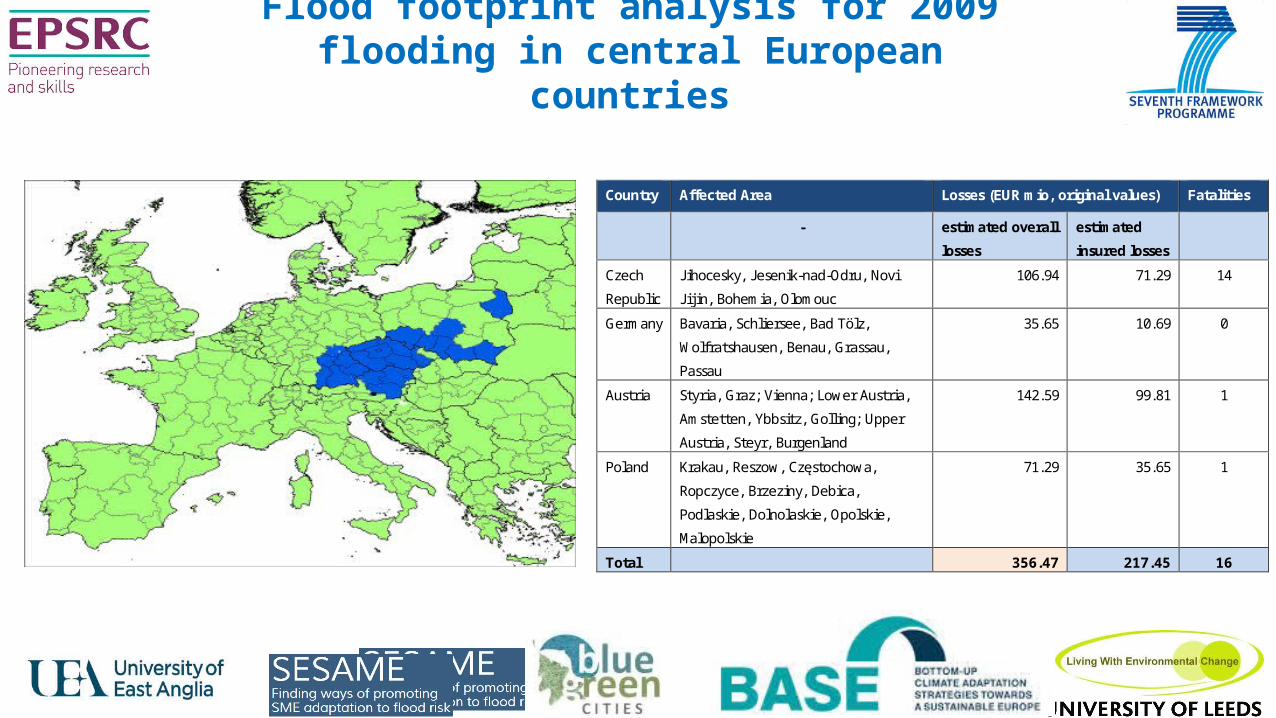
Flood footprint analysis for 2009 flooding in central European countries
Country Affected Area Losses (EUR mio, original values) Fatalities
- estimated overall
losses
estimated
insured losses
Czech
Republic
J ihocesky, J esenik-nad-Odru, Novi
J ij in, Bohemia, Olomouc
106.94 71.29 14
Germany Bavaria, Schliersee, Bad Tölz,
Wolfratshausen, Benau, Grassau,
Passau
35.65 10.69 0
Austria Styria, Graz; Vienna; Lower Austria,
Amstetten, Ybbsitz, Golling; Upper
Austria, Steyr, Burgenland
142.59 99.81 1
Poland Krakau, Reszow, Częstochowa,
Ropczyce, Brzeziny, Debica,
Podlaskie, Dolnolaskie, Opolskie,
Malopolskie
71.29 35.65 1
Total 356.47 217.45 16
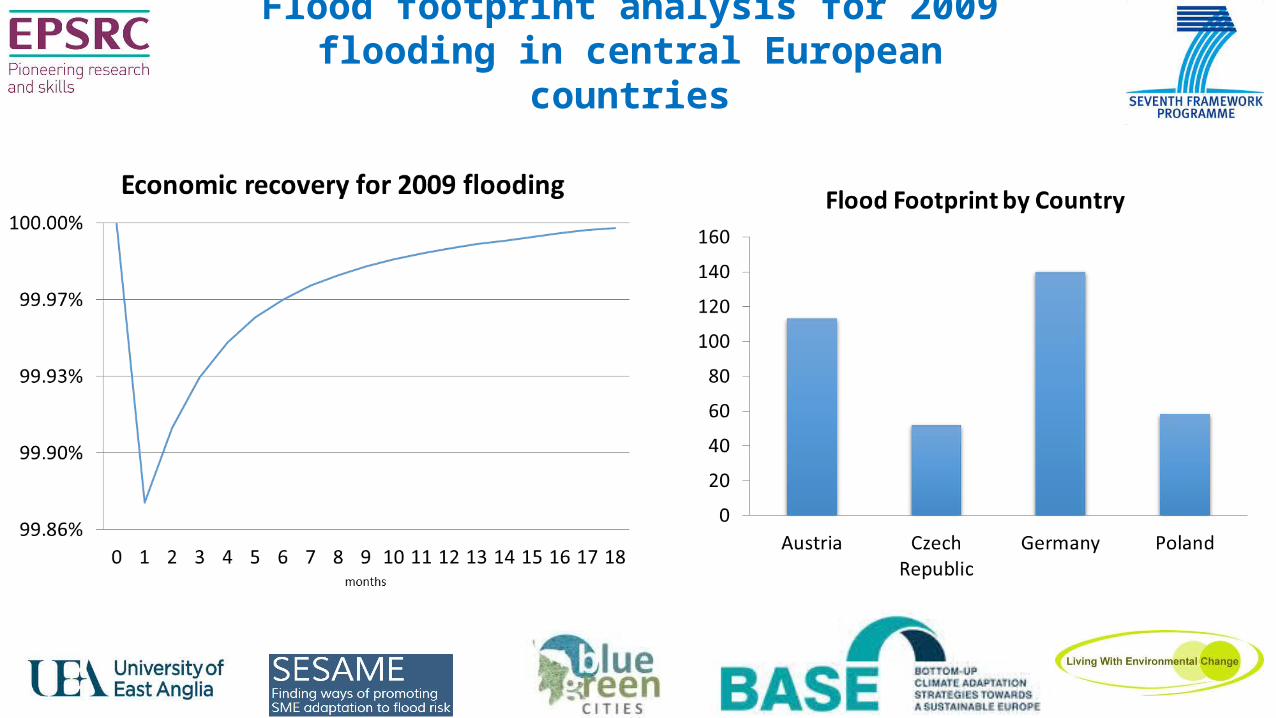
Flood footprint analysis for 2009 flooding in central European countries
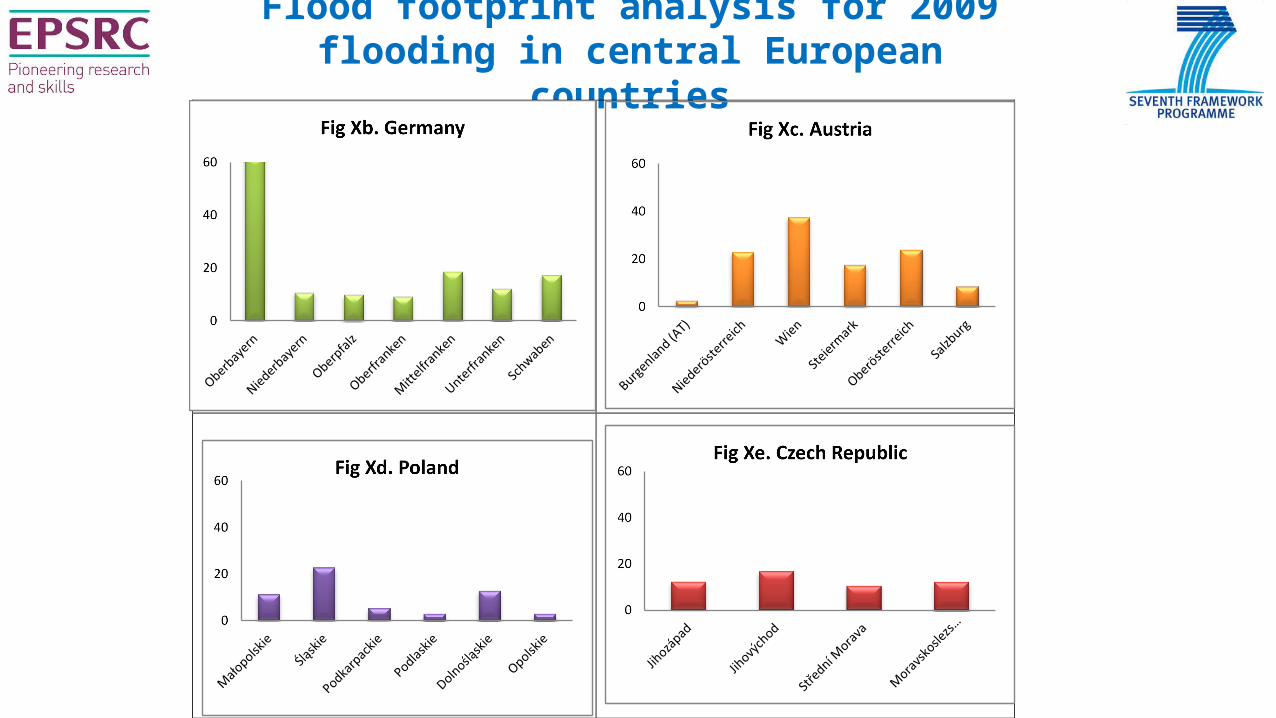
Flood footprint analysis for 2009 flooding in central European countries
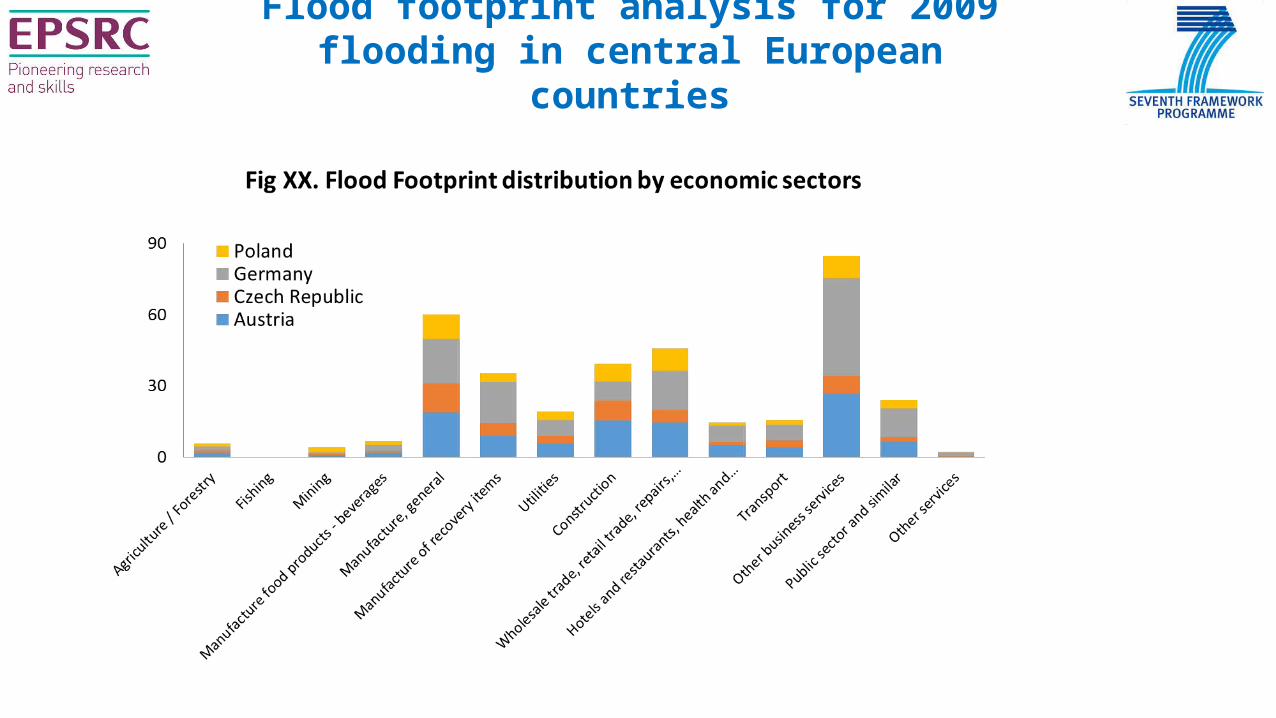
Flood footprint analysis for 2009 flooding in central European countries