Embed Size (px)
Citation preview

ACAATO DOCUMENT
Measuring Graduation and Attrition at Ontario Colleges
A Discussion of Measurement Issues and their Usefulness as Indicators of Student Success
655 Bay Street, Suite 1010, Toronto ON, M5G 2K4 t: 416.596.0744 f: 416.596.2364
www.collegesontario.org

1
MEASURING GRADUATION AND ATTRITION AT ONTARIOCOLLEGES
A DISCUSSION OF MEASUREMENT ISSUES AND THEIRUSEFULNESS AS INDICATORS OF STUDENT SUCCESS
Key Conclusions And Recommendations:
• The Graduation Rate Is An Invalid Indicator Of Labour Market Success OfCollege Graduates
• Do Not Use Graduation Rates For Provincial Funding
• Start With Pilot Studies For Calculating the Graduation Rate Based On CollegeStudent Identifier Number
• Launch A Survey Of Early College Leavers -- Identify Successful FromUnsuccessful Leavers
• Develop A Province Wide Student Number System, Initiate A Systematic Long-Term Survey Of Students And Young Workers
(DRAFT)
ARTHUR DONNER CONSULTANTS
Arthur Donner Ph.D.Fred Lazar Ph.D.March 20, 2000

2
TABLE OF CONTENTS
1.0 Executive Summary
2.0 Introduction2.1 Objectives2.2 Role of the Colleges2.3 Defining Success2.4 Outline of the Report
3.0 Retention Rates3.1 Definition3.2 Measuring Graduation Rates: Universities3.3 Measuring Graduation Rates: Colleges3.4 Problems in Measuring Graduation Rates3.5 Problems in Comparing Graduation Rates between Colleges and Universities
4.0 KPIs4.1 Lessons from other Jurisdictions4.2 Ontario4.3 Literature Review
5.0 The Five Case Studies5.1 Overview5.2 Separate Comments Based On Discussions With College Officials
(Fanshawe, Canadore, Humber, Boreal, Sir Sanford Fleming, Sault College)
6.0 Conclusions6.1 Measuring Student Success6.2 Graduation Rates as an Indicator of Student Success6.3 KPIs6.4 Recommendations6.5 Summing Up
APPENDIXES
1. System KPI DataGraduate Employment Rate Dec. 1997-May 1998-six months after graduation (KPI)Graduate Satisfaction Rate (KPI)Employer Satisfaction Rate (KPI)Student Satisfaction Rate -Average Five Questions (KPI)
2. Calculation Of Attrition And Graduation Rates In Other Jurisdictions (Prepared byMTCU)

3
3. College Case Study Information
Canadore CollegeKPI Graduation Rates By ProgramSurvey of Withdrawals By ReasonCanadore College Executive Information System -- Post Secondary InformationSystem, Critical Performance Indicators.Canadore College Application For Withdrawal Form
Humber CollegeKPI Graduation RaTe By ProgramThe Freshman Integration And Tracking System: An Overview, Sept. 1999
Boreal CollegeKPI Graduation Rates By Program
Sir Sanford FlemingKPI Graduation Rates By Program
Fanshawe CollegeKPI Graduation Rates By Program
4. University MaterialsCarleton, Queen’s And Guelph-Graduation Rates By Programs

4
1.0 EXECUTIVE SUMMARY
Introduction and Terms of Reference
Arthur Donner and Fred Lazar were retained by the Association of Colleges of Applied Arts &Technology of Ontario (ACAATO) to identify, if possible, a valid and policy useful formula thatlinks together for the Colleges the graduation rates and labour market success of their graduates.
The assignment has a number of complex sub-components. We were asked to assess theusefulness and the validity of the “cohort-based” measure of graduation used by Ontario Colleges,and whether the current measures could be improved. We were also asked to consider whetherthe graduation rates of Colleges actually reflect the labour market success of graduates. Finally,we were asked to address a very important public policy question: whether it was appropriate touse the college graduation rate for Government fiscal allocation purposes.
Fortunately, our analysis was able to tap into the considerable expertise that exists in the Collegesand the Ministry with respect to the KPIs, graduation rate calculations, and funding issues. Weheld two roundtable consultation sessions with college officials, one with the College Presidents,the other with officials directly involved in providing KPI information for measurement purposes.
Ministry officials were very helpful to us all along the way both in terms of sharing data that theyhad compiled and in terms of setting out the Ministry position on KPIs and the graduation rate.Ministry officials also attended the two roundtable sessions. Finally, we undertook some specialpilot studies and consultations with five Colleges with respect to their reporting on KPIs and themeasurement of graduation rates at the program level. The pilot studies suggest that adapting astudent tracking measure of graduation at the college level should not be too onerous.
KPIs and the Graduation Rate
The need for this research stems from an important new policy direction introduced by theMinistry of Training, Colleges and Universities (MCTU) that requires the Colleges to publish keyperformance indicators (KPIs) for the general public as well as for the Ministry. Other provincesin Canada and several state governments in the US have also introduced their own versions ofKPIs in their jurisdictions.
The four key performance indicators that were initially developed were the graduate employmentrate for each College, the graduate satisfaction rate, the student satisfaction rate and the employersatisfaction rate. Three of the KPIs (the graduate employment rate; graduate satisfaction rate; andemployer satisfaction rate) are presently tied in a small way to Provincial funding of colleges. Afifth KPI – the graduation rate and its alter ego, the retention rate – is also calculated by theColleges. But a number of problems have arisen both with the calculation and the methods as wellas with the interpretation and use of the data. Consequently, the college graduation rate iscurrently not tied to Ministry funding, though our consultations with college officials,stakeholders and other experts suggest that there is some risk that in the future the Ministrywould also use the graduation rate for fiscal allocation purposes.

5
Clearly it is important that the KPIs, and in particular the graduation rate, accurately representwhat is really going on and accurately reflect the interests of the key stakeholders – students,employers, the Government (MCTU specifically) and the 25 Colleges. It is also important that thegraduation figures not mislead the college officials, the public, students, or the Ministry officials.
Unfortunately, the current “cohort class” method for measuring college graduation rates is flawed,and the data are very misleading, particularly at the program level. Under the present system thereis no tracking of individual college students, as is the case in the university measurements. Aswell, the Colleges use a shorter time frame than do the Universities in calculating graduation ratesand the cohort methodology is backward looking rather than the more traditional forwardlooking.
The tracking of individual students is clearly the direction to go in terms of monitoring collegegraduation rates. This is confirmed not only by the Ontario Universities’ experience, but also bythe experiences of other jurisdictions. However, while the student tracking approach wouldprovide superior information compared to the present cohort method, nonetheless in the collegecase, even this method could result in findings that are problematic and misleading, particularlywith respect to the labour market achievements of graduates and early leavers from Colleges.
College Graduation is an Invalid Indicator of Labour Market Success
College graduation rates at the program level only partially correlate with short-term (i.e.immediate) labour market success, since we have no data relating to the employment experiencesof the early leavers. But there is a fairly extensive literature explaining the apparent high level ofcollege attrition (approximately 45% in Ontario), though the literature is limited in terms ofdealing with the labour market success of college graduates compared to non-graduates fromColleges.
The amount of information on successful versus unsuccessful leavers is very limited. However,there are many anecdotal examples of early leavers who are successful in the job market,particularly when the job market is hot. In other words, one cannot assume that attritioncorrelates with an unsuccessful job situation. The reverse might be the case, that the collegeexperience, without formal completion of programs, was still a valuable input for the job market.
Labour market success at the college level involves much more than formal graduation. In someparts of the job market, formal credentials, graduation and a certificate are necessary to qualify fora job. For other jobs, formal credentials are not required. Only some degree of training and workexperience are necessary.
Some Background Conclusions Derived from our Consultations and Research
KPIs, Graduation Rates and Labour Market Success

6
Our research suggests that, with the exception of the graduation rate, that the four other KPIsprovide some value added to the key stakeholders – the Colleges, MCTU, students, employersand the wider community. However, even these KPIs have only an immediate, not longer run,linkage to the labour market success of college graduates.
For example, the graduation employment rate and the employer satisfaction rate are notmonitored over longer time periods. Nor for that matter is the quality of the jobs (as reflected inincomes earned) a consideration in these measures; nor is upward mobility reflected in theMinistry survey data. Finally, the labour market experiences of early leavers (non-graduates) arealso not taken into consideration with these measures.
The KPI statistics gathered by the Colleges with the assistance of the Ministry also indicate thatthere is a link between student OSAP defaults and the graduation rate from programs.Consequently, there is a need to improve the graduation rate data, even if they have only limiteduse in evaluating labour market success.
As already noted, the cohort approach for measuring graduation rates at the college program levelis flawed and misleading. Nonetheless the cohort methodology currently used by the Colleges maybe useful with respect to calculating aggregate graduation rates. But the figures are not useful ona program-by-program basis. Indeed, the figures at a program level jump all over the place (insome cases with graduation rates above 100%), suggesting that there are some major problemswith the current measurement basis.
Interpreting Comparative Graduation Rate Data
The Colleges in Ontario are very diversified in terms of their program offerings. Since separateprograms have very different graduation rates, the comparisons of aggregate graduation ratesamong Colleges are problematic.
Nonetheless, with all of its flaws, Ontario’s aggregate college graduation rate (55%) comparesfavourably with the graduation rates in other jurisdictions. For example, the national US collegegraduation rate was 38% for two-year programs. The rate in Newfoundland was 50% and thegraduation rates in Kentucky and South Carolina were 11% and 14% respectively.
Similarly, comparing college graduation rates on a system wide basis with university graduationrates is also analytically misleading, though Universities reported a higher average graduation rate– 71% compared to 55% for the Colleges. .
The common problem in comparing graduation rates across different jurisdictions and betweenColleges and Universities in Ontario is that different approaches and definitions are used.
Why are College Graduation Rates Typically Lower than Universities?
The literature, our consultations and the pilot studies all point to the same general explanationsfor higher average attrition at the Colleges compared with the Universities. Demographic and

7
socio-economic factors, combined with an open access policy at Ontario’s Colleges, are the keyfactors that explain the higher measured attrition rates and relatively lower graduation rates at theColleges. In a nutshell, Colleges are more unique than Universities.
• College students tend to be older than their university counterparts, and have different goalsfor entering Colleges. Students entering the Colleges from high schools or from the workforce are more immediately required to make career choices than their counterparts enteringUniversities.
• Some college students receive work experience as part of their college education, and aretempted by job offers while enrolled in their programs.
• To a greater degree than is possible at the college level, students entering University can selecta number of courses in their first year before they decide to specialize.
• There is considerable diversity among the Colleges in terms of the student population, theprogram/course offerings, and the strength of the local labour market.
• Colleges also stress easy entry access to programs relative to their university counterparts.One well-known researcher indicated that “Institutions that admit large numbers of less-wellprepared students will tend to have low retention rates, regardless of how effective theirretention programs are”. Consequently, it is unfair to compare the retention rates of differenttypes of institutions.
• Finally, success at the college level involves more than graduating students. Indeed, in someprograms, graduation and a certificate are necessary to qualify for a job. For other jobs,formal credentials are not required. Only some degree of training and work experience isnecessary.
Improving the Measurement of Graduation Rates at the Colleges Under the cohort measurement system, retention is described as “students who completediploma/certificate programs within a minimum time frame expressed as a percentage of enteringstudents.” Unfortunately, this graduation rate measure often provides misleading (and even silly)findings because of so much program switching, dropping in and out of the system and movementbetween Colleges, the labour market and Universities. The university tracking system assigns graduating students to the programs in which they firstenrolled and thus is preferable to the cohort tracking system, which assigns graduating students tothe programs from which they graduate. However, what do the resulting university programgraduation rates tell us about the “success” of each program? Even though the university trackingsystem captures transfers between programs within the same institution, the reported graduationrates do not necessarily correlate with the ability of a program to enhance its students’ labourmarket opportunities.

8
Another problem arises when a program requires as a pre-requisite for entry a year or more ofgeneral education or another program. In such cases, it is important to properly define the entryyear. If the entry year is defined as the year in which a student starts the program rather than theyear a student enters into a College or University, then graduation rates will tend to be higher,ceteris paribus, than for programs where the entry year is the one in which a student first enrolledin the post-secondary institution. Aggregate institution graduate rates also will be higher wherethe entry point is defined as the year in which a student enters a program. The introduction of a university style measure of graduation rates at the program level (i.e.following individual students rather than cohorts) would be an improvement over the currentsystem. But recognize that using a college institution identifier will still face the problem ofcapturing and measuring students moving between different Colleges and in and out of the collegesystem (either to the job market or to other post-secondary educational opportunities). In closing, while a university style student tracking system is superior to the current cohortapproach used by the Colleges, its findings might also prove problematic.
Our Key Conclusions and Recommendations General Conclusions And Recommendations
• The graduation rate is an invalid indicator of the labour market success of college graduates.
• Do not use graduation rates for provincial funding at this time.
• Start with pilot studies for calculating the graduation rate based on college student identifiernumbers.
• Launch a survey of early college leavers to identify successful from unsuccessful leavers.
The research and evidence we have marshalled suggest that the college graduation rate is aninvalid measure of labour market success. Indeed, the measured college graduation rates havelittle bearing on the labour market success of graduates and/or the early leavers. Even if thegraduation rate is better constructed, we would still worry that the information would be oflimited use to outsiders and could be easily misinterpreted.
Consequently, the graduation rate should not be used for Ministry funding. In effect, we have tolook at measures other than the college graduation rate to better reflect labour market success.
It is still worthwhile, however, to improve the measurement of graduation rates at the Collegelevel for internal college planning purposes. Consequently, ACAATO should propose that MTCUmove towards introducing a student tracking measurement system for graduation based oncollege student identification numbers.

9
To ensure that the graduation rate data are reliable, ACAATO should suggest that MTCUsponsor several pilot studies, experimenting with starting and ending dates (i.e. the starting point-semester one or two, and the termination point, up to five years).
ACAATO should also petition MTCU to undertake a survey of early leavers from collegeprograms, attempting to identify successful from unsuccessful college leavers in terms of the jobmarket prospects. We believe that this kind of a survey would provide value both to the Collegesand to the Ministry.
A Better Method for Linking Retention to Labour Market Success
Our research suggests that the Ontario labour market is very dynamic, and that new entrants intothe labour market quite properly experiment (job hop) before settling down into a career/job path.There is a counterpart to the labour market/job hopping when one considers student mobilitybetween different college programs and within and between Colleges and Universities. All of thiscomplicates the measurements and interpretation of graduation statistics.
Accordingly, the optimum approach would be to establish a provincial wide student identificationnumber, and use it to follow the education experiences and job paths of Ontarians. The provincialwide number approach also allows for a much longer time period in terms of tracking the labourmarket experience of those who have graduated and of those who are truly early leavers from theColleges. This long-run tracking approach may solve the problem of the inadequacy of thegraduation rates. It is only when we have a better grasp on the job experiences of early leaversand graduates that we can then assess the labour market validity of college programs.

10
2.0 INTRODUCTION
2.1 Objectives
Accountability in post secondary education and training institutions and programs has becomemore prominent for funding decisions by the Ontario Government, as well as in many otherjurisdictions in recent years. In the US, the combination of increased costs along with decreasedstate resources have resulted in public demands that college and university administrators takesteps to ensure greater quality, productivity and effectiveness of their institutions. Colleges andUniversities are being asked to be more responsive to state concerns and to be publiclyaccountable to stakeholders – students, parents, employers and the general public. Several stateshave adopted performance measures to respond to these accountability demands.
Historically, Ontario’s Colleges have had a tradition of being accountable through methods suchas community-based governance, program advisory committees and provincial program standards.In their search for quality, Colleges build into their internal processes opportunities to review andreflect on the nature, content and delivery of their programs. Perceptions are sought fromstudents, graduates, employers of graduates, advisory committees, faculty and staff of the Collegeand members of the college’s Board of Governors. These inputs are synthesized with statisticalreporting processes to create a view of the college’s effectiveness in carrying out its mandate.
Lacking, however, has been a system-wide accountability framework that actually measuredcolleges’ performances against goals identified by the ministry responsible for postsecondaryeducation and the Colleges. Accountability requires a set of objectives for these institutions and ameans for measuring the success for each institution in achieving the defined public policy goals.In Ontario, the provincial government has indicated that it intends to depend more heavily on KeyPerformance Indicators (KPIs) in its future policy and funding decisions. Five KPIs have beenidentified thus far: post-college outcomes, graduate satisfaction, employer satisfaction, studentsatisfaction and graduation rates.
It is important that the KPIs provide the information needed to assess whether the institutions areachieving the goals set by the government. In the case of the 25 Colleges, which compriseACAATO, the KPIs should reflect what is important for students, employers and the taxpayer andaccurately represent the degree of success that each College has in serving the needs of eachstakeholder group.
Accountability should be centered in the mission of the college system and should respect thediversity of each College in Ontario. Internal accountability processes can be strengthened by awell-structured and complementary system of external accountability measurements – the right setof KPIs. But these KPIs need to be clear and explicit and relate performance to purpose andexpectations. Measuring performance is an ongoing, evolutionary process that should contributeto the improvement of the quality of what Colleges do.

11
In 1998, the Colleges worked collaboratively with the MTCU to implement the first public sectorkey performance indicator project in Ontario. The following are the four key performanceindicators that were developed through the joint effort of the Colleges and the MTCU:
• Graduate employment rate of each College;• Graduate satisfaction rate of each College;• Student satisfaction rate with the Colleges; and• Employer satisfaction rate (i.e. satisfaction with the generic/vocational skills of their
employees who graduated from the Colleges).
Data collection on graduate outcomes, graduate satisfaction and employer satisfaction began inthe Fall of 1998. The results released in 1999 demonstrated that the Colleges in Ontario providethe quality education and training that Ontario needs in the knowledge economy.
These three KPIs (graduate employment rates, graduate satisfaction and employer satisfaction)will be factored into the mechanism for distributing government transfer payments to the Collegesstarting in fiscal year 2000-01. Commencing with this fiscal year, 2% of the allocation of fundingfor operating grants for the Colleges will be based on these KPIs. The comparisons will be acrossthe 25 Colleges in Ontario. No comparison will be made between the Colleges and theUniversities, at least at the outset. Student satisfaction and student graduation data, also beinggathered beginning with the 1998-99 academic year, will not be tied to funding distribution at thistime.
It is important to keep in mind that when the link between KPIs and funding begins, 98% of thefunding will continue to be based on total college enrolment. If a College attracts students, it alsowill attract money from the province. Eventually these three indicators will account for up to 6%of total funding for the Colleges.
Funding models are now being evaluated to ensure that the KPIs serve the ultimate objectives ofprogram and service improvements at the Colleges. For example, the government would like tosee a 100% employment rate for college graduates and will reward the Colleges that succeed inplacing their students in jobs. But should Colleges located in regions with unemployment ratesabove the provincial average be penalized if they attain marginally lower graduate employmentrates?
Several questions have been raised about the graduation rate KPI. For example, it is difficult todefine and measure and the interpretation of this variable in respect to the roles of the Collegesand the public policy goals set out for these institutions is ambiguous.
Since there are considerable and legitimate concerns over the measurement and interpretation ofthe graduation rate KPI measure, the provincial government is not yet using it for fiscal allocationpurposes. Moreover, the Colleges are not required to publish anything other than the aggregatecollege graduation rate with the other KPI information that is being made available.

12
Nevertheless, the fact that the 25 Colleges in Ontario are not homogeneous either in programs,geographic locations, their history and their student demographics complicates the interpretationof broad brush KPI measures. Thus, to be useful, the KPIs, especially the graduation rates shouldallow for differences among the Colleges and between the Colleges and other post-secondaryinstitutions, in particular the Universities.
Hence, the purpose of this research project is to examine the feasibility of using the graduationrate for funding allocation decisions, and if so, to identify for the Colleges and the Ministry apolicy useful formula that links together graduation rates and the labour market success ofgraduates.
As a starting point, one can ask whether it is appropriate to equate the graduation ratewith labour market success? Statistics Canada data suggest that this is indeed the case.Labour market survey data reveal that there is an inverse correlation between educationand unemployment rates and a positive correlation between educational attainment andincomes.
But does this mean that it is right to assume that non-graduation equates to labour market failure?
The traditional concept of the graduation rate, regardless of how it is measured, does notnecessarily provide a reliable indicator of the “success” of the Colleges in achieving thegovernment set goals. The number of graduates and the program and aggregate graduation ratesdo not reflect those students who have had a positive experience in College and who may havesecured employment related to their area of education and elected not to finish their programs;temporarily gone back to work only to continue with their studies at a later time on either a full-time or part-time basis; or, decided to continue their programs on a part-time basis. Thus, failureby a student to complete a college program within a fixed period of time does not necessarilymean that such students have not benefited from their education or that they have not improvedtheir labour market opportunities and status.
Experimentation with jobs and college programs and continual movement between the labourmarket and the education market characterise a dynamic economy where technological changerequires a flexible, mobile and adaptable work force. The possibility for a life-long educationexperience plays a key role in ensuring that the work force has these important characteristics.This, in turn, has important implications for defining and interpreting graduation rates and for aneducation system where students complete the requirements for their degrees/certificates/diplomas and at the same time complete their formal education.
2.2 Role of the Colleges
As a starting point in any discussion of the purpose and value of KPIs in general, and thegraduation rate in particular, it is useful to identify the role of the Colleges in the post-secondaryeducation and training system in Ontario. While identifying the role of the Colleges will dependupon which group of stakeholders – students, employers, administrators, tax payers, government

13
– one asks, there is likely to be agreement that a key role, if not the primary role, is to developand augment the stock of human capital in the province.
The specific role identified for the Colleges of Applied Arts and Technology of Ontario is todevelop graduates who have achieved learning outcomes that are consistent with broad-basedemployment and societal needs and who are able to adapt to changing employment/workplacedemands, within an environment that facilitates student learning and promotes personal andprofessional growth.
Since a fundamental role of Colleges is to train people for a continually changing labour market,then graduation from a program may not necessarily correlate with the degree of success thatColleges have in fulfilling this role. Developing human capital may not require the traditionallinear model of education, where a student enters, completes the program and then permanentlyleaves.
Colleges will be successful in fulfilling their role if they allow their students to integrate life-longlearning and training with job experience. Flexibility requires students/workers to be able to haveor attain the skills and training needed to fill a large number of jobs during their careers. It willbecome increasingly rarer for an individual to enter the labour market after graduation from someeducation program and to work for the same employer and in a similar job role throughout her/hiswork-life.
Colleges will be facilitating labour market flexibility and will be supporting a dynamic economy byproviding an environment where individuals can drop in whenever they need skills upgrading orretraining, and drop out when they have achieved their personal labour market goals, only to re-enter again at a later date when a future need arises. In this world, and it is the one that isevolving, and for countries to be successful they must accommodate their social andeducation infrastructure and policies to it, the linear model leading to graduation within aset time period may become increasingly outdated.
As a result, the traditional concept and measurement of the graduation rate may be compatiblewith the education/training model that was or currently is, but not with the model that should andwill be. Current trends in the nature of work/jobs and the pace of workplace change suggest thatstudents will increasingly demand only the appropriate “bite-sized” educational modules that fittheir specific needs. Increasing demand for modularized education suggests that to measureperformance in completion of programs, many with rigid start and finish points, might be focusingon a diminishing model. An alternative model would measure course completions against courseattempts.
2.3 Defining Success
There are a number of stakeholders in the college system. As a result, success is a multi-facetedconcept. Defining success depends upon what the role is of the college system as a whole, and ofeach College within the system. And the definition will depend upon which of the stakeholder

14
groups one asks. So, it is unreasonable to expect that one indicator can provide a good measureof how successful Colleges are in achieving their goals.
Thus, that there is controversy over the definition, measurement and value of graduation rates isto be expected.
As one commentator has asked: is success to be measured by the ability of a post-secondaryinstitution “to keep clients captured for the full period of their sentence?” Furthermore,how do you measure success for programs where graduation is a failure; for example, finearts where if students have not been picked up for a role, then they have not succeeded?
Students get work experience as part of their college education, and so they may betempted by job offers while enrolled in their programs. Employers have experience withstudents and so may be more likely to offer them jobs. In the following areas – printing,graphic design and animation – employers are not waiting for students to graduate beforeoffering them attractive jobs.
Therefore, stopping out may not necessarily have negative repercussions for students and societyas whole. Students can drop out to take advantage of job opportunities and may return at a laterdate to complete their programs or transfer into new programs. Furthermore, students in Collegesare more likely to experiment with courses and programs than students in Universities because,with the exception of the professional programs at the Universities, Colleges are more career-oriented.
One of the leading researchers in the field of student attrition, Vincent Tinto, suggests that theterm “drop out” be eliminated from any future discussions about student withdrawals. Hisreasoning for not using the term is that many community college students can “stop out” fromtheir studies (i.e. leave for a period of time and then at some point return), or they can transfer toother post-secondary institutions or training programs, or they can be required to leave because ofmisconduct, or the can just quit their studies altogether. The singular term “drop out”, as used inour post-secondary system, can hinder a full understanding of the various types of “early leavers.”(Working Group Report, p. 5)
Each College has a different mix of students, faces different labour/economic market conditionsand serves different social needs. Thus, Colleges take different paths to achieve their goals – andso success for each College is difficult to define.
Nevertheless, graduation rates, if properly defined and measured, may serve a role. But alone andwithout clarification, these rates do not measure success for the Colleges. For example, OntarioColleges had an average system-wide retention rate of 55% in the 1997-98 academic year. Thegraduation rate for the US for two-year Colleges was 38% in 1997-98. Does this mean that theColleges in Ontario are more “successful” than the two-year Colleges in the US?
As well, in 1997-98 the average graduation rate for Universities in Ontario was 71%. DoUniversities better fulfill their mandates than the Colleges in Ontario? Which group better serves

15
the needs of society? Is it proper to equate the low graduation rate at some Colleges with labourmarket failure? Alternatively, is it right to assume that non-graduation equates to labour marketfailure?
In other words, a major policy issue relates to defining what is a successful graduation from aCollege. Is it finishing/receiving a diploma or is it generating a job in a program-related field?
College Graduation RateAlgonquin 61%Boreal 73Cambrian 50La Cite 46Canadore 61Centennial 49Conestoga 63Confederation 72Durham 55Fanshawe 57Georgian 61George Brown 59Grand Lacs 67Humber 53Lambton 45Loyalist 61Mohawk 49Niagara 53Northern 43St. Clair 37St. Lawrence 54Sault 51Seneca 46Sheridan 71SS Fleming 62Provincial Average 55
There also was considerable variation in the average graduation rates across Colleges andUniversities. Among the 25 Colleges, the lowest aggregate rate was at St Clair at 37% and atNorthern at 43%, while the highest rate was at Boreal at 73%. Carleton had the lowest graduationrate (46%) among the Universities, with Queen’s having the highest (87%). By ranking theColleges and Universities in descending order of graduation rates, can one conclude that theresulting rank order is appropriate in terms of their relative degrees of labour market success ortraining? We do not think so!
16
Colleges and Universities differ in many significant ways, including their pedagogical, social andeconomic roles. Accessible career programs or courses coupled with relatively lower tuition feesencourage students to enroll in Colleges who may be academically underprepared or ambivalentabout a post-secondary education. Attrition is higher for students have not completed their OACsand the open access policy for Colleges results in many such students enrolling in Colleges inOntario. As well, courses feared towards updating the skills of employees of local businesses mayattract students who do not intend to complete the full career programs.
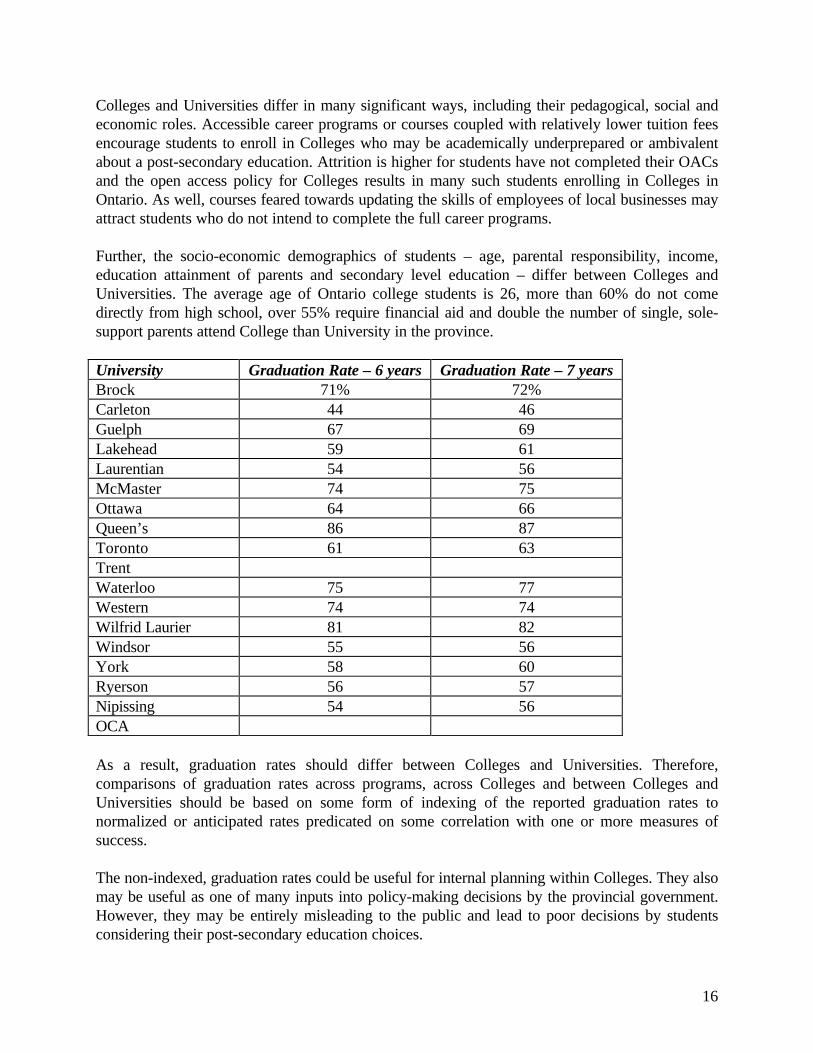
Further, the socio-economic demographics of students – age, parental responsibility, income,education attainment of parents and secondary level education – differ between Colleges andUniversities. The average age of Ontario college students is 26, more than 60% do not comedirectly from high school, over 55% require financial aid and double the number of single, sole-support parents attend College than University in the province.
University Graduation Rate – 6 years Graduation Rate – 7 yearsBrock 71% 72%Carleton 44 46Guelph 67 69Lakehead 59 61Laurentian 54 56McMaster 74 75Ottawa 64 66Queen’s 86 87Toronto 61 63TrentWaterloo 75 77Western 74 74Wilfrid Laurier 81 82Windsor 55 56York 58 60Ryerson 56 57Nipissing 54 56OCA
As a result, graduation rates should differ between Colleges and Universities. Therefore,comparisons of graduation rates across programs, across Colleges and between Colleges andUniversities should be based on some form of indexing of the reported graduation rates tonormalized or anticipated rates predicated on some correlation with one or more measures ofsuccess.
The non-indexed, graduation rates could be useful for internal planning within Colleges. They alsomay be useful as one of many inputs into policy-making decisions by the provincial government.However, they may be entirely misleading to the public and lead to poor decisions by studentsconsidering their post-secondary education choices.

17
Moreover, Colleges should not base their longer-term plans on measures of success whichmay be backward looking (in order to maintain their government funding), but rather onmeasures which more accurately reflect their longer term economic and social objectives.
2.4 Outline of the Report
The Report is organized as follows. Section 3 discusses a number of issues associated withdefining and measuring graduation rates. The issue is discussed not only at an empirical level, butalso in terms of assessing the policy distortions that could occur when comparing graduation rateswithin the college system and between Colleges and Universities.
Section 4 discuses KPIs and expands on the discussion of the graduation rate measure. Lessonsfrom other jurisdictions and some discussion of the relevant literature relating to measurementissues and the labour market experience of College and other post secondary graduates are alsopresented in section 4.
Section 5 considers graduation measurement issues as they relate to five Colleges in Ontario –Canadore College, Humber College, Boreal College, Sir Sanford Fleming and Fanshawe College.The main point for the case studies is to indicate to ACAATO the level of progress being made onmeasuring college graduation at a student level.
The final section of the Report sets out our broad conclusions with respect to measurement issuesand policy concerns. The recommendations in this section are intended to provide ACAATO andthe Colleges with a useable and practical direction for improving the measurement and the use ofcollege graduation statistics.
The appendix section, which is attached at the end of this Report, provides some of the basicbackground data and information discussed in our study. The data that are reviewed anddiscussed in the appendix includes KPI system data for the Colleges and the Universities, themeasurement of graduation rates in other jurisdictions, the five case studies and the programgraduation rate at three universities – Carleton, Queen’s and Guelph.

18
3.0 RETENTION RATES
3.1 Definition
According to a MTCU/ACAATO joint statement, retention is described as “students whocomplete diploma/certificate programs within a minimum time frame expressed as a percentage ofentering students.” The above definition is the crux of the measure currently being used. Thecohort method is currently used to measure this definition of graduation for the Colleges. Thegraduation rate also can be measured by tracking individual students and aggregating over all thestudents that enter into a College/University and/or program in either post-secondary institution.
Whichever methodology is used, the resulting graduation rate estimate depends upon when youtake the picture; that is, the time period after commencement of the program. The longer the timeframe, the higher and the more reliable will be the resulting graduation rates.
Furthermore, the graduation rates will be more accurate when they are aggregated over programsrather than measured on an individual program basis since this will capture students who transferbetween programs.
3.2 Measuring Graduation Rates: Universities
Universities assign their own identification numbers to each student who enrolls and track eachstudent, using these numbers, for up to seven years after first enrolling. The university graduationrate is measured in the following way. It is the percentage of students who enroll in a bachelors orfirst professional degree program in year X who subsequently receive a university degree betweenyear X+1 and X+7. The data are compiled by the Ministry and verified by the separateUniversities.
Graduation rates also have been calculated by relating the number of students who enroll in yearX who subsequently receive a university degree between year X+1 and X+6. As expected, thegraduation rates based on this measure using a shorter time frame are lower. They are lower byone to two percentage points according to the graduation rate data for the universities (see tableabove).
Each University has its own student identification number. There are no province-wide numbers.Therefore, the tracking system is unable to follow students across Universities, and so theresulting graduation rates may be underestimated for some Universities and over-estimated forothers. For specialized programs at the undergraduate level, the starting point for trackingstudents for the purpose of measuring the graduation rates is a student’s second year of study.Year one is considered a transition year in which students take general education courses beforethey decide on their area of specialization. Since a significant number of students drop out ofUniversity during their first year, graduation rates for specialized undergraduate programs willtend to be higher than if the starting point included all students who entered in first year.

19
In measuring the graduation rates by program, if a student starts off in Physical Education forexample, but later transfers into General Arts and graduates from this program, the student iscounted as a graduate of the Physical Education program.
3.3 Measuring Graduation Rates: Colleges
Colleges use the reverse cohort method to measure graduation rates; that is, they take the ratio ofthe total number that graduate in year X to the total number that enrolled in a one-year programin year X-1 plus those who enrolled in a two-year program in year X-2 and those who enrolled ina three-year program in year X-3. In other words, there is a single graduation year and multipleintake years. So for starters, the Colleges use a shorter time frame on average than do theUniversities. They do so because college programs are shorter than those in Universities.
The cohort method provides a reasonable measure of the graduation rate at the college-widelevel, but not at the program level. But even the aggregate college graduation rate is deficientbecause it does not capture students transferring between Colleges or between a College and aUniversity or between a College and the labour market and back again to a College.
Moreover, the program mix is an important driver of graduation rates. One-year programs arelikely to have higher graduation rates than three-year program, and this difference is likely to becompounded by the cohort method used by the Colleges to measure graduation rates.Consequently, if Colleges were to shorten program length, they could conceivably increasegraduation rates. But would this change necessarily reflect greater success by the Colleges inachieving their goals?
While the plan of the MTCU is to make individual programs at Colleges somewhat accountable interms of student success; nonetheless, comparisons of the graduation rates across programs arenot reliable. Colleges offer a much larger number of programs than Universities. For example,Carleton (with a graduation rate of 46%) listed 14 starting programs and Queen’s, with agraduation rate of 87%, listed 16 programs. By comparison, Humber College, with an aggregategraduation rate of 53% listed 83 programs and Boreal with a graduation rate of 73% listed 53programs. Thus, there is a greater opportunity and indeed and a higher propensity for students toswitch between programs in Colleges than in Universities.
Furthermore, the inclusion of the General Arts and Science (GAS) program in the graduation ratecalculations for the Colleges is problematic since Colleges use this program as remedial area forstudents. The intent is not for students to graduate from GAS but to apply to core programs ofchoice when they are qualified through the GAS studies.
Conestoga has an aggregate graduation rate of 63% when the GAS students are included in thecalculation. Excluding these students increases the graduation rate to 68%. Sheridan College has agraduation rate of 78% when the GAS students are excluded, compared to the reported 71%graduation rate. The graduation rate for GAS at Sheridan is only 13%. The graduation rate forGAS students at Lambton is 27%. This compares to the aggregate graduation rate of 45%.

20
As well, in Universities it does not matter in what program a student graduates, but rather theprogram where the student starts for purposes of measuring graduation rates by programs. ForColleges it matters in what program the student graduates. Hence, we can find many exampleswhere some college programs report very low graduation rates, while others have graduationrates of 100% or higher.
3.4 Problems in Measuring Graduation Rates
Graduation rates by program are problematic. The university tracking system assigns graduatingstudents to the programs in which they first enrolled and thus is preferable to the cohort trackingsystem, which assigns graduating students to the programs from which they graduate. However,what do the resulting university program graduation rates tell us about the “success” of eachprogram? Even though the university tracking system captures transfers between programs withinthe same institution, the reported graduation rates do not necessarily correlate with the ability of aprogram to enhance its students’ labour market opportunities.
Another problem arises when a program requires as a pre-requisite for entry a year or more ofgeneral education or another program. The GAS program at Colleges is a case in point. Inaddition, the Colleges have increased the number of programs which provide future options forstudents. In such cases, it is important to properly define the entry year, especially since 50% ofstudents who leave Colleges during the first year do so in the first semester.
If the entry year is defined as the year in which a student starts the program rather than the year astudent enters into a College or University, then graduation rates will tend to be higher, ceterisparibus, than for programs where the entry year is the one in which a student first enrolled in thepost-secondary institution. Aggregate institution graduate rates also will be higher where the entrypoint is defined as the year in which a student enters a program.
Many of the anomalies that occur at the program level, especially with the cohort system, shouldbe aggregated out at the institution level. However, both systems fail to capture transfers betweeninstitutions both within the college system and the university system and between the two systems.The university tracking system underestimates the graduation rates for each University. On theother hand, the college cohort system can underestimate aggregate graduation rates for someColleges and overestimate for others.
Another issue that arises is the appropriate time frame to use for measuring graduation rates. Thelonger the time period, the higher should be the resulting graduation rates. But does a longer timeframe necessarily correlate with “success” for both students and post-secondary institutions?
Students enrolling in University are less likely than students enrolling in Colleges to movebetween school and full-time work. Thus, university students should take less time to completetheir formal programs and receive degrees than college students in their programs. As well,university students are more likely to be committed to completing their programs (i.e. to receivethe degree) than are college students. University students may need a degree in order to improvetheir labour market possibilities. College students, on the other hand, may only need some
21
technical courses to enhance their labour market prospects and may need to periodically upgradetheir skills. Formal accreditation is less an issue in the job market for College students.
Therefore, is a longer time frame more appropriate for Universities than for Colleges? Perhapseach student should have a different time frame based on his/her expectations at the time of entryinto a post-secondary institution.
A common tracking period for all programs leads to longer possible periods for graduation forshorter programs. In addition, many entrants into post-secondary institutions have clear goalswhen they enter. Others are unclear and are likely to experiment with both programs and work.Students entering from high schools are generally required to make career choices when selectingtheir college programs, whereas in Universities they can select a number of courses in their firstyear before they decide to specialize. College students may be more likely to change their mindsregarding their programs of study or even whether completing a college program is necessary.Consequently, the same starting point may be inappropriate for all students, and the same endpoint (“X” years after the starting point) may also be inappropriate.
3.5 Other Problems in Comparing Graduation Rates Between Colleges andUniversities
There are significant differences between Universities and Colleges in terms of their roles, theirobjectives and the socio-economic demographics of their students. And so, one should expectdifferences in graduation rates and these differences should not necessarily reflect differences insuccess.
Colleges are more unique than Universities. The graduation rate measure is an output measure,and downplays the input side of the measure. Success at the College level is more than simply thegraduation rate.
Open and easy access to Colleges makes a big difference on the input side. The student body atColleges consists of older students, more students who are married and more single parents.These types of students are more likely to pursue a post-secondary education to upgrade theirskills and to accept a full-time job offer as soon as they have achieved a given amount ofupgrading rather than wait until they graduate from their programs.
The open access mandate for Colleges results in their having a number of students who require aconsiderable amount of remedial education. Special needs students may reduce measuredgraduation rates even though the Colleges are serving their social goals by helping these studentsprepare for the job market.
Unlike Universities, Colleges do not need to sell a product that is completed. In some programs,graduation and a certificate are necessary to qualify for a program-related job. In others, someskills training without formal completion is acceptable to employers.
22
One of the key roles of Colleges is to train students and help them upgrade their skills. Therefore,it is not surprising for college students to drop in and drop out. In periods of low unemploymentand tight labour markets, college students are more likely to drop out and accept job offers relatedto their areas of study. As well, in some college programs success requires students to drop outand accept job offers.
There is now a closer association between Colleges and Universities than in the past. Thatis, more students are using Colleges as pre-university preparation and move to Universitiesafter one or two years of study at a College. These students do not show up in thegraduation statistics of the Colleges, even though they move onto Universities and possiblygraduate from these institutions. At a minimum, General Arts and Science programs atColleges, which serve primarily a preparatory role, should be excluded when measuringaggregate college graduation rates.

23
4.0 KPIs
4.1 Lessons from other Jurisdictions
The Ministry of Training, Colleges and Universities shared with us some data that were compiledon the measurement of KPIs in other Canadian and US jurisdictions. Summary tables relating tothese findings are set out in the Appendix 2 section.
Alberta has implemented an individual tracking based graduation rate measure. The programcompletion rate is measured as the percentage of the entry cohort who complete the programwithin the normal program duration plus one year. The measured completion rate includes thosewho complete a program and those who transfer to and complete other programs within theCollege. The number of non-completers still active is also reported. Individual tracking ofstudents is done only at the institution level using student institutional identification numbers.System-wide tracking of students cannot be done yet, but may be possible in two years time.
Alberta also has a common KPI system composed of 13 measures for all of its post-secondaryeducational institutions. As in Ontario, the KPIs are linked to funding allocations. Alberta doesnot follow system wide student tracking, but seems to use a cohort measure similar to Ontario’s.
British Columbia has a system that tracks students based on a province wide personal educationnumber and calculates course completion rates since Colleges in BC serve as feeders into theUniversities in the province. The course completion rate is measured as the number of stable dateregistrations (usually three weeks into term) in courses who have grade of pass or better. BC hasa high course completion rate of 80%. Note that BC excludes adult basic education, adult specialeducation and English as a second language from the calculations.
BC also has a system of 26 KPIs that are intended to measure a wide range of outcomesassociated with the achievement of system goals and objectives. The KPIs have been selected onthe basis of reliability and usefulness. The following principles guided the selection of the KPIs inBC:
• Consistent data definitions and collection across college system;• Emphasis on measuring results (outcomes and outputs);• Valid measures of what they are intended to measure;• Reliable over time; and• Clear, understandable and transparent.
The general categories for the KPIs are:• Relevance and Quality – ensure learners are able to acquire the skills and knowledge
needed; ensure learners acquire the necessary competencies to function successfully in lifeand work; ensure learners are able to acquire job readiness and job specific skills;
• Access – ensure opportunities exist for participation in post-secondary education andtraining and that opportunities in all regions reflect regional education and training needs;eliminate attitudinal and physical barriers affecting participation of non-traditional learners;

24
promote equity of access across the system; improve opportunities for successfulcompletion of post-secondary education; and
• Affordability – ensure post-secondary education is affordable to students; ensure post-secondary education is affordable to taxpayers.
Newfoundland measures the graduation rate for the sole College in the province by taking thenumber of graduates in a given year as a percentage of the total number of entrants within normalprogram duration. The graduation rate calculations use student information numbers. Studentswho leave before the academic prejudice date are excluded from the calculations. The graduationrate is 50% in the province.
Two US states, Kentucky and South Carolina, use social security numbers to track students andto calculate graduation rates.
Both South Carolina and Kentucky calculate the graduation rates by taking the first-time, full-timedegree-seeking cohort of students who graduate within 150% of program duration. SouthCarolina excludes from the calculation of the graduation rates students taking two or moreremedial courses since completion of programs by these students may take more than 150% ofprogram duration. Kentucky also calculates the persistence rate: the percentage of full-time,degree-seeking freshmen who either graduated, transferred to another public institution or werestill enrolled at the original institution after 150% of program duration. The graduation rate inKentucky is11%. The persistence rate, which is more comprehensive, is 46%. The graduation ratein South Carolina is 14%.
The US National Center for Education Statistics (NCES) published a survey of all funded two-year college programs. NCES is the benchmark source for graduation rate calculations in the USand its benchmark is to calculate the graduation rate for a cohort within 150% of normal programduration. Thus, for a two-year college institution, graduation would be calculated based on threeyears after entry (i.e. the number of students who enter in year X and the number who graduate inyear X+3).
In closing, comparisons of graduation rates across jurisdictions are problematic because differentapproaches and definitions are used. However, Ontario’s aggregate college graduation rate (55%)compares favourably with the graduation rates in other jurisdictions. For example, the national UStwo-year college graduation rate was 38%. The rate in Newfoundland was 50% and thegraduation rates in Kentucky and South Carolina were 11% and 14% respectively.
4.2 Ontario
The proposed accountability framework for Colleges in Ontario is intended to consist of a two-tier system of performance indicators: those which derive from the shared goal and commonoutcomes of the college system and those which reflect the mission, values, and strategic directionof the individual Colleges.

25
The first level is comprised of five performance indicators that will be measured at each Collegeusing standardized definitions and measurement tools. They include:
• Student Satisfaction• Post-College Outcomes/Graduate Success• Graduate Satisfaction• Employer Satisfaction• Quality Assurance.
The suggested performance indicators for the second, equally important, level are intended toprovide Colleges with sufficient flexibility to relate the Accountability Framework to theirindividual mission/strategic direction:
• Access• Fiscal Responsibility
The objective for the Student Satisfaction indicator is to measure performance against the goal ofquality education and the student success-related goal of meeting the needs of students. Theobjective is to capture a variety of information from the students’ perspectives, including theirviews regarding the quality of their learning experience; its relevance to future employment,further education and life beyond the workplace.
The Post-College Outcomes/Graduate Success indicator is intended to measure performanceagainst the student success-related goals of: finding employment and continuing with educationalpursuits. The objective is to capture information in order to determine whether alumni are able tofind appropriate employment within a reasonable time frame after leaving College and/or alumniare able to gain entrance to further post-secondary studies of their choice.
The Graduate Satisfaction indicator is intended to measure performance against the studentsuccess-related goal of meeting the needs and objectives of students. The objective is to determinethe opinion of college graduates regarding their college experience, including their views as towhether their College helped prepare them for a specific occupation, a specific field of work,work generally, further educational pursuits, better citizenry, or meeting other personal objectives.
The Employer Satisfaction indicator is intended to measure performance against the goal ofquality education and the student success-related goal of student employability. It is importantthat employers are satisfied with graduate preparedness, program relevance, and the Colleges’ability to meet emerging employer needs. Measuring the rate of employer satisfaction will providean indication of how well employer needs are being met by the college system.
The Quality Assurance indicator is intended to demonstrate that the College has and uses internalaccountability processes to ensure the quality of college programs. This graduation rate serves asthe proxy for this indicator.
26
The purpose of institutional performance indicators would be to acknowledge the diversity andthe particular strengths of each College in order to support the individual Colleges in movingtowards their stated strategic directions. The two general institutional performance indicatorswould be Access and Fiscal responsibility.
Access issues would include the ability of students to pursue their chosen program of study withina reasonable distance from their home, without undue regard for individual disabilities or otherpersonal factors, within a time frame which is reasonable responsive to individual backgrounds,circumstances and needs.
Fiscal responsibility refers to a College’s use and management of its financial resources such as itsadministrative efficiency and its ability to obtain, organize and administer resources so thatstudent learning outcomes are achieved at reasonable costs.
4.3 Literature Review
A research report by Daniel Parent, “Labour Market Outcomes and Schooling in Canada: Has theValue of a High School Degree Changed over Time”, analysed the school-to-work transitionprocess in Canada, focusing on the value of a high school diploma. Statistics Canada’s “SchoolLeavers Survey and its Follow-Up” was used by Parent to derive details on labour marketperformance (earnings, jobs, and training histories etc.). The purpose of the study was todetermine whether the value of a high school diploma (excluding the option value of pursuingpost-secondary education) has markedly changed over the past 15 to 20 years. His conclusionswere as follows:
• the premium to holding just a high school diploma in Canada is substantially lower than inthe United States;
• labour earnings of high school graduates have stagnated and even decreased relative tothose of dropouts, without major changes in the relative employment rates;
• the earnings premium of a university degree has been increasing since the mid 1980s;• high school graduates’ labour market outcomes in Canada are essentially no better than
those of high school drop outs, except perhaps in terms of employment rates; and• high school attrition was very sensitive to local labour markets.
Robert Allen found, in his study “Education and Technological Revolutions: The Role of theSocial Sciences and the Humanities in the Knowledge Based Economy” (November 1999), thatthere is a link between the level of education and employment success as reflected inunemployment rates.
“Thus the highest unemployment rates are those of high school dropouts. They are followed byhigh school graduates and people with a technical or trade certificate and then by those with acollege diploma......The mediocre performance of those with a college diploma and the poorperformance of those with a trade certificate is inconsistent with the basic view that specific skillsguarantee a job in the new knowledge-based economy.”

27
Allen did note that those with some university education experienced considerably higherunemployment rates than those with a university degree. The unemployment rate difference in1996 was 2.1% for women and 3% for men.
He also reported that the percentage of Canadian workers in 1996 with managerial or professionaloccupations also depended upon academic credentials. For example, 71% of bachelor degreesgraduates, 59% of those with some university experience, 48% of college graduates, 25% ofthose with trade certificates and 25% of those with only a high school graduation diploma wereemployed in a managerial or professional occupation.
The data Allen presented in Tables 5 and 6 of his study indicate positive correlations betweenincome levels and the level of education for both men and women. That is, incomes tend to risefrom high school non-completes, to high school graduates, to trade certificates and collegediplomas.
Finally, in terms of total employment growth between 1991 and 1996 by level of education, Allenreported that total employment contracted for high school graduates and non-completes and tradecertificates, while employment for those with a college diploma grew very strongly.
John Mohammadi’s study, “Exploring Retention and Attrition in a Two-Year Public CommunityCollege” (VCAA Journal, Spring 1996, 39-50), attempted to explain the retention and attrition intwo-year public community Colleges in the US in order to assess the usefulness of indicators ofstudent retention and attrition for determining the effectiveness among community Colleges.
Mohammadi noted that there are conflicting views of retention and attrition at US Colleges andthat most studies do not take into account the external environment affecting student participationin College.
According to Mohammadi, “There are two main reasons for this argument: (1) demographic andsocio-economic factors relating to community college students are somewhat different from thoserelating to students attending four-year colleges. That is, on average, community college studentsare older, attend part-time more often, do not reside on campus, have lower degrees of goals,have lower high school grades, have more modest financial resources, are employed for morehours, have more family responsibilities, have relatively little interaction with other studentsoutside of class, and are not strongly involved in campus activities and (2) external forces,particularly those related to community forces in the immediate geographical environment of thecollege’s service area, are also important in understanding and interpreting the retention andattrition patterns at two-year public community colleges. For example, the need for training andretraining of the work force for business, industry, and governmental agencies within anycommunity college service area changes the social composition of the student population, thusrequiring different definitions and methodologies to study student departure.”
His principal conclusions were:

28
• the students’ goals for attending College are a very strong predictor of retention – 40%who left College after one year had no intention of completing a de gree or certificateprogram;
• demographic and socio-economic factors, combined with an open access policy by thecommunity Colleges, influence the attrition/retention rates – “Institutions that admit largenumbers of less-well prepared students will tend to have low retention rates, regardless ofhow effective their retention programs are” – consequently, it is unfair to compare theretention rates of different types of institutions; and
• college planners and government need to recognize that social forces in the immediatecommunity directly influence retention and attrition.
Mohammadi’s conclusions seem to speak strongly to the Ontario College retention issue, andwere certainly supported by the feedback we received at our two Roundtable meetings withCollege Presidents and officials and in our other stakeholder interviews.

29
5.0 THE FIVE COLLEGE CASE STUDIES
5.1 Overview
We undertook to examine the experience and the graduation rate statistics for five Colleges –Boreal, Canadore, Fanshawe, Humber and Sir Sanford Fleming. Officials at MTCU believed thatsome student tracking was going on with respect to program graduation rates. So one of thereasons the case studies were undertaken was to see how much individual student tracking wasactually going on at the college level.
Some of the key questions we posed to the college officials included the following:
• What is your college’s capacity with respect to developing alternative methods ofmeasuring attrition and graduation?
• If your College had access to an individual student tracking system for calculatinggraduation rates, would it be helpful for strategic planning and programming?
• How close is your College to actually tracking student graduation?
• How much work would be involved in introducing a student tracking system?
We requested examples of the data in the case where the College is tracking students byidentification number. We also inquired as to the college’s interest in and capacity for developinga student tracking system for measuring attrition and graduation rates more accurately andwhether the College had been tracking successful versus unsuccessful leavers. We inquired aboutthe extra costs of developing this capacity.
Here is how the graduation rate measures of these five Colleges compare to the total system andto each other.
1997/98 Grad Rate Enrolment FTE BasisBoreal 73% 1,234Canadore 61% 2,658Fanshawe 57% 8,839Humber 53% 11,767Sir Sanford Fleming 62% 5,145Average: 5 Colleges 61%Average: 25 Colleges 55% 168,779University Aggregate 71% 242,889Source: Data provided by Colleges Branch, MTCU
We include program graduation rates for the five Colleges in the Appendix 3 section of the report.
When we examine the graduation rate figures at a program level we discover that:

30
• The Colleges are tremendously diversified in terms of program offerings. Since separateprograms have far different graduation rates, the comparisons of aggregate graduationrates between Colleges present some problems.
• While many of the college programs are similar, there are also some distinct differences.For example, Humber lists 73 programs on its web site, Boreal 51 programs and SirStanford Fleming lists 60 programs. Clearly, the programs differ markedly, and of coursethis provides the job oriented college entrants with significant choice.
The following table presents the distribution of full-time students by program at all Colleges in
College Preparatory/upgrading
Visualandcreativearts
Humanservices
Computing-electronics
Business Health Tech.
Algonquin 4% 12% 13% 21% 29% 7% 14%Cambrian 10 10 25 12 17 9 17Canadore 12 9 15 8 31 9 17Centennial 5 3 11 18 38 8 18Conestoga 4 6 14 12 30 12 21Confederation 9 5 21 6 27 9 23Durham 5 11 17 10 33 8 16Fanshawe 12 13 12 8 28 7 19George Brown 3 18 14 9 28 16 13Georgian 3 12 10 8 39 12 16Humber 5 17 10 14 32 11 12Lambton 17 4 19 8 24 6 22Loyalist 6 17 26 10 20 6 16Mohawk 4 10 13 16 24 15 18Niagara 8 12 21 13 30 6 10Northern 8 2 22 11 23 11 23St. Clair 5 7 11 11 23 15 28St. Lawrence 12 3 16 16 28 18 7Sault 9 4 17 14 14 12 30Seneca 4 10 11 22 38 3 13Sheridan 7 28 16 11 28 2 7SSFleming 2 1 25 7 22 8 36La Cite 5 16 24 20 17 7 10Boreal 9 0 22 8 20 27 14Grand Lacs 0 14 17 5 45 18 0 Note: Based on 1997-98 data (full-time students).

31
Ontario. Both Boreal and Canadore have 12% of their students in Preparatory/upgradingprograms. Humber and Fleming, on the other hand, have only 5% and 2% respectively of theirstudents in these programs. Humber, Fleming, Canadore and Fanshawe have between 28% and32% of their students in Business programs, while Boreal has only 20% in these programs. Borealhowever has 27% of their students in Health programs. None of the other four Colleges has morethan 11% in these programs. Fleming has 36% of their students in Technology programs while theother Colleges have less than 19% of their students in these programs.
In light of these differences, it is not surprising that graduation rates differ among these Colleges.
5.2 Separate Comments Based On Discussions With College Officials
Boreal
Boreal is a relatively new Francophone College which began its operations in 1995. Boreal hasmore female than male students, and its administrative system is unable to track the studentpopulation based on family incomes. However, the College knows that may of its students arepresently receiving social assistance, and that the average age of the students is between 24 and29 years of age. Boreal’s students are heavily dependent on external financial aid.
Since the families of the College’s students often have had little formal education, the College hashad to introduce mechanisms to support student study skills at the entry level. The Collegeemphasizes that a considerable number of its students are mature and in debt before they arrive atthe College.
The College has minimal student tracking in place, though a common student numbering systemdoes exist that could be used to track individual students. The College does track students forgraduation purposes. As in the other Colleges, Boreal’s students seem to be in motion; i.e.considerable program experimentation and movement.
The College is proud of its common first year program in three areas: business, human servicesand technology. The College often has students finishing a two-year program with one diploma,then adding an additional year and receiving a second diploma. That is, after three years, they endup with two diplomas in two different programs.
The College acknowledges the improved information flow associated with a student identificationand tracking system. The College could not estimate the additional costs of implementing astudent tracking system. And as in other Colleges, Boreal would like to see the individual trackingfor graduation stretched out beyond six months of the normal program.
A measurement problem might arise with respect to the common one-year program. In the aboveexample, what is the actual point of entry for a student who finishes after three years with twodifferent diplomas? This could be a serious problem in terms of measuring the graduation rate.
Canadore

32
The officials pointed out that the Colleges are very different from the Universities. Theyemphasized three important differences: Colleges provide more program offerings thanUniversities; the student mix is very different in that Colleges have a higher proportion of olderstudents; and finally, Colleges are not identical to each other as each College tends to focus onprograms that they excel in.
Canadore has a withdrawal form which it tries to have its “early leavers” complete. According tothe information, students seem to withdraw primarily for personal reasons or financial need. TheCollege also employs informal surveys of early leavers. But a large number of students leavewithout any explanation.
It is interesting to note that Canadore has used a cohort measure of program graduation before itwas introduced by the Ministry. Canadore found the measure useful because it assumed that anymovement of students was roughly similar from year to year. The College has the potential tocreate a historical cohort track record based on its own records, but this would be costly andrequire extra resources.
It was recognized that the student tracking approach was superior to that of the cohort approach.Canadore could introduce a student tracking system based on its student identification number,but it would involve the development of some extra computer software and other costs.
Finally, the College worries about the misuse or damage that could result from the disseminationof program graduation rates. On balance the College sees value to a direct student trackingapproach for measuring graduation.
Fanshawe
Fanshawe, and the other Colleges, have a form that students fill out when they withdraw. But theydo not have a survey of early student leavers. However, Fanshawe has a system for identifyingstudents at risk based on the incoming grades of the students. This represents the full extent ofstudent tracking.
Fanshawe provided us with written answers to our structured questionnaire. Several excerpts areset out below.
• 41% of Fanshawe student population enter College directly from high school, comparedwith the system average of 46%;
• Many more students in College are married or sole-support;• Fanshawe does not use pre-admission testing for entrance to the College;• Many programs at Fanshawe now have common curricula in at least the first semester;• The College administered an exit survey in 98/99. In general, the results of the survey
were inconclusive, with the majority of students stating personal and financial reasons forleaving;

33
• The anticipated extra costs (to shift to an individual student tracking system would includeapproximately one programmer for a year ($50,000) plus $10,000 for equipment. On-going costs would be approximately $10,000.
Humber
One of the College’s key officials has been researching the subject of retention and graduation forabout 20 years. Consequently, the College has been tracking individual students and studentleavers and has developed a software program that has been shared with other institutions. TheCollege has been using a student tracking system for planning and programming. The College hasalso been measuring student aptitude at entry and at the point of graduation.
On an empirical basis, Humber data suggest that approximately one-third of all first-year entrantsleave the system. The one-third ratio fluctuates over time depending upon the strength of the jobmarket. Clearly, in a strong cyclical upturn, the pull out of the Colleges into the job market ishigher. Of those who leave programs and/or the College, roughly 40% of the leavers are regardedas successful leavers, with the other 60% as failures.
Successful leavers are likely to be older students, with higher skill levels at entry, who wereunclear about the college program delivering a job. .
Sir Sanford Fleming
This College has been involved in some extensive student tracking, and has calculated its owngraduation rates by program based on the individual student number. The College is convincedthat the individual student tracking method yields far better information. The College started thetracking program for entry classes in 1994-95, 1995-96 and 1996-97. Its tracking methodidentified conditional graduates and non-graduates, and students who graduate from differentprograms than they started in.
The College recognized that this kind of information is superior and it was uncomfortable with theassumption that with the present cohort approach every thing evened out. The College also feelsthat the individual student tracking system to be imposed should be similar to the one used by theUniversities. Finally, it is also important to understand and identify student mobility betweenprograms and in and out of the College.
The College does not have any follow up information with respect to the labour market success ofits leavers beyond the KPI filed information. The College does, however, interview students withrespect to reasons for withdrawal. The primary reasons seem to be personal, financial and/orprogram related.
Sault College Of Applied Arts And Technology
Since Sault College was unable to provide input though the Roundtable discussion, officials at theCollege wrote to Arthur Donner with respect to the College’s practices and interests. Theinformation is included under this section.

34
The key issues identified were:
• Students typically do not graduate in the time frame specified for their programs. Themajority of three-year program registrants will graduate in a time frame beyond threeyears.
• The number of programs that have future options available to the student has increasedover the last five years. Students can opt for a different program after their first year. Thiscauses difficulty in calculating a graduation rate based on the first year cohort.
• Uncompleted courses at the end of a semester and subsequently finished, may cause thestudent to graduate after the peer group. Our system does not then include this graduate inthe cohort.
• GAS program is designed primarily as a feeder program and therefore should not beincluded in the Graduate calculation.
• Transfers in and out of a program will change the cohort and therefore affect thegraduation rate based on the present definitions.
• If clustering is allowed on a College by College basis, there will be no system data that arecomparable.
• Our present client information system does not allow tracking by student. If arecommendation emerges using this type of tracking method, Sault College will not beable to comply.
The College also put forth the following possible recommendations:
• Have MTCU calculate a retention rate across the system by using the enrolment dataalready submitted for audit purposes and the graduate data also completed by audit.
• Drop the graduation rate as a KPI. Concentrate on the employment rate and studentsatisfaction.
• If retention is deemed as critical, concentrate on year-to-year retention as a measure ofperformance, not on the graduation rate. This would allow the system to generate data onwhy students leave and recommend solutions.
• If the graduation rate is deemed critical, allow the time frame to exceed the programduration.
• If a student tracking system is deemed appropriate, Sault College will require Ministrysupport to change its Information Systems to comply.

35
6.0 CONCLUSIONS
6.1 Measuring Student Success
Most Colleges reject the status quo measure of graduation and attrition and accept that a newmethodology is needed.
There are three important issues regarding graduation rates – how should graduation rates bemeasured; what do comparisons of graduation rates across post-secondary institutions tell usabout the labour market success of students who attend these institutions; and should graduationrates be used for funding allocation decisions by the provincial government?
It is clear that using graduation rates as a measure of student success in comparisons acrossinstitutions may yield misleading conclusions unless one normalizes these rates for differences inthe socio-economic demographic composition of the student bodies, mix and number of programofferings, labour market conditions and admissions standards. However, this normalizationprocess would be difficult, if not impossible. In other words, one needs a multi-variate measurefor student success.
Furthermore, even if one could construct such a measure, what would be the appropriatecomparator group of post-secondary institutions – only Colleges in Ontario, all Colleges acrossCanada, all Colleges in North America, or all post-secondary institutions in Ontario, Canada orNorth America?
Cohort tracking systems may produce reliable measures for the graduation rates at the aggregatelevel if appropriate starting and end points are selected and a forward moving cohortmeasurement system is used. The current cohort systems used by Colleges in Ontario areinappropriate and produce graduation rates that are too low because they use too early a startingpoint for most programs, but more critically, too early an end point.
If graduation rates, however they are measured, are used without normalizing for institutionaldifferences, including their mandates and roles within the province, as a KPI for provincialallocation of funds to post-secondary institutions, they may distort planning at Colleges. Inaddition, this could also inhibit the ability of Colleges to adapt to changing economic and socialconditions.
Graduation rates, properly measured, can be useful for the Colleges for internal planningpurposes. But without normalization and qualification, graduation rates that become publicinformation may lead to incorrect decisions by students considering their post-secondaryeducation and training options, in addition to inappropriate allocations, from an economicefficiency perspective, of government funding of post-secondary education and traininginstitutions in the province. Colleges do not really know what appropriate graduation rates shouldbe, so how can the public be expected to interpret these rates and make the right decisions.

36
Nevertheless, graduation rates may be turned to as a measure of success. So it is imperative thatthe measurements be improved. It is also important that they not be used without anyqualifications or adjustments.
One could attempt to normalize graduation rates through the use of econometric techniques. Thatis, one could use a cross-section and time series data set consisting of graduation rates (measuredin the same way for all post-secondary institutions in the province); demographic, education andemployment characteristics of the student bodies; local economic conditions; and one or more setsof dummy variables for each post-secondary institution in the province. The dummy variableswould reflect differences in the roles of these institutions. Regressing the graduation rates againstthese other variables would provide a means for normalizing graduation rates for each institution.
While the resulting normalized graduation rates would be useful as a KPI for budget allocationdecisions by the province, they still may be weakly correlated with student or institutional success.Hence, some other measures should be developed that together with normalized graduation ratesprovide more comprehensive indicators of student and institutional success.
6.2 Graduation Rates as an Indicator of Success for Colleges
Colleges are more unique than Universities. Students entering the Colleges from high schools aremore immediately required to make career choices than their counterparts entering Universities.That is, to a greater degree than is possible at the college level, students entering University canselect a number of courses in their first year before they decide to specialize.
Moreover, the graduation rate is only one output measure, and downplays the measures of inputs.Open and easy access to Colleges compared with Universities makes a big difference on the inputside. Open and easy access is regarded as a societal goal. Colleges do not require high schoolOACs. As well, the graduation rates of Colleges may be biased downwards because they accept arelatively high proportion of special needs students who are less likely to graduate.
Success at the college level involves more than graduating students. In some programs,graduation and a certificate are necessary to qualify for a job. For other jobs, formal credentialsare not required. Only some degree of training and work experience are necessary.
The graduation rates as currently measured by the Colleges are most likely underestimated incomparison to the graduation rates produced by the methodology used by the Universities inOntario.
Comparisons of the aggregate graduation rates between Universities and Colleges at presentwould be misleading for a number reasons. Comparisons of program graduation rates at Collegesto graduation rates at program levels in Universities would be completely misleading. Theintroduction of a student tracking system at the college level would help provide for moremeaningful comparisons.

37
Indeed, mounting a pilot program involving a small number of Colleges would provide usefulinformation to determine whether the introduction of a student tracking system similar to theUniversities would be useful and cost effective.
However, whatever system is used to measure graduation rates for the Colleges, it is important touse appropriate entry points (the time when a student actually begins a program) and end-points(the elapsed time for a student to have completed a program). This also suggests that there wouldbe value in a pilot program where each College experimented with different entry and graduationtime frames.
It is important to keep in mind that success is multi-faceted, so there is a need for other measuresbesides successful graduation. Some of these measures may have to be institution-specific sinceColleges differ in many ways. In developing other indicators and a better measure of graduationrates, historical context will be very important. A one-size fits all approach may not beappropriate.
Graduation rates should be expected to differ across Colleges and programs and betweenColleges and Universities. However, there probably is some kind of steady state or base caselevel of measured differences. If one could normalise for these differences, then one couldstart to determine how to improve upon the differences.
Current aggregate college graduation rate measures can mislead because of differences indemographics, different admission standards, different mix of programs and courses, and differentlabour and economic market conditions. The public rarely considers all of these variables in termsof reflecting upon the meaning of an aggregate college graduation rate figure.
What all of this suggests is that even comparisons of aggregate graduation rates across differentColleges is somewhat misleading without a long track record of graduation rates to compare.Moreover, the same case can be made for University comparisons within their system.Comparisons across Colleges and Universities, while perhaps interesting, provide very little usefulpublic policy insight.
6.3 KPIs
The numeric approach associated with KPIs is intended to provide a useful tool for studentsselecting between different Colleges and between Colleges and Universities. At the same time, thenumerical approach allows the MTCU to evaluate whether each College is achieving its objectivesas reflected in large part in graduate employment, graduate satisfaction, student satisfaction andemployer satisfaction.
Implicit is the thinking that somehow the KPIs can capture best practice delivery of programs,training, and ultimately jobs. But in broad brush terms, the numerical approach associated withKPIs suggests a level of precision that may not really be appropriate.

38
For example, when linking KPIs to the labour market opportunities of graduates (the mostimportant final outcome), it is clear that there is a significant time frame problem. That is, theeffects on labour market outcomes have to be measured at an individual level and over time. Butthere are many “non-controllable variables” which are also determinants of labour market success– ethnicity, socio-economic background, region, pre-school family incomes, education levels ofparents, literacy, etc.
As well, there is the issue of the quality of the working career post graduation from College; forexample, income levels over time, the stability of the job, the nature and flexibility of the job (part-time, full time, self employment, etc.).
But there is a strong case to be made that the college graduation rate may not truly reflect labourmarket success. On the positive side, it might well be that well structured KPIs are a usefulcatalyst for change with respect to all of the stakeholders and could lead to more focused actionwith programs moving in the right direction.
Each college recognizes its obligation to its many stakeholders to provide assurance that itsactivities are inclusive of and consistent with its specific values, goals and strategic direction.External accountability processes could provide objective means by which those who use, supportand fund the Colleges can be assured that their confidence is well placed.
6.4 Recommendations
Measurement Of Graduation Rates
Graduation rates can be estimated for individual programs, for clusters of programs and/or at theaggregate institution level. Graduation rates for individual programs or clusters of programs willbe useful for internal planning by each College. Institutions need to monitor what happensinternally from semester-to-semester and among programs.
But graduation rates for individual programs can be misleading for students making decisionsregarding institutions and programs and may be inappropriate for making funding allocationdecisions across post-secondary institutions. The links between student/institution success andgraduation rates are even more tenuous at the program level than at the level of the institution.Consequently, if graduation rates are to be used as one of the KPIs for funding allocationdecisions by the province, college-wide graduation rates are preferred relative to the programgraduation rates.
In addition, these rates should be normalized using the econometric methodology we outlinedabove.
The graduation rates can be calculated using any one of the following three models:
• cohort tracking: group A at time X and compare to group B at time X+Y;• cohort tracking: group A at time X and compare to group A at time X+Y;

39
• individual student tracking: each individual starting at time X and compare to same set ofindividuals at time X+Y.
In the absence of a pilot program comparing cohort model 2 with individual tracking (model 3),we cannot choose between these two models. But either one is preferable to the current approach– cohort model 1.
Over time, we would suggest moving to a system where students are given a provincial studentnumber so that they can be tracked if they move from one institution to another. In other words,individual student tracking across the entire post-secondary education/training system in theprovince is the preferred model in the long run.
If graduation rates are to be estimated using individual student tracking, the provinceshould subsidize, through a one-time cash payment, the costs for each College to acquireand develop the needed computer hardware and software. Only the province, using itsfinancial levers, can ensure that a uniform system – computer software, similar lengthstudent identifiers – will be developed by all the Colleges.
A pilot study involving a small number of Colleges should provide a reasonable estimate ofthe upgrade costs for all Colleges. Of course, the financial assistance by the province shouldinvolve new money and not arise from a reallocation of existing operating and capitalgrants.
At this time, it appears that the following Colleges would have some difficulty in moving quicklyand at minimum cost to student tracking system based on institutional individual student numbersfor calculating graduation rates – Boreal, Confederation, Durham, Fanshawe, Lambton, Northern,St. Clair and Sault.
As for the time periods – X and Y – we recommend that X begins after the first semesterfollowing the entry of a student into a program. This will exclude those students who areuncertain about whether or not they made the right decision to go to College and about whetherthey selected the right program. Further, we recommend that Y be at least 150 percent of the timeperiod for completing a program (this happens to be the official US NCES norm) – 4.5 years for athree-year program; three years for a two-year program and 1.5 years for a one-year program.Furthermore, feeder programs and remedial programs should be excluded from the graduationrate calculations.
The combination of a pilot program and Y years of tracking the first group of students means thatit will take at least five years before any meaningful information will flow from the newmeasurement system. The pilot project however, will provide in a much shorter time frame anindication of how reliable the existing cohort tracking method is in generating estimates ofaggregate, institution level graduation rates. Assuming a forward moving cohort system producesreasonable estimates, then it may be appropriate for the government to have greater confidence inthe normalised graduation rate figures for planning purposes.

40
Nonetheless, it is crucial to remember that even the current five KPIs together may not provide anaccurate measure of the success of each College in achieving its goals. Other KPIs, some of themalong the lines of those used in BC, may be needed in order for funding allocations to create theright incentives for Colleges.
Pilot Projects
The provincial government should sponsor and underwrite the costs of several pilot studies. Asmall number of Colleges (3-4) should be selected to develop individual student tracking systems.The Colleges should experiment with different entry points and time frames for measuringgraduation rates. In order to provide information more quickly, the Colleges should apply thesystem to historical data; that is, they should go back four or five years if possible.
The Colleges should differ in terms of size (student body, number of programs), current level ofsophistication in tracking students and geographic location. The roles of the pilot projects shouldbe as follows:
• to see if the additional costs of a more complex tracking system are warranted by theproduction of more reliable estimates of graduation rates;
• to estimate the system-wide costs of moving to a more complex individual studenttracking system;
• to examine the impacts on measured graduation rates of different assumptions for startingand end points; and
• to see whether there is a high correlation between graduation and labour market success.
The MTCU should not rush out to create a new system that might be too costly and/or producemarginally better estimates of graduation rates and other measures of student success. There is aneed to experiment to find the most appropriate measurement methodology. The MTCU shouldalso examine the feasibility and costs of moving towards provincial student numbers and province-wide tracking of students.
6.5 SUMMING UP
The graduation rates and the attrition rates are important public policy educational indictors. Butat best they represent only rough proxies for student success in the labour market.
Attrition rates are important financial indicators for the Colleges. To some, attrition symbolisesthe wastage of educational investment funds; whereas in fact, some attrition may be a healthy signof a strong job market.
Consequently, there is a need to improve the data on graduation/attrition rate measures at thecollege level. Experience suggests that the optimal system would track students directly.
The Ontario government allocates about $700 million annually to the Colleges, and thus theattrition information is useful, and relative to the total budget, the extra funds for improving the

41
measuring of graduation rates and for developing other measures of success should be found.There is a strong case for investing more money in the measurement of graduation rates so as toimprove on the quality of the data on a program basis.
Note that the government surveys college graduates for their employment records. There is nocomparable survey of attrition (successful or unsuccessful in job market terms) from the system.There is a need for good data relating to why students leave and their subsequent employmentrecords.
In closing,
• While the four KPI measures that are tied to funding at the college level are useful to all ofthe stakeholders, the current measure of graduation at the college program level is flawedand misleading.
• The aggregate measure of graduation at the college level is probably reasonablyrepresentative of the total picture. However, comparisons across Colleges can bemisleading, particularly since there is no attempt to normalize the data for differences inprograms, location, and/or the demographics of the student population. .
• The introduction of a university style measure of graduation at the program level (i.e.following individual students rather than cohorts of students) would be an improvementover the current system. But recognize that using a college institution identifier will stillhave the problem of capturing and measuring students moving between different Collegesand in and out of the college system programs (either to the job market or to other post-secondary educational opportunities).
• ACAATO should propose that MTCU move towards introducing a student trackingmeasurement system for graduation based on the Colleges’ student identification numbers.
• To ensure that the graduation rate data at the program level are reliable and notmisleading, ACAATO should suggest that MTCU sponsor several pilot studies,experimenting both with measurement and interpretation of the data. While the universitymeasurement system based on student tracking is superior to the current college cohortbasis measure, it is also clear that even the university style system has some problems.Consequently, The Ministry is advised not to rush out to create a new system that couldalso mislead. There is a need to experiment to find the most appropriate measurementapproach.
• ACAATO should also petition MTCU to undertake a survey of early leavers from collegeprograms, attempting to identify successful from unsuccessful college leavers in terms ofthe job market.
• How long will it be before meaningful graduation information flows from a new system –at least five years after the new system is introduced.

42
• Finally, the best system would be based on provincial student identification numbers, sincethis would allow the Ministry to track students in and out of of post secondary institutionsand in and out of the labour market.