Embed Size (px)
Citation preview

Research Article
FACTOR INFLUENCE STUDY OF IVABRADINE HCL OSMOTIC PUSH PULL TABLETS USING FRACTIONAL FACTORIAL DESIGN
SONA P. S1, C. MUTHULINGAM2, DR. G. GEETHA 3*, DR. R. VEKATA NARAYANAN4
1 Department of pharmaceutics, RVS college of pharmaceutical sciences, 242 B, Trichy road, Sulur, Coimbatore, Tamil Nadu, 641 402, 2Aurobindo pharma Ltd, 313, Bachupally, Quthubullapur(M), RR District, Hyderabad 500090, A.P.,3Department of Pharmaceutical
Analysis, PSG College of Pharmacy, Coimbatore, Tamil Nadu, 641004, 4RVS college of pharmaceutical sciences, 242 –B, Trichy road, Sulur, Coimbatore, Tamil Nadu, India 641402. Email: [email protected]
Received: 17 Dec 2013, Revised and Accepted: 11 Feb 2014
ABSTRACT
A push pull osmotic tablets of Ivabdradine was formulated and different factors affecting the release profile were studied with the help of design of experiments. A fractional factorial design was used for the factor influence study. Various core and coating factors were selected for the study. The responses selected were lag time, Zero order rate constant, PCUR at 24 hrs. ANOVA and regression analysis were used for the identification of significant factors and constructing the polynomial equation representing the responses. A 5 % SL (p< 0.05) was chosen for the study. Various plots like Half normal plot, Normal plot, Pareto chart were also studied. The factors which were affecting the PCUR at 24 hrs were identified as Propylene glycol > weight gain> Nacl in the DL. The significant factors which were affecting the R2 were Nacl DL> Nacl PL. The lag time for the drug release was greatly affected by PEG > Weight gain > Nacl in the DL. The simultaneous effect of two factors were represented and studied with the help of contour plots and response surface plots.
Keyword: Design of experiments, PCUR, Contour plot, Response surface plot, Factor influence study.
INTRODUCTION
Design of experiments is nowadays widely used for the pharmaceutical product development and optimization. One has to be very conscious while choosing the right design for any study. As the statistical designs are based on assumptions, a wise selection of design is mandatory for the success of the research. Plenty of designs are available for designing the experiments during the product development. The following flow chart will be showing the basic steps for the systematic approach followed while applying the DoE in product development. With the help of the designed experiments, the effects of multiple variables on the responses can be studied. When sufficient literatures are available about the different factors affecting the product as well as process, the first step, ie, the screening study can be omitted. Out of many trivial factors the vital factors were identified and can proceed with the factor influence study. Factor influence study will be helpful for identifying and quantifying the significant factors. So final optimization can only include the significant factors identified after factor influence study. This step will minimize the number of factors included in the optimization study thus drastically reducing the experimental trials.
Fractional factorial designs are reduced factorial designs which can be used when many vital factors are to be included in a factor influence study. In the present study, push pull osmotic tablets of ivabradine Hcl were developed with the help of fractional factorial design. Numbers of factors were identified as vital after screening study. So before optimization a factor influence study was performed to quantify the effect of the vital factors. This would be helpful for the optimization of the formulation where we can only concentrate on the highly significant factors obtained after factor influence study.
Thus the number of experimental trials can be further minimized and better design can be selected for the optimization. Ivabradine Hcl, A heart rate lowering agent used for the treatment of Symptomatic treatment of chronic stable angina pectoris in coronary artery disease adults with normal sinus rhythm. The formulation is available in the market as immediate release dosage form to be taken twice daily. A once daily Osmotic drug delivery system of Ivabradine Hcl was developed with an intention of more patient compliance. A zero order release, which reduces the fluctuations in the plasma concentration, is only expected in the case of osmotically controlled systems.
MATERIALS AND METHODS
Materials
The Ivabradine Hcl was received as gift sample from Alembic Pharmaceuticals Limited; Butylated hydroxyl toluene, Sodium
lauryl sulfate, Sodium chloride was received from Merck; Polyethylene Oxide and cellulose acetate was received from signet; Dibasic calcium phosphate from Innophos; Magnesium stearate from Ferro; iron oxide and Propylene glycol from Alembic Limited. Other regents were of analytical grade.
Methods
I. Formulation and evaluations of Push pull osmotic tablets of Ropinirole Hcl 2
A fractional factorial design with 8 selected factors 2 [8-4](ie 1/32 fraction) with Resolution IV was selected for the study. 16 trials with 4 centre points were planned for the study. The selected factors with levels chosen are given in the Table 1. The responses selected for the study were given in the Table: 2. The formula table showing all the ingredients taken in each trial is explained in the Table: 3 and 4.
The prepared granules of both the pull layer and push layer of trial 1- 20 were weighed separately in sachets. First drug layer was compressed using rotary tablet compression machine and made thin tablet and then push layer was added by setting the dye cavity and in the upper pull layer tablet was put as a plug and final sharp compression was carried out. By this bilayer tablets were made. Hardness was adjusted while compressing the granules. 5.0 mm biconcave punch was used in preparation of bi layer tablets.
Coating and drilling of core tablet.[3,4]
The prepared bi layer tablets were then coated with coating solution (Acetone :water 90:10) Coating of core tablet was done by conventional coating method in coating pan. 10 tablets were removed at an interval of 30min and increase of weight was noted down until it was observed sufficient %wt gain. Coated tablets were allowed to dry completely in a hot air oven at 60 0C and finished by standard polishing procedure. The drug delivery orifice having diameter of 0.6 mm was made on the surface of one side of the tablets( above the drug layer) by using Micro drill. High speed stainless steel drill bits were used for drilling.
Flow chart of the proceedings using DoE 1
The systematic steps of the product optimization using DoE is shown in the flow chart given in figure.1
International Journal of Pharmacy and Pharmaceutical Sciences
ISSN- 0975-1491 Vol 6 suppl 2, 2014
AAccaaddeemmiicc SScciieenncceess

Geetha et al. Int J Pharm Pharm Sci, Vol 6, Supple 2, 644-651
645
Fig. 1: It shows systematic steps of the product optimization using DoE
Table 1: It shows the selected Factors with levels affecting osmotic push pull delivery system for the factor influence study
Factors Levels Min(-) Max(+)
1 PEO in the drug layer ( % w/w of the API) 10 100 2 Nacl concentration in drug layer( % w/w core tablet) 1 10 3 SLS in the drug layer ( %w/w of the drug layer) 1 5 4 PEO (coagulant) in the push layer (% w/w of the drug layer) 5 50 5 Sodium chloride in the Push layer (% w/w % of the extender) 5 50 6 SLS in the Push layer(%w/w of the push layer) 1 5 7 Propylene Glycol (% w/w of the coating weight) 1 10 8 Weight gain (%) 10 20
Table 2: It shows the selected response for the factor influence study
Response Unit Weightage Cumulative release at 24 Hrs % +++++ R2 ---- ++++ Lag time Hrs +++
Known factors Un Known factors
Screening
Factor effects and
Interactions
Vital few
Screening Trivial
many
Curvature NO
Yes
Yes
Response surface
Methods
Characterization
Optimization
Confirm
Confirmation
Yes
Yes
Celebrate
Back up
Geetha et al. Int J Pharm Pharm Sci, Vol 6, Supple 2, 644-651
646
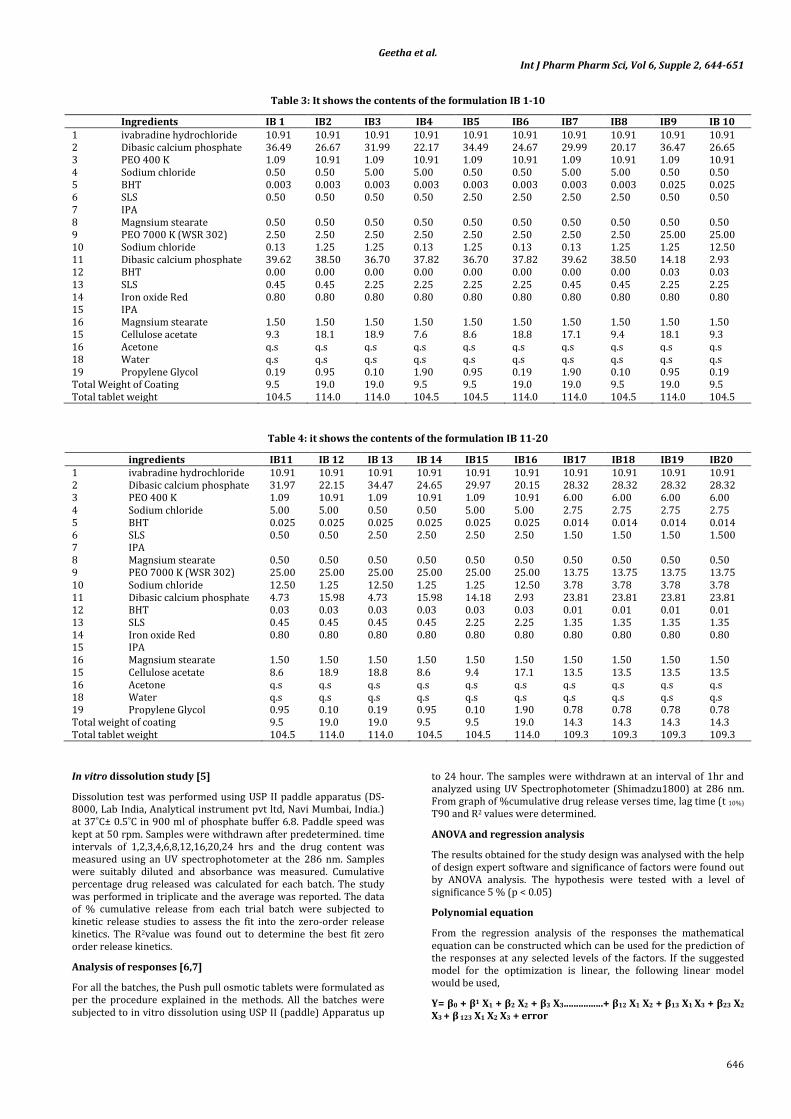
Table 3: It shows the contents of the formulation IB 1-10
Ingredients IB 1 IB2 IB3 IB4 IB5 IB6 IB7 IB8 IB9 IB 10 1 ivabradine hydrochloride 10.91 10.91 10.91 10.91 10.91 10.91 10.91 10.91 10.91 10.91 2 Dibasic calcium phosphate 36.49 26.67 31.99 22.17 34.49 24.67 29.99 20.17 36.47 26.65 3 PEO 400 K 1.09 10.91 1.09 10.91 1.09 10.91 1.09 10.91 1.09 10.91 4 Sodium chloride 0.50 0.50 5.00 5.00 0.50 0.50 5.00 5.00 0.50 0.50 5 BHT 0.003 0.003 0.003 0.003 0.003 0.003 0.003 0.003 0.025 0.025 6 SLS 0.50 0.50 0.50 0.50 2.50 2.50 2.50 2.50 0.50 0.50 7 IPA 8 Magnsium stearate 0.50 0.50 0.50 0.50 0.50 0.50 0.50 0.50 0.50 0.50 9 PEO 7000 K (WSR 302) 2.50 2.50 2.50 2.50 2.50 2.50 2.50 2.50 25.00 25.00 10 Sodium chloride 0.13 1.25 1.25 0.13 1.25 0.13 0.13 1.25 1.25 12.50 11 Dibasic calcium phosphate 39.62 38.50 36.70 37.82 36.70 37.82 39.62 38.50 14.18 2.93 12 BHT 0.00 0.00 0.00 0.00 0.00 0.00 0.00 0.00 0.03 0.03 13 SLS 0.45 0.45 2.25 2.25 2.25 2.25 0.45 0.45 2.25 2.25 14 Iron oxide Red 0.80 0.80 0.80 0.80 0.80 0.80 0.80 0.80 0.80 0.80 15 IPA 16 Magnsium stearate 1.50 1.50 1.50 1.50 1.50 1.50 1.50 1.50 1.50 1.50 15 Cellulose acetate 9.3 18.1 18.9 7.6 8.6 18.8 17.1 9.4 18.1 9.3 16 Acetone q.s q.s q.s q.s q.s q.s q.s q.s q.s q.s 18 Water q.s q.s q.s q.s q.s q.s q.s q.s q.s q.s 19 Propylene Glycol 0.19 0.95 0.10 1.90 0.95 0.19 1.90 0.10 0.95 0.19 Total Weight of Coating 9.5 19.0 19.0 9.5 9.5 19.0 19.0 9.5 19.0 9.5 Total tablet weight 104.5 114.0 114.0 104.5 104.5 114.0 114.0 104.5 114.0 104.5
Table 4: it shows the contents of the formulation IB 11-20
ingredients IB11 IB 12 IB 13 IB 14 IB15 IB16 IB17 IB18 IB19 IB20 1 ivabradine hydrochloride 10.91 10.91 10.91 10.91 10.91 10.91 10.91 10.91 10.91 10.91 2 Dibasic calcium phosphate 31.97 22.15 34.47 24.65 29.97 20.15 28.32 28.32 28.32 28.32 3 PEO 400 K 1.09 10.91 1.09 10.91 1.09 10.91 6.00 6.00 6.00 6.00 4 Sodium chloride 5.00 5.00 0.50 0.50 5.00 5.00 2.75 2.75 2.75 2.75 5 BHT 0.025 0.025 0.025 0.025 0.025 0.025 0.014 0.014 0.014 0.014 6 SLS 0.50 0.50 2.50 2.50 2.50 2.50 1.50 1.50 1.50 1.500 7 IPA 8 Magnsium stearate 0.50 0.50 0.50 0.50 0.50 0.50 0.50 0.50 0.50 0.50 9 PEO 7000 K (WSR 302) 25.00 25.00 25.00 25.00 25.00 25.00 13.75 13.75 13.75 13.75 10 Sodium chloride 12.50 1.25 12.50 1.25 1.25 12.50 3.78 3.78 3.78 3.78 11 Dibasic calcium phosphate 4.73 15.98 4.73 15.98 14.18 2.93 23.81 23.81 23.81 23.81 12 BHT 0.03 0.03 0.03 0.03 0.03 0.03 0.01 0.01 0.01 0.01 13 SLS 0.45 0.45 0.45 0.45 2.25 2.25 1.35 1.35 1.35 1.35 14 Iron oxide Red 0.80 0.80 0.80 0.80 0.80 0.80 0.80 0.80 0.80 0.80 15 IPA 16 Magnsium stearate 1.50 1.50 1.50 1.50 1.50 1.50 1.50 1.50 1.50 1.50 15 Cellulose acetate 8.6 18.9 18.8 8.6 9.4 17.1 13.5 13.5 13.5 13.5 16 Acetone q.s q.s q.s q.s q.s q.s q.s q.s q.s q.s 18 Water q.s q.s q.s q.s q.s q.s q.s q.s q.s q.s 19 Propylene Glycol 0.95 0.10 0.19 0.95 0.10 1.90 0.78 0.78 0.78 0.78 Total weight of coating 9.5 19.0 19.0 9.5 9.5 19.0 14.3 14.3 14.3 14.3 Total tablet weight 104.5 114.0 114.0 104.5 104.5 114.0 109.3 109.3 109.3 109.3
In vitro dissolution study [5]
Dissolution test was performed using USP II paddle apparatus (DS-8000, Lab India, Analytical instrument pvt ltd, Navi Mumbai, India.) at 37˚C± 0.5˚C in 900 ml of phosphate buffer 6.8. Paddle speed was kept at 50 rpm. Samples were withdrawn after predetermined. time intervals of 1,2,3,4,6,8,12,16,20,24 hrs and the drug content was measured using an UV spectrophotometer at the 286 nm. Samples were suitably diluted and absorbance was measured. Cumulative percentage drug released was calculated for each batch. The study was performed in triplicate and the average was reported. The data of % cumulative release from each trial batch were subjected to kinetic release studies to assess the fit into the zero-order release kinetics. The R2value was found out to determine the best fit zero order release kinetics.
Analysis of responses [6,7]
For all the batches, the Push pull osmotic tablets were formulated as per the procedure explained in the methods. All the batches were subjected to in vitro dissolution using USP II (paddle) Apparatus up
to 24 hour. The samples were withdrawn at an interval of 1hr and analyzed using UV Spectrophotometer (Shimadzu1800) at 286 nm. From graph of %cumulative drug release verses time, lag time (t 10%)
T90 and R2 values were determined.
ANOVA and regression analysis
The results obtained for the study design was analysed with the help of design expert software and significance of factors were found out by ANOVA analysis. The hypothesis were tested with a level of significance 5 % (p < 0.05)
Polynomial equation
From the regression analysis of the responses the mathematical equation can be constructed which can be used for the prediction of the responses at any selected levels of the factors. If the suggested model for the optimization is linear, the following linear model would be used,
Y= β0 + β1 X1 + β2 X2 + β3 X3................+ β12 X1 X2 + β13 X1 X3 + β23 X2 X3 + β 123 X1 X2 X3 + error

Geetha et al. Int J Pharm Pharm Sci, Vol 6, Supple 2, 644-651
647
Half Normal plot and normal plot
For 2-level factorial designs, this plot can be used to choose significant effects.
Normal plot
For 2-level factorial designs, this plot can be used to choose significant effects. They show up as outliers on the normal probability plot.
Pareto chart
Pareto chart is bar graph for the clear identification of the significant factors.
Contour plots and response surfaces plots
Contour plot is a 2D graphical representation of the effect of less than 3 factors on a single response. Response surface plots are the 3D version of the contour plot. A better understanding will be possible with the help of response surface plots.
RESULT AND DISCUSSION
Factor influence study of the Ivabdadine Hcl push pull osmotic tablets was done with the help of 2IV [8-4] fractional factorial designs. Twenty trials were formulated as per the procedure given in the materials and methods.
The invitro dissolution of each trial was performed as per the procedure given in the materials and methods. The PCUR at 24 hrs, R2, and the lag time was recorded and analysed with the help of design expert software 8.0.7.1 version. The result of the invitro dissolution profile was given in the Table.5.
Analysis of responses – PCUR at 24 hrs
With the help of the half normal plot, normal plot and pareto chart the significant factors affecting the PCUR was determined. The plots are given in the figures 2, 3 and 4. From the graph it was evident that the factor which are affecting the cumulative release up to 24 hrs are B (Nacl in the DL), G (Propylene glycol) H (the weight gain). The Shapiro-Wilk Normality Test indicates the non significance of the non selected factors. From the pareto chart also it was clearly
evident that the factors B, G, H are the significantly affecting the cumulative response at 24 hrs. All the factors cross the t limit and G and H crosses the Bonferroni limit. The magnitude of the effect can be written as Propylene glycol > weight gain > sodium chloride in the drug layer.
Table 5: It shows the result of the dissolution study
Trial NO CUR at 24 hr R2 Lag time IB1 70.1 0.952 4.1 IB2 52.3 0.8489 3.5 IB3 70.4 0.9315 4 IB4 100 0.997 3 IB5 82.2 0.8713 3.5 IB6 35.3 0.9531 4.5 IB7 84.2 0.9993 3.6 IB8 100 0.9549 3 IB9 82.5 0.9598 4.2 IB10 76 0.8582 4.1 IB11 100 0.9689 2.9 IB12 55.1 0.9982 4.7 IB13 50 0.8573 5 IB14 90.2 0.8614 3.5 IB15 78.5 0.9978 3.5 IB16 100 0.9781 3.1 IB17 80.5 0.9263 4 IB18 79.2 0.9455 3.4 IB19 80.2 0.9331 4 IB20 79 0.9229 3.6
The significance level selected for the study was 5 % and the p value was 0.05. Values of "Prob > F" less than 0.0500 indicate model terms are significant. Values greater than 0.1000 indicate the model terms are not significant. In this case B (p =0.0062), G (p =0.0018), and H (p =0.0024) are significant model terms. The Model F-value of 12.29 implies the model is significant. There is only a 0.02% chance that a "Model F-Value" this large could occur due to noise. The "Lack of Fit F-value" of 5.00 implies the Lack of Fit is not significant relative to the pure error.
Fig. 2: It shows the Half Normal plot of the effect of the factors on PCUR at 24 hrs
Design-Expert® SoftwareCumulative percent drug release in 24 hours
Error estimates
Shapiro-Wilk testW-value = 0.940p-value = 0.499A: PEO in the drug layer B: Nacl concentration in drug layer C: SLS in the drug layer D: PEO (coagulant) in the push layer E: Sodium chloride in the Push layer F: SLS in the Push layer G: Propylene glycolH: weight gain
Positive Effects Negative Effects
Half-Normal Plot
Ha
lf-N
orm
al
% P
rob
ab
ilit
y
|Standardized Effect|
0.00 5.16 10.31 15.47 20.62
0
10
20
30
50
70
80
90
95
99
B
G
H

Geetha et al. Int J Pharm Pharm Sci, Vol 6, Supple 2, 644-651
648
Fig. 3: It shows the Normal plot of the effect of the factors on PCUR at 24 hrs
Fig. 4: It shows the Pareto chart of effect of the factors on PCUR at 24 hrs
The polynomial equation representing the PCUR at 24 hrs was given as,
Cumulative percent drug release in 24 hours = +84.64028+1.93056 * Nacl in drug layer +2.29167 * Propylene glycol -1.98750 * weight gain
Figure 5 shows the contour plot and response surface plot of the simultaneous effect of Nacl DL and Propylene glycol on the PCUR at 24 hrs at a time. At lower concentration of propylene glycol Nacl DL had little effect. High PCUR at 24 hrs would be expected at high levels of both the factors.
Fig. 5: It shows the Contour plot and RS Plot – Effect of Nacl DL and Propylene Glycol on PCUR at 24 hrs
Fig. 6: It shows the Contour plot and RS Plot – Effect of Nacl DL and weight gain on PCUR at 24 hrs
Design-Expert® SoftwareCumulative percent drug release in 24 hours
Warning! Pure error terms not shown
Shapiro-Wilk testW-value = 0.940p-value = 0.499A: PEO in the drug layer B: Nacl concentration in drug layer C: SLS in the drug layer D: PEO (coagulant) in the push layer E: Sodium chloride in the Push layer F: SLS in the Push layer G: Propylene glycolH: weight gain
Positive Effects Negative Effects
Normal Plot
No
rma
l %
Pro
ba
bili
ty
Standardized Effect
-19.88 -9.75 0.37 10.50 20.62
1
5
10
20
30
50
70
80
90
95
99
B
G
H
Design-Expert® SoftwareCumulative percent drug release in 24 hours
A: PEO in the drug layer B: Nacl concentration in drug layer C: SLS in the drug layer D: PEO (coagulant) in the push layer E: Sodium chloride in the Push layer F: SLS in the Push layer G: Propylene glycolH: weight gain
Positive Effects Negative Effects
Pareto Chart
t-V
alu
e o
f |E
ffe
ct|
Rank
0.00
0.92
1.85
2.77
3.69
1 2 3 4 5 6 7 8 9 10 11 12 13 14 15
Bonf erroni Limit 3.48368
t-Value Limit 2.13145
GH
B
Design-Expert® SoftwareFactor Coding: ActualCumulative percent drug release in 24 hours
Design Points100
35
X1 = G: Propylene glycolX2 = B: Nacl concentration in drug layer
Actual FactorsA: PEO in the drug layer = 55.00C: SLS in the drug layer = 3.00D: PEO (coagulant) in the push layer = 27.50E: Sodium chloride in the Push layer = 27.50F: SLS in the Push layer = 3.00H: weight gain = 15.00
1.00 2.00 3.00 4.00 5.00 6.00 7.00 8.00 9.00 10.00
1.00
2.00
3.00
4.00
5.00
6.00
7.00
8.00
9.00
10.00Cumulative percent drug release in 24 hours
G: Propylene glycol
B:
Na
cl
co
nc
en
tra
tio
n i
n d
ru
g l
ay
er
60
70
80
90
4
Design-Expert® SoftwareFactor Coding: ActualCumulative percent drug release in 24 hours
Design points above predicted value100
35
X1 = G: Propylene glycolX2 = B: Nacl concentration in drug layer
Actual FactorsA: PEO in the drug layer = 55.00C: SLS in the drug layer = 3.00D: PEO (coagulant) in the push layer = 27.50E: Sodium chloride in the Push layer = 27.50F: SLS in the Push layer = 3.00H: weight gain = 15.00
1.00 2.00
3.00 4.00
5.00 6.00
7.00 8.00
9.00 10.00
1.00 2.00
3.00 4.00
5.00 6.00
7.00 8.00
9.00 10.00
50
60
70
80
90
100
110
C
um
ula
tiv
e p
erc
en
t d
ru
g r
ele
as
e i
n 2
4 h
ou
rs
G: Propylene glycol B: Nacl concentration in drug layer
Design-Expert® SoftwareFactor Coding: ActualCumulative percent drug release in 24 hours
Design Points100
35
X1 = B: Nacl concentration in drug layer X2 = H: weight gain
Actual FactorsA: PEO in the drug layer = 55.00C: SLS in the drug layer = 3.00D: PEO (coagulant) in the push layer = 27.50E: Sodium chloride in the Push layer = 27.50F: SLS in the Push layer = 3.00G: Propylene glycol = 5.50
1.00 2.00 3.00 4.00 5.00 6.00 7.00 8.00 9.00 10.00
10.00
12.00
14.00
16.00
18.00
20.00Cumulative percent drug release in 24 hours
B: Nacl concentration in drug layer
H:
we
igh
t g
ain
70
80
90
4
Design-Expert® SoftwareFactor Coding: ActualCumulative percent drug release in 24 hours
Design points above predicted value100
35
X1 = B: Nacl concentration in drug layer X2 = H: weight gain
Actual FactorsA: PEO in the drug layer = 55.00C: SLS in the drug layer = 3.00D: PEO (coagulant) in the push layer = 27.50E: Sodium chloride in the Push layer = 27.50F: SLS in the Push layer = 3.00G: Propylene glycol = 5.50
10.00
12.00
14.00
16.00
18.00
20.00
1.00 2.00
3.00 4.00
5.00 6.00
7.00 8.00
9.00 10.00
50
60
70
80
90
100
110
C
um
ula
tiv
e p
erc
en
t d
ru
g r
ele
as
e i
n 2
4 h
ou
rs
B: Nacl concentration in drug layer
H: weight gain

Geetha et al. Int J Pharm Pharm Sci, Vol 6, Supple 2, 644-651
649
Fig. 7(1): It shows the Half Normal plot of the effect of the factors on R2
Fig. 7: It shows the Contour plot and RS Plot – Effect of Nacl DL and weight gain on PCUR at 24 hrs
Figure.6 shows the Contour plot and Rs plot, showing the change in PCUR at24hr with the change in weight gain and Nacl.Nacl DL had a positive effect and Weight gain had an opposite effect on the response. At the low levels of weight gain the Nacl had a prominent effect.
Figure.7 shows the contour plot and RS plot showing the simultaneous effect of weight gain and propylene glycol on the PCUR at 24hrs. At 10 % of the weight gain the response is more prone to slight changes propylene glycol. But at a higher weight gain even a 10% of propylene glycol is not sufficient to achieve 80% release at 24hrs.
Analysis of responses - Rate constant(R2)
With the help of the half normal plot and normal plot shown in figure 7 and 8, the significant factors affecting the R2was determined. The plots are given in the figures and. From the graph it was evident that the factor which are affecting the release rate constant ( R2)were B ( Nacl in the DL ) and E( Nacl in the push layer). The Shapiro-Wilk Normality Test displayed the non significance of the non selected factors.
Fig. 8: It shows the half Normal plot of the effect of the factors
onR2
Fig.9: It shows the Pareto chart of effect of the factors on R2
The Pareto chart shown in figure.9 represents the significant effect of B and E on the zero order rate constant. Both the factors crosses the t and Bonferroni limit confirm the obvious effect of these factors on the zero order rate constant. The magnitude of the effect can be written as Nacl in the drug layer > Nacl in the push layer. The F-value from the ANOVA analysis 29.11 implies the model is significant. Factors B (p =< 0.0001), E(0.0002) are significant model terms.. The "Lack of Fit F-value" of 0.3706 implies the Lack of Fit is not significant relative to the pure error. The polynomial equation representing R2 can be written,
R2 =+0.91727+9.10833E-003* Nacl concentration in drug layer - 1.38833E-003* Sodium chloride in the Push layer. The Figure.10 shows the Contour plot and response surface plot for the simultaneous effect of factor B and E at a time. From the plot it is obvious that the factor B had a positive effect and E had a negative effect. High levels of Nacl in the DL and low levels of Nacl in the PL yields a better R2 value. The change in concentration of Nacl in the DL is more evident at low level of Nacl in the PL.
Design-Expert® SoftwareFactor Coding: ActualCumulative percent drug release in 24 hours
Design Points100
35
X1 = G: Propylene glycolX2 = H: weight gain
Actual FactorsA: PEO in the drug layer = 55.00B: Nacl concentration in drug layer = 5.50C: SLS in the drug layer = 3.00D: PEO (coagulant) in the push layer = 27.50E: Sodium chloride in the Push layer = 27.50F: SLS in the Push layer = 3.00
1.00 2.00 3.00 4.00 5.00 6.00 7.00 8.00 9.00 10.00
10.00
12.00
14.00
16.00
18.00
20.00Cumulative percent drug release in 24 hours
G: Propylene glycol
H:
we
igh
t g
ain
60
70
80
90
4
Design-Expert® SoftwareFactor Coding: ActualCumulative percent drug release in 24 hours
Design points above predicted value100
35
X1 = G: Propylene glycolX2 = H: weight gain
Actual FactorsA: PEO in the drug layer = 55.00B: Nacl concentration in drug layer = 5.50C: SLS in the drug layer = 3.00D: PEO (coagulant) in the push layer = 27.50E: Sodium chloride in the Push layer = 27.50F: SLS in the Push layer = 3.00
10.00
12.00
14.00
16.00
18.00
20.00
1.00 2.00
3.00 4.00
5.00 6.00
7.00 8.00
9.00 10.00
50
60
70
80
90
100
110
C
um
ula
tiv
e p
erc
en
t d
ru
g r
ele
as
e i
n 2
4 h
ou
rs
G: Propylene glycol H: weight gain
Design-Expert® SoftwareR2
Warning! Pure error terms not shown
Shapiro-Wilk testW-value = 0.959p-value = 0.741A: PEO in the drug layer B: Nacl concentration in drug layer C: SLS in the drug layer D: PEO (coagulant) in the push layer E: Sodium chloride in the Push layer F: SLS in the Push layer G: Propylene glycolH: weight gain
Positive Effects Negative Effects
Normal Plot
No
rm
al
% P
ro
ba
bil
ity
Standardized Effect
-0.06 -0.03 0.01 0.05 0.08
1
5
10
20
30
50
70
80
90
95
99
B
E
Design-Expert® SoftwareR2
Error estimates
Shapiro-Wilk testW-value = 0.959p-value = 0.741A: PEO in the drug layer B: Nacl concentration in drug layer C: SLS in the drug layer D: PEO (coagulant) in the push layer E: Sodium chloride in the Push layer F: SLS in the Push layer G: Propylene glycolH: weight gain
Positive Effects Negative Effects
Half-Normal Plot
Ha
lf-N
orm
al
% P
ro
ba
bil
ity
|Standardized Effect|
0.00 0.02 0.04 0.06 0.08
0
10
20
30
50
70
80
90
95
99
B
E
Design-Expert® SoftwareR2
A: PEO in the drug layer B: Nacl concentration in drug layer C: SLS in the drug layer D: PEO (coagulant) in the push layer E: Sodium chloride in the Push layer F: SLS in the Push layer G: Propylene glycolH: weight gain
Positive Effects Negative Effects
Pareto Chart
t-V
alu
e o
f |E
ffe
ct|
Rank
0.00
1.00
2.00
3.00
3.99
4.99
5.99
1 2 3 4 5 6 7 8 9 10 11 12 13 14 15
Bonf erroni Limit 3.44432
t-Value Limit 2.11991
B
E
Geetha et al. Int J Pharm Pharm Sci, Vol 6, Supple 2, 644-651
650
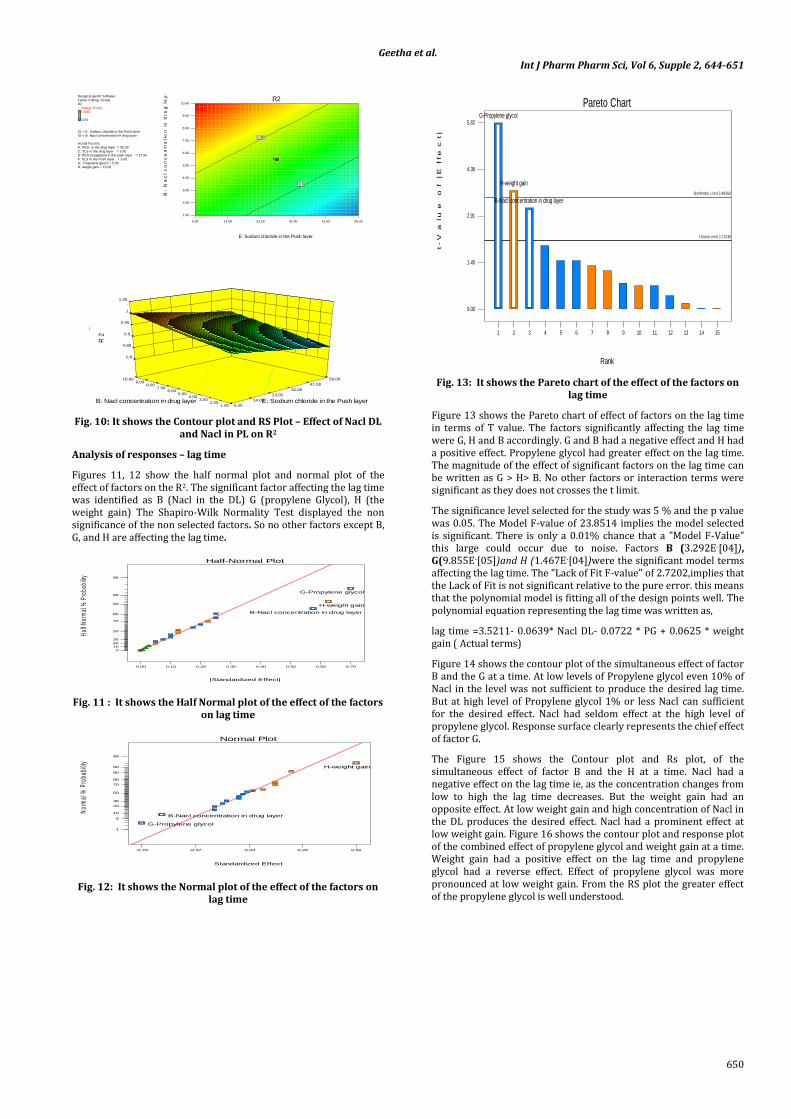
Fig. 10: It shows the Contour plot and RS Plot – Effect of Nacl DL and Nacl in PL on R2
Analysis of responses – lag time
Figures 11, 12 show the half normal plot and normal plot of the effect of factors on the R2. The significant factor affecting the lag time was identified as B (Nacl in the DL) G (propylene Glycol), H (the weight gain) The Shapiro-Wilk Normality Test displayed the non significance of the non selected factors. So no other factors except B, G, and H are affecting the lag time.
Fig. 11 : It shows the Half Normal plot of the effect of the factors on lag time
Fig. 12: It shows the Normal plot of the effect of the factors on lag time
Fig. 13: It shows the Pareto chart of the effect of the factors on lag time
Figure 13 shows the Pareto chart of effect of factors on the lag time in terms of T value. The factors significantly affecting the lag time were G, H and B accordingly. G and B had a negative effect and H had a positive effect. Propylene glycol had greater effect on the lag time. The magnitude of the effect of significant factors on the lag time can be written as G > H> B. No other factors or interaction terms were significant as they does not crosses the t limit.
The significance level selected for the study was 5 % and the p value was 0.05. The Model F-value of 23.8514 implies the model selected is significant. There is only a 0.01% chance that a "Model F-Value" this large could occur due to noise. Factors B (3.292E-[04]), G(9.855E-[05])and H (1.467E-[04])were the significant model terms affecting the lag time. The "Lack of Fit F-value" of 2.7202,implies that the Lack of Fit is not significant relative to the pure error. this means that the polynomial model is fitting all of the design points well. The polynomial equation representing the lag time was written as,
lag time =3.5211- 0.0639* Nacl DL- 0.0722 * PG + 0.0625 * weight gain ( Actual terms)
Figure 14 shows the contour plot of the simultaneous effect of factor B and the G at a time. At low levels of Propylene glycol even 10% of Nacl in the level was not sufficient to produce the desired lag time. But at high level of Propylene glycol 1% or less Nacl can sufficient for the desired effect. Nacl had seldom effect at the high level of propylene glycol. Response surface clearly represents the chief effect of factor G.
The Figure 15 shows the Contour plot and Rs plot, of the simultaneous effect of factor B and the H at a time. Nacl had a negative effect on the lag time ie, as the concentration changes from low to high the lag time decreases. But the weight gain had an opposite effect. At low weight gain and high concentration of Nacl in the DL produces the desired effect. Nacl had a prominent effect at low weight gain. Figure 16 shows the contour plot and response plot of the combined effect of propylene glycol and weight gain at a time. Weight gain had a positive effect on the lag time and propylene glycol had a reverse effect. Effect of propylene glycol was more pronounced at low weight gain. From the RS plot the greater effect of the propylene glycol is well understood.
Design-Expert® SoftwareFactor Coding: ActualR2
Design Points0.999
0.84
X1 = E: Sodium chloride in the Push layer X2 = B: Nacl concentration in drug layer
Actual FactorsA: PEO in the drug layer = 55.00C: SLS in the drug layer = 3.00D: PEO (coagulant) in the push layer = 27.50F: SLS in the Push layer = 3.00G: Propylene glycol = 5.50H: weight gain = 15.00
5.00 14.00 23.00 32.00 41.00 50.00
1.00
2.00
3.00
4.00
5.00
6.00
7.00
8.00
9.00
10.00R2
E: Sodium chloride in the Push layer
B:
Na
cl
co
nc
en
tra
tio
n i
n d
ru
g l
ay
er
0.9
0.95
4
Design-Expert® SoftwareFactor Coding: ActualR2
Design points above predicted valueDesign points below predicted value0.999
0.84
X1 = E: Sodium chloride in the Push layer X2 = B: Nacl concentration in drug layer
Actual FactorsA: PEO in the drug layer = 55.00C: SLS in the drug layer = 3.00D: PEO (coagulant) in the push layer = 27.50F: SLS in the Push layer = 3.00G: Propylene glycol = 5.50H: weight gain = 15.00
1.00 2.00
3.00 4.00
5.00 6.00
7.00 8.00
9.00 10.00
5.00
14.00
23.00
32.00
41.00
50.00
0.8
0.85
0.9
0.95
1
1.05
R
2
E: Sodium chloride in the Push layer B: Nacl concentration in drug layer
Design-Expert® Softwarelag time
Error estimates
Shapiro-Wilk testW-value = 0.933p-value = 0.415A: PEO in the drug layer B: Nacl concentration in drug layer C: SLS in the drug layer D: PEO (coagulant) in the push layer E: Sodium chloride in the Push layer F: SLS in the Push layer G: Propylene glycolH: weight gain
Positive Effects Negative Effects
0.00 0.10 0.20 0.30 0.40 0.50 0.60 0.70
0
10
20
30
50
70
80
90
95
99
Half-Normal Plot
|Standardized Effect|
Hal
f-Nor
mal
% P
roba
bilit
y
B-Nacl concentration in drug layer
G-Propylene glycol
H-weight gain
Design-Expert® Softwarelag time
Warning! Pure error terms not shown
Shapiro-Wilk testW-value = 0.933p-value = 0.415A: PEO in the drug layer B: Nacl concentration in drug layer C: SLS in the drug layer D: PEO (coagulant) in the push layer E: Sodium chloride in the Push layer F: SLS in the Push layer G: Propylene glycolH: weight gain
Positive Effects Negative Effects
-0.70 -0.37 -0.04 0.29 0.62
1
5
10
20
30
50
70
80
90
95
99
Normal Plot
Standardized Effect
Nor
mal
% P
roba
bilit
y
B-Nacl concentration in drug layer
G-Propylene glycol
H-weight gain
0.00
1.45
2.91
4.36
5.82
1 2 3 4 5 6 7 8 9 10 11 12 13 14 15
Pareto Chart
Rank
t-V
alu
e o
f |E
ffe
ct|
Bonferroni Limit 3.48368
t-Value Limit 2.13145
G-Propylene glycol
H-weight gain
B-Nacl concentration in drug layer

Geetha et al. Int J Pharm Pharm Sci, Vol 6, Supple 2, 644-651
651
Fig. 14: It shows the Contour plot and RS Plot – Effect of Nacl DL and Propylene Glycol on lag time
Fig. 15: It shows the Contour plot and RS Plot – Effect of Nacl DL and weight gain on lag time
Fig. 16: It shows the Contour plot and RS Plot – Effect of Weight gain and Propylene Glycol on lag time
CONCLUSION
The factor influence study of the ivabradine Hcl push pull osmotic tablets was done with the help of 2 IV [8-4] fractional factorial design. Core factors and coating factors are combainly selected for the factor influence study. The effect of the factors on the responses like PCUR at 24 hrs, Zero order rate constant and lag time were studied. It was found from the study that the most significant factors which affecting the responses were Propylene glycol (plasticizer), weight gain and the Nacl in the DL. Researchers can concentrate more on the coating parameters and Nacl DL for the optimization of Ivabradine Hcl Push pull osmotic tablets. A better chance of variation with in the design space without affecting the desired profile can be possible with change in coating parameters for the formulation of a push pull osmotic tablets ivabradine Hcl.
Conflict of Interest: None
REFERENCES
1. Mark J. Anderson, Patrick J.whitcomb, DOE simplified. Second Edition. CRS press: New York; 2007.
2. Gibson, M, Product Optimization: Pharmaceutical Pre formulation and Formulation. Taylor & Francis: New York; 2001.
3. Prabakaran D, Singh P, Kanaujia P, Jaganathan K.S, Rawat A, Vyas S.P, Modified push-pull osmotic system for simultaneous delivery of theophylline and salbutamol: development and in vitro characterization, Int. J. Pharm,2004; 284 : 95–108.
4. M. Rani, R. Surana, C. Sankar, et al. Development and biopharmaceutical evaluation of osmotic pump tablets for controlled delivery of diclofenac sodium. Acta Pharm 2003;53: 263-27.
5. Garg, M. Gupta, H. N. Bhargava, Effect of formulation parameters on the release characteristics of propranolol from asymmetric membrane coated tablets. Eur. J. Pharm. Biopharm 2007; 67: 725-731.
6. Muthulingam C, Sona P.S, B. Shrivastava, Pankaj Sharma, Development and optimization of push pull osmotic tablets of quetiapine fumarate using design of experiments. Indo American Journal of Pharm Research 2013; 3(9) : 7580 -7591
7. Muthulingam C, Sona P.S, B. Shrivastava, Pankaj Sharma, Development and Optimization of Push Pull Osmotic Tablets of Lamotrigine Using Design of Experiments Int. J. Pharm. Sci. Rev. Res 2013;22(2) :96-102.
Design-Expert® SoftwareFactor Coding: Actuallag time (hrs)
Design Points4.7
2.8
X1 = B: Nacl DLX2 = G: PG
Actual FactorsA: PEO DL = 55.00C: SLS DL = 3.00D: PEO PL = 30.00E: Nacl PL = 30.00F: SLS PL = 3.00H: weight gain = 15.00
1.00 2.00 3.00 4.00 5.00 6.00 7.00 8.00 9.00 10.00
1.00
2.00
3.00
4.00
5.00
6.00
7.00
8.00
9.00
10.00lag time (hrs)
B: Nacl DL (%)
G:
PG
(%
)
3.2
3.4
3.6
3.8
4
4.2
4
Design-Expert® SoftwareFactor Coding: Actuallag time (hrs)
Design points above predicted valueDesign points below predicted value4.7
2.8
X1 = B: Nacl DLX2 = G: PG
Actual FactorsA: PEO DL = 55.00C: SLS DL = 3.00D: PEO PL = 30.00E: Nacl PL = 30.00F: SLS PL = 3.00H: weight gain = 15.00
1.00
2.00
3.00
4.00
5.00
6.00
7.00
8.00
9.00
10.00
1.00 2.00
3.00 4.00
5.00 6.00
7.00 8.00
9.00 10.00
2.5
3
3.5
4
4.5
5
lag
tim
e
(hrs
)
B: Nacl DL (%)
G: PG (%)
Design-Expert® SoftwareFactor Coding: Actuallag time (hrs)
Design Points4.7
2.8
X1 = B: Nacl DLX2 = H: weight gain
Actual FactorsA: PEO DL = 55.00C: SLS DL = 3.00D: PEO PL = 30.00E: Nacl PL = 30.00F: SLS PL = 3.00G: PG = 5.50
1.00 2.00 3.00 4.00 5.00 6.00 7.00 8.00 9.00 10.00
10.00
12.00
14.00
16.00
18.00
20.00lag time (hrs)
B: Nacl DL (%)
H:
we
igh
t g
ain
(%
)
3.2
3.4
3.6
3.8
4
4.2
4
Design-Expert® SoftwareFactor Coding: Actuallag time (hrs)
Design points above predicted valueDesign points below predicted value4.7
2.8
X1 = B: Nacl DLX2 = H: weight gain
Actual FactorsA: PEO DL = 55.00C: SLS DL = 3.00D: PEO PL = 30.00E: Nacl PL = 30.00F: SLS PL = 3.00G: PG = 5.50
10.00
12.00
14.00
16.00
18.00
20.00
1.00 2.00
3.00 4.00
5.00 6.00
7.00 8.00
9.00 10.00
2.5
3
3.5
4
4.5
5
lag
tim
e
(hrs
)
B: Nacl DL (%)
H: weight gain (%)
Design-Expert® SoftwareFactor Coding: Actuallag time (hrs)
Design Points4.7
2.8
X1 = G: PGX2 = H: weight gain
Actual FactorsA: PEO DL = 55.00B: Nacl DL = 5.50C: SLS DL = 3.00D: PEO PL = 30.00E: Nacl PL = 30.00F: SLS PL = 3.00
1.00 2.00 3.00 4.00 5.00 6.00 7.00 8.00 9.00 10.00
10.00
12.00
14.00
16.00
18.00
20.00lag time (hrs)
G: PG (%)
H:
we
igh
t g
ain
(%
)
3.2
3.4
3.6
3.8
4
4.2
4
Design-Expert® SoftwareFactor Coding: Actuallag time (hrs)
Design points above predicted valueDesign points below predicted value4.7
2.8
X1 = G: PGX2 = H: weight gain
Actual FactorsA: PEO DL = 55.00B: Nacl DL = 5.50C: SLS DL = 3.00D: PEO PL = 30.00E: Nacl PL = 30.00F: SLS PL = 3.00
10.00
12.00
14.00
16.00
18.00
20.00
1.00 2.00
3.00 4.00
5.00 6.00
7.00 8.00
9.00 10.00
2.5
3
3.5
4
4.5
5
lag
tim
e
(hrs
)
G: PG (%)
H: weight gain (%)
![Acaaddemmiicc SSci eennccess - innovareacademics.in · Gulancha, Giloy Anti-HIV, anti-parkinson’s disease, Anti-stress, anti-inflammatory, antibacterial. [38-40] International Journal](https://img.pdfslide.us/doc/110x75/5bff899009d3f20e6b8bbe66/acaaddemmiicc-ssci-eennccess-gulancha-giloy-anti-hiv-anti-parkinsons.jpg)