Embed Size (px)
Citation preview
Postadress: Besöksadress: Telefon: Box 1026 Gjuterigatan 5 036-10 10 00 (vx) 551 11 Jönköping
Abutment sealing issue Finding the root cause and redesign the concept
AREA: Mechanical Engineering, Product development and design
AUTHORS: Béatrice Andersson and Klara Rosenqvist
MENTOR: Lennart Mähler
JÖNKÖPING 2017 June

Postadress: Besöksadress: Telefon: Box 1026 Gjuterigatan 5 036-10 10 00 (vx) 551 11 Jönköping
This thesis work has been carried out at the School of Engineering in Jönköping in the subject area Product Development. The work is a part of the Bachelor degree in mechanical engineering. The authors are responsible for the given opinions, conclusion and results
Examiner: Magnus Andersson Mentor: Lennart Mähler Credit points: 15 credits Date: 2017-06-01

Abstract
Abstract
Kongsberg Automotive is a global company that develops products to the automotive industry. At the department of Powertrain and Chassis the development of manual gear shift systems is performed. The problem presented in this thesis is concerning a component located in the manual gear shift system called abutment. Every system contains four abutments, two located in the engine compartment and two in the passenger compartment. The purpose of the abutments is to attach the cable assembly as well as fixate and isolate the cable and conduit.
The abutment consists of two parts, interface and cover. The problem that has occurred is that water enters the joint of these two parts and finds its way through the cables into the passenger compartment. Except from the fact that it is not preferable to have water inside of the passenger compartment, a risk is that the water may freeze inside of the cable system and make it impossible to shift gear.
The purpose of this thesis is to find the reason why water enters the joint of the abutment and what possible solutions there is for the problem. The focus have been on investigating which solutions that may be applied in a construction aspect. The main goal was to find a solution that would not include adding an extra component to the part. This project does not involve the aspects of material selection, mechanical calculations or calculations of the product life cycle.
The product development process described by David Ullman in The Mechanical Design Process, is used in the process of solving the purpose and research questions.
The root cause was established to be due to manufacturing defects and non-uniform deformation of a rib. The rib is supposed to work like a sealing between the interface and cover. The non-uniform deformation occurs when the interface and cover are being mounted, making the rib fold in different directions.
By knowledge from the root cause, three new concepts were developed and presented to Kongsberg Automotive.

Acknowledgement
Acknowledgement We would like to thank Kongsberg Automotive for the opportunity to perform our thesis at the office in Mullsjö. A special thanks to François Finet and Sofie Rydell Wigren who have been mentors and supported us at Kongsberg throughout the project. In addition we would also like to thank Lennart Mähler who have been our mentor at Jönköping University and supported us with the literature part of the project.
Table of content
Table of content
1 Introduction ............................................................................. 1
1.1 BACKGROUND ....................................................................................................................... 1
1.2 STATEMENT .......................................................................................................................... 2
1.3 PURPOSE AND RESEARCH QUESTION ..................................................................................... 3
1.4 DELIMITATION ..................................................................................................................... 3
1.5 OUTLINE............................................................................................................................... 3
2 Theoretical background ........................................................... 4
2.1 CONNECTION BETWEEN RESEARCH QUESTION AND THEORETICAL BACKGROUND................... 4
2.2 PRODUCT DEVELOPMENT ................................................................................................. 4
2.2.1 Product discovery ..................................................................................................... 5
2.2.2 Project planning ....................................................................................................... 6
2.2.3 Product definition ..................................................................................................... 6
2.2.4 Conceptual design ..................................................................................................... 6
2.2.5 Product development ................................................................................................ 6
2.2.6 Product support ........................................................................................................ 7
3 Method .................................................................................... 8
3.1 CONNECTION BETWEEN RESEARCH QUESTION AND METHODS ............................................... 8
3.2 PRODUCT DEVELOPMENT PROCESS ................................................................................... 8
3.2.1 Product discovery ..................................................................................................... 8
3.2.2 Project planning ....................................................................................................... 8
3.2.3 Product definition ..................................................................................................... 8
3.2.4 Conceptual design ..................................................................................................... 9
3.2.5 Product development .............................................................................................. 12
3.2.6 Product support ...................................................................................................... 12
4 Implementation and result ..................................................... 13
4.1 GANTT-CHART .................................................................................................................. 13
4.1.1 Implementation ...................................................................................................... 13
4.1.2 Result ....................................................................................................................... 13
Table of content
4.2 IMPLEMENTATION AND RESULT RESEARCH QUESTION 1 .................................................. 13
4.2.1 Fault Tree Analysis ................................................................................................. 13
4.2.2 Immersion test ........................................................................................................ 14
4.2.3 Pressure test ............................................................................................................ 15
4.3 IMPLEMENTATION AND RESULT RESEARCH QUESTION 2 ................................................. 17
4.3.1 Brainstorming ........................................................................................................ 17
4.3.2 Quality Function Deployment ............................................................................... 18
4.3.3 Pugh´s method ....................................................................................................... 20
4.3.4 Concepts presented to Kongsberg Automotive..................................................... 21
5 Analysis ................................................................................. 24
5.1 RESEARCH QUESTION 1 ....................................................................................................... 24
5.1.1 Fault Tree Analysis ................................................................................................. 24
5.1.2 Immersion test ........................................................................................................ 24
5.1.3 Pressure test ............................................................................................................ 25
5.2 RESEARCH QUESTION 2 .................................................................................................. 26
5.2.1 Concept 1 – Change the shape of the rib ............................................................... 26
5.2.2 Concept 2 – Track in the stop wall ........................................................................ 27
5.2.3 Concept 3 – Thread all way around .................................................................... 28
6 Discussion and conclusion .................................................... 29
6.1 IMPLICATIONS .................................................................................................................... 29
6.2 CONCLUSIONS AND RECOMMENDATIONS ........................................................................ 29
6.3 FURTHER WORK ............................................................................................................ 30
7 References ............................................................................ 31
8 Appendix ............................................................................... 32
8.1 APPENDIX 1; GANTT-CHART .............................................................................................. 32
8.2 APPENDIX 2, FTA .......................................................................................................... 33
8.3 APPENDIX 3; BRAINSTORMING SESSION ......................................................................... 34
8.4 APPENDIX 4; PUGH´S MATRIX ........................................................................................ 35
Introduction
1
1 Introduction This thesis was performed as a part of the program Mechanical engineering, Product Development and Design at Jönköping University in collaboration with Kongsberg Automotive located in Mullsjö, Sweden. Kongsberg Automotive is a global company that develop and provides products to the automotive industry [1]. The work presented in this thesis was performed at the department of Powertrain and Chassis, in which they had a problem with water entering an area in their manual gear shift system.
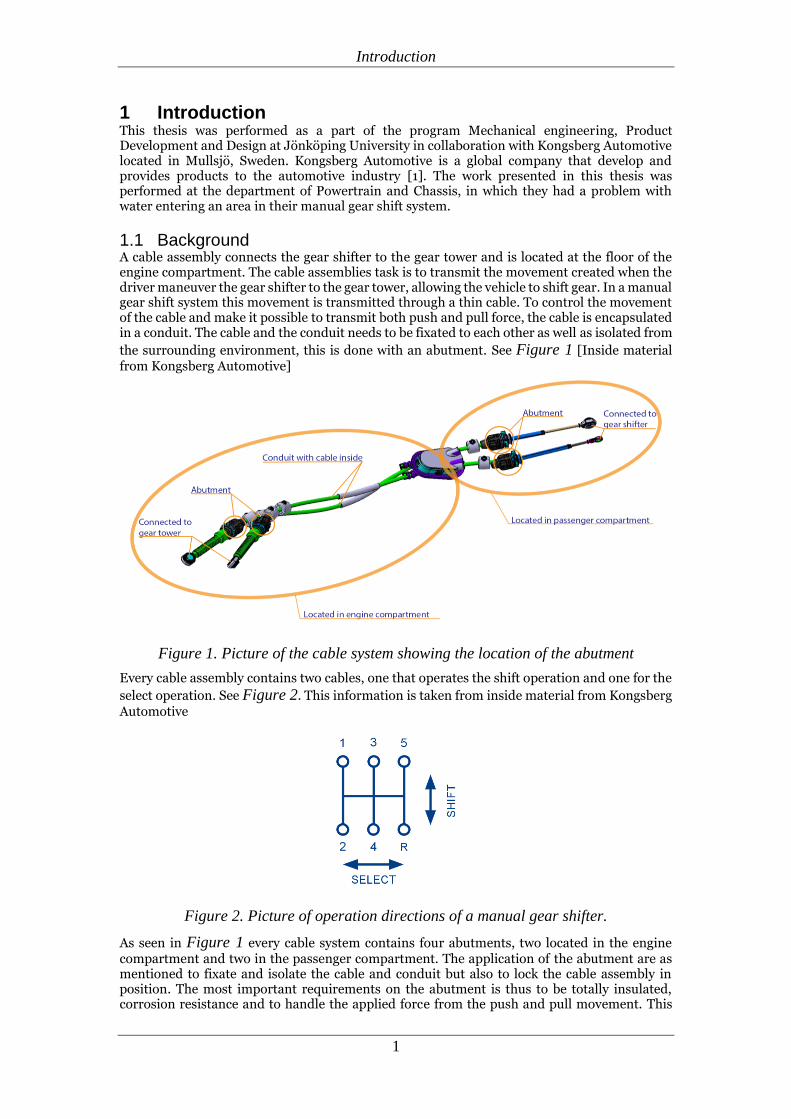
1.1 Background A cable assembly connects the gear shifter to the gear tower and is located at the floor of the engine compartment. The cable assemblies task is to transmit the movement created when the driver maneuver the gear shifter to the gear tower, allowing the vehicle to shift gear. In a manual gear shift system this movement is transmitted through a thin cable. To control the movement of the cable and make it possible to transmit both push and pull force, the cable is encapsulated in a conduit. The cable and the conduit needs to be fixated to each other as well as isolated from
the surrounding environment, this is done with an abutment. See Figure 1 [Inside material from Kongsberg Automotive]
Figure 1. Picture of the cable system showing the location of the abutment
Every cable assembly contains two cables, one that operates the shift operation and one for the
select operation. See Figure 2. This information is taken from inside material from Kongsberg Automotive
Figure 2. Picture of operation directions of a manual gear shifter.
As seen in Figure 1 every cable system contains four abutments, two located in the engine compartment and two in the passenger compartment. The application of the abutment are as mentioned to fixate and isolate the cable and conduit but also to lock the cable assembly in position. The most important requirements on the abutment is thus to be totally insulated, corrosion resistance and to handle the applied force from the push and pull movement. This
Introduction
2
information is taken from inside material from Kongsberg Automotive Kongsberg has performed tests when implementing different kind of sealing such as O-ring, silicone sealing and Flat-ring. Both the O-ring and the silicone sealing has failed parts of the test. The flat ring has also been tested, but all parts of the test has not yet been performed. Those parts of the test that have been performed has been successful. Due to this the flat-ring may be a solution to the leakage problem. Even though the Flat-ring may work, this would include adding a part to the abutment which Kongsberg Automotive preferred to avoid. Instead they strived for a design solution, which makes a more cost effective solution. This information is taken from inside material from Kongsberg Automotive
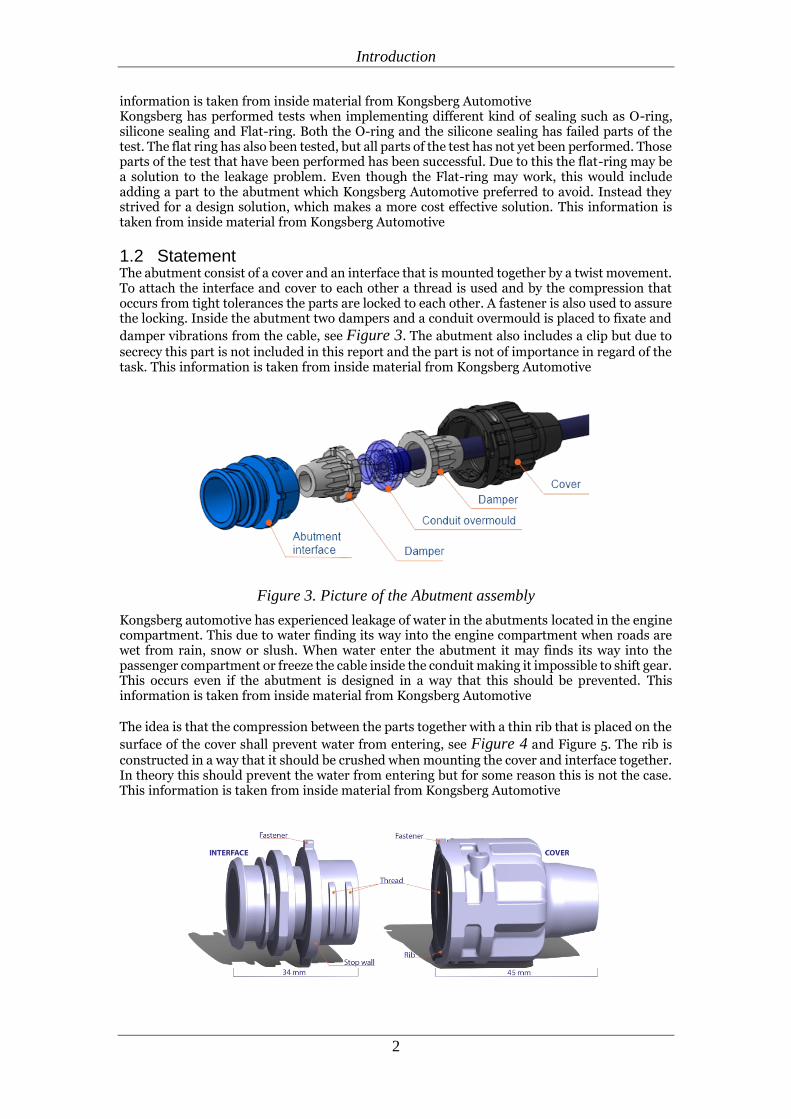
1.2 Statement The abutment consist of a cover and an interface that is mounted together by a twist movement. To attach the interface and cover to each other a thread is used and by the compression that occurs from tight tolerances the parts are locked to each other. A fastener is also used to assure the locking. Inside the abutment two dampers and a conduit overmould is placed to fixate and
damper vibrations from the cable, see Figure 3. The abutment also includes a clip but due to secrecy this part is not included in this report and the part is not of importance in regard of the task. This information is taken from inside material from Kongsberg Automotive
Figure 3. Picture of the Abutment assembly
Kongsberg automotive has experienced leakage of water in the abutments located in the engine compartment. This due to water finding its way into the engine compartment when roads are wet from rain, snow or slush. When water enter the abutment it may finds its way into the passenger compartment or freeze the cable inside the conduit making it impossible to shift gear. This occurs even if the abutment is designed in a way that this should be prevented. This information is taken from inside material from Kongsberg Automotive
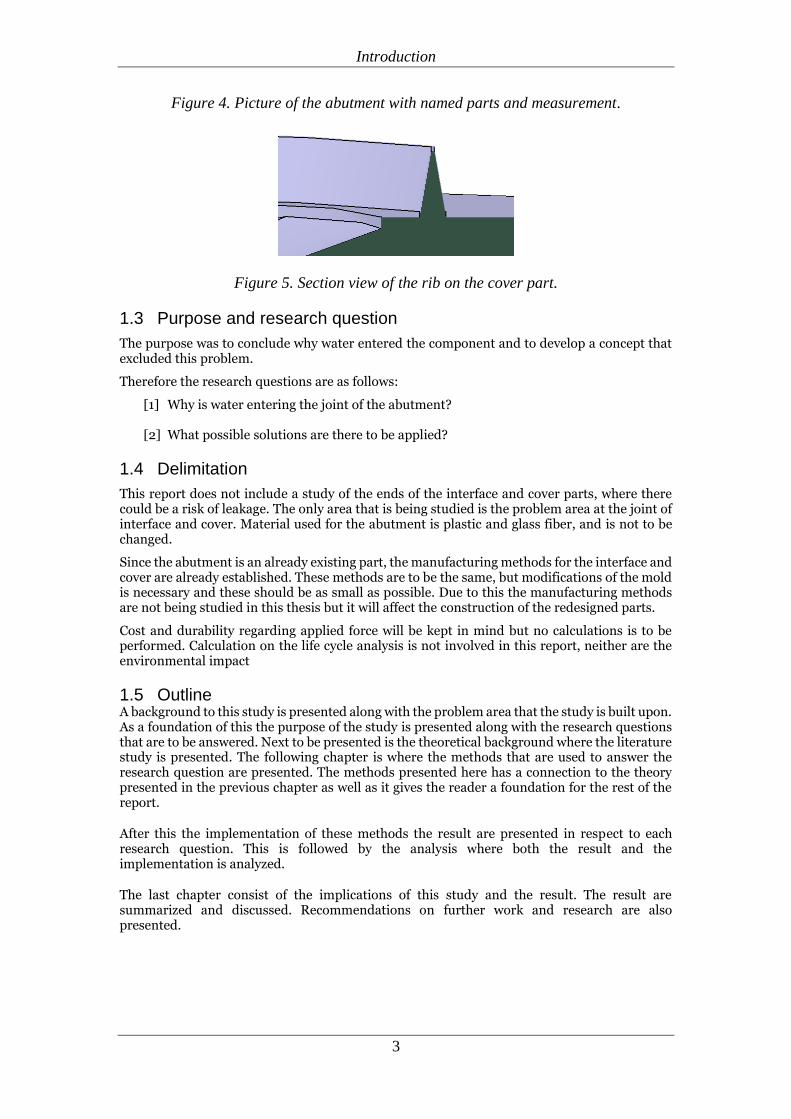
The idea is that the compression between the parts together with a thin rib that is placed on the
surface of the cover shall prevent water from entering, see Figure 4 and Figure 5. The rib is constructed in a way that it should be crushed when mounting the cover and interface together. In theory this should prevent the water from entering but for some reason this is not the case. This information is taken from inside material from Kongsberg Automotive
Introduction
3
Figure 4. Picture of the abutment with named parts and measurement.
Figure 5. Section view of the rib on the cover part.
1.3 Purpose and research question
The purpose was to conclude why water entered the component and to develop a concept that excluded this problem.
Therefore the research questions are as follows:
[1] Why is water entering the joint of the abutment?
[2] What possible solutions are there to be applied?
1.4 Delimitation
This report does not include a study of the ends of the interface and cover parts, where there could be a risk of leakage. The only area that is being studied is the problem area at the joint of interface and cover. Material used for the abutment is plastic and glass fiber, and is not to be changed.
Since the abutment is an already existing part, the manufacturing methods for the interface and cover are already established. These methods are to be the same, but modifications of the mold is necessary and these should be as small as possible. Due to this the manufacturing methods are not being studied in this thesis but it will affect the construction of the redesigned parts.
Cost and durability regarding applied force will be kept in mind but no calculations is to be performed. Calculation on the life cycle analysis is not involved in this report, neither are the environmental impact
1.5 Outline A background to this study is presented along with the problem area that the study is built upon. As a foundation of this the purpose of the study is presented along with the research questions that are to be answered. Next to be presented is the theoretical background where the literature study is presented. The following chapter is where the methods that are used to answer the research question are presented. The methods presented here has a connection to the theory presented in the previous chapter as well as it gives the reader a foundation for the rest of the report.
After this the implementation of these methods the result are presented in respect to each research question. This is followed by the analysis where both the result and the implementation is analyzed.
The last chapter consist of the implications of this study and the result. The result are summarized and discussed. Recommendations on further work and research are also presented.

Theoretical background
4
2 Theoretical background
2.1 Connection between research question and theoretical background
To be able to answer the research questions a process to follow simplifies the way to the answer. A design process allow this as well as it gives a weight to the conclusions and decisions along the way. By implementing the steps and methods of a design process it will generate well-founded answers.
Table 1. Table of which phases of product development process described by David
G. Ullman that is used in regards of the research questions.
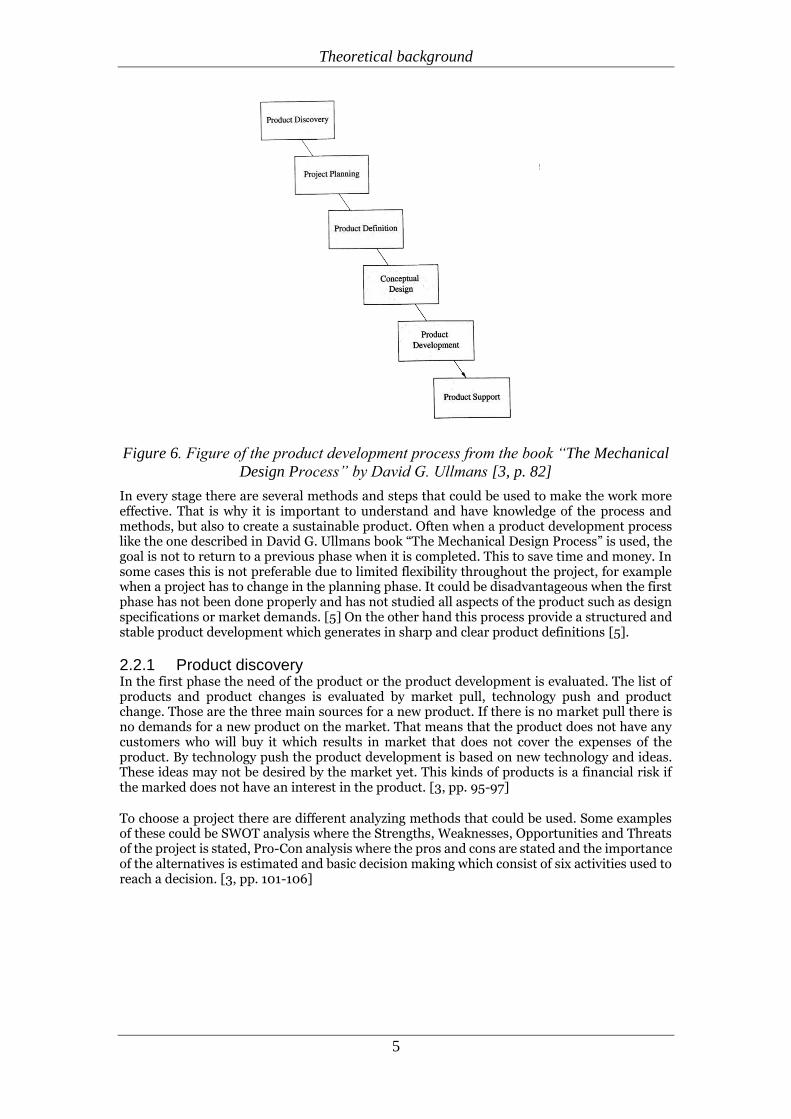
2.2 Product development An effective product development process is necessary for companies and a possibility to evolve and compete with their competitors, particularly in those who are in a fast growing market. To match the evolving market is one of the reasons why product development is important for companies. [2] In the process of developing a product there are several stages and steps that is preferable to perform and follow. The process can have different structures and stages. But often they contain the same or similar content. A process described by David G. Ullman that could be followed, whether a new product is developed or just a small part of the product is developed, is divided into 6 phases, Product discovery, Project planning, Product definition, Conceptual design, Product development and Product support. The process is visualized in
Figure 6. [3, p. 82] Another process, presented in “Produktutveckling” by Hans Johannsesson, Jan-Gunnar Persson and Dennis Pettersson, is divided into four stages, Pre study, Development, Verification, Implementation and Termination. [4, p. 62] In this report the process that David G. Ullman presents is used.
Theoretical background
5
Figure 6. Figure of the product development process from the book “The Mechanical
Design Process” by David G. Ullmans [3, p. 82]
In every stage there are several methods and steps that could be used to make the work more effective. That is why it is important to understand and have knowledge of the process and methods, but also to create a sustainable product. Often when a product development process like the one described in David G. Ullmans book “The Mechanical Design Process” is used, the goal is not to return to a previous phase when it is completed. This to save time and money. In some cases this is not preferable due to limited flexibility throughout the project, for example when a project has to change in the planning phase. It could be disadvantageous when the first phase has not been done properly and has not studied all aspects of the product such as design specifications or market demands. [5] On the other hand this process provide a structured and stable product development which generates in sharp and clear product definitions [5].
2.2.1 Product discovery In the first phase the need of the product or the product development is evaluated. The list of products and product changes is evaluated by market pull, technology push and product change. Those are the three main sources for a new product. If there is no market pull there is no demands for a new product on the market. That means that the product does not have any customers who will buy it which results in market that does not cover the expenses of the product. By technology push the product development is based on new technology and ideas. These ideas may not be desired by the market yet. This kinds of products is a financial risk if the marked does not have an interest in the product. [3, pp. 95-97]
To choose a project there are different analyzing methods that could be used. Some examples of these could be SWOT analysis where the Strengths, Weaknesses, Opportunities and Threats of the project is stated, Pro-Con analysis where the pros and cons are stated and the importance of the alternatives is estimated and basic decision making which consist of six activities used to reach a decision. [3, pp. 101-106]
Theoretical background
6
2.2.2 Project planning In the second phase the projects is planned to make an as good, effective and cost effective process as possible. Time spent on the following phase’s Product definition, Conceptual design and Product development is estimated and resources, such as team and material is specified. [3, p. 111] When planning the project a project plan is created and the tasks in the project are specified and defined [3, p. 126]. When creating a project plan, five steps can be followed. Identify the task, state the objective for each task, estimate the personnel time and other resources needed to meet the objectives, develop a sequence for the tasks and estimate the product development costs [3, pp. 126-155]. A Gantt chart could be created as a plan or schedule with milestones to be followed [3, p. 131]. In each step and task the objective requirements, personnel requirements, time requirements and schedule in relation to other tasks.
2.2.3 Product definition The Project definition phase is where the project is defined and the problem stated. The problem is translated to technical description which means an engineering specification or requirement specification is created. [3, p. 143] Writing requirements specification demands an understanding of the problem. There are several methods and techniques to write the specification, but a method that is often used is QFD. QFD is a suitable method to use in most project because it includes major parts of the information that is needed to understand the problem of the project. It includes the customer's demands, goals for the product is developed, the specifications is evaluated how they measures to the customer demands, determine how well the competition meets the goals and generates several targets to work toward. So it is important to have measurable values in the QFD. [3, p. 145]
2.2.4 Conceptual design When the problem is stated the Product development can start. It is important to have all the facts and knowledge of the root of the problem to create an as efficient development phase as possible. When generating concepts there is several methods that could be used, for example Brainstorming, Brain writing, 6-3-5 method or find ideas in reference books. [3, p. 192] Concepts is to communicate the required function. The concepts are only a rough idea of what could be the solution of the problem so they are not supposed to be ready for prototype making [4]. The concepts can be presented in text, sketches, diagrams and models [3, p. 172]. The different concepts can be combined with each other to fulfill the requirements and create a good product [6, p. 132]. There is a possibility to choose only one concept and develop it into a product who will be the final product. But to be on the safe side, several concept can be chosen to continue working with. This to avoid committing to one directly in case it would not be the most suitable one. This will also help the design process to maintain a high quality and will probably result in a better product [3, p. 172]. Along the way of developing concepts they get eliminated until one concepts is left and will generate the final product. [3, p. 214] There are some techniques that could be used in the decision of a concept. One often used is Pugh’s method which is a decision-making methods that presents pros and cons with different concepts. [3, pp. 212-226]
2.2.5 Product development The Product development phase is where the chosen concept is refined into the product. To choose the right concept, the concepts are evaluated and verified which one meets the requirements. The concepts is also evaluated from the manufacturing and assembly perspective. [3, p. 241] This means that when developing the product there are several aspects that have to be taken in consideration. In the product development phase the form of the product is deigned. When creating the form of the product, there are steps that should be followed. To start with the development, constraints to other components have to be understood. The product may have to interact with other assemblies and component that already exists or is unchangeable. After getting an understanding of constraints it’s time for configuration of the product. In this step the product is developed by the structure or architecture. [3, p. 247] Connections or interfaces are developed in the third stage, later the entire component is developed. [3, p. 247] During this process of developing the form, material and process is also decided. Material selection and manufacturing is a very important aspect in product development due to cost sustainability, and to reach the requirements. [3, p. 264] Reliability in the product development is important to measure and evaluate the quality of the product over time [3, p. 315]. A failure in the product in use is not desirable thus a Failure modes
Theoretical background
7
and Effects analysis, FMEA, could be performed. FEMA is to evaluate the potential of failure in the product. Also Fault tree analysis FTA is used to identify possible failures. [3, p. 353]
2.2.6 Product support
When the product has been developed and released to the production the engineer still has some work to do. The engineer may be needed in the assembly and manufacturing, support vendors as well as be there to help introduce the product for new customers and maintaining any changes to the product. [3, p. 82] It is important to maintain a good relationship with the vendors and have a clear dialog what the goals are. This could for example reduce the product or service cost and time to deliver solutions [3, p. 369]. This phase also includes possible enhancement and changes of the product. This is as mentioned before not desirable however the need of changes may only occur until the product is properly tested or the consumer reveals the problem or changes the requirements. There is also a risk that there is a change in material or method of manufacturing. [3, p. 370]
Method
8
3 Method
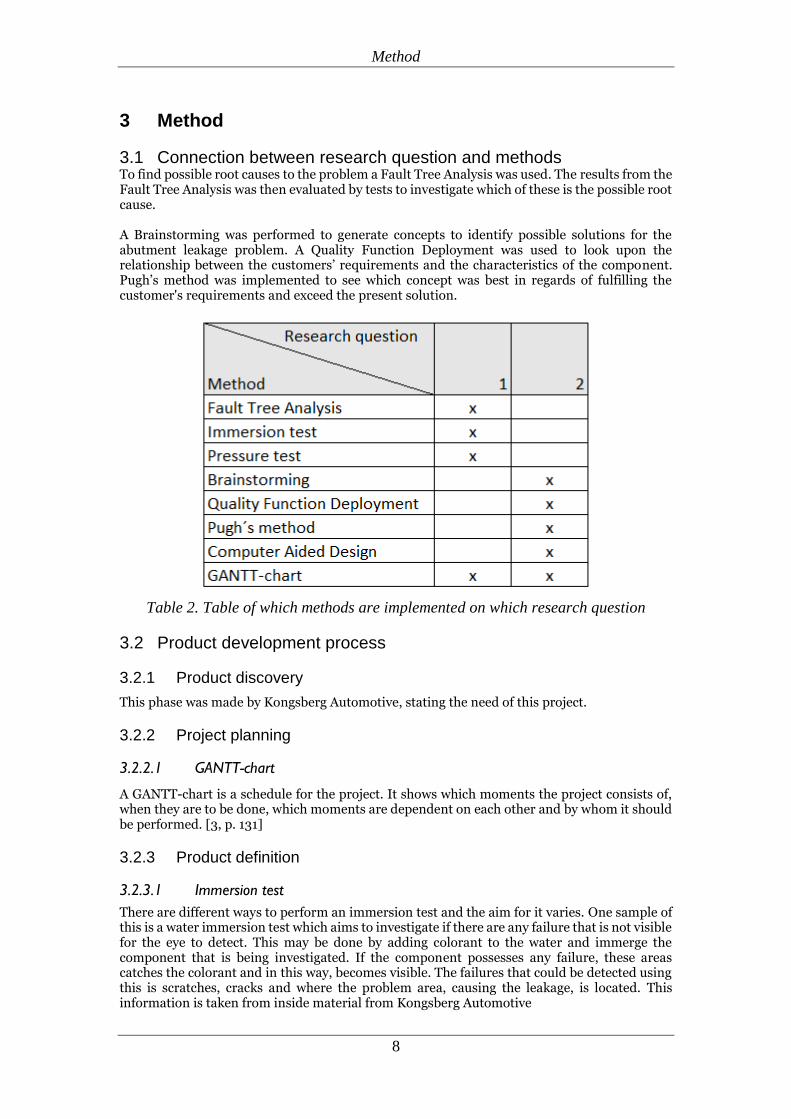
3.1 Connection between research question and methods To find possible root causes to the problem a Fault Tree Analysis was used. The results from the Fault Tree Analysis was then evaluated by tests to investigate which of these is the possible root cause. A Brainstorming was performed to generate concepts to identify possible solutions for the abutment leakage problem. A Quality Function Deployment was used to look upon the relationship between the customers’ requirements and the characteristics of the component. Pugh’s method was implemented to see which concept was best in regards of fulfilling the customer's requirements and exceed the present solution.
Table 2. Table of which methods are implemented on which research question
3.2 Product development process
3.2.1 Product discovery
This phase was made by Kongsberg Automotive, stating the need of this project.
3.2.2 Project planning
3.2.2.1 GANTT-chart
A GANTT-chart is a schedule for the project. It shows which moments the project consists of, when they are to be done, which moments are dependent on each other and by whom it should be performed. [3, p. 131]
3.2.3 Product definition
3.2.3.1 Immersion test
There are different ways to perform an immersion test and the aim for it varies. One sample of this is a water immersion test which aims to investigate if there are any failure that is not visible for the eye to detect. This may be done by adding colorant to the water and immerge the component that is being investigated. If the component possesses any failure, these areas catches the colorant and in this way, becomes visible. The failures that could be detected using this is scratches, cracks and where the problem area, causing the leakage, is located. This information is taken from inside material from Kongsberg Automotive

Method
9
3.2.3.2 Pressure test
To investigate if a component have a leakage a pressure test can be done. It also gives a possibility to locate where on the component the leakage occurs. A pressure test can be performed in a variety of ways, one of them is to seal the component and emerge it in water and then apply pressure through a nipple. In this way bubbles will occur if there is a leakage. This information is taken from inside material from Kongsberg Automotive
3.2.4 Conceptual design
3.2.4.1 Brainstorming
Brainstorming is an effective method used for generating lots of ideas. This method is mostly used in an early stage in a product development process. A brainstorming session consist of three to ten people that generates ideas in an open-minded environment free from criticism. Since brainstorming aims for quantity rather than quality the meeting should be free from distraction such as checking Social Media, taking own notes etc. This because it’s believed to inhibitory the creativity of the participants. One of the most important condition to fulfill when brainstorming is that all the participants feel safe to contribute. This requires that no criticism, good or bad, is to be given in the idea generating part of the brainstorming. [7]
The structure of a session includes steps, given in the book Brainstorming and beyond by C. Wilson, “introduction, discussion of the topic and procedure, warm-up exercises, the brainstorming itself and any post-brainstorming activities” [7, p. 8]. In the introduction part the topic of the session is presented as well as the rules for a brainstorming session and the goal for the session. A presentation of the procedure of the session is also presented, including who is going to be the facilitator, the time line for the session, how the data is going to be manage etc. The warm-up exercise should be of a different topic then the main one to get the participants loosen up and to get a positive atmosphere. When this is done and all of the participants fully understand the topic of the session the brainstorming itself can start. All ideas are noted by the facilitator and there should be no evaluation of the ideas. When the brainstorming is over the generated ideas can be discussed and evaluated to see what ideas to work further on. This requires that all the data from the session needs to be handled and made accessible for the participants and other people that may have an interest in this. The evaluation can be done by the participants ranking the ideas privately, by discussing it in the group, by a person/team that did not participate in the brainstorming session, etc. [7]
3.2.4.2 Quality Function Deployment, QFD
The first step and the most common application of a QFD is to identify the customers’ requirements and needs. These requirements and needs is translated into technical terms all the way down to construction and product parameters. This makes the method applicable during the whole product development process, from translating the requirements to when the product reach the market. [8, p. 6] The QFD method can also be used in the construction phase, in this case only some parts of the method is applied. When using the QFD in this phase it aims to find the best technical solution that fulfills the customer specification regarding requirements and needs on the product. To be able to do this the requirements and needs has to be broken down to demands on subsystems and the components in the product. The characteristics of the product are then defined as the “what”, what shall be solved, in the matrix and the subsystems are defined as the “how”, how it should be solved. The connection between these two categories are then analyzed in regards if the subsystem affects the fulfilling of achieving the attributes and how strongly. This is made by evaluate one subsystem at the time against all of the attributes. If the subsystem has a strong relationship it is scored with a 9, if it has a medium relationship it is scored with a 3 and if it has a weak relationship it is scored with a 1. [8, pp. 54 and 70-71]. The requirements and needs are scored with a 5 if it is very important, a 4 if it is important, a 3 if it is less important, a 2 if it is not important or a 1 if it is irrelevant. [8, p. 29]
Method
10
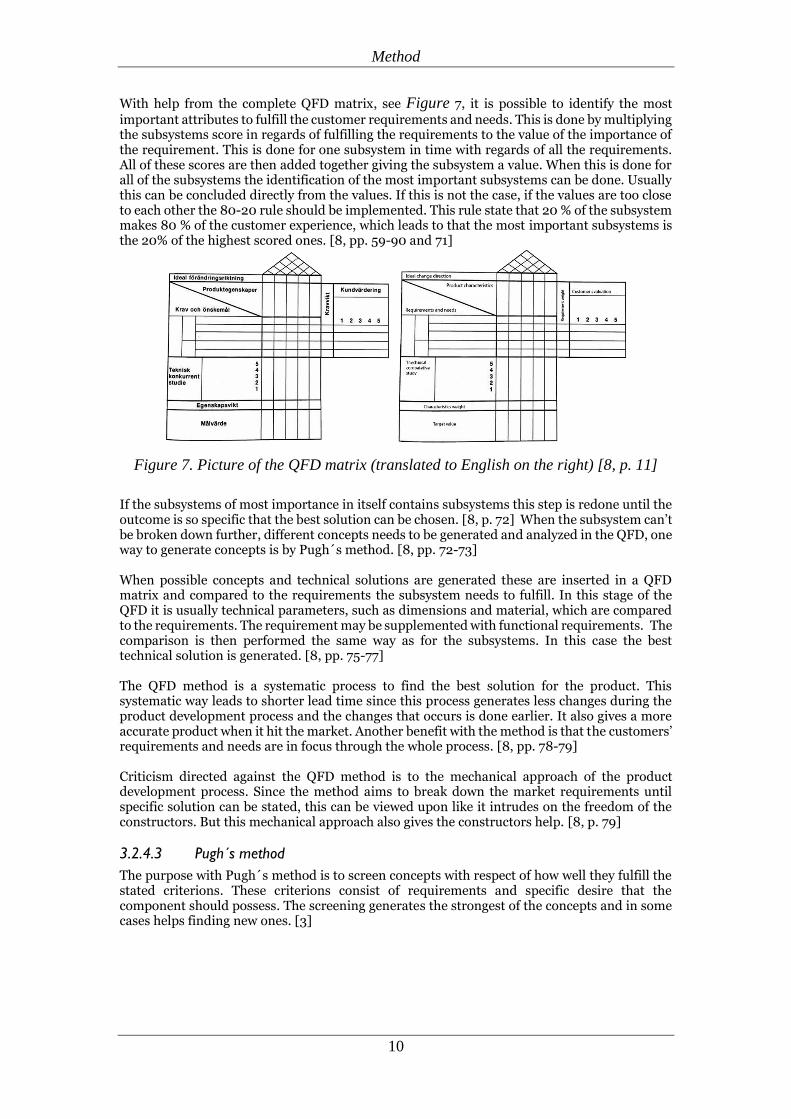
With help from the complete QFD matrix, see Figure 7, it is possible to identify the most important attributes to fulfill the customer requirements and needs. This is done by multiplying the subsystems score in regards of fulfilling the requirements to the value of the importance of the requirement. This is done for one subsystem in time with regards of all the requirements. All of these scores are then added together giving the subsystem a value. When this is done for all of the subsystems the identification of the most important subsystems can be done. Usually this can be concluded directly from the values. If this is not the case, if the values are too close to each other the 80-20 rule should be implemented. This rule state that 20 % of the subsystem makes 80 % of the customer experience, which leads to that the most important subsystems is the 20% of the highest scored ones. [8, pp. 59-90 and 71]
Figure 7. Picture of the QFD matrix (translated to English on the right) [8, p. 11]
If the subsystems of most importance in itself contains subsystems this step is redone until the outcome is so specific that the best solution can be chosen. [8, p. 72] When the subsystem can’t be broken down further, different concepts needs to be generated and analyzed in the QFD, one way to generate concepts is by Pugh´s method. [8, pp. 72-73] When possible concepts and technical solutions are generated these are inserted in a QFD matrix and compared to the requirements the subsystem needs to fulfill. In this stage of the QFD it is usually technical parameters, such as dimensions and material, which are compared to the requirements. The requirement may be supplemented with functional requirements. The comparison is then performed the same way as for the subsystems. In this case the best technical solution is generated. [8, pp. 75-77] The QFD method is a systematic process to find the best solution for the product. This systematic way leads to shorter lead time since this process generates less changes during the product development process and the changes that occurs is done earlier. It also gives a more accurate product when it hit the market. Another benefit with the method is that the customers’ requirements and needs are in focus through the whole process. [8, pp. 78-79] Criticism directed against the QFD method is to the mechanical approach of the product development process. Since the method aims to break down the market requirements until specific solution can be stated, this can be viewed upon like it intrudes on the freedom of the constructors. But this mechanical approach also gives the constructors help. [8, p. 79]
3.2.4.3 Pugh´s method
The purpose with Pugh´s method is to screen concepts with respect of how well they fulfill the stated criterions. These criterions consist of requirements and specific desire that the component should possess. The screening generates the strongest of the concepts and in some cases helps finding new ones. [3]
Method
11
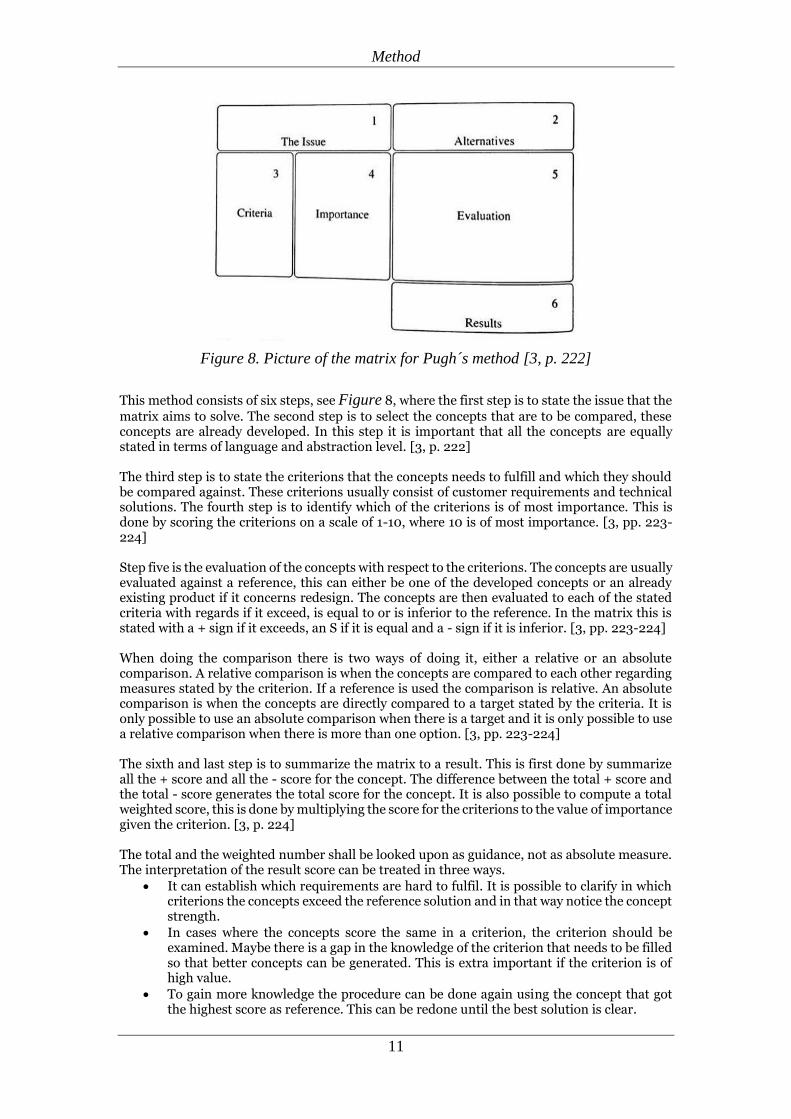
Figure 8. Picture of the matrix for Pugh´s method [3, p. 222]
This method consists of six steps, see Figure 8, where the first step is to state the issue that the matrix aims to solve. The second step is to select the concepts that are to be compared, these concepts are already developed. In this step it is important that all the concepts are equally stated in terms of language and abstraction level. [3, p. 222] The third step is to state the criterions that the concepts needs to fulfill and which they should be compared against. These criterions usually consist of customer requirements and technical solutions. The fourth step is to identify which of the criterions is of most importance. This is done by scoring the criterions on a scale of 1-10, where 10 is of most importance. [3, pp. 223-224] Step five is the evaluation of the concepts with respect to the criterions. The concepts are usually evaluated against a reference, this can either be one of the developed concepts or an already existing product if it concerns redesign. The concepts are then evaluated to each of the stated criteria with regards if it exceed, is equal to or is inferior to the reference. In the matrix this is stated with a + sign if it exceeds, an S if it is equal and a - sign if it is inferior. [3, pp. 223-224] When doing the comparison there is two ways of doing it, either a relative or an absolute comparison. A relative comparison is when the concepts are compared to each other regarding measures stated by the criterion. If a reference is used the comparison is relative. An absolute comparison is when the concepts are directly compared to a target stated by the criteria. It is only possible to use an absolute comparison when there is a target and it is only possible to use a relative comparison when there is more than one option. [3, pp. 223-224] The sixth and last step is to summarize the matrix to a result. This is first done by summarize all the + score and all the - score for the concept. The difference between the total + score and the total - score generates the total score for the concept. It is also possible to compute a total weighted score, this is done by multiplying the score for the criterions to the value of importance given the criterion. [3, p. 224] The total and the weighted number shall be looked upon as guidance, not as absolute measure. The interpretation of the result score can be treated in three ways.
It can establish which requirements are hard to fulfil. It is possible to clarify in which criterions the concepts exceed the reference solution and in that way notice the concept strength.
In cases where the concepts score the same in a criterion, the criterion should be examined. Maybe there is a gap in the knowledge of the criterion that needs to be filled so that better concepts can be generated. This is extra important if the criterion is of high value.
To gain more knowledge the procedure can be done again using the concept that got the highest score as reference. This can be redone until the best solution is clear.
Method
12
This method can by advantage be done individually and then by discussion result in a few of the concept to be further developed and refined. If this is not the case the criterions need to be clarified and more concepts should be generated for evaluation. [3, pp. 224-225]
3.2.5 Product development
3.2.5.1 Fault Tree Analysis, FTA
An evaluation of the cause for a given failure is investigated in a Fault Tree Analysis. This is done by a systematically identification what affects, and may be the root cause for, the failure. When all the events that affects the failure is identified, an evaluation of the probability of these happening and if they are causing the final failure is done. Based on this the root cause may be established and the necessary adjustments to improve the detail is detected. The evaluation needs to consider all kinds of events affecting the failure, all from environment to the mistake made by human or software. Everything needs to be taken into consideration that in some way may affect the failure. [9, p. 146]
This method is not suitable if there is a series of events that cause the failure [9, p. 145].
3.2.5.2 Computer Aided Design, CAD
Computer Aided Design, CAD, is a tool for the designer to generate models in 2D as well as 3D and where solid models can be developed. Through the CAD models they can be transferred into drawings. There are several other advantage using CAD. For example, it is a way for the designers to communicate ideas between each other or with the manufacturing department. The CAD program detects if there is missing tolerances and dimensions of the product. Through constructing a model with CAD the designer becomes aware if there is something missing in the model. [3, pp. 118-119]
Through these CAD-models assemblies can be made, if the product consists of different parts. The program then helps to detect if these parts fit together in the way that they should. A big advantage of making models in CAD is that drawings and models are made at the same time. [3, p. 123]
Since constructing a model and concepts in CAD takes longer time than sketching concepts it may result in less concepts are developed. But this would only be a problem if sketching is abandoned completely. Another negative side by making models in CAD is that there is a focus on details to early. A risk with this is that too much time have been invested in a design which makes it harder to leave and develop a new idea instead. [3, p. 123]
3.2.6 Product support The project was considered completed at the Product Development phase, due to the time frame of the project
Implementation and result
13
4 Implementation and result
4.1 GANTT-chart
4.1.1 Implementation
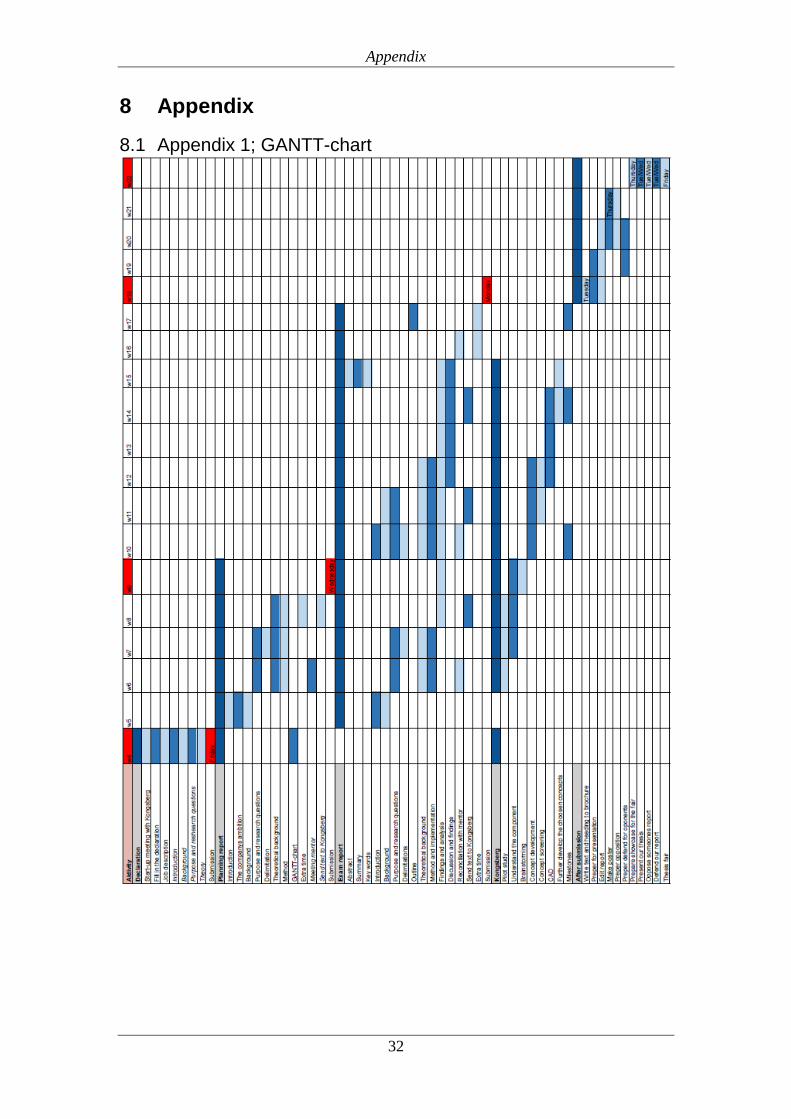
A GANTT-chart was implemented for the project, where the project was broken down to its elements that needed to be accomplished. The GANTT-chart was divided into parts of the project which was start up, planning report, work performed at the problem, working with the report and activities after submitting the report. These part was divided in all stages and activities with a time frame and milestones that was supposed to be followed.
4.1.2 Result
The GANTT-charts was used during the entire project. It was mostly followed but had to be modified sometimes when a new activity was discovered or if a milestone had to be postponed. The GANTT-chart gave a clear view what and when things needed to be done in order to reach the goal with the project. The largest advantages by the GANTT-charts was the overview of what tasks was dependent on each other, which helped to keep the time frame of this project. See
Appendix 1; GANTT-chart for the whole chart.
4.2 Implementation and result research question 1
4.2.1 Fault Tree Analysis
4.2.1.1 Implementation
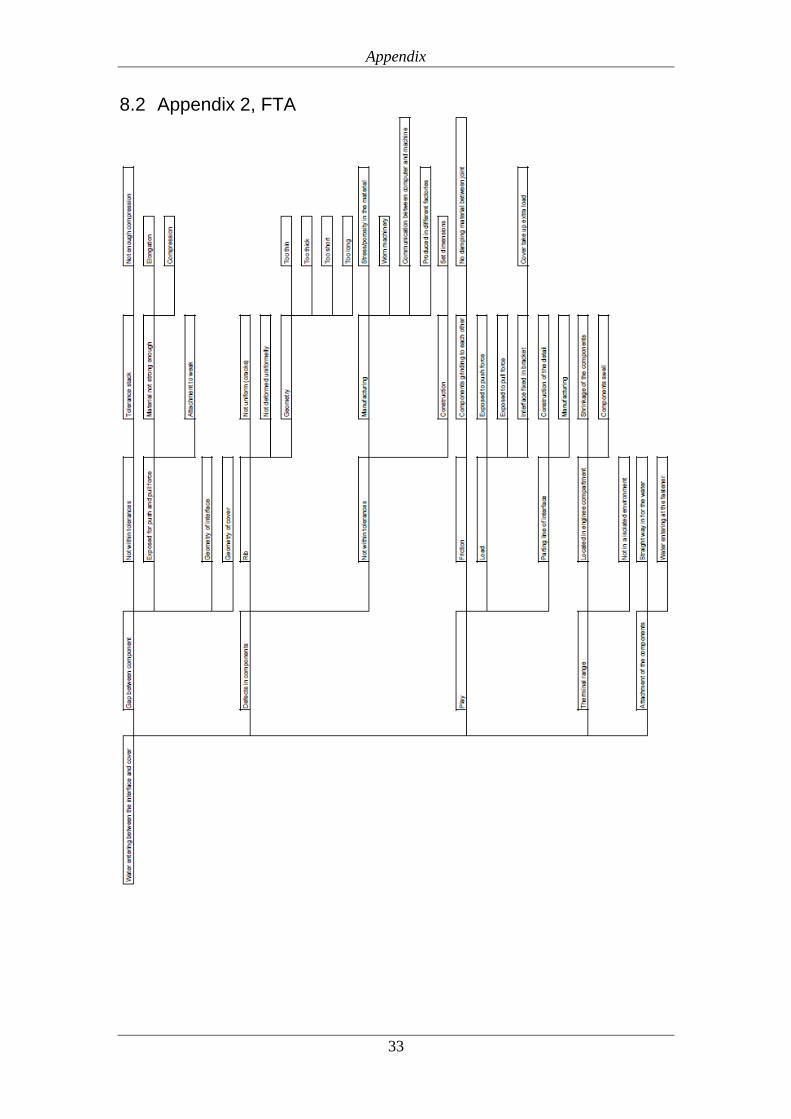
The failure who was defined as “water entering between the interface and cover”, was broken down to possible root causes.
4.2.1.2 Result
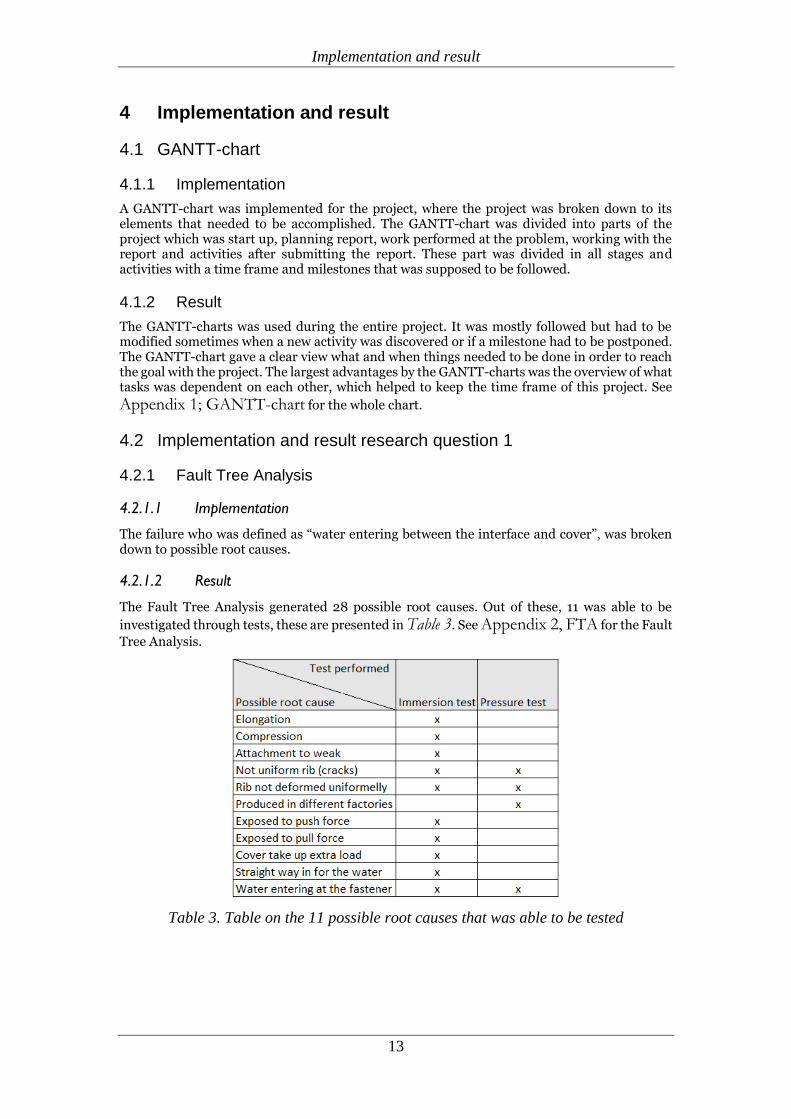
The Fault Tree Analysis generated 28 possible root causes. Out of these, 11 was able to be
investigated through tests, these are presented in Table 3. See Appendix 2, FTA for the Fault
Tree Analysis.
Table 3. Table on the 11 possible root causes that was able to be tested
Implementation and result
14
4.2.2 Immersion test
4.2.2.1 Implementation
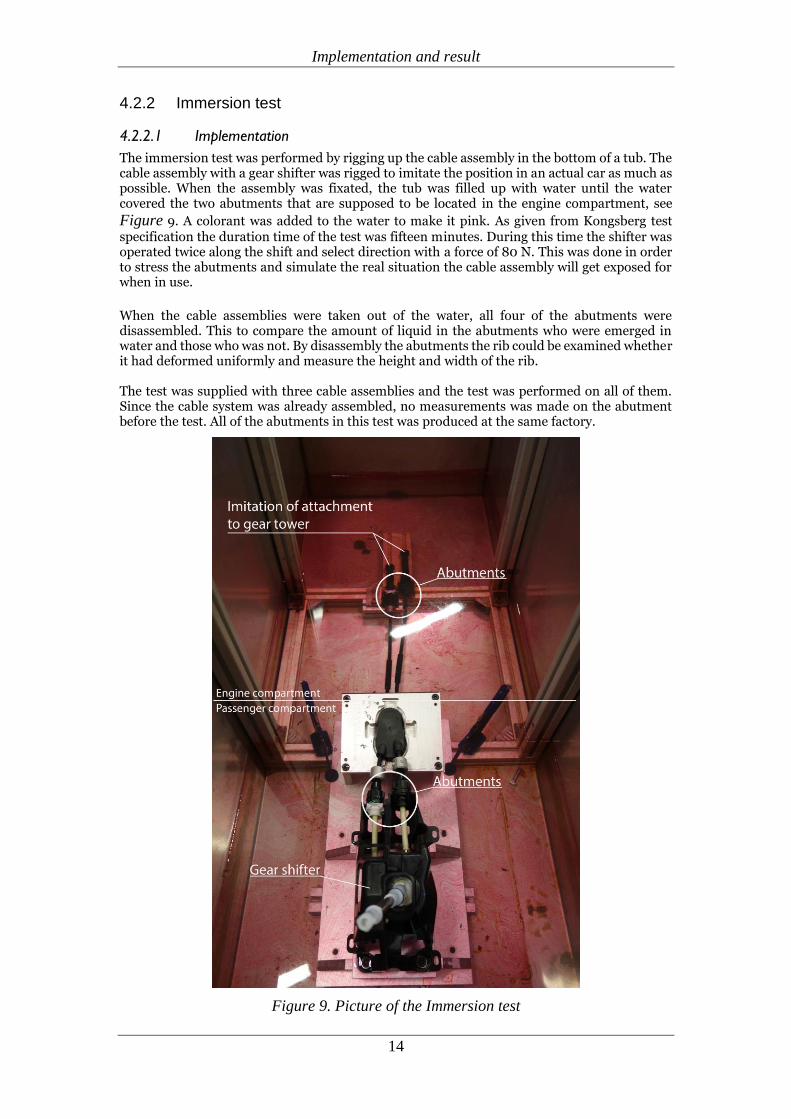
The immersion test was performed by rigging up the cable assembly in the bottom of a tub. The cable assembly with a gear shifter was rigged to imitate the position in an actual car as much as possible. When the assembly was fixated, the tub was filled up with water until the water covered the two abutments that are supposed to be located in the engine compartment, see
Figure 9. A colorant was added to the water to make it pink. As given from Kongsberg test specification the duration time of the test was fifteen minutes. During this time the shifter was operated twice along the shift and select direction with a force of 80 N. This was done in order to stress the abutments and simulate the real situation the cable assembly will get exposed for when in use. When the cable assemblies were taken out of the water, all four of the abutments were disassembled. This to compare the amount of liquid in the abutments who were emerged in water and those who was not. By disassembly the abutments the rib could be examined whether it had deformed uniformly and measure the height and width of the rib. The test was supplied with three cable assemblies and the test was performed on all of them. Since the cable system was already assembled, no measurements was made on the abutment before the test. All of the abutments in this test was produced at the same factory.
Figure 9. Picture of the Immersion test
Implementation and result
15
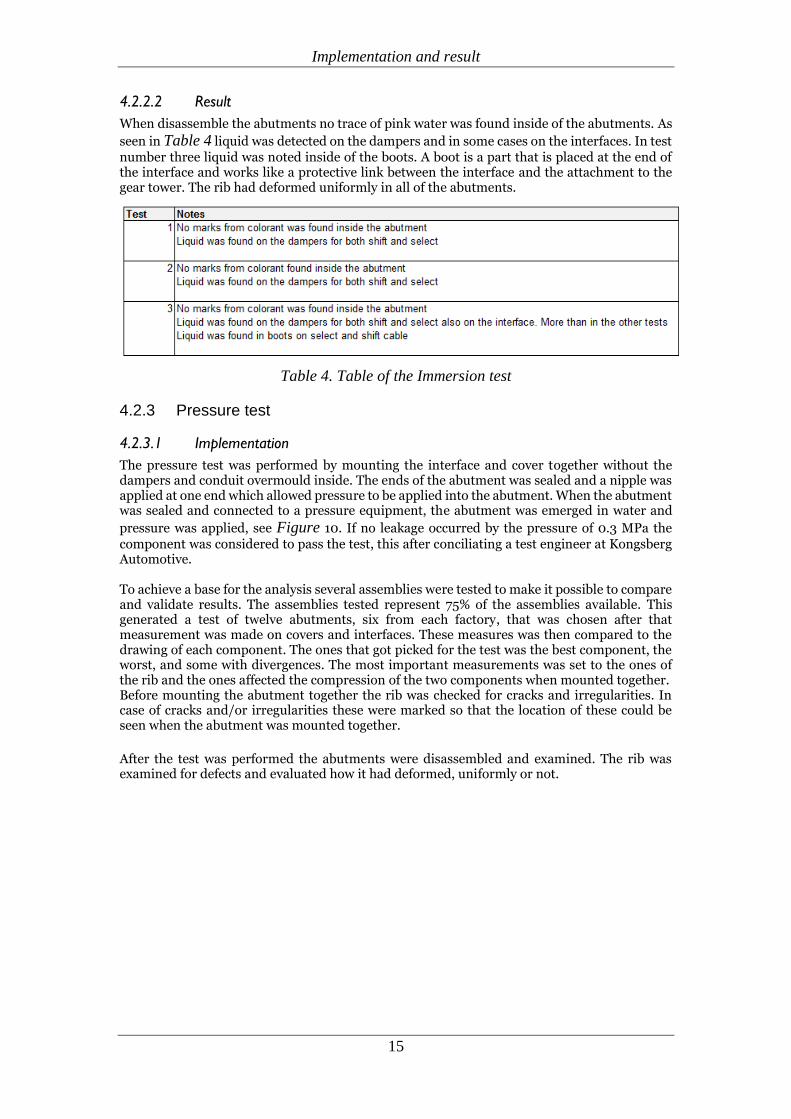
4.2.2.2 Result
When disassemble the abutments no trace of pink water was found inside of the abutments. As
seen in Table 4 liquid was detected on the dampers and in some cases on the interfaces. In test number three liquid was noted inside of the boots. A boot is a part that is placed at the end of the interface and works like a protective link between the interface and the attachment to the gear tower. The rib had deformed uniformly in all of the abutments.
Table 4. Table of the Immersion test
4.2.3 Pressure test
4.2.3.1 Implementation
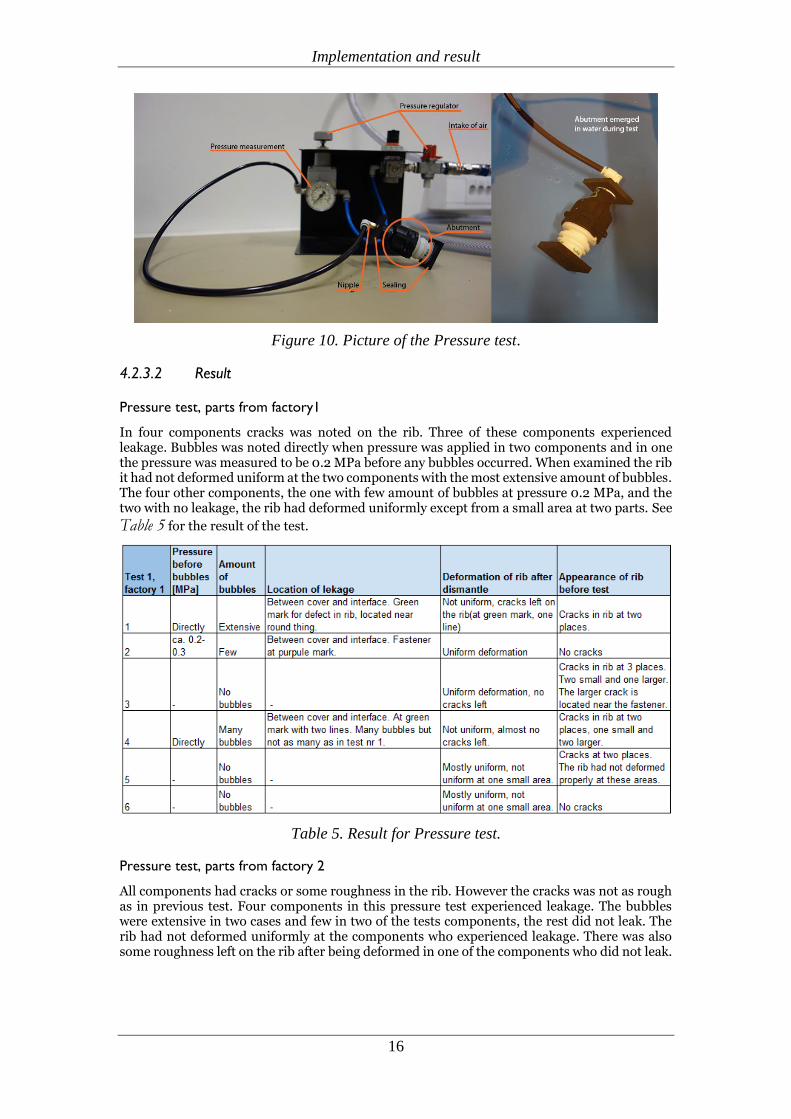
The pressure test was performed by mounting the interface and cover together without the dampers and conduit overmould inside. The ends of the abutment was sealed and a nipple was applied at one end which allowed pressure to be applied into the abutment. When the abutment was sealed and connected to a pressure equipment, the abutment was emerged in water and
pressure was applied, see Figure 10. If no leakage occurred by the pressure of 0.3 MPa the component was considered to pass the test, this after conciliating a test engineer at Kongsberg Automotive. To achieve a base for the analysis several assemblies were tested to make it possible to compare and validate results. The assemblies tested represent 75% of the assemblies available. This generated a test of twelve abutments, six from each factory, that was chosen after that measurement was made on covers and interfaces. These measures was then compared to the drawing of each component. The ones that got picked for the test was the best component, the worst, and some with divergences. The most important measurements was set to the ones of the rib and the ones affected the compression of the two components when mounted together. Before mounting the abutment together the rib was checked for cracks and irregularities. In case of cracks and/or irregularities these were marked so that the location of these could be seen when the abutment was mounted together. After the test was performed the abutments were disassembled and examined. The rib was examined for defects and evaluated how it had deformed, uniformly or not.
Implementation and result
16
Figure 10. Picture of the Pressure test.
4.2.3.2 Result
Pressure test, parts from factory1
In four components cracks was noted on the rib. Three of these components experienced leakage. Bubbles was noted directly when pressure was applied in two components and in one the pressure was measured to be 0.2 MPa before any bubbles occurred. When examined the rib it had not deformed uniform at the two components with the most extensive amount of bubbles. The four other components, the one with few amount of bubbles at pressure 0.2 MPa, and the two with no leakage, the rib had deformed uniformly except from a small area at two parts. See
Table 5 for the result of the test.
Table 5. Result for Pressure test.
Pressure test, parts from factory 2
All components had cracks or some roughness in the rib. However the cracks was not as rough as in previous test. Four components in this pressure test experienced leakage. The bubbles were extensive in two cases and few in two of the tests components, the rest did not leak. The rib had not deformed uniformly at the components who experienced leakage. There was also some roughness left on the rib after being deformed in one of the components who did not leak.

Implementation and result
17
Table 6. Result for Pressure test.
4.3 Implementation and result research question 2
4.3.1 Brainstorming
4.3.1.1 Implementation
The brainstorming session was performed at Kongsberg Automotive with a total of six participants, were four of the participants were employees at the department of Powertrain and Chassis. This means that all participants at the brainstorming had previous knowledge of the abutment and the problem. This was partly due to secrecy agreement of certain parts of the project. A facilitator held in the session and made sure that all ideas got noted and saved. Participants from Kongsberg Automotive were a Design manager and three Design engineers. The ideas generated was later presented to the Manager of Global R&D Manual Shifter System, who along with the design manager made a selection of which ideas was realistic to take further.

Implementation and result
18
4.3.1.2 Result
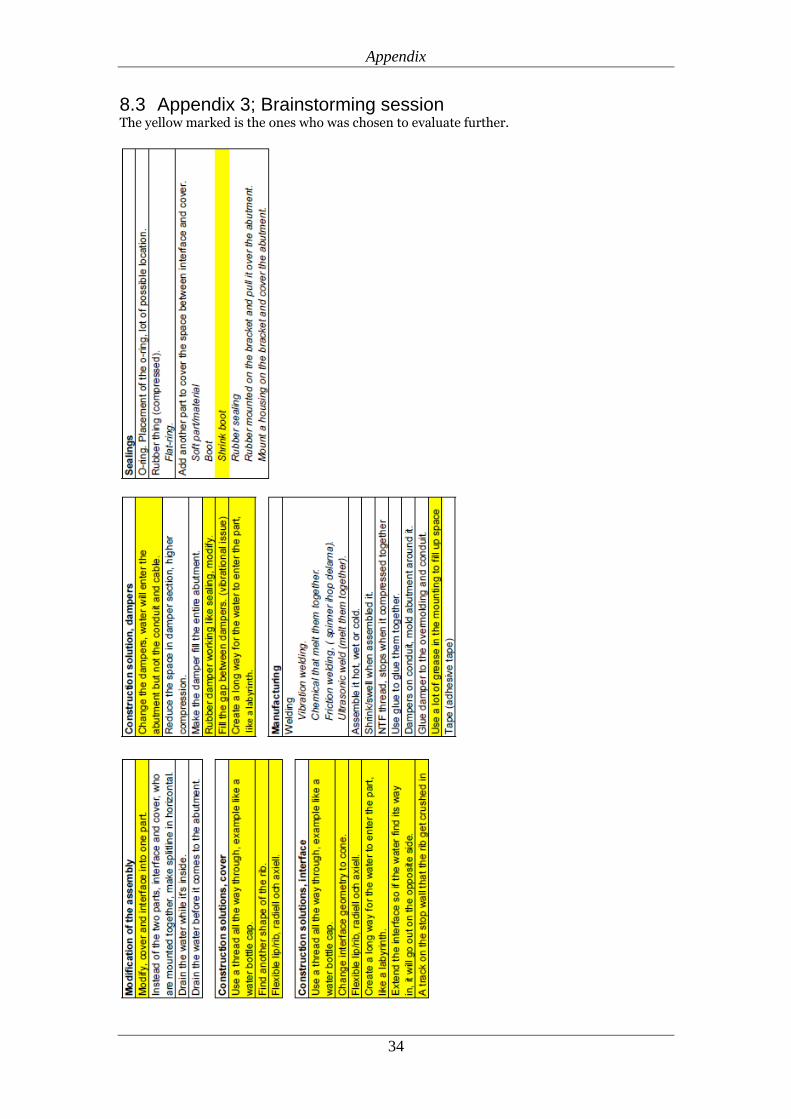
In Table 7 are the result of the ideas decided to take further from the Brainstorming. For all the
ideas generated at the Brainstorming see Appendix 3; Brainstorming session.
Table 7. Ideas chosen from Brainstorming.
4.3.2 Quality Function Deployment
4.3.2.1 Implementation
Since the customer requirements and needs was already known, the QFD matrix was only implemented in the construction phase. The QFD matrix was implemented three times, first to see which subsystem of the abutment to
focus on and second to further evaluate these subsystems. The first matrix in Figure 11 was done even if the subsystems of the abutment to focus on was stated at the beginning of the project.
4.3.2.2 Result
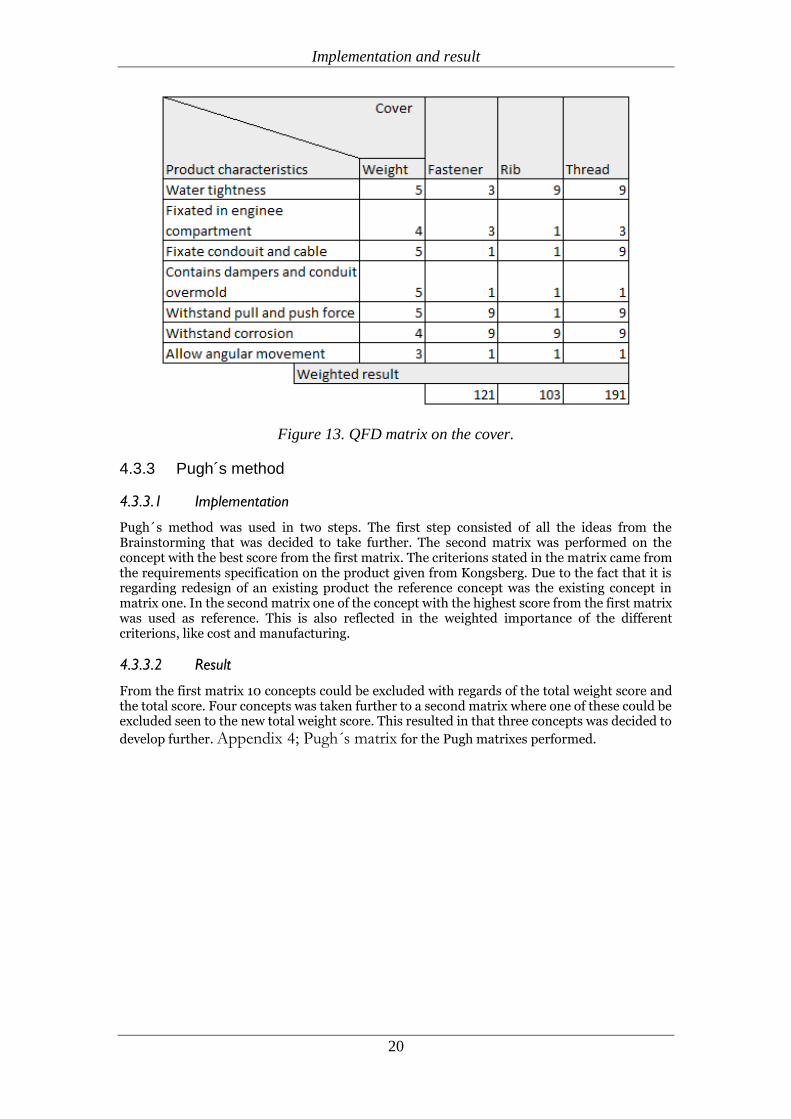
The first QFD matrix states that the focus should be on the interface and the cover, see Figure.
The second matrix was performed on the elements of the interface, see Figure 12, while the
third one was performed on the elements on the cover, see Figure 13. The ones with the highest score in the interface matrix were the elements Stop wall and Thread. In the cover matrix it was the Thread and fastener.

Implementation and result
19
Figure 11. QFD matrix on the subsystem of the abutment.
Figure 12. QFD matrix on the interface.
Implementation and result
20
Figure 13. QFD matrix on the cover.
4.3.3 Pugh´s method
4.3.3.1 Implementation
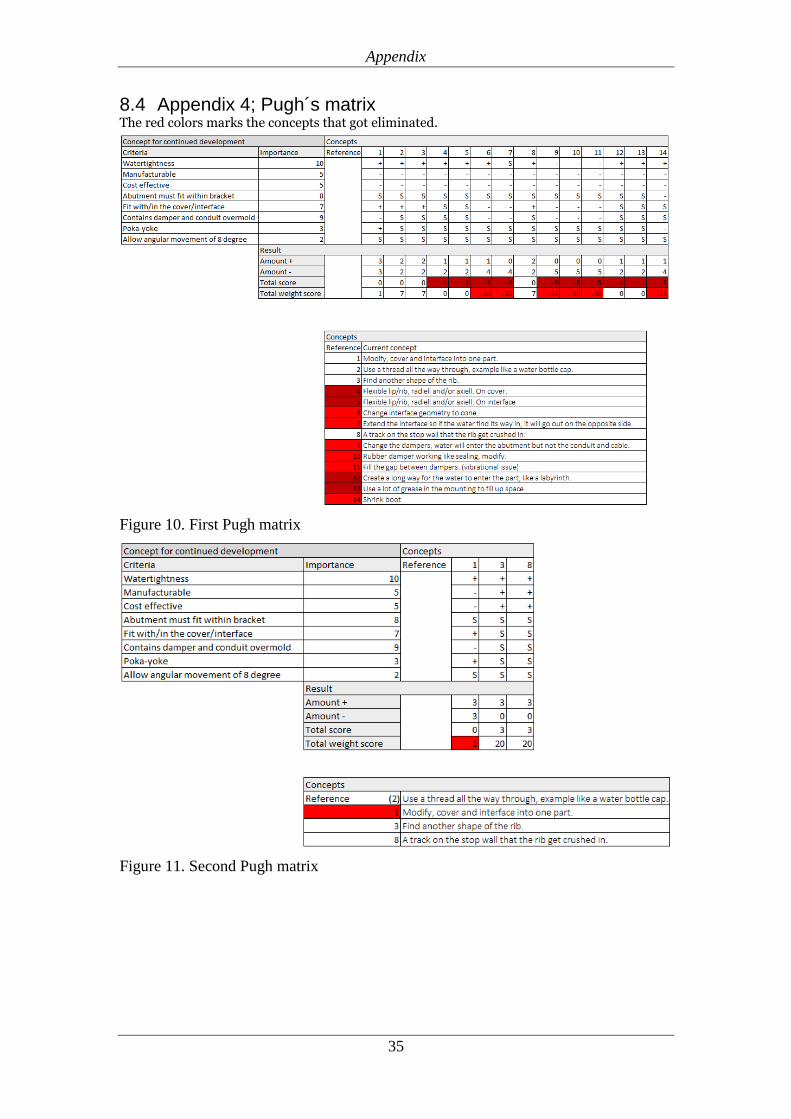
Pugh´s method was used in two steps. The first step consisted of all the ideas from the Brainstorming that was decided to take further. The second matrix was performed on the concept with the best score from the first matrix. The criterions stated in the matrix came from the requirements specification on the product given from Kongsberg. Due to the fact that it is regarding redesign of an existing product the reference concept was the existing concept in matrix one. In the second matrix one of the concept with the highest score from the first matrix was used as reference. This is also reflected in the weighted importance of the different criterions, like cost and manufacturing.
4.3.3.2 Result
From the first matrix 10 concepts could be excluded with regards of the total weight score and the total score. Four concepts was taken further to a second matrix where one of these could be excluded seen to the new total weight score. This resulted in that three concepts was decided to
develop further. Appendix 4; Pugh´s matrix for the Pugh matrixes performed.
Implementation and result
21
4.3.4 Concepts presented to Kongsberg Automotive From the result given by the Pugh method, three concepts where developed further and presented as suggestions to Kongsberg Automotive. These three concepts where presented by CAD-models.
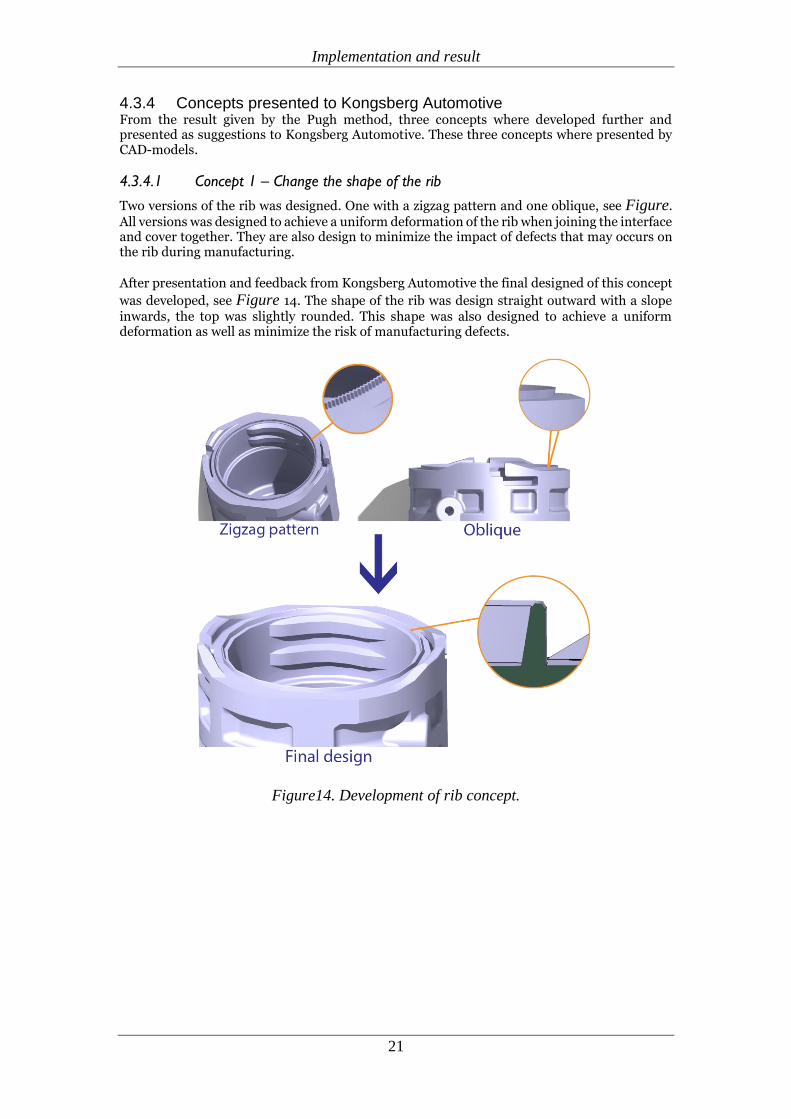
4.3.4.1 Concept 1 – Change the shape of the rib
Two versions of the rib was designed. One with a zigzag pattern and one oblique, see Figure. All versions was designed to achieve a uniform deformation of the rib when joining the interface and cover together. They are also design to minimize the impact of defects that may occurs on the rib during manufacturing.
After presentation and feedback from Kongsberg Automotive the final designed of this concept
was developed, see Figure 14. The shape of the rib was design straight outward with a slope inwards, the top was slightly rounded. This shape was also designed to achieve a uniform deformation as well as minimize the risk of manufacturing defects.
Figure14. Development of rib concept.
Implementation and result
22
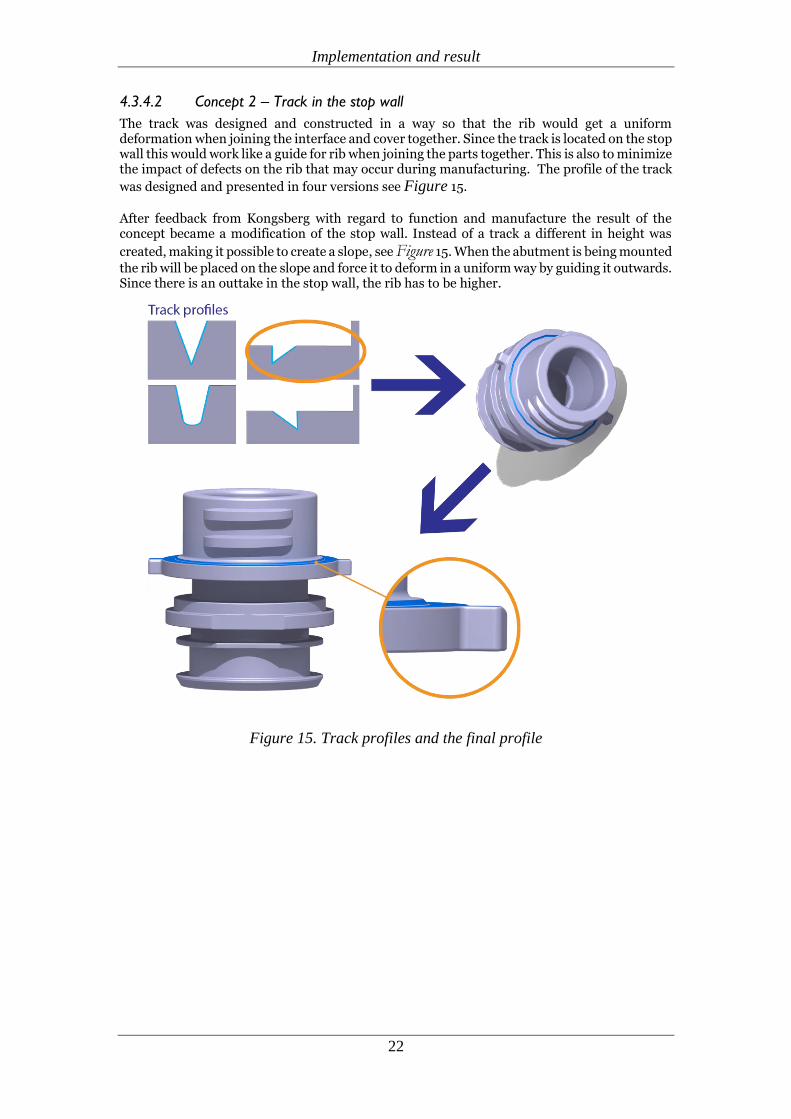
4.3.4.2 Concept 2 – Track in the stop wall
The track was designed and constructed in a way so that the rib would get a uniform deformation when joining the interface and cover together. Since the track is located on the stop wall this would work like a guide for rib when joining the parts together. This is also to minimize the impact of defects on the rib that may occur during manufacturing. The profile of the track
was designed and presented in four versions see Figure 15.
After feedback from Kongsberg with regard to function and manufacture the result of the concept became a modification of the stop wall. Instead of a track a different in height was
created, making it possible to create a slope, see Figure 15. When the abutment is being mounted
the rib will be placed on the slope and force it to deform in a uniform way by guiding it outwards. Since there is an outtake in the stop wall, the rib has to be higher.
Figure 15. Track profiles and the final profile
Implementation and result
23
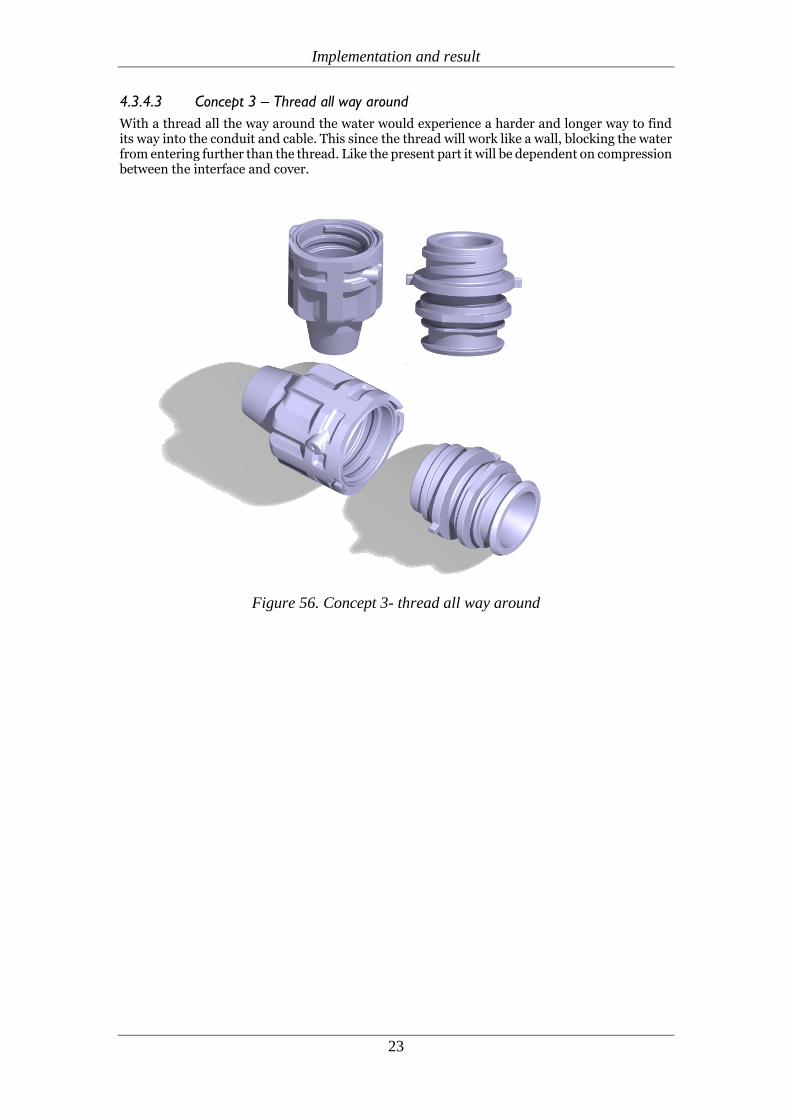
4.3.4.3 Concept 3 – Thread all way around
With a thread all the way around the water would experience a harder and longer way to find its way into the conduit and cable. This since the thread will work like a wall, blocking the water from entering further than the thread. Like the present part it will be dependent on compression between the interface and cover.
Figure 56. Concept 3- thread all way around

Analysis
24
5 Analysis
5.1 Research question 1
5.1.1 Fault Tree Analysis
By performing an FTA several possible root causes for water entering the abutment was found. These root causes was evaluated and analyzed by their testability with regards of the projects resources. This also generated which kinds of tests that were most suitable to perform to evaluate the testable root causes. Some of the non-testable causes were environment and machines in manufacturing. Other possible root causes that could be tested was measurements outside tolerance, defects in component from manufacturer and push and pull force applied in use. The force creates movements inside of the abutments which could lead to pressure, elongation and compression in the parts.
To evaluate the testable causes the immersion test and pressure test was used.
5.1.2 Immersion test
The liquid found on the interface and dampers after the immersion test was compared with the amount and density of the liquid in the abutments, in the same cable assembly, that had not been emerged in water. By this, together with the absence of pink water inside the part, the conclusion could be made that no leakage had occurred and that the liquid found was grease/lubricant used in the mounting process.
The liquid found in the boot was by the absence of pink water marks excluded the possibility to be water entering at the joint of the abutment. The liquid could still be water but in that case it
had entered the part in some other area which this project dose not focus on. See Table 8 for the result of the immersion test.
Table 8. Result from immersion test.
The possible stated root causes that could be excluded due to the result of the immersion test is
presented in Table 9 and are marked in red.

Analysis
25
Table 9. Possible root causes by the immersion test.
5.1.3 Pressure test The pressure test showed in several components that there is a risk of leakage. In this test the location of leakage and the amount of leakage could be evaluated. By summarizing and
analyzing the test result in Table 10 a connection between manufacturing defects in the rib and a non-uniform deformation of the rib could be made to why the abutment leak. This due to that leakage was most often located at irregularities caused due to manufacturing or where the deformation of the rib had been non uniform. This creates gaps that the water can seek its way into. Another possible root cause could be that the water have an easy way to get inside of the abutment if it passes through the joint. When performing the pressure test it became obvious, if the rib allows the water to go through there is nothing that will stop the water from continue to travel into the abutment.
Table 10. Results from pressure test.
The sum of the result and analysis of the tests show that the root cause is that in many cases the rib deforms not uniformly, which means that when being compressed it folds in different directions. It also shows that the manufacturing defects that occurs on the rib is a cause for water entering the joint of the abutment.
Analysis
26
5.2 Research question 2 From the stated root causes in research question 1 a possible solution to the leakage problem could be to redesign the rib. The rib would have to be constructed in a way so that it won’t bend in different ways and angels, and so that manufacturing defects won't affect the deformation of the rib.
The concepts presented and analyzed in this chapter are the three that got the best score in the Pugh matrixes. These, as discussed in the method chapter, represent the solution that best fulfills the criterions on the product. Two of these concepts also includes changes on the parts that the QFD matrix showed are the ones who is vital to fulfill the requirements for the product. Due to the fact that in the QFD matrix and the Pugh matrix the total weighted score was so distinctive in difference the most important part of the subsystem and the best concepts could be detected straight away.
Even though the second QFD matrix states that the rib is irrelevant in regards of fulfilling the requirements the product needs to achieve, the rib was not excluded. This because that seen to the requirement on water tightness the rib is important, but also in regards of the stated root cause of the leakage.
A factor that needed to be taking into consideration during construction was how the existing parts were manufactured. Changes on the parts means changes in the tooling used when manufactured, the goal was to make this change as small as possible. This due to changing in manufacturing results in high costs for the company. As a result of these changes both the requirement manufacturing and cost are weighted low in the QFD and in Pugh´s matrix.
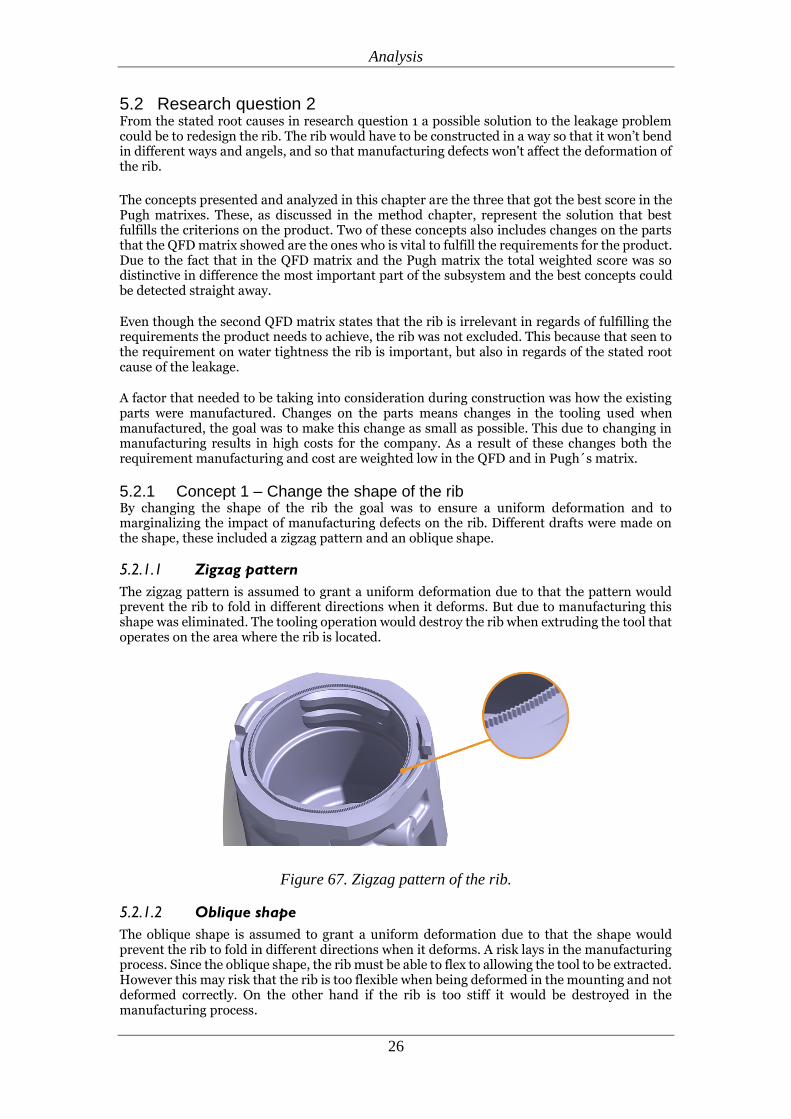
5.2.1 Concept 1 – Change the shape of the rib By changing the shape of the rib the goal was to ensure a uniform deformation and to marginalizing the impact of manufacturing defects on the rib. Different drafts were made on the shape, these included a zigzag pattern and an oblique shape.
5.2.1.1 Zigzag pattern
The zigzag pattern is assumed to grant a uniform deformation due to that the pattern would prevent the rib to fold in different directions when it deforms. But due to manufacturing this shape was eliminated. The tooling operation would destroy the rib when extruding the tool that operates on the area where the rib is located.
Figure 67. Zigzag pattern of the rib.
5.2.1.2 Oblique shape
The oblique shape is assumed to grant a uniform deformation due to that the shape would prevent the rib to fold in different directions when it deforms. A risk lays in the manufacturing process. Since the oblique shape, the rib must be able to flex to allowing the tool to be extracted. However this may risk that the rib is too flexible when being deformed in the mounting and not deformed correctly. On the other hand if the rib is too stiff it would be destroyed in the manufacturing process.

Analysis
27
Figure 78. Oblique rib
5.2.1.3 Final shape of concept 1
The final concept is a modification of the oblique shape. Since only one side of the rib is oblique and the other one is straight the manufacturing of the rib won´t be a problem. The rounded top is assumed to eliminate the manufacturing defects that usually occurs on the present rib.
Figure 89. Final concept of the rib.
5.2.2 Concept 2 – Track in the stop wall The first idea of concept 2 was to have a track on the stop wall of the interface for the rib to get crushed in. The track was supposed to work like a guide for the rib to get a uniform deformation when joining the parts together as well as minimize the impact of the manufacturing defects on the rib. The profile of the track had four possible ways on how it could be designed. All four of these profile has the same manufacturability, but seen to the manufacturing of the existing part it would lead to an extensive change in the manufacturing tools. Since there is a split line along the horizontal line of the interface, the tool will get stuck in the track or damage the interface.
Figure 20. First track concept.
Analysis
28
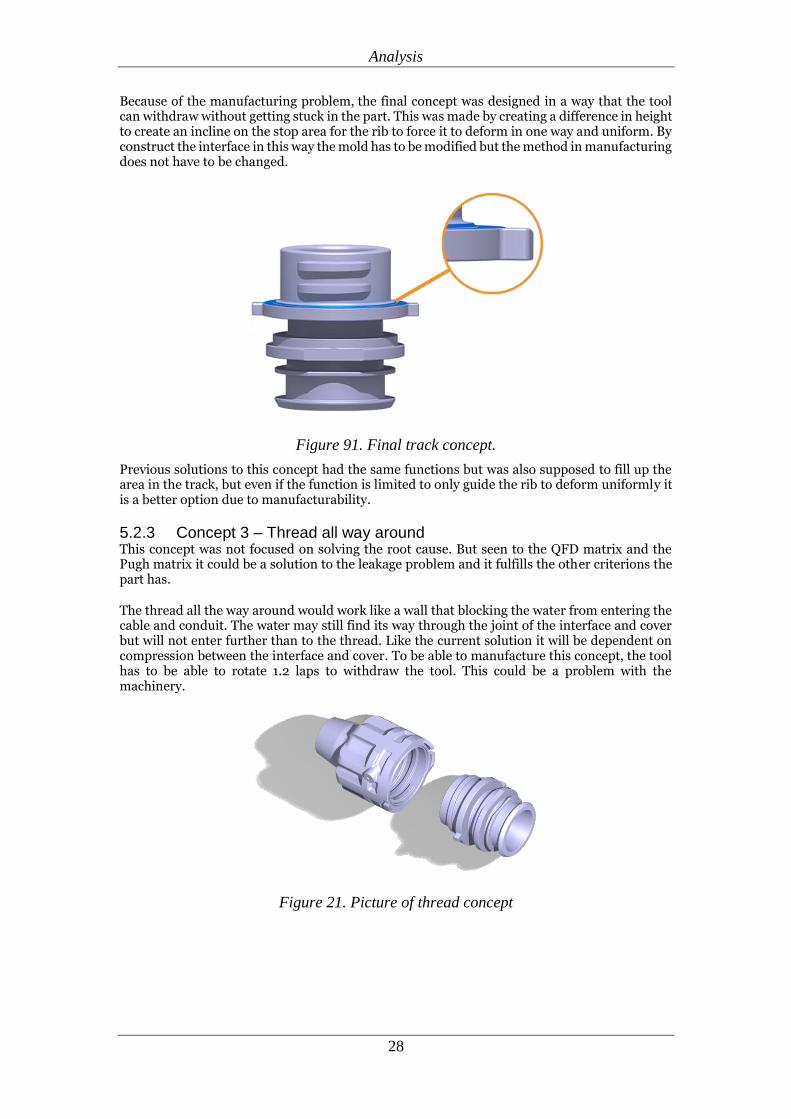
Because of the manufacturing problem, the final concept was designed in a way that the tool can withdraw without getting stuck in the part. This was made by creating a difference in height to create an incline on the stop area for the rib to force it to deform in one way and uniform. By construct the interface in this way the mold has to be modified but the method in manufacturing does not have to be changed.
Figure 91. Final track concept.
Previous solutions to this concept had the same functions but was also supposed to fill up the area in the track, but even if the function is limited to only guide the rib to deform uniformly it is a better option due to manufacturability.
5.2.3 Concept 3 – Thread all way around This concept was not focused on solving the root cause. But seen to the QFD matrix and the Pugh matrix it could be a solution to the leakage problem and it fulfills the other criterions the part has.
The thread all the way around would work like a wall that blocking the water from entering the cable and conduit. The water may still find its way through the joint of the interface and cover but will not enter further than to the thread. Like the current solution it will be dependent on compression between the interface and cover. To be able to manufacture this concept, the tool has to be able to rotate 1.2 laps to withdraw the tool. This could be a problem with the machinery.
Figure 21. Picture of thread concept
Discussion and conclusion
29
6 Discussion and conclusion
6.1 Implications This thesis aimed to establish why water enters the joint of the abutment and to present possible concepts that eliminate the leakage. The analysis and tests performed to find the source of the leakage can be used as a foundation for Kongsberg Automotive to further evaluate the parts and system that have been tested. The established sources for the leakage may also be applicable in other cases.
Kongsberg Automotive will also be provided with three new concepts they could implement if they find them satisfying. They also have analysis made on a high amount of possible concepts for the abutment that could generate further ideas concerning other focus areas than the one for this thesis.
6.2 Conclusions and recommendations The conclusion from the analysis and tests performed are that water enter the joint of the interface and cover due to manufacturing defects and non-uniform deformation of the rib. This answers the first research question.
The intention in this thesis was also to find suitable solutions to prevent water from entering the abutment in the cable system. The result was three concepts that could be the solution to the problem without adding an extra component. However, it has not yet been proven that any of these concepts are the final solution to the leakage problem, as it is beyond the time frame for this work to perform the necessary verifying tests.
In all three concepts the mold has to be modified. Even if the mold has to be changed and this could be an extensive modification that could result in a high tooling cost, it would be a one-time cost.
The third concept would not only lead to modifications of the mold, it would also need changes in manufacturing aspects. The tool would have to be able to withdraw from the cover by twisting 1.2 laps which is a larger moment than in the present with only 0.25 laps.
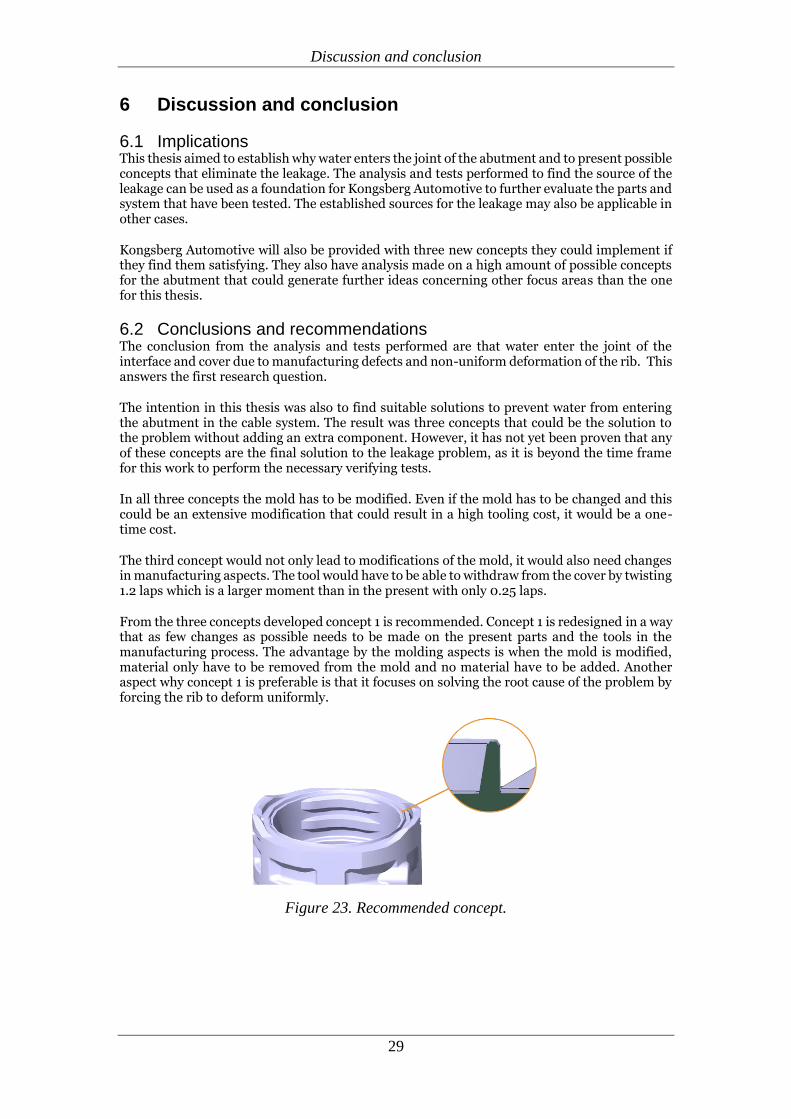
From the three concepts developed concept 1 is recommended. Concept 1 is redesigned in a way that as few changes as possible needs to be made on the present parts and the tools in the manufacturing process. The advantage by the molding aspects is when the mold is modified, material only have to be removed from the mold and no material have to be added. Another aspect why concept 1 is preferable is that it focuses on solving the root cause of the problem by forcing the rib to deform uniformly.
Figure 23. Recommended concept.
Discussion and conclusion
30
6.3 Further work In this project the possibility of a construction solution have been evaluated. These concept presented should be evaluated and tested with prototypes to determine if they works in reality.
In regards to the stated root cause, the aspect of material and manufacturing should be evaluated further. Another aspect to evaluate further is to look into the other possible root causes from the FTA since not all of them was tested in this project. This was due to limited resources in regards of time and equipment. Possible root causes could be due to the environment the abutments is exposed to and the fact that two different factories is used in manufacturing. To be able to investigate the difference in components from different factories an immersion test of parts from the second factory is recommended as well. It is also recommended that with better equipment measure the parts and evaluate the manufacturing process in the different factories.

References
31
7 References
[1] K. Automotive, "About us," [Online]. Available:
http://www.kongsbergautomotive.com/about-us/. [Accessed 03 April 2017].
[2] Shona L. Brown and Kathleen M Eisenhardt, "Product development: Past research,
Present findings and future directions," Academy of Management, vol. 20, p. 344,
1995.
[3] D. G. Ullman, The Mechanical Design Process, New York: The McGraw-Hill
Companies, Inc., 2010.
[4] J.-G. P. a. D. P. Hans Johannesson, Produktutveckling, Effektiva metoder för
konstrukion, Stockholm: Liber, 2013.
[5] D. U. &. S. Eppinger, "Improving product development process design: a method
for managing informatin flows, risks, and iterations," Journal of Engineering
Design , vol. 22, no. 10, pp. 689-699, 2011.
[6] W. B. J. F. &. K. G. G. Pahl, Engineering design: A systematic approach, Lodon:
Springer , 2007.
[7] C. Wilson, Brainstormin and Beyond, a user-centerad design method, Oxford:
Elsevier Inc. , 2013.
[8] S. Ottosson, QFD i produktutvecklingsarbetet, Göteborg: Institutet för
Verkstadsteknisk Forskning, 1993.
[9] M. Catelani, L. Cristaldi, M. Lazzaroni, P. Rinaldi and L. Peretto, Reliability
Engineering, basic concepts and applications in ICT, Berlin Heidelberg: Springer,
2011.
Appendix
32
8 Appendix
8.1 Appendix 1; GANTT-chart
Appendix
33
8.2 Appendix 2, FTA
Appendix
34
8.3 Appendix 3; Brainstorming session The yellow marked is the ones who was chosen to evaluate further.
Appendix
35
8.4 Appendix 4; Pugh´s matrix The red colors marks the concepts that got eliminated.
Figure 10. First Pugh matrix
Figure 11. Second Pugh matrix