Embed Size (px)
Citation preview
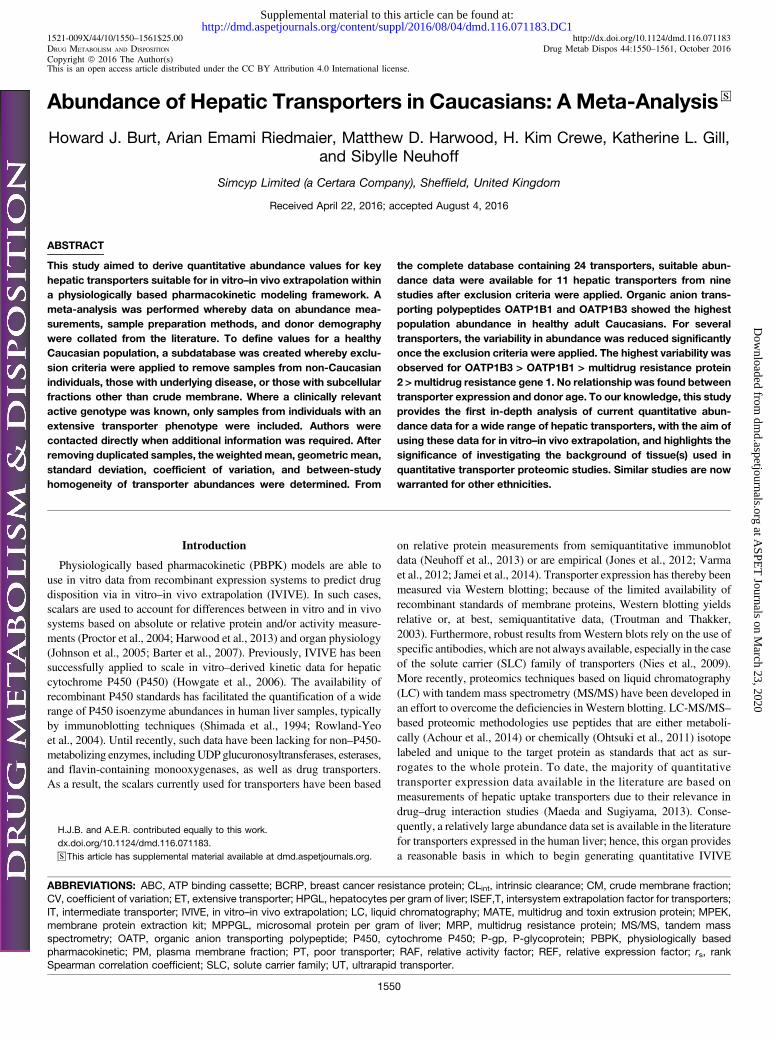
1521-009X/44/10/1550–1561$25.00 http://dx.doi.org/10.1124/dmd.116.071183DRUG METABOLISM AND DISPOSITION Drug Metab Dispos 44:1550–1561, October 2016Copyright ª 2016 The Author(s)This is an open access article distributed under the CC BY Attribution 4.0 International license.
Abundance of Hepatic Transporters in Caucasians: A Meta-Analysis s
Howard J. Burt, Arian Emami Riedmaier, Matthew D. Harwood, H. Kim Crewe, Katherine L. Gill,and Sibylle Neuhoff
Simcyp Limited (a Certara Company), Sheffield, United Kingdom
Received April 22, 2016; accepted August 4, 2016
ABSTRACT
This study aimed to derive quantitative abundance values for keyhepatic transporters suitable for in vitro–in vivo extrapolation withina physiologically based pharmacokinetic modeling framework. Ameta-analysis was performed whereby data on abundance mea-surements, sample preparation methods, and donor demographywere collated from the literature. To define values for a healthyCaucasian population, a subdatabase was created whereby exclu-sion criteria were applied to remove samples from non-Caucasianindividuals, those with underlying disease, or those with subcellularfractions other than crude membrane. Where a clinically relevantactive genotype was known, only samples from individuals with anextensive transporter phenotype were included. Authors werecontacted directly when additional information was required. Afterremoving duplicated samples, the weighted mean, geometric mean,standard deviation, coefficient of variation, and between-studyhomogeneity of transporter abundances were determined. From
the complete database containing 24 transporters, suitable abun-dance data were available for 11 hepatic transporters from ninestudies after exclusion criteria were applied. Organic anion trans-porting polypeptides OATP1B1 and OATP1B3 showed the highestpopulation abundance in healthy adult Caucasians. For severaltransporters, the variability in abundance was reduced significantlyonce the exclusion criteria were applied. The highest variability wasobserved for OATP1B3 > OATP1B1 > multidrug resistance protein2 >multidrug resistance gene 1. No relationship was found betweentransporter expression and donor age. To our knowledge, this studyprovides the first in-depth analysis of current quantitative abun-dance data for a wide range of hepatic transporters, with the aim ofusing these data for in vitro–in vivo extrapolation, and highlights thesignificance of investigating the background of tissue(s) used inquantitative transporter proteomic studies. Similar studies are nowwarranted for other ethnicities.
Introduction
Physiologically based pharmacokinetic (PBPK) models are able touse in vitro data from recombinant expression systems to predict drugdisposition via in vitro–in vivo extrapolation (IVIVE). In such cases,scalars are used to account for differences between in vitro and in vivosystems based on absolute or relative protein and/or activity measure-ments (Proctor et al., 2004; Harwood et al., 2013) and organ physiology(Johnson et al., 2005; Barter et al., 2007). Previously, IVIVE has beensuccessfully applied to scale in vitro–derived kinetic data for hepaticcytochrome P450 (P450) (Howgate et al., 2006). The availability ofrecombinant P450 standards has facilitated the quantification of a widerange of P450 isoenzyme abundances in human liver samples, typicallyby immunoblotting techniques (Shimada et al., 1994; Rowland-Yeoet al., 2004). Until recently, such data have been lacking for non–P450-metabolizing enzymes, includingUDPglucuronosyltransferases, esterases,and flavin-containing monooxygenases, as well as drug transporters.As a result, the scalars currently used for transporters have been based
on relative protein measurements from semiquantitative immunoblotdata (Neuhoff et al., 2013) or are empirical (Jones et al., 2012; Varmaet al., 2012; Jamei et al., 2014). Transporter expression has thereby beenmeasured via Western blotting; because of the limited availability ofrecombinant standards of membrane proteins, Western blotting yieldsrelative or, at best, semiquantitative data, (Troutman and Thakker,2003). Furthermore, robust results fromWestern blots rely on the use ofspecific antibodies, which are not always available, especially in the caseof the solute carrier (SLC) family of transporters (Nies et al., 2009).More recently, proteomics techniques based on liquid chromatography(LC) with tandem mass spectrometry (MS/MS) have been developed inan effort to overcome the deficiencies in Western blotting. LC-MS/MS–based proteomic methodologies use peptides that are either metaboli-cally (Achour et al., 2014) or chemically (Ohtsuki et al., 2011) isotopelabeled and unique to the target protein as standards that act as sur-rogates to the whole protein. To date, the majority of quantitativetransporter expression data available in the literature are based onmeasurements of hepatic uptake transporters due to their relevance indrug–drug interaction studies (Maeda and Sugiyama, 2013). Conse-quently, a relatively large abundance data set is available in the literaturefor transporters expressed in the human liver; hence, this organ providesa reasonable basis in which to begin generating quantitative IVIVE
H.J.B. and A.E.R. contributed equally to this work.dx.doi.org/10.1124/dmd.116.071183.s This article has supplemental material available at dmd.aspetjournals.org.
ABBREVIATIONS: ABC, ATP binding cassette; BCRP, breast cancer resistance protein; CLint, intrinsic clearance; CM, crude membrane fraction;CV, coefficient of variation; ET, extensive transporter; HPGL, hepatocytes per gram of liver; ISEF,T, intersystem extrapolation factor for transporters;IT, intermediate transporter; IVIVE, in vitro–in vivo extrapolation; LC, liquid chromatography; MATE, multidrug and toxin extrusion protein; MPEK,membrane protein extraction kit; MPPGL, microsomal protein per gram of liver; MRP, multidrug resistance protein; MS/MS, tandem massspectrometry; OATP, organic anion transporting polypeptide; P450, cytochrome P450; P-gp, P-glycoprotein; PBPK, physiologically basedpharmacokinetic; PM, plasma membrane fraction; PT, poor transporter; RAF, relative activity factor; REF, relative expression factor; rs, rankSpearman correlation coefficient; SLC, solute carrier family; UT, ultrarapid transporter.
1550
http://dmd.aspetjournals.org/content/suppl/2016/08/04/dmd.116.071183.DC1Supplemental material to this article can be found at:
at ASPE
T Journals on M
arch 23, 2020dm
d.aspetjournals.orgD
ownloaded from
scalars for PBPK modeling. To generate robust IVIVE scalars that arerelevant to a particular target population, the design of the currentlyreported quantitative proteomic studies assessing liver transporterabundance must be evaluated. This includes the choice of the subcellularfraction in which the protein was quantified and the correspondingextraction method as well as the source of liver samples, which may bederived from a multitude of disease, phenotype, age, and ethnic back-grounds. In light of the potential differences in transporter expres-sion among individuals of different backgrounds, it is important todefine selection criteria based on these differences to ensure that thequantitative scalars are based on a homogeneous baseline population.Similarly, the between-study heterogeneity should be analyzed andduplicate use of source data should be avoided. Here we aim toprovide an up-to-date meta-analysis of quantitative hepatic transporterabundance data, which are readily available for quantitative abun-dance scaling within a PBPK framework such as the SimcypSimulator (version 15, release 1; Simcyp Limited, Sheffield, UK),and to highlight the potential limitations that might be associated withthese values.
Materials and Methods
Abundance Data. An in-house database of published quantitative abun-dance data was first established in 2009. This initial database was expanded tocontain published data for all known hepatic drug transporters that have beenquantified in human liver tissue (n = 24 transporters). This was performed viasearching the PubMed electronic database using the following keywordcombination: hepatic/liver transporter abundance, absolute quantification,proteomics, and quantitative immunoblotting. A complete database includingall available measurements was established (final literature search, November2015), with background information on the methods as well as donordemographics collated where provided. In cases in which individual datawere not directly reported, data were extracted via GetData Graph Digitizer(version 2.22, http://getdata-graph-digitizer.com) or authors were contacteddirectly to request individual donor data. A refined subdatabase was createdthrough the use of various exclusion criteria. First, study methodologies werereviewed to ensure that abundances were quantified using LC-MS/MS orquantitative Western blotting in crude membrane (CM) fractions. Next, datafor which it was stated that the corresponding human liver tissue was not fromadult (aged.18 years), healthy, extensive transporter (ET) phenotype (wherea clinically relevant active phenotype has been reported) or Caucasianindividuals were excluded. Individuals with the ET phenotype were consid-ered to be those that are either wild type or have similar levels of activity.Where only mean abundance data were available, measurements wereincluded in the final database if fewer than 10% of the individuals met theexclusion criteria. Furthermore, the source of data was identified to ensure thatduplicate measurements from the same tissue sample were not included in therefined database. Meta-analysis was then used to characterize the abundance ofhepatic transporters in both the complete and refined databases.
IVIVE and CM Yield. Transporter protein absolute abundance values arereported in moles of transporter protein per mass of total protein, where totalprotein relates to the subcellular fraction under study, typically CM (or totalmembrane). In vitro transporter activity expressed as an intrinsic clearance (CLint)can be scaled to a whole liver clearance (in liters per hour) either via relativetransporter expression (eq. 1) or via absolute transporter expression (eq. 2). Ineither equation, the value of CLint,j may be dependent on the concentration at thetransporter binding site if nonlinear kinetics (Jmax and Km) are defined.
CLint;liver ¼ +n
j¼1CLint; j × RAF
�REFj × Fj;i × HPGLi × Liver Weighti × 60 × 102 6
ð1Þ
where CLint, j is the in vitro intrinsic transport clearance for transporter j (inmicroliters per minute per million hepatocytes), REF or RAF is relativeexpression factor/relative activity factor in vivo compared with in vitro, Fi isthe relative abundance for the phenotype of individual i (i.e., Fi = 1 for an ET),
HPGL is the number of hepatocytes per gram of liver, liver weight is the subject’sliver weight (in grams), and CLint, liver is the whole liver intrinsic transportclearance (in liters per hour).
CLint;liver ¼ +n
j¼1CLint; j × AbundanceH; j;i × ISEF;Tj × HPGLi × Liver Weighti × 60 × 102 6
ð2Þ
where CLint,j is the in vitro intrinsic transport clearance for transporter j (inmicroliters per minute per picomoles of transporter), ISEF,T is the intersystemactivity/abundance ratio between the in vitro system and in vivo (Harwood et al.,2013) and AbundanceH,j,i is the absolute hepatic transporter abundance in thetarget individual (in picomoles of transporter per million hepatocytes).
To be compatible with the IVIVE approach defined by eq. 2, the reportedabundance values were converted from units of picomoles of transporter permilligram of CM protein to picomoles of transporter per million hepatocytes. Thisconversion requires an estimate of the yield of CM protein (in milligrams) pergram of liver tissue that was obtained when using the relevant membraneextraction method. Because such a yield is not routinely reported in transporterabundance studies, authors of potential sources of these data were contactedindividually. The exclusion criteria that were applied to abundance values werealso applied to obtained values of CM yield.
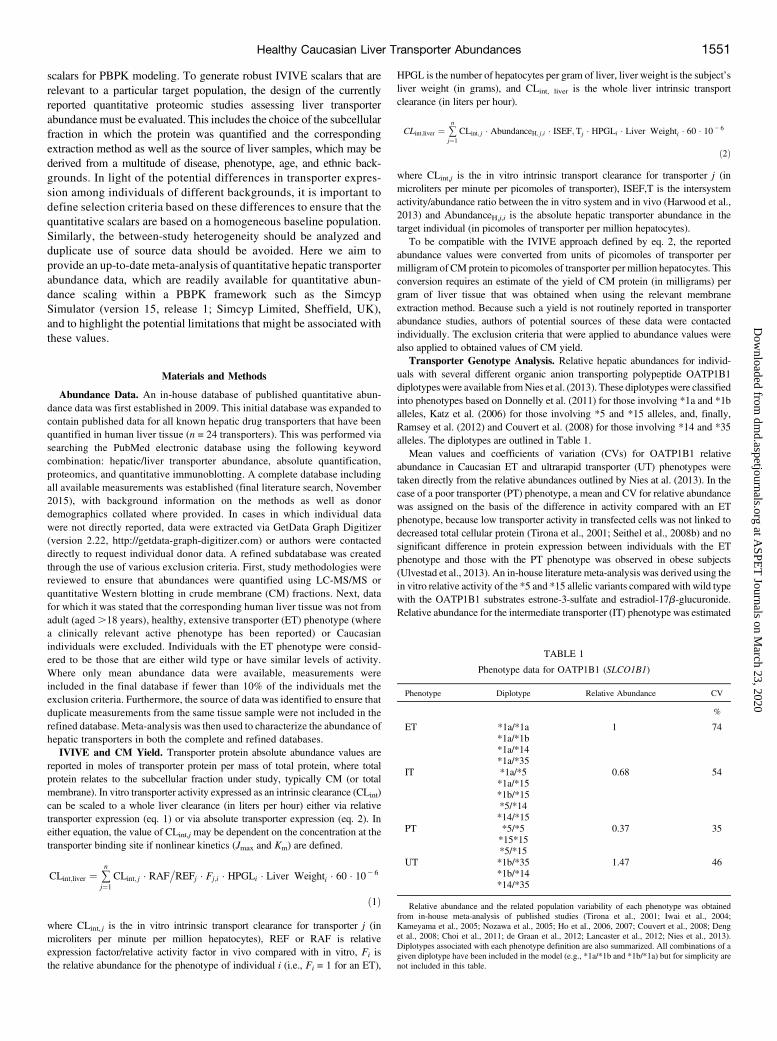
Transporter Genotype Analysis. Relative hepatic abundances for individ-uals with several different organic anion transporting polypeptide OATP1B1diplotypeswere available fromNies et al. (2013). These diplotypeswere classifiedinto phenotypes based on Donnelly et al. (2011) for those involving *1a and *1balleles, Katz et al. (2006) for those involving *5 and *15 alleles, and, finally,Ramsey et al. (2012) and Couvert et al. (2008) for those involving *14 and *35alleles. The diplotypes are outlined in Table 1.
Mean values and coefficients of variation (CVs) for OATP1B1 relativeabundance in Caucasian ET and ultrarapid transporter (UT) phenotypes weretaken directly from the relative abundances outlined by Nies at al. (2013). In thecase of a poor transporter (PT) phenotype, a mean and CV for relative abundancewas assigned on the basis of the difference in activity compared with an ETphenotype, because low transporter activity in transfected cells was not linked todecreased total cellular protein (Tirona et al., 2001; Seithel et al., 2008b) and nosignificant difference in protein expression between individuals with the ETphenotype and those with the PT phenotype was observed in obese subjects(Ulvestad et al., 2013). An in-house literature meta-analysis was derived using thein vitro relative activity of the *5 and *15 allelic variants compared with wild typewith the OATP1B1 substrates estrone-3-sulfate and estradiol-17b-glucuronide.Relative abundance for the intermediate transporter (IT) phenotype was estimated
TABLE 1
Phenotype data for OATP1B1 (SLCO1B1)
Phenotype Diplotype Relative Abundance CV
%
ET *1a/*1a 1 74*1a/*1b*1a/*14*1a/*35
IT *1a/*5 0.68 54*1a/*15*1b/*15*5/*14*14/*15
PT *5/*5 0.37 35*15*15*5/*15
UT *1b/*35 1.47 46*1b/*14*14/*35
Relative abundance and the related population variability of each phenotype was obtainedfrom in-house meta-analysis of published studies (Tirona et al., 2001; Iwai et al., 2004;Kameyama et al., 2005; Nozawa et al., 2005; Ho et al., 2006, 2007; Couvert et al., 2008; Denget al., 2008; Choi et al., 2011; de Graan et al., 2012; Lancaster et al., 2012; Nies et al., 2013).Diplotypes associated with each phenotype definition are also summarized. All combinations of agiven diplotype have been included in the model (e.g., *1a/*1b and *1b/*1a) but for simplicity arenot included in this table.
Healthy Caucasian Liver Transporter Abundances 1551
at ASPE
T Journals on M
arch 23, 2020dm
d.aspetjournals.orgD
ownloaded from
from PT in vitro activity data and ET protein abundance data. Currently, it is notclear whether the in vivo activity of OATP1B1 in individuals with the ITphenotype is linked to protein abundance (as has been shown for ET and UT) oronly in vitro activity (as has been shown for PT). Therefore, a midpoint value ofrelative abundance between PT and ET was assumed with the CV calculated fromthe abundance values reported previously (Nies et al., 2013). An estimate of thepopulation frequencies of ET, PT, IT, and UT phenotypes in Caucasians waspreviously defined from a literature meta-analysis (Emami Riedmaier et al., 2016).
Data Analysis. A relationship between age and CM yield obtained using theProteoExtract native membrane extraction kit (MPEK) (Calbiochem, Billerica,MA) was investigated similarly to the manner in which the relationship betweenage and microsomal protein per gram of liver (MPPGL) was previously defined(Barter et al., 2008). Polynomial functions of two to five orders were fitted to thelog-transformed CM yield (assuming a log-normal distribution of data) andgoodness of fit was evaluated via visual inspection of the data and calculation ofthe Akaike information criterion.
Abundances were converted from picomoles of transporter protein permilligram of CM protein to picomoles per million hepatocytes using eq. 3.
Abundancey ¼�Abundancex × Yieldage
��HPGLage ð3Þ
where Abundancey is the abundance in picomoles of transporter per millionhepatocytes, Abundancex is the abundance reported in the literature (pico-moles per milligram of protein), Yieldage is the CM yield for donor age(milligrams of protein per gram of liver), and HPGLage is the hepatocellularity(106 hepatocytes per gram of liver) for donor age (Barter et al., 2007). Whereindividual abundance measurements were available, Yieldage and HPGLage
were calculated for each donor, whereas the mean age of the donors was usedfor mean abundance measurements. The relationship between yield and agethat was applied in eq. 3 was specific to the extraction method used. In cases inwhich the CM was generated using differential centrifugation, yield wasdetermined from the MPPGL relationship with age (Barter et al., 2008), whereasthe relationship defined in our studywas applied if theMPEKwas used. In cases inwhich the filter-aided sample preparationmethod was used (Vildhede et al., 2014),a yield similar to that obtained by an MPEK was assumed.
After applying the exclusion criteria to the complete database, the collatedindividual abundance values for the healthy, Caucasian adult subdatabase werecombined for a given transporter to generate weighted mean, geometric mean,standard deviation, and weighted coefficient of variation based on the equationsdescribed previously (Perrett et al., 2007). The abundance values were furthertested for between-study heterogeneity using the Cochran X2-based Q test (Perrettet al., 2007), whereby heterogeneity was assigned as low (P . 0.05), moderate(P , 0.05 and P . 0.001), or high (P , 0.001).
Using cases where more than one transporter was quantified in the same liversample, correlations between transporters were tested in both the complete andrefined databases. A Shapiro–Wilk normality test was used to test for Gaussiandistributions of the abundance data for OATP1B1, OATP1B3, OATP2B1, andP-glycoprotein (P-gp).
The relationship between the expression of OATP transporters and age wasexamined in the subdatabase in which case samples from individuals agedyounger than 18 years were also included (all other exclusion factors applied). Inaddition, the effect of fatty liver disease on the expression of OATPs, P-gp,multidrug resistance protein MRP2, and breast cancer resistance protein (BCRP)and sex-associated differences in expression for OATPs and P-gp wereinvestigated by including such samples in the subdatabase with the otherexclusion factors retained.
Simulations. To assess the number of livers required to replicate the reportedsubset of transporter abundance and variability using the Simcyp Simulator(version 15, release 1), simulations were run in 100, 200, 500, 1000, and2000 healthy virtual individuals of North European Caucasian background andthe population abundance values were compared with values used to create thepopulation library. The Mersenne Twister MT19937 random number generatorwas used to generate individuals.
Results
Genotype Data and Frequencies. Table 1 shows the classificationof OATP1B1 genotypes and phenotype-linked relative abundances.Abundance Database. In this study, a total of 1486 measurements
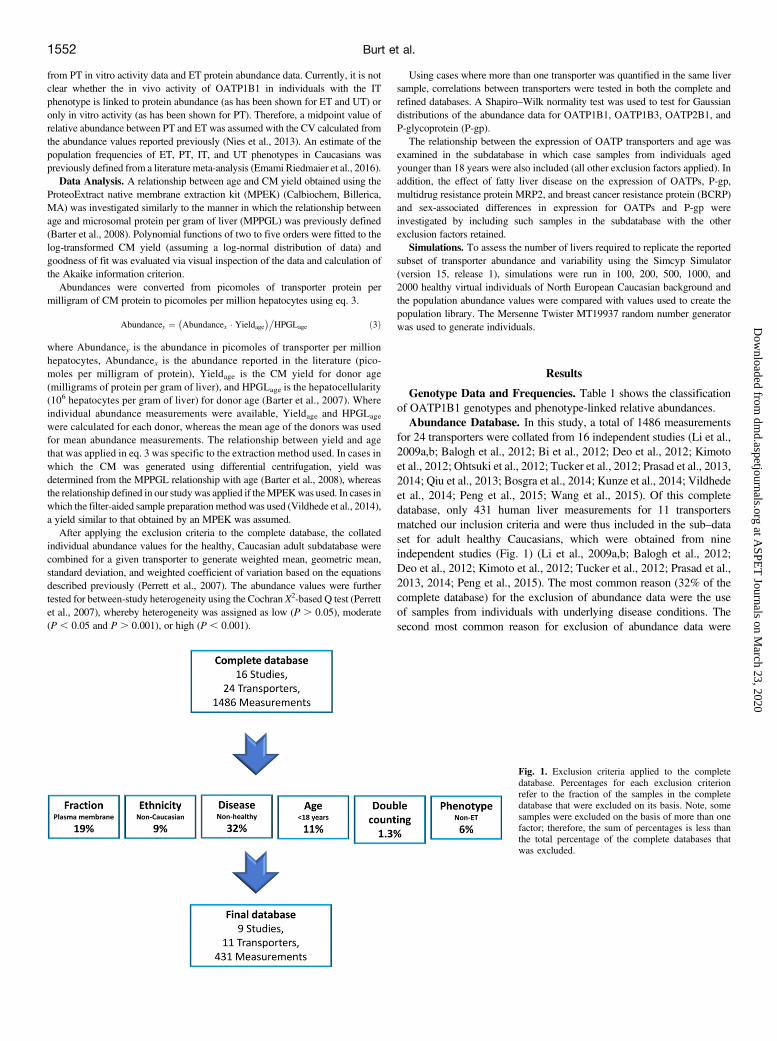
for 24 transporters were collated from 16 independent studies (Li et al.,2009a,b; Balogh et al., 2012; Bi et al., 2012; Deo et al., 2012; Kimotoet al., 2012; Ohtsuki et al., 2012; Tucker et al., 2012; Prasad et al., 2013,2014; Qiu et al., 2013; Bosgra et al., 2014; Kunze et al., 2014; Vildhedeet al., 2014; Peng et al., 2015; Wang et al., 2015). Of this completedatabase, only 431 human liver measurements for 11 transportersmatched our inclusion criteria and were thus included in the sub–dataset for adult healthy Caucasians, which were obtained from nineindependent studies (Fig. 1) (Li et al., 2009a,b; Balogh et al., 2012;Deo et al., 2012; Kimoto et al., 2012; Tucker et al., 2012; Prasad et al.,2013, 2014; Peng et al., 2015). The most common reason (32% of thecomplete database) for the exclusion of abundance data were the useof samples from individuals with underlying disease conditions. Thesecond most common reason for exclusion of abundance data were
Fig. 1. Exclusion criteria applied to the completedatabase. Percentages for each exclusion criterionrefer to the fraction of the samples in the completedatabase that were excluded on its basis. Note, somesamples were excluded on the basis of more than onefactor; therefore, the sum of percentages is less thanthe total percentage of the complete databases thatwas excluded.
1552 Burt et al.
at ASPE
T Journals on M
arch 23, 2020dm
d.aspetjournals.orgD
ownloaded from

quantification in plasmamembrane fractions (PMs) instead of CMs (19%of complete database), followed by the exclusion of samples fromindividuals aged ,18 years, which resulted in the omission of 11% ofsamples from the subdatabase. Non-Caucasian ethnicities resulted in 9%of the complete database samples being excluded, and a further 6% ofsamples in the complete database were excluded on the basis ofindividuals having a non-ET phenotype. Finally, 1.3% of samples wereexcluded from the subdatabase due to double counting. A number ofsamples were excluded on the basis of two ormore reasons; therefore, thesum of the percentages quoted above (78%) does not match the totalpercentage of the complete database that was excluded (71%). Of thesample excluded because of underlying disease, fatty liver disease (45%of samples excluded due to disease) and colorectal carcinoma (31%)werethe most frequent diseases (Fig. 2A). Of the samples excluded because ofnon-Caucasian ethnicity, 72% were Asian and 28% were AfricanAmerican or non-Hispanic black (Fig. 2B). Finally, of the samplesexcluded due to a non-ET phenotype, the transporter was OATP1B1,MRP2, or BCRP in 55%, 35%, and 10% of cases, respectively (Fig. 2C).Of the 24 transporters for which abundance values were collated,
suitable data could not be obtained for 13 at the time of this meta-analysis due to one or more of the criteria outlined in Fig. 1. Thesetransporters were as follows: equilibrative nucleoside transporter 1(SLC29A1); monocarboxylate transporter 1 (SLC16A1); organicanion transporters 2 and 7 (SLC22A7 and SLC22A9); multidrugresistance-associated proteins 1, 4, 5 and 6 (ABCC1, ABCC4,ABCC5 and ABCC6); organic cation transporter 3 (SLC22A3); multi-drug resistance protein 3 (ABCB4); concentrative nucleoside transporter1 (SLC28A1); ABCA6 and ABCA8. Thus, only 24% of the total data setwas deemed suitable for characterizing transporter abundance in healthyCaucasian adults.CM Yield. Amean CM yield of 35.86 14.3 mgmembrane protein/g
liver using a differential centrifugationmethodwas confirmed via personal
communication with Tucker et al. (2012) (n = 13 livers). This value isconsistent with the MPPGL value that is obtained via a similar method(Barter et al., 2007). Corresponding mean CM yields of 38.66 8.3 and33.4 6 4.6 mg membrane protein/g liver using MPEK were obtainedvia personal communication with investigators at the University ofWashington (Seattle, WA) (n = 65 livers) and Eli Lilly (Indianapolis,IN)/University of Kansas (Lawrence, KS) (n = 141 livers), respectively.Because demographic data were available, the University of Wash-
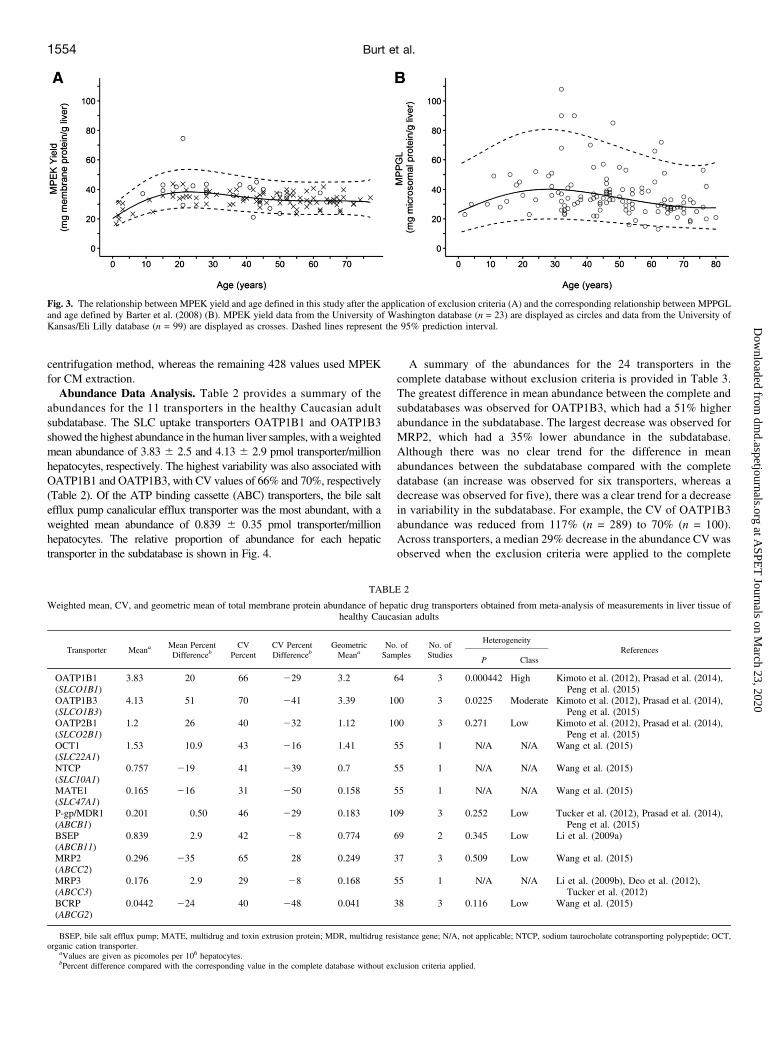
ington and Eli Lilly/University of Kansas data sets were subsequentlyrefined with the same exclusion criteria applied to abundance data withthe exception of donor ages to create a specific healthy, Caucasian dataset. In this refined data set, the relationship established between age andMPEK yield (Fig. 3A) was similar to that obtained for MPPGL (Barteret al., 2008) (eq. 4; Fig. 3B) and was best described by the fourth-orderpolynomial (eq. 5). However, the wider 95% prediction intervals (Fig. 3)and 2.4-fold higher root mean squared error value for the MPPGL dataset indicated considerably higher variability around the central tendencycompared with the MPEK yield.
MPPGL Yieldage ¼ 101:041þð0:0158 × ageÞ2 ð0:000382 × age2Þþð2:37 × 102 6 × age3Þð4Þ
MPEK Yieldage ¼ 101:31 þ ð3:08 × ageÞ2ð0:00116 × age2Þ þ ð1:67 × 102 5 × age3Þ2 ð8:31 × 102 8 × age4Þð5Þ
As described in the Materials and Methods, eqs. 4 and 5 were used forthe conversion of abundance units obtained using differential centrifu-gation and MPEK CM extraction methods, respectively (eq. 3). In thefinal subdatabase, three values were obtained using the differential
Fig. 2. (A) Relative proportion of the different diseasesassociated with samples that were excluded from the completedatabase on the basis of disease. (B) Relative proportion of thedifferent ethnicities associated with samples that were excludedfrom the complete database on the basis of non-Caucasianethnicity. (C) Relative proportion of the transporters associatedwith samples excluded from the complete database on the basisof a non-ET phenotype. n represents the number of samplesexcluded.
Healthy Caucasian Liver Transporter Abundances 1553
at ASPE
T Journals on M
arch 23, 2020dm
d.aspetjournals.orgD
ownloaded from
centrifugation method, whereas the remaining 428 values used MPEKfor CM extraction.Abundance Data Analysis. Table 2 provides a summary of the
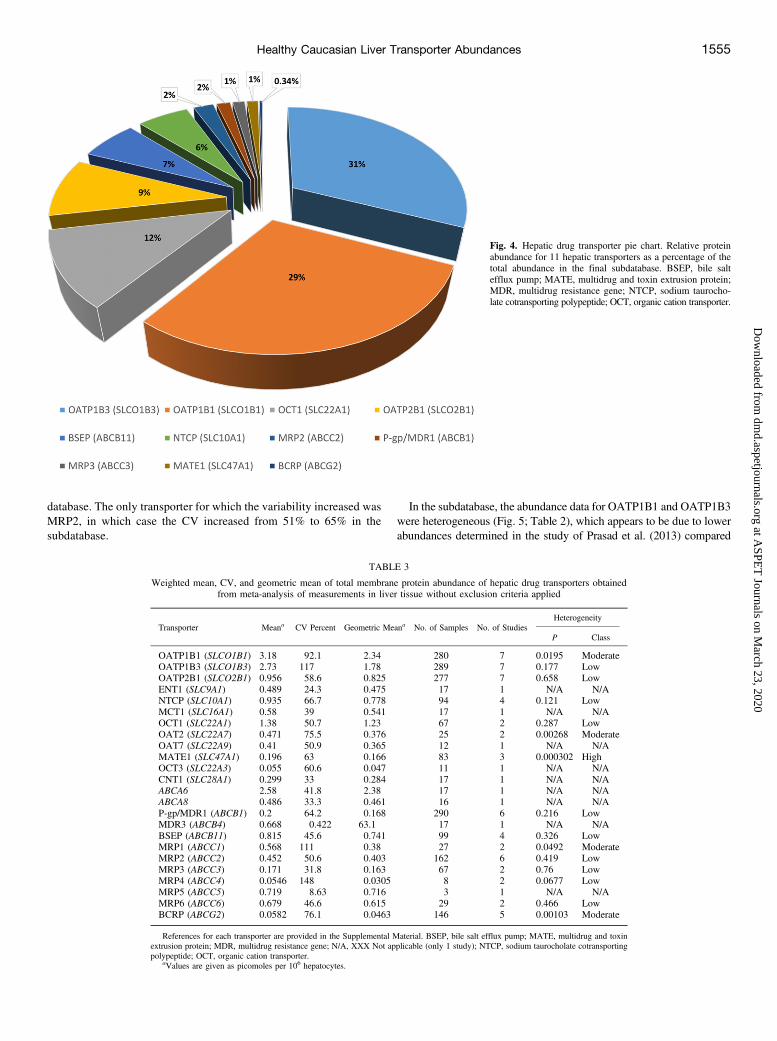
abundances for the 11 transporters in the healthy Caucasian adultsubdatabase. The SLC uptake transporters OATP1B1 and OATP1B3showed the highest abundance in the human liver samples, with aweightedmean abundance of 3.83 6 2.5 and 4.13 6 2.9 pmol transporter/millionhepatocytes, respectively. The highest variability was also associated withOATP1B1 and OATP1B3, with CV values of 66% and 70%, respectively(Table 2). Of the ATP binding cassette (ABC) transporters, the bile saltefflux pump canalicular efflux transporter was the most abundant, with aweighted mean abundance of 0.839 6 0.35 pmol transporter/millionhepatocytes. The relative proportion of abundance for each hepatictransporter in the subdatabase is shown in Fig. 4.
A summary of the abundances for the 24 transporters in thecomplete database without exclusion criteria is provided in Table 3.The greatest difference in mean abundance between the complete andsubdatabases was observed for OATP1B3, which had a 51% higherabundance in the subdatabase. The largest decrease was observed forMRP2, which had a 35% lower abundance in the subdatabase.Although there was no clear trend for the difference in meanabundances between the subdatabase compared with the completedatabase (an increase was observed for six transporters, whereas adecrease was observed for five), there was a clear trend for a decreasein variability in the subdatabase. For example, the CV of OATP1B3abundance was reduced from 117% (n = 289) to 70% (n = 100).Across transporters, a median 29% decrease in the abundance CV wasobserved when the exclusion criteria were applied to the complete
Fig. 3. The relationship between MPEK yield and age defined in this study after the application of exclusion criteria (A) and the corresponding relationship between MPPGLand age defined by Barter et al. (2008) (B). MPEK yield data from the University of Washington database (n = 23) are displayed as circles and data from the University ofKansas/Eli Lilly database (n = 99) are displayed as crosses. Dashed lines represent the 95% prediction interval.
TABLE 2
Weighted mean, CV, and geometric mean of total membrane protein abundance of hepatic drug transporters obtained from meta-analysis of measurements in liver tissue ofhealthy Caucasian adults
Transporter MeanaMean PercentDifferenceb
CVPercent
CV PercentDifferenceb
GeometricMeana
No. ofSamples
No. ofStudies
HeterogeneityReferences
P Class
OATP1B1(SLCO1B1)
3.83 20 66 229 3.2 64 3 0.000442 High Kimoto et al. (2012), Prasad et al. (2014),Peng et al. (2015)
OATP1B3(SLCO1B3)
4.13 51 70 241 3.39 100 3 0.0225 Moderate Kimoto et al. (2012), Prasad et al. (2014),Peng et al. (2015)
OATP2B1(SLCO2B1)
1.2 26 40 232 1.12 100 3 0.271 Low Kimoto et al. (2012), Prasad et al. (2014),Peng et al. (2015)
OCT1(SLC22A1)
1.53 10.9 43 216 1.41 55 1 N/A N/A Wang et al. (2015)
NTCP(SLC10A1)
0.757 219 41 239 0.7 55 1 N/A N/A Wang et al. (2015)
MATE1(SLC47A1)
0.165 216 31 250 0.158 55 1 N/A N/A Wang et al. (2015)
P-gp/MDR1(ABCB1)
0.201 0.50 46 229 0.183 109 3 0.252 Low Tucker et al. (2012), Prasad et al. (2014),Peng et al. (2015)
BSEP(ABCB11)
0.839 2.9 42 28 0.774 69 2 0.345 Low Li et al. (2009a)
MRP2(ABCC2)
0.296 235 65 28 0.249 37 3 0.509 Low Wang et al. (2015)
MRP3(ABCC3)
0.176 2.9 29 28 0.168 55 1 N/A N/A Li et al. (2009b), Deo et al. (2012),Tucker et al. (2012)
BCRP(ABCG2)
0.0442 224 40 248 0.041 38 3 0.116 Low Wang et al. (2015)
BSEP, bile salt efflux pump; MATE, multidrug and toxin extrusion protein; MDR, multidrug resistance gene; N/A, not applicable; NTCP, sodium taurocholate cotransporting polypeptide; OCT,organic cation transporter.
aValues are given as picomoles per 106 hepatocytes.bPercent difference compared with the corresponding value in the complete database without exclusion criteria applied.
1554 Burt et al.
at ASPE
T Journals on M
arch 23, 2020dm
d.aspetjournals.orgD
ownloaded from
database. The only transporter for which the variability increased wasMRP2, in which case the CV increased from 51% to 65% in thesubdatabase.
In the subdatabase, the abundance data for OATP1B1 and OATP1B3were heterogeneous (Fig. 5; Table 2), which appears to be due to lowerabundances determined in the study of Prasad et al. (2013) compared
Fig. 4. Hepatic drug transporter pie chart. Relative proteinabundance for 11 hepatic transporters as a percentage of thetotal abundance in the final subdatabase. BSEP, bile saltefflux pump; MATE, multidrug and toxin extrusion protein;MDR, multidrug resistance gene; NTCP, sodium taurocho-late cotransporting polypeptide; OCT, organic cation transporter.
TABLE 3
Weighted mean, CV, and geometric mean of total membrane protein abundance of hepatic drug transporters obtainedfrom meta-analysis of measurements in liver tissue without exclusion criteria applied
Transporter Meana CV Percent Geometric Meana No. of Samples No. of StudiesHeterogeneity
P Class
OATP1B1 (SLCO1B1) 3.18 92.1 2.34 280 7 0.0195 ModerateOATP1B3 (SLCO1B3) 2.73 117 1.78 289 7 0.177 LowOATP2B1 (SLCO2B1) 0.956 58.6 0.825 277 7 0.658 LowENT1 (SLC9A1) 0.489 24.3 0.475 17 1 N/A N/ANTCP (SLC10A1) 0.935 66.7 0.778 94 4 0.121 LowMCT1 (SLC16A1) 0.58 39 0.541 17 1 N/A N/AOCT1 (SLC22A1) 1.38 50.7 1.23 67 2 0.287 LowOAT2 (SLC22A7) 0.471 75.5 0.376 25 2 0.00268 ModerateOAT7 (SLC22A9) 0.41 50.9 0.365 12 1 N/A N/AMATE1 (SLC47A1) 0.196 63 0.166 83 3 0.000302 HighOCT3 (SLC22A3) 0.055 60.6 0.047 11 1 N/A N/ACNT1 (SLC28A1) 0.299 33 0.284 17 1 N/A N/AABCA6 2.58 41.8 2.38 17 1 N/A N/AABCA8 0.486 33.3 0.461 16 1 N/A N/AP-gp/MDR1 (ABCB1) 0.2 64.2 0.168 290 6 0.216 LowMDR3 (ABCB4) 0.668 0.422 63.1 17 1 N/A N/ABSEP (ABCB11) 0.815 45.6 0.741 99 4 0.326 LowMRP1 (ABCC1) 0.568 111 0.38 27 2 0.0492 ModerateMRP2 (ABCC2) 0.452 50.6 0.403 162 6 0.419 LowMRP3 (ABCC3) 0.171 31.8 0.163 67 2 0.76 LowMRP4 (ABCC4) 0.0546 148 0.0305 8 2 0.0677 LowMRP5 (ABCC5) 0.719 8.63 0.716 3 1 N/A N/AMRP6 (ABCC6) 0.679 46.6 0.615 29 2 0.466 LowBCRP (ABCG2) 0.0582 76.1 0.0463 146 5 0.00103 Moderate
References for each transporter are provided in the Supplemental Material. BSEP, bile salt efflux pump; MATE, multidrug and toxinextrusion protein; MDR, multidrug resistance gene; N/A, XXX Not applicable (only 1 study); NTCP, sodium taurocholate cotransportingpolypeptide; OCT, organic cation transporter.
aValues are given as picomoles per 106 hepatocytes.
Healthy Caucasian Liver Transporter Abundances 1555
at ASPE
T Journals on M
arch 23, 2020dm
d.aspetjournals.orgD
ownloaded from
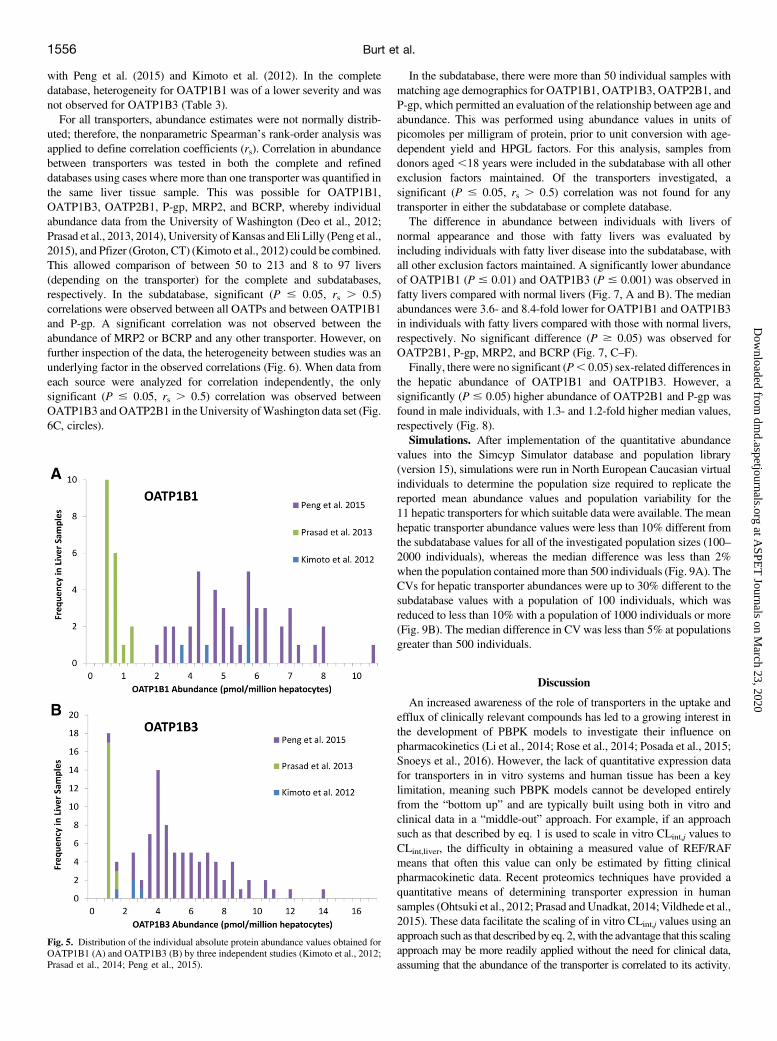
with Peng et al. (2015) and Kimoto et al. (2012). In the completedatabase, heterogeneity for OATP1B1 was of a lower severity and wasnot observed for OATP1B3 (Table 3).For all transporters, abundance estimates were not normally distrib-
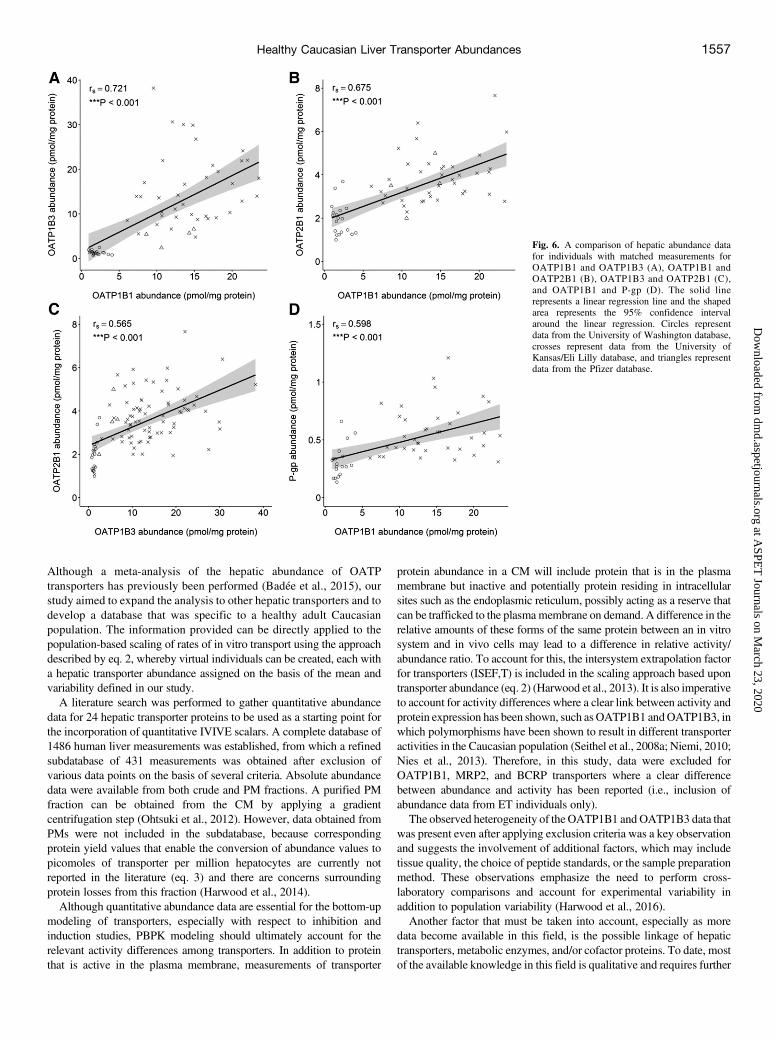
uted; therefore, the nonparametric Spearman’s rank-order analysis wasapplied to define correlation coefficients (rs). Correlation in abundancebetween transporters was tested in both the complete and refineddatabases using cases where more than one transporter was quantified inthe same liver tissue sample. This was possible for OATP1B1,OATP1B3, OATP2B1, P-gp, MRP2, and BCRP, whereby individualabundance data from the University of Washington (Deo et al., 2012;Prasad et al., 2013, 2014), University of Kansas and Eli Lilly (Peng et al.,2015), and Pfizer (Groton, CT) (Kimoto et al., 2012) could be combined.This allowed comparison of between 50 to 213 and 8 to 97 livers(depending on the transporter) for the complete and subdatabases,respectively. In the subdatabase, significant (P # 0.05, rs . 0.5)correlations were observed between all OATPs and between OATP1B1and P-gp. A significant correlation was not observed between theabundance of MRP2 or BCRP and any other transporter. However, onfurther inspection of the data, the heterogeneity between studies was anunderlying factor in the observed correlations (Fig. 6). When data fromeach source were analyzed for correlation independently, the onlysignificant (P # 0.05, rs . 0.5) correlation was observed betweenOATP1B3 and OATP2B1 in the University ofWashington data set (Fig.6C, circles).
In the subdatabase, there were more than 50 individual samples withmatching age demographics for OATP1B1, OATP1B3, OATP2B1, andP-gp, which permitted an evaluation of the relationship between age andabundance. This was performed using abundance values in units ofpicomoles per milligram of protein, prior to unit conversion with age-dependent yield and HPGL factors. For this analysis, samples fromdonors aged ,18 years were included in the subdatabase with all otherexclusion factors maintained. Of the transporters investigated, asignificant (P # 0.05, rs . 0.5) correlation was not found for anytransporter in either the subdatabase or complete database.The difference in abundance between individuals with livers of
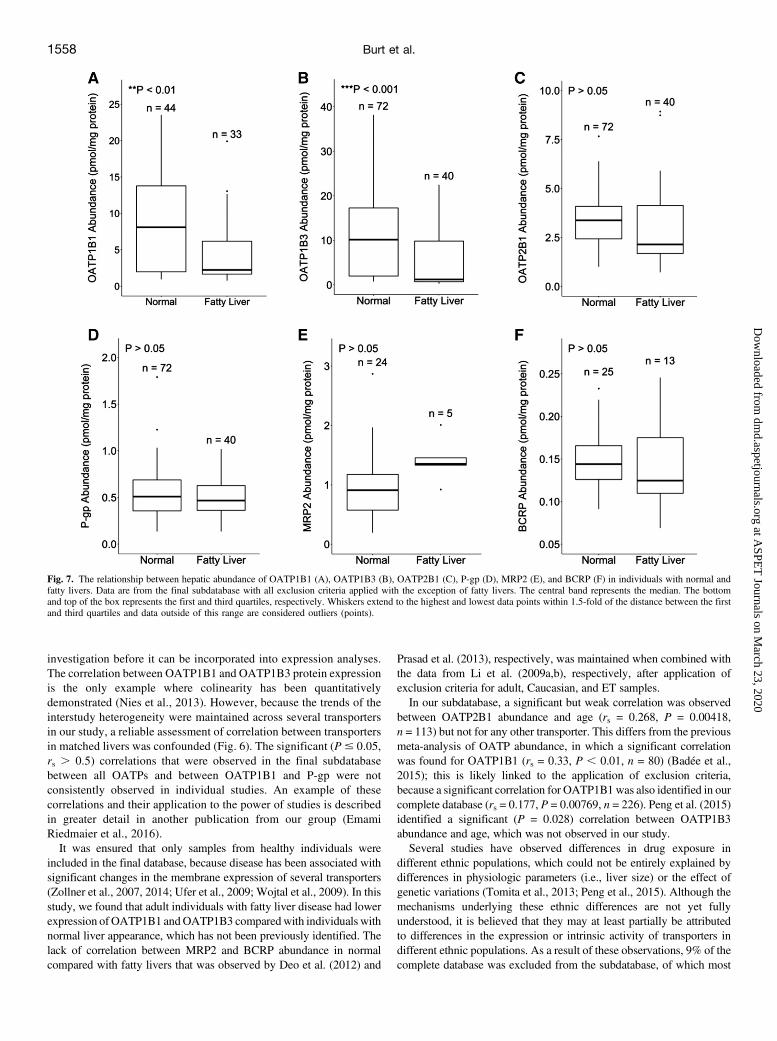
normal appearance and those with fatty livers was evaluated byincluding individuals with fatty liver disease into the subdatabase, withall other exclusion factors maintained. A significantly lower abundanceof OATP1B1 (P # 0.01) and OATP1B3 (P # 0.001) was observed infatty livers compared with normal livers (Fig. 7, A and B). The medianabundances were 3.6- and 8.4-fold lower for OATP1B1 and OATP1B3in individuals with fatty livers compared with those with normal livers,respectively. No significant difference (P $ 0.05) was observed forOATP2B1, P-gp, MRP2, and BCRP (Fig. 7, C–F).Finally, there were no significant (P, 0.05) sex-related differences in
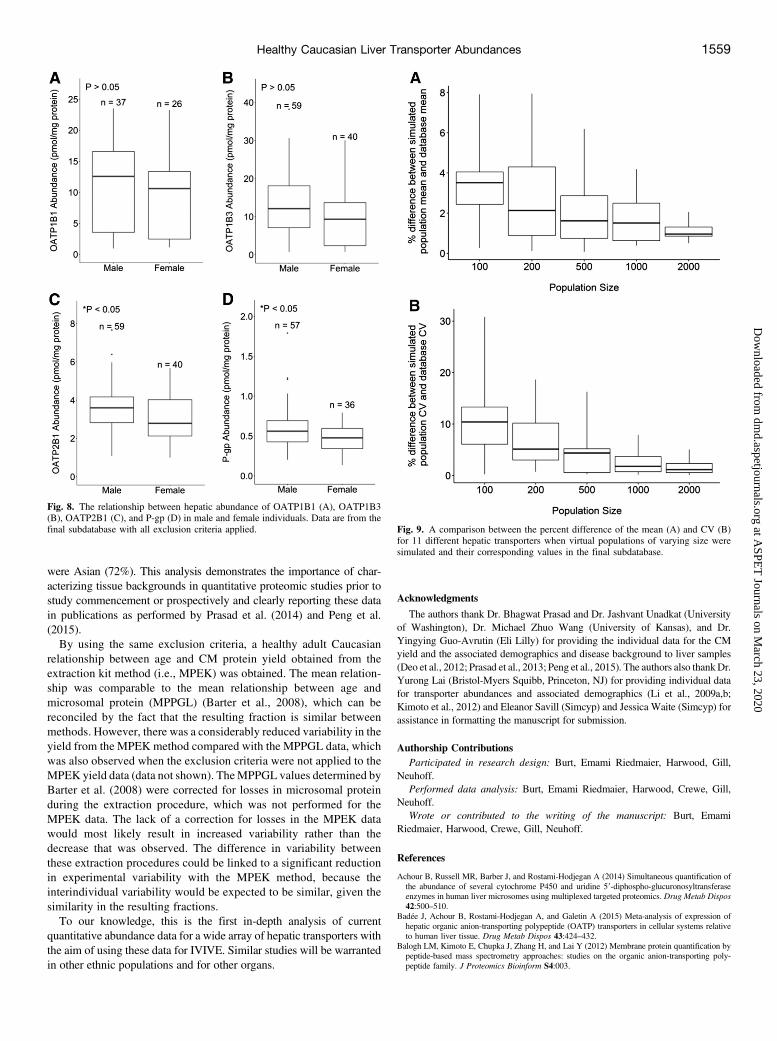
the hepatic abundance of OATP1B1 and OATP1B3. However, asignificantly (P # 0.05) higher abundance of OATP2B1 and P-gp wasfound in male individuals, with 1.3- and 1.2-fold higher median values,respectively (Fig. 8).Simulations. After implementation of the quantitative abundance
values into the Simcyp Simulator database and population library(version 15), simulations were run in North European Caucasian virtualindividuals to determine the population size required to replicate thereported mean abundance values and population variability for the11 hepatic transporters for which suitable data were available. The meanhepatic transporter abundance values were less than 10% different fromthe subdatabase values for all of the investigated population sizes (100–2000 individuals), whereas the median difference was less than 2%when the population contained more than 500 individuals (Fig. 9A). TheCVs for hepatic transporter abundances were up to 30% different to thesubdatabase values with a population of 100 individuals, which wasreduced to less than 10% with a population of 1000 individuals or more(Fig. 9B). The median difference in CV was less than 5% at populationsgreater than 500 individuals.
Discussion
An increased awareness of the role of transporters in the uptake andefflux of clinically relevant compounds has led to a growing interest inthe development of PBPK models to investigate their influence onpharmacokinetics (Li et al., 2014; Rose et al., 2014; Posada et al., 2015;Snoeys et al., 2016). However, the lack of quantitative expression datafor transporters in in vitro systems and human tissue has been a keylimitation, meaning such PBPK models cannot be developed entirelyfrom the “bottom up” and are typically built using both in vitro andclinical data in a “middle-out” approach. For example, if an approachsuch as that described by eq. 1 is used to scale in vitro CLint,j values toCLint,liver, the difficulty in obtaining a measured value of REF/RAFmeans that often this value can only be estimated by fitting clinicalpharmacokinetic data. Recent proteomics techniques have provided aquantitative means of determining transporter expression in humansamples (Ohtsuki et al., 2012; Prasad andUnadkat, 2014; Vildhede et al.,2015). These data facilitate the scaling of in vitro CLint,j values using anapproach such as that described by eq. 2,with the advantage that this scalingapproach may be more readily applied without the need for clinical data,assuming that the abundance of the transporter is correlated to its activity.
Fig. 5. Distribution of the individual absolute protein abundance values obtained forOATP1B1 (A) and OATP1B3 (B) by three independent studies (Kimoto et al., 2012;Prasad et al., 2014; Peng et al., 2015).
1556 Burt et al.
at ASPE
T Journals on M
arch 23, 2020dm
d.aspetjournals.orgD
ownloaded from
Although a meta-analysis of the hepatic abundance of OATPtransporters has previously been performed (Badée et al., 2015), ourstudy aimed to expand the analysis to other hepatic transporters and todevelop a database that was specific to a healthy adult Caucasianpopulation. The information provided can be directly applied to thepopulation-based scaling of rates of in vitro transport using the approachdescribed by eq. 2, whereby virtual individuals can be created, each witha hepatic transporter abundance assigned on the basis of the mean andvariability defined in our study.A literature search was performed to gather quantitative abundance
data for 24 hepatic transporter proteins to be used as a starting point forthe incorporation of quantitative IVIVE scalars. A complete database of1486 human liver measurements was established, from which a refinedsubdatabase of 431 measurements was obtained after exclusion ofvarious data points on the basis of several criteria. Absolute abundancedata were available from both crude and PM fractions. A purified PMfraction can be obtained from the CM by applying a gradientcentrifugation step (Ohtsuki et al., 2012). However, data obtained fromPMs were not included in the subdatabase, because correspondingprotein yield values that enable the conversion of abundance values topicomoles of transporter per million hepatocytes are currently notreported in the literature (eq. 3) and there are concerns surroundingprotein losses from this fraction (Harwood et al., 2014).Although quantitative abundance data are essential for the bottom-up
modeling of transporters, especially with respect to inhibition andinduction studies, PBPK modeling should ultimately account for therelevant activity differences among transporters. In addition to proteinthat is active in the plasma membrane, measurements of transporter
protein abundance in a CM will include protein that is in the plasmamembrane but inactive and potentially protein residing in intracellularsites such as the endoplasmic reticulum, possibly acting as a reserve thatcan be trafficked to the plasmamembrane on demand. A difference in therelative amounts of these forms of the same protein between an in vitrosystem and in vivo cells may lead to a difference in relative activity/abundance ratio. To account for this, the intersystem extrapolation factorfor transporters (ISEF,T) is included in the scaling approach based upontransporter abundance (eq. 2) (Harwood et al., 2013). It is also imperativeto account for activity differences where a clear link between activity andprotein expression has been shown, such asOATP1B1 andOATP1B3, inwhich polymorphisms have been shown to result in different transporteractivities in the Caucasian population (Seithel et al., 2008a; Niemi, 2010;Nies et al., 2013). Therefore, in this study, data were excluded forOATP1B1, MRP2, and BCRP transporters where a clear differencebetween abundance and activity has been reported (i.e., inclusion ofabundance data from ET individuals only).The observed heterogeneity of theOATP1B1 and OATP1B3 data that
was present even after applying exclusion criteria was a key observationand suggests the involvement of additional factors, which may includetissue quality, the choice of peptide standards, or the sample preparationmethod. These observations emphasize the need to perform cross-laboratory comparisons and account for experimental variability inaddition to population variability (Harwood et al., 2016).Another factor that must be taken into account, especially as more
data become available in this field, is the possible linkage of hepatictransporters, metabolic enzymes, and/or cofactor proteins. To date, mostof the available knowledge in this field is qualitative and requires further
Fig. 6. A comparison of hepatic abundance datafor individuals with matched measurements forOATP1B1 and OATP1B3 (A), OATP1B1 andOATP2B1 (B), OATP1B3 and OATP2B1 (C),and OATP1B1 and P-gp (D). The solid linerepresents a linear regression line and the shapedarea represents the 95% confidence intervalaround the linear regression. Circles representdata from the University of Washington database,crosses represent data from the University ofKansas/Eli Lilly database, and triangles representdata from the Pfizer database.
Healthy Caucasian Liver Transporter Abundances 1557
at ASPE
T Journals on M
arch 23, 2020dm
d.aspetjournals.orgD
ownloaded from
investigation before it can be incorporated into expression analyses.The correlation between OATP1B1 and OATP1B3 protein expressionis the only example where colinearity has been quantitativelydemonstrated (Nies et al., 2013). However, because the trends of theinterstudy heterogeneity were maintained across several transportersin our study, a reliable assessment of correlation between transportersin matched livers was confounded (Fig. 6). The significant (P# 0.05,rs . 0.5) correlations that were observed in the final subdatabasebetween all OATPs and between OATP1B1 and P-gp were notconsistently observed in individual studies. An example of thesecorrelations and their application to the power of studies is describedin greater detail in another publication from our group (EmamiRiedmaier et al., 2016).It was ensured that only samples from healthy individuals were
included in the final database, because disease has been associated withsignificant changes in the membrane expression of several transporters(Zollner et al., 2007, 2014; Ufer et al., 2009; Wojtal et al., 2009). In thisstudy, we found that adult individuals with fatty liver disease had lowerexpression of OATP1B1 andOATP1B3 comparedwith individuals withnormal liver appearance, which has not been previously identified. Thelack of correlation between MRP2 and BCRP abundance in normalcompared with fatty livers that was observed by Deo et al. (2012) and
Prasad et al. (2013), respectively, was maintained when combined withthe data from Li et al. (2009a,b), respectively, after application ofexclusion criteria for adult, Caucasian, and ET samples.In our subdatabase, a significant but weak correlation was observed
between OATP2B1 abundance and age (rs = 0.268, P = 0.00418,n = 113) but not for any other transporter. This differs from the previousmeta-analysis of OATP abundance, in which a significant correlationwas found for OATP1B1 (rs = 0.33, P , 0.01, n = 80) (Badée et al.,2015); this is likely linked to the application of exclusion criteria,because a significant correlation for OATP1B1was also identified in ourcomplete database (rs = 0.177, P = 0.00769, n = 226). Peng et al. (2015)identified a significant (P = 0.028) correlation between OATP1B3abundance and age, which was not observed in our study.Several studies have observed differences in drug exposure in
different ethnic populations, which could not be entirely explained bydifferences in physiologic parameters (i.e., liver size) or the effect ofgenetic variations (Tomita et al., 2013; Peng et al., 2015). Although themechanisms underlying these ethnic differences are not yet fullyunderstood, it is believed that they may at least partially be attributedto differences in the expression or intrinsic activity of transporters indifferent ethnic populations. As a result of these observations, 9% of thecomplete database was excluded from the subdatabase, of which most
Fig. 7. The relationship between hepatic abundance of OATP1B1 (A), OATP1B3 (B), OATP2B1 (C), P-gp (D), MRP2 (E), and BCRP (F) in individuals with normal andfatty livers. Data are from the final subdatabase with all exclusion criteria applied with the exception of fatty livers. The central band represents the median. The bottomand top of the box represents the first and third quartiles, respectively. Whiskers extend to the highest and lowest data points within 1.5-fold of the distance between the firstand third quartiles and data outside of this range are considered outliers (points).
1558 Burt et al.
at ASPE
T Journals on M
arch 23, 2020dm
d.aspetjournals.orgD
ownloaded from
were Asian (72%). This analysis demonstrates the importance of char-acterizing tissue backgrounds in quantitative proteomic studies prior tostudy commencement or prospectively and clearly reporting these datain publications as performed by Prasad et al. (2014) and Peng et al.(2015).By using the same exclusion criteria, a healthy adult Caucasian
relationship between age and CM protein yield obtained from theextraction kit method (i.e., MPEK) was obtained. The mean relation-ship was comparable to the mean relationship between age andmicrosomal protein (MPPGL) (Barter et al., 2008), which can bereconciled by the fact that the resulting fraction is similar betweenmethods. However, there was a considerably reduced variability in theyield from the MPEK method compared with the MPPGL data, whichwas also observed when the exclusion criteria were not applied to theMPEK yield data (data not shown). TheMPPGL values determined byBarter et al. (2008) were corrected for losses in microsomal proteinduring the extraction procedure, which was not performed for theMPEK data. The lack of a correction for losses in the MPEK datawould most likely result in increased variability rather than thedecrease that was observed. The difference in variability betweenthese extraction procedures could be linked to a significant reductionin experimental variability with the MPEK method, because theinterindividual variability would be expected to be similar, given thesimilarity in the resulting fractions.To our knowledge, this is the first in-depth analysis of current
quantitative abundance data for a wide array of hepatic transporters withthe aim of using these data for IVIVE. Similar studies will be warrantedin other ethnic populations and for other organs.
Acknowledgments
The authors thank Dr. Bhagwat Prasad and Dr. Jashvant Unadkat (Universityof Washington), Dr. Michael Zhuo Wang (University of Kansas), and Dr.Yingying Guo-Avrutin (Eli Lilly) for providing the individual data for the CMyield and the associated demographics and disease background to liver samples(Deo et al., 2012; Prasad et al., 2013; Peng et al., 2015). The authors also thankDr.Yurong Lai (Bristol-Myers Squibb, Princeton, NJ) for providing individual datafor transporter abundances and associated demographics (Li et al., 2009a,b;Kimoto et al., 2012) and Eleanor Savill (Simcyp) and Jessica Waite (Simcyp) forassistance in formatting the manuscript for submission.
Authorship ContributionsParticipated in research design: Burt, Emami Riedmaier, Harwood, Gill,
Neuhoff.Performed data analysis: Burt, Emami Riedmaier, Harwood, Crewe, Gill,
Neuhoff.Wrote or contributed to the writing of the manuscript: Burt, Emami
Riedmaier, Harwood, Crewe, Gill, Neuhoff.
References
Achour B, Russell MR, Barber J, and Rostami-Hodjegan A (2014) Simultaneous quantification ofthe abundance of several cytochrome P450 and uridine 59-diphospho-glucuronosyltransferaseenzymes in human liver microsomes using multiplexed targeted proteomics. Drug Metab Dispos42:500–510.
Badée J, Achour B, Rostami-Hodjegan A, and Galetin A (2015) Meta-analysis of expression ofhepatic organic anion-transporting polypeptide (OATP) transporters in cellular systems relativeto human liver tissue. Drug Metab Dispos 43:424–432.
Balogh LM, Kimoto E, Chupka J, Zhang H, and Lai Y (2012) Membrane protein quantification bypeptide-based mass spectrometry approaches: studies on the organic anion-transporting poly-peptide family. J Proteomics Bioinform S4:003.
Fig. 8. The relationship between hepatic abundance of OATP1B1 (A), OATP1B3(B), OATP2B1 (C), and P-gp (D) in male and female individuals. Data are from thefinal subdatabase with all exclusion criteria applied. Fig. 9. A comparison between the percent difference of the mean (A) and CV (B)
for 11 different hepatic transporters when virtual populations of varying size weresimulated and their corresponding values in the final subdatabase.
Healthy Caucasian Liver Transporter Abundances 1559
at ASPE
T Journals on M
arch 23, 2020dm
d.aspetjournals.orgD
ownloaded from
Barter ZE, Bayliss MK, Beaune PH, Boobis AR, Carlile DJ, Edwards RJ, Houston JB, Lake BG,Lipscomb JC, Pelkonen OR, et al. (2007) Scaling factors for the extrapolation of in vivo met-abolic drug clearance from in vitro data: reaching a consensus on values of human microsomalprotein and hepatocellularity per gram of liver. Curr Drug Metab 8:33–45.
Barter ZE, Chowdry JE, Harlow JR, Snawder JE, Lipscomb JC, and Rostami-Hodjegan A (2008)Covariation of human microsomal protein per gram of liver with age: absence of influence ofoperator and sample storage may justify interlaboratory data pooling. Drug Metab Dispos 36:2405–2409.
Bi YA, Kimoto E, Sevidal S, Jones HM, Barton HA, Kempshall S, Whalen KM, Zhang H, Ji C,Fenner KS, et al. (2012) In vitro evaluation of hepatic transporter-mediated clinical drug-druginteractions: hepatocyte model optimization and retrospective investigation. Drug Metab Dispos40:1085–1092.
Bosgra S, van de Steeg E, Vlaming ML, Verhoeckx KC, Huisman MT, Verwei M, and WortelboerHM (2014) Predicting carrier-mediated hepatic disposition of rosuvastatin in man by scalingfrom individual transfected cell-lines in vitro using absolute transporter protein quantification andPBPK modeling. Eur J Pharm Sci 65:156–166.
Choi MK, Shin HJ, Choi YL, Deng JW, Shin JG, and Song IS (2011) Differential effect of geneticvariants of Na(+)-taurocholate co-transporting polypeptide (NTCP) and organic anion-transporting polypeptide 1B1 (OATP1B1) on the uptake of HMG-CoA reductase inhibitors.Xenobiotica 41:24–34.
Couvert P, Giral P, Dejager S, Gu J, Huby T, Chapman MJ, Bruckert E, and Carrié A (2008)Association between a frequent allele of the gene encoding OATP1B1 and enhanced LDL-lowering response to fluvastatin therapy. Pharmacogenomics 9:1217–1227.
de Graan AJM, Lancaster CS, Obaidat A, Hagenbuch B, Elens L, Friberg LE, de Bruijn P, Hu S,Gibson AA, Bruun GH, et al. (2012) Influence of polymorphic OATP1B-type carriers on thedisposition of docetaxel. Clin Cancer Res 18:4433–4440.
Deng JW, Song IS, Shin HJ, Yeo CW, Cho DY, Shon JH, and Shin JG (2008) The effect ofSLCO1B1*15 on the disposition of pravastatin and pitavastatin is substrate dependent: thecontribution of transporting activity changes by SLCO1B1*15. Pharmacogenet Genomics 18:424–433.
Deo AK, Prasad B, Balogh L, Lai Y, and Unadkat JD (2012) Interindividual variability in hepaticexpression of the multidrug resistance-associated protein 2 (MRP2/ABCC2): quantification byliquid chromatography/tandem mass spectrometry. Drug Metab Dispos 40:852–855.
Donnelly LA, Doney AS, Tavendale R, Lang CC, Pearson ER, Colhoun HM, McCarthy MI,Hattersley AT, Morris AD, and Palmer CN (2011) Common nonsynonymous substitutions inSLCO1B1 predispose to statin intolerance in routinely treated individuals with type 2 diabetes: ago-DARTS study. Clin Pharmacol Ther 89:210–216.
Emami Riedmaier A, Burt H, Abduljalil K, and Neuhoff S (2016) More power to OATP1B1: anevaluation of sample size in pharmacogenetic studies using a rosuvastatin PBPK model forintestinal, hepatic and renal transporter-mediated clearances. J Clin Pharmacol 56 (Suppl 7):S132–S142.
Harwood MD, Achour B, Neuhoff S, Russell MR, Carlson G, Warhurst G, and Rostami-HodjeganA (2016) In vitro-in vivo extrapolation scaling factors for intestinal P-glycoprotein and breastcancer resistance protein: part i: a cross-laboratory comparison of transporter-protein abundancesand relative expression factors in human intestine and Caco-2 cells. Drug Metab Dispos 44:297–307.
Harwood MD, Neuhoff S, Carlson GL, Warhurst G, and Rostami-Hodjegan A (2013) Absoluteabundance and function of intestinal drug transporters: a prerequisite for fully mechanisticin vitro-in vivo extrapolation of oral drug absorption. Biopharm Drug Dispos 34:2–28.
Harwood MD, Russell MR, Neuhoff S, Warhurst G, and Rostami-Hodjegan A (2014) Lost incentrifugation: accounting for transporter protein losses in quantitative targeted absolute pro-teomics. Drug Metab Dispos 42:1766–1772.
Ho RH, Choi L, Lee W, Mayo G, Schwarz UI, Tirona RG, Bailey DG, Stein CM, and Kim RB(2007) Effect of drug transporter genotypes on pravastatin disposition in European- and African-American participants. Pharmacogenet Genomics 17:647–656.
Ho RH, Tirona RG, Leake BF, Glaeser H, Lee W, Lemke CJ, Wang Y, and Kim RB (2006) Drugand bile acid transporters in rosuvastatin hepatic uptake: function, expression, and pharmaco-genetics. Gastroenterology 130:1793–1806.
Howgate EM, Rowland Yeo K, Proctor NJ, Tucker GT, and Rostami-Hodjegan A (2006) Pre-diction of in vivo drug clearance from in vitro data. I: impact of inter-individual variability.Xenobiotica 36:473–497.
Iwai M, Suzuki H, Ieiri I, Otsubo K, and Sugiyama Y (2004) Functional analysis of singlenucleotide polymorphisms of hepatic organic anion transporter OATP1B1 (OATP-C). Phar-macogenetics 14:749–757.
Jamei M, Bajot F, Neuhoff S, Barter Z, Yang J, Rostami-Hodjegan A, and Rowland-Yeo K (2014)A mechanistic framework for in vitro-in vivo extrapolation of liver membrane transporters:prediction of drug-drug interaction between rosuvastatin and cyclosporine. Clin Pharmacokinet53:73–87.
Johnson TN, Tucker GT, Tanner MS, and Rostami-Hodjegan A (2005) Changes in liver volumefrom birth to adulthood: a meta-analysis. Liver Transpl 11:1481–1493.
Jones HM, Barton HA, Lai Y, Bi YA, Kimoto E, Kempshall S, Tate SC, El-Kattan A, Houston JB,Galetin A, et al. (2012) Mechanistic pharmacokinetic modeling for the prediction of transporter-mediated disposition in humans from sandwich culture human hepatocyte data. Drug MetabDispos 40:1007–1017.
Kameyama Y, Yamashita K, Kobayashi K, Hosokawa M, and Chiba K (2005) Functional char-acterization of SLCO1B1 (OATP-C) variants, SLCO1B1*5, SLCO1B1*15 and SLCO1B1*15+C1007G, by using transient expression systems of HeLa and HEK293 cells. PharmacogenetGenomics 15:513–522.
Katz DA, Carr R, Grimm DR, Xiong H, Holley-Shanks R, Mueller T, Leake B, Wang Q, Han L,Wang PG, et al. (2006) Organic anion transporting polypeptide 1B1 activity classified bySLCO1B1 genotype influences atrasentan pharmacokinetics. Clin Pharmacol Ther 79:186–196.
Kimoto E, Yoshida K, Balogh LM, Bi YA, Maeda K, El-Kattan A, Sugiyama Y, and Lai Y (2012)Characterization of organic anion transporting polypeptide (OATP) expression and its functionalcontribution to the uptake of substrates in human hepatocytes. Mol Pharm 9:3535–3542.
Kunze A, Huwyler J, Camenisch G, and Poller B (2014) Prediction of organic anion-transportingpolypeptide 1B1- and 1B3-mediated hepatic uptake of statins based on transporter protein ex-pression and activity data. Drug Metab Dispos 42:1514–1521.
Lancaster CS, Bruun GH, Peer CJ, Mikkelsen TS, Corydon TJ, Gibson AA, Hu S, Orwick SJ,Mathijssen RHJ, Figg WD, et al. (2012) OATP1B1 polymorphism as a determinant of eryth-romycin disposition. Clin Pharmacol Ther 92:642–650.
Li N, Palandra J, Nemirovskiy OV, and Lai Y (2009a) LC-MS/MS mediated absolute quantifi-cation and comparison of bile salt export pump and breast cancer resistance protein in livers andhepatocytes across species. Anal Chem 81:2251–2259.
Li N, Zhang Y, Hua F, and Lai Y (2009b) Absolute difference of hepatobiliary transporter mul-tidrug resistance-associated protein (MRP2/Mrp2) in liver tissues and isolated hepatocytes fromrat, dog, monkey, and human. Drug Metab Dispos 37:66–73.
Li R, Barton HA, Yates PD, Ghosh A, Wolford AC, Riccardi KA, and Maurer TS (2014) A“middle-out” approach to human pharmacokinetic predictions for OATP substrates usingphysiologically-based pharmacokinetic modeling. J Pharmacokinet Pharmacodyn 41:197–209.
Maeda K and Sugiyama Y (2013) Transporter biology in drug approval: regulatory aspects. MolAspects Med 34:711–718.
Neuhoff S, Yeo KR, Barter Z, Jamei M, Turner DB, and Rostami-Hodjegan A (2013) Applicationof permeability-limited physiologically-based pharmacokinetic models: part I-digoxin pharma-cokinetics incorporating P-glycoprotein-mediated efflux. J Pharm Sci 102:3145–3160.
Niemi M (2010) Transporter pharmacogenetics and statin toxicity. Clin Pharmacol Ther 87:130–133.
Nies AT, Koepsell H, Winter S, Burk O, Klein K, Kerb R, Zanger UM, Keppler D, Schwab M,and Schaeffeler E (2009) Expression of organic cation transporters OCT1 (SLC22A1) and OCT3(SLC22A3) is affected by genetic factors and cholestasis in human liver. Hepatology 50:1227–1240.
Nies AT, Niemi M, Burk O, Winter S, Zanger UM, Stieger B, Schwab M, and Schaeffeler E (2013)Genetics is a major determinant of expression of the human hepatic uptake transporterOATP1B1, but not of OATP1B3 and OATP2B1. Genome Med 5:1.
Nozawa T, Minami H, Sugiura S, Tsuji A, and Tamai I (2005) Role of organic anion transporterOATP1B1 (OATP-C) in hepatic uptake of irinotecan and its active metabolite, 7-ethyl-10-hydroxycamptothecin: in vitro evidence and effect of single nucleotide polymorphisms. DrugMetab Dispos 33:434–439.
Ohtsuki S, Schaefer O, Kawakami H, Inoue T, Liehner S, Saito A, Ishiguro N, Kishimoto W,Ludwig-Schwellinger E, Ebner T, et al. (2012) Simultaneous absolute protein quantification oftransporters, cytochromes P450, and UDP-glucuronosyltransferases as a novel approach for thecharacterization of individual human liver: comparison with mRNA levels and activities. DrugMetab Dispos 40:83–92.
Ohtsuki S, Uchida Y, Kubo Y, and Terasaki T (2011) Quantitative targeted absolute proteomics-based ADME research as a new path to drug discovery and development: methodology,advantages, strategy, and prospects. J Pharm Sci 100:3547–3559.
Peng KW, Bacon J, Zheng M, Guo Y, and Wang MZ (2015) Ethnic variability in the expression ofhepatic drug transporters: absolute quantification by an optimized targeted quantitative proteomicapproach. Drug Metab Dispos 43:1045–1055.
Perrett HF, Barter ZE, Jones BC, Yamazaki H, Tucker GT, and Rostami-Hodjegan A (2007)Disparity in holoprotein/apoprotein ratios of different standards used for immunoquantificationof hepatic cytochrome P450 enzymes. Drug Metab Dispos 35:1733–1736.
Posada MM, Bacon JA, Schneck KB, Tirona RG, Kim RB, Higgins JW, Pak YA, Hall SD,and Hillgren KM (2015) Prediction of renal transporter mediated drug-drug interactions for pemetrexedusing physiologically based pharmacokinetic modeling. Drug Metab Dispos 43:325–334.
Prasad B, Evers R, Gupta A, Hop CECA, Salphati L, Shukla S, Ambudkar SV, and Unadkat JD(2014) Interindividual variability in hepatic organic anion-transporting polypeptides andP-glycoprotein (ABCB1) protein expression: quantification by liquid chromatography tandemmass spectroscopy and influence of genotype, age, and sex. Drug Metab Dispos 42:78–88.
Prasad B, Lai Y, Lin Y, and Unadkat JD (2013) Interindividual variability in the hepatic expressionof the human breast cancer resistance protein (BCRP/ABCG2): effect of age, sex, and genotype.J Pharm Sci 102:787–793.
Prasad B and Unadkat JD (2014) Optimized approaches for quantification of drug transporters intissues and cells by MRM proteomics. AAPS J 16:634–648.
Proctor NJ, Tucker GT, and Rostami-Hodjegan A (2004) Predicting drug clearance from recom-binantly expressed CYPs: intersystem extrapolation factors. Xenobiotica 34:151–178.
Qiu X, Bi YA, Balogh LM, and Lai Y (2013) Absolute measurement of species differences insodium taurocholate cotransporting polypeptide (NTCP/Ntcp) and its modulation in culturedhepatocytes. J Pharm Sci 102:3252–3263.
Ramsey LB, Bruun GH, Yang W, Treviño LR, Vattathil S, Scheet P, Cheng C, Rosner GL,Giacomini KM, Fan Y, et al. (2012) Rare versus common variants in pharmacogenetics:SLCO1B1 variation and methotrexate disposition. Genome Res 22:1–8.
Rose RH, Neuhoff S, Abduljalil K, Chetty M, Rostami-Hodjegan A, and Jamei M (2014) Ap-plication of a physiologically based pharmacokinetic model to predict OATP1B1-related vari-ability in pharmacodynamics of rosuvastatin. CPT Pharmacometrics Syst Pharmacol 3:e124.
Rowland-Yeo K, Rostami-Hodjegan A, and Tucker GT (2004) Abundance of cytochromes P450 inhuman liver: a meta-analysis [Abstract]. Br J Clin Pharmacol 57:687–688.
Seithel A, Glaeser H, Fromm MF, and König J (2008a) The functional consequences of geneticvariations in transporter genes encoding human organic anion-transporting polypeptide familymembers. Expert Opin Drug Metab Toxicol 4:51–64.
Seithel A, Klein K, Zanger UM, Fromm MF, and König J (2008b) Non-synonymous polymor-phisms in the human SLCO1B1 gene: an in vitro analysis of SNP c.1929A.C. Mol GenetGenomics 279:149–157.
Shimada T, Yamazaki H, Mimura M, Inui Y, and Guengerich FP (1994) Interindividual variationsin human liver cytochrome P-450 enzymes involved in the oxidation of drugs, carcinogens andtoxic chemicals: studies with liver microsomes of 30 Japanese and 30 Caucasians. J PharmacolExp Ther 270:414–423.
Snoeys J, Beumont M, Monshouwer M, and Ouwerkerk-Mahadevan S (2016) Mechanistic un-derstanding of the nonlinear pharmacokinetics and intersubject variability of simeprevir: APBPK-guided drug development approach. Clin Pharmacol Ther 99:224–234.
Tirona RG, Leake BF, Merino G, and Kim RB (2001) Polymorphisms in OATP-C: identification ofmultiple allelic variants associated with altered transport activity among European- and African-Americans. J Biol Chem 276:35669–35675.
Tomita Y, Maeda K, and Sugiyama Y (2013) Ethnic variability in the plasma exposures ofOATP1B1 substrates such as HMG-CoA reductase inhibitors: a kinetic consideration of itsmechanism. Clin Pharmacol Ther 94:37–51.
Troutman MD and Thakker DR (2003) Novel experimental parameters to quantify the modulationof absorptive and secretory transport of compounds by P-glycoprotein in cell culture models ofintestinal epithelium. Pharm Res 20:1210–1224.
Tucker TGHA, Milne AM, Fournel-Gigleux S, Fenner KS, and Coughtrie MWH (2012) Absoluteimmunoquantification of the expression of ABC transporters P-glycoprotein, breast cancer
1560 Burt et al.
at ASPE
T Journals on M
arch 23, 2020dm
d.aspetjournals.orgD
ownloaded from
resistance protein and multidrug resistance-associated protein 2 in human liver and duodenum.Biochem Pharmacol 83:279–285.
Ufer M, Häsler R, Jacobs G, Haenisch S, Lächelt S, Faltraco F, Sina C, Rosenstiel P, Nikolaus S,Schreiber S, et al. (2009) Decreased sigmoidal ABCB1 (P-glycoprotein) expression in ulcerativecolitis is associated with disease activity. Pharmacogenomics 10:1941–1953.
Ulvestad M, Skottheim IB, Jakobsen GS, Bremer S, Molden E, Asberg A, Hjelmesæth J,Andersson TB, Sandbu R, and Christensen H (2013) Impact of OATP1B1, MDR1, and CYP3A4expression in liver and intestine on interpatient pharmacokinetic variability of atorvastatin inobese subjects. Clin Pharmacol Ther 93:275–282.
Varma MV, Lai Y, Feng B, Litchfield J, Goosen TC, and Bergman A (2012) Physiologically basedmodeling of pravastatin transporter-mediated hepatobiliary disposition and drug-drug interac-tions. Pharm Res 29:2860–2873.
Vildhede A, Karlgren M, Svedberg EK, Wisniewski JR, Lai Y, Norén A, and Artursson P (2014)Hepatic uptake of atorvastatin: influence of variability in transporter expression on uptakeclearance and drug-drug interactions. Drug Metab Dispos 42:1210–1218.
Vildhede A, Wi�sniewski JR, Norén A, Karlgren M, and Artursson P (2015) Comparative proteomicanalysis of human liver tissue and isolated hepatocytes with a focus on proteins determining drugexposure. J Proteome Res 14:3305–3314.
Wang L, Prasad B, Salphati L, Chu X, Gupta A, Hop CECA, Evers R, and Unadkat JD (2015)Interspecies variability in expression of hepatobiliary transporters across human, dog, monkey,and rat as determined by quantitative proteomics. Drug Metab Dispos 43:367–374.
Wojtal KA, Eloranta JJ, Hruz P, Gutmann H, Drewe J, Staumann A, Beglinger C, Fried M, Kullak-Ublick GA, and Vavricka SR (2009) Changes in mRNA expression levels of solute carriertransporters in inflammatory bowel disease patients. Drug Metab Dispos 37:1871–1877.
Zollner G, Thueringer A, Lackner C, Fickert P, and Trauner M (2014) Alterations of canalicularATP-binding cassette transporter expression in drug-induced liver injury. Digestion 90:81–88.
Zollner G, Wagner M, Fickert P, Silbert D, Gumhold J, Zatloukal K, Denk H, and Trauner M(2007) Expression of bile acid synthesis and detoxification enzymes and the alternative bile acidefflux pump MRP4 in patients with primary biliary cirrhosis. Liver Int 27:920–929.
Address correspondence to: Dr. Sibylle Neuhoff, Simcyp Limited (a CertaraCompany), Blades Enterprise Centre, Sheffield S2 4SU, UK. E-mail: [email protected]
Healthy Caucasian Liver Transporter Abundances 1561
at ASPE
T Journals on M
arch 23, 2020dm
d.aspetjournals.orgD
ownloaded from