Embed Size (px)
Citation preview
Abundance estimate and acoustic monitoring of harbour porpoise Phocoena phocoena in the
Blasket Islands candidate Special Area of Conservation
Simon Berrow1, Joanne O’Brien2, Ian O’Connor2 and David McGrath2
1 Irish Whale and Dolphin Group, Merchants Quay, Kilrush, County Clare2 Marine Biodiversity Research Group, Galway-Mayo Institute of Technology, Dublin Road,
Galway
Report to the National Parks and Wildlife Service
November 2007

2
Abundance estimate and acoustic monitoring of habour porpoise Phocoena phocoena in the Blasket Islands cSAC
Summary
A survey of harbour porpoises (Phocoena phocoena) was carried out within the Blasket Islandscandidate Special Area of Conservation (cSAC) to derive density and abundance estimates and carryout static acoustic monitoring. Single platform line-transect surveys were carried out on six daysbetween 16 July and 1 October 2007. Distance sampling was used to derive g(0), which is the densityof harbour porpoises on the track of the vessel. Passive acoustic monitoring was carried out throughthe deployment of self-contained click detectors called T-PODs, which identify and log theecholocation clicks of harbour porpoises. T PODs were deployed at four locations within the cSAC. T-PODs were calibrated against each other prior to deployment to account for different sensitivities of theequipment.
A total of 74 tracks were surveyed of a total distance of 460km. A total of 44 sightings of 102individual harbour porpoise were recorded. Sightings of 25 common dolphins (Delphinus delphis), fiveminke whales (Balaenoptera acutoratrata) and two basking sharks (Cetorhinus maximus) were alsorecorded.
Abundance estimates were calculated using the day and the track line as the samples and the sighting asthe observation. Density estimates ranged from 0.71 to 3.39 porpoises per km2. This gave abundanceestimates from 162±120 to 768±198 depending on the number of sightings per day. The most robustestimate was using all the data from each track-line combined, which gave an estimate of 303±76(CV=0.25: (5% Confident intervals 186-494). However there are indications of a strong seasonalincrease in abundance from July through to September.
An analysis of the effect of sea-state on density estimates was carried out and showed similar estimateswere derived in sea-state 0 and 1 but there was a 50% decline in density for track lines surveyed in sea-state 2. No porpoises were observed in sea-state 3. This indicates harbour porpoise surveys within theBlasket Islands cSAC should only be carried out in sea-state 0 or 1 for accurate density estimates.
Two months of acoustic data were acquired, one month each from the Wildbank and off Inishtooskert.Gear loss prevented additional data to be collected. Data were extracted as Detection Positive Minutes(DPM) per day and per hour for analysis. Detections were logged every day of deployment at bothsites. Nearly twice as many DPM per day were recorded off Wildlbank compared to Inishtooskert.Acoustic data from the Wildbank showed harbor porpoises to be more acoustically active during theday. The opposite occurred at Inishtooskert with porpoises more acoustically active during the night.
Density estimates from the Blasket Islands cSAC were compared to other similar surveys carried out inIrish and European waters. The densities in the Blaskets were much higher than other publishedstudies. When acoustic data were compared to other sites, the mean DPM per hour was greater in theBlaskets Islands cSAC than sites in Galway and Clew Bays and two out of three sites surveyed inRoaringwater Bay. Only off Sherkin Island in Co Cork were higher DPM per hour recorded. Thesetwo comparisons support the designation of the Blaskets islands as a cSAC for harbour porpoise. Acrude calculation estimates that around 0.5% of the total Irish harbour porpoise population may occurwithin the Blasket Islands cSAC.
More sighting surveys should be carried out to provide a robust dataset from which to inform thedesign of a long-term monitoring protocol. We recommend two replicate samples within each seasonare required, in parallel with an extensive acoustic dataset (minimum one year) to explore seasonalvariation in harbour porpoise densities and abundance.
Citation: Berrow, S.D., O’Brien. J., O’Connor, I. and McGrath, D. (2007) Abundance estimate andacoustic monitoring of habour porpoise Phocoena phocoena in the Blasket Islands candidate SpecialArea of Conservation. Report to the National Parks and Wildlife Service.
Cover images: Tearaght and Great Blasket © Pádraig Whooley, Harbour porpoise © Randall Counihan

3
Introduction
The Blasket Islands are comprised of a group of six main islands situated at the end of the Dinglepeninsula in County Kerry. They are well known for their rich literature and archeological heritage(Sayers, 1974; O’Crohan, T. 1978). The islands support one of the most important seabird colonies inIreland, with at least 11 species of seabird breeding regularly (Brazier and Merne, 1989; Smiddy et al.,2000). The Blasket Islands are one of the most important breeding sites for grey seals (Halichoerusgrypus) in Ireland with pup production in 2005 estimated at 185 giving a minimum population size of648-833 (Ó Cadhla et al., 2007).
Published information on the cetaceans of the Blasket Islands is limited. Berrow (1993) carried outtimed watches from 26 headlands around the Irish coast and recorded the highest sighting rate fromSlea Head overlooking the Blasket Islands where harbour porpoise (Phocoena phocoena) and minkewhales (Balaenoptera acutorostrata) were observed. Smiddy et al., (2000) reported a single sightingof two harbour porpoises in Blasket sound in 1989 and a single bottlenose dolphin (Tursiops truncatus)in 2001. Five cetacean species were reported off Slea Head overlooking the Blasket Islsnds by Berrowet al. (2002). These included harbour porpoise, bottlenose, common (Delphinus delphis) Risso’sdolphin (Grampus griseus) and minke whale. The presence of small cetaceans was known to islandersliving on Great Blasket as O’Crohan (1978) describes driving sea-hogs ashore in 1890 where they werekilled and eaten during the winter. These could refer to harbour porpoises (muc mhara or sea-pigs) orsmall dolphins.
The harbour porpoise is probably the most widespread and abundant cetacean species in Irish waters(Rogan and Berrow 1997). It has been recorded off all coasts and over the continental shelf but isthought to be most abundant off the southwest coast (Reid et al., 2003). They are consistently the mostfrequently recorded species stranded on the Irish coast (Berrow and Rogan, 1997). The life history ofharbour porpoise in Irish waters is poorly understood. Rogan and Berrow (1996) reported that 95% ofprey items recovered from the stomachs of stranded and bycaught harbour porpoise were either gadoidsand clupeids, with Trisopterus spp., whiting, Merlangius merlangus, and poor cod, T. minutus,contributing most of the prey items. Walton (1997) showed there were significant genetic differencesbetween harbour porpoise from the northern North Sea and the Celtic/Irish Sea, but these differenceswere predominantly due to variation among females. Abundance estimates for the Celtic Sea weredetermined in 1994 (Hammond et al., 1999) and for all Irish waters to the shelf edge and including theIrish Sea in 2005 (Hammond and MacLeod, 2006).
Threats to harbour porpoise in Irish waters are also poorly understood. Tregenza et al. (1997) estimated2,200 harbour porpoises were killed by bottom set gillnets in the Celtic Sea in 1993/94. This accountedfor 6.2% of the estimated number of harbour porpoise in that region and there was serious concernabout the ability of the population to sustain this mortality. Studies of persistent pollutants have shownradio-nuclide levels are low in harbour porpoises in the Irish Sea (Berrow et al., 1998) whilst levels oforganochlorine pesticide contamination are among the lowest recorded in the north-east Atlantic(Smyth et al., 2000).
EU member states are required to designate Special Areas of Conservation (SAC) for species listedunder Annex II of the EU Habitats Directive. The Blasket Islands were designated as a candidateSpecial Area of Conservation (cSAC) in 2000 for a number of marine and terrestrial habitats as well asthe grey seal and harbour porpoise. Roaringwater Bay cSAC in Co Cork is also designated for harbourporpoise and the Lower River Shannon is the only cSAC in Ireland designated for bottlenose dolphin.
Objectives
The objectives of the present survey were to:1. survey the Blasket Island cSAC for harbour porpoise2. calculate the density of harbour porpoise within the cSAC3. derive an abundance estimate of harbour porpoises within the
cSAC4. carry out acoustic monitoring within the cSAC5. record other species of interest within the cSAC
4
Methods
Sighting Survey
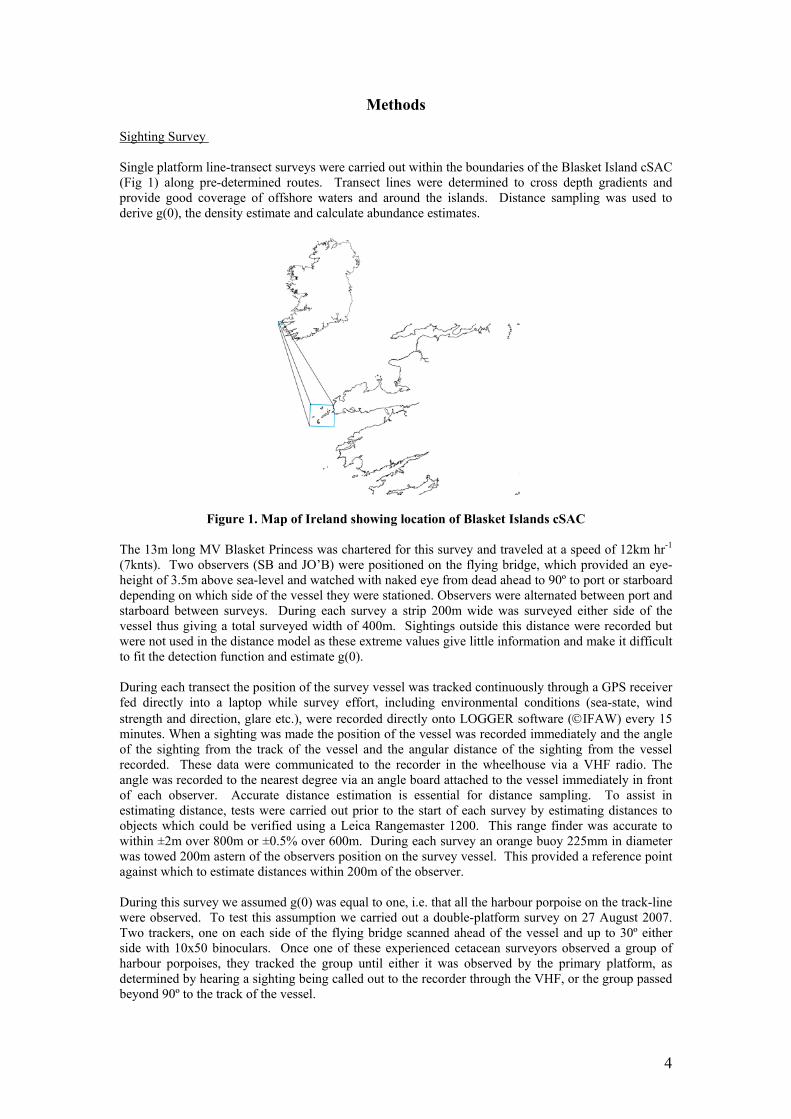
Single platform line-transect surveys were carried out within the boundaries of the Blasket Island cSAC(Fig 1) along pre-determined routes. Transect lines were determined to cross depth gradients andprovide good coverage of offshore waters and around the islands. Distance sampling was used toderive g(0), the density estimate and calculate abundance estimates.
Figure 1. Map of Ireland showing location of Blasket Islands cSAC
The 13m long MV Blasket Princess was chartered for this survey and traveled at a speed of 12km hr-1
(7knts). Two observers (SB and JO’B) were positioned on the flying bridge, which provided an eye-height of 3.5m above sea-level and watched with naked eye from dead ahead to 90º to port or starboarddepending on which side of the vessel they were stationed. Observers were alternated between port andstarboard between surveys. During each survey a strip 200m wide was surveyed either side of thevessel thus giving a total surveyed width of 400m. Sightings outside this distance were recorded butwere not used in the distance model as these extreme values give little information and make it difficultto fit the detection function and estimate g(0).
During each transect the position of the survey vessel was tracked continuously through a GPS receiverfed directly into a laptop while survey effort, including environmental conditions (sea-state, windstrength and direction, glare etc.), were recorded directly onto LOGGER software (©IFAW) every 15minutes. When a sighting was made the position of the vessel was recorded immediately and the angleof the sighting from the track of the vessel and the angular distance of the sighting from the vesselrecorded. These data were communicated to the recorder in the wheelhouse via a VHF radio. Theangle was recorded to the nearest degree via an angle board attached to the vessel immediately in frontof each observer. Accurate distance estimation is essential for distance sampling. To assist inestimating distance, tests were carried out prior to the start of each survey by estimating distances toobjects which could be verified using a Leica Rangemaster 1200. This range finder was accurate towithin ±2m over 800m or ±0.5% over 600m. During each survey an orange buoy 225mm in diameterwas towed 200m astern of the observers position on the survey vessel. This provided a reference pointagainst which to estimate distances within 200m of the observer.
During this survey we assumed g(0) was equal to one, i.e. that all the harbour porpoise on the track-linewere observed. To test this assumption we carried out a double-platform survey on 27 August 2007.Two trackers, one on each side of the flying bridge scanned ahead of the vessel and up to 30º eitherside with 10x50 binoculars. Once one of these experienced cetacean surveyors observed a group ofharbour porpoises, they tracked the group until either it was observed by the primary platform, asdetermined by hearing a sighting being called out to the recorder through the VHF, or the group passedbeyond 90º to the track of the vessel.

5
Abundance estimate
Statistical inference using distance sampling rests on the validity of several assumptions (Buckland etal., 2001). These include that objects are spatially distributed according to some stochastic process. Iftransect lines are randomly placed within the study area we can safely assume that objects areuniformly distributed with respect to the perpendicular distance from the line in any given direction.Another assumption is that objects on the trackline are always detected (g(0)=1) and are detected attheir initial location prior to any movement in response to the observer. Finally, if objects on or near tothe trackline are missed the density estimate will be biased low. To minimise the effect of movement itis recommended that the speed of the observer is at least twice the speed of the object and if this is thecase then movement of the object causes few problems in line transect sampling (Buckland et al.,2001).
The software programme DISTANCE (Version 5, University of St Andrews, Scotland) was used forcalculating the density of harbour porpoises on the track of the vessel (g(0)) and thus derivingabundance estimates. This software allows the user to select a number of models in order to identifythe most appropriate for the data. It also allows truncation of outliers when estimating variance ingroup size and testing for evasive movement prior to detection.
There were two broad approaches to data analysis. Either survey day could be used as the sample withsightings as observations or track-line treated as the sample with sightings used as observations. Theadvantage of the latter method is that the sample size is much greater which should reduce the variance.One possible disadvantage is the high number of zero observations within each sample (i.e. no porpoisesighted on the track line).
We fitted the data to a number of models. We found that a Half-Normal model with HermitePolynomial series adjustments best fitted the data according to Akaike’s Information Criterion. Therecorded data were grouped into equal intervals of 0-20, 20-40 up to 180-200. Cluster size wasanalysed used size-bias regression method with log(n) of cluster size against estimated g(x). Thevariance was estimated empirically.
Maps were created using Irish Grid (TM65_Irish Grid) with ArcView 3.2; the map of the SAC wasobtained from National Parks ands Wildlife Service. Data used in the creation of the maps of transects,effort, abundance and density estimates were stored in a single MS Access database, which was queriedfrom within the GIS to produce maps.
Acoustic monitoring
Acoustic monitoring was carried out through the deployment of T-PODs, in the study area. The T-POD units were manufactured by Chelonia Ltd in the UK. They consist of a self-contained computerand hydrophone and can log the times and duration of clicks which resemble the echolocation clicksproduced by porpoises. The T-PODs detect clicks using two band-pass filters, one filter is called thetarget filter A, while the other filter is B, the reference filter. T-PODs were set to log only harbourporpoise clicks, using the generic harbour porpoise settings. This meant that the target filter A was setto 130Khz (Peak frequency of harbor porpoises), while the reference B filter was set to 92kHz (as atthis frequency there is very little or no energy of the porpoise sonar signal at that frequency) (Table 1).
Harbour porpoise are known to produce echolocation signals that are narrowband, high frequencyclicks within 110-150 kHz (Møhl and Andersen, 1973). An example of the output is shown in Figure2.
Table 1. TPOD settings used for porpoise monitoring in the Blasket Islands cSAC (Ver 5 T-POD)
Scan 1 2 3 4 5 6Target A Filter reference kHz 130 130 130 130 130 130Reference B Filter reference kHz 92 92 92 92 92 92Click Bandwidth 4 4 4 4 4 4Noise Adaptation ++ ++ ++ ++ ++ ++Sensitivity 16 16 16 16 16 16

Scan Limit on N of clicks logged 240 240 240 240 240 240
T-POD Calibration trials
In order to facilitate the comparison of acoustic data collected by different units, simultaneouslyrecording from different sites, it is necessary to carry out calibration trials to assess the variability insensitivity between units. Calibrations trials were carried out in Galway Bay, from a site two miles eastof Spiddal, Co. Galway between 12 June and 10 July 2007. Two T-PODs (Nos 642 and 658) weredeployed in close proximity to each other for a duration of 29 days. Both T-PODs were set to detectharbour porpoises only. Upon recovery of both devices, data were extracted as total detection positiveminutes (DPM) per day.
Results from these trials showed that T-POD 658 detected 4,243 more clicks (56 more DPM) than T-POD 642 (Table 2). A correction factor was applied to data collected from T-POD 642, which was theless sensitive device. The mean detection rate of each T-POD over the 29-day deployment (X) wasused to calculate the correction factor (C)
Table 2. Summary of acoustic d
T-PODNumber
Duration ofdeployment
642 29d 3h 39m
658 29d 3h 39m
After the correction factor was applied asignificant differences between the corrDetection Positive Minutes (DPM) per daend of the study, to explore any changesto loss of gear this task could not be com
Moorings
The mooring system used at each locawithstand adverse weather condition. Thby hand from the surface. This is attaProviding the distance between the weigstraight forward. A similar but lighter m
to 500µs (as shown on the Y axis).
as shown below:
ata logged during cal
Total clicks“cet all” P
20,587
24,830
non-parametric Kruskected data. No signiy (P=0.401). It was p in sensitivity betweenpleted.
tion is shown in Fige T-POD is attached toched to a heavier wehts is greater than theooring system was us
Figure 2. Screen print of the T-PODsoftware after analyzing click trainspresent in the logged data fromInishtooskert. The clicks in red areclassed as high probability cetaceanclicks, while those in yellow areclassed as lower probability cetaceanclicks. There are several clickspresent in a click train and range up
6
ibration trials in Galway Bay
Clicks er hour
TotalDPM
Mean DPMper h-1
30 372 0.53
36 428 0.61
al Wallis test was carried out in order to test forficant difference was found when expressed aslanned to carry out similar calibration trials at the T-PODs over the duration of the study, but due
ure 3. This system was designed to the lighter weight, which can be pulledight, which acts as the main mooring. depth of water recovery was relativelyed by O’Brien (unpubl. data) in Galway

7
Bay. She used 40kg instead of 60kg on the main mooring and it stayed in position for the duration of awinter, ever during gale force winds. Written on each main mooring buoy was “The Irish Whale andDolphin Group Harbour Porpoise Survey. Please leave alone. Phone 086 8545450”.
Figure 3. Design of the mooring system used for deployment of T-PODs
Deployment positions of T-PODs
Four locations were used for T-POD deployments throughout this study (Fig. 4). Two units weredeployed at any one time. From the four sites, data were only successfully recovered from units at twosites (Inishtooskert and Wildbank). At the end of the study period, neither surface mooring-buoyscould be found at their locations off Inishtearaght and Inishtooskert.
Figure 4. Map of locations where T-PODs were deployedResults
Sighting Surveys
Harbour porpoise surveys were carried out on six days between July and October 2007 (Table 3).Individual track-lines for each survey are shown in Appendix I. The track-lines were chosen to provideas complete coverage of the cSAC as possible in order to identify any high-density areas. The wholecSAC was covered on each survey day to enable individual abundance estimates for each survey day tobe calculated. No track-line was surveyed more than once (apart from in restricted areas such asBlasket sound) which provided good coverage of the whole cSAC (Fig 5).
Table 3. Date, sea-state and number of sightings of harbour porpoises within the Blasket Island cSAC during 2007

8
Sample Date No. of tracklines
Total distance(km)
Sea-state(% of total survey time)
Number ofsightings
Total Animals
0 1 2 3
1 16 July 2007 8 65.947 0 81.4 12.2 6.4 10 202 24 July 2007 17 83.045 0 55.7 35.3 9.0 5 123 11 August 2007 19 92.380 0 71.2 27.3 6.0 4 84 27 August 2007 18 83.180 7.1 57.0 24.0 11.9 9 265 11 September 2007 12 64.675 53.0 44.3 1.0 1.6 16 366 1 October 2007 8 67.429 0 15.8 66.7 17.5 0 0
Total 74 460.399 44 102
Transects were carried out within the cSAC boundary but on two occasions the route passed amaximum of 830m to the west of the western boundary (Fig 5). A total of 460 km of track-line wassurveyed over the six survey days, ranging in length from 66km on 16 July to 92km on 11 August. Atotal of 44 sightings of harbour porpoise were recorded consisting of 102 individual animals.
Figure 5. Map showing location of all track lines surveyed and harbour porpoise observedSea conditions varied over the survey period (Table 3). Although sea-state was less than 3 for over88% of the track lines surveyed during five of the six days, a significant proportion of time with sea-state 0 was only recorded during the fifth transect on 11 September. Sea-state one or less was recordedon 97% of track lines surveyed on 11 September but under 65% on three of the six transect days. Sea-state was 2 or greater on 84% of the track lines surveyed on 1 October and no cetacean sightings wererecorded. Data from this survey day was removed from all the subsequent analysis.
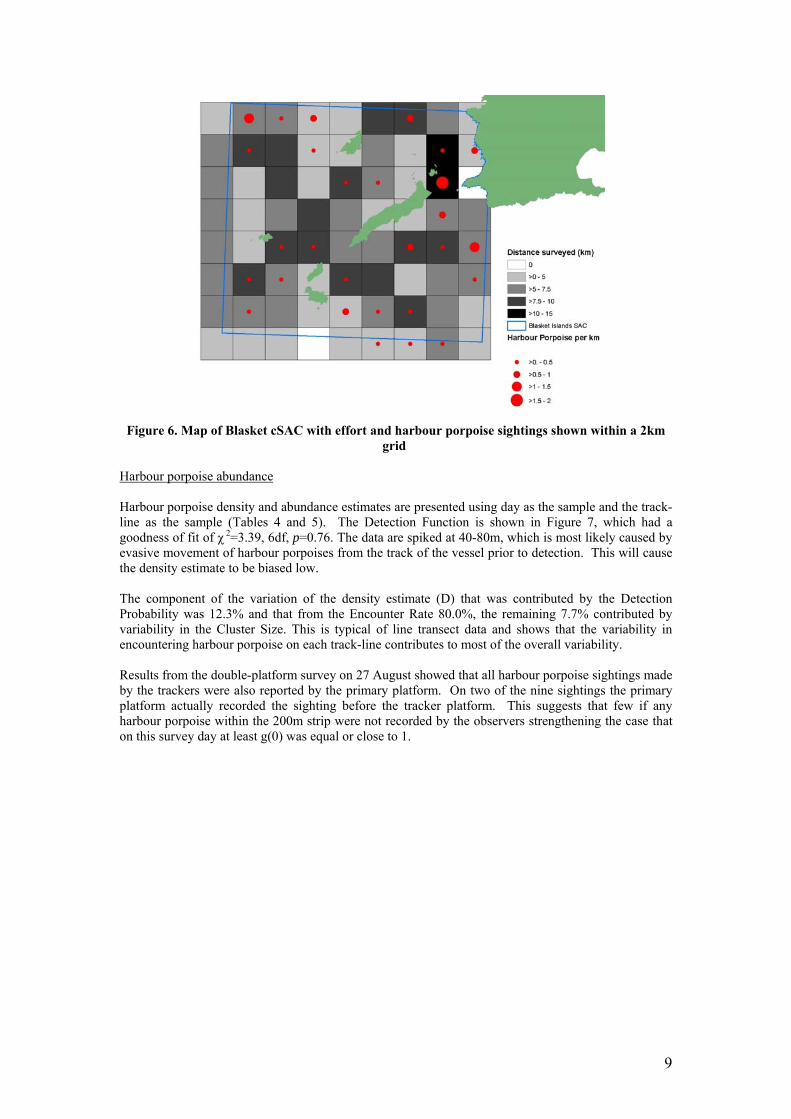
Harbour porpoise distribution
Harbour porpoise were distributed throughout within the cSAC with highest densities (harbourporpoise per km traveled) in Blasket Sound. High concentrations were also recorded to the south ofGreat Blasket and east of Inishvickillane and to the northwest of the cSAC (Fig 6). Only two calveswere reported, both in September, which means gives an adult/calf ratio of 50:1 or 2% of total wasrecorded.
9
Figure 6. Map of Blasket cSAC with effort and harbour porpoise sightings shown within a 2kmgrid
Harbour porpoise abundance
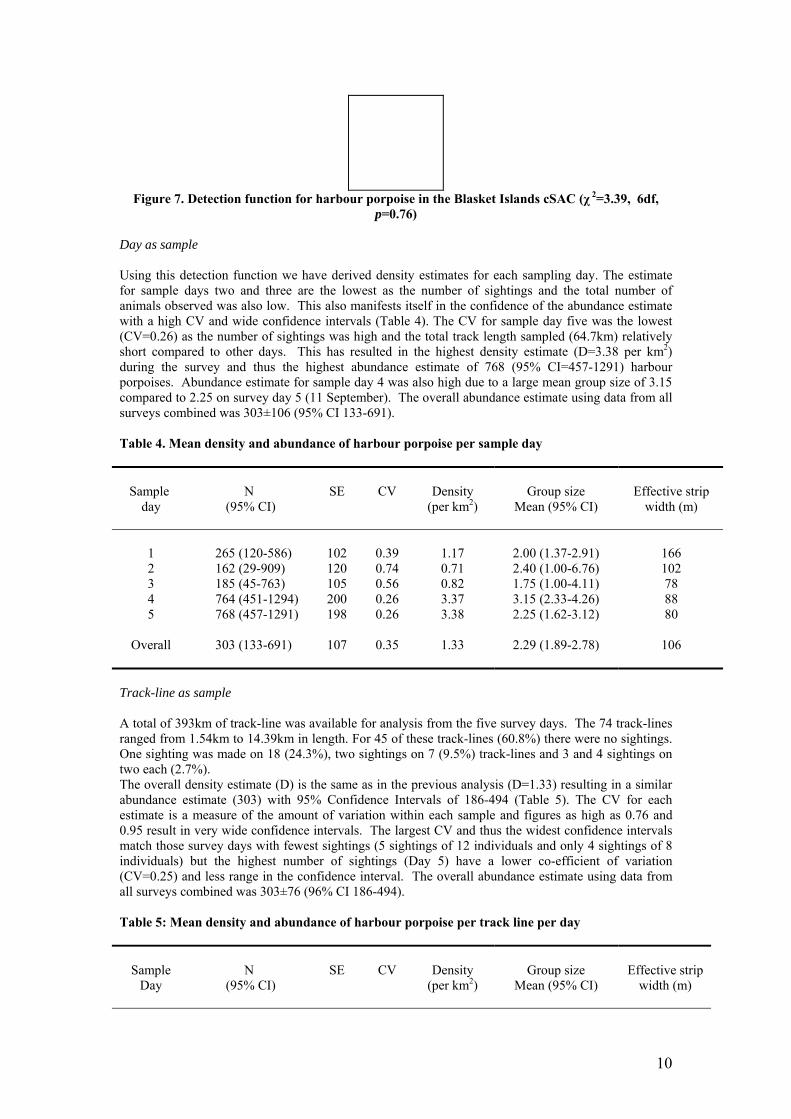
Harbour porpoise density and abundance estimates are presented using day as the sample and the track-line as the sample (Tables 4 and 5). The Detection Function is shown in Figure 7, which had agoodness of fit of χ 2=3.39, 6df, p=0.76. The data are spiked at 40-80m, which is most likely caused byevasive movement of harbour porpoises from the track of the vessel prior to detection. This will causethe density estimate to be biased low.
The component of the variation of the density estimate (D) that was contributed by the DetectionProbability was 12.3% and that from the Encounter Rate 80.0%, the remaining 7.7% contributed byvariability in the Cluster Size. This is typical of line transect data and shows that the variability inencountering harbour porpoise on each track-line contributes to most of the overall variability.
Results from the double-platform survey on 27 August showed that all harbour porpoise sightings madeby the trackers were also reported by the primary platform. On two of the nine sightings the primaryplatform actually recorded the sighting before the tracker platform. This suggests that few if anyharbour porpoise within the 200m strip were not recorded by the observers strengthening the case thaton this survey day at least g(0) was equal or close to 1.
10
Figure 7. Detection function for harbour porpoise in the Blasket Islands cSAC (χ 2=3.39, 6df,p=0.76)
Day as sample
Using this detection function we have derived density estimates for each sampling day. The estimatefor sample days two and three are the lowest as the number of sightings and the total number ofanimals observed was also low. This also manifests itself in the confidence of the abundance estimatewith a high CV and wide confidence intervals (Table 4). The CV for sample day five was the lowest(CV=0.26) as the number of sightings was high and the total track length sampled (64.7km) relativelyshort compared to other days. This has resulted in the highest density estimate (D=3.38 per km2)during the survey and thus the highest abundance estimate of 768 (95% CI=457-1291) harbourporpoises. Abundance estimate for sample day 4 was also high due to a large mean group size of 3.15compared to 2.25 on survey day 5 (11 September). The overall abundance estimate using data from allsurveys combined was 303±106 (95% CI 133-691).
Table 4. Mean density and abundance of harbour porpoise per sample day
Sample day
N (95% CI)
SE CV Density(per km2)
Group sizeMean (95% CI)
Effective stripwidth (m)
1 265 (120-586) 102 0.39 1.17 2.00 (1.37-2.91) 1662 162 (29-909) 120 0.74 0.71 2.40 (1.00-6.76) 1023 185 (45-763) 105 0.56 0.82 1.75 (1.00-4.11) 784 764 (451-1294) 200 0.26 3.37 3.15 (2.33-4.26) 885 768 (457-1291) 198 0.26 3.38 2.25 (1.62-3.12) 80
Overall 303 (133-691) 107 0.35 1.33 2.29 (1.89-2.78) 106
Track-line as sample
A total of 393km of track-line was available for analysis from the five survey days. The 74 track-linesranged from 1.54km to 14.39km in length. For 45 of these track-lines (60.8%) there were no sightings.One sighting was made on 18 (24.3%), two sightings on 7 (9.5%) track-lines and 3 and 4 sightings ontwo each (2.7%). The overall density estimate (D) is the same as in the previous analysis (D=1.33) resulting in a similarabundance estimate (303) with 95% Confidence Intervals of 186-494 (Table 5). The CV for eachestimate is a measure of the amount of variation within each sample and figures as high as 0.76 and0.95 result in very wide confidence intervals. The largest CV and thus the widest confidence intervalsmatch those survey days with fewest sightings (5 sightings of 12 individuals and only 4 sightings of 8individuals) but the highest number of sightings (Day 5) have a lower co-efficient of variation(CV=0.25) and less range in the confidence interval. The overall abundance estimate using data fromall surveys combined was 303±76 (96% CI 186-494).
Table 5: Mean density and abundance of harbour porpoise per track line per day
SampleDay
N (95% CI)
SE CV Density(per km2)
Group sizeMean (95% CI)
Effective stripwidth (m)

11
1 265 (77-910) 167 0.63 1.17 2.00 (1.37-2.91) 1662 162 (28-938) 154 0.95 0.71 2.40 (1.00-6.76) 1023 205 (50-832) 155 0.76 0.90 2.05 (1.05-3.80) 784 356 (144-876) 165 0.46 1.57 2.89 (1.81-4.59) 1135 769 (329-1799) 330 0.42 3.39 2.25 (1.62-3.12) 81
Overall 303 (186-494) 76 0.25 1.33 2.32 (1.92-2.79) 107
Influence of sea-state of density estimates
The DISTANCE model was run again with the data stratified by sea-state to explore the influence ofsea-state on density and abundance estimates. There were no sightings during the 37km surveyed insea-state 3, thus the density estimate is zero. There were seven sightings in sea-state 0, which providedan abundance estimate with the highest standard error and a CV of 0.52 (Table 6). The estimate withthe lowest CV was in sea-state 1 where 30 sightings were made during 45 track lines of total length203km. The density estimates in sea-state 0 and 1 were similar suggesting that the detection rate issimilar in these sea-states. However the density estimate declined by 49% in sea-state 2 compared withthe mean of seas-states 0 and 1. Thus the data suggests that, if possible, surveys should not be carriedout in seas-state 2 as this will strongly affect the detection function.
Table 6. Mean density and abundance of harbour porpoise per track line in different sea-states
Sea-state Distancesurveyed (km)
N (95% CI)
SE CV Density(per km2)
Group sizeMean (95% CI)
0 46 320 (115-890) 166 0.52 1.41 1.28 (1.00-1.82)1 203 369 (194-701) 122 0.33 1.62 2.27 (1.78-2.88)2 107 179 (49-656) 126 0.70 0.78 2.40 (1.02-3.80)3 37 - - - 0.00 -
Temporal changes in harbour porpoise abundance
The data suggest that was an increase in the abundance of harbour porpoises within the cSAC fromJuly through to September. Densities increased around three-fold from around 1 porpoise per km inJuly and early August to 3 porpoise per km during late August and September. Large concentrations ofharbour porpoises were recorded to the south of Blasket sound. This is in an important factor in thedesign of monitoring protocols as abundance estimates would have to be stratified by season to ensureany recorded changes in abundance are not due to shifts in seasonal changes rather than long termtrends. Acoustic detections
During the six potential acoustic months of deployment (3 months x 2 T-PODs) we only acquired 2months of acoustic data from the Blasket Islands cSAC. Initially, one T-POD was deployed offInishtooskert and one off the Wildbank and data was successfully downloaded from these two devicesat the end of a 28-day deployment period.
Table 7. Summary of acoustic data from T-PODs recovered from Wildbank and Inishtooskert
Location Deploymentdate
Deploymentduration
Totalclicks
“cet all”
Clicksper hour
TotalDPM
Mean DPMper h-1
12
Inishtooskert (642) 12.07.07 28d 14h 49m 33,389 46 619 0.9Wildbank (658) 12.07.07 29d 6h 28m 89,984 120 1394 1.99
After recovering the T-POD on the Wildbank it was re-deployed off Beginish Island. T-POD 658 wasre-deployed off Inishtooskert with an extra small surface mooring attached. When the T-POD wasrecovered from Beginish on 11 September 2007, the unit had only logged for 10 hours, 48 minutesafter which the angle switch showed the T-POD had moved into an off position. The T-POD offInishtooskert could not be located on the 11 September, despite visiting the site at extreme low-water.After recovering the T-POD from Beginish, the mooring was then moved to a position on the easternside of Inishtearaght. On the final transect on the 1 October the surface mooring could not be located.Results from the two full months of acoustic data are shown in Table 7.
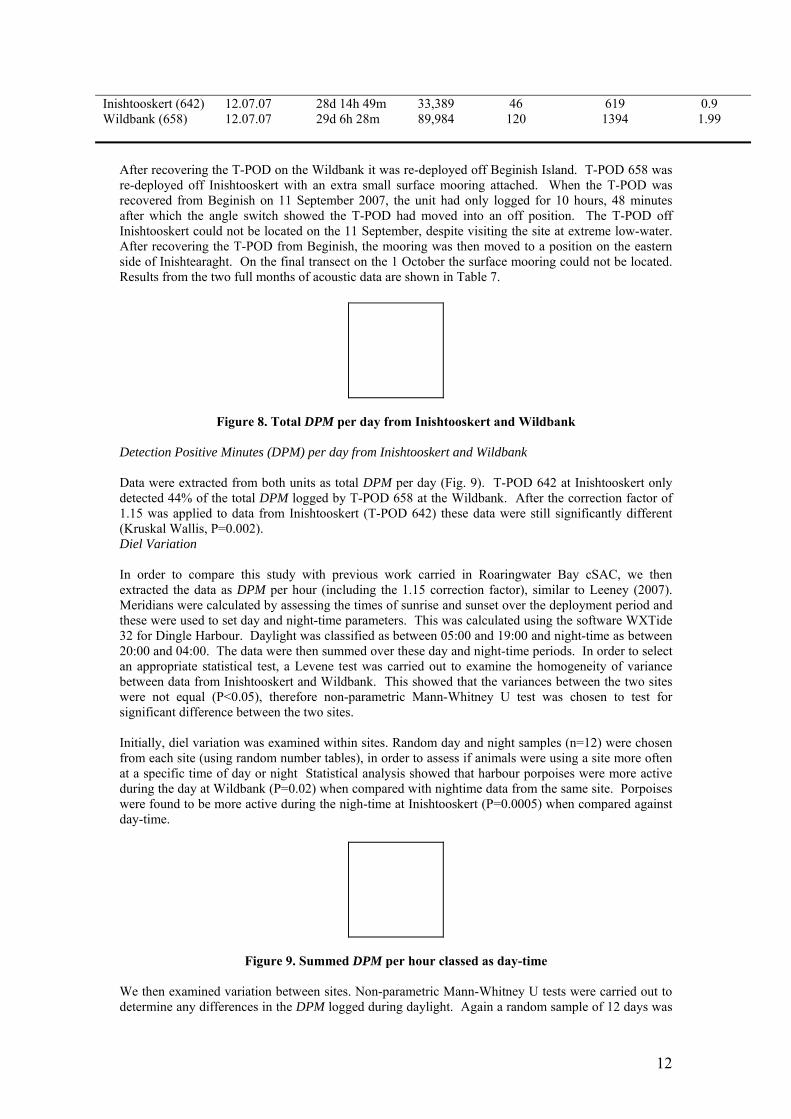
Figure 8. Total DPM per day from Inishtooskert and Wildbank
Detection Positive Minutes (DPM) per day from Inishtooskert and Wildbank
Data were extracted from both units as total DPM per day (Fig. 9). T-POD 642 at Inishtooskert onlydetected 44% of the total DPM logged by T-POD 658 at the Wildbank. After the correction factor of1.15 was applied to data from Inishtooskert (T-POD 642) these data were still significantly different(Kruskal Wallis, P=0.002). Diel Variation
In order to compare this study with previous work carried in Roaringwater Bay cSAC, we thenextracted the data as DPM per hour (including the 1.15 correction factor), similar to Leeney (2007).Meridians were calculated by assessing the times of sunrise and sunset over the deployment period andthese were used to set day and night-time parameters. This was calculated using the software WXTide32 for Dingle Harbour. Daylight was classified as between 05:00 and 19:00 and night-time as between20:00 and 04:00. The data were then summed over these day and night-time periods. In order to selectan appropriate statistical test, a Levene test was carried out to examine the homogeneity of variancebetween data from Inishtooskert and Wildbank. This showed that the variances between the two siteswere not equal (P<0.05), therefore non-parametric Mann-Whitney U test was chosen to test forsignificant difference between the two sites.
Initially, diel variation was examined within sites. Random day and night samples (n=12) were chosenfrom each site (using random number tables), in order to assess if animals were using a site more oftenat a specific time of day or night Statistical analysis showed that harbour porpoises were more activeduring the day at Wildbank (P=0.02) when compared with nightime data from the same site. Porpoiseswere found to be more active during the nigh-time at Inishtooskert (P=0.0005) when compared againstday-time.
Figure 9. Summed DPM per hour classed as day-time
We then examined variation between sites. Non-parametric Mann-Whitney U tests were carried out todetermine any differences in the DPM logged during daylight. Again a random sample of 12 days was

13
used, which showed there was a significant difference showing that harbour porpoises were moreactive during the day at Wildbank when compared with Inishtooskert (P=0.0014) (Fig. 9). The sametrend was evident when the data were analyzed from both sites during night-time hours (Fig. 10). Asabove, a random sample of 12 nights was chosen from each site. Mann-Whitney U tests were used totest for significant difference. A significant difference (Mann-Whitney, P=0.0001) was found betweenthe sites during night-time, with porpoises off the Wildbank most active.
Figure 10. Summed DPM per hour classed as night-timeTidal Influence
When DPM per hour is presented over a tidal cycle it is clear that there are no trends on the Wildbank(Fig. 11) while off Inishtooskert there was some variation between low and high water, with the highestpeaks ocurring during the ebbing tide (Fig. 11) however these were not significant (Kruskal Wallis test,P=0.234, NS).
Figure 11. Distribution of DPM over completer tidal cycles at Wildbank and Inishtooskert
Other species recorded during survey
In addition to harbour porpoise we recorded two other species of cetacean and two basking sharks(Cetorhinus maximus) (Table 8). Common dolphins (Delphinus delphis) were the most frequentlyrecorded other species with seven sightings of 25 individuals. They were mainly observed to west andnorth side of cSAC area and at the south side of Blasket sound. The five minke whale sightings wereall to the south of Blasket sound and on two occasions were observed in the same feeding aggregate asharbour porpoise.
Table 8. Species of marine megafauna, other than harbour porpoise, recorded during this survey
LocationDate Species Number ofindividuals Latitude Longitude
Behaviour
16 July Basking shark 1 52.11169 10.49249 Feeding16 July Minke whale 1 52.10072 10.4863824 July Common dolphin 2 52.09688 -10.70317 Traveling24 July Common dolphin 4 52.13765 -10.70197 Travelling
11 August Common dolphin 5 52.11261 -10.6931 Travelling11 August Common dolphin 1 52.07759 -10.68857 Travelling27 August Minke whale 1 52.09896 -10.47663 Feeding27 August Common dolphin 2 52.09661 -10.47656 Feeding27 August Minke whale 1 52.09326 -10.47704 Feeding27 August Common dolphin 3 52.14727 -10.55287 Travelling27 August Minke whale 2 52.10154 -10.48637
11 September Minke whale 1 52.10227 -10.49079 Feeding11 September Common dolphin 8 52.14052 -10.51583 Feeding

14
11 September Basking shark 1 52.10151 -10.53803
Discussion
The ability to detect harbour porpoise visually at sea and thus the accuracy of density and abundanceestimates is extremely dependent on sea-state. During the present study, transects were carried out,whenever possible, in sea-state 2 or less as the ability to detect harbour porpoise decreases significantlyin sea-state ≥3 (Teilman, 2003). Palka (1996) found that the sighting rates of this species decreased by20% from Beaufort 0 to 1 and by 75% from Beaufort 0 to 2-3. We have shown the differences inabundance estimates with sea-state can vary as much as 100% between sea-state 0-1 and sea-state 2.Harbour porpoise surveys should only be carried out in sea-state 0 or 1 to ensure all animals aredetected and g(0)=1. This is rarely possible and given the poor weather throughout July and August2007 we were fortunate to be able to carry out as many surveys as we did in relatively good sea-state.Acoustic monitoring is much less weather dependent.
Little was known about the distribution of harbour porpoise within the Blasket Islands cSAC prior tothis study. The results suggest that all, or most of the site, is used by harbour porpoise. Concentrations,especially in Blasket sound, were recorded which might indicate an important foraging area as currentsare very strong through the sound. Pierpoint et al. (1994) observed porpoises in tidal races surfacingrepeatedly at the same location, always orientated so as to face into the tidal stream, which theyintercepted as foraging activity. Other concentrations may correlate with reefs (e.g. Wildbank) or othertypographic or oceanographic features.
Mean harbour porpoise group size recorded during this study ranged from 1.75 to 3.15 (actual: 1-7individuals). O’Cadhla et al., (2003) reported a mean of 1.92 (range: 1-4) from Broadhaven Bay, CoMayo and Pierpoint (2001) 1.74 (range: 1-8) in the coastal water of southwest Wales. Thus the groupsizes recorded are typical for the British Isles.
Comparison of harbour porpoise density estimates
Typically for surveys of harbour porpoise g(0)= 0.4 or 0.5, i.e. only one-half of the animals on thetrack-line are detected. If this was the case with the present survey then we could double the densityestimate. Without a double-platform methodology it is not possible to accurately determine thenumbers missed on the track-line. An attempt to test this assumption was carried out during this surveyand all animals tracked were detected by the primary platform but some groups were not detectedimmediately and demonstrated evasive movement from the boat. This is also indicated by the detectionfunction. These factors will reduce the density estimates however as density estimates were similar insea-state 0 and 1 we can be confident that they are relatively accurate. We have provided minimumdensity estimates for harbour porpoises within the Blasket Islands cSAC and provided a baseline fromwhich to monitor changes in the population.
We compare the density estimate from the present survey to those recorded for other harbour porpoisesurveys in Irish and other European waters (Table 9). The density estimate recorded in the presentstudy (1.33 harbour porpoise per km2) was much higher than other published surveys. Only Leopold etal. (1992) reported densities greater than 0.5 harbour porpoise per km2 in Irish waters. The highestdensities in other European waters were from The East Danish coast (0.81) and in the Northern NorthSea and around Orkney and Shetland (0.78)
We might expect density estimates to be high in the Blasket Islands cSAC given that densities ofharbour porpoise are thought to be greater off the southwest coast compared to other parts of Ireland(Rogan and Berrow, 1996; Reid et al., 2003) and this survey was restricted to the coast and offshoreislands, which are considered preferred habitats for harbour porpoise (Santos and Pierce, 2005).

15
Table 9. Density estimates of harbour porpoise in Irish and EU waters as determined from dedicated sightingsurveys
Location Year Area(km2)
Method Density(per km2)
CV Reference
Irish watersGalway - Cork1 1989 - SPL 0.77 Leopold et al. (1992)Celtic Sea 1994 201,490 DPL 0.18 0.57 Hammond et al. (2002)Celtic Sea 2005 197,400 DPL 0.41 0.50 Hammond and MacLeod (2006)Irish Sea 2005 45,417 Aerial 0.34 0.35 Hammond and MacLeod (2006)Coastal Ireland 2005 31,919 Aerial 0.28 0.37 Hammond and MacLeod (2006)Offshore shelf edge2 2005 149,637 DPL 0.07 1.24 Hammond and MacLeod (2006)Blasket Islands 2007 227 SPL 1.33 0.25 This study
Other EU watersNorthern North Sea 1994 118,985 DPL 0.78 0.25 Hammond et al. (2002)Orkney and Shetland 1994 31,059 Aerial 0.78 0.34 Hammond et al. (2002)East Danish coast 1994 7,278 Aerial 0.81 0.27 Hammond et al. (2002)South Central North Sea 2005 156,972 DPL 0.56 0.23 Hammond and MacLeod (2006)Coastal NW Denmark 2005 20,844 Aerial 0.56 0.43 Hammond and MacLeod (2006)
SPL = Single platform line transect, DPL = Double platform line transect, Aerial=Aerial survey1 not a dedicated survey but a platform of opportunity2 includes offshore waters to the west of Scotland
Comparison of harbour porpoise abundance estimates
The overall abundance estimate from this study suggests around 303 harbour porpoise occurred withinthe cSAC between July and September. Immigration into the site may have occurred through thesummer and into the autumn increasing abundance to a maximum of 760 porpoises in September.
In the NPWS Conservation Assessment recently submitted to the EU as part of the governmentsreporting requirements the total population estimate for harbour porpoises in Irish waters was around100,000 individuals. If this is accurate then the Blasket Islands cSAC may contain around 0.5% (0.3%-0.7%) of the total Irish population of harbour porpoise. The results present here provide a good baselinefrom which to compare similar surveys in other locations and from which to monitor changes indensities through time.
Acoustic detections
To compliment the boat-based surveys which could only be carried out during daylight hours, StaticAcoustic Monitoring (SAM) was used through the use of T-PODs. This provided a robust means toexplore factors such as site usage, diurnal and tidal factors influencing the distribution of harbourporpoises within this cSAC.
These data showed that there were significant differences in detections between the two sites surveyed(Inishtooskert and Wildbank). A significant difference was also found in the number of detectionsduring day-time and night-time parameters within sites. This showed that harbour porpoise were morevocally active at Inishtooskert during the night, but were more active during the day-time at Wildbank.These results were similar to that reported by Carlström (2005) who found significantly higher inter-click intervals at night than during the day.
Further analysis examined the effect of tidal cycle on the number of DPM/h-1, but no significant effecton the number of DPM/h-1 was found. This is in contrast to that reported by (Pierpoint and Baines,

16
2000), who found that tide had a strong influence on harbor porpoise activity at some Welsh coastalsites. However, a longer dataset is required to determine whether this relationship is consistentthroughout the year or perhaps due to the seasonal occurrence of potential prey.
When compared with data from Roaringwater Bay cSAC (Leeney, 2007) the mean DPM/h-1 wasgreater at the Blaskets when compared with sites off Long and Calf Islands. However the mean valuefor Sherkin island was much greater than both sites in the Blaskets (Table 10). When the mean DPM/h-
1 from the Blasket Islands was compared with Galway Bay (O’Brien, J. unpublished data) from thesame month there was a large difference in this acoustic index. However, there was less of a differencewhen these data are compared to Clew Bay in County Mayo (Table 10).
Table 10: Comparison between acoustic indices from similar studies in Irish waters
County General area Location Deploymentduration
Mean DPMper hour
Reference
Kerry Blasket Islands Wildbank 29d 1.99 This studyKerry Blasket Islands Inishtooskert 29d 1.04 This studyGalway Galway Bay Spiddal 22d 0.20 O’Brien (unpubl.)Mayo Clare Island Clare Island 93d 0.68 O’Brien (unpubl.)Cork Roaringwater Bay Calf Islands 66d 0.63 Leeney (2007)Cork Roaringwater Bay Sherkin Island 71d 3.58 Leeney (2007)Cork Roaringwater Bay Long Island 55d 0.23 Leeney (2007)
In this study we present a brief acoustic snapshot of harbour porpoise activity in the Blaskets cSAC.The results have shown that detection rates were high when compared with other sites in Ireland. Italso demonstrates how the harbour porpoise activity can vary considerably between sites. Wildbankhad higher acoustic detections and was used more during the day. Results suggest this site may be animportant foraging area during the day and night when compared with Inishtooskert. Higher detectionrates at night have been reported elsewhere (Pierpoint, 2001; Carlstrom, 2005) which were alsoattributed to availability of prey items, and the fact that harbor porpoises used their echolocation toexplore the environment at greater distances during darkness.
A long-term monitoring scheme in this area would greatly increase our knowledge of the use and anyseasonal variations in abundance or behaviour within the cSAC. Given the strong influence of sea-stateon visual surveys a long-term monitoring programme involving extensive use of SAM may be thepreferred option. This would be very beneficial during winter months, when sea conditions rarelysupport boat-based observations. Having a long-term acoustic dataset from a cSAC would provide agood reference for other sites where acoustic monitoring may take place during assessment for futuredesignations.
It was hoped that a larger acoustic dataset would have been generated over the study period.Calibration trials planned for the end of the survey could not be carried out due to equipment loss. It issuggested that future deployment of acoustic equipment in this area should consider the use of verylarge chained moorings, with navigation lights and marine notices to minimise interference. The use ofacoustic release systems should be considered, thereby eliminating the use of surface mooring-buoys.This could prove especially beneficial in areas where trawling does not take place.

17
Conclusion
The EC Habitats Directive states a site which “corresponds to the ecological requirements of thespecies” may be designated as a Special Area of Conservation (SAC). The Directive states that theselection of sites eligible for identification as of Community importance are those “for aquatic specieswhich range over wide areas, such sites shall be proposed only where there is a clearly identifiablearea representing the physical and biological factors essential to their life and reproduction”. It hasproved difficult for member states to identify sites based on these criteria due to insufficient data andother criteria have been proposed. Elevated population density (in relation to neighbouring areas) is oneof the recent criteria recommended for SAC selection according to Johnston et al., (2002).
This study shows densities of harbour porpoise within the Blasket Islands cSAC were high relative toother areas, which supports its designation as a candidate Special Area of Conservation. Theseelevated density estimates are supported by acoustic data, which although limited, suggests acousticdetection rates are also high compared to other sites in Ireland.
The limited time-series presented here (3 months, July-September) suggests there could be a strongseasonal component to the abundance of harbour porpoise within the Blasket Islands cSAC. Werecommend this factor is fully investigated through a replicated, seasonally stratified, samplingprogramme for at least one year. Simultaneous acoustic monitoring should also be carried out. As partof the recently funded Marine Institute SeaChange Marine Megafauna Research Project it is planned toacquire two years of acoustic data from within the Blasket Islands cSAC through the use of staticacoustic monitoring. We suggest that this provides a cost-effective opportunity to fully exploreseasonal variation in porpoise abundance if visual surveys are carried out during this period. Thesewould then inform the design of a long-term monitoring protocol.
RecommendationsSighting surveys
1. Single platform sighting surveys should be carried out to establish a robust dataset from whichto inform the design of a long-term monitoring protocol. We recommend two replicatesamples within each season (16 visits) to be carried out within the next reporting round of theHabitats Directive.
2. All sighting surveys should only be carried out in sea-state 0-2 and preferably 0-1.3. Tracks should be randomized within each season to ensure good coverage of the cSAC 4. In distance analysis we recommend the track-line is used as the sample to reduce the
coefficient of variation and confidence interval.5. Ongoing land-based watches should be continued from Slea Head to compliment the
dedicated surveys and acoustic monitoring
Acoustics
With regard to passive acoustic monitoring we recommend:
1. An extensive acoustic dataset (minimum 12 months) would assist in determining seasonalchanges in detection rates and behaviour within the cSAC. This recommendation will becarried out under the Marine Institute SeaChange marine megafauna research project.
2. Site selection for Static Acoustic Monitoring (SAM) is important due to significant differencesin acoustic detections over relatively short distances.
3. The use of more sophisticated mooring systems in order to eliminate loss of gear. Acousticrelease systems could prove useful as they would eliminate the need for surface mooringbuoys, and therefore long-term deployments of gear could go unnoticed.

18
Acknowledgements
We would like to thank Michael Sheeran of Blasket Islands Ferry and Tours for his commitment toensuring the success of this survey. We would also like to thank Randall Counihan, EugeneMcKeown, Mick O’Connell and Pádraig Whooley for help in the field. We would like to thankProfessor Steve Buckland from the Centre for Research into Ecological and Environmental Monitoringat the University of St Andrews on advice on DISTANCE analysis. This survey was funded by theDepartment of Environment, Heritage and local Governments’ National Parks and Wildlife Service andwe thank Dr David Lyons for his support during this project.
References
Berrow, S. 1993. Constant effort cetacean sighting survey of Ireland. Irish Naturalists' Journal. 24(8)344.Berrow, S. D., and Rogan, E. 1997. Cetaceans stranded on the Irish coast, 1901-1995. Mammal
Review 27(1), 51-76.Berrow, S. D., Long, S.C., McGarry, A.J., Pollard, D., and Rogan, E. 1998. Radionuclides (Cs-137
and K-40) in Harbour porpoises Phocoena phocoena L. from British and Irish Waters. MarinePollution Bulletin 36(8), 569-576.
Berrow, S. D., Whooley, P. and Ferriss, S. 2002. Irish Whale and Dolphin Group Cetacean SightingReview (1991-2001). Irish Whale and Dolphin Group, 1-34.
Brazier, H., and Merne, O.J. 1989. Breeding seabirds on the Blasket Islands, Co Kerry Irish Birds 4,43-64. Buckland, S.T., Anderson, D.R., Burnham, K.P., Laake, J.L., Borchers, D.L. and Thomas, L., 2001. An
Introduction to Distance Sampling: Estimating abundance of biological populations. OxfordUniversity Press, Oxford, UK.
Carlström, J. 2005. Diel variation in echolocation behavior of wild harbor porpoises. Marine MammalSacience, 21(1); 1-12.
Hammond, P. S., Benke, H., Berggren, P., Borchers, D.L., Buckland, S.T., Collet, A., Heide-Jorgensen,M.P., Heimlich-Boran, S., Hiby, A.R., Leopold, M.F. and Oien, N. 2002. Abundance of harbourporpoise and other cetaceans in the North Sea and adjacent waters. Journal of Applied Ecology 39:361-376.
Hammond, P.S. and MacLeod, K. 2006. SCANS-II-Report on Progress. Document for ASCOBANSMeeting of Partis, Egmond aan Zee, September 2006.
Johnston, C.M., Turnbull, C.G. and Tasker, M.L., 2002. Natura 2000 in UK Offshore Waters, JNCCReport 325, ISSN 0963 8091.
Leeney, R. 2007. Distribution and abundance of harbor porpoises and other cetaceans in RoaringwarerBay, Co. Cork. Report to the National Parks and Wildlife Service, 1-23.
Leeney, R. and Tregenza, N.J.C. 2006. Static Acoustic Monitoring of Cetaceans. European CetaceanSociety Newsletter No 46 – Special Issue. July 2006.
Leopold, M. F., Wolf, P.A. and Van de Meer, J. 1992. The elusive harbour porpoise exposed, striptransect counts off southwestern, Ireland. Netherlands Journal of Sea Research 29(4), 395-402.
Møhl, B. and Anderson, S. 1973. Echolocation: high-frequency component in the click of the HarbourPorpoise (Phocoena ph. L.). Journal of the Acoustical Society of America 54(5), 1368-1372.
O'Cadhla, O., Englund, A., Philpott, E., Mackey, M. and Ingram, S. 2003. Marine mammalmonitoring in the waters of Broadhaven Bay and northwest Mayo: 2001-2002. Report toEnterprise Energy Ireland, Ltd., 1- 74.
Ó Cadhla, O., Strong, D., O’Keeffe, C., Coleman, M., Cronin, M., Duck, C., Murray, T., Dower, P.,Nairn, R., Murphy, P., Smiddy, P., Saich, C., Lyons, D. and Hiby, A.R. 2007. Grey seal breedingpopulation assessment in the Republic of Ireland: 2005. Irish Wildlife Manuals (In press). NationalParks and Wildlife Service, Department of the Environment, Heritage and Local Government,Dublin, Ireland. 50pp.
O’Crohan, T. 1978. The Islandman. Oxford: Oxford University Press. (First Published as ÓCriomhthain, T. 1929. An Toileánach. Baile Átha Cliath: Oifig an Tsoláthair).
Palka, D. 1996. Effects of Beaufort Sea State on the Sightability of Harbour Porpoises in the Gulf OfMaine. Report of the International Whaling Commission 46, 575-582.
Pierpoint, C. 2001. Harbour porpoise distribution in the coastal waters of SW Wales. UnpublishedReport to the International Fund for Animal Welfare.

19
Reid, J. B., Evans, P.G.H. and Northridge, S.P. 2003. Atlas of Cetacean distribution in north-westEuropean waters. Joint Nature Conservation Committee, 1-75.
Rogan, E. and Berrow, S.D. 1996. Review of Harbour porpoises Phocoena phocoena L. in Irishwaters. Report of the International Whaling Commission 46, 595-605.
Santos, M.B., and Pierce, G.J. (2003) The diet of Harbor porpoises (Phocoena phocoena) in theNortheast Atlantic. Oceanography and Marine Biology: An annual review 2003, 41, 355-390.
Sayers, P. 1974. Peig: The Autobiography of Peig Sayers of The Great Blasket Island. Dublin: TalbotPress. (First Published as Sayers, P. 1936. Peig. Baile Átha Cliath: Clólucht an Talbóidigh).
Smiddy, P., O’Halloran, J. and O’Mahony, B. 2000. The birds and mammals of Beginish and Young’sIsland (Blaskets), Co Kerry (1988-2001). Irish Birds 6(4), 593-596.
Smyth, M., Berrow, S.D., Nixon, E. and Rogan, E. 2000. Polychlorinated biphenyls andorganochlorines in by-caught harbour porpoises Phocoena phocoena and common dolphinsDelphinus delphis from Irish Coastal Waters. Biology and Environment. Proceedings from theRoyal Irish Academy 100B(2), 85-96.
Teilman, J. 2003. Influence of sea state on density estimates of harbour porpoises (Phocoenaphocoena). Journal of Cetacean Research and Management. 5(1), 85-92.
Tregenza, N.J.C., Berrow, S.D., Leaper, R. and Hammond, P.S. 1997. Harbour porpoise Phocoenaphocoena L. bycatch in set gill nets in the Celtic Sea. ICES Journal of Marine Science 54: 896-904.
Walton, M. J. 1997. Population structure of harbour porpoises Phocoena phocoena in the seas aroundthe UK and adjacent waters. Proceedings of the Royal Society, London B 264: 89-94.

20
Appendix I: Routes of transect lines and harbour porpoise sightings for each day in the Blasket Islands cSAC
Day 1: 16 July 2007
Day 2: 24 July 2007
Day 3: 11 August 2007
Day 4: 27 August 2007
Day 5: 11 September