Embed Size (px)
Citation preview

Abundance and generalization in mutualistic networks:
solving the chicken-and-egg dilemma
Hugo Fort1, Diego P. Vázquez2,3*, Boon Leong Lan4
1Physics Department, Faculty of Sciences, Universidad de la República, Igua 4225, Montevideo
11400, Uruguay.
2Argentine Institute for Dryland Research, CONICET, CC 507, 5500 Mendoza, Argentina.
3Faculty of Exact and Natural Sciences, National University of Cuyo, M5502JMA Mendoza,
Argentina.
4School of Engineering, Monash University, 46150 Bandar Sunway, Selangor, Malaysia.
*Corresponding author: Phone: +54-261-524-4121. E-mail: dvazquez@mendoza-
conicet.gob.ar.
Statament of authorship: H.F. conceived the study. H.F. and D.V. jointly compiled the data,
performed the analyses and wrote the paper. B.L.L. contributed to the analyses and to
the final version of the manuscript.
Running title: Abundance and generalization in mutualistic networks
Manuscript type: Letter
Manuscript statistics: Words in abstract: 137. Words in main text: 3046. Number of references:
48 (24 of which are cited only as data sources). Figures: 3. Tables: 1. Text boxes: 0.
Supplementary figures: 1.
5
10
15

Key words: causality, generalization, mutualistic networks, plant-animal interactions,
pollination, seed dispersal, specialization
2
20

Abstract: A frequent observation in plant-animal mutualistic networks is that abundant species
tend to be more generalized, interacting with a broader range of interaction partners than rare
species. Uncovering the causal relationship between abundance and generalization has been
hindered by a chicken-and-egg dilemma: is generalization a by-product of being abundant, or
does high abundance result from generalization? Here we analyze a database of plant-pollinator
and plant-seed disperser networks, and provide strong evidence that the causal link between the
abundance and generalization is uni-directional. Specifically, species appear to be generalists
because they are more abundant, but the converse, that is, that species become more abundant
because they are generalists, is not supported by our analysis. Furthermore, null model analyses
suggest that abundant species interact with many other species simply because they are more
likely to encounter potential interaction partners.
3
25
30

Introduction
Understanding the causal relationships among entities in natural systems is one of the major
philosophical and scientific challenges of all times (Pearl 2000; Shipley 2000). The challenge is
particularly great in ecology, given that ecological systems are usually driven by multiple
causality, and experimentation is not always possible (Pickett et al. 1994; Shipley 2000). The
frequent observation in plant-animal mutualistic networks that abundant species tend to be more
generalized, interacting with a broader range of interaction partners than rare species (Dupont et
al. 2003; Vázquez & Aizen 2003), is a case in point: does high generalization lead to high
abundance, or does high abundance lead to high generalization (Santamaría & Rodríguez-
Gironés 2007; Fontaine 2013)?
Solving the above chicken-and-egg dilemma has been difficult, as there are good reasons
to argue both ways. On the one hand, it is possible to argue that high generalization should lead
to high local abundance (as well as broad geographic distributions) because generalists are able
to exploit a broad range of resources, thus giving them an advantage over specialists (Brown
1984). For instance, an animal that can exploit flowers or fruits of many plant species should
attain a higher local abundance than an animal specialized on few plant species. However, the
likely trade-offs between generalization and the ability to exploit successfully any given
resource---the jack-of-all-trades is a master of none (MacArthur 1972; Krasnov et al. 2004)---
would blur the positive correlation between generalization and abundance. On the other and, it is
also possible to argue that high abundance should lead to high generalization since abundant
species would interact with many other species simply because they are more likely to encounter
potential interaction partners (Vázquez et al. 2007). In addition, abundance may lead to
4
35
40
45
50
55
5
generalization if generalized species are a collection of individuals specialized on distinct sets of
resources, so that a greater number of individuals results in a larger set of resources exploited by
the population (Araújo et al. 2011; Bolnick et al. 2011). We should also expect abundance to
determine generalization if pollinators forage optimally, because at high pollinator densities
resources should become scarcer, pushing pollinators towards greater generalization (Fontaine et
al. 2008).
Here we offer a solution to the abundance-generalization causality dilemma in plant-
animal mutualistic networks by evaluating the logical consequences of the above alternative
hypotheses. We start by classifying plant and animal species in a network into two abundance
categories (rare, R, or abundant, A) and two generalization categories (specialist, S, or generalist,
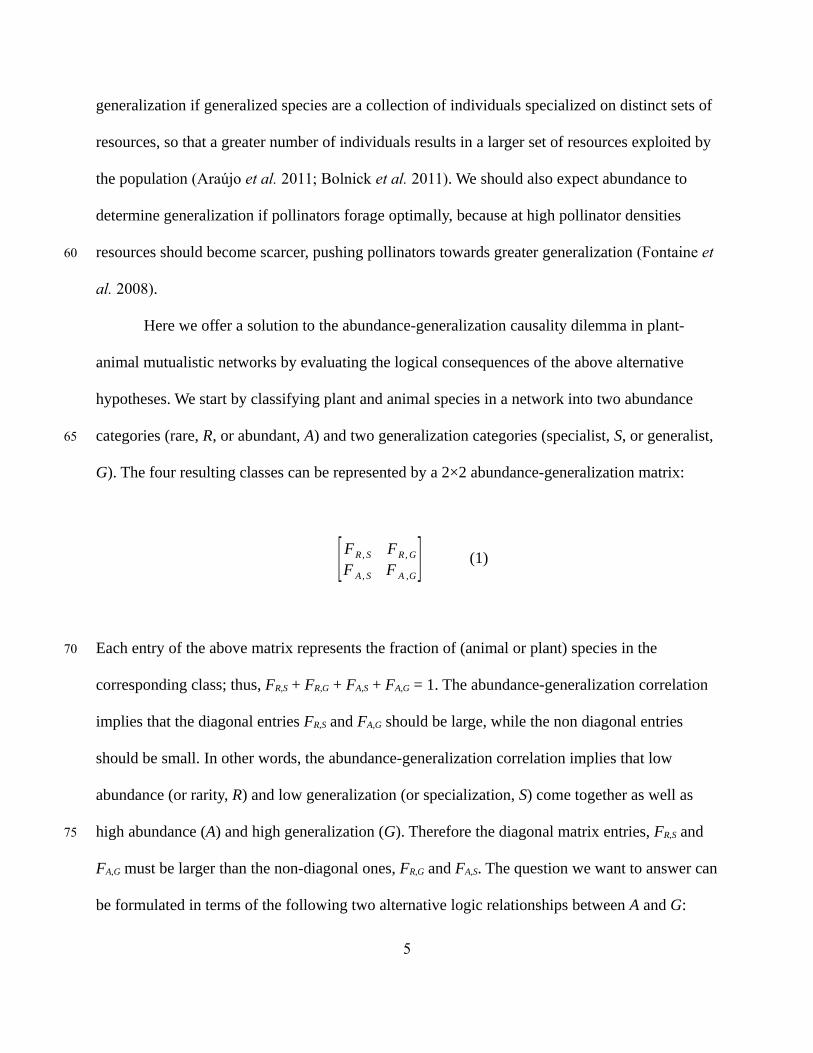
G). The four resulting classes can be represented by a 2×2 abundance-generalization matrix:
[FR, S FR, G
F A, S F A ,G] (1)
Each entry of the above matrix represents the fraction of (animal or plant) species in the
corresponding class; thus, FR,S + FR,G + FA,S + FA,G = 1. The abundance-generalization correlation
implies that the diagonal entries FR,S and FA,G should be large, while the non diagonal entries
should be small. In other words, the abundance-generalization correlation implies that low
abundance (or rarity, R) and low generalization (or specialization, S) come together as well as
high abundance (A) and high generalization (G). Therefore the diagonal matrix entries, FR,S and
FA,G must be larger than the non-diagonal ones, FR,G and FA,S. The question we want to answer can
be formulated in terms of the following two alternative logic relationships between A and G:
5
60
65
70
75

(i) If A implies G, then no abundant species can be a specialist, i.e., FA,S = 0.
(ii) If G implies A, then no generalist species can be rare, i.e., FR,G = 0.
Relationship (i) is equivalent to stating that A is a sufficient condition for G (and G is a necessary
condition for A), while relationship (ii) is equivalent to stating that G is a sufficient condition for
A (and A is a necessary condition for G).
We compiled a database on plant-pollinator and plant-seed disperser networks from local
communities around the world, and then classified species in each network as either abundant or
rare and either specialist or generalist to evaluate whether the frequencies FA,S and FR,G observed
in plant-animal mutualistic networks matched the above predictions. We also conducted a null
model analysis to assess whether the observed network patterns can be reproduced by assuming
that abundant species are more likely to encounter potential interaction partners than rare species.
Methods
Data
The data consisted in 35 quantitative bipartite mutualistic networks (22 for plant-pollinator
interactions and 13 for plant-seed disperser interactions), with broad geographic and taxonomic
spans, with link weights represented as animal visitation frequency to plants, and the abundance
of each animal or plant species in the network (Table 1).
Calculation of abundance and generalization
Abundance estimates
6
80
85
90
95

To compute the fractions of the 2×2 abundance-generalization matrix (eq. 1) for each network
we need appropriate measures of abundance and generalization. Regarding abundance, for
plants, ten of the plant-pollinator networks included estimates of plant abundance independent
from the interaction observations, from transect and quadrat sampling (see Supplementary
Information). For animals, no equivalent estimates of abundance were available for any of the
datasets; we thus estimated the abundance of each animal species from the quantitative
interaction networks by summing across the link weights (representing animal visitation
frequency to plants). These animal abundance data are arguably limited, as they are not
independent from the interactions; but these are the best data available to evaluate our question.
Furthermore, the plant data do include independent estimates of abundance, and results for those
datasets (see below) we similar to those for animals. In addition, we have used two different
measures of generalization, degree and g, for both of which we got similar results. All of this
suggests that out results are robust to the methodological limitations of the animal abundance
data.
Generalization estimates
For generalization, the simplest measure is species degree (the number of species with which a
given species interacts) (Vázquez & Aizen 2006). Since measuring generalization in this way
ignores important information about interaction frequency and availability of interaction
partners, and depends strongly on network size, we also used an alternative measure of
generalization, based on the Kullback-Leibler distance d, which overcomes some of these
limitations (Blüthgen et al. 2006). The Kullback–Leibler (K–L) distance or relative entropy is a
7
100
105
110
115
120
non-symmetric measure of the difference between two probability distributions P and Q (the K–
L divergence from P to Q is generally not the same as that from Q to P). For a given animal or
plant, P corresponds to the distribution of the interactions with each partner (respectively, plants
or animals) and Q corresponds to the overall partner availability (Blüthgen et al. 2006). We
defined g = 1-d/dmax as a standardized measure of generalization, where dmax is the natural
logarithm of the sum of all link weights in the network (i.e., the grand sum of the bipartite
interaction matrix) and is the maximum theoretically possible value for d (corresponding to the
case when two species interact exclusively with each other).
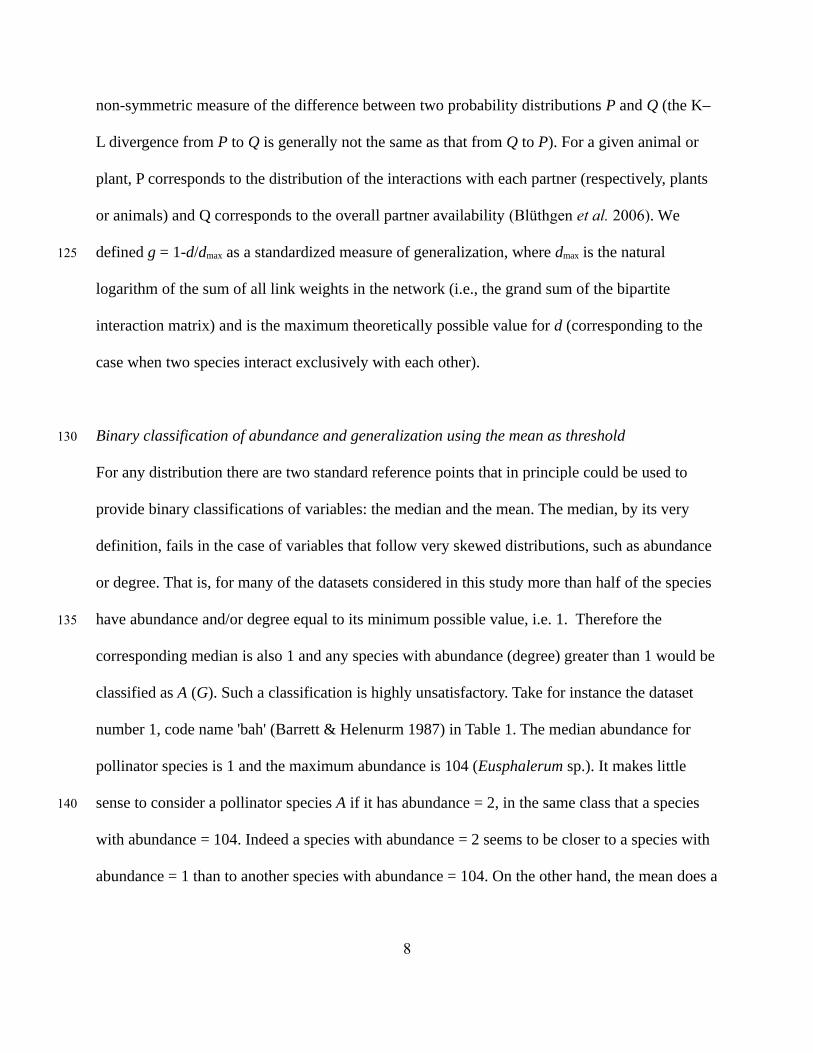
Binary classification of abundance and generalization using the mean as threshold
For any distribution there are two standard reference points that in principle could be used to
provide binary classifications of variables: the median and the mean. The median, by its very
definition, fails in the case of variables that follow very skewed distributions, such as abundance
or degree. That is, for many of the datasets considered in this study more than half of the species
have abundance and/or degree equal to its minimum possible value, i.e. 1. Therefore the
corresponding median is also 1 and any species with abundance (degree) greater than 1 would be
classified as A (G). Such a classification is highly unsatisfactory. Take for instance the dataset
number 1, code name 'bah' (Barrett & Helenurm 1987) in Table 1. The median abundance for
pollinator species is 1 and the maximum abundance is 104 (Eusphalerum sp.). It makes little
sense to consider a pollinator species A if it has abundance = 2, in the same class that a species
with abundance = 104. Indeed a species with abundance = 2 seems to be closer to a species with
abundance = 1 than to another species with abundance = 104. On the other hand, the mean does a
8
125
130
135
140

better job than the median (in the same example the mean abundance is equal to 5.4 and then A
species are those with an abundance of at least 6). Hence, we classified species in each network
as A if their abundance was equal or greater than mean abundance in the network, or R if their
abundance was lower than the mean. Similarly, for generalization, we classified species as G if
their degree or g was at or above the mean, and S if their degree or g was below the mean.
Fuzzy logic classification of abundance and generalization
Relying on a sharp threshold for defining categories may be problematic, as most so-called
opposites—tall or short, hot or cold, etc.—are not separated by a sharp line; instead, they are
ends of a continuum that involves subtle shadings. A useful alternative for classifying things or
properties for which there is a degree of vagueness or context dependence that cannot be
properly expressed with clear-cut classes is the fuzzy logic formalism (Zadeh 1965). We have
conducted a fuzzy logic analysis, which leads to the same qualitative conclusions we reached
using the simpler and more drastic classification with the mean as threshold. Fuzzy logic uses
fuzzy sets or classes, which are generalizations of the conventional sets or 'crisp' sets. A
conventional set or class C can be defined by a membership function PC(x) that specifies whether
an element x belongs to C or not. If an element x belongs to C then PC(x) = 1 while if it does not
belong to C then PC(x) = 0. In contrast, a fuzzy set or class F is defined through a membership
function PF(x) that is not binary; rather it varies from 0 to 1. For example, a fuzzy set,
representing a fuzzy concept such as 'tall', can be defined by assigning to each possible element
within a certain domain (e.g., all the people in a country) a membership grade between 0 and 1
9
145
150
155
160
10

that denotes the extent to which that element belongs to the fuzzy set (i.e., the extent to which
that particular individual is tall).
Thus, we considered the following less drastic fuzzy classification: a species is in the
lower class L (S or R), with membership grade = 1, if its property x (generalization or abundance,
respectively) is below or equal to the mean minus one standard deviation of this quantity, μX−σX
. In a completely equivalent way, a species is in the upper class U (G or A), with membership
grade = 1, if its corresponding property is above the mean plus one standard deviation, μX +σX .
Those species in-between μ X−σX and μX +σX have a membership grade to class L (S or R) that
is given by a linear membership function PL(x) interpolating between 0, for x=μX+σX , and 1,
for x=μX−σX . [In some of the plant-animal networks considered in our study μX−σX was
below the minimum possible value for the variable x (i.e., xmin = 1 for the degree and the
abundance and xmin = 0 for the index g). In such cases we took for the threshold delimiting the
class L the maximum between μ X−σX and xmin.]
To obtain the corresponding four fuzzy logic fractions of the 2×2 abundance-
generalization matrix it remains to specify how to compute the membership function of the
complements of classes R and S, i.e., A and G respectively, as well as the membership function
for the intersections R∩S, R∩G, A∩S, and A∩G. As membership function of the complement FC
of a fuzzy set F (e.g., G in the case of S, A in the case of R) the natural and most widely used
function is the additive complement, PF C
(x)=1−PF(x ) . There are many functions that can
be used to compute the intersection of fuzzy sets (Zimmermann 2010). We used as membership
function for the intersection of two fuzzy sets F and F', F∩F', the product, which is one of the
10
165
170
175
180

most widely used functions (Zimmermann 2010): PF∩F '(x )=PF
(x )×PF '(x) . Therefore, the
four fractions of the 2×2 abundance-generalization matrix become:
FR , S≡PR∩S (x)=PR(x )×PS (x) , FR ,G≡PR∩G(x )=PR (x)×PG(x) ,
FA , S≡PA∩S(x )=PA(x )×PS (x) , and FA ,G≡PA∩G( x)=PA (x)×PG(x) .
Null model analysis
We compared the frequency of occurrence of species in the 2×2 abundance-generalization matrix
(eq. 1) with those predicted by a null model that assumes neutrality of interactions (Vázquez et
al. 2009b), so that individuals interact randomly, regardless of their taxonomic identity. The null
model generated 1000 randomized plant-animal interaction matrices for each dataset by
assigning interactions according to an interaction probability matrix N constructed by
multiplying the relative abundances of each pair of plant and animal species in the network, with
the only constraint that each species had at least one interaction (see Vázquez et al. 2009b for
details).
Results
We started by confirming the abundance-generalization correlation for pollinators, seed
dispersers and plants in our database. Fig. 1 shows a highly positive correlation for most datasets.
We then evaluated the frequency of occurrence of species in the 2×2 abundance-
generalization matrix (eq. 1) to evaluate the predictions of logic relationships (i) and (ii) (see
Introduction). Virtually no species were both abundant and specialized (i.e., FA,S close to zero),
11
185
190
195
200
205

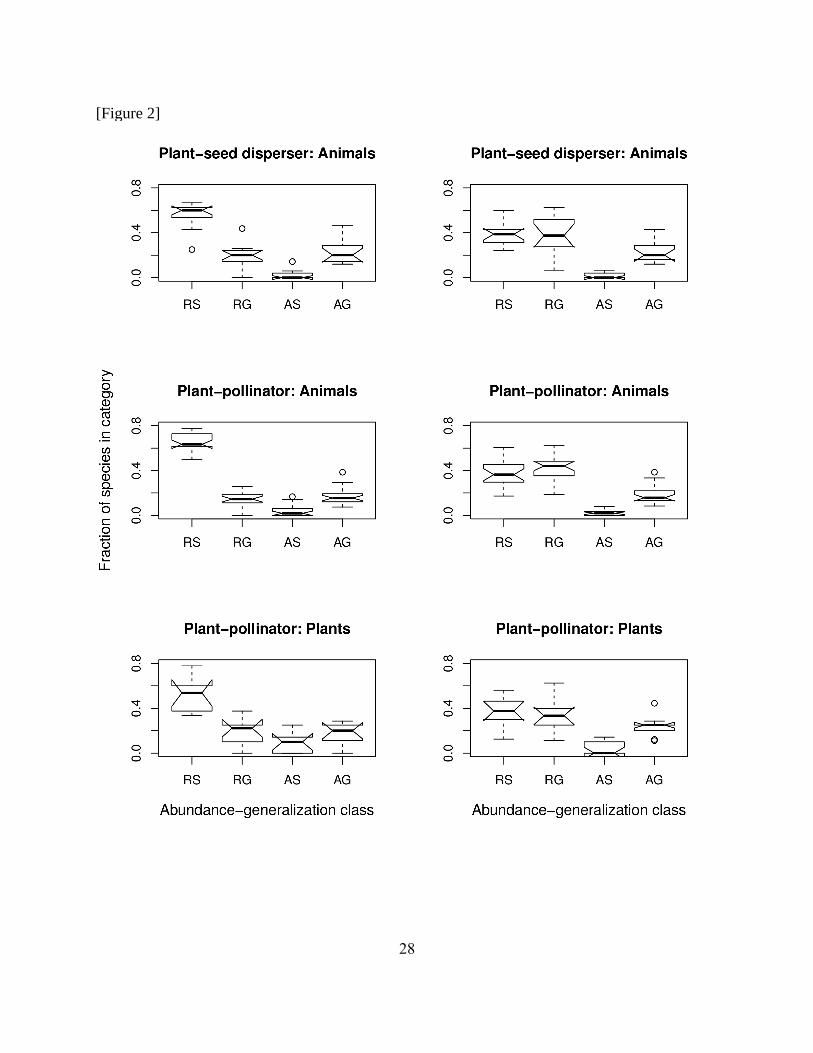
when using both degree (Fig. 2, left column) and, especially, g (Fig. 2, right column) as measures
of generalization, matching the expectation of logic relationship (i) (A implies G). Conversely,
the frequency of rare and generalized species was high, substantially higher than zero (i.e., FR,G
>> 0) for both degree and g (Fig. 2), which does not match the expectation of logic relationship
(ii) (G implies A).
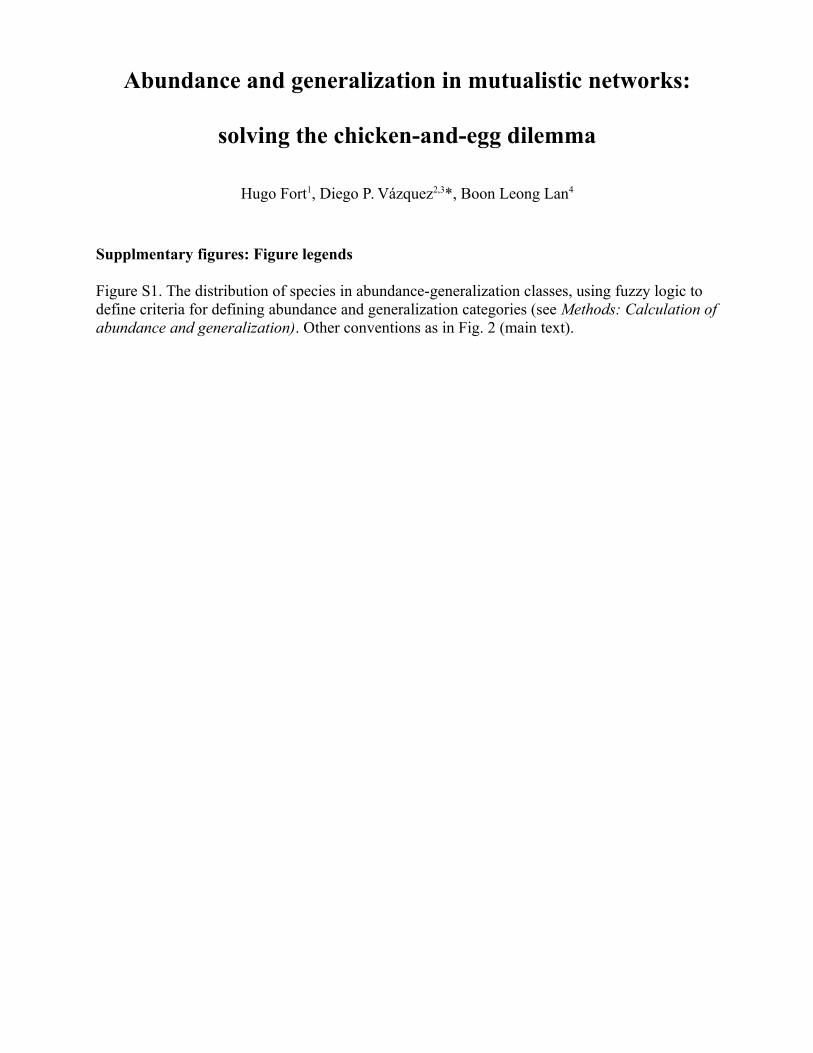
The above results were based on a classification of species into abundance and
generalization categories using the mean of these variables as the threshold for classification.
Using the abundance and generalization classification based on fuzzy logic (see Methods:
Calculation of abundance and generalization), results were qualitatively similar to those
obtained using the mean as threshold, especially for g as our measure of generalization, which, as
we argued above (see Methods: Calculation of abundance and generalization), is a better
measure of generalization than the degree (Fig. S1).
Given the above results, the simplest interpretation of the pervasive abundance-
generalization correlation in mutualistic networks is that abundant species are engaged in
generalized interactions simply because they are more likely to encounter potential interaction
partners (Vázquez et al. 2007). To evaluate this conjecture we compared the observed
frequencies in the 2×2 abundance-generalization matrix (eq. 1) with the frequencies predicted by
the null model that assumes random interactions among individuals. The predictions of the null
model match closely the observed frequencies of occurrence in the 2×2 matrix for a majority of
datasets (Fig. 3).
Discussion
12
210
215
220
225

Our analysis provides strong support for the hypothesis that abundance implies generalization,
while generalization does not appear to imply high abundance. Thus, high abundance is a
sufficient (but not a necessary) condition for generalization, while generalization is a necessary
(but not sufficient) condition for a species to be abundant. Furthermore, our null model analysis
indicates that the simplest interpretation of the pervasive correlation between abundance and
generalization in mutualistic networks is that abundant species are engaged in generalized
interactions simply because they are more likely to encounter potential interaction partners.
Based on these results, can we make a statement about the causal relationship between
abundance and generalization? It is well known that, given two propositions p and q, logical
implications of the kind “p implies q” do not imply cause and effect; in other words, we can infer
that “A implies G,” but not that “A causes G”. Cause-and-effect assertions are predictive
hypotheses that cannot be proved by statistical analysis, only disproved (Panik 2012). In that
sense, our findings provide evidence against the proposition that generalization causes
abundance, suggesting then that abundance causes generalization. In other words, if there is a
causal relationship between abundance and generalization, abundance is what causes
generalization, not the other way around.
When studying the structure of ecological interaction networks, it is important to bear in
mind that the observed structure may partly result from sampling artifacts (Vázquez et al.
2009a). However, this is an unlikely explanation of our finding of FA,S ≈ 0, as such artifacts come
from the lack of information for links involving rare species (Blüthgen 2010) rather than
abundant species. Missing interaction links for rare species would not affect FA,S; it would,
instead, lead to an underestimation of FR,G. Therefore, increased sampling effort should lead to a
13
230
235
240
245
250

larger FR,G, thus reinforcing our conclusion. Furthermore, as we mentioned above (see Methods,
Calculation of abundance and generalization), using the sum of interaction weights as a proxy of
the abundances of pollinators and seed dispersers is arguably limited. However, since for the
datasets available for our study there were no independent measurements of abundances for
animals, these are the best estimates one can obtain. In any event, for plants, for which we did
have estimates of abundances independent from visits, the results are similar to those for
animals, confirming the general trend we found. Our findings also seem independent of the
classification scheme of species into abundance and generalization categories (the binary and
fuzzy logic classifications). Thus, it seems unlikely that our findings are just an artifact of the
limitations of the abundance data for animals.
Our study sheds light on a long-standing causality dilemma between abundance and
generalization in plant-animal mutualistic networks, with important implications for the
ecological and evolutionary dynamics of these ecological systems. Furthermore, the reasoning
used here, which is based on first principles of logical inference, could be applied to address
similar causality problems in ecology. For example, for many ecological relationships, such as
the relationship between species diversity and disturbance (Hughes 2010), it is unclear whether
effects are uni or bi-directional, and to what extent feedbacks influence dynamics (Agrawal et al.
2007). Our approach could be used to offer solutions to such causality dilemmas.
Acknowledgments
14
255
260
265
270
15
HF was supported in part by PEDECIBA-Uruguay and ANII (SNI), DVP by FONCYT (PICT-
2010-2779), and BLL by TWAS-Unesco as an Associate in the Physics Dept., Universidad de la
República. We thank Nicolás Pérez for discussions on fuzzy logic algorithms, and Ignasi
Bartomeus, Nico Blüthgen, James H. Brown, Jimena Dorado, Colin Fontaine, Rodrigo Ramos-
Jiliberto, Rachael Winfree and two anonymous reviewers for helpful comments on the
manuscript.
References
1.
Agrawal, A.A., Ackerly, D.D., Adler, F., Arnold, A.E., Cáceres, C., Doak, D.F., et al. (2007).
Filling key gaps in population and community ecology. Front. Ecol. Environ., 5, 145–152.
2.
Araújo, M.S., Bolnick, D.I. & Layman, C.A. (2011). The ecological causes of individual
specialisation. Ecol. Lett., 9, 948–958.
3.
* Baird, J.W. (1980). The selection and use of fruit by birds in an eastern forest. Wilson Bull., 92,
63–73.
4.
* Barrett, S.C.H. & Helenurm, K. (1987). The reproductive biology of boreal forest herbs. I.
Breeding systems and pollination. Can. J. Bot., 65, 2036–2046.
5.
* Beehler, B. (1983). Frugivory and polygamy in birds of paradise. The Auk, 100, 1–12.
15
275

6.
* Bezerra, E.L.S., Machado, I.C. & Mello, M.A.R. (2009). Pollination networks of oil-flowers: a
tiny world within the smallest of all worlds. J. Anim. Ecol., 78, 1096–1101.
7.
Blüthgen, N. (2010). Why network analysis is often disconnected from community ecology: A
critique and an ecologist’s guide. Basic Appl. Ecol., 11, 185–195.
8.
Blüthgen, N., Menzel, F. & Blüthgen, N. (2006). Measuring specialization in species interaction
networks. BMC Ecol., 6, 9–9.
9.
Bolnick, D.I., Amarasekare, P., Araújo, M.S., Bürger, R., Levine, J.M., Novak, M., et al. (2011).
Why intraspecific trait variation matters in community ecology. Trends Ecol. Evol., 26, 183–192.
10.
Brown, J.H. (1984). On the relationship between abundance and distribution of species. Am.
Nat., 124, 255–279.
11.
* Carlo, T.A., Collazo, J.A. & Groom, M.J. (2003). Avian fruit preferences across a Puerto Rican
forested landscape: pattern consistency and implications for seed removal. Oecologia, 134, 119–
131.
12.
Crawley, M.J. (2007). The R Book. Wiley-Blackwell.
16

13.
* Dicks, L.V., Corbet, S.A. & Pywell, R.F. (2002). Compartmentalization in plant–insect flower
visitor webs. J. Anim. Ecol., 71, 32–43.
14.
* Dupont, Y.L., Hansen, D.M. & Olesen, J.M. (2003). Structure of a plant-flower-visitor network
in the high-altitude sub-alpine desert of Tenerife, Canary Islands. Ecography, 26, 301–310.
15.
Fontaine, C. (2013). Ecology: Abundant equals nested. Nature, 500, 411–412.
16.
Fontaine, C., Collin, C.L. & Dajoz, I. (2008). Generalist foraging of pollinators: diet expansion
at high density. J. Ecol., 96, 1002–1010.
17.
* Frost, P.G.H. (1980). Fruit-frugivore interactions in a South African coastal dune forest. In:
Acta XVII Congresus Internationalis Ornithologici. Presented at the Deutsches Ornithologische
Gessenshaft, Berlin, pp. 1179–1184.
18.
* Galetti, M. & Pizo, M.A. (1996). Fruit eating by birds in a forest fragment in southeastern
Brazil. Rev. Bras. Ornitol., 4, 71–79.
19.
Hughes, A. (2010). Disturbance and diversity: An ecological chicken and egg problem. Nat.
Educ. Knowl., 3, 48.
17

20.
* Inouye, D.W. & Pyke, G.H. (1988). Pollination biology in the Snowy Mountains of Australia:
Comparisons with montane Colorado, USA. Aust. J. Ecol., 13, 191–205.
21.
* Jordano, P. (1985). El ciclo anual de los Paseriformes frugívoros en el matorral mediterráneo
del sur de España: importancia de su invernada y variaciones interanuales. Ardeola, 32, 69–94.
22.
* Kato, M., Makutani, T., Inoue, T. & Itino, T. (1990). Insect-flower relationship in the primary
beech forest of Ashu, Kyoto: an overview of the flowering phenology and seasonal pattern of
insect visits. Contr Biol Lab Kyoto Univ, 27, 309–375.
23.
Krasnov, B.R., Poulin, R., Shenbrot, G.I., Mouilliot, D. & Khokhlova, I.S. (2004). Ectoparasitic
Jack-of-all-trades: relationship between abundance and host specificity in fleas (Siphonaptera)
parasitic on small mammals. Am. Nat., 164, 506–516.
24.
MacArthur, R.H. (1972). Geographical Ecology. Princeton University Press, Princeton.
25.
* Memmott, J. (1999). The structure of a plant-pollinator food web. Ecol. Lett., 2, 276–280.
26.
* Mosquin, T. & Martin, J.E.H. (1967). Observations on the pollination biology of plants on
Melville Island, N.W.T., Canada. Can. Field Nat., 81, 201–205.
18

27.
* Motten, A.F. (1982). Pollination ecology of the spring wildflower community in the deciduous
forests of piedmont North Carolina. Duke University.
28.
* Motten, A.F. (1986). Pollination ecology of the spring wildflower community of a temperate
deciduous forest. Ecol. Monogr., 56, 21–42.
29.
* Noma, N. (1997). Annual fluctuations of sap fruits production and synchronization within and
inter species in a warm temperate forest on Yakushima Island, Japan. Tropics, 6, 441–449.
30.
* Olesen, J.M., Bascompte, J., Dupont, Y.L., Elberling, H., Rasmussen, C. & Jordano, P. (2010).
Missing and forbidden links in mutualistic networks. Proc. R. Soc. Lond. B Biol. Sci.,
rspb20101371.
31.
* Olesen, J.M., Eskildsen, L.I. & Venkatasamy, S. (2002). Invasion of pollination networks on
oceanic islands: importance of invader complexes and endemic super generalists. Divers.
Distrib., 8, 181–192.
32.
* Ollerton, J., Johnson, S.D., Cranmer, L. & Kellie, S. (2003). The pollination ecology of an
assemblage of grassland asclepiads in South Africa. Ann. Bot., 92, 807–834.
33.
Panik, M.J. (2012). Statistical Inference: A Short Course. John Wiley & Sons.
1920

34.
Pearl, J. (2000). Causality: Models, Reasoning, and Inference. Cambridge University Press.
35.
Pickett, S.T.A., Kolasa, J. & Jones, C.G. (1994). Ecological Understanding. Academic Press.
36.
Santamaría, L. & Rodríguez-Gironés, M.A. (2007). Linkage rules for plant-pollinator networks:
trait complementarity or exploitation barriers? PLoS Biol., 5, e31.
37.
* Schemske, D.W., Willson, M.F., Melampy, M.N., Miller, L.J., Verner, L., Schemske, K.M., et
al. (1978). Flowering ecology of some spring woodland herbs. Ecology, 59, 351–366.
38.
Shipley, B. (2000). Cause and Correlation in Biology: A User’s Guide to Path Analysis,
Structural Equations and Causal Inference. Cambridge University Press.
39.
* Small, E. (1976). Insect pollinators of the Mer Bleue peat bog of Ottawa. Can. Field Nat., 90,
22–28.
40.
* Snow, B.K. & Snow, D.W. (1971). The feeding ecology of tanagers and honeycreepers in
trinidad. The Auk, 88, 291–322.
41.
Vázquez, D.P. & Aizen, M.A. (2003). Null model analyses of specialization in plant-pollinator
interactions. Ecology, 84, 2493–2501.
20

42.
Vázquez, D.P. & Aizen, M.A. (2006). Community-wide patterns of specialization in plant-
pollinator interactions revealed by null-models. In: Plant-pollinator interactions: from
specialization to generalization (eds. Waser, N.M. & Ollerton, J.). University of Chicago Press,
pp. 200–219.
43.
Vázquez, D.P., Blüthgen, N., Cagnolo, L. & Chacoff, N.P. (2009a). Uniting pattern and process
in plant-animal mutualistic networks: a review. Ann. Bot., 103, 1445–1457.
44.
Vázquez, D.P., Chacoff, N.P. & Cagnolo, L. (2009b). Evaluating multiple determinants of the
structure of plant--animal mutualistic networks. Ecology, 90, 2039–2046.
45.
Vázquez, D.P., Melián, C.J., Williams, N.M., Blüthgen, N., Krasnov, B.R. & Poulin, R. (2007).
Species abundance and asymmetric interaction strength in ecological networks. Oikos, 116,
1120–1127.
46.
* Vázquez, D.P. & Simberloff, D. (2003). Changes in interaction biodiversity induced by an
introduced ungulate. Ecol. Lett., 6, 1077–1083.
47.
Zadeh, L. (1965). Fuzzy Sets. Inf. Control, 8, 338–353.
48.
Zimmermann, H.-J. (2010). Fuzzy set theory. Wiley Interdiscip. Rev. Comput. Stat., 2, 317–332.
21

22

Table 1. Datasets used in the study.
Dataset no. Dataset code Interaction.type Location No. animal species No. plant species Ref.*1 bah Plant-pollinator Central New Brunswick, Canada 102 12 12 bez Plant-pollinator Pernambuco State, Brazil 13 13 23 dih Plant-pollinator Hickling, Norfolk, UK 61 17 34 dis Plant-pollinator Shelfanger, Norfolk, UK 36 16 35 ino Plant-pollinator Snowy Mountains, Australia 85 42 46 kat Plant-pollinator Ashu, Kyoto, Japan 679 91 57 mem Plant-pollinator Bristol, England 79 25 68 mos Plant-pollinator Melville Island, Canada 18 11 79 mot Plant-pollinator North Carolina, USA 44 13 810 ole Plant-pollinator Mauritian Ile aux Aigrettes 13 14 911 oll Plant-pollinator KwaZulu-Natal region, South Africa 56 9 1012 sch Plant-pollinator Brownfield, Illinois, USA 32 7 1113 sma Plant-pollinator Ottawa, Canada 34 13 1214 vag Plant-pollinator Arroyo Goye, neighborhood of Nahuel
Huapi National Park, Argentina29 10 13
15 vcl Plant-pollinator Cerro López, neighborhood of Nahuel Huapi National Park, Argentina
33 9 13
16 vll Plant-pollinator Llao-Llao Municipal Reserve, Bariloche, Argentina
29 10 13
17 vmn Plant-pollinator Lago Mascardi, Nahuel Huapi National Park, Argentina
26 8 13
18 vmh Plant-pollinator Lago Mascardi, Nahuel Huapi National Park, Argentina
35 8 13
19 vqh Plant-pollinator Península Quetrihué, Nahuel Huapi National Park, Argentina
27 8 13
20 vqn Plant-pollinator Península Quetrihué, Nahuel Huapi National Park, Argentina
24 7 13
21 vsa Plant-pollinator Península Quetrihué, Nahuel Huapi National Park, Argentina
27 9 13
22 vvi Plant-pollinator Villavicencio Nature Reserve, Mendoza, 97 41 14

Argentina23 bai Plant-seed disperser Princeton, Mercer, New Jersey, USA 21 7 1524 bee Plant-seed disperser Mount Missim, Morobe Prov, New Guinea 9 31 1625 ccg Plant-seed disperser Caguana, Puerto Rico 16 25 1726 cci Plant-seed disperser Cialitos, Puerto Rico 20 34 1727 cco Plant-seed disperser Cordillera, Puerto Rico 13 25 1728 cfr Plant-seed disperser Fronton, Puerto Rico 15 21 1729 fro Plant-seed disperser Mtunzini, South Africa 10 16 1830 ge1 Plant-seed disperser Santa Genebra Reserve T1 SE, Brazil 18 7 1931 ge2 Plant-seed disperser Santa Genebra Reserve T2 SE, Brazil 29 35 1932 hra Plant-seed disperser Hato Ratón, Sevilla Spain 17 16 2033 nco Plant-seed disperser Nava Correhuelas S Cazorla, SE Spain 33 25 2134 sap Plant-seed disperser Yakushima Island, Japan 8 15 2235 sno Plant-seed disperser Tropical rainforest, Trinidad 14 50 23
* Dataset references: 1, Barrett & Helenurm (1987); 2, Bezerra et al. (2009); 3, Dicks et al. (2002); 4, Inouye & Pyke (1988); 5, Kato et al. (1990); 6, Memmott (1999); 7, Mosquin & Martin (1967); 8, Motten (1982, 1986); 9, Olesen et al. (2002); 10, Ollerton et al. (2003); 11, Schemske et al. (1978); 12, Small (1976); 13, Vázquez & Simberloff (2003); 14, Vázquez et al. (2009b); 15, Baird (1980); 16, Beehler (1983); 17, Carlo et al. (2003); 18, Frost et al. (1980); 19, Galetti & Pizo (1996); 20, Jordano (1985); 21, Olesen et al. (2010); 22, Noma (1997); 23, Snow & Snow (1971).
280
285
25
Figure legends
Figure 1. Correlation between abundance and generalization. Plots show the distribution of
Spearman rank correlation coefficients between abundance and one of two measures of
generalization, degree or g (where g = 1 - d/dmax and d is Kullback-Leibler distance (Blüthgen et
al. 2006; see text) for pollinators (left), seed dispersers (center) and plants (right) in mutualistic
networks. In all panels, each box-and-whisker plot, the horizontal line parting each box indicates
the median, box limits are first and third distributional quartiles, whiskers extend to most
extreme data point within 1.5 times the interquartile range, and circles indicate outlying data
points.
Figure 2. The distribution of species in abundance-generalization classes. Plots show the fraction
of species in each of four abundance-generalization classes for animal species in plant-seed
disperser networks (top), and for animal (middle) and plant (bottom) species in plant-pollinator
networks, using degree (left) or g (right) as measures of generalization, using mean abundance
and generalization as thresholds for defining categories (see Fig. S1 for an alternative using
fuzzy logic). In all panels, R are rare species, A abundant species, S specialized species, and G
generalized species. In each box-and-whisker plot, the thick horizontal line parting each box
indicates the median, notches above and below indicate confidence limits of the median
(precisely 1.58 IQR / √(n) , where IQR is the interquartile range and n is the sample size),
whiskers extend to most extreme data point within 1.5 times the interquartile range, and circles
25
290
295
300
305

indicate outlying data points. Medians of boxes in which notches do not overlap are considered
to be significantly different (Crawley 2007).
Figure 3. Results of null model analyses. Each panel shows the results of the null model model
analysis of the fraction of species in each category in the 2×2 abundance-generalization matrix
(eq. 1) for each network in our dataset (indicated by dataset codes in the abcissa of each panel),
each of the two generalization measures (degree, top three panels, and g, bottom three panels),
and each group of studied species (plants and animals in plant-pollinator networks and animals in
plant-seed disperser networks). For each network, observed fractions are represented by empty
circles, and 95% confidence intervals of null model fractions are represented by error bars. Thus,
an overlap between a circle and an error bar means no significant differences between observed
and predicted fractions. For each category in the 2×2 matrix the ordinates are scaled between 0
and 1.
26
310
315
320

[Figure 1]
27
[Figure 2]
28

[Figure 3]
A B
C
330
30

[Figure 3, continued]
D E
F
335
Abundance and generalization in mutualistic networks:
solving the chicken-and-egg dilemma
Hugo Fort1, Diego P. Vázquez2,3*, Boon Leong Lan4
Supplmentary figures: Figure legends
Figure S1. The distribution of species in abundance-generalization classes, using fuzzy logic to define criteria for defining abundance and generalization categories (see Methods: Calculation ofabundance and generalization). Other conventions as in Fig. 2 (main text).

RS RG AS AG
0.0
0.4
0.8
Plant−seed disperser: Animals
●●
●●
●●
RS RG AS AG
0.0
0.4
0.8
Plant−pollinator: Animals
Fra
ctio
n of
spe
cies
in c
ateg
ory
RS RG AS AG
0.0
0.4
0.8
Plant−pollinator: Plants
Abundance−generalization class
●
RS RG AS AG
0.0
0.4
0.8
Plant−seed disperser: Animals
●●
●
●●
RS RG AS AG
0.0
0.4
0.8
Plant−pollinator: Animals
RS RG AS AG
0.0
0.4
0.8
Plant−pollinator: Plants
Abundance−generalization class


![Mutualistic Growth of the SulfateReducer Desulfovibrio ...digital.csic.es/bitstream/10261/79980/1/Mutualistic growth of the... · Meyerhof–Parnas pathway [9, 10], the degradation](https://img.pdfslide.us/doc/110x75/5e68148dbef0cd325b1073c5/mutualistic-growth-of-the-sulfatereducer-desulfovibrio-growth-of-the-meyerhofaparnas.jpg)