Embed Size (px)
Citation preview

Freshwater Biology (1996) 36, 385–396
Abundance and distribution within a guild of benthicstream fishes: local processes and regional patterns
C H R I S T O P H E R M . T AY L O RDepartment of Zoology and Oklahoma Biological Survey, University of Oklahoma, Norman, OK 73019, U.S.A.
Present address: Department of Biological Sciences, Mississippi State University, Mississippi State, MS 39762, U.S.A.
S U M M A R Y
1. Spatial patterns at regional and local scales were examined for evidence that speciesinteractions can influence distribution and abundance within a guild of benthic fishes inupland streams of Oklahoma, U.S.A. Three groups of community patterns wereexamined: the species–area relationship, species–habitat associations, and interspecificassociations.2. The species–area relationship for riffle habitats was compared to a null species–areamodel based on random placement. The observed species–area curve was steeperresulting in less species per unit area in small streams than predicted by the null model.3. Small, species-poor streams had summed fish densities at least as high as larger,species-rich streams, suggesting density compensation.4. Several significant patterns of negative covariation were found among species at theregional scale, before and after statistically accounting for effects due to measuredhabitat variables.5. For two of these negatively covarying taxa (Cottus carolinae and Etheostoma spectabile),the influence of each species on the distribution of the other was evaluatedexperimentally in field enclosures varying in depth and current velocity. The sculpinC. carolinae caused a shift in habitat use by the darter E. spectabile, but no reciprocal shiftwas found.6. These results indicate an agreement between local and regional patterns ofdistribution for C. carolinae and E. spectabile and suggest that biotic interactions caninfluence regional patterns of distribution for species within this guild.
Introduction
Regional species pools are initially determined by may result in spatial patterns evident at a varietyof scales, ranging from microhabitat segregation tohistorical processes (Ricklefs, 1987, 1989; Brown &
Maurer, 1989), but contemporary abiotic and biotic regional patterns of negative covariation or association(Connor & Bowers, 1987). While manipulative fieldfactors may then constrain regional distribution and
abundance patterns (Connor & Bowers, 1987; experiments have proven useful in detecting present-day competition at local space and time scalesSchoener, 1988; Case & Bolger, 1991). The importance
of various factors in determining distribution and (Schoener, 1983), they may or may not accuratelytranslate to larger scale community patterns (Bennett,abundance patterns depends largely on the scale of
the investigation (Wiens et al., 1986; Fausch, Nakano 1990). Small, upland streams are excellent systems fortesting questions concerning distributional ecology& Ishigaki, 1994). This scale dependence has contrib-
uted to the debate about the importance of interspecific (Angermeier & Schlosser, 1989). Habitats are easilyidentified on the basis of depth and flow, and can becompetition in communities (Connor & Bowers, 1987;
Bennett, 1990). The effects of interspecific competition sampled efficiently. A conspicuous element of the fish
© 1996 Blackwell Science Ltd 385

386 C.M. Taylor
fauna in small, upland streams of the midwesternUnited States is the taxonomically diverse guild ofbenthic, riffle-dwelling species (e.g. darters, sculpins,madtom catfishes). These species form a guild (sensuPolis, Myers & Holt, 1989) based on similarity inhabitat use (Blair, 1959; Miller & Robison, 1973;Pfleiger, 1975; Robison & Buchanan, 1988) and feedinghabits (Todd & Stewart, 1985; Hoover, 1988; Dewey,1988).
In this study empirical field collections and a manip-ulative experiment were used to test hypotheses aboutthe distribution and abundance of species in thisbenthic fish guild. First, collections from ninety-threeriffle habitats in forty-two stream reaches in north-eastern Oklahoma were examined with respect tothree groups of community patterns: the species–arearelationship, species–habitat associations, and inter-specific associations. Variation in stream size, habitatand water chemistry were considered as possiblefactors influencing the number of co-occurring speciesand densities of species, and a null species–area modelwas evaluated based on the random placement ofindividuals among sites. Three types of relationshipswere tested for, that might be expected if interspecificinteractions are an important force structuring thisguild: complementary occurrences, complementaryabundances and density compensation. Although
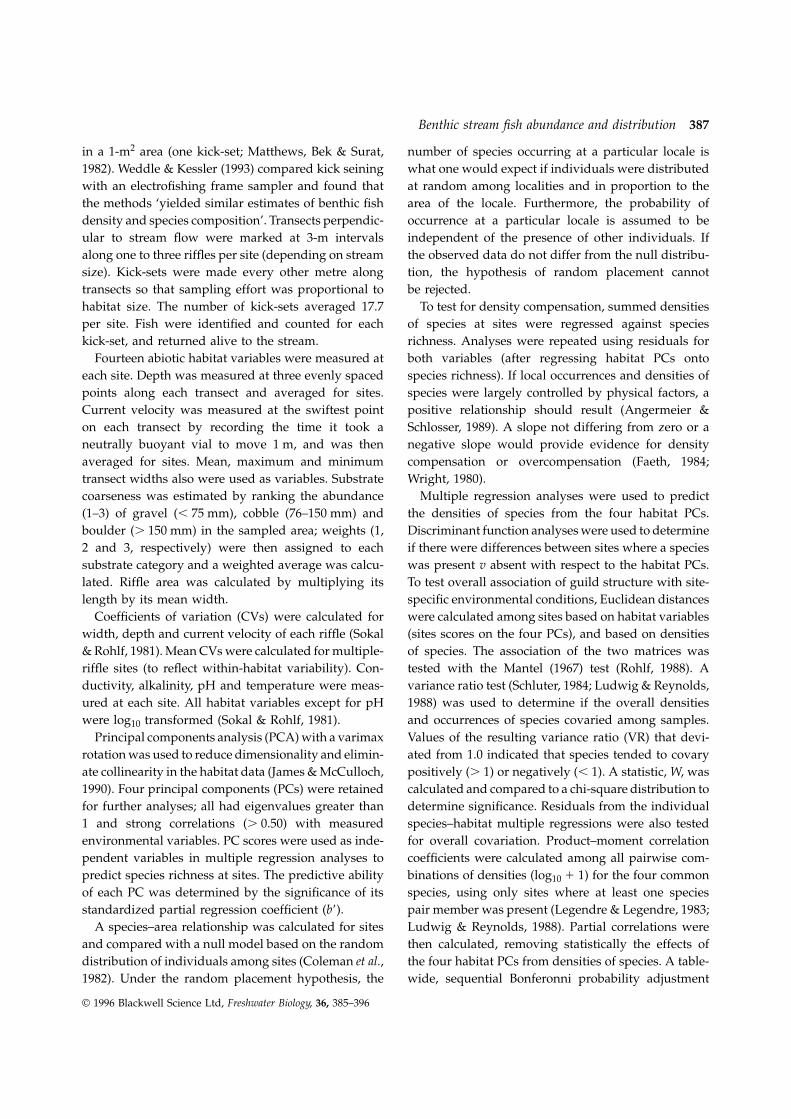
Fig. 1 Map depicting the forty-two sampled sites in the Ozarknone of these patterns explicitly identifies speciesuplift of north-eastern Oklahoma.interactions as a causal mechanism, they represent the
most convincing kind of observational evidence forall share a common fish fauna and are located in the
ongoing interaction among species (Gotelli & Abele,Ozark Biotic District (Blair & Hubbell, 1938). Thus,
1983; Schoener, 1988). Finally, a manipulative fieldthis was an appropriate scale to look at regional
experiment was used to test for local interactive segre-patterns of abundance and distribution among species.
gation patterns between two members of this guild,All sites were on small- to medium-sized, spring-fed
Etheostoma spectabile (Agassiz) and Cottus carolinaestreams (riffle width 1.3–11.3 m) with clear water and
(Gill), to see if local distribution patterns between thesegravel/cobble substrates. A guild of seven species of
two species were related to their regional distributionbenthic fishes that often co-occurred together in vari-
patterns (i.e. whether patterns of coexistence betweenous combinations in these riffles consisted of Cottus
the two species agree at local and regional scales).carolinae, Etheostoma spectabile, E. flabellare Rafinesque,E. blennioides Rafinesque, E. zonale (Cope), Noturusexilis Nelson and Percina caprodes (Rafinesque). All ofMaterials and methodsthese species feed primarily on benthic macroinverteb-
Study area and guild description rates (Todd & Stewart, 1985; Dewey, 1988; Hoover,1988).
Riffles in Ozark uplift streams in north-easternOklahoma were sampled from 24 July to 22 August
Regional-scale analyses1990 (Fig. 1). All sampled streams were in the samegeographical region, the Grand and Illinois River Riffles were sampled with a 3.2-mm mesh seine
(1.2 m 3 1.8 m) by vigorously disturbing the substratesystems of the Arkansas River drainage. These streams
© 1996 Blackwell Science Ltd, Freshwater Biology, 36, 385–396
Benthic stream fish abundance and distribution 387
in a 1-m2 area (one kick-set; Matthews, Bek & Surat, number of species occurring at a particular locale iswhat one would expect if individuals were distributed1982). Weddle & Kessler (1993) compared kick seining
with an electrofishing frame sampler and found that at random among localities and in proportion to thearea of the locale. Furthermore, the probability ofthe methods ‘yielded similar estimates of benthic fish
density and species composition’. Transects perpendic- occurrence at a particular locale is assumed to beindependent of the presence of other individuals. Ifular to stream flow were marked at 3-m intervals
along one to three riffles per site (depending on stream the observed data do not differ from the null distribu-tion, the hypothesis of random placement cannotsize). Kick-sets were made every other metre along
transects so that sampling effort was proportional to be rejected.To test for density compensation, summed densitieshabitat size. The number of kick-sets averaged 17.7
per site. Fish were identified and counted for each of species at sites were regressed against speciesrichness. Analyses were repeated using residuals forkick-set, and returned alive to the stream.
Fourteen abiotic habitat variables were measured at both variables (after regressing habitat PCs ontospecies richness). If local occurrences and densities ofeach site. Depth was measured at three evenly spaced
points along each transect and averaged for sites. species were largely controlled by physical factors, apositive relationship should result (Angermeier &Current velocity was measured at the swiftest point
on each transect by recording the time it took a Schlosser, 1989). A slope not differing from zero or anegative slope would provide evidence for densityneutrally buoyant vial to move 1 m, and was then
averaged for sites. Mean, maximum and minimum compensation or overcompensation (Faeth, 1984;Wright, 1980).transect widths also were used as variables. Substrate
coarseness was estimated by ranking the abundance Multiple regression analyses were used to predictthe densities of species from the four habitat PCs.(1–3) of gravel (, 75 mm), cobble (76–150 mm) and
boulder (. 150 mm) in the sampled area; weights (1, Discriminant function analyses were used to determineif there were differences between sites where a species2 and 3, respectively) were then assigned to each
substrate category and a weighted average was calcu- was present v absent with respect to the habitat PCs.To test overall association of guild structure with site-lated. Riffle area was calculated by multiplying its
length by its mean width. specific environmental conditions, Euclidean distanceswere calculated among sites based on habitat variablesCoefficients of variation (CVs) were calculated for
width, depth and current velocity of each riffle (Sokal (sites scores on the four PCs), and based on densitiesof species. The association of the two matrices was& Rohlf, 1981). Mean CVs were calculated for multiple-
riffle sites (to reflect within-habitat variability). Con- tested with the Mantel (1967) test (Rohlf, 1988). Avariance ratio test (Schluter, 1984; Ludwig & Reynolds,ductivity, alkalinity, pH and temperature were meas-
ured at each site. All habitat variables except for pH 1988) was used to determine if the overall densitiesand occurrences of species covaried among samples.were log10 transformed (Sokal & Rohlf, 1981).
Principal components analysis (PCA) with a varimax Values of the resulting variance ratio (VR) that devi-ated from 1.0 indicated that species tended to covaryrotation was used to reduce dimensionality and elimin-
ate collinearity in the habitat data (James & McCulloch, positively (. 1) or negatively (, 1). A statistic, W, wascalculated and compared to a chi-square distribution to1990). Four principal components (PCs) were retained
for further analyses; all had eigenvalues greater than determine significance. Residuals from the individualspecies–habitat multiple regressions were also tested1 and strong correlations (. 0.50) with measured
environmental variables. PC scores were used as inde- for overall covariation. Product–moment correlationcoefficients were calculated among all pairwise com-pendent variables in multiple regression analyses to
predict species richness at sites. The predictive ability binations of densities (log10 1 1) for the four commonspecies, using only sites where at least one speciesof each PC was determined by the significance of its
standardized partial regression coefficient (b9). pair member was present (Legendre & Legendre, 1983;Ludwig & Reynolds, 1988). Partial correlations wereA species–area relationship was calculated for sites
and compared with a null model based on the random then calculated, removing statistically the effects ofthe four habitat PCs from densities of species. A table-distribution of individuals among sites (Coleman et al.,
1982). Under the random placement hypothesis, the wide, sequential Bonferonni probability adjustment
© 1996 Blackwell Science Ltd, Freshwater Biology, 36, 385–396
388 C.M. Taylor
species treatments were used: Etheostoma spectabile andCottus carolinae alone at high and low densities, andeach species with the putative competitor. Four com-parisons were of interest: an intraspecific and inter-specific comparison for each species. Eighteenindividuals per pen were used for high density, single-species treatments and the interspecific treatments(nine of each species). This total density (24 fish m–2)was higher than average fish densities that wereactually found in eight Brush Creek riffles (8.3–
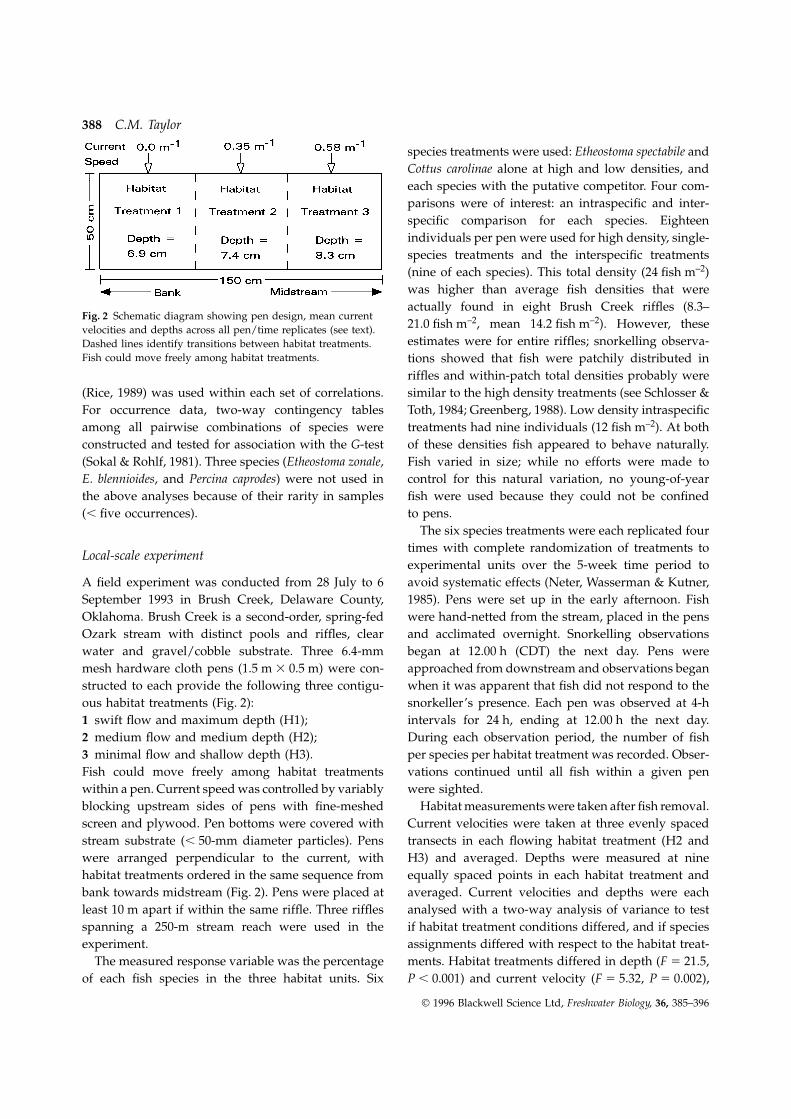
Fig. 2 Schematic diagram showing pen design, mean current21.0 fish m–2, mean 14.2 fish m–2). However, thesevelocities and depths across all pen/time replicates (see text).estimates were for entire riffles; snorkelling observa-Dashed lines identify transitions between habitat treatments.
Fish could move freely among habitat treatments. tions showed that fish were patchily distributed inriffles and within-patch total densities probably weresimilar to the high density treatments (see Schlosser &(Rice, 1989) was used within each set of correlations.
For occurrence data, two-way contingency tables Toth, 1984; Greenberg, 1988). Low density intraspecifictreatments had nine individuals (12 fish m–2). At bothamong all pairwise combinations of species were
constructed and tested for association with the G-test of these densities fish appeared to behave naturally.Fish varied in size; while no efforts were made to(Sokal & Rohlf, 1981). Three species (Etheostoma zonale,
E. blennioides, and Percina caprodes) were not used in control for this natural variation, no young-of-yearfish were used because they could not be confinedthe above analyses because of their rarity in samples
(, five occurrences). to pens.The six species treatments were each replicated four
times with complete randomization of treatments toLocal-scale experiment
experimental units over the 5-week time period toavoid systematic effects (Neter, Wasserman & Kutner,A field experiment was conducted from 28 July to 6
September 1993 in Brush Creek, Delaware County, 1985). Pens were set up in the early afternoon. Fishwere hand-netted from the stream, placed in the pensOklahoma. Brush Creek is a second-order, spring-fed
Ozark stream with distinct pools and riffles, clear and acclimated overnight. Snorkelling observationsbegan at 12.00 h (CDT) the next day. Pens werewater and gravel/cobble substrate. Three 6.4-mm
mesh hardware cloth pens (1.5 m 3 0.5 m) were con- approached from downstream and observations beganwhen it was apparent that fish did not respond to thestructed to each provide the following three contigu-
ous habitat treatments (Fig. 2): snorkeller’s presence. Each pen was observed at 4-hintervals for 24 h, ending at 12.00 h the next day.1 swift flow and maximum depth (H1);
2 medium flow and medium depth (H2); During each observation period, the number of fishper species per habitat treatment was recorded. Obser-3 minimal flow and shallow depth (H3).
Fish could move freely among habitat treatments vations continued until all fish within a given penwere sighted.within a pen. Current speed was controlled by variably
blocking upstream sides of pens with fine-meshed Habitat measurements were taken after fish removal.Current velocities were taken at three evenly spacedscreen and plywood. Pen bottoms were covered with
stream substrate (, 50-mm diameter particles). Pens transects in each flowing habitat treatment (H2 andH3) and averaged. Depths were measured at ninewere arranged perpendicular to the current, with
habitat treatments ordered in the same sequence from equally spaced points in each habitat treatment andaveraged. Current velocities and depths were eachbank towards midstream (Fig. 2). Pens were placed at
least 10 m apart if within the same riffle. Three riffles analysed with a two-way analysis of variance to testif habitat treatment conditions differed, and if speciesspanning a 250-m stream reach were used in the
experiment. assignments differed with respect to the habitat treat-ments. Habitat treatments differed in depth (F 5 21.5,The measured response variable was the percentage
of each fish species in the three habitat units. Six P , 0.001) and current velocity (F 5 5.32, P 5 0.002),
© 1996 Blackwell Science Ltd, Freshwater Biology, 36, 385–396

Benthic stream fish abundance and distribution 389
Table 1 Principal component loadings for fourteen habitatand there were no differences among speciesvariables measured from forty-two Ozark stream sites. Loadingstreatments.greater than |0.50| in bold
To test for interactive segregation, data were ana-Variable PC1 PC2 PC3 PC4lysed with a three-way ANOVA with habitat and time
(observation periods) treatments as repeated meas-Mean width 0.96 0.13 0.10 0.07ures. The three habitat treatments were treated as aMinimum width 0.95 0.12 –0.03 0.02
repeated measure because they were not independent. Maximum width 0.87 0.09 0.09 0.16Depth 0.81 0.09 –0.15 0.41Only the interaction effects involving species andCV of width –0.81 0.05 0.19 0.30habitat treatments were of interest. Interaction for aRiffle area 0.74 0.24 0.18 0.23given species would indicate a significant differenceCurrent velocity 0.70 –0.00 0.18 0.51
in habitat use between the two species treatments. CV of depth –0.66 0.13 0.27 –0.43Niche breadths (treating each habitat unit as a resource Conductivity 0.12 0.95 0.09 –0.03
Alkalinity 0.10 0.94 0.17 –0.07state) were calculated following Levins (1968) andTemperature 0.16 0.12 0.77 0.16analysed for differences among species treatmentspH 0.13 0.26 0.72 –0.39
with a two-way repeated measures ANOVA. For both Substrate 0.22 –0.01 –0.69 –0.03experimental designs, Bonferroni alpha adjustments CV of current velocity 0.19 –0.07 0.02 0.85
Per cent variance explained 39.3 14.3 13.1 12.1(Toothaker, 1991) were made based on the number ofcomparisons. For comparisons involving cell means,the Cicchetti procedure (1972) was used to makeBonferroni adjustments. positive loadings for width, depth, current velocity
and habitat area. Width and depth CVs had strongFor both species, intraspecific comparisons at thetwo densities were used to determine the appropriate negative loadings on PC1, indicating greater width and
depth variability in smaller streams. PC2 correlatedinterspecific comparisons. If no intraspecific densityeffects occurred, then the appropriate interspecific positively with alkalinity and conductivity, and PC3
had positive loadings of temperature and pH, butcomparison would be between the low-density treat-ment (nine individuals) and the nine individuals in correlated negatively with substrate size. Current vel-
ocity and the CV for current velocity loaded highlythe interspecific treatment (i.e. number of target speciesindividuals the same with or without potential com- and positively onto PC4.
Multiple regression of the log of the number ofpetition). Thus, intraspecific effects would be heldconstant, and the presence or absence of a competitor species onto the four habitat PCs showed that PC1
was the only significant predictor of species richnesswould be the only variable (Werner & Hall, 1976, 1977;Underwood, 1986). If an intraspecific effect occurred, (b9 5 0.62; P , 0.001). Thus, riffle habitats in larger
streams of the region tended to have a more diversesuch that increased density caused a change in habitatuse, then the appropriate intraspecific treatment would guild of benthic fishes. To evaluate whether this associ-
ation was simply a sampling phenomenon due tobe the high density one. Otherwise, any shift in habitatuse could be attributed to an increased density effect, larger habitats containing more individuals, the
observed species–area relationship was compared toregardless of which species was present (Maiorana,1977). Note that it is possible to make all six compar- a null species–area model based on the random distri-
bution of individuals across sites (Fig. 3). Because areaisons, but this would represent a loss of statisticalpower and result in two confounded comparisons represents the mean habitat size at sites (when more
than one riffle was sampled per site), mean values for(Underwood, 1986).species richness were used as the observed dependentvariable. The slopes were significantly different (F 5
Results 7.05, P 5 0.01) such that small sites tended to havefewer species than expected from the null modelRegional-scale analyses(Fig. 3).
When summed density was regressed onto speciesThe first four PCs accounted for 78.7% of the totalvariance among sites in the field survey data (Table 1). richness, a negative correlation was found, though it
was not quite significant (r 5 –0.28, P 5 0.069). ThisThe first axis (PC1) reflected stream size, with high
© 1996 Blackwell Science Ltd, Freshwater Biology, 36, 385–396

390 C.M. Taylor
(, 10% of the summed density), and similar resultswere obtained (r 5 –0.33, P 5 0.031).
None of the species’ densities covaried significantlywith any of the habitat PCs. This was consistent withthe result that differences in guild structure amongsites were explained only poorly by differences inhabitat (Mantel test t 5 1.48, P 5 0.07; matrixcorrelation 5 0.13). However, the occurrences of Etheo-stoma flabellare and Cottus carolinae showed significanthabitat associations (Table 2).
Before and after accounting for habitat effects, allsignificant correlations among densities of specieswere negative (Table 3). Cottus carolinae covaried nega-tively with E. spectabile and Noturus exilis, before andafter the effects of the four habitat PCs were statisticallyFig. 3 Observed species–area relationship (solid line) and
expected species–area relationship (dashed line). Expected removed (Table 3). Etheostoma spectabile and E. flabellarevalues were obtained from a null model based on random covaried before, but not after removing habitat effectsplacement of individuals across sites. Slopes are significantly
(Table 3). The variance ratio test at the guild level (alldifferent (P 5 0.01).four species) indicated overall significant negativecovariation, both among species’ densities (VR 5 0.60,W 5 25.08, P , 0.05) and among residuals of species’densities after statistically removing the environmentalcorrelation (VR 5 0.56, W 5 23.72, P , 0.05). Foroccurrence data, two-way contingency analyses andsubsequent G-tests among all pairwise combinationsof species produced no significant results. The varianceratio test for species occurrences indicated no overallassociation among species.
Local-scale experiment
No evidence for an intraspecific density effect wasfound for either species (Table 4). Thus, the appropriateinterspecific comparison was between the low densitytreatment (nine individuals) and the nine individualsin the interspecific treatment. Significant niche shifts
Fig. 4 Summed densities of species at sites v species richness due to the presence of a competitor were found only(r 5 –0.38; P , 0.017). Data are residuals after factoring out for E. spectabile. In monospecific groups E. spectabilemeasured habitat effects.
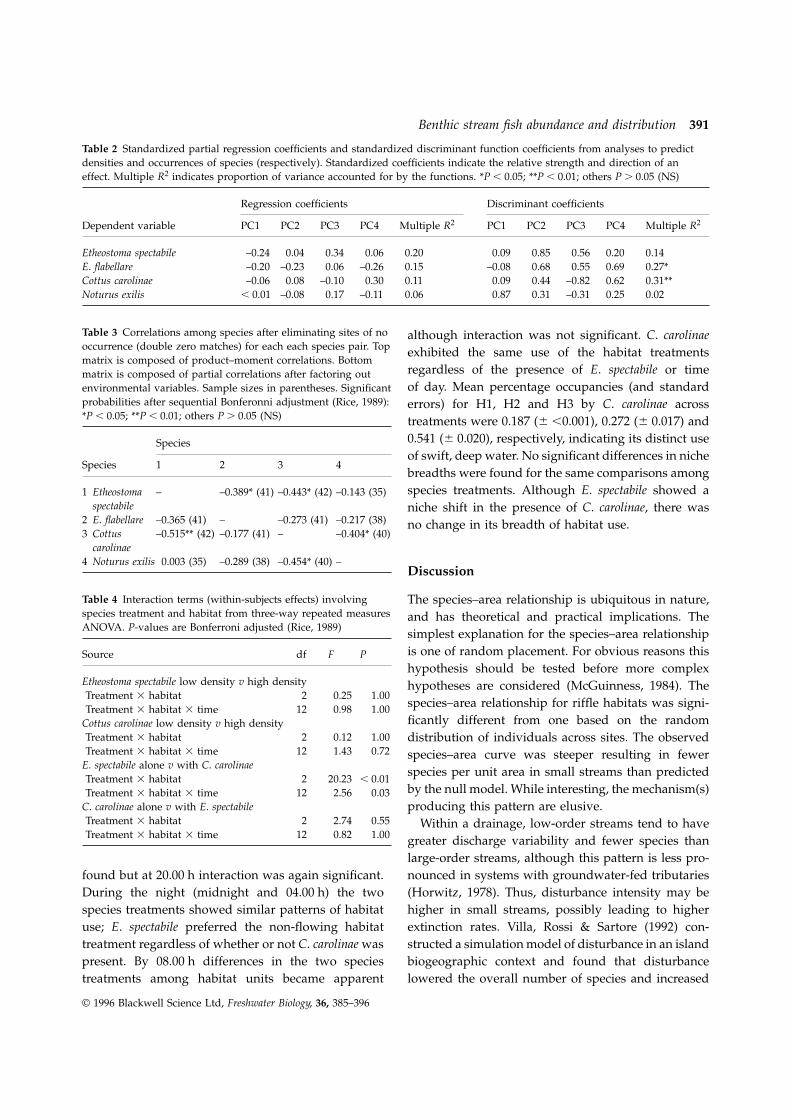
were most abundant in swift, deep habitat, but whenwith C. carolinae, E. spectabile selected shallow, non-flowing habitat. A significant treatment 3 habitat 3suggested that the species present in species-poor
streams maintained summed densities at least as high time interaction (Table 4) indicated that E. spectabileused the available habitat differently depending notas those in more speciose streams. The negative rela-
tionship was significant after habitat effects were only on whether or not C. carolinae was present, butalso on time of day. This three-way interaction can bestatistically factored out (r 5 –0.38, P 5 0.017; Fig. 4),
indicating density overcompensation in smaller stre- clarified by examining Fig. 5. At 12.00 h (both days)there was significant interaction and significant differ-ams. Since rare species could increase species richness
with little effect on summed densities, the analyses ences between cell means for H1 (both days) and H3(second day). At 16.00 h no significant interaction waswere repeated after eliminating rare species at sites
© 1996 Blackwell Science Ltd, Freshwater Biology, 36, 385–396
Benthic stream fish abundance and distribution 391
Table 2 Standardized partial regression coefficients and standardized discriminant function coefficients from analyses to predictdensities and occurrences of species (respectively). Standardized coefficients indicate the relative strength and direction of aneffect. Multiple R2 indicates proportion of variance accounted for by the functions. *P , 0.05; **P , 0.01; others P . 0.05 (NS)
Regression coefficients Discriminant coefficients
Dependent variable PC1 PC2 PC3 PC4 Multiple R2 PC1 PC2 PC3 PC4 Multiple R2
Etheostoma spectabile –0.24 0.04 0.34 0.06 0.20 0.09 0.85 0.56 0.20 0.14E. flabellare –0.20 –0.23 0.06 –0.26 0.15 –0.08 0.68 0.55 0.69 0.27*Cottus carolinae –0.06 0.08 –0.10 0.30 0.11 0.09 0.44 –0.82 0.62 0.31**Noturus exilis , 0.01 –0.08 0.17 –0.11 0.06 0.87 0.31 –0.31 0.25 0.02
Table 3 Correlations among species after eliminating sites of no although interaction was not significant. C. carolinaeoccurrence (double zero matches) for each each species pair. Top exhibited the same use of the habitat treatmentsmatrix is composed of product–moment correlations. Bottom
regardless of the presence of E. spectabile or timematrix is composed of partial correlations after factoring outof day. Mean percentage occupancies (and standardenvironmental variables. Sample sizes in parentheses. Significant
probabilities after sequential Bonferonni adjustment (Rice, 1989): errors) for H1, H2 and H3 by C. carolinae across*P , 0.05; **P , 0.01; others P . 0.05 (NS) treatments were 0.187 (6 ,0.001), 0.272 (6 0.017) and
0.541 (6 0.020), respectively, indicating its distinct useSpeciesof swift, deep water. No significant differences in niche
Species 1 2 3 4breadths were found for the same comparisons amongspecies treatments. Although E. spectabile showed a1 Etheostoma – –0.389* (41) –0.443* (42) –0.143 (35)
spectabile niche shift in the presence of C. carolinae, there was2 E. flabellare –0.365 (41) – –0.273 (41) –0.217 (38) no change in its breadth of habitat use.3 Cottus –0.515** (42) –0.177 (41) – –0.404* (40)
carolinae4 Noturus exilis 0.003 (35) –0.289 (38) –0.454* (40) –
Discussion
Table 4 Interaction terms (within-subjects effects) involving The species–area relationship is ubiquitous in nature,species treatment and habitat from three-way repeated measures and has theoretical and practical implications. TheANOVA. P-values are Bonferroni adjusted (Rice, 1989) simplest explanation for the species–area relationship
is one of random placement. For obvious reasons thisSource df F Phypothesis should be tested before more complex
Etheostoma spectabile low density v high density hypotheses are considered (McGuinness, 1984). TheTreatment 3 habitat 2 0.25 1.00
species–area relationship for riffle habitats was signi-Treatment 3 habitat 3 time 12 0.98 1.00ficantly different from one based on the randomCottus carolinae low density v high density
Treatment 3 habitat 2 0.12 1.00 distribution of individuals across sites. The observedTreatment 3 habitat 3 time 12 1.43 0.72 species–area curve was steeper resulting in fewer
E. spectabile alone v with C. carolinae species per unit area in small streams than predictedTreatment 3 habitat 2 20.23 , 0.01
by the null model. While interesting, the mechanism(s)Treatment 3 habitat 3 time 12 2.56 0.03C. carolinae alone v with E. spectabile producing this pattern are elusive.Treatment 3 habitat 2 2.74 0.55 Within a drainage, low-order streams tend to haveTreatment 3 habitat 3 time 12 0.82 1.00 greater discharge variability and fewer species than
large-order streams, although this pattern is less pro-nounced in systems with groundwater-fed tributariesfound but at 20.00 h interaction was again significant.
During the night (midnight and 04.00 h) the two (Horwitz, 1978). Thus, disturbance intensity may behigher in small streams, possibly leading to higherspecies treatments showed similar patterns of habitat
use; E. spectabile preferred the non-flowing habitat extinction rates. Villa, Rossi & Sartore (1992) con-structed a simulation model of disturbance in an islandtreatment regardless of whether or not C. carolinae was
present. By 08.00 h differences in the two species biogeographic context and found that disturbancelowered the overall number of species and increasedtreatments among habitat units became apparent
© 1996 Blackwell Science Ltd, Freshwater Biology, 36, 385–396
392 C.M. Taylor
Fig. 5 Means for habitat use by Etheostoma spectabile, with and without Cottus carolinae, in each of the three habitat units (H1 toH3) at each time period. I indicates significant interaction.
the slope of the species–area curve. They concluded being studied, the spatial and temporal scale of investi-gation, and the group of organisms being investigatedthat species diversity was more sensitive to disturb-
ance in small areas than in large areas due to the (Power et al., 1988). These data address spatial patternsin the abundance and distribution of species over ainteraction between area and disturbance. The steeper
than expected species–area curve (Fig. 3) that was large region and cannot be used to assess the dynamicnature of biotic and abiotic factors on guild structure.found in this study is consistent with Villa et al.’s
(1992) disturbance model. However, as they pointed However, if species interactions are important in struc-turing this benthic fish guild, other lines of evidenceout, a full understanding of the role of disturbance
on community structure will also require studies of should exist to support this idea.If species interactions were important in producingcommunity-level phenomena, especially species inter-
actions. the non-random species–area curve, one might expectecological release to occur in riffle habitats in theseInterspecific interactions could also lead to the non-
random species–area pattern observed in the present small species-poor streams. In other words, the speciesthat are present should exhibit higher densities in thestudy. Wright (1981) showed, with a simulated equilib-
rium model, that competition can interact with area absence of potential competitors (Schoener, 1988). Thispattern, called density compensation (Crowell, 1962;and cause higher extinction rates in small areas than
in large areas. This idea has been tested in a metapopul- MacArthur, Diamond & Karr, 1972), has often beenassociated with intense competition for resourcesation context. In a long-term experiment with artificial
rockpools and zooplankton, Bengsston (1989, 1993) (Tonn, 1985; Angermeier & Schlosser, 1989). In systemswhere abiotic factors largely control assemblage organ-showed that extinction rates in pools were influenced
by interspecific competition and that the effect was ization, competition for resources is likely to be weak,with both species richness and summed densitiesstronger in smaller pools.
Reconciling the disturbance and interspecific com- covarying positively (Angermeier & Schlosser, 1989).Angermeier & Schlosser (1989) found a significantpetition hypotheses with regard to community struc-
ture in streams is not easy. Both processes are positive correlation between summed fish densityand fish species richness for environmentally harshimportant to varying degrees depending on the system
© 1996 Blackwell Science Ltd, Freshwater Biology, 36, 385–396

Benthic stream fish abundance and distribution 393
Minnesota streams, and a significant negative correla- The observed short-term shift in habitat use byE. spectabile supports interference competition, pos-tion for Panama streams that, relative to Minnesota,
exhibited much less environmental fluctuation. They sibly due to predation threat, as the interactive mech-anism causing the marked effect on E. spectabile’sattributed the positive correlation in Minnesota to the
overriding influence of harsh climatic fluctuations. distribution at the local scale. Such a change in habitatuse by E. spectabile could explain why its abundanceThe present results were consistent with their findings
for a Panama stream system. However, it is possible in riffle habitats declines with increasing C. carolinaeabundance. However, the fact that E. spectabile had nothat density compensation could occur from species
individually responding to environmental features, effect on C. carolinae, and that C. carolinae densitiesshowed very weak correlations with measured habitatwith one or more species reaching their peak abund-
ance in small, species-poor streams due to ‘favourable’ variables, begs the question of what is controllingC. carolinae densities. There must be some other factorhabitat conditions. Measured riffle habitat variables
in this study accounted for only a fraction of the generating a gradient in sculpin densities.The variable diel pattern of interaction for E. spectab-variance in species’ densities (Table 2). No individual
species was negatively correlated with PC1 (stream ile with C. carolinae present v absent was puzzling,although daytime patterns were visibly less similarsize gradient), which would have indicated greater
densities in smaller streams. Furthermore, assemblage between treatments overall than were the night-timepatterns (Fig. 5). The experimental results were consist-structure was not predictable based on measured
environmental variables. These results, along with the ent with results from several field studies that haveshown diurnal feeding patterns for darters, with peaksignificant patterns of negative covariation that were
found among species, suggest that species interactions feeding activity at midday or in the afternoon (Cordes& Page, 1980; Matthews et al., 1982; Dewey, 1988).can play a role in determining the structure of this
benthic fish guild. Dewey found midday and evening peaks in feedingactivity (measured as number of prey ingested) forIf species interactions were important in determin-
ing regional patterns of distribution and abundance, E. spectabile, which corresponds to the significant stat-istical interaction that was found for 12.00 and 20.00 h.it should be possible to experimentally validate the
process that could lead to the pattern. Interactive During these time periods, in the absence ofC. carolinae, E. spectabile moved into deeper, swiftersegregation was tested for between the pair of species
that showed the strongest regional pattern of negative habitats, presumably to feed, whereas in the presenceof C. carolinae they were always more common in thecovariation. Significant interactive segregation was
found such that E. spectabile shifted its habitat use shallow, non-flowing habitat.The data presented support the view that streamwhen in the presence of C. carolinae. However,
C. carolinae’s use of habitat was unaffected by the fish assemblages can be structured by biotic inter-actions (see Power et al., 1988), in spite of knownpresence of E. spectabile.
This experiment indicated the potential importance variability in abiotic factors that may affect fish com-munity structure in various ways (Matthews, 1986a,b).of competition at the local scale between C. carolinae
and E. spectabile, though the interaction was strongly The results also suggest that species interactions caninfluence regional patterns of distribution and abund-asymmetrical. In cases of asymmetrical competition
the larger organism often is competitively superior ance. Two of the three relationships that were expectedto occur as a result of interspecific competition were(Schoener, 1983; Persson, 1985). Adult C. carolinae are
larger than adult E. spectabile (Miller & Robison, 1973; found: negative covariation in density (pairwise andguild level) and density compensation. SignificantRobison & Buchanan, 1988), and this size difference
was allowed for in the experiment. C. carolinae should complementary occurrences were not found amongspecies in this guild. However, complementary abund-benefit from its greater size by having a lower cost
for interference behaviour (Case & Gilpin, 1974). ances, rather than occurrences, are more likely to occuramong competing species in systems where dispersalThough C. carolinae is bigger and may prey on fishes
(Todd & Stewart, 1985; Dewey, 1988), there was no is high (Schoener, 1988).There are trade-offs to choosing particular spatialpredation on E. spectabile throughout the course of the
experiment. and temporal scales for ecological studies, because
© 1996 Blackwell Science Ltd, Freshwater Biology, 36, 385–396
394 C.M. Taylor
sparrow and house finch introductions in Northdifferent scales provide different types of informationAmerica. American Naturalist, 135, 725–747.(Wiens et al., 1986; May, 1994). Patterns observed in
Bengtsson J. (1989) Interspecific competition increasesthis study represent a snapshot in time, making itlocal extinction rate in a metapopulation system. Nature,impossible to assess the temporal variation in species340, 713–715.distributions. If and how these species distributions
Bengtsson J. (1993) Interspecific competition andvary over time remains to be examined. However,determinants of extinction in experimental populationsregional patterns of distribution and abundance doof three rockpool Daphnia species. Oikos, 67, 451–464.
provide hypotheses concerning specific mechanismsBlair A.P. (1959) Distribution of the darters (Percidae,
that can be tested experimentally. Proponents of hier- Etheostomatinae) of northeastern Oklahoma.archy theory (Allen & Starr, 1982; O’Neill, 1989) advoc- Southwestern Naturalist, 4, 1–13.ate that mechanisms driving patterns at one scale Blair W.F. & Hubbell T.H. (1938) The biotic districts ofshould be sought at an adjacent higher or lower level Oklahoma. American Midland Naturalist, 20, 425–454.(or scale) in the hierarchy. Here, a logical explanation Brown J.H. & Maurer B.A. (1989) Macroecology: thehas been proposed for regional patterns of abundance division of food and space among species on continents.and distribution for a guild of benthic stream fishes, Science, 243, 1145–1150.
Case T.J. & Bolger D.T. (1991) The role of interspecificand a hypothesized mechanism leading to a particularcompetition in the biogeography of island lizards.widespread spatial pattern for two members of thisTrends in Ecology and Evolution, 6, 135–139.guild has been experimentally tested. As Wiens et al.
Case T.J. & Gilpin M.E. (1974) Interference competition(1993) stated, ‘One does not need to study everyand niche theory. Proceedings of the National Academy ofspecies in every situation to obtain an understandingScience, 71, 307–3077.of the important mechanistic linkages between explicit
Cichetti D.V. (1972) Extension of multiple range tests tospatial patterns and processes.’ Such linkages are aninteraction tables in the analysis of variance: a rapidimportant step in providing generalizations in ecology.approximate solution. Psychological Bulletin, 77, 405–408.
Coleman B.D., Mares M.A., Willig M.R. & Hsieh Y. (1982)Acknowledgments Randomness, area, and species richness. Ecology, 63,
1121–33.I gratefully acknowledge the help and advice provided
Connor E.F. & Bowers M.A. (1987) The spatialby my major professor W.J. Matthews. I thank
consequences of interspecific competition. AnnalesC.C. Vaughn for considerable help and suggestions on Zoologic Fennici, 24, 213–226.numerous versions of this manuscript. I also appreciate Cordes L.E. & Page L.M. (1980) Feeding chronologythe reviews of my other committee members: S.L. and diet composition of two darters (Percidae) inCollins, N.J. Gotelli and G.D. Schnell. P. Angermeier, the Iroquois River system, Illinois. American MidlandG. Grossman, M. Lomolino and M.R. Winston also Naturalist, 104, 202–206.provided useful comments. The Department of Crowell K.L. (1962) Reduced interspecific competitionZoology, University of Oklahoma provided travel among the birds of Bermuda. Ecology, 43, 75–88.
Dewey S.L. (1988) Feeding relationships among foursupport. C. McAllister drafted Fig. 1. This manuscriptriffle-inhabiting stream fishes. Transactions of the Illinoiswas submitted to the University of Oklahoma as partAcademy of Sciences, 81, 171–184.of a dissertation.
Faeth S.H. (1984) Density compensation in vertebratesand invertebrates: a review and an experiment.Ecological Communities: Conceptual Issues and the EvidenceReferences(Eds D.R. Strong, D. Simberloff, L.G. Abele and A.B.Thistle), pp. 491–509. Princeton University Press,Allen T.F.H. & Starr T.B. (1982) Hierarchy: PerspectivesPrinceton, NJ.for Ecological Complexity. University of Chicago Press,
Fausch K.D., Nakano S. & Ishigaki K. (1994) DistributionChicago, IL.of two congeneric charrs in streams of HokkaidoAngermeier P.L. & Schlosser I.J. (1989) Species–areaIsland, Japan: considering multiple factors across scales.relationships for stream fishes. Ecology, 70, 1450–1462.Oecologia, 100, 1–12.Bennett W.A. (1990) Scale of investigation and the
detection of competition: an example from the house Gotelli N.J. & Abele L.G. (1983) Community patterns
© 1996 Blackwell Science Ltd, Freshwater Biology, 36, 385–396

Benthic stream fish abundance and distribution 395
of coral-associated decapods. Marine Ecology Progress Linear Statistical Models, p. 900. Irwin, Inc.,Homewood, IL.Series, 13, 131–139.
O’Neill R.V. (1989) Perspectives in hierarchy and scale.Greenberg L.A. (1988) Interactive segregation between thePerspectives in Ecological Theory (Eds J. Roughgarden,stream fishes Etheostoma simoterum and E. rufilineatum.R.M. May and S.A. Levin), pp. 140–156. PrincetonOikos, 51, 193–202.University of Press, Princeton, NJ.Hoover J.J. (1988) Trophic dynamics in an assemblage of
Persson L. (1985) Asymmetrical competition: are largerOzark stream fishes. Ph.D. Dissertation, University ofanimals competitively superior? American Naturalist,Oklahoma, Norman, OK.126, 261–267.Horwitz R.J. (1978) Temporal variability patterns and
Pfleiger W.L. (1975) The Fishes of Missouri. Missourithe distributional patterns of stream fishes. EcologicalDepartment of Conservation, Jefferson City, MO.Monographs, 48, 307–321.
Polis G.A., Myers C.A. & Holt R.D. (1989) The ecology andJames F.C. & McCulloch C.E. (1990) Multivariate analysisevolution of intraguild predation: potential competitorsin ecology and systematics: panacea or Pandora’s box.that eat each other. Annual Review of Ecology andAnnual Review of Ecology and Systematics, 21, 129–166.Systematics, 20, 297–330.Legendre L. & Legendre P. (1983) Numerical Ecology.
Power M.E., Stout R.J., Cushing C.E., Harper P.P., HouerElsevier, New York.F.R., Matthews W.J., Moyle P.B., Statzner B. & Wais DeLevins R. (1968) Evolution in changing environments: someBadgen I.R. (1988) Biotic and abiotic controls in rivertheoretical explorations, Monographs in Populationand stream communities. Journal of the North AmericanBiology no. 2. Princeton University Press, Princeton, NJ.Benthological Society, 7, 456–479.Ludwig J.A. & Reynolds J.F. (1988) Statistical Ecology. John
Rice W.R. (1989) Analyzing tables of statistical tests.Wiley, New York.Evolution, 43, 223–225.MacArthur R.H., Diamond J.M. & Karr J.R. (1972) Density
Ricklefs R.E. (1987) Community diversity: relative rolescompensation in island faunas. Ecology, 53, 330–342.
of local and regional processes. Science, 235, 167–171.Maiorana V.C. (1977) Density and competition among
Ricklefs R.E. (1989) Speciation and diversity: thesunfish: some alternatives. Science, 195, 94–95.
integration of local and regional processes. SpeciationMantel N. (1967) The detection of disease clustering and
and its Consequences (Eds D. Otte and J.A. Endler), pp.a generalized regression approach. Cancer Research, 27,
599–622. Sinauer Associates, Sutherland, MA.209–220. Robison H.W. & Buchanan T.M. (1988) Fishes of Arkansas.
Matthews W.J. (1986a) Fish community structure in a University of Arkansas Press, Fayettville, AR.temperate stream: stability, persistence, and a Rohlf F.J. (1988) NTSYS-pc: numerical taxonomy andcatastrophic flood. Copeia, 1986, 388–397. multivariate analysis system, version 1.40. Exeter
Matthews W.J. (1986b) Physicochemical tolerance and Publishing, Setauket, NY.selectivity of stream fishes as related to their geographic Schlosser I.J. & Toth L.A. (1984) Niche relationships andranges and local distributions. Community and population ecology of rainbow (Etheostoma caeruleum)Evolutionary Ecology of North American Stream Fishes and fantail (E. flabellare) darters in a temporally variable(Eds W.J. Matthews and D.C. Heins), pp. 111–120. environment. Oikos, 42, 229–238.University of Oklahoma Press, Norman, OK. Schluter D. (1984) A variance test for detecting species
Matthews W.J., Bek J.R. & Surat E. (1982) Comparative associations, with some example applications. Ecology,ecology of the darters Etheostoma podostemone, E. 65, 998–1005.flabellare and Percina roanoka in the upper Roanoke Schoener T.W. (1983) Field experiments on interspecificRiver drainage, Virginia. Copeia, 1982, 805–814. competition. American Naturalist, 122, 240–285.
May R.M. (1994) The effects of spatial scale on ecological Schoener T.W. (1988) Ecological interactions. Analyticalquestions and answers. Large-scale Ecology and Biogeography, An Integrated Approach to the Study ofConservation Biology (Eds P.J. Edwards, R.M. May and Animal and Plant Distributions (Eds A.A. Myers and P.S.N.R. Webb), pp. 1–17. Blackwell Scientific Giller), pp. 255–297. Chapman and Hall, New York.Publications, London. Sokal R.R. & Rohlf F.J. (1981) Biometry. W.H. Freeman,
McGuinness K.A. (1984) Species–area relations of New York.communities on intertidal boulders: testing the null Todd C.S. & Stewart K.W. (1985) Food habits and dietaryhypothesis. Journal of Biogeography, 11, 439–456. overlap of nongame insectivorous fishes in Flint Creek,
Miller R.J. & Robison H.W. (1973) The Fishes of Oklahoma. Oklahoma, a western Ozark foothills stream. GreatOklahoma State University Press, Stillwater, OK. Basin Naturalist, 45, 721–733.
Tonn W.M. (1985) Density compensation in Umbra–PercaNeter J., Wasserman W. & Kutner M.H. (1985) Applied
© 1996 Blackwell Science Ltd, Freshwater Biology, 36, 385–396
396 C.M. Taylor
fish assemblages of northern Wisconsin lakes. Ecology, Werner E.E. & Hall D.J. (1977) Density and competitionamong sunfish: some alternatives. Science, 195, 94–95.66, 415–429.
Wiens J.A., Addicott J.F., Case T.J. & Diamond J. (1986)Underwood T. (1986) The analysis of competition by fieldOverview: the importance of spatial and temporal scaleexperiments. Community Ecology: Pattern and Processin ecological investigations. Community Ecology (Eds J.(Eds J. Kikkawa and D.J. Anderson), pp. 240–268.Diamond and T.J. Case), pp. 145–153. Harper and Row,Blackwell Scientific Publications, London.New York.Villa F., Rossi O. & Sartore F. (1992) Understanding the
Wiens J.A., Stenseth N.C., Van Horne B. & Ims R.A. (1993)role of chronic environmental disturbance in the contextEcological mechanisms and landscape ecology. Oikos,
of island biogeographic theory. Environmental66, 369–380.
Management, 16, 653–666. Wright S.J. (1980) Density compensation in islandWeddle G.K. & Kessler R.K. (1993) A square-metre avifaunas. Oecologia, 45, 385–389.
electrofishing sampler for benthic riffle fishes. Journal Wright S.J. (1981) Intra-archipelago vertebrateof the North American Benthological Society, 12, 291–301. distributions: the slope of the species–area relation.
Werner E.E. & Hall D.J. (1976) Niche shifts in sunfishes: American Naturalist, 118, 726–748.experimental evidence and significance. Science, 191,
(Manuscript accepted 24 May 1996)404–406.
© 1996 Blackwell Science Ltd, Freshwater Biology, 36, 385–396