Embed Size (px)
Citation preview

Scottish Natural HeritageCommissioned Report No. 512
Site Condition Monitoring of bottlenosedolphins within the Moray Firth Special Area of Conservation: 2008 - 2010
C O M M I S S I O N E D R E P O R T
Commissioned Report No.512
Site Condition Monitoring of bottlenose
dolphins within the Moray Firth Special Area
of Conservation: 2008 - 2010
For further information on this report please contact:
Morven Carruthers Scottish Natural Heritage Great Glen House INVERNESS IV3 8NW Telephone: 01463 725 000 E-mail: [email protected]
This report should be quoted as:
Cheney, B., Corkrey, R., Quick, N.J., Janik, V.M., Islas-Villanueva, V., Hammond, P.S. & Thompson, P.M. (2012) Site Condition Monitoring of bottlenose dolphins within the Moray Firth Special Area of Conservation: 2008 - 2010. Scottish Natural Heritage Commissioned Report No.512.
This report, or any part of it, should not be reproduced without the permission of Scottish Natural Heritage. This permission will not be withheld unreasonably. The views expressed by the author(s) of this report should not be taken as the views and policies of Scottish Natural Heritage.
© Scottish Natural Heritage 2012.
i
Site condition monitoring of bottlenose dolphins within the Moray Firth Special Area of Conservation: 2008 - 2010.
Commissioned Report No. 512 (iBids and Project no, 4964)
Contractor: University of Aberdeen
Year of publication: 2012
Background
The Moray Firth Special Area of Conservation (SAC) is one of two UK areas that have been proposed as part of the Natura 2000 series for bottlenose dolphins (Tursiops truncatus). The SAC extends from the inner firths to Helmsdale on the north coast and Lossiemouth on the south coast and includes areas that are regularly used by the population of bottlenose dolphins occurring along the east coast of Scotland. Scottish Natural Heritage (SNH) has a responsibility to report on the condition of bottlenose dolphins within the Moray Firth SAC every six years. Since 1989, this population of bottlenose dolphins has been the focus of an intensive research programme, carried out by the University of Aberdeen in collaboration with the Sea Mammal Research Unit at the University of St Andrews. In 2004, SNH entered into a Memorandum of Agreement with the University of Aberdeen to support these photo-identification studies and use these data to report on the condition of the site. This report presents the results from the third round of SNH funded surveys, together with the results of similar surveys made in 2008 and 2009 that were carried out with support from the Scottish Government, the Department of Energy and Climate Change, the Whale & Dolphin Conservation Society and Talisman Energy (UK) Ltd.
Main findings
Photo-identification surveys and passive acoustic monitoring studies were carried out in core sampling areas within the Moray Firth SAC during the summers (May to September) of 2008 to 2010.
Mark-recapture analysis of photographs collected during photo-identification surveys indicated that an estimated 68 individual dolphins used the SAC during the summer of 2008, 102 in 2009 and 114 in 2010.
A Bayesian capture-recapture assessment of the total abundance of the east coast bottlenose dolphin population suggests, with a high probability, that this population is stable or increasing.
The number of dolphins using the SAC between 1990 and 2010 appears to be stable. However, because the overall east coast population size appears to have increased, the actual proportion of the population using the SAC has declined. Nevertheless, at least 60% of the population have been seen within the SAC in 16 of the 21 years of photo-identification effort.
COMMISSIONED REPORT
Summary
ii
Between 2005 and 2010, acoustic monitoring using T-PODs and C-PODs highlighted that dolphins were present in three sample sites within the SAC for several hours each day throughout May to September.
The following conclusions were reached:
Despite inter-annual variability, the number of dolphins using the SAC between 1990 and 2010 has remained stable.
Additional data suggest that there is no evidence of a decline in the population of dolphins on the east coast of Scotland, and there is an over 99% probability that this population is stable or increasing.
The proportion of the east coast of Scotland bottlenose dolphin population that use the SAC between 1990 and 2010 has declined, most probably due to an overall increase in population size.
Dolphins occur at sample sites within the SAC on most days between May to September, with broadly similar patterns of use detected over the period 2005 – 2010.
For further information on this project contact: Morven Carruthers, SNH, Great Glen House, Leachkin Rd, Inverness, IV3 8NW
Tel: 01463 725000 For further information on the SNH Research & Technical Support Programme contact:
DSU (Policy & Advice Directorate), Scottish Natural Heritage, Great Glen House, Inverness, IV3 8NW. Tel: 01463 725000 or [email protected]

iii
Acknowledgements
We would like to thank all the colleagues who have helped collect and analyse data during the period 1990 to 2010. We would especially like to thank Charlie Phillips and the Whale and Dolphin Conservation Society Wildlife Centre in Spey Bay for their photographic contributions. Surveys and analysis of data from 2010 were funded by Scottish Natural Heritage. We would like to thank the Scottish Government, Whale and Dolphin Conservation Society, Talisman Energy (UK) Ltd., the Department of Energy and Climate Change, Earthwatch Europe, Chevron, the European Union and the Natural Environment Research Council whose support has allowed us to continue these studies on an annual basis. The St Andrews Bay efforts were funded by a Royal Society University Research Fellowship, a fellowship of the Wissenschaftskolleg zu Berlin and studentships from NERC and the Mexican National Council for Science and Technology (CONACYT).

iv
Table of Contents Page
Summary……………………………………………………………………………………………...i Acknowledgements………………………………………………………………………………..iii 1 INTRODUCTION ............................................................................................................... 1
2 METHODOLOGY .............................................................................................................. 2
2.1 Survey Protocols ......................................................................................................... 2 2.2 Photographic Analysis ................................................................................................. 3 2.3 Mark-recapture Analysis.............................................................................................. 4 2.4 Usage of the SAC........................................................................................................ 5 2.4.2. Encounter Probability in the Sutors Area................................................................6 2.4.3. Passive Acoustic Monitoring...................................................................................6
3 RESULTS.......................................................................................................................... 8
3.1 Survey details .............................................................................................................. 8 3.2 Variation in estimates of ......................................................................................... 13 3.3 Estimate of the number of dolphins using the SAC ................................................... 16 3.4 Trends in the number of dolphins estimated to be using the SAC ............................ 16 3.5 Usage of the SAC...................................................................................................... 18 3.5.1. Estimates of total population size .........................................................................18 3.5.2. Encounter probability in the Sutors area ..............................................................20 3.5.3. Passive Acoustic Monitoring.................................................................................21
4 DISCUSSION .................................................................................................................. 23
5 REFERENCES ................................................................................................................ 26
APPENDIX I – EXAMPLE RAW DATA TABLES........................................................... 28
APPENDIX II – SITE ATTRIBUTE TABLE..................................................................... 32
APPENDIX III – PHOTO-IDENTIFICATION CATALOGUE............................................ 33
APPENDIX IV – GIS PROJECT...................................................................................... 34

1
1 INTRODUCTION
The Moray Firth Special Area of Conservation (SAC) is one of two UK areas that were designated in 2005 under the European Habitats Directive (92/43/EEC) for bottlenose dolphins (Tursiops truncatus). The SAC extends from the inner firths to Helmsdale on the north coast and Lossiemouth on the south coast (Figure 1), and includes areas that are regularly used by the population of bottlenose dolphins occurring along the east coast of Scotland. Since 1989, this population of bottlenose dolphins has been the focus of an intensive research programme. This work has been led by the University of Aberdeen and the University of St Andrews, and involved collaboration with a wide variety of other groups (see Thompson et al., 2011). Research has been conducted throughout the known range of this population, but the University of Aberdeen’s core programme has consisted of boat-based photo-identification studies within the Moray Firth SAC. As a result, these studies have provided information on abundance, distribution and behaviour patterns that have supported the development and management of the SAC. Scottish Natural Heritage (SNH) has a responsibility to report on the condition of bottlenose dolphins within the Moray Firth SAC every six years. In 2003, SNH contracted the Universities of Aberdeen and St Andrews to review existing information on the distribution and abundance of this population of bottlenose dolphins, and to explore the different options for monitoring bottlenose dolphins within the SAC (Thompson et al., 2004). Subsequently, SNH entered into a Memorandum of Agreement with the University of Aberdeen to support these photo-identification studies and use these data to fulfil SNH’s requirement to report on the condition of the site. During the period 1990 to 2000 there appeared to have been a decline in the extent to which this population was using the SAC, and an apparent range expansion (Wilson et al., 2004). Data from the first reporting cycle (Thompson et al., 2006) confirmed that a high proportion (75-80%) of the east coast of Scotland population still used the SAC during summer, and suggested that there may have been a slight increase in summer abundance within the SAC post-2000. On the basis of these findings, the condition status in 2006 was considered to be “Unfavourable (recovering)”. An interim report covering 2005 to 2007 identified significant inter-annual variation in the indicators being monitored, and acknowledged that it remained unclear to what extent this results from sampling variation or genuine biologically significant changes. In light of this uncertainty and the limited amount of data collected since the previous report, no change was made to the condition status (Thompson et al., 2009). This report presents the results from the third round of SNH funded surveys, together with the results of similar surveys made in 2008 and 2009 that were carried out with support from the Scottish Government, the Department of Energy and Climate Change, the Whale & Dolphin Conservation Society and Talisman Energy (UK) Ltd. We present information on the development of our mark-recapture methods to provide more robust estimates of bottlenose dolphin abundance within the SAC. New data are also presented on the overall size of the bottlenose dolphin population on the east coast of Scotland. Finally, we include data from acoustic monitoring studies that can be used to assess long-term variation in the extent to which dolphins use three sample sites within the SAC.

2
Figure 1. A map showing the location of the Moray Firth and the boundaries of the Moray Firth SAC (grey), core study area (dark grey) and locations of POD deployments in three sample sites (pins).
2 METHODOLOGY
Detailed discussion of the different options for monitoring bottlenose dolphins in the Moray Firth SAC can be found in Thompson et al. (2004). Following this work, it was decided that the main requirement in this situation is to estimate the number of dolphins using the SAC. Given this, we recommended that mark-recapture analysis of photo-identification data was the most appropriate method for estimating the abundance of this well-marked population of coastal dolphins. However, there still remained a number of different sampling options that could provide estimates of this kind. In particular, given the large size of the SAC, it was recommended that sampling be restricted to a core study area (Figure 1) that can be used as a proxy for the SAC. Furthermore, because of the need for good weather conditions for boat-based photo-identification work, it was recommended that surveys be restricted to the summer period, when earlier year-round studies had also indicated that abundance within the Moray Firth SAC was highest (Wilson et al., 1997). The resulting survey strategy was therefore based on Option A in Thompson et al. (2004), and further details of the protocols are given below. 2.1 Survey Protocols All surveys were made from an MCA certified 5.8m Rigid Inflatable Boat, working from Cromarty Harbour. Survey effort was spread through the period May to September, but restricted to days with low sea state (< Beaufort 3), to maximise sighting probability, and
3
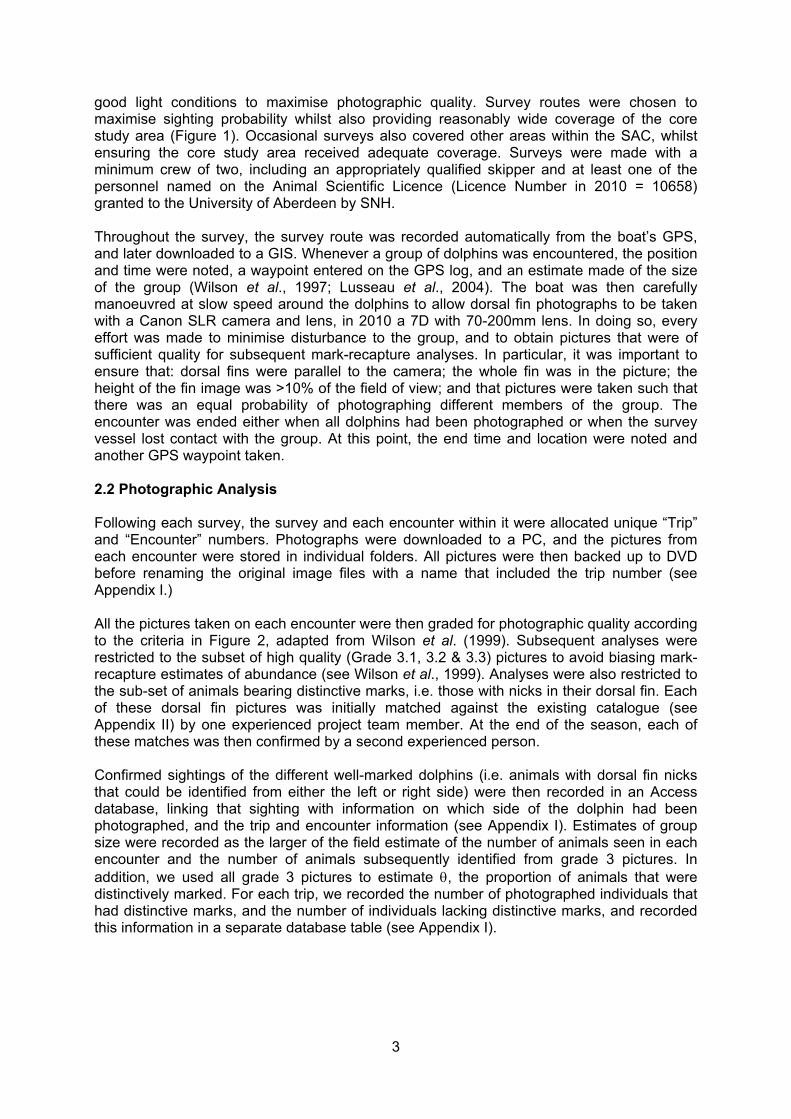
good light conditions to maximise photographic quality. Survey routes were chosen to maximise sighting probability whilst also providing reasonably wide coverage of the core study area (Figure 1). Occasional surveys also covered other areas within the SAC, whilst ensuring the core study area received adequate coverage. Surveys were made with a minimum crew of two, including an appropriately qualified skipper and at least one of the personnel named on the Animal Scientific Licence (Licence Number in 2010 = 10658) granted to the University of Aberdeen by SNH. Throughout the survey, the survey route was recorded automatically from the boat’s GPS, and later downloaded to a GIS. Whenever a group of dolphins was encountered, the position and time were noted, a waypoint entered on the GPS log, and an estimate made of the size of the group (Wilson et al., 1997; Lusseau et al., 2004). The boat was then carefully manoeuvred at slow speed around the dolphins to allow dorsal fin photographs to be taken with a Canon SLR camera and lens, in 2010 a 7D with 70-200mm lens. In doing so, every effort was made to minimise disturbance to the group, and to obtain pictures that were of sufficient quality for subsequent mark-recapture analyses. In particular, it was important to ensure that: dorsal fins were parallel to the camera; the whole fin was in the picture; the height of the fin image was >10% of the field of view; and that pictures were taken such that there was an equal probability of photographing different members of the group. The encounter was ended either when all dolphins had been photographed or when the survey vessel lost contact with the group. At this point, the end time and location were noted and another GPS waypoint taken. 2.2 Photographic Analysis Following each survey, the survey and each encounter within it were allocated unique “Trip” and “Encounter” numbers. Photographs were downloaded to a PC, and the pictures from each encounter were stored in individual folders. All pictures were then backed up to DVD before renaming the original image files with a name that included the trip number (see Appendix I.) All the pictures taken on each encounter were then graded for photographic quality according to the criteria in Figure 2, adapted from Wilson et al. (1999). Subsequent analyses were restricted to the subset of high quality (Grade 3.1, 3.2 & 3.3) pictures to avoid biasing mark-recapture estimates of abundance (see Wilson et al., 1999). Analyses were also restricted to the sub-set of animals bearing distinctive marks, i.e. those with nicks in their dorsal fin. Each of these dorsal fin pictures was initially matched against the existing catalogue (see Appendix II) by one experienced project team member. At the end of the season, each of these matches was then confirmed by a second experienced person. Confirmed sightings of the different well-marked dolphins (i.e. animals with dorsal fin nicks that could be identified from either the left or right side) were then recorded in an Access database, linking that sighting with information on which side of the dolphin had been photographed, and the trip and encounter information (see Appendix I). Estimates of group size were recorded as the larger of the field estimate of the number of animals seen in each encounter and the number of animals subsequently identified from grade 3 pictures. In addition, we used all grade 3 pictures to estimate , the proportion of animals that were distinctively marked. For each trip, we recorded the number of photographed individuals that had distinctive marks, and the number of individuals lacking distinctive marks, and recorded this information in a separate database table (see Appendix I).
4
Figure 2. Schematic showing the criteria used to quality grade the photographs taken during photo-identification surveys. Only sightings confirmed from pictures of grade 3.1, 3.2 or 3.3 were used in mark-recapture analyses to estimate abundance.
2.3 Mark-recapture Analysis A capture matrix was constructed for each year containing either a 1 or 0, to represent whether or not a well-marked individual was seen in a high quality photograph on each trip. Previously, separate capture matrices, were produced for photographs of the left or right hand sides of the animals (see Wilson et al., 1999). However, as only dolphins with nicks were used for the analysis and nicked individuals can be identified from both sides, we followed the approach used by Corkrey et al. (2008) and constructed a single capture matrix for each year (see Appendix I). These capture matrices were then used to estimate the number of well-marked individuals using the SAC during the summer survey period.
5
Following Wilson et al. (1999), we used Chao et al.’s (1992) Mth model, implemented in the programme CAPTURE (Rexstad & Burnham, 1991). The number of individuals within the SAC in each summer was estimated as: Ntotal = N where Ntotal is the estimated number of individuals within the SAC, N is the mark-recapture estimate of the number of well-marked animals and is the proportion of well-marked animals in the population. The variance was estimated again following Wilson et al. (1999) using the delta method as: var(Ntotal) = Ntotal var(N) + 1 - N n where n is the cumulative total number of dolphins used to estimate . Initially the proportion of well marked animals () was estimated separately for left and right hand sides for each trip, and an average value calculated for each year’s set of surveys (Wilson et al., 1999; Thompson et al., 2006). However, inspection of our time series of data suggested that much of the variation in estimates of annual abundance appeared to be related to sampling variation related to our estimate of (see results). To reduce these effects, we used all the available data (1990 to 2010) to model . Preliminary modelling explored whether there was any trend in over time, by fitting a generalised linear model (GLM) with a binomial distribution for the left and right hand sides separately. We then examined whether yearly variations in resulted from biological factors and/or heterogeneity in sampling effort and protocols. Again we used GLMs with a binomial distribution to model several parameters and fitted separately for the right and left hand side. To investigate biological factors we modelled the number of well-marked animals from our original CAPTURE estimates, the number of newborns born and the number of newborns identified each year. To investigate heterogeneity in sampling effort we modelled the total number of trips, the number of encounters, the number of captures (cumulative number of well-marked individuals identified) and the number of trapping occasions (number of trips where at least one well-marked dolphin was identified in a grade 3 picture). Changes to our sampling protocols were also included in the models. In 2001 we moved from a fixed survey route (see Wilson et al., 1997) to targeted surveys to maximise the probability of encountering dolphins and in 2002 we changed from a film to digital camera. As a number of these explanatory variables were collinear, each was included in their own GLM and the best model (the one that best explained the variability in ) was selected using Akaike Information Criterion (AIC) (Burnham & Anderson, 2002). All data analysis was carried out in R (R Development Core Team, 2010). These models indicated that the change in survey protocol best explained the variation in θ (see results). To produce a single modelled value for to inflate the CAPTURE estimate to estimate overall abundance we averaged the GLM modelled values for the best model (see results) for the left and right hand side. 2.4 Usage of the SAC We employed three methods to estimate the use of the SAC by the east coast bottlenose dolphin population. The first involved relating the numbers of animals recorded in the SAC to total population size, and the others used different approaches to quantify the amount of time that dolphins spent within the SAC.
6
2.4.1. Estimating total population size
In our 2006 condition report, we described a Bayesian capture-recapture model that used a state-space approach (see Corkrey et al., 2008) to incorporate data from other areas and estimate the most likely trend in overall population size (Thompson et al., 2006). This Bayesian model uses the same underlying data used in the annual mark-recapture estimates for the SAC, but only uses information on whether or not a well-marked animal was seen in each year. To estimate the annual total abundance for the east coast bottlenose dolphin population, this model was updated to include data from surveys made across the known range of this population between 1990 and 2010. This included University of Aberdeen data from the inner Moray Firth (1990-2010), outer Moray Firth (1991-1998 and 2006-2010), Grampian (1992 and 1994-1996) and Tayside and Fife (1997-2000), and University of St Andrews Sea Mammal Research Unit (SMRU) data from around Tayside (1999-2004, 2006-2007 and 2009-2010) (see Quick & Janik (2008) and Islas (2010) for survey details). Additional data from the Moray Firth were also available from the Whale and Dolphin Conservation Society (WDCS) surveys that were made from land-based observation points in the inner Moray Firth (2004-2008) and from a commercial dolphin watching vessel along the southern coast of the Moray Firth (2001-2002, 2004-2010). All photographs from collaborators were graded (Figure 2) and matches were confirmed by at least two experienced researchers (see also Thompson et al., 2011). Following Corkrey et al. (2008) this model was run in Fortran compiler G95, version 0.93 for 240,000 iterations with a 50% burn in. The average proportion of well-marked animals was calculated for each trip using data from the University of Aberdeen and SMRU where available and incorporated in the model. This produced yearly estimates from 1990 to 2010 of the total number of bottlenose dolphins using the east coast of Scotland with 95% highest posterior density intervals (HPDI). A simple Bayesian linear regression model (Corkrey et al., 2008) was used to determine whether there was a trend in total population abundance. Using this annual estimate of total population size and our CAPTURE estimates of the number of dolphins using the SAC, we modelled changes in the proportion of the east coast bottlenose dolphin population making use of the SAC between 1990 and 2010 using a GLM with a quasi-binomial distribution. 2.4.2. Encounter Probability in the Sutors Area
Although survey routes varied, all surveys passed through the Sutors of Cromarty (the headlands at the mouth of the Cromarty Firth). Therefore, as in previous condition monitoring reports, we used a simple index of usage of the SAC based upon the probability of encountering dolphins each time the survey boat passed through the Sutors area during the period May to September (Thompson et al., 2006). 2.4.3. Passive Acoustic Monitoring
We also used passive acoustic monitoring to provide a more detailed assessment of usage of the SAC. These studies used passive acoustic monitoring systems (T- and C-PODs) to record changes in the presence or absence of dolphins at sample sites within the SAC. These devices incorporate a hydrophone, processor and digital timing system. In every minute, the T-POD runs six successive scans within different user-defined frequencies, and automatically logs the start and end of each echolocation click to 10 s resolution. Following the manufacturers guidelines for use in areas where both harbour porpoises and bottlenose dolphins might be detected, T-PODs were configured to detect clicks from dolphins and porpoises on alternate channels. As described in Bailey et al. (2010) and Thompson et al. (2011) we set a target frequency of 50 kHz and a reference frequency of 70 kHz for dolphins. The C-POD continuously detects from 20-160 kHz, logging time, centre frequency, sound

7
pressure level and bandwith of each cetacean echolocation click. Both types of POD log detections for periods of up to 5 months. Accompanying software programmes are used to post-process the recovered data, detect characteristic click trains, and remove noises from other sources such as boat sonar (see www.chelonia.co.uk for details). Resulting data on the number of click trains recorded in each minute can be used to determine the presence or absence of target species in different time periods, or to identify the timing and duration of encounters with target species. We used Versions 4 and 5 T-PODs and Versions 0 and 1 C-PODS to detect echolocation click trains, and processed all data using the manufacturer’s software (version 4.1 train filter for T-PODS and version 1 train filter for C-PODS). . Studies both in the Moray Firth SAC (Bailey et al., 2010) and in the Shannon SAC (Philpott et al., 2007) confirmed that T-PODS could successfully detect bottlenose dolphins at distances of at least 1000m. Comparison with visual observations within the Cromarty Firth verified that all groups spending at least 30 minutes in the area were detected by the T-PODS, and suggests that the technique is robust for determining presence or absence of dolphins at hourly sampling scales (Bailey et al., 2010). We compared the performance of T-PODs and C-PODs using data from a series of 2010 deployments in which both devices were mounted side by side on the same mooring. To evaluate trends in the use of sample areas within the SAC we used available acoustic data from a series of different studies that have been conducted by the University of Aberdeen since 2005 (see Bailey et al., 2010; Thompson et al., 2010, 2011). Sample sites and coverage varied between years, but data are available from at least 5 years for three sample sites (Sutors, Chanonry and Lossiemouth) (Figure 1).

8
3 RESULTS
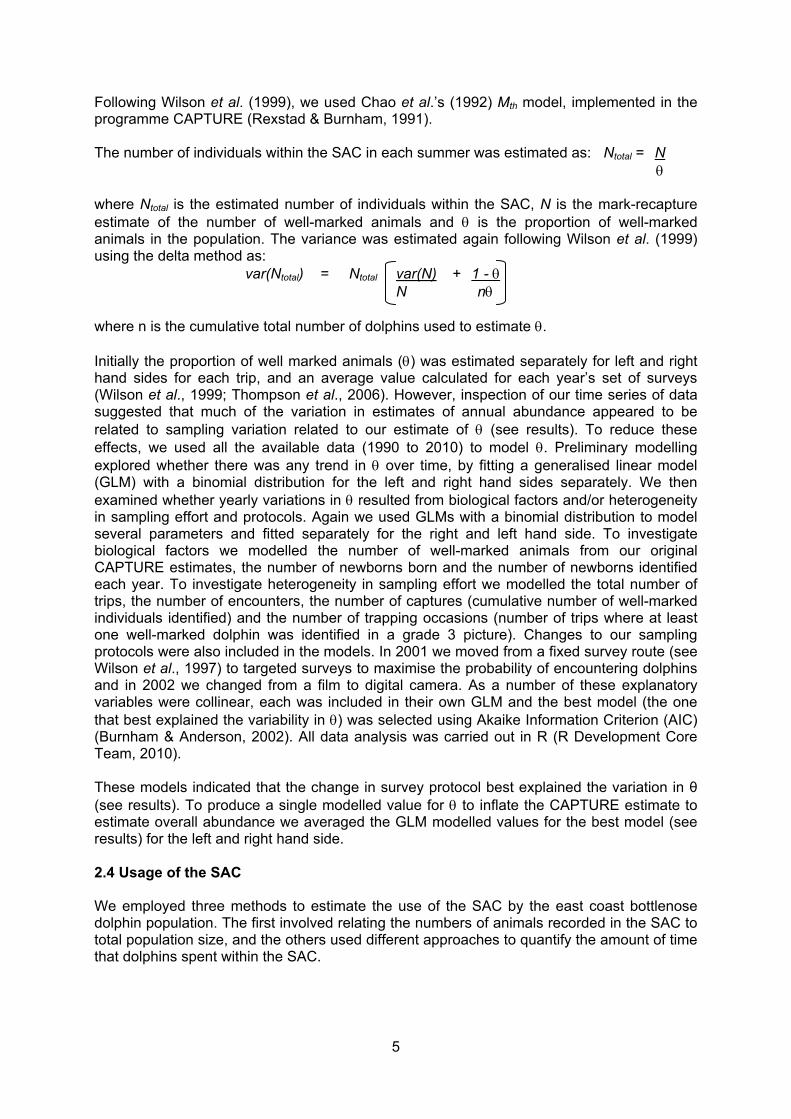
3.1 Survey details In 2010, 24 photo-identification surveys were carried out within the inner Moray Firth under contract from SNH. These surveys resulted in a total of 115 encounters with dolphin groups. Information on these surveys, and those made in 2008 and 2009 are presented in Table 1 and the survey routes for the three years are shown in Figure 3. Estimated group sizes during these encounters varied between 1 and 45, with similar distribution for group sizes in all years (Figure 4). The locations of encounters with dolphins in each year, based upon the position of the survey boat at the start of each encounter, are shown in Figures 5a, b & c. Table 1. Summary data on the numbers of photo-identification surveys conducted during
the 2008 to 2010 reporting period.
Year No. of surveys Mean survey duration (hours)
No. of encounters % of survey time with dolphins
2008 27 4.4 75 34 2009 34 5.5 98 30 2010 24 6.1 115 39

9
a) 2008
b) 2009
Figure 3. A map showing the areas covered by surveys in a) 2008 b) 2009 and c) 2010
(continued overleaf).
10
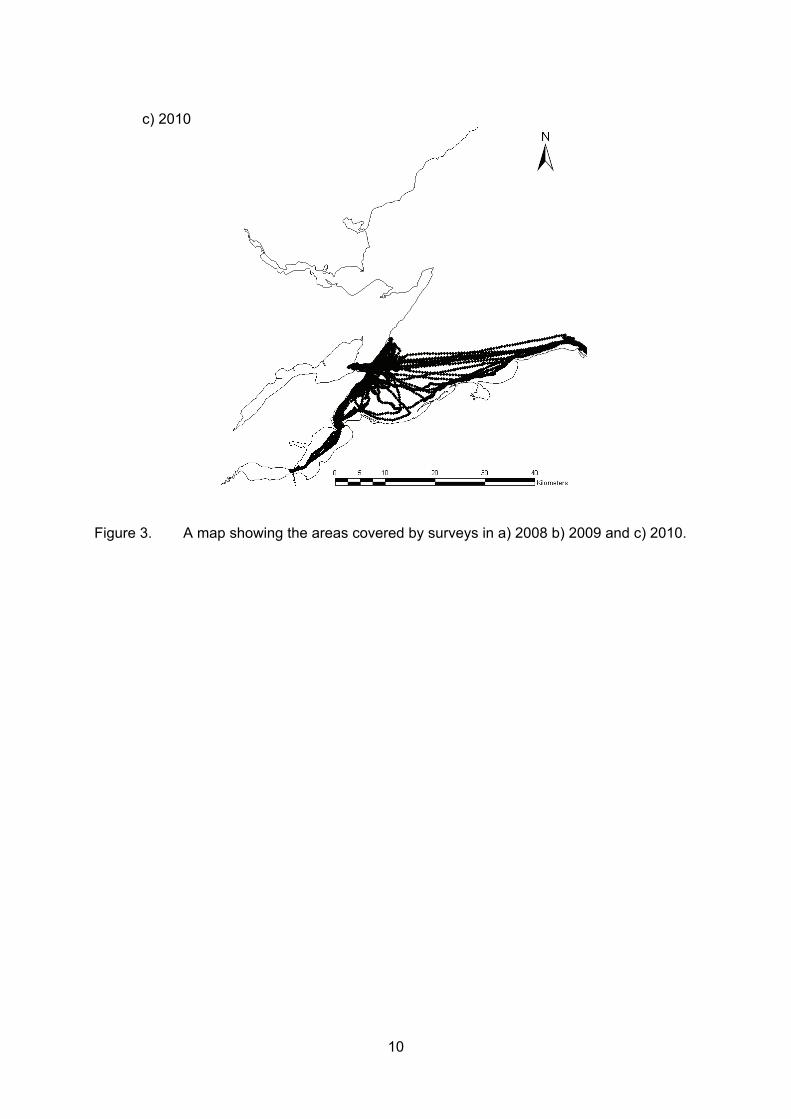
c) 2010
Figure 3. A map showing the areas covered by surveys in a) 2008 b) 2009 and c) 2010.

11
Figure 4. Frequency distribution of different dolphin group sizes encountered during photo-identification surveys in the summers of 2008, 2009 and 2010.

12
a) 2008
b) 2009
Figure 5. A map showing the location of encounters with groups of dolphins during surveys conducted in a) 2008 b) 2009 and c) 2010 (continued overleaf).
13
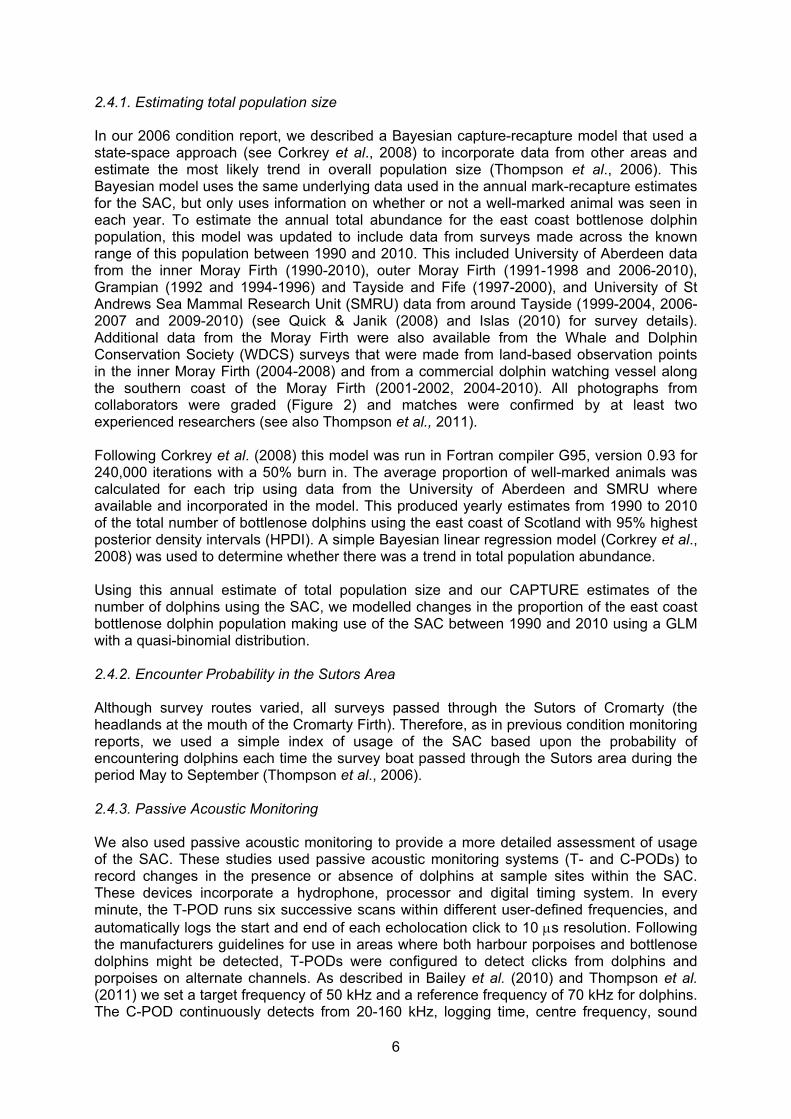
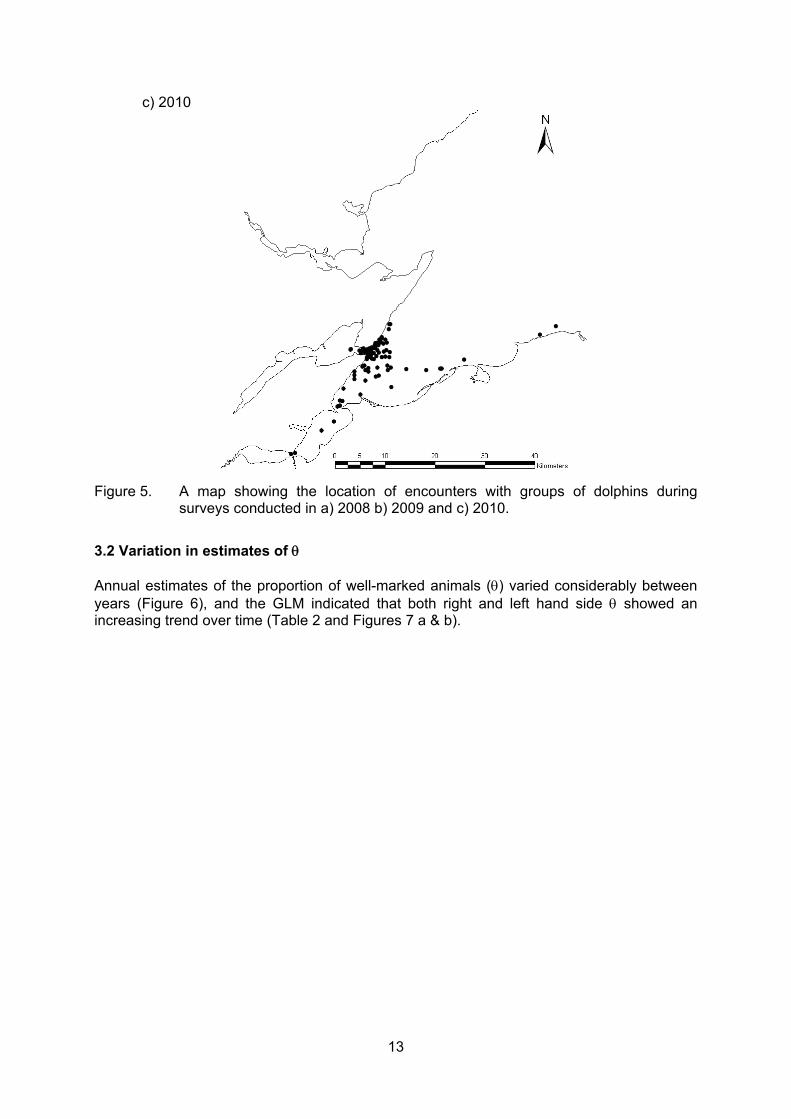
c) 2010
Figure 5. A map showing the location of encounters with groups of dolphins during surveys conducted in a) 2008 b) 2009 and c) 2010.
3.2 Variation in estimates of Annual estimates of the proportion of well-marked animals () varied considerably between years (Figure 6), and the GLM indicated that both right and left hand side showed an increasing trend over time (Table 2 and Figures 7 a & b).

14
1990 1995 2000 2005 2010
0.0
0.2
0.4
0.6
0.8
1.0
YEAR
Pro
po
rtio
n o
f We
ll-M
ark
ed
Do
lph
ins
Figure 6. The proportion of well-marked individuals (), right hand side (black squares)
and left hand side (clear circles) averaged by year from 1990 to 2010, with standard errors.
Table 2. The results of a generalised linear model on trends in the proportion of well-marked animals per trip, right hand side (RHS) and left hand side (LHS), from 1990 to 2010.
Variable Coefficient Standard error Z P RHS Intercept -44.8395 9.4624 -4.739 <0.0001 Year 0.0225 0.0047 4.755 <0.0001 LHS Intercept -39.7146 10.3348 -3.843 0.0001 Year 0.0199 0.0052 3.858 0.0001

15
a)
1990 1995 2000 2005 2010
0.0
0.2
0.4
0.6
0.8
1.0
Year
Pro
port
ion
of W
ell-
Ma
rked
Do
lphi
ns
(RH
S)
b)
1990 1995 2000 2005 2010
0.0
0.2
0.4
0.6
0.8
1.0
Year
Pro
por
tion
of M
arke
d D
olp
hin
s (L
HS
)
Figure 7. The proportion of well-marked animals per trip from 1990 to 2010 (clear circles)
with generalised linear model predicted values fitted line (red) and proportion of well-marked animals averaged per year (black squares), a) right hand side, b) left hand side.

16
The results of the GLMs investigating the variation in θ were very similar for both right and left hand sides. None of the biological variables in the models could explain the variability in θ and the models suggest that much of the variation is due to heterogeneity in sampling protocols. The model with the lowest AIC, which therefore best explains the variability in θ, was the one that included the change in survey protocol in 2001. Estimates of the proportion of well-marked individuals (θ) were higher in the period after the change in survey protocol. The mean value of θ from trips during the fixed and targeted surveys was similar to the modelled θ using the best fitting GLMs that included survey protocol (Table 3). Table 3. Proportion of well-marked animals for the fixed (1990-2000) and targeted (2001-
2010) survey protocols. Average proportion for right hand side (RHS), left hand side (LHS) and both sides combined (BOTH) from all trips and modelled θ from the best generalised linear model for right and left hand side and an averaged combined LHS and RHS modelled θ.
Fixed Survey Protocol Targeted Survey Protocol RHS LHS Both RHS LHS Both Average θ 0.4747 0.4655 0.4704 0.5639 0.5610 0.5624 Modelled θ 0.4728 0.4699 0.4716 0.5628 0.5577 0.5603
3.3 Estimate of the number of dolphins using the SAC High quality pictures were obtained of 60 well-marked individuals during the 2010 surveys. Using photographs of individual well-marked dolphins whether they were seen from the left, right or both sides, the mark-recapture estimate of the total number of well-marked individuals was 64 (95% Confidence Interval (CI) = 61-73). This estimate was inflated by the GLM modelled averaged combined right and left hand side proportion of well-marked individuals (θ = 0.5603). The resulting estimate of the number of dolphins using the SAC in the summer of 2010 was 114 (95% CI = 109-131). 3.4 Trends in the number of dolphins estimated to be using the SAC Previous abundance estimates of the number of dolphins in the SAC between 1990 and 2010 were also recalculated using the modelled value of θ (Figure 8). Between 2002 and 2010, the years presented in the SAC site condition monitoring reports, estimates ranged from 68 to 114 but with overlapping confidence limits (Table 4).
17
0
50
100
150
200
250
1990 1991 1992 1993 1994 1995 1996 1997 1998 1999 2000 2001 2002 2003 2004 2005 2006 2007 2008 2009 2010
Abundance Estimate
Year
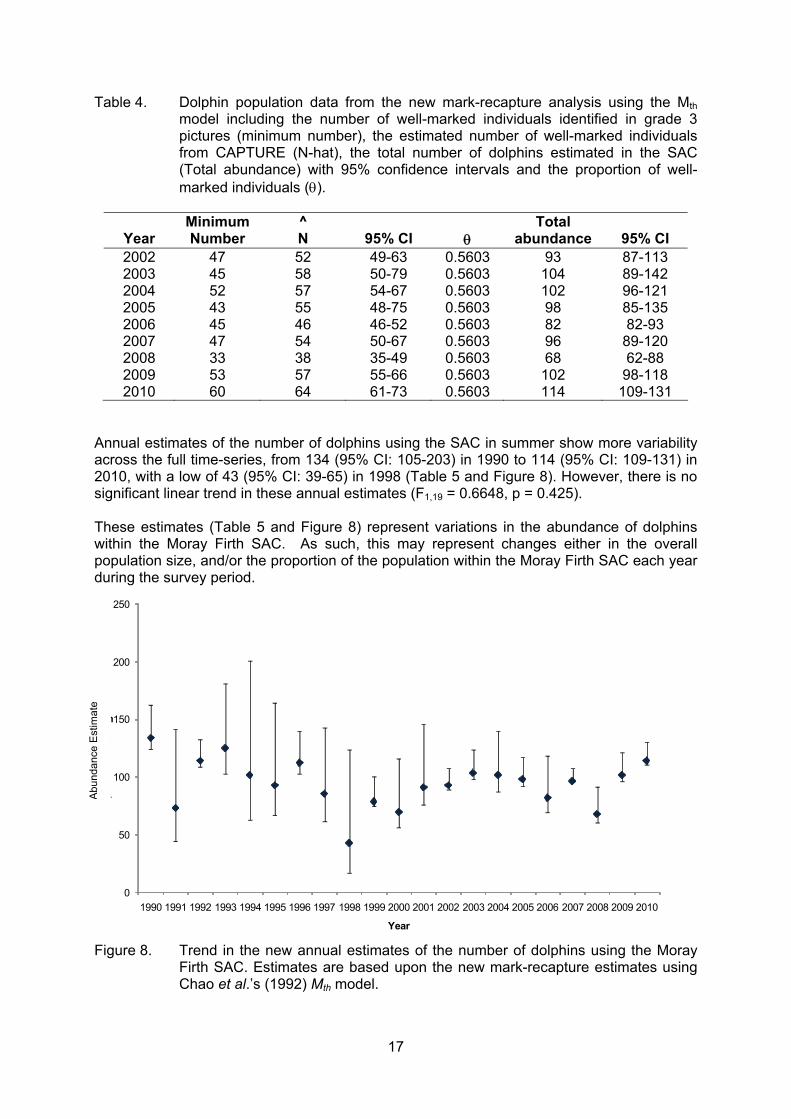
Table 4. Dolphin population data from the new mark-recapture analysis using the Mth model including the number of well-marked individuals identified in grade 3 pictures (minimum number), the estimated number of well-marked individuals from CAPTURE (N-hat), the total number of dolphins estimated in the SAC (Total abundance) with 95% confidence intervals and the proportion of well- marked individuals ().
Year Minimum Number
^ N
95% CI
Total abundance
95% CI
2002 47 52 49-63 0.5603 93 87-113 2003 45 58 50-79 0.5603 104 89-142 2004 52 57 54-67 0.5603 102 96-121 2005 43 55 48-75 0.5603 98 85-135 2006 45 46 46-52 0.5603 82 82-93 2007 47 54 50-67 0.5603 96 89-120 2008 33 38 35-49 0.5603 68 62-88 2009 53 57 55-66 0.5603 102 98-118 2010 60 64 61-73 0.5603 114 109-131
Annual estimates of the number of dolphins using the SAC in summer show more variability across the full time-series, from 134 (95% CI: 105-203) in 1990 to 114 (95% CI: 109-131) in 2010, with a low of 43 (95% CI: 39-65) in 1998 (Table 5 and Figure 8). However, there is no significant linear trend in these annual estimates (F1,19 = 0.6648, p = 0.425). These estimates (Table 5 and Figure 8) represent variations in the abundance of dolphins within the Moray Firth SAC. As such, this may represent changes either in the overall population size, and/or the proportion of the population within the Moray Firth SAC each year during the survey period.
Figure 8. Trend in the new annual estimates of the number of dolphins using the Moray Firth SAC. Estimates are based upon the new mark-recapture estimates using Chao et al.’s (1992) Mth model.
Abu
ndan
ce E
stim
ate
18
0
50
100
150
200
250
1990 1991 1992 1993 1994 1995 1996 1997 1998 1999 2000 2001 2002 2003 2004 2005 2006 2007 2008 2009 2010
Total Abundance
Year
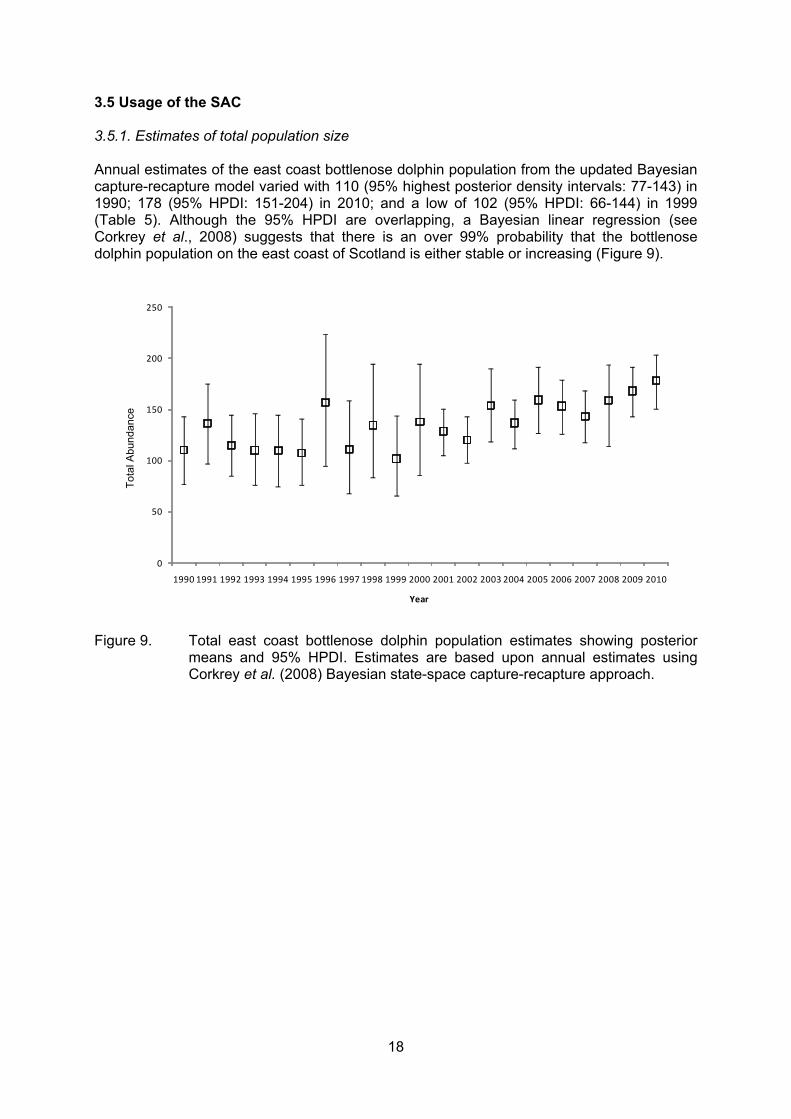
3.5 Usage of the SAC 3.5.1. Estimates of total population size
Annual estimates of the east coast bottlenose dolphin population from the updated Bayesian capture-recapture model varied with 110 (95% highest posterior density intervals: 77-143) in 1990; 178 (95% HPDI: 151-204) in 2010; and a low of 102 (95% HPDI: 66-144) in 1999 (Table 5). Although the 95% HPDI are overlapping, a Bayesian linear regression (see Corkrey et al., 2008) suggests that there is an over 99% probability that the bottlenose dolphin population on the east coast of Scotland is either stable or increasing (Figure 9).
Figure 9. Total east coast bottlenose dolphin population estimates showing posterior
means and 95% HPDI. Estimates are based upon annual estimates using Corkrey et al. (2008) Bayesian state-space capture-recapture approach.
Tot
al A
bund
ance
19
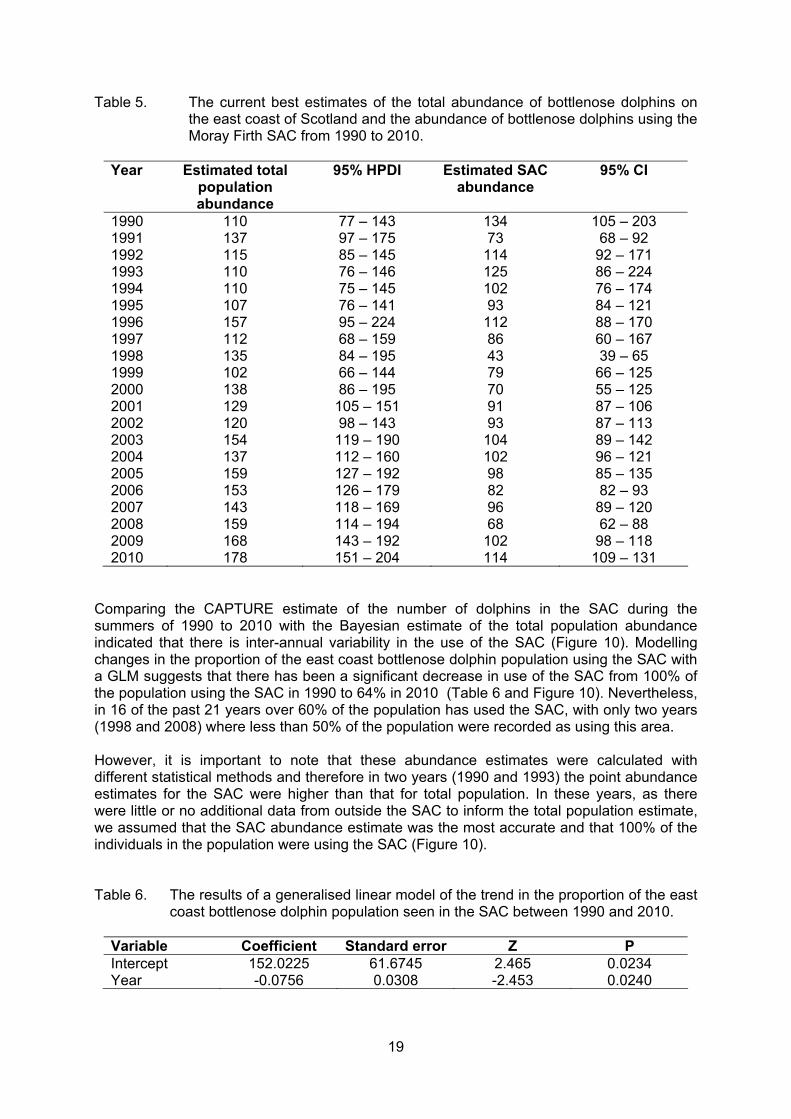
Table 5. The current best estimates of the total abundance of bottlenose dolphins on the east coast of Scotland and the abundance of bottlenose dolphins using the Moray Firth SAC from 1990 to 2010.
Year Estimated total
population abundance
95% HPDI Estimated SAC abundance
95% CI
1990 110 77 – 143 134 105 – 203 1991 137 97 – 175 73 68 – 92 1992 115 85 – 145 114 92 – 171 1993 110 76 – 146 125 86 – 224 1994 110 75 – 145 102 76 – 174 1995 107 76 – 141 93 84 – 121 1996 157 95 – 224 112 88 – 170 1997 112 68 – 159 86 60 – 167 1998 135 84 – 195 43 39 – 65 1999 102 66 – 144 79 66 – 125 2000 138 86 – 195 70 55 – 125 2001 129 105 – 151 91 87 – 106 2002 120 98 – 143 93 87 – 113 2003 154 119 – 190 104 89 – 142 2004 137 112 – 160 102 96 – 121 2005 159 127 – 192 98 85 – 135 2006 153 126 – 179 82 82 – 93 2007 143 118 – 169 96 89 – 120 2008 159 114 – 194 68 62 – 88 2009 168 143 – 192 102 98 – 118 2010 178 151 – 204 114 109 – 131
Comparing the CAPTURE estimate of the number of dolphins in the SAC during the summers of 1990 to 2010 with the Bayesian estimate of the total population abundance indicated that there is inter-annual variability in the use of the SAC (Figure 10). Modelling changes in the proportion of the east coast bottlenose dolphin population using the SAC with a GLM suggests that there has been a significant decrease in use of the SAC from 100% of the population using the SAC in 1990 to 64% in 2010 (Table 6 and Figure 10). Nevertheless, in 16 of the past 21 years over 60% of the population has used the SAC, with only two years (1998 and 2008) where less than 50% of the population were recorded as using this area. However, it is important to note that these abundance estimates were calculated with different statistical methods and therefore in two years (1990 and 1993) the point abundance estimates for the SAC were higher than that for total population. In these years, as there were little or no additional data from outside the SAC to inform the total population estimate, we assumed that the SAC abundance estimate was the most accurate and that 100% of the individuals in the population were using the SAC (Figure 10). Table 6. The results of a generalised linear model of the trend in the proportion of the east
coast bottlenose dolphin population seen in the SAC between 1990 and 2010.
Variable Coefficient Standard error Z P Intercept 152.0225 61.6745 2.465 0.0234 Year -0.0756 0.0308 -2.453 0.0240
20
1990 1995 2000 2005 2010
0.0
0.2
0.4
0.6
0.8
1.0
Year
Pro
po
rtio
n o
f T
ota
l P
op
ula
tio
n u
sin
g t
he
SA
C
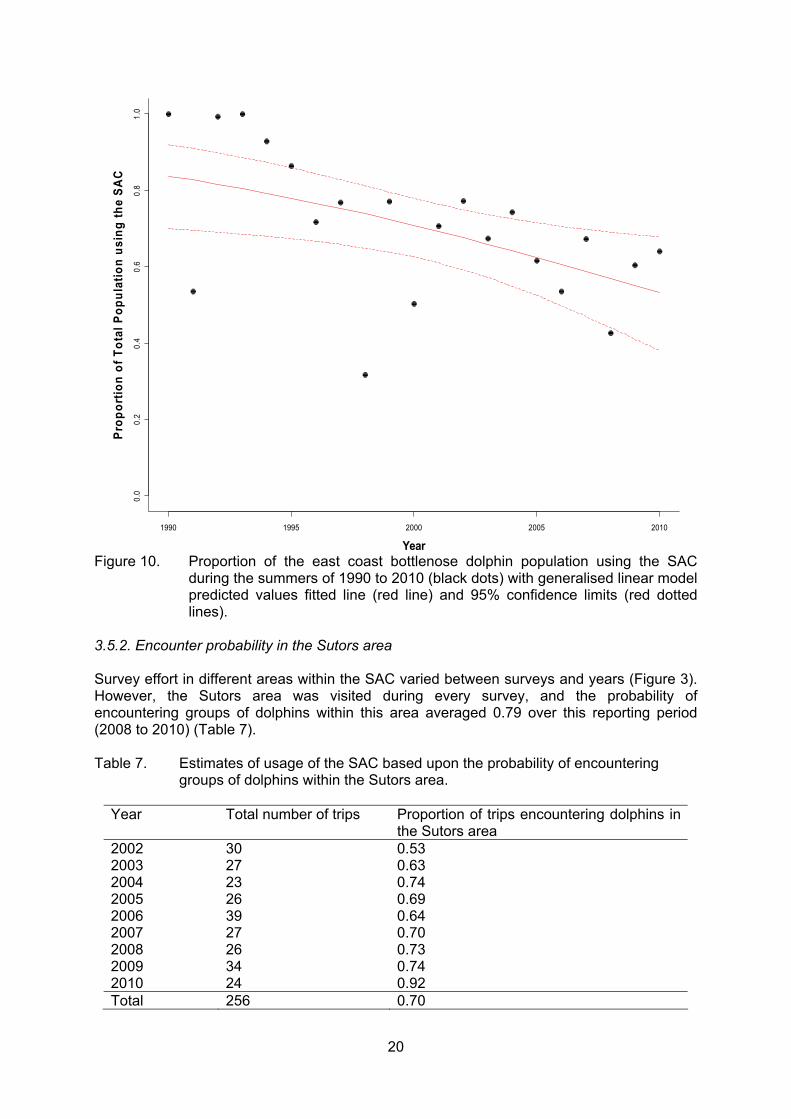
Figure 10. Proportion of the east coast bottlenose dolphin population using the SAC
during the summers of 1990 to 2010 (black dots) with generalised linear model predicted values fitted line (red line) and 95% confidence limits (red dotted lines).
3.5.2. Encounter probability in the Sutors area
Survey effort in different areas within the SAC varied between surveys and years (Figure 3). However, the Sutors area was visited during every survey, and the probability of encountering groups of dolphins within this area averaged 0.79 over this reporting period (2008 to 2010) (Table 7). Table 7. Estimates of usage of the SAC based upon the probability of encountering
groups of dolphins within the Sutors area.
Year Total number of trips Proportion of trips encountering dolphins in the Sutors area
2002 30 0.53 2003 27 0.63 2004 23 0.74 2005 26 0.69 2006 39 0.64 2007 27 0.70 2008 26 0.73 2009 34 0.74 2010 24 0.92 Total 256 0.70

21
3.5.3. Passive Acoustic Monitoring
In 2010, at least one month of data were collected from paired C-PODs and T-PODs at 12 sites across the Moray Firth, including the three sample sites (Sutors, Chanonry and Lossiemouth, see Figure 1) used in this report. Comparison of the number of hours in which dolphin detections were recorded at these sites indicated that, on average, there was no difference in the performance of these two types of devices when data were analysed at the hourly scale (Figure 11).
9630-3-6-9
600
500
400
300
200
100
0
T-POD DPH/DAY minus C-POD DPH/DAY
Fre
que
ncy
Figure 11. Frequency distribution of differences in the number of hours that dolphins were detected on paired T-PODs and C-PODs that were moored at 12 sites across the Moray Firth in 2010.
Data from T-PODs and C-PODs deployed between May and September at the three sampling sites within the Moray Firth between 2006 and 2010 are presented in Figure 12. These data show broadly similar patterns within these three sites across this period, with higher use of the Sutors and Chanonry areas compared with the section of coast at Lossiemouth.

22
a) Sutors
2 0 1 02 0 0 92 0 0 82 0 0 72 0 0 6
2 0
1 5
1 0
5
0Med
ian
No.
Dol
phin
+ve
Hou
rs/d
ay
b) Chanonry
2 0 1 02 0 0 92 0 0 82 0 0 72 0 0 6
2 0
1 5
1 0
5
0Med
ian
No.
Dol
phin
+ve
Hou
rs/d
ay
c) Lossiemouth
2 0 1 02 0 0 92 0 0 82 0 0 72 0 0 6
2 0
1 5
1 0
5
0Med
ian
No
. Do
lph
in +
ve H
ours
/da
y
Figure 12. Year to year variation in the median number of hours/day (+/- IQ ranges) that dolphins were detected on T-PODs and C-PODs moored in the Sutors, Chanonry and Lossiemouth.
23
4 DISCUSSION
Currently, there are three attributes and associated targets for the bottlenose dolphin feature of the SAC, as outlined in the Site Attribute Table presented in Appendix II. Attribute 1.1.1 relates to the number of dolphins using the SAC; 1.1.2 to the frequency of occurrence of dolphins within the SAC and 1.1.3 to overall trends in the dolphin population. These attributes are updated slightly from the previous reports (Thompson et al., 2006, 2009) in reflection of the increased information now available on the dolphin population and therefore our understanding of the most suitable attributes to use in monitoring its condition. The existing photo-identification monitoring programme focuses on providing data to address the first two of these attributes (the number of individual dolphins using the SAC and the frequency of occurrence of dolphins within the SAC). Additional data from ongoing studies including other collaborative projects, related POD studies and analysis of changes in the use of the Sutors area, monitored on every photo-identification survey, provide extra information to assess these attributes. The data from ongoing studies outside the SAC, by ourselves and collaborators, can also be used to monitor the remaining attribute (dolphin population trends). Because of the large size of the SAC, efforts to monitor changes in the number of dolphins using the SAC (Attribute 1.1.1) have been based upon photo-identification surveys within a core study area in the inner Moray Firth. This has the advantage that sighting probability is higher in this intensively used area, and abundance estimates are therefore more precise. Furthermore, data collected during this monitoring programme can be more clearly related to the existing time series of data from this core study area (Thompson et al., 2004). Using data collected in the 2010 surveys, we estimated that 114 (95% CI: 109-131) different bottlenose dolphins used the SAC during the period May to September. This is the highest estimate of the number of dolphins in the SAC since reporting began in 2002. It remains possible that other individuals use other parts of the SAC, but are never recorded within the core study area in the inner Moray Firth. However, three lines of evidence support our assumption that this core study area provides a good proxy for use of the whole SAC. First, during extensive visual and acoustic surveys conducted across the whole of the SAC in the summers of 2004 and 2005, 84% of dolphin encounters were within the core study area (Bailey & Thompson, 2009). Second, most remaining sightings were along the southern Moray Firth coast, and related photo-identification studies have shown that animals using these areas also use the core study area (Wilson et al., 1999; Durban et al., 2005). Thirdly, work completed as part of a Scottish Government and Scottish Natural Heritage funded project identified that in 2006 and 2007 over 80% of the well-marked dolphins seen on the southern coast of the outer Moray Firth were also identified within the SAC in those years. Only 11 well-marked individuals seen in this area in 2006 or 2007 were not seen in the SAC over this period, and only one has never been seen in the SAC (Thompson et al., 2011). The method for estimating abundance in the previous site condition monitoring reports (Thompson et al., 2006, 2009) was refined for this reporting period. Comparison of trends in the number of well-marked animals and the total SAC abundance suggested that variation in the proportion of well-marked animals (θ) has influenced year to year variation in the estimate of abundance within the Moray Firth SAC. This is not an issue if the variability and increasing trend in θ was a result of biological variables (e.g. an aging population). However, modelling θ suggested that no measured biological variables could explain the trend in θ and that this trend is a result of changes in the sampling protocol. This may result from the change from a fixed survey route to targeted surveys, but it could also be related to a switch from film to digital photographs. Whatever the underlying cause, we suggest it is now appropriate to use a modelled value of θ to take account of this heterogeneity. As only nicked animals are used to estimate abundance, we also adapted our CAPTURE method to combine data from both sides at the beginning rather than the end of the estimation process.

24
This approach was initially introduced in Corkrey et al.’s (2008) analyses of this dataset. We re-analysed the data from 1990 to 2010 with this revised approach. Comparisons of the coefficient of variations (CV) of our old (0.34) and new (0.25) abundance estimates show that these new estimates display less inter-annual variability (less variance around the mean) and the confidence limits, especially in years with less data, have been reduced. We suggest that reducing sampling heterogeneity from these two parts of our estimation process provides a more robust view of changes in abundance within the SAC. Although, there is clearly still inter-annual variability in the number of dolphins seen in the SAC there was no significant trend in abundance between 1990 and 2010. These data now provide opportunities for further work that can explore the factors that may be driving the inter-annual changes in the number of animals within the SAC. The second site attribute is the frequency of occurrence of dolphins within the SAC. In previous assessments we used a simple estimator which provided information on variations in the probability of sighting dolphins in the Sutors area (an area visited on every survey). More recent data confirms that dolphins continue to be encountered within this area at a high rate (on an average of 70% of visits to the area). Passive acoustic monitoring data also suggest that the Sutors and Chanonry areas are used regularly by dolphins, typically for several hours each day during the summer sampling period. For this assessment we were able to augment the second site attribute by updating Corkrey et al.’s (2008) estimate of overall abundance for the east coast of Scotland bottlenose dolphin population, and compare this to estimates of the number of individuals using the SAC. Between 1990 and 2010 there appears to be a decreasing trend in the proportion of the total population using the SAC, but this seems to be driven by an increase in overall population size (Figure 9) rather than a reduction in the number of dolphins using the SAC (Figure 8) . Despite this reduction in most years, more than 60% of the population are seen within this area. This suggests that the SAC is still used by the majority of this bottlenose dolphin population, but that it is less important to the population as a whole in 2010 than it was in 1990. Our most comprehensive photo-identification dataset from 2006 and 2007 showed that 46% of the well-marked animals seen in those years were only identified outside the SAC. Of these, 30% were seen in the SAC within the last five years but 38% have never been seen in the SAC (Thompson et al., 2011). This adds weight to Wilson et al.’s (2004) research identifying that this population has expanded its range and also suggests that a small number of individuals may have never visited the SAC. The third site attribute relates to overall trends in the east coast of Scotland dolphin population. Monitoring to address this attribute requires photo-identification data to be collected both within and outside the SAC. Although data for areas outside the SAC for all years are not available, additional data collected by ourselves between 2006 and 2010 and between 2003 and 2010 in the Tayside area by SMRU have allowed the update of the Bayesian method developed by Corkrey et al. (2008) to estimate population abundance and trends from 1990 to 2010. Comparisons of these estimates to published total abundance estimates is possible for some years, for example, the commonly used estimate of 129 (95% CI: 110-174) for 1992 (Wilson et al., 1999) is higher than this Bayesian modelled 1992 estimate of 115 (95% HPDI: 85-145) and our most recent estimate of 195 (95% HPDI: 162-253) for 2006 (Cheney et al., 2012) is again higher than this report’s 2006 estimate of 153 (95% HPDI: 126-179). Although these new population estimates are calculated using different statistical techniques and are lower than published estimates, they do have overlapping confidence limits which provides support for their use. Earlier modelling work predicted a negative population growth rate (Sanders-Reed et al., 1999). Subsequent work by Corkrey et al. (2008) using data from 1990 to 2002 suggested that the population may have been decreasing, but that the evidence for the decline was weak. Our update of this same Corkrey et al. (2008) model now suggests there is no evidence of a decline, and it is probable that the dolphin population on the east coast of
25
Scotland is either stable or increasing. However, increases in effort outside the SAC and as far south to the Tay in recent years could have latterly resulted in an increase in estimated population abundance. Wilson et al., (2004) found evidence suggesting that this population expanded its range outside the Moray Firth during the 1990s. Although extension of our survey effort to these areas lagged behind this range expansion, this suggests that our effort over this time period has been sufficient to sample the changing home range of this population and that evidence of a stable or increasing trend is valid. In summary, and building on the results of the last assessments, the quality of data available for completing the Site Attribute Table is high. In May 2005, the original condition monitoring assessment concluded that the current condition of the population was “Unfavourable (no change)” (Thompson et al., 2006). Subsequent analysis of monitoring data from 2003 and 2004 indicated that there was a higher probability that targets 1.1.1 and 1.1.2 were being met, and this was reflected in a revision of the condition status to “Unfavourable (recovering)” (Thompson et al., 2006). The interim report for 2005-2007 highlighted that there was significant inter-annual variation in the indicators being monitored, and it remained unclear to what extent this resulted from sampling variation or genuine biologically significant changes and therefore the condition status was not changed (Thompson et al., 2009). Recent analysis for this report suggests that sampling variation has affected estimates of abundance and revising our methods to take account of this can provide more robust estimates. New abundance estimates using this method suggest that there is a high probability that target 1.1.1 is being met. Visual and passive acoustic monitoring results also suggest target 1.1.2 is being met, with the data indicating similar patterns of use of the SAC by dolphins over the reporting period. Although the proportion of the population using the SAC appears to be decreasing, available data suggest that this is due to an increase in our estimate of total population size rather than a decline in the number of animals using the SAC. Updating the previously used Bayesian capture-recapture model has suggested that the number of animals in the population is either stable or increasing, meeting target 1.1.3. Therefore all attributes for the bottlenose dolphin feature of the Moray Firth SAC are currently being met.

26
5 REFERENCES Bailey, H. & Thompson, P.M. (2009) Using marine mammal habitat modelling to identify priority conservation zones within a marine protected area. Marine Ecology Progress Series, 378: 279-287. Bailey, H., Clay, G., Coates, E.A., Lusseau, D., Senior, B. & Thompson, P.M. (2010) Using T-PODs to assess variations in the occurrence of coastal bottlenose dolphins and harbour porpoises. Aquatic Conservation: Marine and Freshwater Ecosystems 20: 150-158. Burnham, K. P. & Anderson, D.R. (2002) Model Selection and Multimodel Inference: A Practical Information-Theoretic Approach, 2nd ed. Springer-Verlag. Chao, A., Lee, S.M. & Jeng, S.L. (1992) Estimating population size for capture-recapture data when capture probabilities vary by time and individual animal. Biometrics, 48: 201-216. Cheney, B., Thompson, P.M., Ingram, S.N., Hammond, P.S., Stevick, P.T., Durban, J.W., Culloch, R.M., Elwen, S.H., Mandleberg, L., Janik, V.M., Quick, N.J., Islas-Villanueva, V., Robinson, K.P., Costa, M., Eisfeld, S.M., Walters, A., Phillips, C., Weir, C.R., Evans, P.G.H., Anderwald, P., Reid, R.J., Reid, J.B. & Wilson, B. (2012) Integrating multiple data sources to assess the distribution and abundance of bottlenose dolphins (Tursiops truncatus) in Scottish waters. Mammal Review. Corkrey, R., Brooks, S., Lusseau, D., Parsons, K., Durban, J.W., Hammond, P.S. & Thompson, P.M. (2008) A Bayesian capture-recapture population model with simultaneous estimation of heterogeneity. Journal of the American Statistical Association, 103: 948-960. Durban, J.W., Elston, D.A.,Ellifrit, D.K., Dickson, E., Hammond, P.S. & Thompson, P.M. (2005) Multi-site mark-recapture population estimates with Bayesian model determination. Marine Mammal Science, 21: 80-92. Islas, V. (2010) Genetic characterisation and social structure of the east Scotland population of bottlenose dolphins (Tursiops truncatus). PhD Thesis, University of St. Andrews, St. Andrews, UK. Lusseau, D., Williams, R., Wilson, B., Grellier, K., Barton, T., Hammond, P.S. & Thompson, P.M. (2004) Parallel influence of climate on the behaviour of Pacific killer whales and Atlantic dolphins. Ecology Letters, 7: 1068-1076. Philpott, E., Englund, A., Ingram, S. and Rogan, E. (2007) Using T-PODs to investigate the echolocation of coastal bottlenose dolphins. Journal of the Marine Biological Association of the UK, 87: 11-17. Quick, N.J. & Janik, V.M. (2008) Whistle rates of wild bottlenose dolphins: influences of group size and behavior. Journal of Comparative Psychology, 122: 305-311. R Development Core Team (2010). R: A language and environment for statistical computing. R Foundation for Statistical Computing, Vienna, Austria. ISBN 3-900051-07-0, URL http://www.R-project.org/. Rexstadt, E. & Burnham, K.P. (1991) User's Guide for Interactive Program CAPTURE. Colorado Cooperative Fish and Wildlife Research Unit, Colorado State University, Fort Collins, CO, USA.
27
Sanders-Reed, C. A., Hammond P. S., Grellier, K. & Thompson, P. M. (1999) Scottish National Heritage Research, Survey and Monitoring Report No. 156. Edinburgh: Scottish National Heritage. Thompson, P.M., Lusseau, D. Corkrey, R & Hammond, P.S. (2004) Moray Firth bottlenose dolphin monitoring strategy options. Scottish Natural Heritage Commissioned Report No. 079 (ROAME No. F02AA409). Thompson, P.M., Corkrey, R., Lusseau, D., Lusseau, S., Quick, N., Durban, J.W., Parsons, K.M. & Hammond, P.S. (2006) An assessment of the current condition of the Moray Firth bottlenose dolphin population. Scottish Natural Heritage Commissioned Report No. 175 (ROAME No. F02AC409). Thompson, P.M, Cheney, B., Cândido, A.T. & Hammond, P.S. (2009) Site Condition Monitoring of bottlenose dolphins within the Moray Firth Special Area of Conservation: Interim report 2005-2007. Internal report to Scottish Natural Heritage. Thompson, P.M., Lusseau, D., Barton, T., Simmons, D., Rusin, J. & Bailey, H. (2010) Assessing the responses of coastal cetaceans to the construction of offshore wind turbines. Marine Pollution Bulletin, 60: 1200-1208. Thompson, P.M., Cheney, B., Ingram, S., Stevick, P., Wilson, B. & Hammond, P.S. (Eds) (2011). Distribution, abundance and population structure of bottlenose dolphins in Scottish waters. Scottish Government and Scottish Natural Heritage funded report. Scottish Natural Heritage Commissioned Report No. 354. Wilson, B., Thompson, P.M. & Hammond, P.S. (1997) Habitat use by bottlenose dolphins: seasonal distribution and stratified movement patterns in the Moray Firth, Scotland. Journal of Applied Ecology, 34: 1365-1374. Wilson, B., Hammond, P.S. & Thompson, P.M. (1999) Estimating size and assessing trends in a coastal bottlenose dolphin population. Ecological Applications, 9: 288-300. Wilson, B., Reid, R.J., Grellier, K., Thompson, P.M. & Hammond, P.S. (2004) Considering the temporal when managing the spatial: a population range expansion impacts protected areas based management for bottlenose dolphins. Animal Conservation, 7: 331-338.

28
APPENDIX I – EXAMPLE RAW DATA TABLES Overview This Appendix contains five Tables of the raw data used in this project to produce estimates of the number of dolphins using the Moray Firth SAC. Full Tables are provided in electronic format. Only the first few rows of each Table are displayed as an illustration the format of each file. In all cases, “-99” is an identifier for no data.
1. Surveys – containing basic information on the date and timing of surveys, with a unique “trip number” that links these data to those from any encounters with groups of dolphins during that survey.
TRIP_NO DATE TIMESTART TIMEEND NO. OF
ENCOUNTERS NO. OF
PICTURES NO. OF Q3 PICTURES
1083 07-May-08 9.3 14.23 4 188 54 1084 15-May-08 8.52 13.26 5 219 48 1085 16-May-08 9.5 13.41 1 140 53 1086 20-May-08 8.54 13.44 2 89 17 1087 30-May-08 9.31 14.03 3 310 90 1088 02-Jun-08 9.26 16.53 5 451 62 1089 05-Jun-08 7.05 12.48 7 302 61 1090 06-Jun-08 11.35 13.32 2 47 14 1091 12-Jun-08 9.4 14.44 3 90 11 1092 13-Jun-08 9.4 12.05 2 235 65 1093 24-Jun-08 6.06 11 1 110 23 1094 03-Jul-08 6.01 12.35 5 580 160 1095 17-Jul-08 10.02 15.39 5 367 92
2. Encounters – containing information on the location of the start of the survey, estimates of group size, and a unique “encounter number” that links these data with any photo-graphs and sightings of individually recognisable dolphins.
TRIP_NO ENCOUNTER GROUP SIZE START_LAT START_LONG YEAR
1082 2055 1 57.6971758800 -3.9669748400 2008 1083 2056 3 57.6889287600 -4.0066336900 2008 1083 2057 6 57.6534090800 -4.0214967400 2008 1083 2058 7 57.5804822400 -4.0882047200 2008 1083 2059 1 57.5916863800 -4.0845903500 2008 1084 2063 8 57.6403666600 -3.9652803300 2008 1084 2064 6 57.6408249600 -3.9663258800 2008 1084 2062 8 57.6719661700 -3.9876064600 2008 1084 2061 2 57.6878158400 -4.0138353700 2008 1084 2060 4 57.6874352200 -4.0105995700 2008 1085 2065 7 57.6595910100 -4.0035511100 2008 1086 2066 10 57.6876038500 -4.0001620900 2008 1086 2067 5 57.6081215800 -4.0218392500 2008

29
3. Pictures – containing information on all Grade 3 pictures and the confirmed ID
numbers of any dolphins in that picture. ENCOUNTER FRAME SIDE Conf_ID
2056 AU08-1083-038 R 573 2056 AU08-1083-041 R 732 2056 AU08-1083-010 R 573 2056 AU08-1083-039 R 1018 2056 AU08-1083-037 R 732 2056 AU08-1083-034 R 1018 2056 AU08-1083-032 R 732 2056 AU08-1083-024 R 1018 2056 AU08-1083-018 R 573 2056 AU08-1083-014 L 1018 2056 AU08-1083-012 L 1018 2056 AU08-1083-040 R 732 2057 AU08-1083-114 L 440 2057 AU08-1083-076 L 990 2057 AU08-1083-077 L 1014
4. Inflation factor – containing the number of well-marked and unmarked dolphins photographed on each trip, and the resulting estimate of .
Year Trip L_Marked L_total θ R_Marked R_total θ 2008 1083 5 11 0.455 3 10 0.300 2008 1084 6 14 0.429 6 13 0.462 2008 1085 3 4 0.750 4 7 0.571 2008 1086 1 5 0.200 4 11 0.364 2008 1087 10 17 0.588 10 16 0.625 2008 1088 11 14 0.786 10 15 0.667 2008 1089 8 15 0.533 12 22 0.545 2008 1090 1 2 0.500 1 3 0.333 2008 1091 2 5 0.400 0 1 0.000 2008 1092 6 14 0.429 4 9 0.444 2008 1093 0 2 0.000 4 8 0.500 2008 1094 10 23 0.435 10 18 0.556 2008 1095 4 10 0.400 7 15 0.467 2008 1096 9 12 0.750 14 22 0.636 2008 1097 12 18 0.667 11 19 0.579

30
5. Mark-recapture matrices – containing the input matrices for programme CAPTURE that were used to provide the estimate of abundance in each of the three reporting years. Each row represents one well-marked dolphin (with the ID number in the first column). Subsequent columns represent each survey in the year, with a 0 or 1 representing whether or not there was a confirmed sighting from a grade 3 picture for that individual, e.g. 2010
0001 000000010000000000000010 0008 000001011110001000000101 0011 000001000000010010000101 0023 100000100001110010000001 0030 101001000000010000000001 0031 100000010100010000001000 0036 101000010100000000000000 0042 000000010000000000000000 0049 000001111010011000000000 0052 000001000000010010000110 0060 000000000000010000000000 0064 011011111110000010000101 0079 110001000000010000000001 0105 100000010000010000001000 0129 000000100000000000000000 0157 000000101000000000000000 0192 011000100100000010100001 0209 000000010000000000000000 0307 000000000000000000000010 0344 000000000000000000000001 0430 000000000000010000000100 0435 000001011100000010000101 0573 111010110101111010000001 0578 011100000000010000101001 0580 111001000100010000001001 0744 100000110000000000001000 0745 000001111000010010000111 0748 101000010000010000001001 0760 000000000000000001000011 0773 000001010000000000000000 0800 000000000000100000000101 0805 111001000000000000000001 0815 100111000111110000101000 0817 000001010011000001000000 0820 000000011000010010000011 0849 000000011111111011000010 0856 000000011010011010010100 0866 000100000000000000001000 0885 000000000000000101000001 0901 000000000000000001000011 0904 000000111111000110010000 0907 001011010100000000001001 0908 000000000000010100000000 0914 000000011011010010010100 0923 010001110010000001000001 0965 000000000000010010000001 0969 001011111111000000001101 0972 000000010111111100000100 0985 000000000000000000000010

31
0991 111100000000010000101001 0997 000000010110111101100100 1013 000000000000000100000010 1016 000000110110011100010100 1022 011100000000010000101001 1025 001000000000000000001000 1027 101001010001101000101001 1028 000001010101110010000100 1032 000000110110110010000100 1042 000001000000000000000000 1063 000001100111111000100010
32
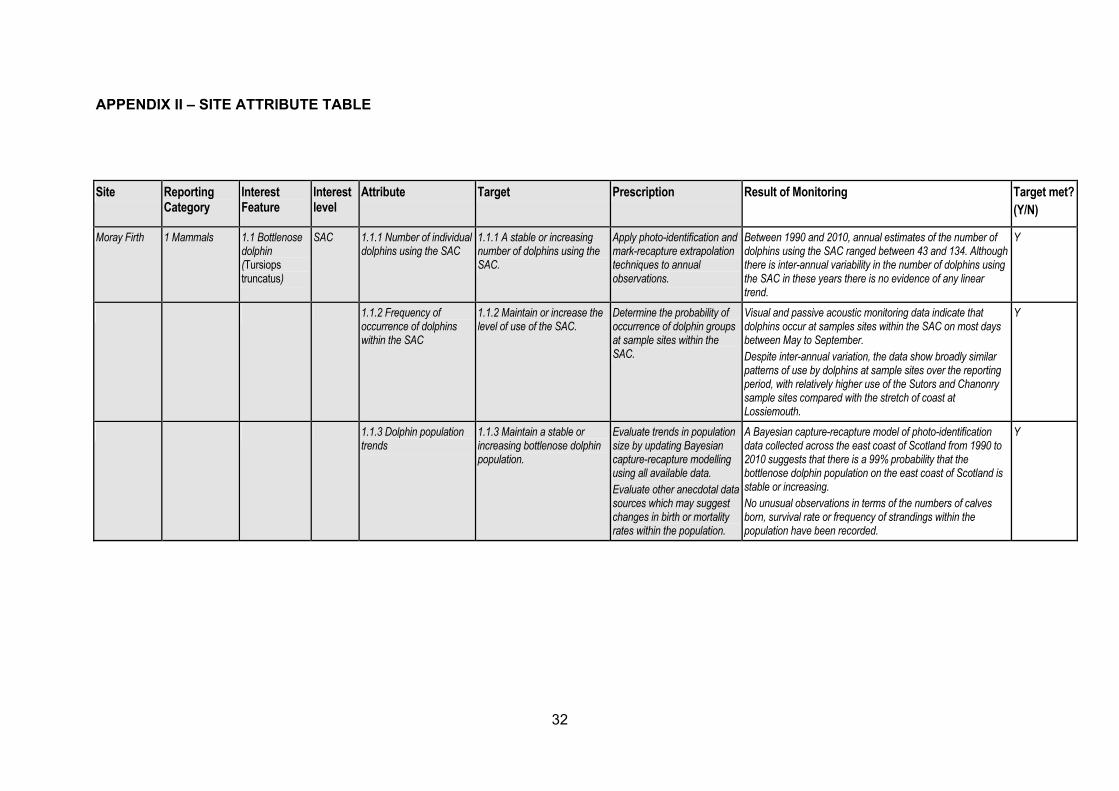
APPENDIX II – SITE ATTRIBUTE TABLE Site Reporting
Category Interest Feature
Interest level
Attribute Target Prescription Result of Monitoring Target met? (Y/N)
Moray Firth 1 Mammals 1.1 Bottlenose dolphin (Tursiops truncatus)
SAC 1.1.1 Number of individual dolphins using the SAC
1.1.1 A stable or increasing number of dolphins using the SAC.
Apply photo-identification and mark-recapture extrapolation techniques to annual observations.
Between 1990 and 2010, annual estimates of the number of dolphins using the SAC ranged between 43 and 134. Although there is inter-annual variability in the number of dolphins using the SAC in these years there is no evidence of any linear trend.
Y
1.1.2 Frequency of occurrence of dolphins within the SAC
1.1.2 Maintain or increase the level of use of the SAC.
Determine the probability of occurrence of dolphin groups at sample sites within the SAC.
Visual and passive acoustic monitoring data indicate that dolphins occur at samples sites within the SAC on most days between May to September. Despite inter-annual variation, the data show broadly similar patterns of use by dolphins at sample sites over the reporting period, with relatively higher use of the Sutors and Chanonry sample sites compared with the stretch of coast at Lossiemouth.
Y
1.1.3 Dolphin population trends
1.1.3 Maintain a stable or increasing bottlenose dolphin population.
Evaluate trends in population size by updating Bayesian capture-recapture modelling using all available data. Evaluate other anecdotal data sources which may suggest changes in birth or mortality rates within the population.
A Bayesian capture-recapture model of photo-identification data collected across the east coast of Scotland from 1990 to 2010 suggests that there is a 99% probability that the bottlenose dolphin population on the east coast of Scotland is stable or increasing. No unusual observations in terms of the numbers of calves born, survival rate or frequency of strandings within the population have been recorded.
Y
33
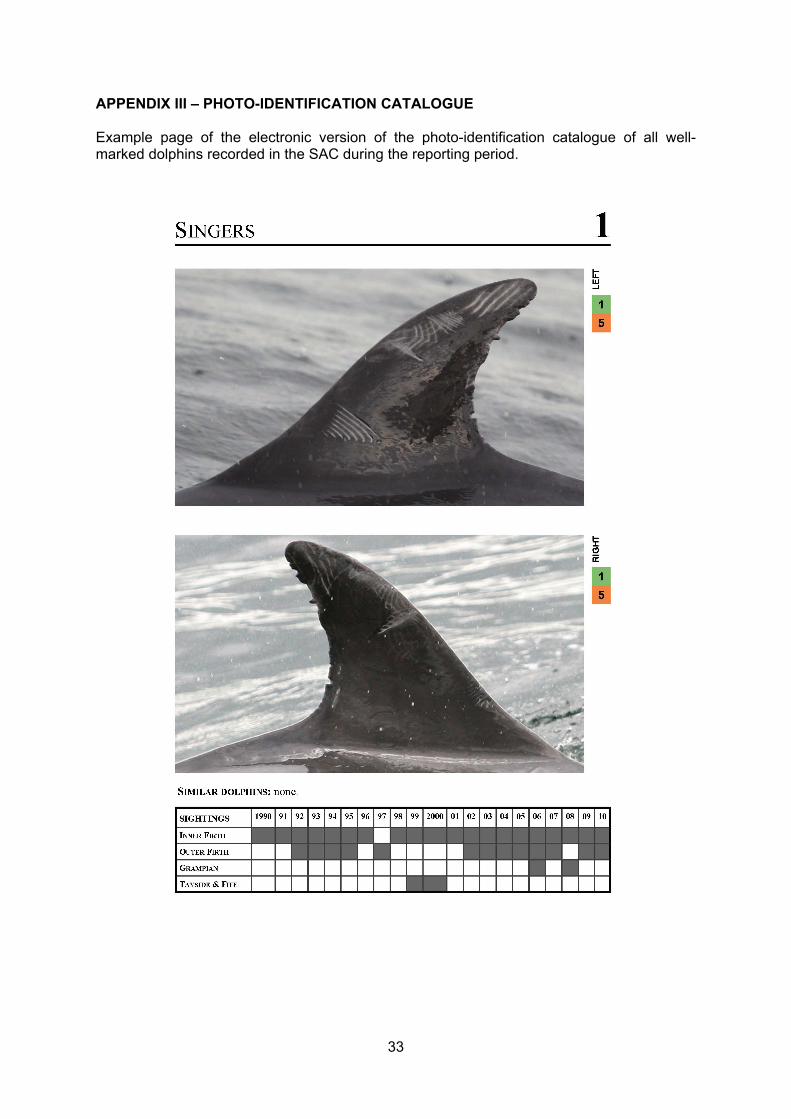
APPENDIX III – PHOTO-IDENTIFICATION CATALOGUE Example page of the electronic version of the photo-identification catalogue of all well-marked dolphins recorded in the SAC during the reporting period.
34
APPENDIX IV – GIS PROJECT The GIS Project “snh 2010.mxd” contains GPS derived tracks of all surveys conducted by AULFS as well as locations of all encounters with bottlenose dolphins during these surveys in the Inner Moray Firth between May and September in 2008, 2009 and 2010. The project should run from the CD if used on any PC running ArcMap, as long as the CD drive is designated as the D: drive. Each survey track is provided as a .dbf and shapefile labelled with trip number and the date of the trip is included in the attribute table. Encounters are grouped by year and provided as an excel spreadsheet and shapefile for each year and in the attribute table there is information on each individual encounter. This information includes the encounter number, latitude and longitude of the start of each encounter, date, trip number and the number of dolphins in the encounter. The ArcMap Project includes a map of Great Britain with the UKSACs. There are three layers, each containing all the individual survey trip trails conducted in 2008, 2009 and 2010 (e.g. 2008_Trips). There are also three other layers, each containing all the bottlenose dolphin encounters in 2008, 2009 and 2010 (e.g. 2008_Encounters). The survey tracks from each trip are found separately in the layers for each year (e.g. 1082_trail is a trip trail from 2008 within the 2008 layer).

www.snh.gov.uk© Scottish Natural Heritage 2012ISBN: 978-1-85397-864-7
Policy and Advice Directorate, Great Glen House,Leachkin Road, Inverness IV3 8NWT: 01463 725000
You can download a copy of this publication from the SNH website.