Embed Size (px)
Citation preview
ABSTRACT
Title of Document: COLOR SELECTION IN OBJECT DRAWINGS OF YOUNG CHILDREN
Karen Jesuit Drosinos, Master of Arts, 2006
Directed By: Dr. Susan M. Hendricks, College of Education,Department of Curriculum and Instruction
This action research study examined the selection of color used in six object
drawings of young children. Study sample size consisted of eighteen Kindergarten
students from a public elementary school in Prince George’s County Public School
System, Maryland. This study was organized into three phases. Each phase asked student
participants to draw six familiar objects (tree, house, boy, dog, girl, car) while limiting
the amount of color selection in each phase. The use of logical color and expressive
color was investigated and scores were given to each drawing in order to compare logical
color usage. Color trends were also documented to show possible color associations in
young children’s representation of everyday objects. The results found that there was an
increase in the use of logical color as the selection of color in each phase was minimized.
Strong color trends were shown in the representation of the tree and boy images.
COLOR SELECTION IN OBJECT DRAWINGS OF YOUNG CHILDREN
By
Karen Jesuit Drosinos
Thesis submitted to the Faculty of the Graduate School of the University of Maryland, College Park, in partial fulfillment
of the requirements for the degree ofMaster of Arts
2006
Advisory Committee:Dr. Susan M. Hendricks; EDCIDr. Julianne K. Ferris; EDCIDr. Olivia N. Saracho; EDCI
© Copyright byKaren Jesuit Drosinos
2006

ii
Dedication
To my dad, Charles Jesuit, who teaches by example that with courage, strength, and
determination, anything is possible.
iii
Acknowledgements
I would like to thank:
My husband, John, for always asking the right questions and encouraging me to find the
answers.
My newborn daughter, Melina Grace, for giving me the “kicks” I needed to finish this
thesis.
My Kindergarten students, who were always eager to meet me at the drawing table.
My advisor, Dr. Susan Hendricks, for her unending support, guidance, and
encouragement.
iv
Table of Contents
Dedication ........................................................................................................................... iiAcknowledgements............................................................................................................ iiiTable of Contents............................................................................................................... ivList of Tables ..................................................................................................................... viList of Figures ................................................................................................................... viiChapter I: Introduction to the Study .................................................................................. 1
Background ..................................................................................................................... 1Purpose of the Study ....................................................................................................... 1Scope and Methodology ................................................................................................. 3
1. Research Questions................................................................................................ 32. Scope...................................................................................................................... 33. Methodology.......................................................................................................... 3
Organization of Study..................................................................................................... 6Chapter II: Literature Review ............................................................................................ 8
Introduction..................................................................................................................... 8Perspectives in Drawing Theories of Young Children ................................................... 9
1. Viktor Lowenfeld................................................................................................... 92. Rhoda Kellogg ..................................................................................................... 133. Jean Piaget ........................................................................................................... 194. Relating Three Theoretical Perspectives ............................................................. 22
Color Studies with Young Children.............................................................................. 251. Color Preference .................................................................................................. 252. Color - Emotion Relationships............................................................................. 273. Color Choice in Object Representations.............................................................. 30
Summary of the Literature Review............................................................................... 32Chapter III: Research Methodology.................................................................................. 33
Introduction................................................................................................................... 33Research Questions....................................................................................................... 33
1. Question One ....................................................................................................... 342. Question Two....................................................................................................... 343. Question Three..................................................................................................... 34
Participants.................................................................................................................... 35Materials ....................................................................................................................... 37Color Classifications..................................................................................................... 37
1. Logical Color Choices ......................................................................................... 372. Expressive (Non - Realistic) Color Choices ........................................................ 38
Procedures..................................................................................................................... 391. Phase One............................................................................................................. 392. Phase Two............................................................................................................ 403. Phase Three.......................................................................................................... 41
Data Collection and Analysis........................................................................................ 42Summary....................................................................................................................... 43
v
Chapter IV: Data Analysis and Results ............................................................................ 44Introduction................................................................................................................... 44Data Analysis ................................................................................................................ 44
1. Phase One Data .................................................................................................... 442. Phase Two Data ................................................................................................... 493. Phase Three Data ................................................................................................. 544. Data Comparison of Phases ................................................................................. 60
Summary....................................................................................................................... 66Chapter V: Summary and Discussion .............................................................................. 69
Introduction................................................................................................................... 69Initial Assumptions of Study Outcomes ....................................................................... 69Conclusions................................................................................................................... 71
1. Phase One............................................................................................................. 712. Phase Two............................................................................................................ 733. Phase Three.......................................................................................................... 754. Comparison of Phases.......................................................................................... 77
Limitations of the Study................................................................................................ 80Recommendations for the Study................................................................................... 81Recommendations for Further Research....................................................................... 82Final Discussion............................................................................................................ 82
Appendixes........................................................................................................................84Bibliography……………………………………………………………..………………90
vi
List of Tables
1. Participant Data Classifications………………………………………………………36
2. Phase 1 Summary…………………………………………………………………….45
3. Phase 1 Logical Color Classifications………………………………………………..46
4. Phase 2 Summary…………………………………………………………………….50
5. Phase 2 Logical Color Classifications………………………………………………..51
6. Phase 3 Summary…………………………………………………………………….55
7. Phase 3 Logical Color Classifications………………………………………………..56
8. Average Logical Color Scores………………………………………………………..61
9. Average Scores of Participants……………………………………………………….62
vii
List of Figures
1. Phase 1 Color Trends…………………………………………………………….47
2. Phase 2 Color Trends…………………………………………………………….52
3. Phase 3 Color Trends…………………………………………………………….59
4. Data Comparison of Tree………………………………………………………...65
5. Data Comparison of Boy…………………………………………………….......66
1
Chapter I: Introduction to the Study
Background
The drawings of young children have interested many individuals in the field of
education. Studies have been performed by researchers, psychologists, teachers, and
parents in order to determine the significance of children’s drawings. Through the
process of observing and analyzing the drawings of young children, insights can be
gained as to the social/emotional, physical, and intellectual development of each child.
The progression of drawings that children make over a period of time can show
significant growth and development, as well as determine academic capabilities and skills
characteristic of their developmental level (Brittain & Lowenfeld, 1987).
According to Lowenfeld, children begin their drawing process as early as they can
physically hold a drawing utensil. From their first attempts at a drawing, consisting of
random marks and lines, to their first representational drawing, children are making
efforts to communicate to the world around them and establish meaning through the
images they create (Brittain & Lowenfeld, 1987). It is through their drawings that
children express the views and interpretations of their experiences.
Purpose of the Study
Children from the ages of four to seven have a natural tendency to utilize
expressiveness in making artistic choices. At this stage of development, referred to as the
Preschematic Stage, children create drawings consisting of spontaneous and non-realistic
color choices (Brittain & Lowenfeld, 1987). Although it can be stated that children in
this stage make distinct lines and shapes that are characteristic of their development, it
2
has not yet been noted that there is a definite trend in the colors that they use to represent
objects and images in their drawings.
This case study is characteristic of action research in which the professional
educator (teacher) assumes the role of the researcher of the study. Action research is
designed to promote research in the classroom, hereby providing opportunities for the
classroom teacher to contribute to the field of education through the process of research.
The purpose of this research is to examine the drawings of everyday images that
Kindergarten children make in order to establish a trend or commonality in the colors that
they use. The use of logical colors (realistic colors) as opposed to expressive or non-
realistic colors will also be explored. This study will present its student participants with
the task of drawing six separate objects under three different phases. Each phase will
present the student participants with a new direction as to the number of colors they may
use in drawing each object. Each drawing activity will challenge the students to utilize
their critical thinking and problem-solving skills in selecting the colors they desire to use
in their drawings. This study will examine the colors chosen by the students to draw the
objects in each phase in order to determine any common color trends or commonalities as
well as to establish the number of logical color choices representative of each object.
This examination of the relationship between the color choices of the student
participants and the objects drawn will have a significant benefit to people in the field of
education, particularly educators in early childhood and art. This thesis may benefit
educators in assessing the intellectual abilities of students through the analysis of
children’s drawings. In addition, this study may be used to propel further research in
determining the significance of the images and drawings of young children.
3
Scope and Methodology
1. Research Questions
This study will examine the following research questions: (1) What number of
students uses logical colors in object drawings? (2) Do students use logical colors when
limitations are set? (3) What color trends are evident throughout the study?
2. Scope
An analysis and evaluation of color selection in children’s object drawings will be
conducted in an attempt to find commonalities of colors and sets of colors chosen by the
student participants of the study. The scope of this thesis will include: (1) a review of
literature containing theories and studies of children’s drawings; (2) a review of the color
selection in the object drawings of student participants; and (3) a review of color
schemas, logical color choices, and the effects of a controlled environment on color
selection. This thesis will conclude with a summary of the results from the data collected
as well as recommendations for further research and topics for future study.
3. Methodology
The methodology used in this research study consists of four significant steps.
First, a comprehensive literature review was conducted. Texts, journal articles, and other
library informational resources on the topic of color and children’s drawings were used to
gain a foundation of knowledge and understanding in this area of study. Next, a study
was conducted in three phases where Kindergarten student participants were asked to
draw six familiar objects. Each phase of the study gave the participants a different
direction to follow concerning the numbers of colors they were to use in each of their
4
drawings. Then, participants’ drawings were examined and data were compiled from
each phase of the study. Finally, analyses were performed using the data collected from
the drawings. Both descriptive statistics and qualitative analysis were used to evaluate
the data.
As previously stated, this study was divided into three phases. In each phase of
the study, student participants were asked to draw six objects: a tree, a house, a boy, a
dog, a girl, and a car. These objects were selected according to their familiarity to
children in this age group. The order of drawing each object remained constant
throughout the course of the study. In each phase student participants were given a paper
on which six boxes were pre-drawn horizontally. Prompts and directions were given to
the student participants prior to and during each phase of the study. In order to maximize
the possibility of obtaining a true result of their color choice and minimize the risk of
copying from other student participants, each student participant was separated from the
class and performed their drawings in a secluded space within the classroom. The
teacher/researcher was present throughout the drawing sessions, observing the students,
as well as giving prompts and repeating directions as needed.
Phase 1 of the study asked student participants to draw the six familiar objects
using the crayons provided by the teacher/researcher. In a cup, the crayon colors of red,
orange, yellow, green, blue, purple, brown, and black, were available for students to
choose. There were no limits given as to the number of colors that student participants
may use.
Phase 2 of the study (which began approximately one month after the culmination
of Phase 1) asked student participants to draw the six specified objects in the same order
5
as was asked in Phase 1. In this phase, participants were given the same cup of crayons
to use. However, they were asked to use any two colors to draw each of the six objects.
Students were not required to use the same two colors for all object drawings. This is the
first phase in which a limitation was set.
Phase 3 of the study (which began approximately one month after the culmination
of phase 2) again asked student participants to draw the six specified objects in the same
order as Phase 1 and Phase 2. This time, a tray with pre - arranged sets of colored
crayons was presented to each student. In this phase, student participants were asked to
choose one set of pre - arranged colors to draw each object. Again, students were not
required to use the same color set for all object drawings. This is the second phase in
which a limitation was set.
Drawings from each student participant in each phase of the study were collected
and data concerning the colors that were selected by the participants were gathered.
Participants’ identities were masked and each participant was assigned a number for data
gathering and analysis. For the purpose of this study, drawings were evaluated according
to participants’ classification in four categories: (1) gender; (2) age; (3) academic ability;
and (4) socio-economic status. Academic ability was determined through information
obtained from individual assessments of each student according to school district’s
mandatory assessment process. Socio-economic status of each student was obtained
through the use of the FARM program (Free and Reduced Meals). This federal program
offers free and reduced breakfast and lunch services to students dependent upon the
annual income of their parent/guardian. The number of children in the household
6
combined with the annual wage of the parent/guardian determines the qualification for
this service.
The objective of this thesis is to determine whether a correlation between color
choices and objects drawn can be found in young children. The use of logical colors
(realistic colors) as opposed to expressive or non-realistic colors will be analyzed and
data will be compiled in relation to the four categories.
Organization of Study
This section serves as a brief description of the organization of each chapter of the
thesis. It is organized into five chapters, as briefly described below.
Chapter I includes the background, purpose, scope and methodology, as well as
the organization of the study. The background section presents a brief description of
children’s drawings and the significance of utilizing the drawings of young children in
educational settings. The purpose for conducting the research is set and the problem
which the study is designed to confront is identified. The scope and methodology of the
study are briefly reviewed. Within this chapter, research questions, the scope of the
study, and the process of conducting the research are identified and described.
Chapter II contains a literature review of various materials and informational
resources collected about the subject of children’s drawings. It includes theories
regarding the drawings of children established by Victor Lowenfeld, Rhoda Kellogg, and
Jean Piaget. Specific studies concerning color preferences and color usage by young
children will also be discussed in this chapter.
7
Chapter III describes the participants, phases of the study, and methodology used
in this research. The verbal prompts given to student participants are also included in this
chapter.
Chapter IV includes the data collected from the drawings of each phase as well as
qualitative analyses of the data. Samples of student object drawings that are pertinent to
the analysis will be included.
Chapter V provides a conclusion to the study with a summary of the data, as well
as an interpretation of the results of both the descriptive statistics and qualitative
analyses. This chapter will conclude with recommendations for further research and
topics for future study.
8
Chapter II: Literature Review
Introduction
An extensive amount of research has been recorded on the topic of children’s
drawings. Theories regarding the drawings of young children have been established by
leading figures in the fields of art education, psychology, and child development. Many
past theories that have been generated concerning the development and analysis of
children’s drawings are pertinent in education today. Three leading researchers in the
topic of children’s drawings will be discussed in this chapter. Viktor Lowenfeld, Rhoda
Kellogg, and Jean Piaget have each contributed to the understanding and appreciation of
child development as demonstrated through drawings. The theories established by each
researcher will be presented throughout the first section of this chapter.
The theories of Lowenfeld, Kellogg, and Piaget will be utilized in this chapter to
establish the drawing capabilities and trends in the developmental stages of a
Kindergarten-aged child. It is pertinent to this study that theories on young children’s
drawings be addressed because this study investigates colors used in the drawings of
young children, rather than merely the selection of color (of pre-drawn or outlined
images, for example).
In addition to addressing theories behind children’s drawings, this chapter will
also focus on color topics as selected from studies conducted on color preference and
usage in young children. The topics that will be addressed in this section include color
preference, color - emotion relationships, and color choice in object representations.
9
Each topic will be discussed and findings derived from studies pertaining to each topic
will be addressed.
Perspectives in Drawing Theories of Young Children
Throughout the course of many decades, there have been various individuals
known for their research, analysis, and writings about the development of young children
as seen through the drawings they produce. The following three individuals and their
theoretical perspectives of children’s drawings will be presented: Viktor Lowenfeld,
Rhoda Kellogg, and Jean Piaget.
1. Viktor Lowenfeld
In the field of art education, Viktor Lowenfeld is well - known for his attention to
the importance of children’s drawings in determining a progression of developmental
levels. He has developed a theory of stages of drawing development which defines
appropriate drawing activities according to the age level of children. In his text, Creative
and Mental Growth, Lowenfeld (1987) outlines these various stages of development and
suitable art activities for each stage of personality growth (Kelly, 2004). The stages of
artistic development, as referred to by Lowenfeld, consist of the Scribbling Stage
(occurring 2 to 4 years of age); Preschematic Stage (4 to 7 years); Schematic Stage (7 to
9 years); Drawing Realism (9 to 12 years); and Psuedo - Realistic Stage (12 to 14 years)
(Lowenfeld & Brittain, 1987).
Throughout his text, Lowenfeld (1987) describes his belief that individual self -
expression in art promotes cognitive development and personal growth, stressing the
importance of encouraging spontaneous self - expression and thus, discouraging the
10
formal teaching of drawing which Lowenfeld believes would inhibit children from using
their art for the purpose of self - expression (Thomas & Silk, 1990). Lowenfeld’s model
of artistic development also suggests that the personal growth of children is “a naturally
unfolding process that is constant and cannot be essentially changed” (Freedman, 1997).
Lowenfeld addresses in his developmental stages the topic of schemas in
children’s drawings. Freedman (1997) states that Lowenfeld describes schemas as
symbolic forms that children make to represent many generic types of objects. Objects
such as a person, tree, or flower, for example are popular schemas of children and can be
observed in many of their drawings (Freedman, 1997). According to Lowenfeld (1987),
schemas are stable concepts that remain constant and unchanging until a child requires
another mode of representation, at which time, through experimentation and observation
of the environment a new schema will be developed (Freedman, 1997). Until the end of
the Preschematic stage (age seven), children will have established schemas and as a result
will create drawings with less flexibility (Lowenfeld & Brittain, 1987).
In addition to the development of children’s drawings through artistic stages,
Lownfeld also is known for his “visual - haptic expressive” theory, referring to the mode
of perceptual organization and conceptual categorization of the external environment. At
age twelve, it becomes possible to see examples of these two types within a child’s
development (Lowenfeld & Brittain, 1982). According to Lowenfeld (1982), a visually
minded person would be classified as one who acquaints himself with his environment
through the eyes, whereas a haptic child is one who concerns himself with personal body
sensations, experiences, and emotions.
11
Lowenfeld’s artistic stages of development are concerned with children rang ing
from two to fourteen years of age. In order to focus on the developmental stage which
defines the behaviors of the five year old child, the Preschematic Stage (the
developmental stage in which Kindergarten - age students are classified) will be
presented in detail.
Prior to the Preschematic Stage, Lowenfeld (1987) believes that children begin
their drawing experience by making random marks on paper until approximately the age
of four where recognizable objects begin to appear in their drawings. It is at this time
that children make their first recognizable attempts and this occurs until children reach
the age of seven (Lowenfeld & Brittain, 1987). This stage is the beginning of graphic
communication where Lowenfeld (1987) indicates a child of high intellectual ability on
the basis of detailed drawings which reflect the child’s awareness of the world around
him.
During this stage, the first representational symbol attempted by children is a
human/person which consists of a head - feet image (Lowenfeld & Brittain, 1987).
According to Lowenfeld (1987), when children make this head - feet representation of a
person, they are not trying to copy the environmental world so much as they are drawing
the parts that they know and see of themselves. However, this may not be a visual
representation at all. Therefore, the first attempts of the drawing of a person should be
viewed as an abstraction or schema from a large array of complex stimuli which
demonstrates the beginnings of an ordered process. It is not to be looked at as an
immature visual representation (Lowenfeld & Brittain, 1987).
12
An interesting point that Lowenfeld makes reflects a universal view of the child’s
first drawings of a human. All children make the shapes of a circle to represent the head
and two vertical lines representing legs in drawing a person (Lowenfeld & Brittain,
1987). There may be no differences between children of different socioeconomic or
cultural influences (Golomb, 1992).
On the topic of color in children’s drawings, Lowenfeld (1987) states that there is
often little relationship between the colors children select and the objects they attempt to
represent and that the conventional use of color (green grass, blue sky) may not appear in
children’s drawings until age eight (Schematic stage). According to Lowenfeld (1987),
being critical of the use of color or pointing out the “correct” or realistic color for objects
would interfere with a child’s freedom of expression. Children’s use of color is for
color’s sake in which the color chosen is not for the purpose of imitating subject matter
because they do not grasp an exact color relationship (Lowenfeld & Brittain, 1987).
Therefore, children’s choice of color may not be realistic in its imitation of their
environment, but rather meaningful and expressive to the individual child.
Throughout the Preschematic stage, children are anxious to express themselves in
creative ways which may not be characteristic of the manner which adults may deem
logical. The drawings that children make in this stage are considered a reflection of their
growth and development where children portray relationships and thoughts about the real
world (Lowenfeld & Brittain, 1987).
Lowenfeld (1987) states that a child’s flexibility and frequent changes in concepts
and schemas are vital factors of this developmental stage in which meaningfulness in the
subject matter drawn by young children emphasizes the emotional impact of an
13
experience. An emotional reaction to a meaningful experience or object may result in an
exaggeration of a particular part of their drawing which focuses on their experience
(Lowenfeld & Brittain, 1987). The drawings of children in this developmental stage
generally contain images that are perceived as important to the child.
In the Preschematic stage and all of Lowenfeld’s stages of artistic development,
the emotional, physical, and social growth of the child are evident in the drawings they
create. Lowenfeld (1987) describes art and the drawings of young children as a process.
It is through this process that changes in behavior and growth patterns develop and
meaningful changes occur in the products that children make (Lowenfeld & Brittain,
1987).
2. Rhoda Kellogg
Known for her extensive collection of children’s drawings, Rhoda Kellogg has
produced a detailed analysis of the shapes and patterns found in the drawings of young
children throughout the course of many years (Thomas & Silk, 1990). Her drawing
collection contains the products of children ranging in age from approximately two to
five years. Although Kellogg studied a large number of drawings, her research is
unsystematic and may not clearly define the progressions and orders of complexity of the
drawing development of individual children (Thomas & Silk, 1990).
Kellogg (1970) believed that there is a universal pattern of development in the
drawings and art of young children. It is suggested by Kellogg (as cited in Thomas &
Silk, 1990) that the simple forms and shapes that children make in their drawings can be
found in the drawings of children from diverse cultural backgrounds. However, because
of a possible lack of clarity in her analysis and system of data collection, the number of
14
examples of children’s art from primitive cultures in her collection is unknown (Thomas
& Silk, 1990).
Through the process of analysis of children’s drawings and art, Kellogg (1970)
creates an investigation which focuses on the characteristics of line formations made by
children, particularly in the form of scribbling and drawing. Kellogg’s (1970)
categorizations of line formations are organized into a system of classification in four
stages. These four stages cover the period from which the child’s first scribbling occurs
until approximately age five, a time at which children often create schemas favored by
society (Kellogg, 1970).
The four stages that Kellogg (1970) creates include the Pattern Stage, consisting
of the classifications of Basic Scribbles and Placement Patterns; the Shape Stage,
containing the Emergent Diagram Shapes and Diagrams classifications; the Design Stage,
characteristic of the classifications of Combines, Aggregates, and Balanced Line
Formations. The last of Kellogg’s four stages, the Pictorial Stage, includes the
classifications of Humans and Early Pictorialism (Kellogg, 1970). Each stage and its
classifications of line formations will be discussed in further detail in order to show
Kellogg’s theory of an evolving progression of child growth through drawing.
The first of Kellogg’s four stages is the Pattern Stage, a self - taught stage which
begins as early as two years of age (Kellogg, 1970). In this stage, Kellogg (1970)
addresses the classifications of Basic Scribbles and Placement Patterns. During the
period of Basic Scribbles, Kellogg (1970) believes that the visual interest in the simple
act of scribbling is an essential component to a child’s acquisition of line making
capability. There are twenty types of markings each demonstrating movements of
15
variations of muscular tension that do not require visual guidance (Kellogg, 1970).
Kellogg (1970) views these twenty basic scribbles as the building blocks of art, important
because they permit a detailed and comprehensive description of the work of young
children. A child has the ability at age three or four to place a single type of scribble on
one piece of paper comprised of spontaneous movements with or without eye control
(Kellogg, 1970). This action, according to Kellogg (1970) may demonstrate a child’s
progression of visual awareness. The earliest evidence that Kellogg (1970) has found of
controlled shaping in children’s work is during the period of Placement Patterns. When
children’s markings progress to this classification, they contain their scribbles into a
designated space or “frame” requiring control of the eye to position markings in relation
to the edge of the paper (Kellogg, 1970). Occurring by the age of two, Placement
Patterns suggest purposeful circles, rectangles, triangles, squares, arches, and various odd
shapes (Kellogg, 1970).
The Shape Stage, the second of Kellogg’s (1970) four stages, is also a self -
taught stage which includes the classifications of Emergent Diagram Shapes and
Diagrams. When children are engaged in the classification of Emergent Diagram Shapes
(between the ages of two and three), they make marks that consist of single lines
employed to form crosses and to outline circles, triangles, and other shapes (Kellogg,
1970). Kellogg (1970) considers this stage as emerging because it provides a transition
between the Pattern Stage and the Diagram classification. Developmentally, the
Diagrams indicate a child’s increasing ability to make controlled lines and employ
memory (Kellogg, 1970). In opposition to Basic Scribbles, Placement Patterns, and
Emergent Diagram Shapes in which a child’s markings are spontaneous and visually
16
stimulating, the Diagrams are evidence of a child’s first planning and deliberation of a
drawing activity (Kellogg, 1970).
The third stage that Kellogg (1970) distinguishes is the Design Stage, consisting
of children between the ages of three and four. Included in this stage are the
classifications of Combines, Aggregates, and the Balanced Line Formations of Mandalas,
Suns, and Radials (Kellogg, 1970). The Combines are essentially units of two Diagrams
in which identifiable circles, squares, triangles, and crosses gradually become irregular
and undifferentiated forms (Kellogg, 1970). Combines are created as a result of these
shapes and forms becoming superimposed onto another (Thomas & Silk, 1990). Kellogg
(1970) refers to Aggregates as larger numbers of scribbles that lie in close proximity
(Thomas & Silk, 1990). When a child begins to form Aggregates, Kellogg (1970)
believes he begins to function as an artist with a repertory of visual ideas. There is an
infinite amount of possible Aggregates and the characteristic of line formations (bold,
subtle, simple, intricate, large, small) can be attributed to the child’s attention span
occurring at the time of the markings (Kellogg, 1970).
In addition to the Combines and Aggregates that a child creates during the Design
Stage, Kellogg’s (1970) Balanced Line Formations of Mandalas, Suns, and Radials are
significant to the progression of development throughout this stage. The Mandalas, a
Sanskrit word for circle, are often Combines that are formed of a circle or square that are
divided into quarters by a cross (Kellogg, 1970). This is a frequently occurring Combine
that Kellogg (1970) considers inherently pleasing to children (Thomas & Silk, 1990).
Kellogg (1970) states that M andalas are essential not only as a part of the sequence of
child art development, but also because they are a link between the art of children and the
17
art of adults. Suns are characteristic of linear lines that form marks moving from the
center or outline of the circle, resembling the rays of a sun and, although simple in
structure, do not appear before the child has drawn complex Aggregates (Kellogg, 1970).
A Radial formation is one with lines that radiate from a point or small area in a shape
which can influence the placement of arms and legs in a Human drawing, occurring next
in the progression of developmental stages (Kellogg, 1970).
The remaining stage in Kellogg’s stages of child art development is the Pictorial
Stage which, according to Kellogg (1970) occurs when children enter the age of four and
continues throughout their early childhood years. Included in this stage are the
classifications of Humans and Early Pictorialism containing the images of animals,
buildings, vegetation, and other subjects (Kellogg, 1970). Kellogg (1970) suggests that
the way in which the child combines the Scribbles and the Diagrams determines a
particular appearance to the Human image and to all subsequent pictorialism. When the
first Human is made, the child joins the face Aggregate with the body parts that from a
modified Mandala. The details of hands, feet, and hair show clearly that aesthetics
outweighs realism in child art with each mark distinguishing its own story (Kellogg,
1970).
The transfiguration of the Human into the horizontal Animal becomes effective
for the four and five year old child (Kellogg, 1970). According to Kellogg (1970), this is
the time in which Early Pictorialism would begin to occur and may be grouped into the
categories of Animals, Buildings, Vegetation, and Transportation. Kellogg (1970)
believes that at this stage five year old drawings are not as pure as nursery school age
children because of the influence of school and formal art lessons in providing formulas
18
for copying which lessens the ‘purity’ of their work. It is to be noted that Kellogg’s
studies occurred during the decade of the fifties where school art lessons had an impact
on the creative development of the young child. In today’s society, art education in the
early childhood years encourages creativity and models art lessons according to the
developmental needs of young individuals. Kellogg remains consistent in utilizing her
classifications in the Early Pictorial images children make. Kellogg (1970) states that
Buildings are drawn by combining Diagrams in various ways, not as a result of observing
houses on the street. In addition, it is observed by Kellogg (1970) that Buildings or
Houses made by children are drawn similarly all over the world, supporting a universal
approach to child art development. The popular Vegetation images drawn by children are
Trees and Flowers, in which Kellogg’s classifications of Scribbles, Diagrams, Combines,
Aggregates, Mandalas, Suns, and Radials are all evident. Accoding to Kellogg (1970),
Flowers, Trees, and Transportation drawings (boats, cars, trains, airplanes) are not drawn
in sizes found in nature or the external world, but in sizes needed to complete Patterns or
to achieve aesthetic goals. Transportation images, consisting of Combines and
Aggregates, are also made in combination with other classifications in representation of
the objects (Kellogg, 1970).
Throughout Kellogg’s four stages of child development in art and their
subsequent classifications, progression of growth in children ages two to five can be
determined through the building and combination of marks. Kellogg (1970) believes that
the child relies on the basic shapes of art and arranges them in relation to one another to
pictorialize objects and scenes. Like Lowenfeld’s model, Kellogg’s theory of drawing
19
development corresponds to the belief that children’s growth and development cannot be
changed because it is a naturally unfolding process (Freedman, 1997).
3. Jean Piaget
Jean Piaget has dominated for many the world of developmental and cognitive
theories of children (Kelly, 2004). Piaget has conducted an extensive amount of research
and has created many approaches and explanations of the progression of social,
emotional, and cognitive growth in children. On the topic of child development in art, for
Piaget, children’s drawings were interesting only as a support to his own stage theory of
child development (Kelly, 2004). Because there is no distinct analysis of children’s
drawings made by Piaget (Thomas & Silk, 1990), his cognitive theory of development
presents a theoretical approach of child development through drawing.
Piaget’s stages of cognitive development are based on maturation and age of the
child (Kelly, 2004). The growth of intelligence in childhood progresses through a series
of stages which are determined by the age of the child (Thomas & Silk, 1990). In
Piaget’s system of cognitive development, learning from experiences in the external
world plays a significant role in the development of a child’s cognitive ability (Kelly,
2004).
Piaget’s theory of cognitive development can be described by attributing the
interpretation of an experience by a child. Piaget believed that the environment of
children is received by assimilation or accommodation. Through assimilation, the
preconceptions of the child are used to understand new stimuli, whereas the
accommodation requires an adjustment to these new stimuli (Thomas & Silk, 1990). The
process of assimilation occurs when a child utilizes his prior knowledge when confronted
20
with a new experience. The child then addresses this new experience and adapts
accordingly. The action of assimilating or accommodating to a situation or experience
can be a determining factor in a child’s development. In the natural way of things, the
young child is faced with accommodating to an external world which he may slightly
understand. It becomes necessary for there to be an area of activity that is not externally
constraining which also provides opportunities for assimilation (Thomas & Silk, 1990).
As stated by Piaget (1969), play is the core activity involving assimilation. Piaget
regarded the early scribbles of the very young child as being “pure play” (Thomas & Silk,
1990). In addition to the act of scribbling, Piaget (1969) considered the early scribbles of
young children as exercise. From the progression of scribble making to the onset of
drawing images, the activity of recreating personally important incidents would also
serve as an assimilative function (Thomas & Silk, 1990).
Piaget’s view that cognitive development proceeds through a series of distinct
stages led him to adopt the classification of stages in children’s drawings. Piaget’s theory
of children’s drawing development, originally proposed by Luquet in 1913, is classified
by organizational and graphic skills of the child as well as the child’s realistic intentions
(Thomas & Silk, 1990). Piaget’s theory focused on the idea that cognitive development
occurs throughout a set of sequenced universal stages. These stages are influenced by the
chronological age in which the child attains each state (Newton & Kantner, 1997). The
child is assumed to progress throughout the drawing stages as he matures cognitively in
his development.
Piaget used drawing as evidence in his theory of the child attempting to create a
representation of the real world (Thomas & Silk, 1990). A child’s drawing was
21
centralized around mental images and the understanding of space (Piaget & Inhelder,
1967). Piaget assigned to drawing a level of status positioned between symbolic play and
mental images. Although Piaget occasionally utilized the drawings of young children to
illustrate his theory, studies of drawings were never central in his theory development
(Thomas & Silk, 1990).
Piaget proposed that children’s drawings were essentially realistic in intention and
that the child intended to produce a representation of an object in a recognizable and
realistic fashion (Thomas & Silk, 1990). The color usage, shapes, and formation of lines
used in the drawings and images of children can be attributed to an attempt to create a
true representation of the real world, as opposed to an expressive interpretation. The
drawings of young children classified as schematic and unorganized are associated with
an inability to construct precise relations to space between objects (Reith, 1997).
Because Piaget (as cited by Thomas & Silk, 1990) believed that children as they advance
chronologically in age will mature in their cognitive ability, drawing instruction was not
deemed a necessary tool. A child’s maturation in age will result in a mental image which
is more developmentally advanced as opposed to formal instruction of drawing
techniques to create a similar outcome (Thomas & Silk, 1990).
Piaget’s theory of drawing development parallels his theory of cognitive
development with the basis of age and maturation predicting the outcomes and products
created by the child. As Piaget attributes the drawings of young children as a
developmental process, it can be noted that it is a progression from stages determined by
chronological age in addition to a child’s ability to assimilate and accommodate to new
stimuli in the real world. Although children’s drawings were beneficial only to Piaget in
22
sustaining his own theory of child development (Kelly, 2004), his theory supports a
succession of sequential stages which contribute to the overall understanding of the
child’s intellectual growth and development.
4. Relating Three Theoretical Perspectives
Within the theories presented by Viktor Lowenfeld, Rhoda Kellogg, and Jean
Piaget on the topic of child development through drawing, there has surfaced
commonalities as well as differences in the theoretical perspectives proposed by each
theorist. Although each shares the belief in the importance of children’s drawings in
predicting the development of the child, Lowenfeld, Kellogg, and Piaget each have
established models of analyzing the products of children with the intended purpose of
determining the growth and progression of the child. Each theorist attributes different
characteristics and trends in the images young children make to distinguish a level of
attainment of cognitive and behavioral status. Comparisons will be made in the
developmental theories of Lowenfeld, Kellogg, and Piaget in order to relate three
theoretical perspectives.
On the topic of proposing a developmental theory of drawing for young children,
it can be assumed that both Lowenfeld and Kellogg began their process with the
collection and analysis of children’s drawings. Inclusions of illustrations from sample
child images gave clear definitions and examples of their stages of child art development.
Kellogg’s approach to the analysis of children’s drawings may be deemed unsystematic
in nature (Thomas & Silk, 1990). However, it is evident from her text that the drawings
from her collection are included and adequately labeled. Lowenfeld, in addition to
Kellogg, has referenced the images produced by children in his studies throughout his
23
text. Piaget, although interested in children’s drawings, may lack concrete evidence in
the collection and analysis of specific elements in the drawings of young children in
support of his theory.
Evident throughout each theory presented by Lowenfeld, Kellogg, and Piaget is
their common perspective on a universal trend in the development of young children as
seen through their drawings. Each theorist states that children develop in similar ways
throughout the course of their young lives through experiences and chronological order.
As children develop and progress through stages, there is a sequence of universal patterns
that can be observed in the images that young children make. Although each theorist
may distinguish different possibilities for growth to occur, it can be concluded that the
progression and images that children make are universal in outcome and product.
It is interesting to note that there is a distinct contrast between the self -
expressive theory of Lowenfeld and that of Piaget’s cognitive theory of development.
Where Lowenfeld (1987) believes that children create drawings that are inherently
important and reflect their desire to express their experiences and emotions, Piaget
proposes that the drawings children make are the product of an intentional effort to
represent realistic images (Thomas & Silk, 1990). Regardless of which theory proves
this assumption, both theories consider the progression of a young child’s drawing in
migrating from the stage where this occurs to a stage characteristic of their continued
growth.
Because the theories of Lowenfeld, Kellogg, and Piaget became popularized
during similar times, it can be assumed that each theorist was familiar with and possibly
influenced by the beliefs and findings of the others. This particularly lies true for Rhoda
24
Kellogg in reference to Viktor Lowenfeld’s (1982) “visual - haptic expressive” theory.
Kellogg (1970) states in her text, Analyzing Children’s Art, that her prim ary objection to
Lowenfeld’s categories is that the haptic and visual aspects of art cannot be separated
meaningfully. Kellogg (1970) continues by stating that the haptic aspects which are
considered by Lowenfeld as subjective may be in fact found in child art universally, as
well as the visual aspects.
In relating the three theoretical perspectives presented by Viktor Lowenfeld,
Rhoda Kellogg, and Jean Piaget, it becomes apparent that there are commonalities and
differences worth noting between the theories proposed by each. Although there are
many current theories concerned with the development of children through drawing and
art, these three theorists have created solid and reputable foundations and ideas that some
consider valid and true in a society separated from their time by decades. Lowenfeld,
Kellogg, and Piaget have influenced the field of education, art, and child development
through their distinct theories of children’s drawings and development.
Based on the literature in the field of child development through art as presented
by Lowenfeld, Kellogg, and Piaget, assumptions made as to the outcomes of color
selection in the drawings of young children are as follows:
• Kindergarten-age children will make expressive color choices rather than logical
color choices in the drawings they create.
• In relation to gender, girls would use more expressive color choices than boys.
• Logical color choices would increase with age.
25
• Students with a higher level of academic ability would use more logical color
choices.
• Students with a higher economic status would use more logical color choices.
Color Studies with Young Children
The remaining section of this chapter will be devoted to the discussion of three
distinct topics pertaining to color and young children. Each topic will be addressed in
accordance with recent studies conducted on each topic and their respective findings.
1. Color Preference
Color preference in young children is a topic of much importance in the
understanding of the color choices that children make. Many past and present studies
have focused on color preferences in individuals of various ages as it relates to a ranking
of most preferred color to least preferred color. Such color ranking studies have provided
opportunities to compare the colors that are most frequently chosen by young children to
those colors that are least preferred. The analysis of color preference in young children
may support an assumption that the color choices children make are representative of
colors that they deem likeable or favor for personal reasons. A study conducted by Mark
Meerum Terwogt and Jan B. Hoeksma (1995) asked children seven years of age to rank
colors according to their preference. This study included the colors red, yellow, blue,
green, white, and black (Meerum Terwogt & Hoeksma, 1995). Meerum Terwogt and
Hoeksma (1995) found that children of this age group chose the color blue most
frequently, followed by the colors yellow, red, white, green/black (both colors attaining
the same lowest rank). A study by Norman and Scott (as cited by Meerum Terwogt &
26
Hoeksma, 1995) revealed that “young children prefer the colors red and yellow” (1952).
The results from Meerum Terwogt& Hoeksma’s (1995) study confirmed this finding with
red and yellow being highly preferred by their participants. However, these colors were
surpassed by the highest color preference ranking of blue.
In a similar study, conducted by Marcel R. Zentner (2001), young children
ranging in age from two and a half to four and a half years were asked to rank colors by
preference. The colors used in this study varied on hue and value and included red,
yellow, light green, dark green, light blue, dark blue, pink, brown, and black (Zentner,
2001). The variation of color was an interesting component to this study in that it
allowed for a further investigation to the hues and values of color preference. The results
of this study paralleled the findings of Norman and Scott (1952) in that red was the most
preferred color for both boys and girls (Zentner, 2001). In examining the color
preferences of bright colors versus dark colors, results have shown that the overall
preference for bright colors was more emphasized for girls than boys (Zentner, 2001).
Zentner (2001) suggests that “this gender bias towards greater chromatic sensitivity in
females is already present in early childhood.” Because of stereotypes and color
associations in our society (boys associated with blue, girls associated with pink), it can
be assumed that boys may rank blue in preference to other colors, and consequently girls
in the same respect may prefer pink. However, Zentner (2001) found that there was no
evidence for such gender stereotypes in the color rankings of boys and girls in his study.
Consistent with the findings in color preference in young children previously
mentioned, there seems to be a prevalent movement in development of color preference
occurring during the early elementary school years (Zenter, 2001). Contrasting the
27
finding of red as the most preferred color, the color blue has been shown to be the most
preferred color of young children in other studies. Although Zentner (2001) has shown
that red was the color most preferred by young children in his study, two recent studies
(as cited by Zentner, 2001) suggested that the preference for blue over red may be
established by the age of seven (Boystzis & Varghese, 1994; Meerum Terwogt &
Hoeksma, 1995). This statement may provide an explanation for Zentner’s finding as it
compares to that of Meerum Terwogt & Hoeksma. Another reason for this shift in color
preference from red to blue may be a result of young children acquiring negative
connotations for red (such as associations with blood, a stop sign) through the onset of
schooling and socialization (Zentner, 2001).
Studies and findings on color preferences in young children may provide insight
into the internal mechanisms that children experience when choosing colors. Perhaps the
colors children choose are more a result of their personal preference as opposed to a
spontaneous impulse or expressive action. It can be said that young children are
influenced by external forces which may impact their color choice throughout their
development. However, the importance of recognizing children’s color preference may
offer a possible explanation for the choices children make when using colors.
2. Color - Emotion Relationships
Much emphasis in the research of color and young children has been placed on
the relationship between color preference and emotional symbolism. The interest in the
connection between color and emotion in young children has lead to many recent studies
devoted to obtaining information about a possible relationship between color and
emotional preference. Such studies aim to provide substantial data to support a
28
connection between the colors children prefer in correlation with their emotional
preference. In a study conducted by Meerm Terwogt & Hoeksma (1995), it was
hypothesized that the domains of color and emotion are connected to each other on the
basis of the preferences of each. This hypothesis lead its researchers to make a
connection to the colors children prefer (refer to previous section) and the emotions
preferred by the young children in their study. Participants in a seven year old age group
were asked to rank in order of preference the following emotions: anger, aversion, fear,
happiness, sadness, and surprise (Meerum Terwogt & Hoeksma, 1995). It was found by
Meerum Terwogt & Hoeksma (1995) that children preferred happiness most frequently,
followed by the emotions of surprise, aversion/fear (receiving the same ranking score),
sadness, and anger. When analyzed in combination with the color preferred by these
children, it was found that there was a distinct correlation between the colors and
emotions children prefer. Meerum Terwogt & Hoeksma (1995) state that “colors and
emotions that were more similar, as indicated by their preferences, were more likely to be
tied to each other.” This finding is in support of their initial hypothesis. In addition to
this assumption, with further investigation of the emotional preferences, it can be said
that the positive emotions (happiness, surprise) took higher positions in preference than
the negative emotions (fear, sadness, anger) (Meerum Terwogt & Hoeksma, 1995).
A more specific study, conducted by Marcel R. Zentner (2001), was designed to
find a direct relationship between an emotional feature and the color that feature elicits.
After participants (consisting of young children between the ages two and a half and four
and a half years) of this study were asked to rank colors varying in hue and value in order
of preference, they were shown three facial depictions of emotions (anger, happiness,
29
sadness) and asked to match each emotion to one of six color stimuli (Zenter, 2001).
Zentner’s (2001) findings correspond to that of Meerum Terwogt & Hoekma’s (1995) in
that the colors children preferred highly corresponded to a positive emotion, whereas the
colors children least preferred were matched to a negatively perceived emotion. Further
analysis concluded by Zentner (2001) states that “children tended to match bright colors
with a happy emotional expression and dark colors with a sad emotional expression.” By
the age of three years, the association of bright colors with happy and dark colors with
sad seemed to be established (Zentner, 2001). Also interesting were his findings
concerning gender differences in color and emotional preference. According to Zentner
(2001), the colors of red and brown held emotional connotations for boys in that red was
matched more than twice as often with as a face depicting happy and brown was matched
four times as often with sad. Furthermore, consistent with both genders, the color blue
was consistently associated with the emotion of sad (Zentner, 2001).
In evaluating the findings of Zentner’s study, it can be concluded that there are
differences in emotional connotations of color occurring past the early childhood years
(Zentner, 2001). Evidence was shown by Karp & Karp (as cited by Zentner, 2001) that
by age ten, children associated the colors of black and red with the emotion constituting
anger (1988). It can be assumed that this tendency will occur in children as they progress
from early childhood to elementary age.
The relationship between color and emotion proves to be an important topic in
understanding the role of emotional preference in the utilization of color with young
children. Research has provided much information into the connection between color
preferences as it relates to emotional associations. This is a concept that is evident in
30
many adult experiences. However, with recent studies it can be said that emotional
connotations and color/emotional relationships strongly exist in young children. With the
rise in research on this topic, the effect of emotion in eliciting color choices in young
children may continue to demonstrate an awareness of purpose in the choices young
children make.
3. Color Choice in Object Representations
Research on the topic of color choice in the representation of objects provides a
further escalation of possible emotional associations with color possessed by young
children. Objects that are characterized by specific attributes may determine a systematic
approach to the use of color in symbolizing the interpretation of objects. In
understanding the color choices children make when representing objects, it is essential
to examine the effect of color preference and emotional context in determining a
connection between color usage and object representation.
In a particular study completed by Esther Burkitt, Martyn Barrett, and Alyson
Davis (2003), the concept of children’s systematic usage of color in object association
was tested. According the Burkitt, Barrett, and Davis (2003), this study attempts to
“examine children’s sensitivity to metaphorical associations of color, rather than
examining children’s use of color in drawing production tasks.” Because children (as
cited by Burkitt, Barrett, and Davis, 2003) as young as four years of age demonstrate the
ability the use color symbolically (Golomb, 1992), this study also focused on exploring
possible developmental trends in children’s color choice (Burkitt, Barrett, & Davis,
2003).
31
Participants of this study (children ranging in age from four years to eleven years)
were first asked to complete a color preference task where children ranked and rated ten
colors according to their preference (Burkitt, Barrett, & Davis, 2003). The next task, as
stated by Burkitt, Barrett, & Davis (2003), asked participants to color three identical
figures of objects (tree, man, dog) with each given different personality attributes (nice,
neutral, and nasty). Findings indicate that children used their more preferred colors for
positively characterized objects, used colors least preferred for negatively characterized
objects, and used colors ranked intermediately for neutrally characterized objects
(Burkitt, Barrett, & Davis, 2003).
In addition to this finding, Burkitt, Barrett, and Davis also investigated possible
trends in common color usage in objects. The results of this examination were interesting
in that “black tended to be the most frequently chosen color for completing the drawings
of negatively characterized topics” (Burkitt, Barrett, & Davis, 2003). Also noted by
Burkitt, Barrett, & Davis (2003) was a similar trend in children’s realistic color choices
used to represent the dog and tree objects. This consisted of the use of the color brown
for dogs depicted as neutral, and the choice of green for trees symbolizing a similar
neutral characteristic (Burkitt, Barrett, & Davis, 2003). It may be concluded from this
finding that children may possess realistic color associations for known objects which
represent common color schemas.
The exploration of the topic of color choice in the representation of objects serves
an important purpose in determining common color trends in the drawings of children. It
also provides possible reasons for emotional and symbolic associations that young
children may possess. Deciphering children’s color preferences may contribute to this
32
understanding. However, the analysis of a sample of young children’s color choices
when representing objects for common trends may further determine the use of color as a
symbolic function in children’s drawings.
Summary of the Literature Review
The topics of children’s drawings and color studies in young children were
presented in order to address these issues as they relate to color selection in the drawings
of young children. Pertaining to the subject of children’s drawings, three distinct
individuals and their respective theories each provided an understanding of child
development through the analysis of children’s drawings. Recent studies conducted with
young children relevant to color preference, color - emotion relationships, and color
choice in object representations were presented in order to examine findings and common
color trends in young children. The results of the studies presented established possible
assumptions for the colors children choose according to emotional preferences and/or
symbolic associations in representing objects.
33
Chapter III: Research Methodology
Introduction
The purpose of this study is to examine the color selection in object drawings of
Kindergarten age students. Common color usage or commonalities will be established in
order to determine possible color trends used throughout the drawings of six everyday
images. The participants’ selection and usage of logical colors as opposed to expressive
or non-realistic colors will be explored throughout three phases of the study. Each phase
will contain a different set of limitations for each student, namely the number of colors
that they may chose to perform their drawing task.
This chapter of the thesis will focus on the research methodology used throughout
the study. The topics that will be discussed in this chapter include the restatement of the
research questions, a description of the participants in the study, a brief explanation of
materials used, a review of color classifications, a discussion of the procedures used
including verbal prompts given, and a summary of the chapter contents.
Research Questions
There are two major objectives of this thesis. The primary objective is to
determine the use of logical color choices as opposed to expressive or non-realistic color
choices in the object drawings of student participants. The secondary objective is to find
possible color commonalities or trends in the colors children chose to use in their
drawings. The research questions established from these objectives and a brief
explanation of each are as follows:
34
1. Question One
What number of students use logical colors in object drawings?
This question will address the use of logical colors (realistic colors) in the choices
student participants make as evident in their object drawings. This question will provide
a quantitative assumption as to the percentage of students with a logical color choice in
comparison to students with an expressive color choice. This question will be explored
throughout all three phases of the study in order to determine any trend s in the use of
logical colors and to distinguish a relationship between logical color usage and the object
it was used to represent.
2. Question Two
Do students use logical colors when limitations are set?
This question will explore the use of logical colors in two phases of the study.
Because phase 2 and phase 3 set limitations as to the number of colors participants can
use in their object drawings, the analyses of the colors used in these two phases will be
important in determining possible increases or decreases in the use of logical colors.
Both phase 2 and phase 3 will provide information concerning the use of logical colors
when limitations are set.
3. Question Three
What color trends are evident throughout the study?
This question will address any possible common color trends throughout all three
phases of the study. This question will explore a possible correlation between common
colors used and the objects they were used to represent. A determination of possible
35
color schemas in Kindergarten age children may be established from the findings of this
question.
Participants
Participants in this study consisted of eighteen Kindergarten students from
Carmody Hills Elementary School, a general education public school located in Capitol
Heights, Maryland. This school, one of 118 elementary schools in the Prince George’s
County Public School System, receives Title I federal funds because of its high
population of low income students. The eighteen student participants were members of
one heterogeneous Kindergarten class, varying in abilities and characteristics. The
subjects of this study included seven boys and eleven girls, all of African American
decent. Student participants ranged in age from 60 months (5 years) to 77 months (6
years, 5 months) with a mean age of 67 months (5 years, 7 months). Academic ability
has been categorized into three areas on the basis of academic performance in classroom
instruction and assessments. The categories of Below Grade Level (BGL), On Grade
Level (OGL), and Above Grade Level (AGL) are used throughout the school system in
identifying student academic ability. The eighteen subjects of this study included six
students performing below grade level (33%), five students performing on grade level
(28%), and seven students performing above grade level (39%). The socio-economic
status of student participants can be classified as low or average according to school
system’s FARM (Free and Reduced Meals) Program. Student participants receiving
benefits from this program are identified by the annual wages of parents/guardians.
There are ten students receiving free meal status (56%), one student receiving reduced
36
meal status (5%), and seven students not participating in this program and thus paying
full meal coverage (39%).
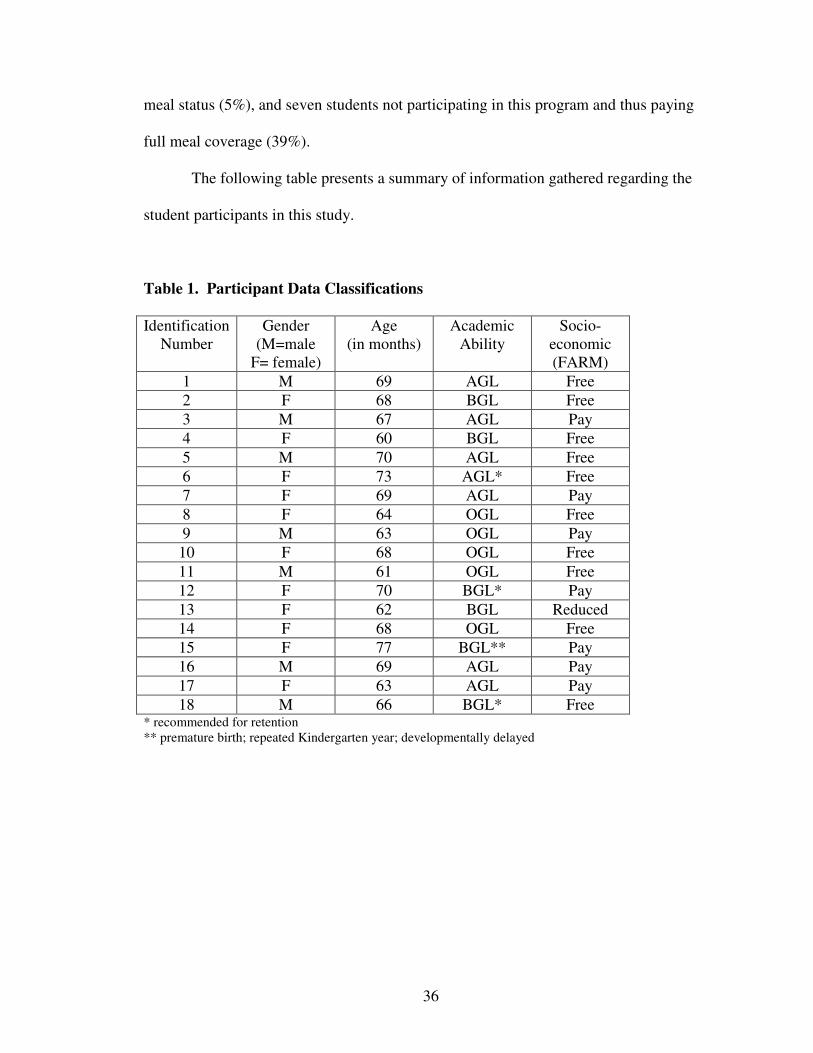
The following table presents a summary of information gathered regarding the
student participants in this study.
Table 1. Participant Data Classifications
Identification Number
Gender(M=male
F= female)
Age(in months)
Academic Ability
Socio-economic(FARM)
1 M 69 AGL Free2 F 68 BGL Free3 M 67 AGL Pay4 F 60 BGL Free5 M 70 AGL Free6 F 73 AGL* Free7 F 69 AGL Pay8 F 64 OGL Free9 M 63 OGL Pay10 F 68 OGL Free11 M 61 OGL Free12 F 70 BGL* Pay13 F 62 BGL Reduced14 F 68 OGL Free15 F 77 BGL** Pay16 M 69 AGL Pay17 F 63 AGL Pay18 M 66 BGL* Free
* recommended for retention** premature birth; repeated Kindergarten year; developmentally delayed
37
Materials
White photocopy paper (8 ½ in. x 11 in.) divided into six boxes was used in all
three phases of the study. These pre-drawn boxes were used to distinguish the space
where each participant was to draw his object images. Paper was presented to each
participant in a horizontal manner. In phase 1 and phase 2, a cup of Crayola crayons with
the colors red, orange, yellow, green, blue, purple, brown, and black were presented to
student participants, placed on the table in front of the students and positioned above their
paper. These crayons were taller than the height of the cup and therefore were in direct
view of the participants. The crayons were replaced with a new set of crayons containing
the same colors in the same presentation format for both phase 1 and phase 2. In phase 3,
five sets of crayons were placed in a line on a tray in front of the students and positioned
above their paper. Each set, containing a group of two crayons bound together with a
rubber band, was pre-arranged prior to student participants’ drawing task and was
presented to each participant in the following manner: yellow and purple, green and
brown, red and black, brown and black, blue and orange. The tray was rearranged in this
order prior to each student participant coming to the table.
Color Classifications
1. Logical Color Choices
For this study, student selected color choices will be deemed logical based on the
realistic use of color to represent each object. The following logical color choices remain
constant for all three phases of the study. Logical color choices will be defined as colors
used to realistically represent an object. The logical color choices for the tree image
38
would include the color brown in representation of the bark of the tree, and the color
green, orange, red, or yellow representing leaves. Logical color choices for the house
image include black and red to symbolize brick, brown to symbolize wood, and an
additional color to represent the color of the siding and roof of the house which may
include red, yellow, green, or blue. The skin colors of brown, or orange used to represent
the boy and girl images will be considered a logical color choice, with the additive color
chosen from the remaining colors in symbolizing hair and clothes. In the image of a dog,
color choices of brown, black, and yellow will be deemed logical in the representation of
a dog’s fur. The logical color choices for the car image will include the color black in
representing the wheels of the car. Any color used to represent the body of the car
(because a car can be observed in various colors) will be considered a logical choice.
It is important to note that although a student participant utilizes a color that
would not be deemed “logical”, it may be considered as a logical color choice dependent
upon the student participant’s explanation for the reason of choosing that particular color
or colors.
2. Expressive (Non - Realistic) Color Choices
Expressive color choices are distinguishable from logical color choices in that
expressive colors are used by the student participants in representing an object for
personal reasons and which contain colors that are not realistic representations of the
images. In this study, all colors that have not been specified as logical color choices will
be considered as expressive color choices.
39
Procedures
Student subjects completed object drawing tasks organized into three phases.
Each phase of the study asked students to perform the same activity of drawing six
objects: tree, house, boy, dog, girl, and car. The order of drawing each object remained
constant throughout the phases. Student subjects completed each drawing task
independent from the other students at a designated space in the classroom in order to
minimize the risk of copying from other participants and maximize the possibility of
obtaining a true result of their color choice. The teacher/researcher was present
throughout the drawing sessions giving prompts and directions as needed, as well as for
observation purposes. The location of each drawing session consisted of a table in a quiet
area of the classroom with materials displayed as described previously for the drawing
session. The onset of each phase occurred in succession to the previous phase. After all
students completed their object drawing task, the next phase began (each phase lasting
approximately one month from the end of the previous phase). Students were called back
to the drawing table in the same order for each phase in order to control the duration of
time students had between each phase drawing. Each session in each phase of the study
lasted approximately ten minutes per student.
1. Phase One
Phase 1 of the study asked students to complete the task of drawing six objects
(tree, house, boy, dog, girl, and car) using an unspecified number of colors. In front of
the student, a paper divided into six spaces and a cup of crayons were placed on the table.
In the cup, the colors of red, orange, yellow, green, blue, purple, brown, and black were
40
available for students to choose. There was no limit to the number of colors students may
use in this phase of the study. The directions given to the each student were as follows:
‘I would like you to draw six objects: a tree, a house, a boy, a dog, a girl, and a
car. There are six boxes on your paper. When I point to a box, I would like you to draw
the object I say. Here is a cup of crayons. You may use any colors you want to draw
your object. Give me a “thumbs up” when you are ready to begin.’
The directions were restated throughout the session if a student indicated that they
needed additional prompting as to the instructions of the task. This was dependent upon
student appeal and/or teacher/researcher observation.
2. Phase Two
Phase 2 of the study asked students to complete the same task of drawing the
same six objects (tree, house, boy, dog, girl, and car) in the same order as in Phase 1.
However, this phase of the study asked students to choose only two crayon colors to use
in drawing each object. Students were given another paper divided into six spaces and
the same cup of crayons with the colors red, orange, yellow, green, blue, purple, brown,
and black. This is the first phase of the study in which a limitation was set. The
directions given to each student were as follows:
‘I would like you to draw six objects: a tree, a house, a boy, a dog, a girl, and a
car. There are six boxes on your paper. When I point to a box, I would like you to draw
the object that I say. Here is a cup of crayons. Last time we did these drawings, I asked
you to use any colors you wanted. Today, I would like you to pick only two colors to
draw each object. Can you show me two fingers? Good! That is how many crayons I
would like you to use. Give me a “thumbs up” when you are ready to begin.’
41
The directions were restated throughout the drawing session upon the
teacher/researcher’s observation of students using more or less than two crayons.
Additional reminders and prompts were given as needed.
3. Phase Three
Phase 3 of the study asked students to complete the task of drawing six objects in
the same specified order as the two previous phases. However, a further limitation was
set as to color combinations that students may choose. Students were again given a paper
with six spaces placed in front of them at the table. Then, the teacher/researcher
presented the students with a tray of five groups of pre-arranged crayon sets. The color
combination sets included yellow and purple, green and brown, red and black, brown and
black, blue and orange placed from left to right in the middle of the tray. Students were
asked to choose one set of pre-arranged colors to draw each object. These color sets were
predetermined by the teacher/researcher in order to include possible color selections of
logical or expressive color choices for the six object drawings. This is the second phase
in which a limitation was set. The directions given to each student were as follows:
‘I would like you to draw six objects: a tree, a house, a boy, a dog, a girl, and a
car. There are six boxes on your paper. When I point to a box, I would like you to draw
the object I say. Here is a tray of crayons. I put the crayons together in groups of two.
Can you find the yellow and purple group? Can you find the green and brown group?
Can you find the red and black group? Can you find the brown and black group? Can
you find the blue and orange group?’ (Teacher/researcher assessed each student’s color
awareness as the student pointed to each group when the question was asked). ‘Today, I
42
am going to ask you to pick one group from the tray to draw each object. Give me a
“thumbs up” when you are ready to begin.’
The directions were restated throughout the drawing session prior to each object
drawing depending on the teacher/researcher’s observation of students’ indication that
they had not understood the instructions. Upon this assessment, the teacher/researcher
repeated the directions and gave additional prompts as needed.
Data Collection and Analysis
At the culmination of each phase, the object drawings of student subjects were
collected. The identities of the participants were masked and each student was assigned a
number for data purposes. The identification numbers of the student subjects remained
consistent throughout all phases of the study.
Each object drawing in each of the three phases of the study was analyzed for the
use of logical colors and expressive colors. A scoring system of percentages was used for
each object drawing and information was stored in tables in order to organize the data
and formulate results. Percentages were derived by dividing the number of logical colors
used into the total number of colors used per object drawing. The use of specific colors
in each object drawing has also been recorded and information was translated into tables
and graphs in order to graphically represent common color trends found in the object
drawings completed by student subjects.
43
Summary
The intention of this study is to investigate the color selection in objects drawn by
young children. This study will determine the use of logical colors as opposed to
expressive colors in the drawings of six familiar objects completed by Kindergarten age
students. Object drawings will also be analyzed to find common color trends present in
the representation of these objects. This study is divided into three phases with each
phase containing different sets of limitations as to the number of colors a student may use
in completing each drawing task. Drawings will be analyzed and data will be collected in
order to determine the use of logical colors as well as finding possible color
commonalities or trends in the colors students use to represent each object. Throughout
this chapter, the topics of research questions, student participants, materials, color
classification criteria, and procedures of the study have been presented and discussed.
44
Chapter IV: Data Analysis and Results
Introduction
Chapter IV contains the results of data collected during Phase 1, Phase 2, and
Phase 3 of the study. The organization of this chapter consists of sections pertaining to
each phase. Within each section, results concerning the use of logical color and common
color trends will be presented. The remaining section of the chapter will focus on the
comparison of data throughout the three phases of the study.
Data Analysis
1. Phase One Data
a. Logical Colors
Logical color scores were formulated by dividing the number of logical colors
used by the number of total colors used by that particular child in each object drawing.
Using this formula, a raw score (percentage) was established for each student participant.
This formula was repeated for each of the six object drawings in Phase 1. The logical
color score for each participant was averaged to determine an overall average score for
Phase 1. An average score for each object drawing was also included to show the range
of logical color scores throughout this phase. The highest obtainable score was 1.00 or
100%. A summary of the scores and averages of Phase 1 are shown in Table 2.
The most evident use of logical color appears in the drawing of the tree where
90% of students used logical colors (green, brown) in its representation. In two instances
(11%), the color red was chosen in addition to green and brown to represent apple - like
objects within the top section of the tree. In a separate instance, one student used only
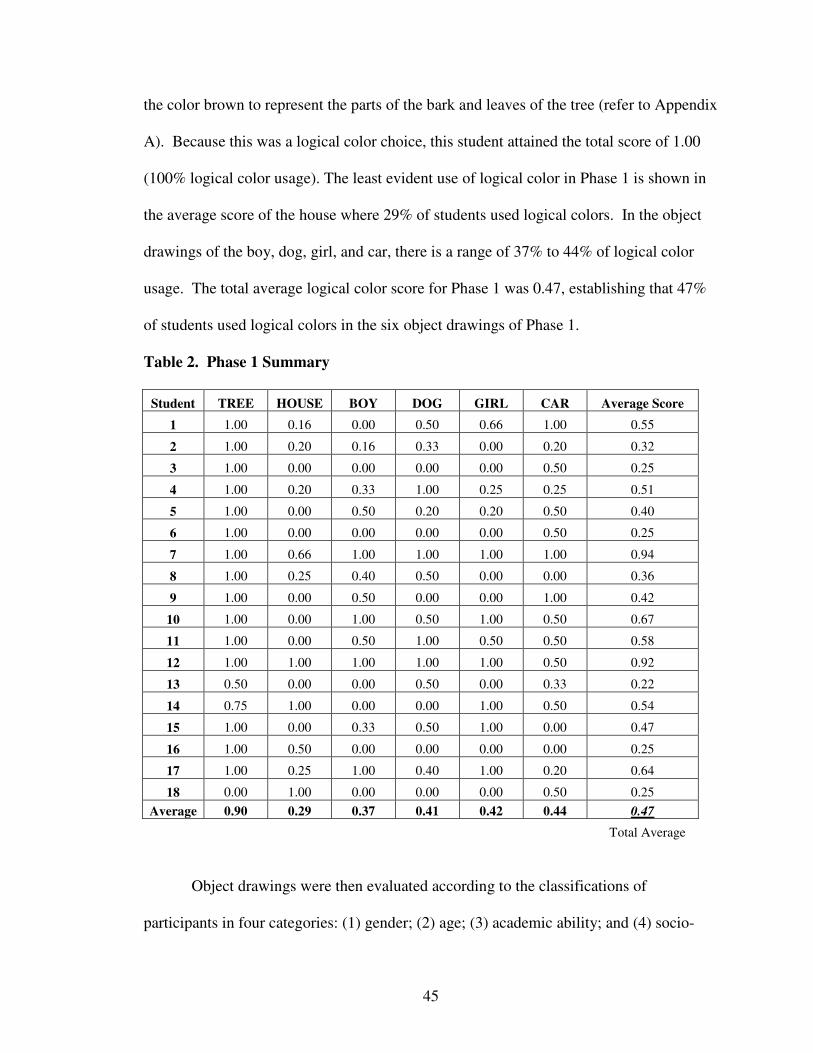
45
the color brown to represent the parts of the bark and leaves of the tree (refer to Appendix
A). Because this was a logical color choice, this student attained the total score of 1.00
(100% logical color usage). The least evident use of logical color in Phase 1 is shown in
the average score of the house where 29% of students used logical colors. In the object
drawings of the boy, dog, girl, and car, there is a range of 37% to 44% of logical color
usage. The total average logical color score for Phase 1 was 0.47, establishing that 47%
of students used logical colors in the six object drawings of Phase 1.
Table 2. Phase 1 Summary
Student TREE HOUSE BOY DOG GIRL CAR Average Score
1 1.00 0.16 0.00 0.50 0.66 1.00 0.55
2 1.00 0.20 0.16 0.33 0.00 0.20 0.32
3 1.00 0.00 0.00 0.00 0.00 0.50 0.25
4 1.00 0.20 0.33 1.00 0.25 0.25 0.51
5 1.00 0.00 0.50 0.20 0.20 0.50 0.40
6 1.00 0.00 0.00 0.00 0.00 0.50 0.25
7 1.00 0.66 1.00 1.00 1.00 1.00 0.94
8 1.00 0.25 0.40 0.50 0.00 0.00 0.36
9 1.00 0.00 0.50 0.00 0.00 1.00 0.42
10 1.00 0.00 1.00 0.50 1.00 0.50 0.67
11 1.00 0.00 0.50 1.00 0.50 0.50 0.58
12 1.00 1.00 1.00 1.00 1.00 0.50 0.92
13 0.50 0.00 0.00 0.50 0.00 0.33 0.22
14 0.75 1.00 0.00 0.00 1.00 0.50 0.54
15 1.00 0.00 0.33 0.50 1.00 0.00 0.47
16 1.00 0.50 0.00 0.00 0.00 0.00 0.25
17 1.00 0.25 1.00 0.40 1.00 0.20 0.64
18 0.00 1.00 0.00 0.00 0.00 0.50 0.25
Average 0.90 0.29 0.37 0.41 0.42 0.44 0.47
Total Average
Object drawings were then evaluated according to the classifications of
participants in four categories: (1) gender; (2) age; (3) academic ability; and (4) socio-
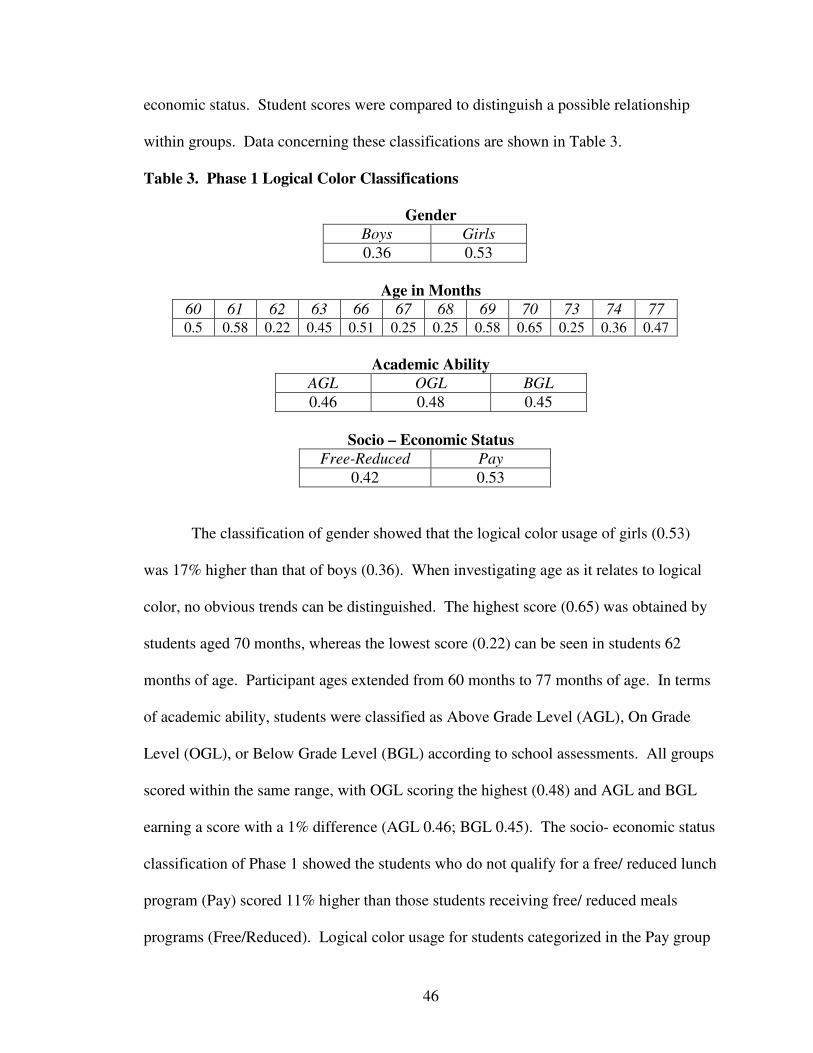
46
economic status. Student scores were compared to distinguish a possible relationship
within groups. Data concerning these classifications are shown in Table 3.
Table 3. Phase 1 Logical Color Classifications
GenderBoys Girls0.36 0.53
Age in Months60 61 62 63 66 67 68 69 70 73 74 770.5 0.58 0.22 0.45 0.51 0.25 0.25 0.58 0.65 0.25 0.36 0.47
Academic AbilityAGL OGL BGL0.46 0.48 0.45
Socio – Economic StatusFree-Reduced Pay
0.42 0.53
The classification of gender showed that the logical color usage of girls (0.53)
was 17% higher than that of boys (0.36). When investigating age as it relates to logical
color, no obvious trends can be distinguished. The highest score (0.65) was obtained by
students aged 70 months, whereas the lowest score (0.22) can be seen in students 62
months of age. Participant ages extended from 60 months to 77 months of age. In terms
of academic ability, students were classified as Above Grade Level (AGL), On Grade
Level (OGL), or Below Grade Level (BGL) according to school assessments. All groups
scored within the same range, with OGL scoring the highest (0.48) and AGL and BGL
earning a score with a 1% difference (AGL 0.46; BGL 0.45). The socio- economic status
classification of Phase 1 showed the students who do not qualify for a free/ reduced lunch
program (Pay) scored 11% higher than those students receiving free/ reduced meals
programs (Free/Reduced). Logical color usage for students categorized in the Pay group
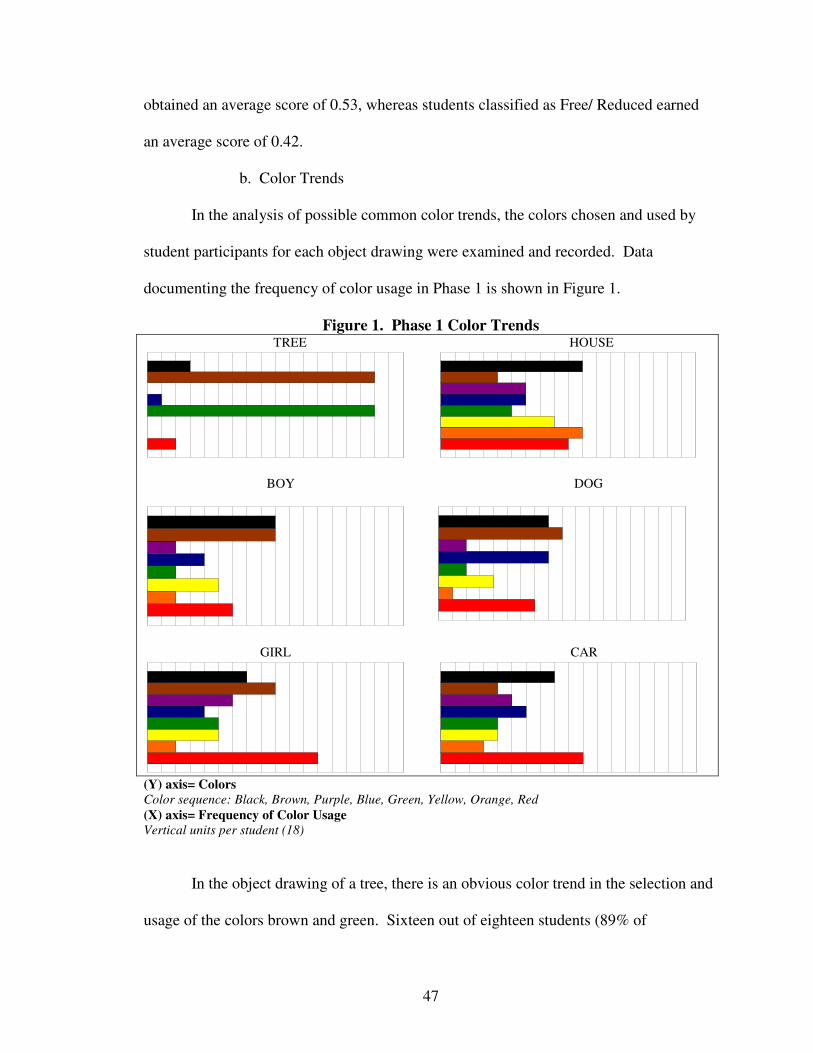
47
obtained an average score of 0.53, whereas students classified as Free/ Reduced earned
an average score of 0.42.
b. Color Trends
In the analysis of possible common color trends, the colors chosen and used by
student participants for each object drawing were examined and recorded. Data
documenting the frequency of color usage in Phase 1 is shown in Figure 1.
Figure 1. Phase 1 Color Trends TREE HOUSE
BOY DOG
GIRL CAR
(Y) axis= ColorsColor sequence: Black, Brown, Purple, Blue, Green, Yellow, Orange, Red(X) axis= Frequency of Color Usage Vertical units per student (18)
In the object drawing of a tree, there is an obvious color trend in the selection and
usage of the colors brown and green. Sixteen out of eighteen students (89% of
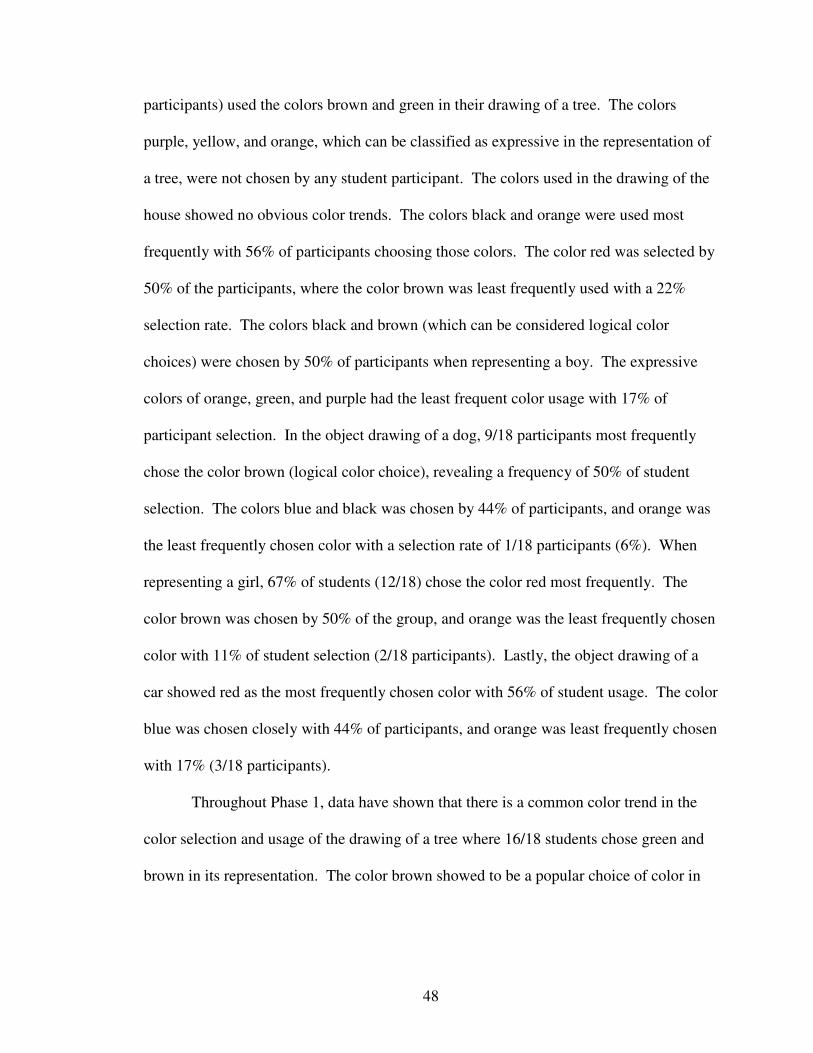
48
participants) used the colors brown and green in their drawing of a tree. The colors
purple, yellow, and orange, which can be classified as expressive in the representation of
a tree, were not chosen by any student participant. The colors used in the drawing of the
house showed no obvious color trends. The colors black and orange were used most
frequently with 56% of participants choosing those colors. The color red was selected by
50% of the participants, where the color brown was least frequently used with a 22%
selection rate. The colors black and brown (which can be considered logical color
choices) were chosen by 50% of participants when representing a boy. The expressive
colors of orange, green, and purple had the least frequent color usage with 17% of
participant selection. In the object drawing of a dog, 9/18 participants most frequently
chose the color brown (logical color choice), revealing a frequency of 50% of student
selection. The colors blue and black was chosen by 44% of participants, and orange was
the least frequently chosen color with a selection rate of 1/18 participants (6%). When
representing a girl, 67% of students (12/18) chose the color red most frequently. The
color brown was chosen by 50% of the group, and orange was the least frequently chosen
color with 11% of student selection (2/18 participants). Lastly, the object drawing of a
car showed red as the most frequently chosen color with 56% of student usage. The color
blue was chosen closely with 44% of participants, and orange was least frequently chosen
with 17% (3/18 participants).
Throughout Phase 1, data have shown that there is a common color trend in the
color selection and usage of the drawing of a tree where 16/18 students chose green and
brown in its representation. The color brown showed to be a popular choice of color in
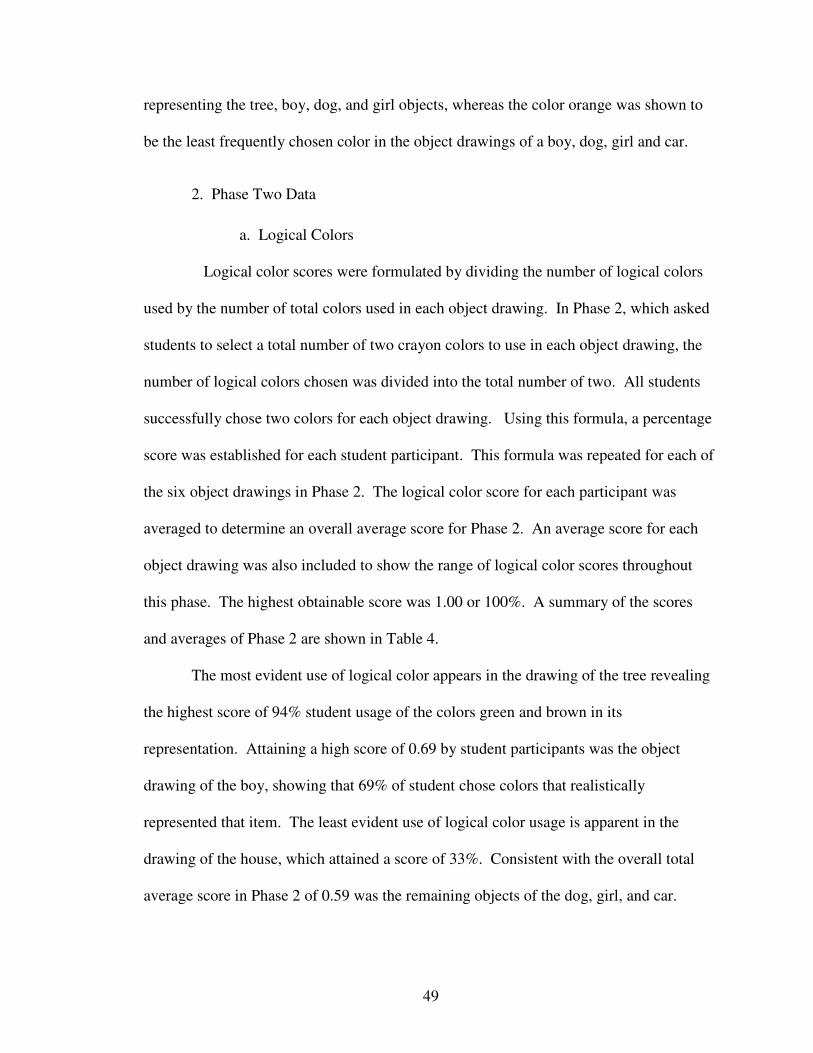
49
representing the tree, boy, dog, and girl objects, whereas the color orange was shown to
be the least frequently chosen color in the object drawings of a boy, dog, girl and car.
2. Phase Two Data
a. Logical Colors
Logical color scores were formulated by dividing the number of logical colors
used by the number of total colors used in each object drawing. In Phase 2, which asked
students to select a total number of two crayon colors to use in each object drawing, the
number of logical colors chosen was divided into the total number of two. All students
successfully chose two colors for each object drawing. Using this formula, a percentage
score was established for each student participant. This formula was repeated for each of
the six object drawings in Phase 2. The logical color score for each participant was
averaged to determine an overall average score for Phase 2. An average score for each
object drawing was also included to show the range of logical color scores throughout
this phase. The highest obtainable score was 1.00 or 100%. A summary of the scores
and averages of Phase 2 are shown in Table 4.
The most evident use of logical color appears in the drawing of the tree revealing
the highest score of 94% student usage of the colors green and brown in its
representation. Attaining a high score of 0.69 by student participants was the object
drawing of the boy, showing that 69% of student chose colors that realistically
represented that item. The least evident use of logical color usage is apparent in the
drawing of the house, which attained a score of 33%. Consistent with the overall total
average score in Phase 2 of 0.59 was the remaining objects of the dog, girl, and car.
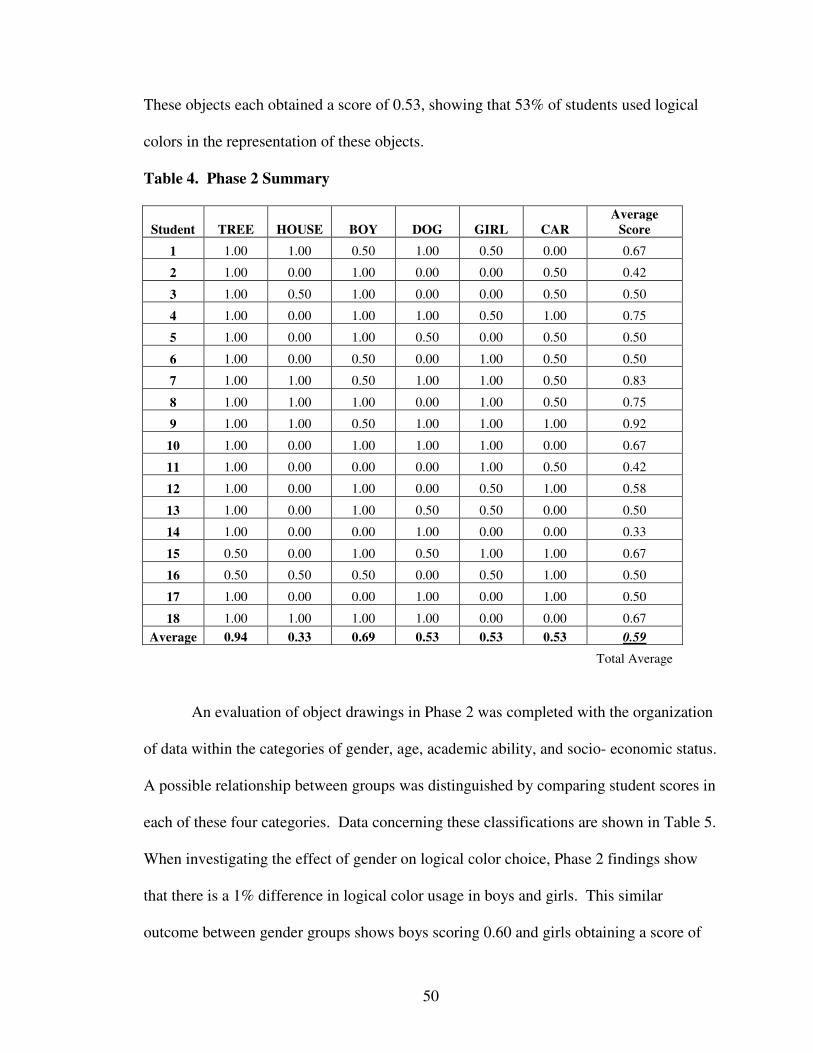
50
These objects each obtained a score of 0.53, showing that 53% of students used logical
colors in the representation of these objects.
Table 4. Phase 2 Summary
Student TREE HOUSE BOY DOG GIRL CARAverage
Score
1 1.00 1.00 0.50 1.00 0.50 0.00 0.67
2 1.00 0.00 1.00 0.00 0.00 0.50 0.42
3 1.00 0.50 1.00 0.00 0.00 0.50 0.50
4 1.00 0.00 1.00 1.00 0.50 1.00 0.75
5 1.00 0.00 1.00 0.50 0.00 0.50 0.50
6 1.00 0.00 0.50 0.00 1.00 0.50 0.50
7 1.00 1.00 0.50 1.00 1.00 0.50 0.83
8 1.00 1.00 1.00 0.00 1.00 0.50 0.75
9 1.00 1.00 0.50 1.00 1.00 1.00 0.92
10 1.00 0.00 1.00 1.00 1.00 0.00 0.67
11 1.00 0.00 0.00 0.00 1.00 0.50 0.42
12 1.00 0.00 1.00 0.00 0.50 1.00 0.58
13 1.00 0.00 1.00 0.50 0.50 0.00 0.50
14 1.00 0.00 0.00 1.00 0.00 0.00 0.33
15 0.50 0.00 1.00 0.50 1.00 1.00 0.67
16 0.50 0.50 0.50 0.00 0.50 1.00 0.50
17 1.00 0.00 0.00 1.00 0.00 1.00 0.50
18 1.00 1.00 1.00 1.00 0.00 0.00 0.67
Average 0.94 0.33 0.69 0.53 0.53 0.53 0.59
Total Average
An evaluation of object drawings in Phase 2 was completed with the organization
of data within the categories of gender, age, academic ability, and socio- economic status.
A possible relationship between groups was distinguished by comparing student scores in
each of these four categories. Data concerning these classifications are shown in Table 5.
When investigating the effect of gender on logical color choice, Phase 2 findings show
that there is a 1% difference in logical color usage in boys and girls. This similar
outcome between gender groups shows boys scoring 0.60 and girls obtaining a score of
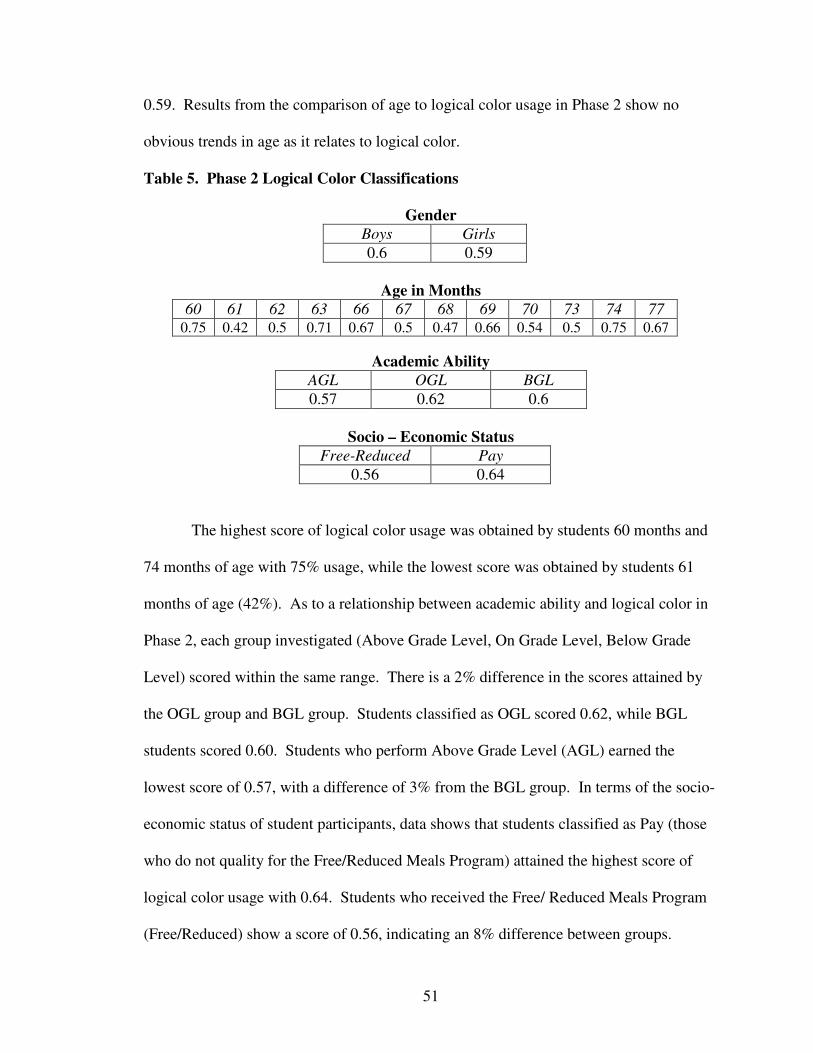
51
0.59. Results from the comparison of age to logical color usage in Phase 2 show no
obvious trends in age as it relates to logical color.
Table 5. Phase 2 Logical Color Classifications
GenderBoys Girls0.6 0.59
Age in Months60 61 62 63 66 67 68 69 70 73 74 77
0.75 0.42 0.5 0.71 0.67 0.5 0.47 0.66 0.54 0.5 0.75 0.67
Academic AbilityAGL OGL BGL0.57 0.62 0.6
Socio – Economic StatusFree-Reduced Pay
0.56 0.64
The highest score of logical color usage was obtained by students 60 months and
74 months of age with 75% usage, while the lowest score was obtained by students 61
months of age (42%). As to a relationship between academic ability and logical color in
Phase 2, each group investigated (Above Grade Level, On Grade Level, Below Grade
Level) scored within the same range. There is a 2% difference in the scores attained by
the OGL group and BGL group. Students classified as OGL scored 0.62, while BGL
students scored 0.60. Students who perform Above Grade Level (AGL) earned the
lowest score of 0.57, with a difference of 3% from the BGL group. In terms of the socio-
economic status of student participants, data shows that students classified as Pay (those
who do not quality for the Free/Reduced Meals Program) attained the highest score of
logical color usage with 0.64. Students who received the Free/ Reduced Meals Program
(Free/Reduced) show a score of 0.56, indicating an 8% difference between groups.
52
b. Color Trends
The colors chosen and used by student participants in the representation of each
object drawing were analyzed to find possible color trends in Phase 2. The colors used in
each object drawing were recorded and data was then formulated to investigate color
commonalities among objects. Data documenting the frequency of color usage in Phase
2 is shown in Figure 2.
Figure 2. Phase 2 Color Trends TREE HOUSE
BOY DOG
GIRL CAR
(Y) axis= ColorsColor sequence: Black, Brown, Purple, Blue, Green, Yellow, Orange, Red(X) axis= Frequency of Color Usage Vertical units per student (18)
The drawing of the tree indicates an obvious color trend in the frequency of usage
in both the colors green and brown. Eighteen out of eighteen students chose the color
green when drawing a tree, resulting in 100% of student participants. The color brown
53
was chosen with a frequency rate of 89% (16/18 student participants). The colors of
purple, yellow, orange, and red (which can be classified as expressive in the
representation of the tree) were not chosen by any student, therefore receiving a score of
0% color usage. The house object drawing for Phase 2 indicated no obvious color trends.
The color red was used most frequently with nine students out of eighteen (50% of total
participants) choosing this color to represent a house image. The colors black and blue
revealed the second highest frequency rate of 39% usage. The color green showed to be
the least frequent color used with one student out of eighteen choosing this color (6%
usage). The image of the boy in Phase 2 showed that 72% of student participants (13/18
students) used the color brown, attaining the highest frequency of color usage in the
representation of a boy. The color blue was chosen with the second highest frequency
rate of 56%. The colors red and yellow were the least frequently chosen colors with 6%
of student usage. In the investigation of color usage in the object drawing of a dog, 61%
of students logically chose the color brown to represent this image. The color yellow was
chosen by 33% of student participants, and the color green was shown as the least
frequently used color with 0% usage by student participants (0/18 students). Phase 2
object drawing of a girl found that purple was the most frequently chosen color with nine
students out of eighteen using this color in their image (50% of student participants). The
color brown was chosen with the second highest frequency rate of 39%. The least
frequently chosen colors for the girl object drawing was green, yellow, and orange with
11% of participant usage. In the object drawing of a car, 50% usage of the color black
indicated it as the most frequently chosen color. The color orange was shown with the
second highest frequency rate of 33%. The least frequently chosen color to represent the
54
car image was revealed with 11% student usage of the color blue (2//18 student
participants).
Throughout Phase 2, data have shown that there is a distinct common color trend
in the object drawing of a tree, where 18/18 students used the color green and 16/18
students used the color brown in the representation of this image. This resulted in a total
of 100% usage of the color green and 89% usage of the color brown. Excluding the total
percentage of student usage of the color green in the tree drawing, this color was shown
to be the least frequently chosen color for the remaining objects of the house, boy, dog,
and girl. Consistent with the frequency of usage of the color brown in the tree drawing,
this color along with the color blue showed to be the most frequently used colors
throughout all object drawings in Phase 2.
3. Phase Three Data
a. Logical Colors
Logical color scores were formulated by dividing the number of logical colors
used by the number of total colors used in each object drawing. In Phase 3, which asked
students to select a pre-arranged group of two crayon color combinations to use for each
object drawing, the number of logical colors chosen was divided into the total number of
two. All students successfully chose one color combination for each object drawing.
(There were no restrictions as to the number of times students may use any particular
color combination throughout the object drawing series. Directions specified students to
choose only one color group per object.) Using this formula, a percentage score was
established for each student participant. This formula was repeated for each of the six
object drawings in Phase 3. The logical color score for each participant was averaged to
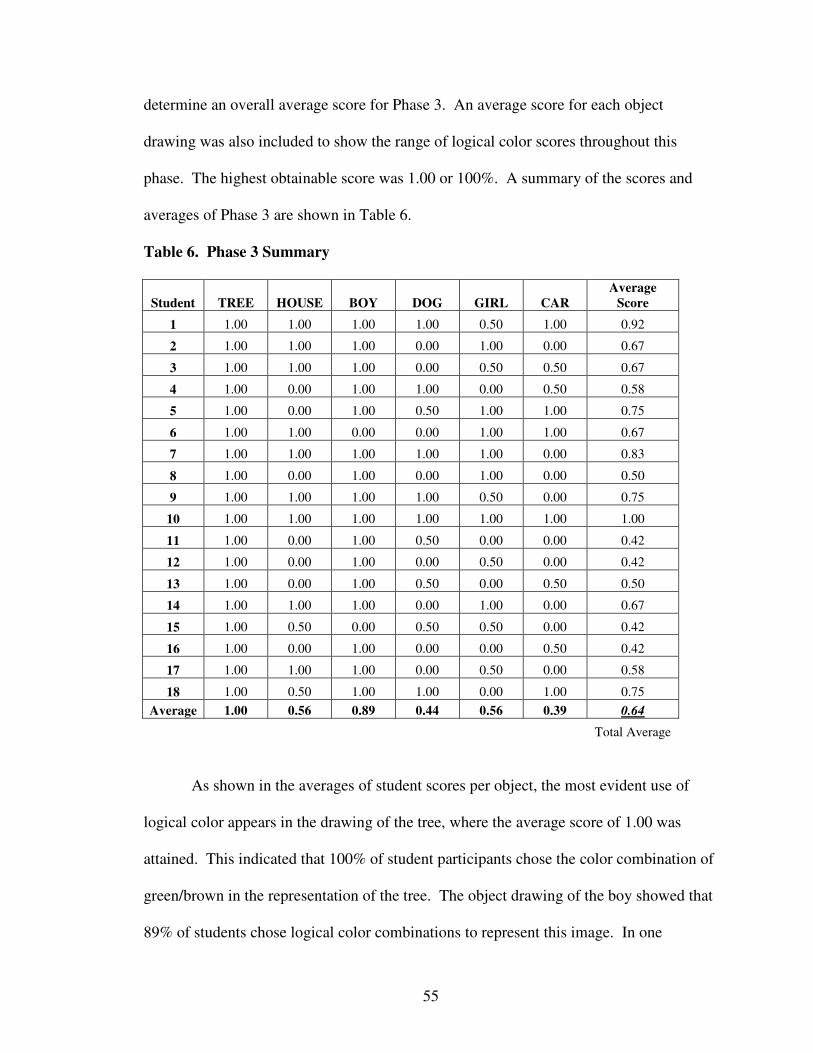
55
determine an overall average score for Phase 3. An average score for each object
drawing was also included to show the range of logical color scores throughout this
phase. The highest obtainable score was 1.00 or 100%. A summary of the scores and
averages of Phase 3 are shown in Table 6.
Table 6. Phase 3 Summary
Student TREE HOUSE BOY DOG GIRL CARAverage
Score
1 1.00 1.00 1.00 1.00 0.50 1.00 0.92
2 1.00 1.00 1.00 0.00 1.00 0.00 0.67
3 1.00 1.00 1.00 0.00 0.50 0.50 0.67
4 1.00 0.00 1.00 1.00 0.00 0.50 0.58
5 1.00 0.00 1.00 0.50 1.00 1.00 0.75
6 1.00 1.00 0.00 0.00 1.00 1.00 0.67
7 1.00 1.00 1.00 1.00 1.00 0.00 0.83
8 1.00 0.00 1.00 0.00 1.00 0.00 0.50
9 1.00 1.00 1.00 1.00 0.50 0.00 0.75
10 1.00 1.00 1.00 1.00 1.00 1.00 1.00
11 1.00 0.00 1.00 0.50 0.00 0.00 0.42
12 1.00 0.00 1.00 0.00 0.50 0.00 0.42
13 1.00 0.00 1.00 0.50 0.00 0.50 0.50
14 1.00 1.00 1.00 0.00 1.00 0.00 0.67
15 1.00 0.50 0.00 0.50 0.50 0.00 0.42
16 1.00 0.00 1.00 0.00 0.00 0.50 0.42
17 1.00 1.00 1.00 0.00 0.50 0.00 0.58
18 1.00 0.50 1.00 1.00 0.00 1.00 0.75
Average 1.00 0.56 0.89 0.44 0.56 0.39 0.64
Total Average
As shown in the averages of student scores per object, the most evident use of
logical color appears in the drawing of the tree, where the average score of 1.00 was
attained. This indicated that 100% of student participants chose the color combination of
green/brown in the representation of the tree. The object drawing of the boy showed that
89% of students chose logical color combinations to represent this image. In one
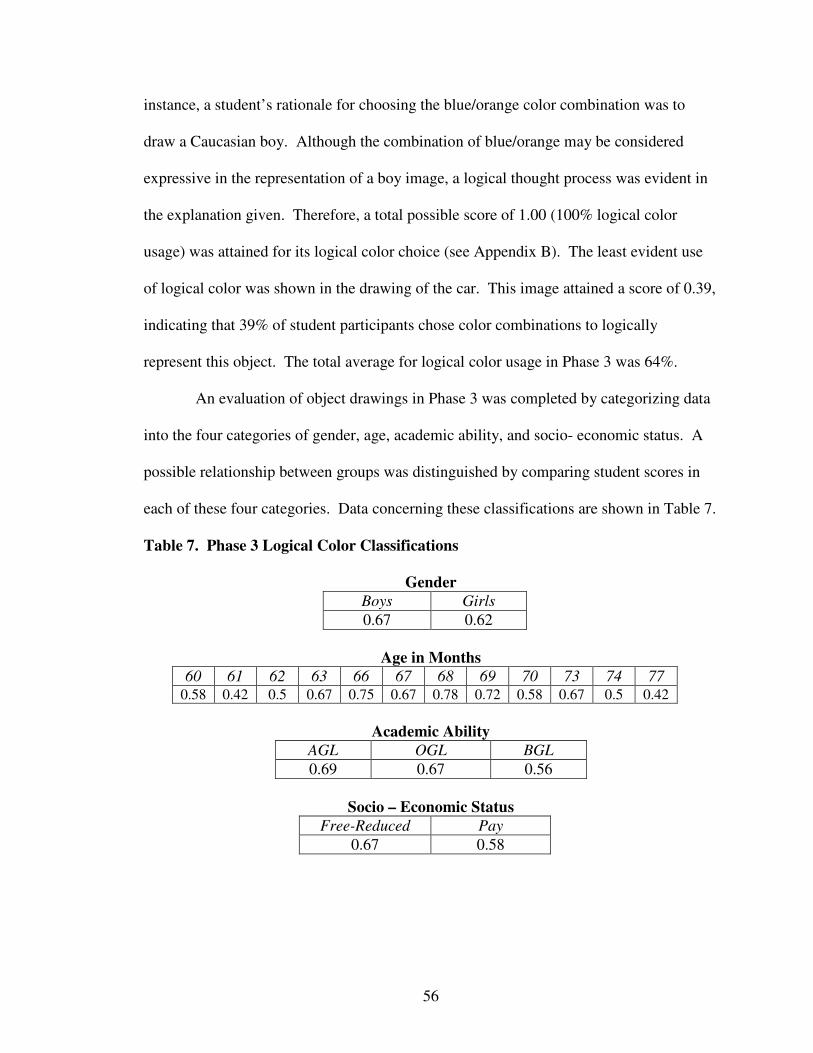
56
instance, a student’s rationale for choosing the blue/orange color combination was to
draw a Caucasian boy. Although the combination of blue/orange may be considered
expressive in the representation of a boy image, a logical thought process was evident in
the explanation given. Therefore, a total possible score of 1.00 (100% logical color
usage) was attained for its logical color choice (see Appendix B). The least evident use
of logical color was shown in the drawing of the car. This image attained a score of 0.39,
indicating that 39% of student participants chose color combinations to logically
represent this object. The total average for logical color usage in Phase 3 was 64%.
An evaluation of object drawings in Phase 3 was completed by categorizing data
into the four categories of gender, age, academic ability, and socio- economic status. A
possible relationship between groups was distinguished by comparing student scores in
each of these four categories. Data concerning these classifications are shown in Table 7.
Table 7. Phase 3 Logical Color Classifications
GenderBoys Girls0.67 0.62
Age in Months60 61 62 63 66 67 68 69 70 73 74 77
0.58 0.42 0.5 0.67 0.75 0.67 0.78 0.72 0.58 0.67 0.5 0.42
Academic AbilityAGL OGL BGL0.69 0.67 0.56
Socio – Economic StatusFree-Reduced Pay
0.67 0.58
57
In establishing a possible relationship between logical color usage and gender,
Phase 3 indicates a 5% difference in the logical color usage of boys and girls, where boys
scored a total of 0.67 and girls obtained a total score of 0.62. The investigation of age as
it related of logical color shows no obvious trends for Phase 3. Students aged 68 months
obtained the highest use of logical color with 78% logical color usage. The lowest score
of logical color usage is shown by students aged 61 months (42%). Results from the
comparison of academic ability as it relates to logical color indicate slight differences in
percentages between groups. Students in the Above Grade Level group (AGL) showed
the highest use of logical color with 69% usage (with a score of 0.67). Following this
group, students On Grade Level (OGL) performed with 67% logical color usage (with a
score of 0.67). Establishing the lowest use of logical color usage in Phase 3 was Below
Grade Level (BGL) students, earning 56% of logical color usage (with a score of 0.56).
This comparison revealed a 13% difference in the use of logical color between the AGL
and BGL groups. Investigating socio-economic status as a possible relation to logical
color, students qualifying for the Free/Reduced Meals program (Free/Reduced) attained
the highest score of logical color usage with 0.67. Students not qualifying for this
program (Pay) received a score of 0.58. This distinguishes a 9% difference of logical
color usage as it relates to socio-economic status for Phase 3.
58
b. Color Trends
The color combinations chosen and used by student participants in the
representation of each object drawing throughout Phase 3 were analyzed to find possible
color trends. The color combinations used in each object drawing were recorded and data
was then formulated to investigate color commonalities among objects. Data
documenting the frequency of color usage in Phase 3 is shown in Figure 3.
In examining the color combinations used in the drawing of the tree, results
indicate an overwhelming trend in the usage of the colors green/brown. All students
(18/18 participants) chose this color combination in the representation of the tree,
indicating 100% of student usage. The remaining four possible color combination
choices (yellow/purple, red/black, brown/black, and blue/orange) were not chosen by any
student participant. Color trends for the house drawing in Phase 3 indicated the color
combination red/black with the most frequent usage with nine out of eighteen students
choosing this combination (50% of student participants). The combinations brown/black
and green/brown were not chosen by any student, resulting in the least frequent color
usage of 0%. The color combination of brown/black was used most frequently in the
drawing with a frequency of usage of 83% (15/18 student participants). The least
frequent color combination choice was red/black with 0% usage. The combination of
blue/orange was chosen by two students (11%), representing one logical color choice
with reasoning to represent the image realistically. The other instance was an expressive
representation of a boy.
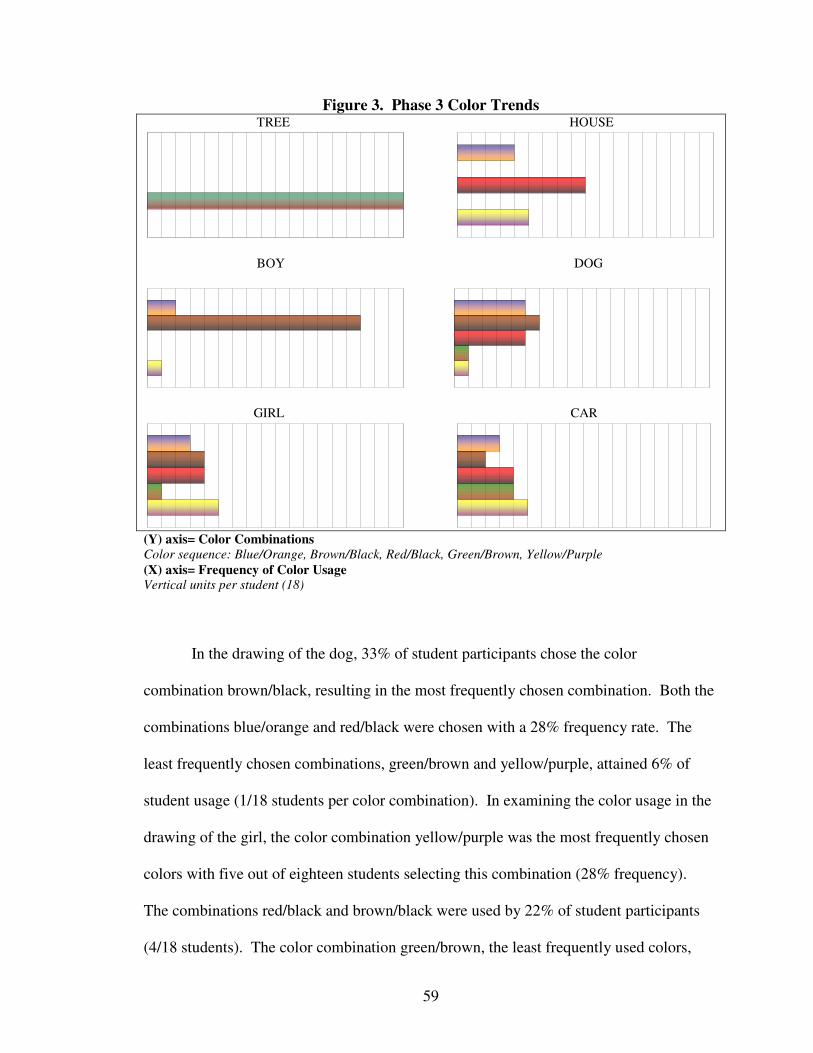
59
Figure 3. Phase 3 Color Trends TREE HOUSE
BOY DOG
GIRL CAR
(Y) axis= Color CombinationsColor sequence: Blue/Orange, Brown/Black, Red/Black, Green/Brown, Yellow/Purple(X) axis= Frequency of Color Usage Vertical units per student (18)
In the drawing of the dog, 33% of student participants chose the color
combination brown/black, resulting in the most frequently chosen combination. Both the
combinations blue/orange and red/black were chosen with a 28% frequency rate. The
least frequently chosen combinations, green/brown and yellow/purple, attained 6% of
student usage (1/18 students per color combination). In examining the color usage in the
drawing of the girl, the color combination yellow/purple was the most frequently chosen
colors with five out of eighteen students selecting this combination (28% frequency).
The combinations red/black and brown/black were used by 22% of student participants
(4/18 students). The color combination green/brown, the least frequently used colors,
60
was chosen by one student participant resulting in 6% of student selection. The color
trends in the drawing of the car indicated the color combination yellow/purple as the most
frequently used colors with 28% of student usage. The combinations red/black and
green/brown were shown with four out of eighteen students choosing these combinations,
resulting in 22% of student usage. With 11% (2/18 students), the color combination
brown/black was the least frequently chosen color combination in the drawing of the car.
Throughout Phase 3, data have indicated an overwhelming color trend in the
representation of the tree. The total number of student participants (18) chose the color
combination green/brown when drawing this image. This resulted in 100% of student
usage. With the exception of the tree drawing, the green/brown color combination was
shown to be the least frequently chosen color combination throughout the following four
objects: house, boy, dog, and girl. In the drawing of the car, this color combination was
used by less than 1/3 of the class, obtaining a small percentage of student usage (22%).
4. Data Comparison of Phases
Logical Colors. Throughout the three phases of the study, comparisons were
completed in order to find possible relationships between objects and logical colors. A
comparison of the average scores throughout phases can be found in Table 8. (Further
examples of student images as they progress throughout the three phases of the study can
be found in Appendixes C through F).
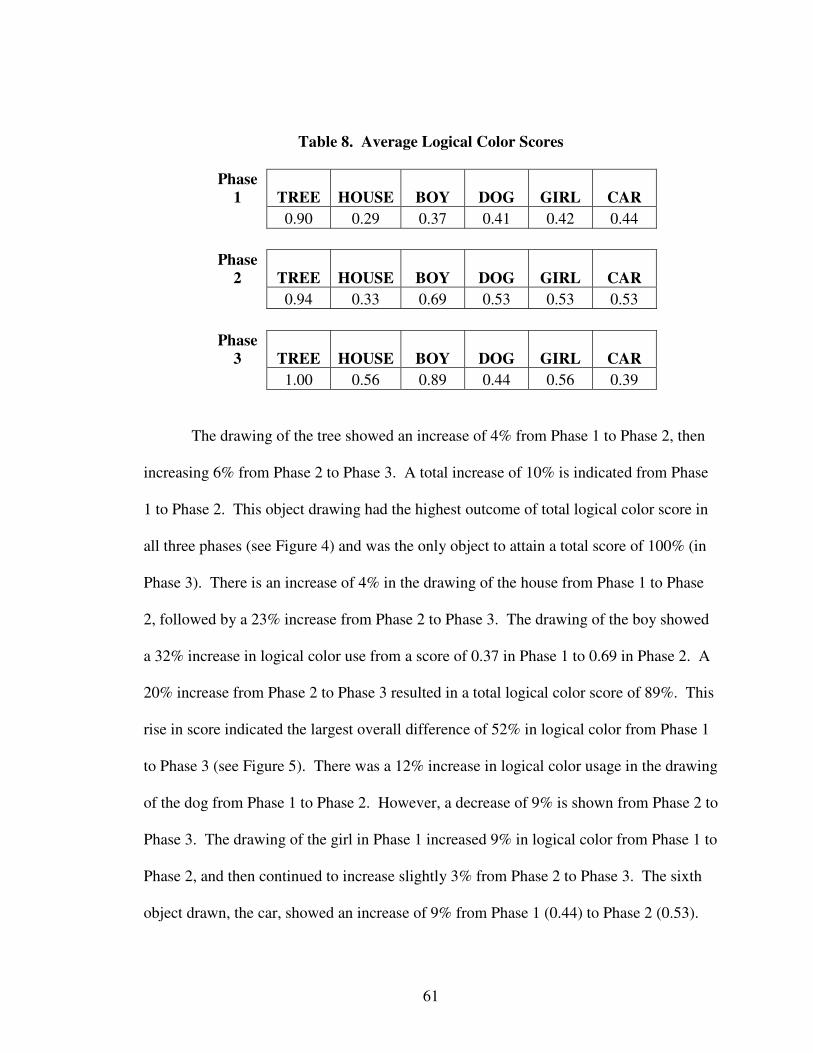
61
Table 8. Average Logical Color Scores
Phase 1 TREE HOUSE BOY DOG GIRL CAR
0.90 0.29 0.37 0.41 0.42 0.44
Phase 2 TREE HOUSE BOY DOG GIRL CAR
0.94 0.33 0.69 0.53 0.53 0.53
Phase 3 TREE HOUSE BOY DOG GIRL CAR
1.00 0.56 0.89 0.44 0.56 0.39
The drawing of the tree showed an increase of 4% from Phase 1 to Phase 2, then
increasing 6% from Phase 2 to Phase 3. A total increase of 10% is indicated from Phase
1 to Phase 2. This object drawing had the highest outcome of total logical color score in
all three phases (see Figure 4) and was the only object to attain a total score of 100% (in
Phase 3). There is an increase of 4% in the drawing of the house from Phase 1 to Phase
2, followed by a 23% increase from Phase 2 to Phase 3. The drawing of the boy showed
a 32% increase in logical color use from a score of 0.37 in Phase 1 to 0.69 in Phase 2. A
20% increase from Phase 2 to Phase 3 resulted in a total logical color score of 89%. This
rise in score indicated the largest overall difference of 52% in logical color from Phase 1
to Phase 3 (see Figure 5). There was a 12% increase in logical color usage in the drawing
of the dog from Phase 1 to Phase 2. However, a decrease of 9% is shown from Phase 2 to
Phase 3. The drawing of the girl in Phase 1 increased 9% in logical color from Phase 1 to
Phase 2, and then continued to increase slightly 3% from Phase 2 to Phase 3. The sixth
object drawn, the car, showed an increase of 9% from Phase 1 (0.44) to Phase 2 (0.53).
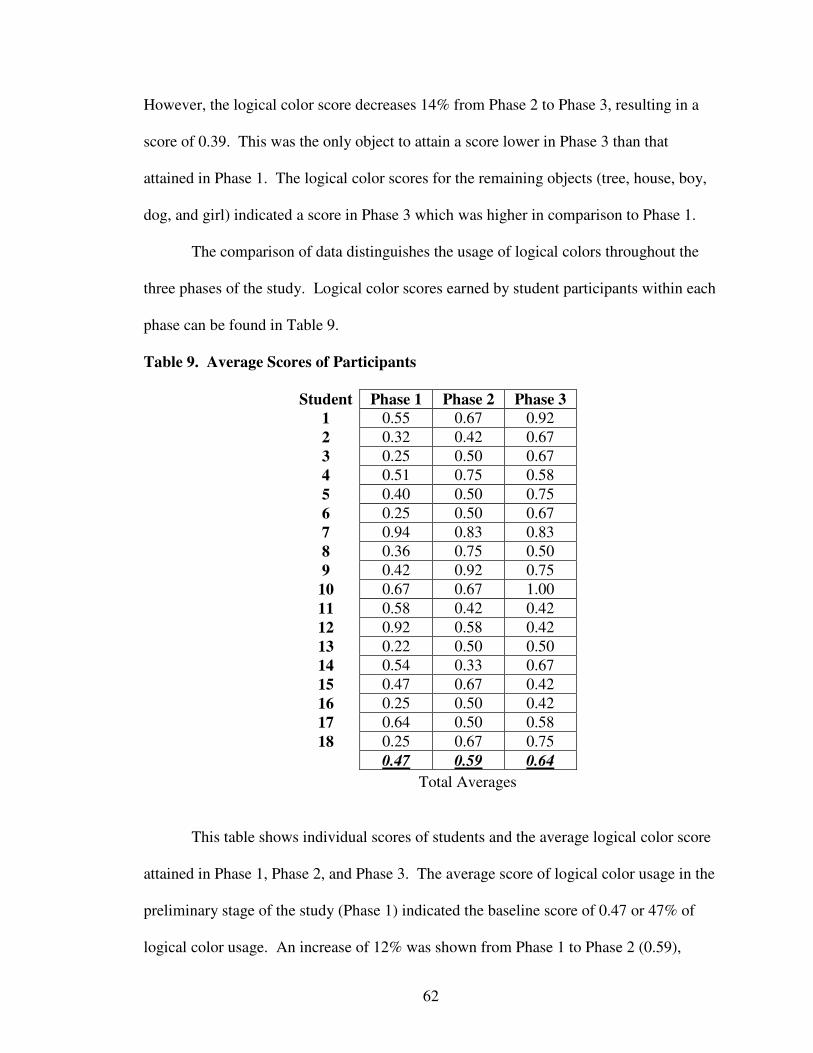
62
However, the logical color score decreases 14% from Phase 2 to Phase 3, resulting in a
score of 0.39. This was the only object to attain a score lower in Phase 3 than that
attained in Phase 1. The logical color scores for the remaining objects (tree, house, boy,
dog, and girl) indicated a score in Phase 3 which was higher in comparison to Phase 1.
The comparison of data distinguishes the usage of logical colors throughout the
three phases of the study. Logical color scores earned by student participants within each
phase can be found in Table 9.
Table 9. Average Scores of Participants
Student Phase 1 Phase 2 Phase 31 0.55 0.67 0.922 0.32 0.42 0.673 0.25 0.50 0.674 0.51 0.75 0.585 0.40 0.50 0.756 0.25 0.50 0.677 0.94 0.83 0.838 0.36 0.75 0.509 0.42 0.92 0.7510 0.67 0.67 1.0011 0.58 0.42 0.4212 0.92 0.58 0.4213 0.22 0.50 0.5014 0.54 0.33 0.6715 0.47 0.67 0.4216 0.25 0.50 0.4217 0.64 0.50 0.5818 0.25 0.67 0.75
0.47 0.59 0.64 Total Averages
This table shows individual scores of students and the average logical color score
attained in Phase 1, Phase 2, and Phase 3. The average score of logical color usage in the
preliminary stage of the study (Phase 1) indicated the baseline score of 0.47 or 47% of
logical color usage. An increase of 12% was shown from Phase 1 to Phase 2 (0.59),
63
revealing that 59% of students chose logical colors throughout this phase. From Phase 2
to Phase 3, there was a 5% increase in logical color usage (0.64). When comparing the
preliminary phase of the study (Phase 1) to that of the last phase (Phase 3), a total
increase of 17% was indicated.
Data collected within each phase were organized into four categories of
classification (gender, age, academic ability, and socio-economic status) and then
compared throughout the three phases of the study. The comparison of gender suggested
an increase of logical color usage of boys of 24% from Phase 1 (0.36) to Phase 2 (0.60).
This score continued to rise 7% from Phase 2 to Phase 3 (0.67). The logical color usage
of girls in Phase 1 increased 6% to Phase 2 (0.59), and then continued to rise 3% to Phase
3 (0.62). These results indicated a considerable increase in the logical color usage of
boys and a steady increase in the logical color usage of girls throughout the three phases.
In comparing the data gathered in the category of age, results were conclusive as to no
obvious trends in logical color usage as it relates to the age of student participants. In
examining logical color usage as compared to academic ability, the AGL group showed
an increase of 11% from Phase 1 (0.46) to Phase 2 (0.57), and then continued to increase
12% from Phase 2 to Phase 3 (0.69). An increase of 14% in logical color usage of the
OGL group from Phase 1 (0.48) to Phase 2 (0.62) continued to show a 5% increase from
Phase 2 to Phase 3 (0.67). Accordingly, the logical color score of the BGL group in
Phase 1 (0.45) increased 15% in Phase 2 (0.60). However, a decrease of 4% was shown
from Phase 2 to Phase 3 (0.56). The results of the comparison of academic ability
indicated a consistent rise in logical color score in both the AGL and OGL groups. The
only decrease in score was identified in the BGL group in Phase 3. The relationship
64
between logical color usage and socio-economic status across the three phases of the
study showed an increase of 14% from Phase 1 (0.42) to Phase 2 (0.56) for students
receiving Free/Reduced meal plans. This score continued to rise 11% from Phase 2 to
Phase 3 (0.67). Students not receiving meal programs (Pay) indicated an 11% increase
from Phase 1 (0.53) to Phase 2 (0.64). However, a score of 0.58 in Phase 3 revealed a
decrease of 6% from Phase 2. These results show a notable increase in both groups for
Phase 1 to Phase 2. Students in the Pay group indicated a decrease in score in Phase 3 as
compared to the previous phases.
Color Trends. The frequency of color usage in each object drawing was
compared throughout the three phases of the study in order to find possible trends in
color selection. In the object drawing of the tree, the colors green and brown increased
from 89% usage in Phase 1 to 95% usage in Phase 2, indicating a 6% increase. From
Phase 2 to Phase 3, the usage of these colors continued to rise 5%, attaining a total score
of 100% of student usage (see Figure 4). This was the only object drawing in which the
colors selected and used by student participants reached a total score of 100%. In the
drawing of the house, the colors red and black were used most frequently throughout the
three phases. From Phase 1 (53%) to Phase 2 (44%), there was a decrease of 9% in the
usage of these colors. However, in Phase 3, an increase of 6% was shown with 50% of
students choosing the colors red and black in their drawing.
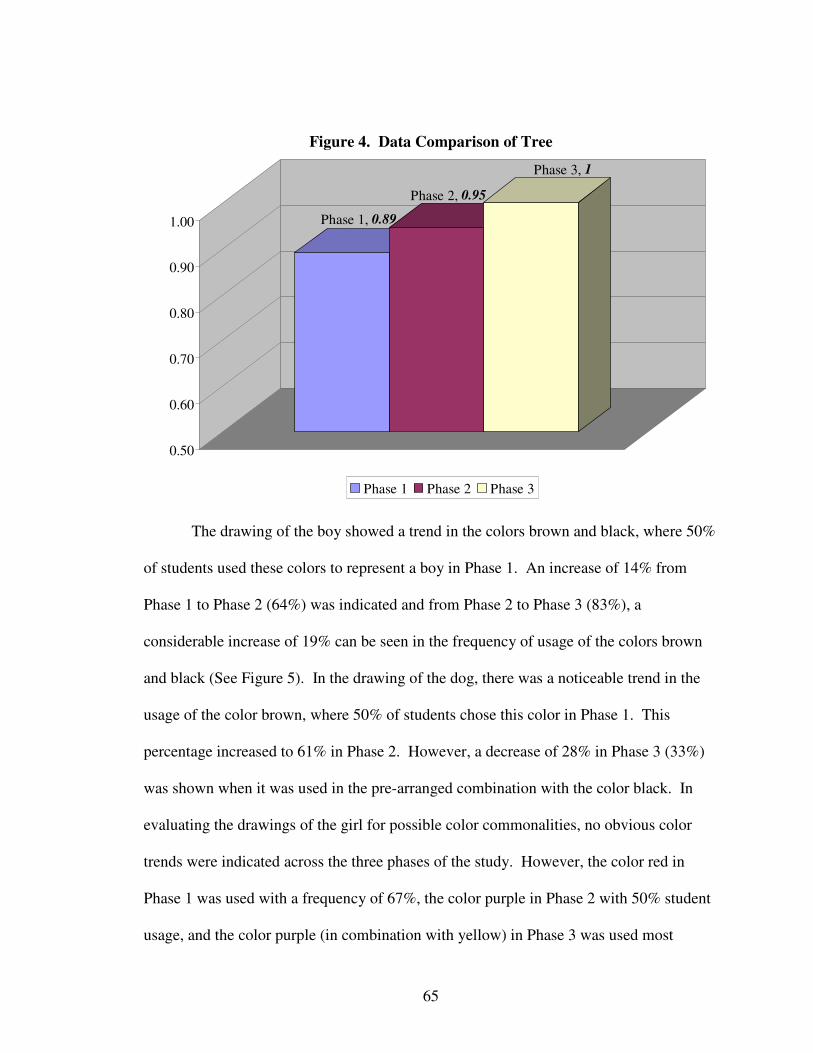
65
Figure 4. Data Comparison of Tree
Phase 1, 0.89
Phase 2, 0.95
Phase 3, 1
0.50
0.60
0.70
0.80
0.90
1.00
Phase 1 Phase 2 Phase 3
The drawing of the boy showed a trend in the colors brown and black, where 50%
of students used these colors to represent a boy in Phase 1. An increase of 14% from
Phase 1 to Phase 2 (64%) was indicated and from Phase 2 to Phase 3 (83%), a
considerable increase of 19% can be seen in the frequency of usage of the colors brown
and black (See Figure 5). In the drawing of the dog, there was a noticeable trend in the
usage of the color brown, where 50% of students chose this color in Phase 1. This
percentage increased to 61% in Phase 2. However, a decrease of 28% in Phase 3 (33%)
was shown when it was used in the pre-arranged combination with the color black. In
evaluating the drawings of the girl for possible color commonalities, no obvious color
trends were indicated across the three phases of the study. However, the color red in
Phase 1 was used with a frequency of 67%, the color purple in Phase 2 with 50% student
usage, and the color purple (in combination with yellow) in Phase 3 was used most
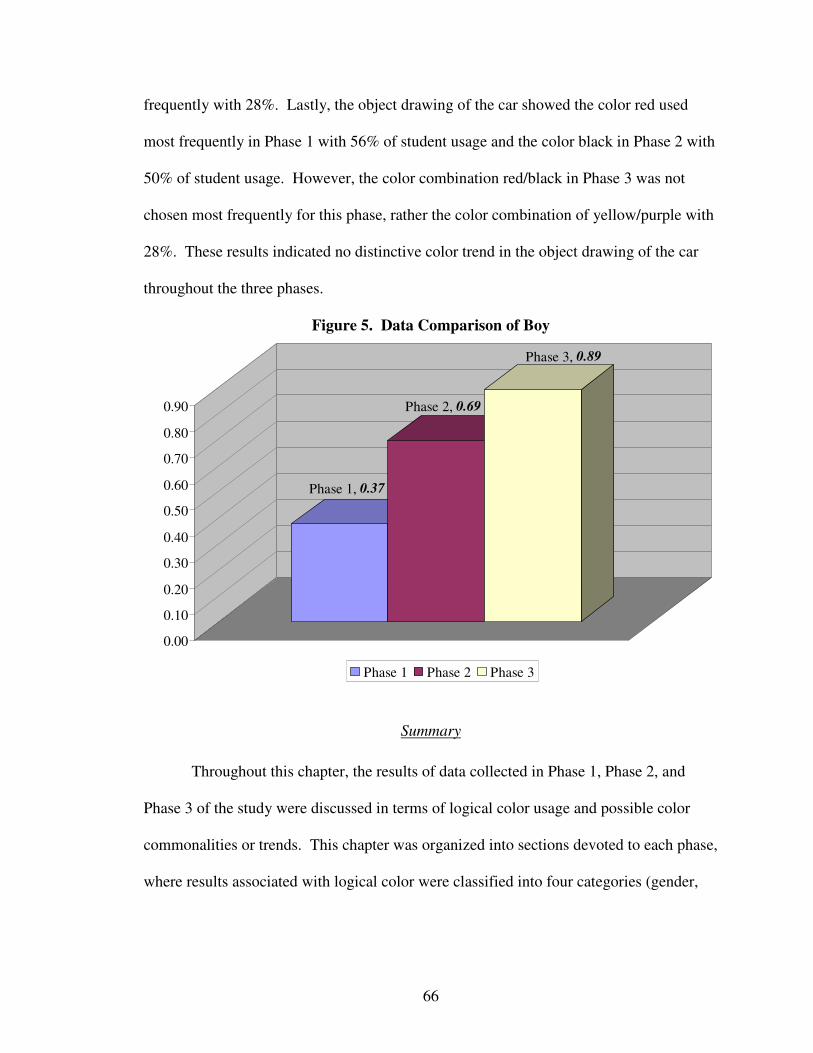
66
frequently with 28%. Lastly, the object drawing of the car showed the color red used
most frequently in Phase 1 with 56% of student usage and the color black in Phase 2 with
50% of student usage. However, the color combination red/black in Phase 3 was not
chosen most frequently for this phase, rather the color combination of yellow/purple with
28%. These results indicated no distinctive color trend in the object drawing of the car
throughout the three phases.
Figure 5. Data Comparison of Boy
Phase 1, 0.37
Phase 2, 0.69
Phase 3, 0.89
0.00
0.10
0.20
0.30
0.40
0.50
0.60
0.70
0.80
0.90
Phase 1 Phase 2 Phase 3
Summary
Throughout this chapter, the results of data collected in Phase 1, Phase 2, and
Phase 3 of the study were discussed in terms of logical color usage and possible color
commonalities or trends. This chapter was organized into sections devoted to each phase,
where results associated with logical color were classified into four categories (gender,
67
age, academic ability, and socio-economic status) and evaluated according to logical
color usage scores obtained in each phase.
Data showed that the overall total logical color usage of student participants
increased throughout the three phases of the study. In relation to gender, there was an
increase in scores in both boy and girl groups. There were no obvious trends in the
scores obtained from age groups. In reference to academic ability, an increase was
shown in the logical color usage in all subgroups from Phase 1 to Phase 2. The AGL and
OGL subgroup scores continued to increase from Phase 2 to Phase 3. However, the BGL
subgroup showed a decrease in logical color usage from Phase 2 to Phase 3. Lastly, in
relation to socio – economic status, the logical color scores of Free- Reduced and Pay
subgroups increased from Phase 1 to Phase 2. However, from Phase 2 to Phase 3, the
Free – Reduced subgroup continued to increase while there was a decrease in score in the
Pay subgroup.
Color selection in each object drawing was then presented in order to show
notable trends in the frequency of color usage. Throughout the phases, color trends in the
object drawings of the dog and boy were shown in the usage of green and brown to
represent the tree, and brown and black to represent the boy. The color brown was seen
in the representation of the dog and girl throughout the phases. In addition to the color
brown, the colors red and purple were used to represent the girl. The colors red and black
were shown to represent the car in both Phase 1 and Phase 2. However, this color trend
was not evident in Phase 3. In the drawing of the house, there were no obvious color
trends throughout the phases of the study.
68
The remaining section of this chapter presented a comparison of data throughout
the three phases of the study. Average logical color scores for the drawings of the tree,
house, boy, and girl increased throughout phases. The scores for the object drawings of
the dog and car increased from Phase 1 to Phase 2. However, there was a decrease in
logical color score in these objects from Phase 2 to Phase 3. Total average scores of
participants in the study were presented. This showed an increase in logical color usage
throughout the three phases. Lastly, colors used to represent each object throughout the
three phases were compared to find possible color trends in the usage of color for each
object drawing.
69
Chapter V: Summary and Discussion
Introduction
Chapter V contains a summary of the study in relation to the results presented in
Chapter IV. This chapter begins with a discussion of the initial assumptions of the
outcomes of the study. These assumptions were made prior to the conduction of the
study and will be used in the explanation of the study’s results. Conclusions of each
phase and a comparison of phases will be established. The remaining sections of this
chapter will include a discussion of possible limitations of the study and
recommendations for the study and further research on this topic.
Initial Assumptions of Study Outcomes
Prior to conducting the study, assumptions were established on the outcomes of
logical color choice in each phase of the study as well as logical color choice within the
four classifications of gender, age, academic ability, and socio - economic status. In
relation to logical color choices of student participants, it could be assumed that student
outcomes would consist of expressive color choices in all six object drawings. This
assumption was established in accordance with Lowenfeld’s (1987) artistic stages of
development (as noted in Chapter II), where students at this age level produce art that is
expressive and spontaneous. The increase of logical color choice from each phase of the
study was assumed to occur based on the increase of color choice limitations in each
phase. It was established that an increase in logical thinking would be used throughout
the study as each phase was differentiated by color choice amount, therefore resulting in
a decrease of expressive color usage and an increase of logical color choice.
70
Assumptions about logical color choice within the four classifications of gender,
age, academic ability, and socio - economic status were also recognized. Based on
classroom observations and experience prior to the conduct of the study, it was assumed
that boys would be less expressive and girls more expressive in their color choice
throughout all three phases of the study, resulting in a higher logical color score for boys.
Assumptions about age as it relates to logical color were established in
accordance with Lowenfeld’s (1987) Preschematic Stage (classifying children’s artistic
tendencies from age four to age seven). Student participants with a younger
chronological age were assumed to be more expressive in their color choices as compared
to older students. This assumption was established because of the younger student’s
classification in the Preschematic Stage (students between the ages of sixty months and
sixty- seven months). Older students were presumed to be more logical in their color
choice due to their age (sixty-eight months and older) which would classify them,
according to Lowenfeld (1987), as exiting the Preschematic Stage.
It was assumed that academic ability would be a predictor of logical color choice
due to academic assessments consisting of logical thinking which group students as
Above Grade Level, On Grade Level, and Below Grade Level. Therefore, students
classified as Above Grade Level would perform with a higher logical color score than
those students classified as On Grade Level. Students classified as On Grade Level
would produce a logical color score higher than those students classified as Below Grade
Level.
Lastly, in relation to socio-economic status and logical color, it was assumed that
students receiving the Free - Reduced Meals program because of their economic need
71
would be less logical in their color choice (more expressive) than those students not
receiving this program (Pay students). This assumption was recognized because of low
standardized test scores throughout the school where student participants attended. Prior
to the study, students in testing grades (grades 3 and 5) who have been classified as
receiving Free- Reduced Meals program have attained lower performing test scores in
logical reasoning of both reading and math indicators in comparison to those students not
receiving this program (i.e., those considered as Pay students). Because of this state
assessment result, it was assumed that students in this study receiving this program
because of economic need would be more expressive and less logical in their color
choices than those students with higher economic status.
Conclusions
1. Phase One
Logical Color. Logical color was used by 90% of students in the drawing of the
tree. This score included one student participant who selected only the color brown to
represent a tree which consisted of leaf – less branches in the autumn season. The object
drawing of the tree attained the highest logical color score in comparison to the other
objects in this phase. It should be noted that this phase of the study occurred in the
month of November, where deciduous trees in this environment have mostly shed their
leaves. However, the majority of students chose the colors green and brown in their
representation. This may be a result of a possible color schema of objects in nature,
where the prior knowledge of students creates strong associations in the representation of
an object. The object drawing which attained the lowest logical color score of 29% was
the drawing of the house. Because houses appear in a variety of colors and students in
72
this phase where not limited in their color amount, students were more expressive with
this object drawing in comparison to the other objects in this phase, utilizing a larger
number of colors in their drawing. The remaining objects of the boy, dog, girl, and car
obtained scores ranging between 37% and 44%, representative of the average total logical
color score for this phase (47%).
In reference to the four classifications of logical color in Phase 1, certain
assumptions associated with the sub- groups of gender, age, academic ability, and socio-
economic status have been met. When examining the effect of gender on logical color,
girls attained a higher score (0.53) than that of boys (0.36). The assumption that girls
would perform more expressive than boys was not met in this phase. In evaluating age as
it relates to logical color, there were no evident trends shown in logical color score. The
assumption that older age yields logical ability may not be an adequate predictor of
logical color usage, therefore resulting in the proposition that age does not predict ability.
Logical color scores in relation to academic ability showed that the assumption of Above
Grade Level students attaining the highest logical color score was not met. The On
Grade Level group attained the highest score of 0.48. However, the Below Grade Level
group did score the lowest with a logical color score of 0.45. Logical color scores in
terms of socio - economic status showed the assumption that students receiving Free -
Reduced meals program scored lower in logical color usage in comparison to students
who pay full meal coverage to be true. Pay students attained a score of 0.53 followed by
Free - Reduced students scoring 0.42.
Color Trends. In Phase 1, two groups of color trends were evident in the object
drawings of the tree and boy. In the drawing of the tree, the colors green and brown were
73
most frequently chosen. Although this phase occurred during the autumn season, the
majority of students (with the exception of one participant) used these colors in their
representation. Students seemed to choose natural colors to represent a tree. However,
these colors were not a realistic representation of some trees at the time when the study
was conducted. The result of this finding may explain a possible color schema in the
representation of an object in nature. In the drawing of the boy, the colors brown and
black were chosen most frequently in its representation. Because student participants
were of the African American race, the ethnicity of the students may have resulted in the
selection of these colors. The colors used in the remaining objects (house, dog, girl, car)
showed no obvious color trends.
2. Phase Two
Logical Color. Logical color was used by 94% of student participants in the
object drawing of the tree. The use of expressive colors in the representation of the tree
was not evident in this phase. As in Phase 1, the result of a high logical color score for
this object may be explained by addressing a possible color association, or schema, with
the colors green and brown in the representation of a tree. The object drawing which
attained the lowest score of logical color with 33% was the drawing of the house, similar
to the finding in Phase 1. The expressive color usage with this object may be a result of
the variety of colors associated with a house. However, it should be noted that this phase
posed a limitation as to the number of colors that can be chosen to represent each object.
Students were asked to select two crayon colors for each drawing. This minimized the
color choices. However, it did not seem to limit the expressive color selection of the
students. Logical color was used by 69% of students when representing the image of the
74
boy. This score showed an increase of 32% in logical color usage from the drawing of
the boy in Phase 1. The remaining objects (dog, girl, car) all obtained a score of 53%
which is consistent with the total average logical color score in Phase 2 (0.59).
The four classifications of gender, age, academic ability, and socio- economic
status on logical color choice in Phase 2 showed similar findings to Phase 1. In
examining the effect of gender on logical color, the assumption of boys attaining a higher
logical color score than girls was slightly true, with a score of 0.60 for boys and 0.59 for
girls. However, it should be noted that there is only a difference of 0.1 between each
group. In investigating age as it relates to logical color, there were not any obvious
trends shown in logical color score, creating supporting evidence that age is not a good
predictor of logical thinking or academic ability. According to academic ability on
logical color, Below Grade Level students did not satisfy the assumption of attaining the
lowest logical color score. This group scored an average of 0.60. However, as in Phase
1, students in the On Grade Level group attained the highest logical color score of 0.62,
while students in the Above Grade Level group scored the lowest in this phase with 0.57.
In terms of socio-economic status, the assumption that economic status has an effect on
logical thinking has been satisfied in Phase 2 with Free - Reduced meals students
attaining a lower score (0.56) when compared to Pay students (0.64).
Color Trends. In Phase 2, as in Phase 1, color trends were evident in the object
drawing of the tree and the boy. Again as in Phase 1, the colors brown and green were
chosen most frequently. However, because this phase asked students to choose only two
colors to represent each object, it may have eliminated the possibility of using only the
color brown as a color choice and increased the possibility of using the color green. The
75
selection of these colors may be the result of a possible color association of green and
brown with the representation of a tree. The colors brown and black, as in Phase 1, were
used most frequently in the drawing of the boy, resulting in possible skin color
associations with the student participants’ ethnicity. In addition to the object drawings of
the tree and boy, there are notable color trends in the drawings of the dog and car. In the
object drawing of the dog, the color brown was used frequently to represent this object,
showing a possible color association of the color brown with the hair of a dog. The color
black was used frequently in the drawing of the car, providing evidence of a logical color
choice in the representation of its wheels. The colors purple, brown, and red were used
most frequently in the drawing of the girl, providing a possible association with these
colors to the image of a girl. However, there was no obvious color trends in the drawing
of the house, with all colors used consistently (with the exception of the color green,
which was selected by only one student). Because a house can be observed in a variety
of colors, students’ color selection varied.
3. Phase Three
Logical Color. In Phase 3, logical color was used by 100% of student participants
in the drawing of the tree. The use of expressive colors in the representation of the tree
was not evident in this phase. As in Phase 1 and Phase 2, the result of a high logical
color score for this object may be explained by addressing a possible color association, or
schema, with the colors green and brown in the representation of a tree. It should be
noted that, differing from the two previous phases, student in this phase were asked to
select a pre-arranged group of colors to draw each object. The logical color usage for this
object may have increased due to the pre-arranged color combination of green and brown.
76
The object drawing which attained the lowest score of logical color choices with 39%
was the drawing of the car. Because a car can be observed in a variety of colors, students
may have chosen color combinations to represent the body of a car and consequently
overlooked the element of black to represent the tires. Logical color was used by 89% of
student participants in the drawing of the boy. There was a 20% increase of logical color
usage for this object from Phase 2. This may be the result of a possible association with
realistic images of boys in the representation of this object. The remaining objects
(house, dog, girl) obtained logical color scores ranging from 44% to 56%, which were
consistent with the total average logical color score for Phase 3 (64%).
With reference to the four classifications of logical color in Phase 3, several
assumptions associated with the sub- groups of gender, age, academic ability, and socio-
economic status have been met. The assumption of boys scoring higher in logical color
usage as compared to girls has been satisfied with boys earning a score of 0.67 and girls
scoring 0.62. In relation to age, there were no obvious trends in logical color score,
providing evidence, as in Phase 1 and Phase 2, that age is not a predictor of logical
thinking or academic ability. When examining the effect of academic ability on logical
color, the Above Grade Level group received the highest logical color score of 0.69,
followed by the On Grade Level group with 0.67. The Below Grade Level group scored
the lowest logical color usage with 0.56. The assumption of academic ability as a
predictor of logical color choices was evident in this phase. It can be noted that because
this phase asked students to select a pre-arranged group of colors, logical reasoning was
heightened, therefore challenging students to utilize logical thinking skills. In terms of
socio-economic status on logical color, the assumption of Free - Reduced meals students
77
attaining a lower logical color score when compared to Pay students was not satisfied in
this phase. Free - Reduced meals students earned a score of 0.67, while Pay students
scored 0.58. This finding may support the possibility that economic status of students is
not a constant factor for logical thinking or ability.
Color Trends. In Phase 3, as in Phase 1 and Phase 2, color trends were evident in
the object drawing of the tree and the boy. In this phase, the colors brown and green
were chosen most frequently with 100% student participant selection. However, because
this phase asked students to select a pre-arranged set of colors, the color combination of
green and brown may have reduced the expressive tendency to choose alternative color
combinations, increasing the probability of selecting the green/brown combination. This
overwhelming color choice may be explained as a result of a possible color schema or the
association of green and brown with the representation of a tree. In the drawing of the
boy, the colors black and brown were chosen most frequently. As in the previous phases,
the color associations of black and brown with the image of a boy may be the result of
realistically representing a boy in the ethnicity of the student population. There were no
obvious color trends in the drawings of the house, dog, girl, and car. All color
combinations were utilized in all drawings, with the exception of the house in which the
color combinations brown/black and green/brown were not selected by any student
participant.
4. Comparison of Phases
Logical Color. Throughout the three phases of the study, the average score of
participants’ logical color usage was predicted to increase from phase to phase. It was
also assumed that logical thinking in each phase would increase due to color selection
78
limitations. This would result in an increase in logical color choice. In the examination
of logical color throughout the three phases of the study, the objects of the tree, house,
boy, and girl met the assumptions of logical color choice increase throughout the phases.
Moreover, the object drawing of the boy and car showed an increase from Phase 1 to
Phase 2. However, these objects decreased from Phase 2 to Phase 3. The selection of a
group of color combinations may have contributed to this decrease due to the more
involved task of choosing colors that have been pre-arranged.
The four classifications of gender, age, academic ability, and socio-economic
status on logical color usage were compared throughout the three phases of the study. In
the sub-group of gender, the logical color score for boys increased dramatically, while
girls were showed to have a steady increase. The logical color scores for both groups
increased in accordance with the assumption of an increase of logical color throughout
phases. When examining age throughout the phases of the study, there were no obvious
trends as it relates to logical color. This finding may be due to the basis that intellectual
levels and logical thinking are not based on age, but rather on the ability of the students.
Therefore, the logical thinking capability of students may be considered a prediction of
logical color choices. In relation to academic ability, the On Grade Level group attained
the highest logical color score in Phase 1 and Phase 2. Above Grade Level students’
creativity in Phase 1 and Phase 2 may have reduced their logical thinking scores, which
increased their expressive ability. Below Grade Level students’ scores deceased in Phase
3 as a possible result of the heightened logical thinking color selection task in that phase.
Logical color scores in Phase 3 correspond with the ability level of students, thus
satisfying the assumption that academic ability is a predictor of logical thinking and
79
consequently logical color choice. The assumptions as to the socio-economic status of
student participants in predicting the outcome of logical color usage was met in both
Phase 1 and Phase 2. However, in Phase 3, Pay students attained a lower logical color
score in comparison to Free - Reduced Meals students. Economic status did not prove to
be a prediction of logical color choice in Phase 3 of the study. Therefore, it may be
explained that logical thinking which yields logical color selection depends on the ability
of the students rather than on socio - economic status.
Color Trends. Throughout the study, color trends within each phase have been
evaluated according to the six object drawings. Prior to the study, it was assumed that all
student participants because of age (which classified them in Lowenfeld’s (1987)
Preschematic Stage) would be expressive in their color selection of all object drawings.
However, there was a strong color schema of the colors green and brown in the drawing
of the tree. Because a child’s memory begins at approximately 3 years of age, students in
this study would have experienced the changing of leaves in the autumn season
approximately three times. It should be noted that young children are active outside
mostly in the summer months where leaves are the color green and the bark of the tree is
a constant color brown. The students’ selection of the colors green and brown to
represent the image of the tree may be the result of a strong color schema which
associates the colors green and brown with the representation of a tree in its natural,
mostly frequently observed setting. The color trend of brown and black for the
representation of the boy can be attributed to a possible skin color association due to the
ethnicity of student participants. It can be assumed that this color trend would be evident
in the drawing of the girl. However, the colors most frequently chosen throughout the
80
phases to represent the girl were red and purple. This color trend may be a result of a
symbolic color association with the image of girls. These colors are popularized in girls’
clothing and accessories, as well as toys and dolls designed to appeal to girls in today’s
society. Lastly, the object drawing of the car presents color trends throughout Phase 1
and Phase 2 that do not culminate to the color trends of Phase 3. In Phase 1, the color red
was chosen frequently in the object drawing of the car. This color was used to
distinguish the body of the car. In Phase 2, the color black was used most frequently in
representing the wheels of the car. However, in Phase 3, the colors red and black as a
pre-arranged color combination were not chosen most frequently, as was assumed to
occur. This result may have occurred due to a variety of color choices of the body of a
car other than the color red, which may have hindered the selection of red and black
together. One such instance of color association occurred in Phase 3 when a student
shared her thought process aloud with the teacher/researcher. This particular student
explained that she chose the color combination blue and orange because her dad drives a
blue car and blue was not grouped with black, so she drew orange wheels instead. A
logical thought process was evident in the selection of blue and orange to represent the
car. This student explanation may support evidence that logical thinking contributes to
logical color choices.
Limitations of the Study
When interpreting the findings of this study, there are certain limitations that
should be addressed. All participants in the study were of African American decent and
attended the same elementary school located in an urban setting. In addition, the
elementary school is classified as a low – income in a racially non -diverse environment.
81
The homogenous background of the student participants may be considered a limitation
to the study.
Because this study was a form of action research, where research was conducted
in the classroom of the teacher/researcher, it included all students within the class,
consisting of a total of eighteen students. This small sample size should also be
considered a limitation to the study. As an action research study, it should be noted that
because the researcher is the classroom teacher, there is a familiarity to subjects, which
may present a bias in the scoring of drawings.
The eight crayon colors (red, orange, yellow, green, blue, purple, brown, and
black) although familiar to the students, may be considered a limitation in that they do
not promote the logical use of color in the skin tones of the boy and girl. Although the
color combinations in Phase 3 were selected as a result of the colors used in Phase 1 and
Phase 2 by student participants, the selection of color combinations may need further
justification, as well as the inclusion of specific criteria in Phase 3 for classifying colors
as logical.
Recommendations for the Study
Because of the possible limitations to the study, it is necessary to present certain
recommendations. This study should be replicated to include student participants from
diverse ethnic backgrounds as well as from a variety of geographic locations. Moreover,
replicating this study with a heterogeneous population may confirm or deny the findings
of the study.
In order to prevent bias in this study, an outside individual to evaluate the
drawings in addition to the teacher/researcher may minimize possible bias in the analysis
82
and scoring of drawings. It can also be noted that conducting this study using a larger
sample size would validate the findings.
Lastly, the use of a variety of colors representative of skin tones may increase the
logical representation of the boy/girl images. The justification of the color combinations
used in Phase 3 as well as an additional statement of criteria to evaluate logical color in
this phase may contribute to the evaluation of the drawings, which may further support
the findings of the study.
Recommendations for Further Research
Further research on the topic of color selection in young children is recommended
in order to provide further documentation of the effect color may have on children’s
representation of objects. It may be valuable to investigate color usage of children in pre-
drawn outlined images or objects. Moreover, symbolic color associations that children
may possess may also provide interesting findings on the influence of color on children’s
drawings. Lastly, it is recommended that color schemas in drawings of young children be
further studied in order to examine the possibility of a pre-disposed association to color.
Final Discussion
Throughout this study, color selection in the drawings of young children was
investigated in order to explore possible relationships between color and the
developmental stages of young children. Developmental theories derived from
Lowenfeld, Kellogg, and Piaget were used to present a model for interpretation of child
drawings. Assumptions as to the outcomes of color selection were established in
83
accordance with these theories, and these initial assumptions were used to hypothesize
the outcomes of the study. As noted by Lowenfeld (1987), children in the age group
consistent with this study would be expressive and spontaneous in the colors that they
choose in their drawings. However, the results of this study presented a new finding on
the color selection that young children make. There are logical approaches to the
selection and usage of color in young children’s drawings as well as possible color trends
used to represent familiar objects. The findings of this study may provide an insight into
the nature of the present-day child, as opposed to the child of the past, as described by
Lowenfeld, Kellogg, and Piaget. Because of an increase in testing and academic
achievement in today’s society (through national, state, and local educational goals), the
nature of the child is changing. An interruption in the natural artistic development of the
child may be occurring as a result of this change in society’s goals. The child, once
encouraged to freely express through art, may be hindered by society as expectations to
perform are presented at an early age in the academic setting of a school. This change in
the nature of today’s child warrants further research on a larger scale of children’s artistic
development as it relates to color selection in the drawings that children make.
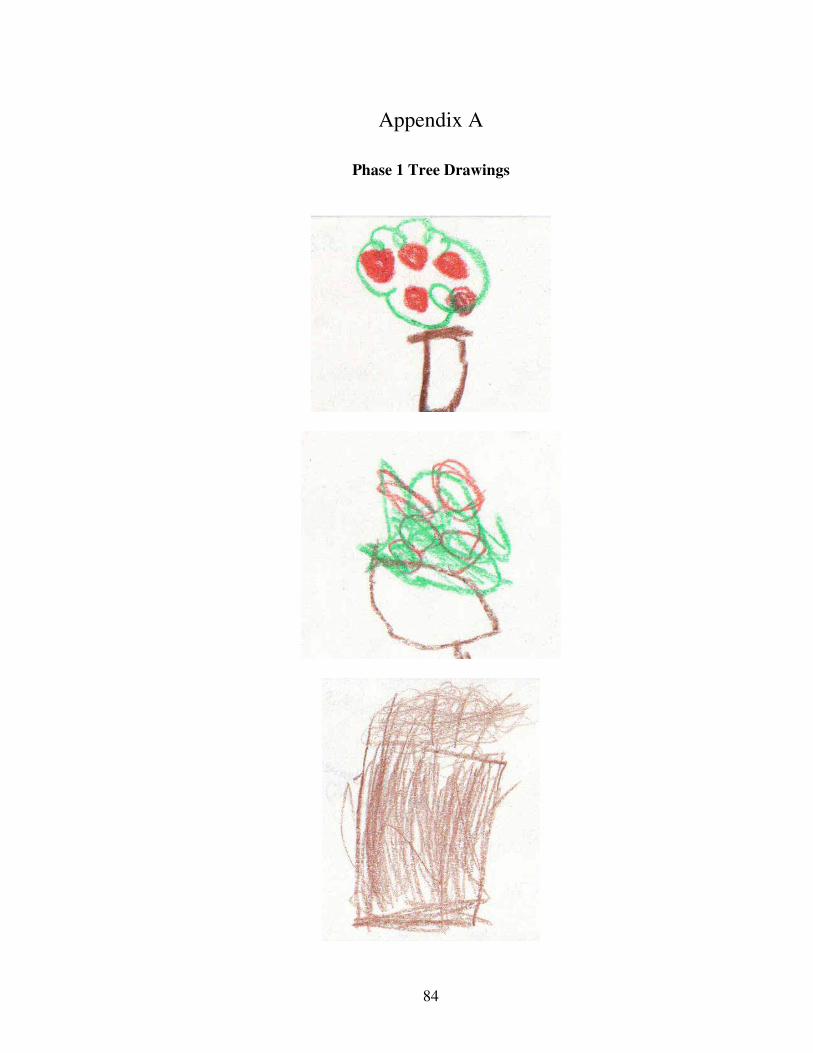
84
Appendix A
Phase 1 Tree Drawings
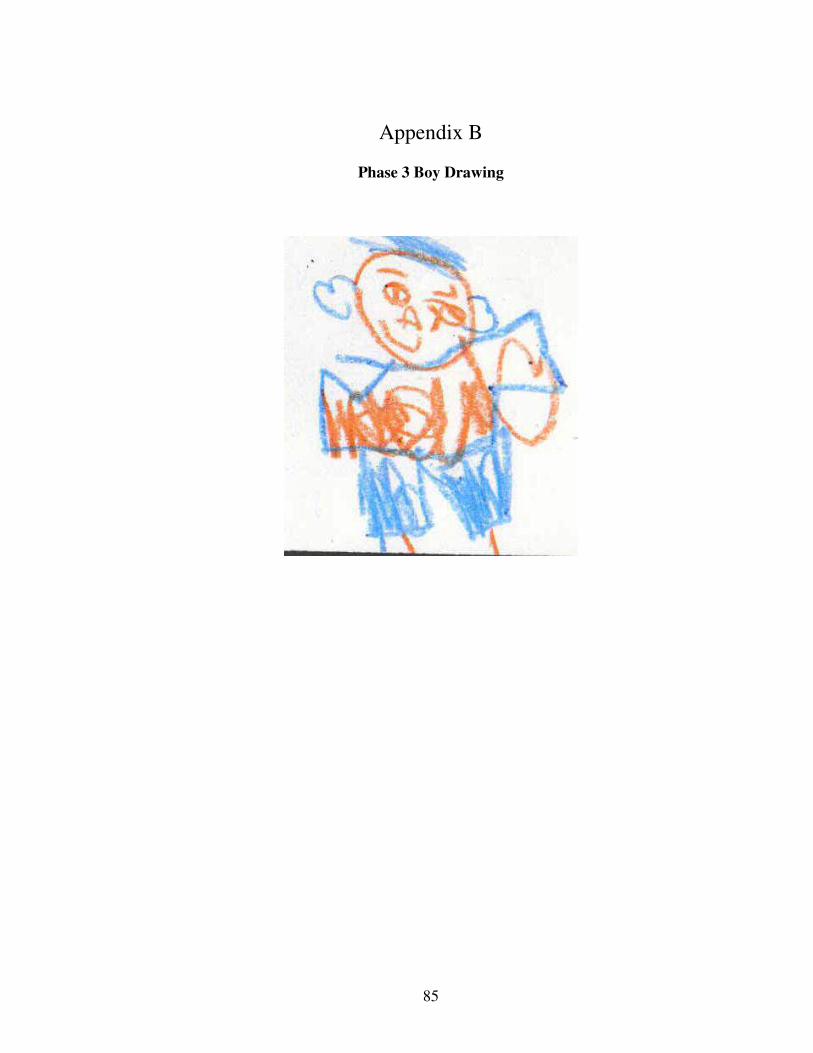
85
Appendix B
Phase 3 Boy Drawing
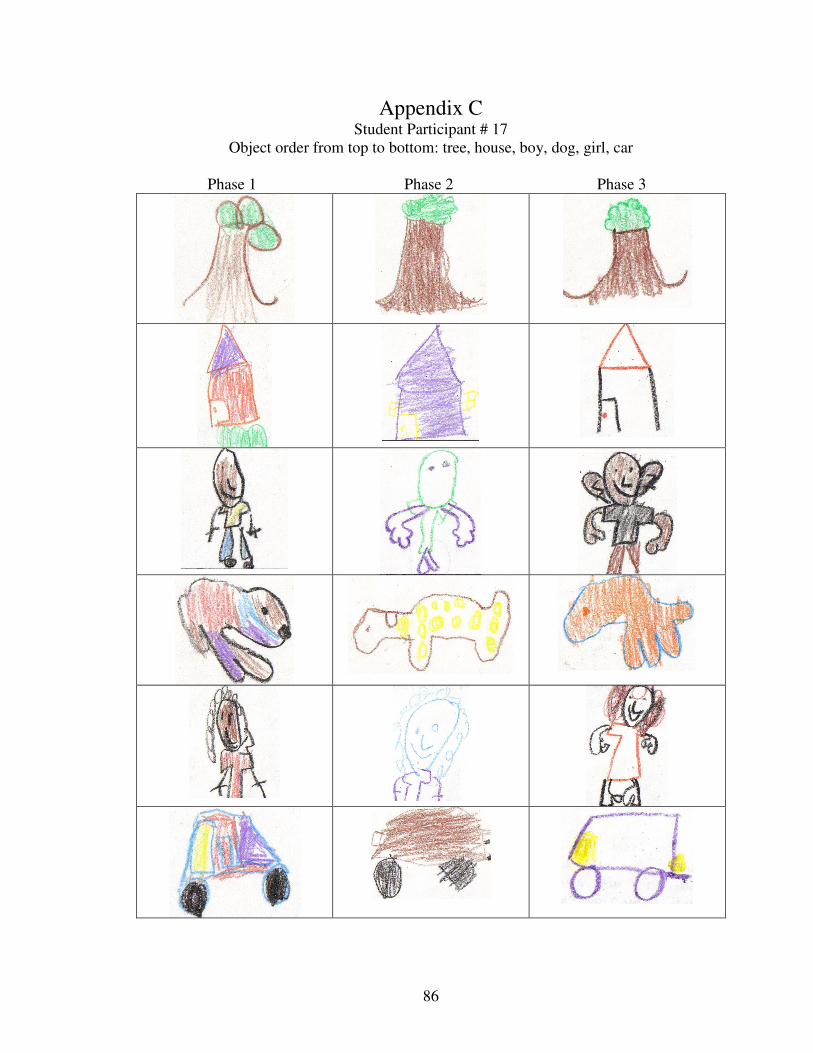
86
Appendix CStudent Participant # 17
Object order from top to bottom: tree, house, boy, dog, girl, car
Phase 1 Phase 2 Phase 3
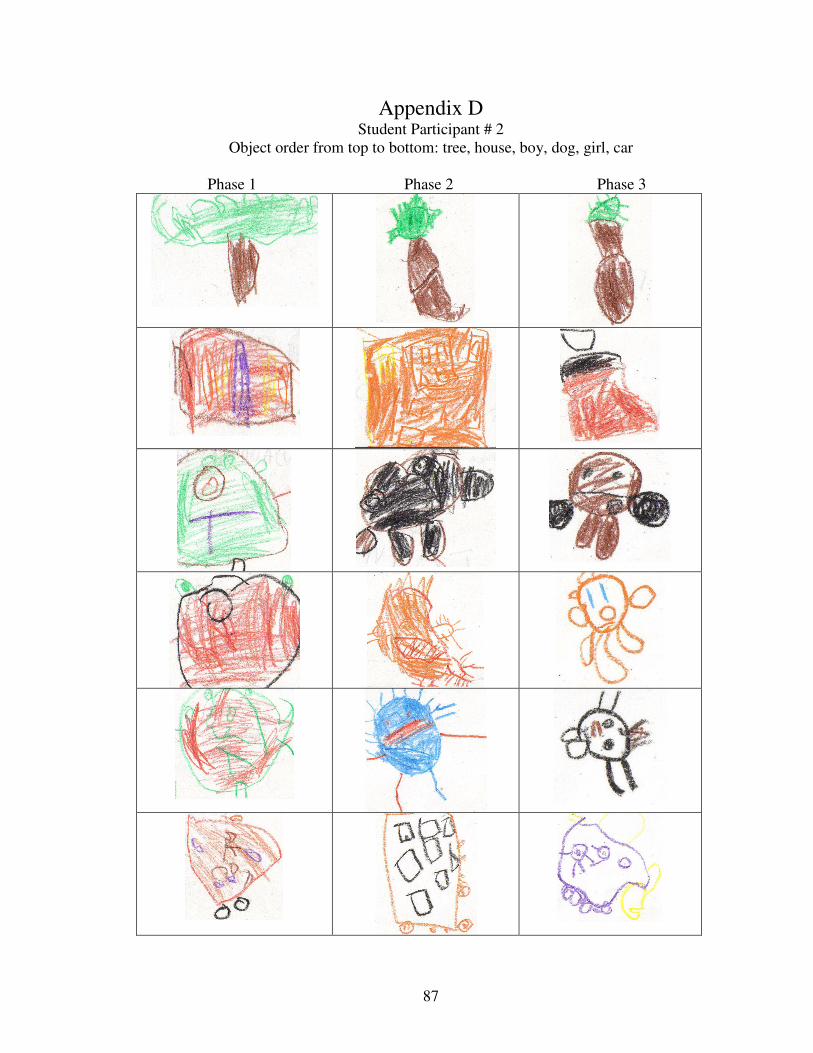
87
Appendix DStudent Participant # 2
Object order from top to bottom: tree, house, boy, dog, girl, car
Phase 1 Phase 2 Phase 3
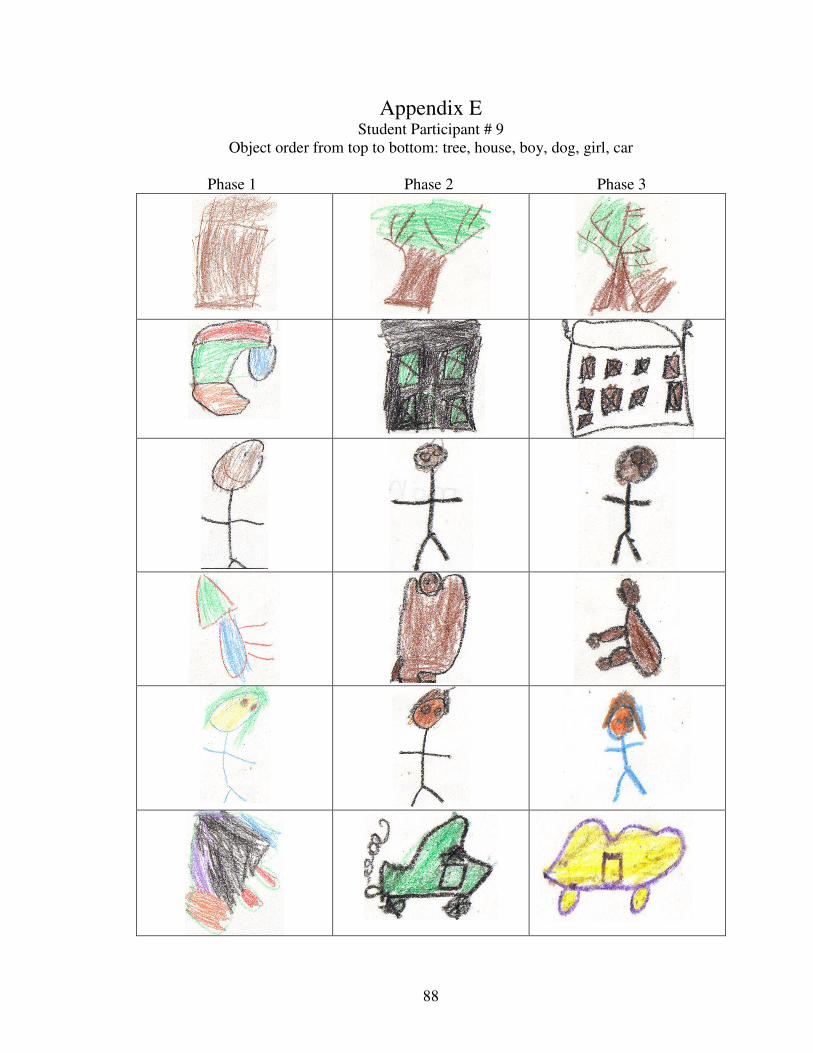
88
Appendix EStudent Participant # 9
Object order from top to bottom: tree, house, boy, dog, girl, car
Phase 1 Phase 2 Phase 3
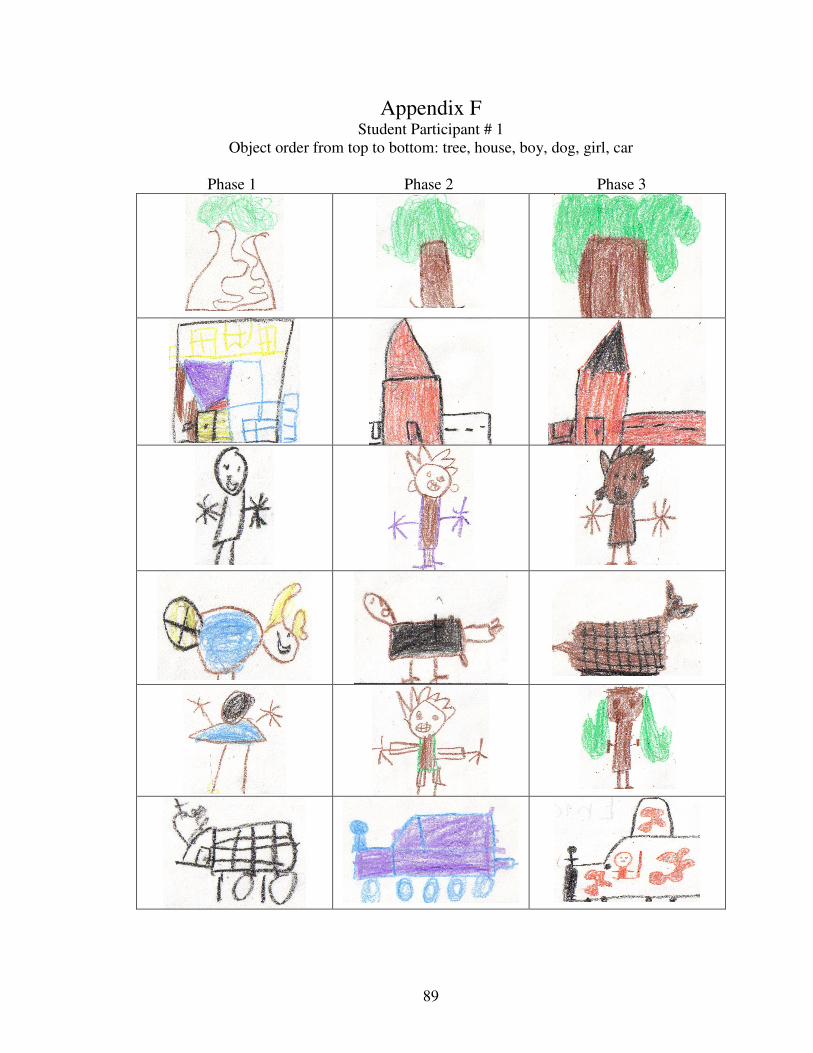
89
Appendix FStudent Participant # 1
Object order from top to bottom: tree, house, boy, dog, girl, car
Phase 1 Phase 2 Phase 3
90
Bibliography
Althouse, R., Johnson, M. H., & Mitchell, S. T. (2003). The colors of learning. New York: Teachers College Press.
Alschuler, R.H. & Hattwick, L.W. (1969, reprinted). Painting and personality. Chicago: University of Chicago Press.
Anning, A. & Ring, K. (2004). Making sense of children’s drawings. Maidenhead: OUP/ McGraw- Hill Education.
Arnheim, R. (1974). Art and visual perception: A psychology of the creative eye. Berkeley: University of California Press.
Barrett, M., Burkitt, E., & Davis, A. (2003). Children’s colour choices for completing drawings of affectively characterized topics. Journal of Child Psychology and Psychiatry, 44(3), 445-455.
Barrett, M. D. & Light, P. H. (1976). Symbolism and intellectual realism in children’s drawings. British Journal of Educational Psychology, 46, 198-202.
Berry, S. & Fox, J.E. (2002). Art in Early Childhood: Curriculum Connections. Excelligence Learning Corportation. (online article from Earlychildhood.com). http://www.earlychildhood.com (2005, July 27).
Boyatzis, C. J. & Varghese, R. (1994). Children’s emotional associations with colors. Journal of Genetic Psychology, 155(1), 77-85.
Buck, J. (1948). The House- Tree- Person technique. Los Angeles: Western Psychological Services.
Burton, J. (1980). The first visual symbols. School Arts, 80(2), 60-65.
Casey, M. B. (1979). Color versus form discrimination learning in 1- year- old infants. Developmental Psychology, 15(3), 341-343.
Colbert, C., & Taunton, M. (1992). Developmentally appropriate practices for the visual arts education of young children. Reston, VA: National Art Education Association [NAEA].
Corcoran , A. L. (1954). Color usage in nursery school painting. Child Development, 25(2), 107.
Cox, M. (1989). Children’s drawings. In D. Hargreaves (Ed.). Children and the arts. Bristol, PA: Taylor & Francis.
91
Dewey, J. (1980). Art as experience. New York: Perigee Books. (Originally published 1934)
DiLeo, J. (1970). Young children and their drawings. New York: Brunner/ Mazel.
DiLeo, J. (1983). Interpreting children’s drawings. New York: Brunner/ Mazel.
Engle, B. (1995). Considering children’s art: Why and how to value their works.Washington, DC: National Association for the Education of Young Children [NAEYC].
Freedman, K. (1997). Artistic development and curriculum: Sociocultural learning considerations. In A. M. Kindler (Ed.), Child development in art. (pp. 95- 106).Reston, VA: National Art Education Association [NAEA].
Gaines, R. & Powell, G. J. (1981). Children’s color perception in relation to habitat and skin color. Child Development, 52(3), 914-920.
Gale, A. V. N. (1933). Children’s preferences for colors, color combinations, and colorarrangements. Chicago, Il: University of Chicago Press.
Galla, K. (1994). The Languages of Learning: How children talk, write, dance, draw, andsing their understanding of the world. New York: Teachers College Press.
Gardner, H. (1980). Artful scribbles: The significance of children’s drawings. New York: Basic Books.
Gardner, H. (1990). Art education and human development. Los Angeles: Getty Center for Education in the Arts.
Golomb, C. (1981). Representation and reality: The origins and determinants of young children’s drawings. Review of Research in Visual Arts Education, 14, 36-48.
Golomb, C. (1992). The child’s creation of a pictorial world. Berkeley: University of California Press.
Harris, D. (1963). Children’s drawings as a measure of intellectual maturity. New York: Harcourt, Brace & World.
Hartley, J. C., Somerville, S. C., Jensen, D. C., & Eliefja, C. C. (1982). Abstraction of individual styles from the drawings of five- year- old children. Child Development, 53, 1193-1214.
Helm, J., Beneke, S., & Steinheimer, K. (1998). Windows on learning: Documentingyoung children’s work. New York: Teachers College Press.
92
Herberholz, B. & Hanson, L. (1985). Early childhood art (3rd ed.). Dubuque, IA: W.C. Brown.
Karp, E.M., & Karp, H.B. (1988). Colour associations of male and female fourth- grade school children. Journal of Psychology, 122, 383- 388.
Kellogg, R. (1970). Analyzing children’s art. Palo Alto, Cal.: Mayfield.
Kelly, D.D. (2004). Uncovering the history of children’s drawing and art. Westport, CT: Praeger Publishers.
Kindler, A. M. (1997). Child development in art. Reston, VA: National Art Education Association [NAEA].
Lange-Kutter, C. & Thomas, G.V. (1995). Drawing and looking: Theoretical approachesto pictorial representation in children. New York; London: Harvester Wheatleaf.
Lawler, C. O. & Lawler, E. E., III. (1965). Color- mood associations in young children. Journal of Genetic Psychology, 107, 29-33.
Liebowitz, M. (1999). Interpreting children’s drawings: A self- psychological approach. London: Bruner/ Mazel.
Lowenfeld, V. & Brittain, W. L. (1982). Creative and mental growth (7th ed). New York: Macmillan.
Lowenfeld, V. & Brittain, W. L. (1987). Creative and mental growth (8th ed). New Jersey: Prentice- Hall.
Malchiodi, C. A. (1998). Understanding children’s drawings. New York: The Guilford Press.
Meerum Terwogt, M. & Hoeksma, J. B. (1995). Color and emotions: preferences and combinations. Journal of Genetic Psychology, 122(1), 5-17.
Melkman, R., Koriat, A., & Pardo, K. (1976). Preference for color and form in preschoolers as related to color and form differentiation. Child Development, 47, 1045-1050.
Milbrath, C. (1998). Patterns of artistic development in children. Cambridge, UK: Cambridge University Press.
Milne, L.C. & Greenway, P. (1999). Color in children’s drawings: The influence of age and gender. The Arts in Psychotherapy, 26, 261-263.
93
Newton, C. & Kanter, L. (1997). Cross- cultural research in esthetic development: A review. In A.M. Kindler (Ed.), Child development in art. (pp. 165- 182). Reston, VA: National Art Education Association [NAEA].
Norman, R.D. & Scott, W.A. (1952). Color and affect: a review and semantic evaluation. Journal of General Psychology, 46, 185- 223.
Piaget, J. & Inhelder, B. (1967). The child’s conception of space. New York: W. W. Norton
Piaget, J. (1969). The mechanisms of perception. New York: Basic books.
Piaget, J. & Inhelder, B. (1969). The psychology of the child. London: Routledge, Kegan Paul.
Piaget, J. & Inhelder, B. (1971). Mental imagery in the child. New York: Basic books.
Pitchford, N.J. & Mullen, K. T. (2001). Conceptualization of perceptual attributes: A special case for color? Journal of Experimental Child Psychology, 80, 289-314.
Reith, E. (1997). Drawing development: The child’s understanding the dual reality of pictorial representations. In A.M. Kindler (Ed.), Child development in art. (pp. 59- 80). Reston, VA: National Art Education Association [NAEA].
Salome, R.A. (1967). A comparative analysis of kindergarten children’s drawings in crayon and colored pencil. Studies in Art Education, 8(2), 21-36.
Schirrmacher, R. (1997). Art and creative development of young children (3rd ed.). Albany, NY: Delmar.
Suchman, R. G. & Trabasso, T. (1966). Color and form preference in young children. Journal of Experimental Child Psychology, 3(2), 177-187.
Thomas, G. & Silk, A. M. (1990). An introduction to the psychology of children’sdrawings. New York: New York University Press.
Unsworth, J. M. (2001). Drawing is basic. Art Education: The Journal of the National Art Education Association, 54 (6), 6- 11.
Vygotsky, L. (1971). The psychology of art. Cambridge, MA: MIT Press.
Williams, J.E., Boswell, D.A., & Best, D. (1975). Evaluative responses of preschool children to the colours white and black. Child Development, 46, 501- 508.
Yates, M. E. & Fisher, V. L. (1980). Effects of models on children’s spontaneous drawings. Journal of Creative Behavior, 14(3), 220-222.

94
Zentner, M.R. (2001). Preferences for colours and colour-emotion combinations in early childhood. Developmental Science, 4, 389-398.