Embed Size (px)
Citation preview

The Effect of Meteorological Conditions on Fly Ball Distances in North American Major League Baseball Games
Mark D. Kraft Professor
Brent R. Skeeter Professor
Department of Geography and Regional Planning Salisbury State University Salisbury, MD 21801
40
ABSTRACT
This study examines the effect of meteorological conditions on the flight of baseballs hit in North American major league baseball games. Statistical analyses are used to relate game-time temperature, humidity, wind speed and wind direction data to the flight distance of every fair fly ball hit in non-domed stadiums during the 1991 and 1992 seasons. Results indicate that temperature is the most important meteorological variable affecting fly ball distances at most stadiums. The effect of wind speed and direction varies in different stadi ums, with surprising influences at certain stadiums. The results of this study may be strategically valuable to managers and coaches searching for any possible edge to win a game.
KEY WORDS : baseball , domed stadium, fly ball distance, meteorological conditions, sport
INTRODUCTION
Every season professional baseball teams are faced with many decisions during the course of their games that influence their likelihood of winning. It is the job of the coaching staff to make those decisions. If they make the correct ones, their chances of winning will increase. In order to increase the chance of making the correct decisions, the coaching staff should attempt to obtain all potentially significant information. For example, they would want to know individual player abil ity, such as a hitter's success against left-handed pitching or right-handed pitching, or more specifically, against a particular pitcher. It may be helpful to know a hitter's or pitcher's performance in night games compared to day games, or their performance against a particular team. There are many more possibilities that a coaching staff needs to consider, all of which are vital to a team's success.
Although perhaps not at first obvious, the coaching staff may also want to know such meteorological information as wind speed, wind direction, temperature and humidity because of its

possible influence on how the ball travels. In the case of temperature, cold air is more dense than warm air. Given this fact, with all else being equal, a freely moving object will travel farther in warm air, which is less dense, then it will in cold, more dense air. In baseball terms, with all else being equal, a fly ball should travel farther on a warm day than on a cold one. In a game situation, again with all else being equal, on a warm day or evening, the decision to bring in a pitcher who tends to throw high in the strike zone would seem to be illogical because that type of pitcher will typically give up more fly balls. In this case the warm weather may result in an increase in the number of home runs and / or the number of balls which are hit beyond the outfielder's reach.
With the variable of humidity, or the amount of moisture in the air, humid air is less dense than dry air. This is the opposite of what most people think since humid air "feels thick". Water vapor is only about 64 percent as dense as dry air. Therefore, as the water vapor content of the air increases, the air density decreases accordingly. Thus, a fly ball will travel farther in the less dense, more humid air. In a game situation, a fly ball should have a greater chance of becoming a home run or being hit beyond the outfielders on a humid day.
In the case of wind speed and wind direction, it would certainly seem that strong winds blowing out of the ballpark should increase fly ball distances with the reverse being true for winds blowing in. If the manager and his coaching staff are aware these meteorological variables have an effect on baseball games, then the utilization of meteorological information may improve the success of the team as a whole.
To date, studies examining the effect of weather conditions on the flight of baseballs in actual games have relied solely on the number of home runs hit during different meteorological conditions (eg., Kingsley, 1980). It is preferable, however, to be able to analyze more than just variations in the number of home runs which are hit. Specifically, what is most useful is to be able to ex-
amine variations in the distances of all fly balls put into play in major league games. The objective of this research is to examine the influence of meteorological variables on fly ball distance in major league baseball games.
METHODOLOGY
The data used in this study are from a total compilation of every game played in both the American and National Leagues for the years of 1991 and 1992, totaling over 4000 games. The locations of the 26 North American major league teams playing in 1991 and 1992 are shown in Figure 1. The data were obtained from STATS, Inc. Among the wealth of information that STATS, Inc. records for every major league game are the game time temperature, relative humidity, wind speed, wind direction and the estimated distance of travel of every ball put into play. Only fly ball distances were examined in this research because their distance of travel is most affected by meteorological conditions.
Each game has had the distances of each fly ball averaged to obtain a game average distance (Table 1). Even though these are the most complete data available for completing research of this nature (in fact, they are the only source of fly ball distances for all major league games), there are some limitations. For example, meteorological recordings are made at each game's starting time. During the course of a game, which averages approximately three hours, those conditions can change. Also, there were several games for which relative humidity was not recorded. These games were eliminated from the data set. In addition, relative humidity was never recorded for any of the games played in domed stadiums. Therefore, games played in domed stadiums were also not used in the analyses. In the cases of Toronto and Montreal, which have retractable domes, only those games played when the roof was open were included. Because all of the recorded fly ball distances were estimates, the precise fly ball distances are actually unknown. However, because the data set is so large (including over 50,000 fly balls), we feel confident that we can
41

\ 1 , I ) 1 II I
I 1 I I , I' -~ I I "----_{ \, I _.L __ \~'
I ~ I I
,< ' " L_: - _ I oAr- - - - _ 4 - - - -I ('I - , I (\
""-_!..... I , oJ11 ' \1 \ I _ 1 I I " ~_
I I~ - , 1__ !- ____ ) 12 18 .... -.--- --- .J \ 14 - - " ' .
\ I I ( 17 • 20 ' , 3 \ I ,..... - \- .- . - ~I I I ,'- - ',
\ I 1 -. - - '( 9 \ J I 15 " - , '7-> \ , 1_ _ I • \ ~.,._ " f -
\ ,, / - - ._ 1 I 10 . / I \ ( \ I I - - - ~ L _ I '\ J~ J /~ / _ -
4 . 5 i / r- -' -- ----, __ .. _. __ / _----L-/---/,1 I ':', ~r_-._ .....
6~ " " ~ I I - -r-- , '::. , ~ 1 -~ ___ _ I , ( I \ . 16 ",
13. Chicago (~~~-- j 7 . ~~ -- ~~ __ jh~i _. _ \ 14. Detroit I 'r-'- "-'") 15. Cincinnati --16. Atlanta 17. Cleveland 18. Toronto
1. Seattle 2. Oakland 3. San Francisco 4. Los Angeles 5. Anaheim 6. San Diego 7. Arlington 19. Pittsburgh 8. Houston 20. Baltimore 9. Kansas City 21 . Philadelphia
10. St. Louis 22. New York (2) o km SOD
11 . Minneapolis 23. Boston 12. Milwaukee 24. Montreal
FIGURE 1. Location of the 24 North American cities having major league baseball teams in 1992. Chicago and New York have two teams each. D indicates a domed stad ium and R indicates a retractable domed stadium. (Denver, Colorado and Miami, Florida were added as major league cities in 1993.)
rely on the distances obtained since individual errors (i.e., over- or under-estimations) should cancel out one another.
Temperature
Temperature was broken up for analys is using two methods. The first was to analyze all games played with a temperature below 70°F and then all games 70°F and warmer. An actual average fly ball distance was then calculated for each of the two categories.
The second method was to break the games up into ten degree increments in the following manner: < 50°F, 50-59°F, 60-69°F, 70-79°F, 80- 89°F and 90°F and warmer. Again, an average fly ball distance was obta ined for each category_
42
Wind
For the variable of wind, the data had to be altered_ If the wind direction was recorded as blowing out to left field, out to center field or out to right field, no changes were made to the velocity value. If w ind direction was recorded as blowing from left field to right f ield or from right field to left field , a velocity value of o was given because it should have little if any effect on the distance of the fly ball _ If wind direction was recorded as blowing in from any field towards home plate the velocity was assigned a negative value_ For example. a velocity of 12 mph. blowing in from left field would be given a value of - 12 mph_
Wind was also preliminarily exam-
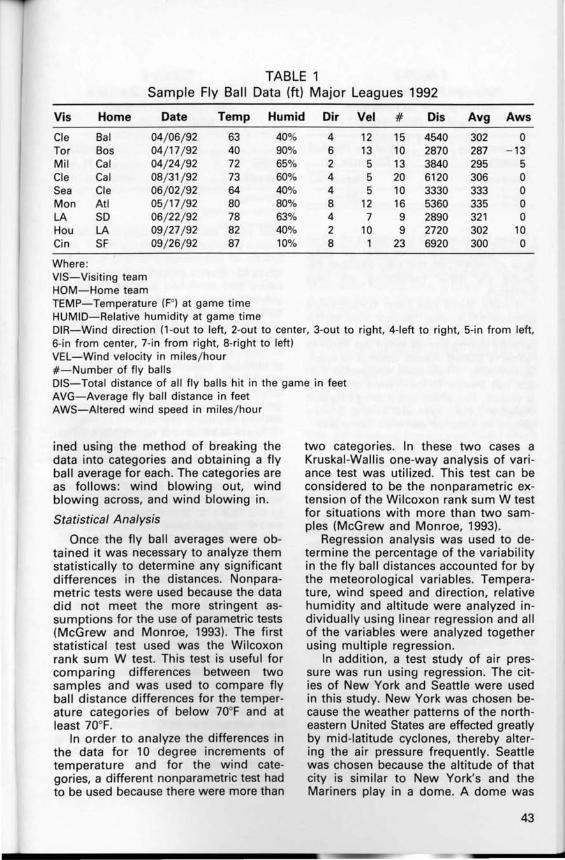
TABLE 1 Sample Fly Ball Data (ft) Major Leagues 1992
Vis Home Date Temp
Cle Bal 04/ 06/ 92 63 Tor Bos 04/ 17/ 92 40 Mil Cal 04/24/ 92 72 Cle Cal 08/ 31 / 92 73 Sea Cle 06/ 02/ 92 64 Mon Atl 05/ 17/ 92 80 LA SD 06/ 22/ 92 78 Hou LA 09/ 27/ 92 82 Cin SF 09/ 26/ 92 87
Where : VIS-Visit ing team HOM-Home team TEMP-Temperature (P) at game time HUMID-Relative humidity at game time
Humid
40% 90% 65% 60% 40% 80% 63% 40% 10%
Dir Vel # Dis Avg Aws
4 12 15 4540 302 0 6 13 10 2870 287 - 13 2 5 13 3840 295 5 4 5 20 6120 306 0 4 5 10 3330 333 0 8 12 16 5360 335 0 4 7 9 2890 321 0 2 10 9 2720 302 10 8 1 23 6920 300 0
DIR-Wind direction (1-out to left, 2-out to center, 3-out to right, 4-left to right, 5-in from left, 6-in from center, 7-in from right, 8-right to left) VEL-Wind velocity in miles/ hour #-Number of fly balls DIS-Total distance of all fly balls hit in the game in feet AVG-Average fly ball distance in feet AWS-Altered wind speed in miles/hour
ined using the method of breaking the data into categories and obtaining a fly ball average for each. The categories are as follows : wind blowing out. wind blowing across, and wind blowing in.
Statistical Analysis
Once the fly ball averages were obtained it was necessary to analyze them statistically to determine any significant differences in the distances. Nonparametric tests were used because the data did not meet the more stringent assumptions for the use of parametric tests (McGrew and Monroe, 1993). The first statistical test used was the Wilcoxon rank sum W test. This test is useful for comparing differences between two samples and was used to compare fly ball distance differences for the temperature categories of below 70°F and at least 70°F.
In order to analyze the differences in the data for 10 degree increments of temperature and for the wind categories, a different non parametric test had to be used because there were more than
two categories. In these two cases a Kruskal -Wallis one-way analysis of variance test was utilized. This test can be considered to be the non parametric extension of the Wilcoxon rank sum W test for situations with more than two samples (McGrew and Monroe, 1993).
Regression analysis was used to determine the percentage of the variability in the fly ball distances accounted for by the meteorological variables. Temperature, wind speed and direction, relative humidity and altitude were analyzed individually using linear regression and all of the variables were analyzed together using multiple regression.
In addition, a test study of air pressure was run using regression. The cities of New York and Seattle were used in this study. New York was chosen because the weather patterns of the northeastern United States are effected greatly by mid-latitude cyclones, thereby altering the air pressure frequently. Seattle was chosen because the altitude of that city is similar to New York's and the Mariners play in a dome. A dome was
43
h
TABLE 2 Average Fly Ball Distance
(ft) «, >= 70°F) Major Leagues 1991-1992
Temperature Range (OF)
Average Fly Ball Distance (tt)
<70 >=70
308 313
chosen because that eliminates all other meteorological variables with air pressure remaining as the only variable because the other conditions are kept constant.
Finally, there has been considerable speculation among players and in the Toronto media that fly balls travel differently during games when the Toronto dome is closed versus when it is open. Specifically, it has been suggested that the ball travels farther when the dome is closed. Therefore, the average fly ball distance for all open and closed domed games in Toronto was also computed.
RESULTS
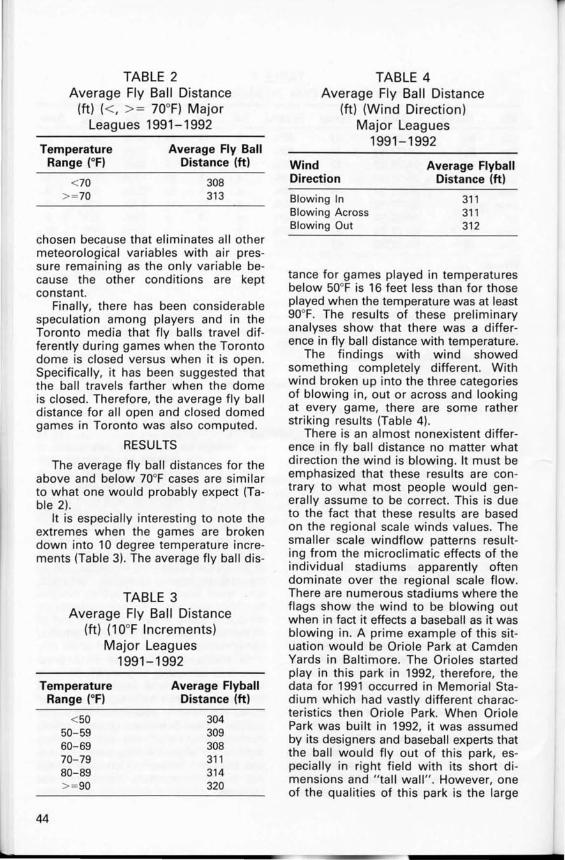
The average fly ball distances for the above and below 70°F cases are similar to what one would probably expect (Table 2).
It is especially interesting to note the extremes when the games are broken down into 10 degree temperature increments (Table 3). The average fly ball dis-
TABLE 3 Average Fly Ball Distance
(ft) (10°F Increments) Major Leagues
1991-1992
Temperature Range (OF)
Average Flyball Distance (tt)
44
< 50 50-59 60-69 70-79 80-89 > =90
304 309 308 311 314 320
TABLE 4 Average Fly Ball Distance
(ft) (Wind Direction) Major Leagues
1991-1992
Wind Direction
Blowing In Blowing Across Blowing Out
Average Flyball Distance (tt)
311 311 312
tance for games played in temperatures below 50°F is 16 feet less than for those played when the temperature was at least 90°F. The results of these preliminary analyses show that there was a difference in fly ball distance with temperature.
The findings with wind showed something completely different. With wind broken up into the three categories of blowing in, out or across and looking at every game, there are some rather striking results (Table 4).
There is an almost nonexistent difference in fly ball distance no matter what direction the wind is blowing . It must be emphasized that these results are contrary to what most people would generally assume to be correct. This is due to the fact that these results are based on the regional scale winds values. The smaller scale windflow patterns resulting from the microclimatic effects of the individual stadiums apparently often dominate over the regional scale flow. There are numerous stadiums where the flags show the wind to be blowing out when in fact it effects a baseball as it was blowing in. A prime example of this situation would be Oriole Park at Camden Yards in Baltimore. The Orioles started play in this park in 1992, therefore, the data for 1991 occurred in Memorial Stadium which had vastly different characteristics then Oriole Park. When Oriole Park was built in 1992, it was assumed by its designers and baseball experts that the ball would fly out of this park, especially in right field with its short dimensions and "tall wall" . However, one of the qualities of this park is the large

TABLE 5 Wilcoxon Rank Sum W
Test Major Leagues 1991-1992
Temperature (OF) w z p-value
<>70 1505624.0 - 8.30 .0000
warehouse just beyond the right field wall. The presence of this building causes the wind that is blowing out to deflect off the warehouse and actually blow towards home plate (Bosman, 1992). This case is not unusual and can be found in numerous ballparks, especially those that are enclosed such as Veterans Stadium in Philadelphia. So when it is recorded that the wind is blowing out, in fact, in many parks it is blowing in, resulting in the lack of difference in fly ball distance for the major leagues. The effect of winds at specific individual ballparks is addressed in more detail later in this paper.
To determine the statistical significance of the differences in the 70 degree split, the Wilcoxon rank sum W test was performed. The results for the major leagues reveal that there is a statistically significant difference in fly ball distance with a significance level of .0000 (Table 5). Therefore one can conclude, with near 100 percent certainty that with all else being equal fly balls travel shorter distances when the temperature is below 70°F than when the temperature is 70°F or warmer.
When the games were broken into six temperature categories a Kruskal-Wallis one-way analysis of variance test was performed. Again, with a significance level of .0000 (Table 6)' one can conclude that the fly ball distances increase significantly when temperatures increase.
The results of the various regression tests produced some interesting results. The first tests of linear regression were perfo rmed on temperature, wind speed and direction, humidity and altitude (Table 7).
The most interesting result of the linear regression involves wind, with the
TABLE 6 Kruskal-Wallis One-way
Analysis Of Variance Six Temperature Categories
Major Leagues 1991-1992
Chi-Square p-value
129.65 .0000
numbers reverting back to the previous tests, showing no significance, thus backing up those preliminary results. With wind having such a low r2 and high p-value level it shows that for the major leagues as a whole the regional scale wind has no significant effect on fly ball distance. The only two variables that have any significant effect are temperature and altitude. Even though the amount of variance that they account for is minimal, they are significant.
The pilot study using the New York Yankees and Seattle Mariners concluded that air pressure has no significant effect on fly ball distances (Table 7). In both cases air pressure was not significant at the .10 level.
In the case of the multiple regression test for the major leagues, the combination of all of the variables were significant with a .0000 p-value and an R2 of .062 (Table 8), meaning that the meteorological variables are responsible for 6.2 percent of the difference in fly ball distances during the major league games.
The variable having the least influence on fly ball distances was relative humidity. Kingsley (1980) found this same result using home run frequencies. This may simply be because relative humidity is a poor measure of the actual moisture content of the air because it is temperature dependent. A preliminary examination using the Temperature-Humidity Index (which takes temperature and relative humidity into account together) showed that also to be insignificant. It appears most likely that the variations in air density associated solely with changes in the air's moisture con-
45

TABLE 7 Linear Regression Major Leagues 1991-1992
Variable
Temperature Altitude
.03655
.02891
.00046
.00039
p-value
.0000
.0000
.2213
.2596 Wind Velocity Relative Humidity *Air Pressure .01367/.00748 .1409/.2738
*variable analyzed in pilot study-complete Major League results unknown (New York/Seattle)
.062
TABLE 8 Multiple Regression
Major Leagues 1991-1992
p-value
.0000
tent are simply too minor to have any significant effect on fly ball distances.
Wind was found to be significant in the multiple regression even though it was found to be insignificant in the linear regression model. This may be due to the fact that for the league as a whole, there is no difference in fly ball distance when the wind is blowing in versus blowing out. However, as wind varies, fly ball distances vary at individual ballparks.
Individual Teams
Although the major leagues as a whole have so far been the subject of analysis, individual teams were also looked at to determine what differences exist between ballparks. One of the more striking findings is that in some ballparks fly ball distance decreases as the season progresses with more games being played in days when the temperature is above 70°F (Table 9).
This is true in Baltimore, Milwaukee and for the Chicago Cubs. When the temperature is above 70, there tends to be a southwesterly flow and with most stadiums being oriented toward the northeast (Skeeter, 1988), winds should blowout. However, in Chicago and Mil-
46
TABLE 9 Average Fly Ball
Distances (tt) «, > = 70°F) Individual Ballparks
1991-1992
City/Team
Baltimore Milwaukee Chicago Cubs
315 312 310
312 310 308
waukee the breeze off of Lake Michigan that is created on these warm days causes the winds to blow in with a greater frequency during warm periods. In the case of Baltimore, as was previously explained, when the regional scale winds are from the southwest the warehouse often causes the wind to reverse and blow in (Table 10).
Again, there are other cities in addition to Baltimore where fly ball distance is shorter when the wind is blowing out. This is true for Baltimore, Philadelphia, St. Louis and Toronto (Table 10). Incidentally, in Los Angeles and San Diego the wind never blew in during any of the games (Table 10). Tables 11-13 list the cities which were found to have statistically significant results (p-value < .05) for each category.
The most noticeable aspect of Tables 11-13 is that Boston appears on each one. From this it appears that games played at Boston are affected most by meteorological variables.
Finally, for 1991-92 there were 80 Toronto home games played with the dome closed and 82 played with the dome

TABLE 10 Average Fly Ball Distances (tt) (Wind Direction) Individual Ballparks
1991-1992
Blowing City In
Baltimore 314 Philadelphia 312 St. Louis 321 Toronto 315 Los Angeles N/ A San Diego N/ A
TABLE 11 Significant Difference In
Fly Ball Distance «, >= 70°F)
City/ Team p-value
Boston .0019 San Diego .0061 Pittsburgh .0139 Chicago White Sox .0426
open. The average fly ball distance for the closed-dome games was 314 feet. For the open-dome games the average was 313 feet. Therefore, at least based on these two years, it appears that closing or opening the dome has virtually no effect on fly ball distances.
CONCLUSIONS
The results of this study show, perhaps surprisingly, that temperature is the most important meteorological variable affecting fly ball distances for the major
TABLE 12 Significant Difference In
Fly Ball Distance (10°F Increments)
City p-value
Boston San Francisco Baltimore
.0169
.0441
.0489
Blowing Blowing Across
314 312 319 321 312 305
TABLE 13 Multiple Regression
Individual Teams 1991-1992
City/Team ~
Milwaukee .105 San Diego .067 Boston .099 Chicago Cubs .073 Chicago W.S. .062 Kansas City .051
Out
311 311 319 305 310 305
p-value
.0006
.0119
.0133
.0247
.0310
.0418
leagues as a whole. Wind is not particularly important for the leagues overall. However, in certain ballparks wind does have a major influence on fly ball distances.
Temperature, being the most important variable should possibly be given strategic consideration during individual games. In order to harness an advantage based on the wind, the individual ballpark must be taken into consideration since the effect of wind is unique to each site. Altitude was also significant even though the highest city in the major leagues (prior to 1993) was Atlanta, Georgia . Relative humidity and air pressure have been found to be insignificant, although the latter was not completely analyzed.
It is also important to recognize that Boston was the only city to appear in all statistical analyses as being significant. It may be concluded that Boston is the
47
only major league city where fly ball distances are affected significantly by all of the meteorological variables analyzed. Incidentally, there has also been some controversy in Boston as to whether the addition of the sky boxes has cut down on the number of fly balls hit because of the alteration of the airflow in Fenway Park.
Additional research on this topic might include adding the 1993 and 1994 results, especially with the addition of the Colorado Rockies in Denver and the Florida Marlins in Miami . Analysis of the Colorado data would be particularly useful for helping to determine the effect of altitude on fly ball distances. Much more detailed studies (including microclimatological analyses) could be performed
48
for each stadium with an extensive analysis on how each variable affects the fly balls in that stadium.
REFERENCES CITED
Bosman, Dick. (Baltimore Orioles Pitching Coach) . 1992. Personal Communication.
Kingsley, R. H. 1980. Lots of Home Runs in Atlanta? Baseball Research Journal, 2: 66-71.
McGrew, J. C. and C. B. Monroe, 1993. Statistical Problem Solving in Geography, Wm. C. Brown. Dubuque, IA
Skeeter, B. R., 1988. Winds and the Baseball Stadium : General Wind Characteristics in Major League Baseball Stadiums. Sport Place International. 2 (1) : 37-44.
STATS Inc. (Sports Team Analysis & Tracking Systems, Inc.) 1991-1992. Lincolnwood, IL.