Embed Size (px)
Citation preview

ABSTRACT
Title of Thesis: FORCE AND TEMPORAL CONTROL IN
CONTINUOUS AND SYNCHRONIZATION UNIMANUAL FINGER TAPPING
Yue Du, Master of Arts, 2011 Directed By: Professor Jane E. Clark, PhD, Kinesiology
Temporal control is essential to human movement both in the activities of daily
living and the skilled actions of the athlete, dancer, or musician. Although the temporal
control ability has been widely and well-studied for over a hundred years, little attention
has been paid to the other movement parameters such as space and force that might
influence temporal control. To probe the relationship between force and temporal control,
17 right-handed participants were required to perform a continuous (without metronome)
and synchronization (with metronome) tapping task with temporal constraints (1500,
1000, or 500 ms tapping interval) and with no force constraint. The results reveal that the
contact time for a tap (initial time when finger touches the surface) was less controlled
than the time of the tap’s peak force. In addition, in the synchronization task, tapping
error at the time of peak force was closer to zero. The force production pattern as
reflected in peak force, impulse, and the time to peak force varied across tapping modes
and intervals. Taken together, these results suggest that force and temporal control are
systematically related to each other in finger tapping and that different force production
strategies may be used to optimize the temporal control.

FORCE AND TEMPORAL CONTROL IN CONTINUOUS AND SYNCHRONIZATION UNIMANUAL FINGER TAPPING
By
Yue Du
Thesis submitted to the Faculty of the Graduate School of the University of Maryland, College Park, in partial fulfillment
of the requirements for the degree of Master of Arts
2011
Advisory Committee: Professor Jane E. Clark, PhD & Chair Professor Jill Whitall, PhD. Research Assistant Professor Marcio A. De Oliveira, PhD. Assistant Professor Jae Kun Shim, PhD.

© Copyright by
Yue Du
2011

Acknowledgements
I would like to thank all of those who helped with this thesis, especially:
• Jane E. Clark, who not only helps me on this thesis, but also provides me a
tremendous amount of support for anything! Without her, the reference list in this
thesis would not be so clear…
• Xia Li, my girlfriend, but also a mentor on statistics providing me with valuable
suggestions about the statistical analysis method.
• Drs. Jill Whitall, Marcio Oliveira, Jae Kun Shim for serving on my committee and
providing valuable feedback.
• Melissa Pangelinan, Bradley King, Woei-Nan Bair, and Kristin Cipriani who
always answer my questions. What a great team!
ii
Table of Contents
ACKNOWLEDGEMENTS ................................................................................................ II
TABLE OF CONTENTS .................................................................................................. III
LIST OF FIGURES ........................................................................................................... V
CHAPTER 1 INTRODUCTION ........................................................................................ 1
CHAPTER 2 REVIEW OF LITERATURE ...................................................................... 9 Conceptual Model and Central Timer .......................................................................... 10 Experimental Paradigms for The Study of Temporal Control ..................................... 12
Synchronization-continuous paradigm. ................................................................... 12 Synchronization paradigm. ...................................................................................... 13
Modeling Human Temporal Control ............................................................................ 13 Temporal Variability .................................................................................................... 17 Negative Synchronization Error ................................................................................... 19 Effect of Sensory Information ...................................................................................... 20 Effect of Effectors ........................................................................................................ 22 Timing and Force ......................................................................................................... 23 Movement Trajectory on Temporal Control ................................................................ 25 Knowledge Gap ............................................................................................................ 26
Force strategies differ between continuous and synchronization tapping. .............. 26 Negativity of the synchronization error. ................................................................. 26 Definition of inter-response interval and synchronization error. ............................ 28
Summary ...................................................................................................................... 29
CHAPTER 3 EXPERIMENT ........................................................................................... 30 Introduction .................................................................................................................. 30 Methods ........................................................................................................................ 32
Participants. ............................................................................................................. 32 Apparatus. ............................................................................................................... 33 Procedure. ................................................................................................................ 33 Data reduction and measures. .................................................................................. 34
Time variable. ...................................................................................................... 35 Inter-response interval at the time of initial contact (IRIC) & peak force (IRIP). .............................................................................................................. 35 Synchronization error at the time of initial contact (SEC) & peak force (SEP). .......................................................................................................................... 35
Force variables. ................................................................................................... 36 Time-related variable: dwell time & time-to-peak (end) force. ....................... 36 Force-related variable: peak force. ................................................................. 36
iii

iv
Time-force related variable: Force increasing (decreasing) rate & impulse. . 36 Statistical analysis. .................................................................................................. 37
Results .......................................................................................................................... 38 Temporal Property and Tapping End Time. ............................................................ 38
Difference between IRIC & IRIP. ........................................................................ 38 Difference between SEC & SEP and the negative SE. ........................................ 41
Different force strategies during finger tapping. ..................................................... 44 Time-to-peak (end force) & dwell time. .............................................................. 44 Peak force. ........................................................................................................... 46 Force increasing (decreasing) rate & impulse. .................................................. 47
Time series structure of the temporal and force variables....................................... 50 Discussion .................................................................................................................... 51
The temporal control variable is the time of peak force.......................................... 53 Different tapping force patterns across tapping mode and intervals ....................... 56
Summary ...................................................................................................................... 57
CHAPTER 4 LIMITATIONS AND FUTURE DIRECTION .......................................... 58 Limitations ................................................................................................................... 58 Future Direction ........................................................................................................... 59
Temporal Control Parameter Is the time of Peak Force .......................................... 59 Time of peak force in musicians. ......................................................................... 59 Time of peak force in continuous tapping (without metronome). ........................ 60 Time of peak force for different effectors. ........................................................... 60
Force Strategies Used in Finger Tapping Task. ...................................................... 61 Temporal perturbation for error correction........................................................ 61
Summary ...................................................................................................................... 62
APPENDICES .................................................................................................................. 63 Appendix A .................................................................................................................. 63 Appendix B .................................................................................................................. 64 Appendix C .................................................................................................................. 65 Appendix D .................................................................................................................. 66 Appendix E .................................................................................................................. 67
BIBLIOGRAPHY ............................................................................................................. 70

List of Figures
Figure 2. 1: The two-level process model for continuous tapping ................................... 13
Figure 2. 2: The two-level process model for synchronization tapping ........................... 16
Figure 3. 1: The experimental setup. ................................................................................ 34
Figure 3. 2: The definition of each dependent variable. ................................................... 37
Figure 3. 3: The mean and standard error (SE) for the magnitude of IRIC and IRIP absolute error across tapping modes and ISIs. .......................................................... 39
Figure 3. 4: The mean and standard error (SE) for the variability of IRIP across tapping modes and ISIs. ......................................................................................................... 40
Figure 3. 5: The mean and standard error (SE) for the variability of IRIC across tapping modes and ISIs. ......................................................................................................... 41
Figure 3. 6: The density distribution of SEP..................................................................... 42
Figure 3. 7: The mean and standard error (SE) for the magnitude and variability of SEC and SEP. .................................................................................................................... 43
Figure 3. 8: The mean and standard error (SE) for the difference of variability between SEC and SEP for each ISI. ........................................................................................ 43
Figure 3. 9: The mean and the standard error for the magnitude of time to peak force across tapping modes and ISI. .................................................................................. 45
Figure 3. 10: The mean and the standard error for the magnitude and variability of time to end force across ISIs. ................................................................................................ 45
Figure 3. 11: The mean and the standard error for the magnitude and variability of dwell time across ISIs. ........................................................................................................ 46
Figure 3. 12: The mean and the standard error for the magnitude and variability of peak force across tapping modes and ISIs ......................................................................... 47
Figure 3. 13: The mean and the standard error for the magnitude and variability of force increasing rate across tapping modes and ISIs.......................................................... 49
Figure 3. 14: The mean and the standard error for the magnitude of impulse across tapping modes and ISIs. ............................................................................................ 49
Figure 3. 15: The mean and the standard error for the variability of impulse across tapping modes and ISIs. ............................................................................................ 50
Figure 3. 16: The lag one auto-correlation coefficient for IRI and SE across ISI ........... 51
Figure 3. 17: Lag one auto-correlation for the impulse across tapping mode and ISI. ..... 52
Figure A. 1: The mean and standard error (SE) for variability of IRIC and IRIP for each tapping condition. ..................................................................................................... 67
v

vi
Figure A. 2: The mean and the standard error for the magnitude and variability of time to end force for each tapping condition......................................................................... 67
Figure A. 3: The mean and the standard error for the magnitude and variability of dwell time for each tapping condition. ............................................................................... 68
Figure A. 4: The mean and the standard error for the magnitude and variability of peak force for each tapping condition. .............................................................................. 68
Figure A. 5: The mean and the standard error for the magnitude and variability of force increasing rate for each tapping condition. ............................................................... 69
Figure A. 6: The mean and the standard error for the variability of impulse for each tapping condition ...................................................................................................... 69

Chapter 1 Introduction
The precision of temporal control is important to human motor behavior because
action takes place in time. Temporal control is both a perception and an action ability that
estimates and produces movement in time intervals. Action takes place over different
timescales: from the circadian 24-hour cycle to, the minutes, seconds or milliseconds of
some behaviors. For example, temporal control at the millisecond level is crucial to
playing music or performing with other musicians (Buhusi & Meck, 2005). Pianists
estimate the time interval between successive notes to play wonderful music and dancers
estimate the right moment when they should pace their movements to specific musical
tempos. Interestingly, temporal perception and action ability are not unique to humans.
Animals such as the cockatoo, for example, can spontaneously adjust the tempo of their
movements to synchronize with rate changes in an external stimulus (Patel, Iversen,
Bregman, & Schuiz, 2009). However, even well-trained musicians and dancers exhibit
variability and inaccuracy in their time estimation and synchronization.
Many models have been proposed to explain temporal control, especially
temporal variability and inaccuracy. Movement parameters such as force, however, have
been ignored in these models. In this thesis, it is this variability and inaccuracy of
movement temporal control that is the central focus. In particular, this research examines
force production during uni-manual finger tapping, a paradigm that has been widely used
to study temporal control’s variability and inaccuracy.
Two different perspectives on temporal control are found in the literature.
Traditionally, an internal timer has been considered to be the central mechanism of time
estimation; although there are many views on the nature of this timer and whether it has a
1

physical instantiation. Several models from this perspective, such as the pacemaker-
accumulator model (Ivry & Richardson, 2002), have been proposed to explain how time
perception and estimation work and to explain the variability and inaccuracy of temporal
control. Alternatively, others have argued that there is no central timer in the brain. Here
temporal perception is conceptualized as a cognitive mechanism rather than an internal
timer (Grondin, 2010). Or as suggested in a recent neuroimaging study, a distributed
brain network, rather than an internal timer located in a specific region of brain, is
responsible for temporal control (Buhusi & Meck, 2005).
For the most part, the central timer models of temporal control have seen the issue
as one predominantly concerned with the central nervous system. It could be argued that
without the peripheral system that executes the movement, the explanation is incomplete
or incorrect. One particular model that took the motor component into consideration
serves as an exemplar for understanding how motor timing is conceptualized. In this
model, timing is viewed as a two-level process. The two-process model was originally
proposed by Wing and Kristofferson (1973) and later developed by Vorberg and Wing
(1996), and Vorberg and Schulze (2002). It was developed to explain perception-action
coupling variability that had been an almost universal finding in previous research. In this
model, variability of temporal control is attributed to two independent sources: 1) a
central timer; and, 2) motor delay. The central timer estimates the time interval and
provides a stochastic timekeeping signal. The motor delay component indicates the neural
transmission delays between the central timer triggering and the overt movement
execution. This model provides an estimate of the variability of the central timer and the
motor delay.
2

In the laboratory, two major experimental paradigms have been widely used to
study the precision of temporal control: synchronization-continuous tapping (see Wing,
2002, for a review) and synchronization tapping (see Repp, 2005, for a review). The
synchronization-continuous finger tapping paradigm, introduced by Stevens (1886)
focuses on the variability of inter-response interval production. In this paradigm,
participants start tapping their finger to an external cue (paced phase). After about 10-15
taps, the external cue is turned off and participants are asked to continue tapping at the
same rate given by the external cue (unpaced phase). The interval between the two
successive external cues is defined as the inter-stimulus interval. During the unpaced
phase, the longer-than-average inter-response interval (IRI) alternate with the shorter-
than-average IRI, thus creating a “zig-zag interval” (Stevens, 1886) or negative lag-one
auto-correlation (Semjen, Schulze, & Vorberg, 2000; Vorberg & Wing, 1996; Wing &
Kristofferson, 1973). Wing (1980) found that for typical adults, only the internal
timekeeper variance increased with increasing external cue rate, while the motor variance
remained relatively constant. These results suggested that the central timer is the major
source contributing to temporal variability.
In contrast to the continuous tapping paradigm in which the inter-response
interval is the datum of interest, the synchronization paradigm focuses on the error
correction mechanism where the synchronization error (SE) is defined as the time
difference between the taps and the corresponding external cues. Synchronization tapping
is a task paced with external cues (auditory, visual, tactile etc.) extensively used to test
sensorimotor synchronization (Repp, 2005). It has been argued that synchronization
tapping is more complex than continuous tapping because, in addition to the IRI
3

production, subjects must correct the SE (Hary & Moore, 1987). The error correction
ability is very important to sensorimotor synchronization because without it, the
accumulated error will increase without bound causing an incorrect timing output. Since
1967 (reported by Repp, 2005), the error correction mechanism has been studied using
the paced finger tapping task. Phase and period error correction models have been
established (Hary & Moore, 1987; Pressing, 1998; Semjen, Vorberg, & Schulze, 1998).
However, these studies ignored the notion that there was a central timer. Taking the two-
level process framework into consideration, Vorberg and Wing (1996) extended the
original two-level process model to the synchronization paradigm and the validity of the
extended model was examined by simulation studies (Semjen, et al., 1998). Using this
extended model, Semjen and his colleagues (Semjen, et al., 2000) compared the temporal
variability between synchronization-continuous and synchronization finger tapping
movements. They found the timekeeper variance increased with increasing external cue
rate for both paradigms, but more steeply during continuous compared to synchronization
tapping. This result suggested that, during synchronization tapping, the central variance
was counteracted by the variance contributed by the corrective mechanism.
The other focus of sensorimotor synchronization studies is the negative SE which
refers to the taps always preceding the external cues in adults. A review of the extant
studies demonstrated that the negative SE was found in almost all the sensorimotor
synchronization studies (Aschersleben, 2002; Repp, 2005) . In Aschersleben’s learning
study (2003) of finger tapping in typical adults, the participants were provided with the
visual feedback of the SE after each tap. However, they still tapped their fingers
preceding the external metronome although their error decreased. Compared to non-
4
musicians, musicians showed smaller (Aschersleben, 2002) or sometimes no negative SE
(Repp & Doggett, 2007). Aschersleben and colleagues showed that sensory information
plays an important role in negative SE (Aschersleben, Gehrke, & Prinz, 2001;
Aschersleben & Prinz, 1995, 1997; Drewing, Hennings, & Aschersleben, 2002;
Stenneken, Prinz, Cole, Paillard, & Aschersleben, 2006). However, the reasons for
negative SE are still unclear. One hypothesis forwarded to explain the negative SE is the
sensory accumulation model (Aschersleben, 2002). This model assumes that the
synchronization occurs at the central representation level rather than at the motor
response level and the sensory information is represented at the central level after the
threshold for this sensory information is reached. The different processing speeds for
tactile (tap) and auditory (metronome) information cause the SE in the representation at
the central level. Therefore, to compensate for this discrepancy at the central level, one of
these two sources of information (i.e., tactile information) should start processing earlier
than the other, resulting in the tap preceding the metronome. Other hypotheses, such as
the neural-conduction hypothesis (reviewed by Aschersleben, 2002) and the virtual
amplitude hypothesis (Vaughan, Rosenbaum, Diedrich, & Moore, 1996) have also been
used to explain the negativity of SE.
All of these above-mentioned studies have ignored another important movement
parameter: force. Implicitly, these studies assume that temporal control is independent of
other factors in motor coordination. However, examination of our daily activities, such as
writing, dancing, and playing piano, reveals that all require simultaneous force
production as well as temporal control. Indeed, some studies have shown that we cannot
separate force control from temporal control: The impulse-timing hypothesis, for
5

example, assumed that the amount, duration and temporal onset of force are determined
by the duration of the neurological activity and the time of its occurrence (Schmidt,
Zelaznik, Hawkins, Frank, & Quinn, 1979). Stein (1982) suggested that force is a muscle
variable that the nervous system controls in producing limb movements. Moreover, motor
behaviors are represented by kinematic parameters such as acceleration and velocity, both
of which are highly related to time and force. Even in an isometric force production
study, the results suggested that the time for reaching the target force level is highly
correlated with the peak force variability (Newell & Carlton, 1985).
Although there is a paucity of studies focusing on force and temporal control
simultaneously, a few studies have suggested that the relationship between force and
temporal control exists. Keele and his colleagues (Keele, Ivry, & Pokorny, 1987) used the
synchronization-continuous tapping paradigm to test the correlation between peak force
variability and IRI variability. Their results suggested that peak force variation was
significantly correlated to IRI variation. The positive and negative lag-one cross-
correlations were found between the tap-to-tap force variation and IRI variation in their
study. The relationship between peak force variability and IRI variability has also been
found for synchronization tapping with high tapping frequencies (Sternad, Dean, &
Newell, 2000). This study also suggested that when force control is required, the
temporal property is stable across force conditions. In a notable study about the force-
timing relationship (Billon, Semjen, & Stelmach, 1996), participants were required to
accentuate one tap in a periodic tapping movements of five taps. It was found that the IRI
of movement onset preceding the accentuated tap was shortened, while the IRI of
movement onset following the specific tap was lengthened. These results suggested that
6

force production and temporal control are coupled to each other.
In the Billon et al.(1995) study, the authors suggested that the timing goal was the
time of contact between finger and surface so that tapping onset can be flexibly changed
to coordinate when a more forceful tap is required. Alternatively, the virtual amplitude
hypothesis suggests that the endpoint of tapping is a virtual point beyond the tapping
surface (Vaughan, et al., 1996). Is the time of peak force or is the time of contact, the
goal of temporal control in both continuous and synchronization tapping? In all the
studies that found the negative synchronization, the time of contact was used as the
endpoint of the tapping movement. Is the synchronization error at the time of peak force
zero or positive?
In addition, in the previous studies, participants were required to tap their fingers
with a given force target or use a relatively constant force implying that both force and
time needed to be controlled simultaneously. Would force and time be related if the
participants were only required to control their tapping speed and no force constraints
were specified? In addition, what is the role of the external stimulus (i.e., the
metronome) in regulating the force-time relationship? Previous studies found a force-
time relationship in both continuous and synchronization paradigms (i.e., metronome
unpaced or paced). When no force constraints are specified, is the time-force relationship
different between continuous (without metronome) and synchronization tapping (with
metronome) since they are proposed to use different temporal mechanisms?
Therefore, the purpose of this thesis is to determine if the temporal parameter that
needs to be precisely controlled is a force parameter time - namely, the time of peak
force. It is hypothesized that the IRI and SE of the time of peak force will have a higher
7

accuracy magnitude and smaller variations than the IRI and SE for contact time,
respectively, indicating that the temporal control target of finger tapping is the time of
peak force and not the tap’s contact time. It is also expected that different force
production strategies are used in the two tapping paradigms, one with an external pacing
cue (i.e., synchronous tapping) and one without an external cue (i.e., continuous tapping)
as tapping intervals or speeds are varied. Specifically, we hypothesize that the time-
related variables (dwell time, time-to-peak force, etc.); force-related (peak force,
variability of peak force, variability of force deviation); and, force-time related variables
(impulse, and force increasing rate) will differ between continuous and synchronization
tapping as tapping interval changes.
In addition to this first introductory chapter (Chapter 1), three additional chapters
are included in this thesis. The second chapter contains a review of the relevant literature.
The third chapter describes the methodology of the proposed studies and presents the
results and discusses the findings. The last chapter discusses the study’s limitations and
offers possible directions for future research.
8

Chapter 2 Review of Literature
Temporal or timing control plays an essential role in human movements. Timing
control is involved in self-paced rhythmic movements such as locomotion, writing, and
speech production; referential movement (Pressing, 1999) such as movements that are
temporally coordinated with external events, such as dancing, singing, and playing
musical instruments; and, in discrete actions, such as catching and reaching. Since 1886
(Stevens), research has been conducted to explore the temporal control mechanism of
human movement. These research efforts have included mathematical modeling
(Pressing, 1998; Schulze & Vorberg, 2002; Vorberg & Wing, 1996); development of the
internal timer model (Helmuth & Ivry, 1996; Ivry & Richardson, 2002; Zelaznik,
Spencer, & Ivry, 2002); exploration of the role of sensory information (Aschersleben, et
al., 2001; Aschersleben & Prinz, 1995, 1997; Drewing, et al., 2002; Stenneken, et al.,
2006) and the role of brain function (Ivry, Spencer, Zelaznik, & Diedrichsen, 2002; Ivry
& Spencer, 2004; Spencer, Ivry, & Zelaznik, 2005; Thaut, 2003); studies of a timing
correction mechanism (Delignieres, Torre, & Lemoine, 2009; Hary & Moore, 1987;
Semjen, et al., 1998); examination of the nonlinear properties of temporal variability
(Delignieres et al., 2006; Delignieres, Torre, & Lemoine, 2008; Lemoine, Torre, &
Delignieres, 2006; Roberts, Eykholt, & Thaut, 2000) ; and, research on timing ability
across the lifespan (Bo, Bastian, Contreras-Vidal, Kagerer, & Clark, 2008; Bo, Bastian,
Kagerer, Contreras-Vidal, & Clark, 2008; Drewing, Aschersleben, & Li, 2006; Greene &
Williams, 1993; Piek & Skinner, 1999).
While timing is an essential element of movement, it is not the only factor
involved in motor control and coordination. Indeed, movement involves three elements:
9

time, space, and force. Interestingly, limited attention has been paid to the
interrelationship of these factors and in particular, the timing-force relationship (Billon,
Semjen, et al., 1996; Sternad, et al., 2000; Therrien & Balasubramaniam, 2010). It is this
latter relationship that is the focus of the present thesis.
In the first section of the thesis’ review of literature, the conceptual model of
timing and the different definitions of the internal timer are discussed. Two classic
experimental paradigms with mathematical models are described in the subsequent two
sections. The variability and synchronization error of temporal control are discussed in
the later sections. The sixth section introduces a hypothesis explaining the negativity of
synchronization error of sensorimotor synchronization. Lastly, the review discusses the
timing-force relationship and the effect of other force-related factors (trajectory etc.) on
temporal control. Because the temporal control mechanism has been widely studied for
over a hundred years, the literature is immense. Therefore for the purposes of this thesis,
the review of literature has been limited to the scientific work that focuses on the 1:1 in-
phase discrete finger tapping experiments.
Conceptual Model and Central Timer
The first study on human movement timing was conducted in by L.T. Stevens in
1886 (Stevens, 1886). He asked participants to tap a lever repetitively matching an
external metronome beats at rates from 360 ms to 1500 ms. The results revealed a pattern
of temporal variability, which Stevens called “constant zig-zag.” (1886). He also found
that even with the short-term fluctuations, participants maintained the response intervals
within 5% percent of the target mean intervals. Almost a century later, Wing and
colleagues proposed a model to explain the variability in the findings of Stevens and
10

others. Wing and Kristofferson (1973) proposed a two-level process model, in which
there is a central timer in the central nervous system that controls movement timing. In
this model, in addition to the central timer, the motor delay is another component that
contributes to the temporal variability. The latter is the neural transmission delays
between the central timer trigger and the overt movement execution. The prediction of
the mathematical model of the two-level process has been supported by a number of
studies (see Wing, 2002, for a review). The mathematical model is discussed in section 3
of this review.
Although the two-level process model is well-supported by the research literature,
there has been a debate about the definition of the central timer. Schöner (2001), for
example, has argued that the central timer is actually a pacemaker, which is a basic time
measurement method in physics. In Schöner’s conceptualization, the central timer
measures time by counting the number of oscillation cycles of the pacemaker. In other
words, one cycle of the pacemaker oscillator is a unit of time. The pacemaker’s frequency
could be adjusted based on the task demands. The other conceptualization of the central
timer is the hourglass model or interval timer. The only difference between the hourglass
model and the pacemaker oscillator is that the interval of one cycle is preset. Therefore,
the model requires a set of hourglasses with different durations to produce different
intervals (Ivry & Richardson, 2002).
Ivry and colleagues conducted a set of studies on the internal timer mechanism.
They (Ivry, Keele, & Diener, 1988) found that patients with unilateral cerebellum lesions
showed higher timing variability when they tapped their ipsi-lateral effectors (foot and
finger) than the variability produced by the contra-lateral effectors. Indeed, it was
11

interesting that this higher variability was attributed to the central timer component based
on the two-level process model. These results implicitly indicated that the ipsi-lateral and
contra-lateral effectors of cerebellum-lesion patients use different internal timers. In one
of their later studies (Franz, Ivry, & Helmuth, 1996) involving both uni-manual and
bimanual finger tapping movement in uni-lateral cerebellum lesions patients, timing
variability of the ipsi-lateral finger tapping was dramatically reduced when participants
tapped their ipsi- and contra-lateral fingers in-phase. According to the two-level process
model, this reduced response variability was associated with reduced central component
variability. A consistent result was also found in typical young adults (Helmuth & Ivry,
1996). Ivry (1996), based on these results, proposed that there were a set of internal
timers used by different perceptual (afferent modalities) and motor systems (effectors),
which he referred to as the “multiple timer” model.
Experimental Paradigms for The Study of Temporal Control
Finger tapping has been widely used as a task to study the temporal control of
human movement. Two of the most common research paradigms to study tapping are the
synchronization-continuous and synchronization tapping. These two paradigms are
described below.
Synchronization-continuous paradigm.
The synchronization-continuous paradigm was first developed by Stevens (1886)
to study the timing of the inter-response interval. This paradigm requires participants to
match their finger taps to external cues with a fixed rate (synchronization phase). After
participants match the rate, the external cues are turned off. Participants are asked to keep
tapping with the same rate for some fixed interval to follow (continuous phase). The
12

inter-response intervals during the continuous phase are the data of interest.
Synchronization paradigm.
During synchronization finger tapping, participants are instructed to tap their
finger(s) to match external cues with a fixed rate. The sensorimotor synchronization is the
focus of this paradigm and the synchronization errors (SE) between response and external
cues are the data of interest. Different effectors (finger, wrist, and foot etc.), different
external cues (visual and auditory), and different coordination patterns between external
cues and response (in-phase and anti-phase; 1:1 or 2:1) have been used in this
experimental paradigm.
Modeling Human Temporal Control
Wing and Kristofferson (1973) developed the two-level process model for the
synchronization-continuous paradigm. As stated earlier, two components contribute to
the overt temporal variability (Figure 2.1):
Figure 2. 1: The two-level process model for continuous tapping (Vorberg & Schulze, 2002)
13

In this model, the jth inter-response interval is related to the timekeeper of
current tap and is bounded by the current motor delay and the preceding motor
delay component :
jI
jC jM
1−jM
(2.1) 1−−+= jjjj MMCI
To check the “zig-zag interval” found by Stevens (1886) , the auto-covariance
coefficient can be calculated:
),cov(),cov(),cov(),cov(
),cov(),cov(),cov(),cov(
),cov(),cov(
11111
1
11
−+−+−+−−+
+−+++
−+++−+
+−−−
+−+=
−+−+=
jnnjnnjnnjnn
jnnjnnjnnjnj
jnjnjnnnnjnn
MMMMCMMM
MMMCMCCC
MMCMMCII
(2.2)
With the assumptions 1). 0),cov(,, =∀ mn MCnm that means the central timer
and motor delay component are independent. 2). 0),cov(,, =∀ mn CCnm and
that means the independence within component, we can simplify
equation (2.2) to:
0),cov( =mn MM
⎪⎩
⎪⎨
⎧
>=−=+
==+
10102
),cov( 2
22
jjj
II M
MCj
Ijnn δδδ
γ (2.3)
Then, it is obvious that
01
)0()0(
)0( === jwhenI
II γ
γρ (2.4a)
12)0(
)1()1( 22
2
=+
−== jwhenMC
M
I
II δδ
δγγ
ρ (2.4b)
(2.4c) 10)( >== KjwhenKIρ
14

where the ρ and γ are the auto-correlation and auto-covariance function of the inter-
response interval, respectively. The is the variance of the motor delay component,
and the is the variance of the central timer. The model indicates that the lag one auto-
correlation of the inter-response interval is bounded between 0 ( ) and -1/2 (
), which is consistent with Stevens’ “zig-zag fluctuations” and has also been
supported by a number of studies about temporal control (Wing, 2002). Equation (2.4)
has been used to calculate the variability of the motor delay and central timer (Greene &
Williams, 1993; Helmuth & Ivry, 1996), which cannot be observed by the overt temporal
response.
2Mδ
2Cδ
2Cδ
02 =Mδ
2Mδ >>
In contrast to the modeling of continuous finger tapping, early models of
sensorimotor synchronization focused on the error correction and they did not distinguish
between the central and peripheral components proposed in the two-level process model
of Wing and Kristofferson (1973). The first model of synchronization timing was
proposed by Michon (reported by Repp, 2005) who suggested a linear correction
mechanism in which each inter-response interval is based on the two preceding inter-
onset intervals which is the interval between two successive external cues. Hary and
Moore (1987) formulated a mixed phase resetting model which suggested the current tap
is based on the previous cue or preceding tap. These two sources are randomly chosen by
the person tapping. Another type of model, referred to as the period correction model,
was proposed by Mates (Mates, 1994a, 1994b). In his model, the central timer corrected
the timing based on the difference between the preceding inter-response interval and
inter-onset interval. The choice of which one of these two correction mechanisms is used
15

depends on the different task parameters, such as the amount of perturbation of the
external cues (Semjen, et al., 1998; Thaut, Miller, & Schauer, 1998).
In 1996, Wing and a colleague (Vorberg & Wing, 1996) extended the two-level
process model for continuous tapping to the sensorimotor synchronization task. In this
phase correction model, the basic assumption is that participants correct the
synchronization error by adjusting the timekeeper based on the previous synchronization
error (Figure 2.2).
Figure 2. 2: The two-level process model for synchronization tapping (Vorberg & Schulze, 2002)
In figure 2.2, the definitions of capital letters are the same as in Figure 2.1. In
addition, and are the external cues’ jth interval and the jth synchronization error,
respectively. It is clear that the synchronization is the time discrepancy between the
external cue and corresponding response, but formally, it is defined as the difference
between cumulated inter-response intervals and cumulated inter-onset intervals (Vorberg
& Schulze, 2002):
jC jA
∑ ∑− −
+ −+=n
j
n
jjjn CIAA
1 111 (2.5)
16

It is obvious in Figure 2.2 that the inter-response interval can be stated as a
function of synchronization error and the inter-onset interval:
(2.6) nnnn AACI −+= +1
The same as for the model for continuous tapping, the inter-response interval is a
linear combination of motor delay and central timer:
(2.7) jjjj MMTI −+= +1*
However, the difference here is the adjustable central timer . According to the
assumption of phase correction mechanism, this adjustable central timer can be described
as:
*jT
(2.8) jjj ATT α−=*
Using these basic equations, we can calculate the auto-correlation function of
inter-response intervals (same as equation (2.2)):
01)0()0(
)0( === jwhenI
II γ
γρ (2.9a)
1
2)0()1()1( 222
2
=++
−== jwhenCMT
M
I
II δδδ
δγγ
ρ (2.9b)
(2.9c) 10)( >== KjwhenKIρ
Equation (2.9) can be used to calculate the time dependence of temporal control
as well as the variance of the central timer and the motor delay.
Temporal Variability
Wing and Kristofferson (1973) examined the mathematical model by
experimental data. Their experimental results showed that the auto-correlation is always
17

negative and bounded between -0.43 to -0.1 for finger tapping when the rate is between
180 to 400 ms. The same negative lag-one auto-correlation was also found by Semjen
and colleagues using 200 to 640 ms interval (Semjen, et al., 2000). In Greene and
William’s developmental study (1993), 98% trial of all participants showed a negative
lag-one auto-correlation. Moreover, they used this model to calculate the variability of
the motor delay and the central timer. They found children, older adults, and females
showed higher variability of the central timer, but no differences in variability of the
motor component, which suggested that the differences observed in temporal variability
across the lifespan are explained by age-related difference in the central timer. The same
method for estimating the variability of the two components was also used by other
studies (Franz, et al., 1996; Helmuth & Ivry, 1996; Ivry, et al., 1988). All of these studies
found that the central timer rather than the motor component contributed more to the
observed temporal variability.
Besides the variability of the inter-response intervals, the synchronization error
also provides information about a person’s sensorimotor synchronization ability. The
same as for the inter-response interval during continuous tapping, the variability of the
inter-response interval and the synchronization error during synchronization tapping
decreases as the rate of the external metronome increases (Semjen, et al., 2000). As
described above, the variability of temporal control during sensorimotor synchronization
is also explained by the central and peripheral source (Vorberg & Wing, 1996). However,
few studies have applied this model to experimental data to calculate the central timer
and motor delay variability during synchronization tapping.
In addition to short duration variability, temporal variability has been studied
18
during a long sequence of finger tapping (up to thousands of taps). In an experiment
involving long sequence finger tapping task (Ding, Chen, & Kelso, 2002), Ding and his
colleagues asked participants to perform 1200 taps with the right index finger. They
found that a long memory process of type 1/fα exists for sensorimotor synchronization
mechanism. The existence of this power law relationship has also been found in
continuous tapping (Lemoine, et al., 2006). The slope of the power-law relation has been
suggested as a criterion to distinguish healthy and handicapped persons (Yoshinaga,
Miyazima, & Mitake, 2000). Using a non-linear time series method and fractal analysis,
several studies have also found a long correlation and a chaotic property for temporal
control variability (Delignieres, Lemoine, & Torre, 2004; Delignieres, et al., 2008;
Roberts, et al., 2000; Torre, Delignieres, & Lemoine, 2007). This would suggest that the
variability of the inter-response interval and SE are not random, but chaotic.
Negative Synchronization Error
One of the question of interest for synchronization tapping is how precise is the
timing of the response to the external cue. For one hundred years, it has been known that
the mean synchronization error, also referred to as asynchrony, is always negative,
suggesting that the tapping response tends to precede the external cue (Dunlap, 1910;
Hary & Moore, 1987; Johnson, 1899; Mates, Muller, Radil, & Poppel, 1994; Peters,
1989; Stenneken, et al., 2006). Interestingly, even when subjects were trained on
sensorimotor synchronization for 10 sessions for five consecutive days, Aschersleben
(2003) found that without synchronization error feedback or with non-informative
feedback, participants consistently showed negative synchronization error and no change
occurred across sessions; however, the errors decreased across sessions when the
19

direction and magnitude of the synchronization errors were provided after each tap.
Interestingly, even though the timing error of the 10th session was close to 0, it was still
negative. The participants reported that they had to delay their tapping to achieve the
synchronization. Two months later when subjects were re-tested, the synchronization
errors went back to the same magnitude as seen before the extended practice.
Besides the negativity, two other characteristics of the SE have been reported in
several studies. The magnitude of SE was found to be positively correlated to the length
of the inter-onset interval (Mates, et al., 1994; Peters, 1989). The other characteristic of
SE that is of interest was the individual differences that have been reported. In particular,
trained musicians have been shown to have much smaller SEs than those not trained in
music (Inui & Ichihara, 2001; Repp & Doggett, 2007).
Effect of Sensory Information
The negative synchronization error (SE) phenomenon, which many consider to be
an anticipation behavior, is still not well explained or understood. Aschersleben (2002)
proposed the sensory accumulator model which assumed that synchrony is formed at the
level of central representation, not at the level of the overt movement response. In this
model, it is assumed there are thresholds for the sensory information representation from
different modalities. Perfect synchronization occurs when the auditory information from
the external metronome and the tactile-proprioceptive information from finger reach their
own thresholds simultaneously. Consequently, if the accumulation functions of afferent
information for different sensory modalities are different, the synchronization error of
central representations would occur. In a synchronization finger tapping task,
Aschersleben (2002) suggested that the accumulation process is faster for auditory
20

information than tactile-proprioceptive information. In order to precisely synchronize
these two events at the central representation level, the tap response has to precede the
external metronome to start accumulating information earlier. This idea was initiated and
supported by a series of studies about sensory information effects on sensorimotor
synchronization conducted by the same research group (Aschersleben, et al., 2001;
Drewing & Aschersleben, 2003; Mates & Aschersleben, 2000; Stenneken, et al., 2006).
By manipulating auditory feedback, Aschersleben & Prinz (1997) and Mates &
Aschersleben (2000) found the synchronization error varied with different auditory
feedback, even though the rate of the external metronome was kept the same across all
auditory feedback conditions, indicating that the central representation for finger tapping
with and without auditory feedback is different. The auditory feedback effect was
supported by a bimanual tapping task (Drewing & Aschersleben, 2003). Although this
experiment used a bimanual continuous tapping task, the authors focused on the intra-
hand temporal variability. On the other hand, Aschersleben et al. (2001) studied how
tactile feedback influenced the sensorimotor synchronization. In this experiment, three
finger tapping tasks: 1) standard tapping; 2) isometric tapping in which the finger was not
allowed to leave the tapping surface; and, 3) contact-free tapping were used. The effect of
tactile information for those participants with a peripheral nerve block showed larger
synchronization error than the control group in the standard and isometric tapping, while
no differences in synchronization error were shown during the contact-free tapping. In
Drewing & Aschersleben’s study (2003), they replicated Helmuth & Ivry’s (1996)
experiment, and suggested that less temporal variability in bimanual finger tapping was
not only due to the multiple timer mechanism, but also may be attributed to the additional
21

tactile information provided by two hands rather than one hand. The effect of tactile and
auditory feedback was also found in deaffereent patients (Stenneken, et al., 2006) and
musicians (Goebl & Palmer, 2008; Krause, Pollok, & Schnitzler, 2010; Loehr & Palmer,
2009). However, one recent study found inconsistent evidence for the sensory
accumulation model (Białuńska, Bella, & Jaśkowski, 2011). In this current study,
manipulating the intensity of external auditory signal did not affect the size of the
synchronization error.
Effect of Effectors
The neural-conduction hypothesis has also been proposed to explain the
negativity of the synchronization error. This hypothesis, with the same central
representation as the sensory accumulation model, was proposed by Fraisse in 1980
(reviewed by Repp, 2005). It is based on the assumption that the afferent information
transmission speed depends on the distance of the effectors to the brain. For example,
auditory information transmission is faster owing to its distance from the brain compared
to tactile-proprioceptive information transmission that comes from the finger. Therefore,
tapping movement is conducted preceding the auditory cue to obtain the tactile-
proprioceptive information earlier. This differential transmission is thus the source of the
asynchrony during synchronization tapping. Support for this hypothesis comes from
studies about simultaneous tapping with two effectors that are different distances to the
brain, such as the foot and finger. The results demonstrate that the foot always leads the
finger in tapping for both the synchronization (Aschersleben & Prinz, 1995; Billon, Bard,
Fleury, Blouin, & Teasdale, 1996) and continuous tapping tasks (Bard et al., 1992;
Billon, Bard, et al., 1996; Stenneken, Aschersleben, Cole, & Prinz, 2002). However, the
22

kinematic properties of these effectors might be the cause of these temporal differences.
Vaughan et.al. (1996) used a tapping task without constraining the wrist, elbow and
shoulder in their study. By manipulating the tapping rate and force level, they found the
contributions of the finger, elbow, wrist and shoulder amplitudes varied. They
hypothesized that different effectors have different implicit preferred frequencies, so
when the tapping rate is close to the frequency of one joint, this joint would play a more
dominant role in the tapping performance than would the others. In the same study,
Vaughan and his colleagues also proposed the virtual amplitude hypothesis. Although
their study was not about the negativity of synchronization error, this hypothesis could be
used to explain the negativity of the synchronization error. In this hypothesis, the virtual
target of tapping is considered to be beyond the contacting surface. Indeed, it is assumed
that the target is the point when the velocity of the finger reaches zero if the finger
tapping is unimpeded. If the target of the finger tapping is to be synchronized to the
virtual target rather than the external cues, the finger might contact the tapping surface
earlier than the external cue to achieve the “virtual” target, thus causing the negative
synchronization error. However, Repp (2005) has argued that this hypothesis cannot
explain the effect of sensory feedback on the negative synchronization error. More details
on this debate are presented in the knowledge gap section at the end of this chapter.
Timing and Force
Force is an essential factor in causing an object to accelerate or change its
movement status. Without force, a stationary object cannot move or moving object stop
or change its direction. The motions involved in finger tapping involve forces created by
muscles. However, all of studies described in this literature review so far have ignored
23

the role of force. Either implicitly or explicitly, these conceptualizations of temporal
control have assumed that timing is an independent factor in motor coordination. But
theoretically and perhaps practically, force and temporal control interact with each other.
At the muscle structure level, muscle contractions are caused by the cross-bridge
whose movement is triggered by the nerve impulse sent from the central nervous system.
The whole process of the nerve impulse transmission is a dynamical process implicitly
involving the time. In Huxley’s cross bridge theory (Huxley, 1957), it was assumed that
the force generated by the muscle is proportional to the number of cross-bridge linkages
formed at that time and that the probability of formation of a cross-bridge is proportional
to the speed of shortening, which also depends on time. On the neuromusculoskeletal
level, the impulse-timing hypothesis (Schmidt, et al., 1979) assumes that the amount,
duration and temporal onset of force are determined by the duration of the neurological
activity and the time of its occurrence. This means that force production is interrelated
with the time factor.
Although there is a paucity of studies focusing on force and temporal control
simultaneously, a few studies have suggested that the relationship between force control
and timing control exists. Keele and his colleagues (Keele, et al., 1987) suggested that
time variation was related to force variation. In their study, participants tapped their index
finger with a specific force and rate in both the continuous and synchronization
paradigms. A high correlation was found between the variation of the inter-response
interval and force magnitude. Moreover, the significant positive lag-one cross-correlation
between force magnitude and inter-response interval showed a larger force was followed
by a longer inter-response interval and preceded by a shorter one. The authors suggested
24

that force production influenced the central timer. Using a continuous finger tapping task
with preferred, half and double preferred force and tapping speed, Inui and his colleagues
also found a positive correlation between force and the inter-response interval variation
(Inui, Ichihara, Minami, & Matsui, 1998). Later (Inui & Ichihara, 2001), they used
specific tapping rates (180, 200, 400, or 800 ms) and force levels (50, 100, 200, or 400g)
instead of the preferred tapping speed and force level to test this relationship. The results
were consistent with their previous study (Inui, et al., 1998). They also found that the
inter-response interval was less variable when higher force was used. This result was
supported by Sternad and Newell (2000).
In a notable study about the force-timing relationship (Billon, Semjen, et al.,
1996), participants were required to accentuate one tap in a periodic tapping movements
of five taps. It was found that the IRI preceding the accentuated tap was shortened, while
the IRI following the specific tap was lengthened, suggesting that the central timer could
be adjusted at the point at which force was adjusted. The relationship between force and
time was also supported by the study about whole body rhythmic movement
(Rousanoglou & Boudolos, 2006). Recently, Therrien and Balasubramaniam (2010) also
found that the force magnitude variability depended on the inter-response interval length,
but in their study, a dependence of inter-response interval variability on force level was
not found. They concluded that the central timing mechanism is robust under different
force level production.
Movement Trajectory on Temporal Control
Movement trajectory also appears to be a factor influencing the temporal control
of movements such as tapping. In their study, Balasubramaniam et al. (2004) instructed
25
participants to oscillate their index finger in either a flexion or extension direction with
the beat from an external metronome. This task was considered to be a continuous
movement which had a different timing mechanism from the discrete finger tapping
movements (such as used in a synchronization tapping task on a surface). The results
revealed that the finger trajectory was symmetrical during unpaced tapping task, and
asymmetrical during paced tapping (synchronization tapping), which contributed to the
accuracy of the synchronization. The more asymmetry that occurred, the closer to zero
the synchronization was. Moreover, the velocity of the return phase was also small if the
preceding SE was larger. The authors suggested that changing the velocity of the moving
finger could be a strategy to compensate for the synchronization error.
Knowledge Gap
From the preceding survey of the literature on temporal control, several
knowledge gaps have been identified. These gaps are described here and form the basis
for the experiments proposed for this thesis.
Force strategies differ between continuous and synchronization tapping.
Continuous and synchronization tapping have different targets and degrees of
freedom, so they are always studied separately. It has been suggested that force and
timing variability are correlated during both of these two tapping tasks, but the
relationship is still not clear. Indeed, we also do not know why this relationship exists or
the nature of the relationship. Perhaps studying both tasks together may reveal more
about the relationship between timing and force control.
Negativity of the synchronization error.
26

It is commonly shown that the tap contact tends to precede the external
metronome beat (defined as a negative SE). This phenomenon is often referred to as
anticipation. Some hypotheses have been proposed to explain this negativity of the
synchronization error (Repp, 2005). However, these explanations have difficulties in
explaining the following properties about the synchronization error: 1) negativity of that
the taps always precede the external cues; 2) the positive correlation with a decreasing
tapping interval; and, 3) individual differences – in particular, those seen with experts on
timing task (i.e., musicians). For example, the neural-conduction hypothesis
(Aschersleben, 2002) cannot explain the individual differences and the tapping interval
dependence. However, the virtual amplitude hypothesis proposed by Vaughan et al.
(1996) can explain why the synchronization error would be negative. In this hypothesis,
finger tapping is considered as an oscillation interrupted by the contact surface. After the
finger contacts the surface, the movement trajectory stops but the force production does
not, so this movement has a virtual target that is beyond the contact surface. If the
synchronization occurs at the virtual target, the negativity of the synchronization error
can be explained well. Moreover, if the interval of the external metronome decreases, the
virtual amplitude decreases so the time needed to reach the target is reduced. The
individual differences in timing precision could be explained by the individual
differences in force production. The fact that the musician has much smaller
synchronization errors could be attributed to their better force control ability. However,
Repp (2005) has argued that this hypothesis could not explain the decreasing error when
auditory feedback is provided. One could claim, however, that the synchronization
tapping with and without auditory feedback is a totally different task and therefore
27

synchronization would be predicted to occur at different events. The virtual amplitude
hypothesis assumes that the tapping and metronome synchronize at the virtual target,
while the tapping task with the auditory feedback changes the synchronization point to
the sounds of two auditory inputs (i.e., the metronome and feedback). Clearly, the
movement does not stop at the point that the auditory feedback is triggered.
According to the experimental definition of synchronization error and the
discussion concerning the virtual amplitude hypothesis, it is logical to conjecture that the
implicit goal of synchronization finger tapping is the accuracy of the time at which the
peak force occurs. Changing the peak force or the force production speed would be one
strategy for the timing correction.
Definition of inter-response interval and synchronization error.
If the plan is to study the force-timing relationship, it is important to know where
on the force curve the time target is defined. Most studies have used an electrical switch
as the tapping surface (Aschersleben, 2003). The timing of a tap in these studies is
defined at the initial time of contact, which ignores the entire process of force production.
The contact time when the finger contacts the surface was also used to define the two
temporal parameters (Inui & Ichihara, 2001; Inui, et al., 1998). One study (Białuńska, et
al., 2011) used the force to calculate the timing, but in this study, the timing of finger
tapping was defined when the force exceeded 1.5 N when calculating the inter-response
interval, Sternad et al. (2000) used the time of peak force. Surprisingly, few studies
defined synchronization error using the time of peak force. Using this method to calculate
the synchronization error, a positive result regarding to the hypotheses of this thesis
should be expected.
28
Summary
Based on the review of literature and the identified knowledge gaps, an
experiment is proposed to study the temporal-force relationship and to examine if the
temporal control properties defined at different points such as the time of contact and the
time of peak force differ from each other. The experiment and its results are discussed in
the next chapter.
29

Chapter 3 Experiment
Introduction
Temporal control is essential to human movement both in the activities of daily
living and the skilled actions of the athlete, dancer, or musician. Timing is critical in
self-paced rhythmic movements such as locomotion and the externally modulated actions
such as intercepting balls or playing in an orchestra. Although temporal control has been
widely and well-studied for over a hundred years (Stevens, 1886), little attention has been
paid to the other movement parameters such as space and force that might influence
temporal control. Indeed most of the extant models of timing control (e.g., Wing &
Kristofferson, 1973) assume that it is independent of the other movement dimensions.
But time, space, and force are all important parameters of human movement, so it might
be predicted that the three parameters would be interrelated. Indeed in 1954, Fitts (1954)
proposed a logarithmic relationship between spatial amplitude and time duration; a
relationship that has been well studied over the ensuing years. Although several
experiments suggest that there may be a relationship between time and force control, this
relationship has been understudied. In the experiment described here, it is this time-force
relationship that is the focus.
Keele and his colleagues (Keele, et al., 1987) using a synchronization-continuous
tapping paradigm (i.e., tapping first with a metronome and then without) tested whether
there was a correlation between the variability of a tap’s peak force and timing
variability as measured by the variability of the inter-response interval (IRI). Their
results suggested that peak force variation was significantly correlated to IRI variation.
Similar findings were reported for synchronization tapping with high tapping frequencies
30

(Sternad, et al., 2000). The correlation between force magnitude and tapping frequencies
was also found in a continuous tapping task (Inui & Ichihara, 2001; Inui, et al., 1998). In
an interesting study by Stelmach and his colleagues (Billon & Semjen, 1995; Billon,
Semjen, et al., 1996), participants were required to accentuate one tap out of five in a
periodic tapping task. They found that the IRI of movement onset, in both continuous and
synchronization tapping, preceding the accentuated tap was shortened, while the one
following the specified tap was lengthened. Taken together the results from these studies
suggest that force production and temporal control are coupled to each other.
In the Billon et al.(1995) study, the authors suggested that the timing goal was the
time of contact between finger and surface so that tapping onset can be flexibly changed
to coordinate when a more forceful tap was required. Alternatively, the virtual amplitude
hypothesis suggests that the endpoint of tapping is virtual point beyond the tapping
surface (Vaughan, et al., 1996). Is the time of peak force or the time of contact, the goal
of temporal control in both continuous and synchronization tapping? All the studies that
found a negative synchronization used the time of contact as the endpoint of the tapping
movement. Is the synchronization error at the time of peak force zero or positive?
In addition, in the previous studies, participants were required to tap their fingers
with a given force target or use a relatively constant force implying that both force and
time needed to be controlled simultaneously. Would force and time be related if the
participants were only required to control their tapping speed and no force constraints
were specified? In addition, what is the role of the external stimulus (i.e., the
metronome) in regulating the force-time relationship? Previous studies found a force-
time relationship in both continuous and synchronization paradigms (i.e., metronome
31

unpaced or paced). When no force constraints are specified, is the time-force relationship
different between continuous (without metronome) and synchronization tapping (with
metronome) since they are proposed to use different temporal mechanisms?
The purpose of this thesis is to explore this temporal-force relationship.
Specifically, we seek to determine if the time of peak force is the temporal parameter that
is the target in tapping. It is hypothesized that the IRI and SE of the time of peak force
will be more accurate and have smaller variations than IRI and SE of contact time,
respectively indicating that the temporal control target of finger tapping is the time of
peak force and not the tap’s contact time. It is also expected that different force
production strategies are used in the two tapping paradigms, one with an external pacing
cue (i.e., synchronous tapping) and one without an external cue (i.e., continuous tapping)
as tapping intervals or speeds are varied. Specifically, we hypothesize that time-related
variables (dwell time, time-to-peak force, etc.), force-related (peak force, variability of
peak force, variability of force deviation) and force-time related variables (impulse, and
force increasing rate) will differ between continuous and synchronization tapping as the
tapping interval changes.
Methods
Participants.
Seventeen right-handed young adults (20.8 ± 1.5 yrs) from the University of
Maryland, College Park were recruited as subjects for this study. Only right-handed
participants were included in this study. Hand dominance was determined by a self-report
questionnaire (Oldfield, 1971) administered to the participants before the study began
(Appendix A). A neurological health questionnaire was also given to each participant
32

(Appendix B). All participants with neurological impairments or medical conditions that
may affect motor performance were excluded. All participants signed the informed
consent (Appendix D) based on the procedures approved by the University of Maryland’s
Institutional Review Board (IRB) before starting the experiment). Upon completion of
the testing session, participants received $ 10 monetary compensation.
Apparatus.
The force data produced by the index, middle, ring, and little finger were
collected by four six-component (three force and three moment components) force
transducers (ATI Industrial Automation, Garner, NC, USA), and the force signals were
routed to the two synchronized 12-bit analog-digital converters (PCI-6031, National
Instrument, Austin, TX, USA). The sensors were mounted on a flat wooden board with a
Velcro strap. This set-up was fixed on a table. A custom software program made in
LabVIEW (LabVIEW 7.1, National Instruments Corp.) produced rhythmic beeps
(frequency 440 Hz, duration 30 ms) transmitted to the participants through a headphone.
All force data were sampled at 200 Hz.
Procedure.
Subjects were seated comfortably in a chair facing a 19’’ computer screen (Figure
3.1). The height of the chair was adjustable so that subjects could reach the force sensor
with the entire arm comfortably positioned and relaxed. The forearm rested on a wooden
panel and was fixed by the velcro straps to avoid forearm and wrist movements. Each of
the four fingers including the index, middle, ring and little finger rested on individual
force transducer before the experiment started. Three practice trials were provided before
the experimental trials. During the experimental trials, subjects were asked to only tap
33

their right index finger on the force sensor to match the external metronome in either the
continuous paradigm in which subjects tapped 10 times before the external metronome
was turned off and were instructed to continue tapping at the same rate given by the
metronome or the synchronization tapping paradigm in which participants tapped their
index finger in synchrony with the external metronome throughout the entire trial. The
metronome rates used in this experiment were 500 ms, 1000 ms, and 1500 ms. Each
condition included two trials and each trial lasted for 60 taps. All the conditions were
randomly arranged within subjects. Throughout the experiment, no visual feedback was
provided.
Figure 3. 1: The experimental setup. The wrist and forearm are fixedby velcro straps. Subjects were required to tap their index finger.
Data reduction and measures.
All data were filtered by low-pass filter (4th order Butterworth with cut off
frequency 20Hz). Custom-designed MATLAB programs derived the following time and
force variables using the last 50 taps in each trial. Both the magnitude and variability of
these variables were the data of interest in this study. The variability of each variable was
calculated as the standard deviation of the magnitude of each variable within a subject’s
34
trial. The mean of the magnitude/variability of each variable across trials within subject
was used to determine the ISI and tapping mode effect and the potential interaction effect
on these variables. The time series of the variables’ magnitudes were used to calculate the
auto-correlation for each subject.
Time variable.
Inter-response interval at the time of initial contact (IRIC) & peak force (IRIP).
IRIC was defined as the time interval between two successive times of force onset
when the finger initially touches the force sensor. The initial touching time was extracted
when force reached 0.05% of the peak force in each tap. This calculation method for
determining contact onset time was selected to exclude the influence of white noise on
this onset time. IRIP was the time interval between two successive times of peak force.
The magnitude and variability of these two variables were used to determine the temporal
control accuracy and variability across tapping mode and ISI length. The difference
between the IRIC and IRIP was used to examine if the temporal property of the initial
contact time of tapping was different from that of the time of peak force.
Synchronization error at the time of initial contact (SEC) & peak force (SEP).
The SEC was defined as the time difference between the time of tapping force
onset and the time of the external metronome. The difference between the time of peak
force and the time of the external metronome was the SEP. A negative value of SE meant
tapping precedes the external metronome. As for IRI, the magnitude and variability of
these two variables were used to determine the temporal control accuracy and variability
of synchronization tapping (with metronome) across ISI lengths. The difference between
the SEC and SEP was also used to examine if the temporal property of the initial contact
35

time of tapping was different from that of the time of peak force.
Force variables.
Three types of force variables were used in this study: time-related, force-related
and the time-force related. Each of these characterizes different aspects of force
production:
Time-related variable: dwell time & time-to-peak (end) force.
Dwell time is the time duration when the finger is in contact with the force sensor.
The time-to-peak force was defined as the time that was needed to reach the tap’s peak
force. The onset of the time-to-peak force was also set as the time when force reached
0.05% of the peak force. Corresponding to the time-to-peak force, the time needed to
release the finger from the force sensor after reaching the peak force was defined as time-
to-end force.
Force-related variable: peak force.
Peak force was defined as the peak point of the force curve in each tap. For most
taps, especially in synchronization tapping, there were two peaks of the force curve at
each tap. The time duration from the initial contact t to the first peak was always 1.25 to
2.5 ms (one or two sampling point with the 200Hz sampling frequency), which might be
caused by the internal impact of the sensor rather than the physical tapping. Therefore,
the time of the second peak was used to define the time to peak force. For a few taps in
which the two peaks had same shapes, the first peak was used because some subjects
might try to tap again to correct the temporal error.
Time-force related variable: Force increasing (decreasing) rate & impulse.
These two variables characterize both the time and force information of the tap.
36

Force increasing (decreasing) rate was the ratio between the peak force and the time-to-
peak and time-to-end force, which indicates how fast the force was produced and
released. Impulse is the accumulated force effect during each tap. It was calculated as the
area under the force curve of each tap. The impulse is related to dwell time. Figure 3.2
graphically illustrates the definition of all the dependent variables.
Figure 3. 2: The definition of each dependent variable. The figure showsthree taps in an experiment trial.
Statistical analysis.
Linear mixed model (Proc Mixed, SAS, version 8.2) 3 x 2 repeated measures
ANOVA was used to determine the main and interaction effect of (3) ISI length and (2)
tapping mode on each variable except SEO and SEP. In this model, the correlated
measure within subject and the subject heterogeneity was controlled. Unstructured
covariance structure determined by the Akaike’s Information Criterion was used in this
model. Post hoc analyses (adjusted by Bonferroni procedures) were applied when any
main or interaction was found. Using the same random terms, the linear mixed model for
37

SEO and SEP only considered the main effect of ISI length since this analysis was used
only for the synchronization tapping task. Model diagnosis was conducted to check if the
assumptions of ANOVA were satisfied. Logarithm transformation was used if the
assumptions were violated. The paired t-test was used to test the difference between
temporal properties defined at the time of force onset and the time of peak force, such as
IRIC and IRIP. Auto-correlation of the time series for each variable was tested by R. The
significant level p=0.05 was used for all effects.
Results
Temporal Property and Tapping End Time.
Difference between IRIC & IRIP.
To determine whether the temporal accuracy as defined by the time of force onset
(i.e., contact time) and the time of peak force were influenced by the ISI length and
tapping mode (with or without metronome), the magnitude of the absolute errors of IRIC
and IRIP were analyzed by a 3 (ISI length) × 2 (tapping mode: ‘with/without
metronome’) repeated measures ANOVA. Figure 3.3 shows the absolute temporal error
between IRI and ISI. The main effect of tapping mode (IRIC: F(1,48)=110.69, p<0.0001;
IRIP: F(1,48)=109045, p <0.0001) and ISI length (IRIC: F(2,32)=23.02, p<0.0001; IRIP:
F(2,32)=23.49, p <0.0001) and the interaction effect (IRIC: F(2,48)=33.16, p<0.0001;
IRIP: F(2,48)=32.19, p <0.0001) for both IRIC and IRIP were significant. As revealed in
the interaction (Fig 3.3), temporal accuracy decreased as ISI increased when the external
cue was not present (i.e., continuous tapping); whereas there was no effect of ISI on
tapping with an external cue (i.e., synchronization paradigm). No previous studies have
reported differences in temporal control accuracy between continuous and
38

synchronization tapping, but it was not surprising that higher errors were seen in the
former mode, since the synchronization condition offered additional auditory information
that was not available during continuous tapping.
In order to examine whether the absolute error of IRIC is less controlled than that
of IRIP, a paired t test between these two dependent variables was conducted for each ISI
level. No difference for absolute error between IRIC and IRIP was found at each ISI level
(p>0.05).
Figure 3. 3: The mean and standard error (SE) for the magnitude of IRIC andIRIP absolute error across tapping modes and ISIs.
Another major property of temporal control that has been widely studied is the
variability of IRI. In figure 3.4 and 3.5, this variability is shown for both IRIC and IRIP.
A 3 (tapping speed) x 2 (tapping condition) repeated measures ANOVA revealed that
there were main effects for tapping condition (IRIC: F(1,48)=5.69, p<0.05; IRIP:
F(1,48)=14.24, p<0.001) and tapping interval (IRIC: F(2,32)=214.26), p<0.0001; IRIP:
F(2,32)=149.27, p<0.0001) (Figure A.1 in Appendix E shows IRIC and IRIP at each
tapping condition and interval combination). Consistent with previous studies, we found
39

that as ISI changes from shorter to longer, the variability increased, suggesting it was
more difficult to maintain the target interval for slower tapping. The continuous tapping
showed
difference in variability between IRIC and IRIP was found at each ISI level
>0.05).
higher variability for IRI than the synchronization tapping.
In order to examine whether the IRIC is less controlled than that of IRIP, a paired
t test of the variability between these two dependent variables was conducted for each ISI
level. No
(p
Figure 3. 4: The mean and standard error (SE) for the variability of IRICacross tapping modes and ISIs. See figure A.1a in Appendix E for IRIC for each tapping condition.
40

of the synchronization error during synchronization tapping
have b
0 as tested by a simple t-test (p<0.001 for SEC; p<0.05 for
SEP) e
s denoted by the two
vertical
Figure 3. 5: The mean and standard error (SE) for the variability of IRIPacross tapping modes and ISIs. See figure A.1b in Appendix E for IRIP foreach tapping condition.
Difference between SEC & SEP and the negative SE.
Two main properties
een considered as the mean negative of synchronization error and the increasing
variability of SE with ISI (Repp, 2005). Both SECs and SEPs at all ISI levels were
negative and different from
xcept for SEP at the 500 ms interval. To illustrate the individual differences
observed in SE, figure 3.6 shows the density of the SEP across each tapping interval. The
peak of the density distribution was around -4ms and about half of subjects produced
positive SE that was outside the range reported in the literature (a
lines on the x-axis).
As illustrated in Figure 3.7(a), the SE magnitude for both contact and peak force
showed an increasing trend from 500 ms to 1500 ms, but this was not statistically
significant effect for ISI.
41

42
As shown in the literature, the longer the ISI used, the larger the variability of SE
produced (SEC: F(2,32)=73.17, p<0.0001; SEP: F(2,32)=31.16, p<0.0001). The highest
variability was produced during tapping with 1500 ms interval, followed by 1000 ms, and
en 500 ms (all p<0.001) for both tapping modes (Figure 3.7(b)).
o determine if the SEC is less controlled than SEP, the difference between the
ariability of SEC and SEP at each interval level was tested by paired-t test. Subjects
howed more stability to control the SEP than SEC regardless of the length of tapping
terval (p<0.05 for each ISI). Figure 3.8 shows the difference between the variability of
SEC and SEP. These findings indicated that subjects changed the time of contact more
than the time of peak force in the synchronization task, suggesting that the temporal
control target is to synchronize the time of peak force with the external metronome.
th
T
v
s
in
Figure 3. 6: The density distribution of SEP. The two vertical lines arethe range of SEC (-20ms to 80ms) reported in the literature.

Figure 3. 7: The mean and standard error (SE) for the magnitude and variability of SEC and SEP.
Figure 3. 8: The mean and standard error (SE) for the difference ofvariability between SEC and SEP for each ISI.
43
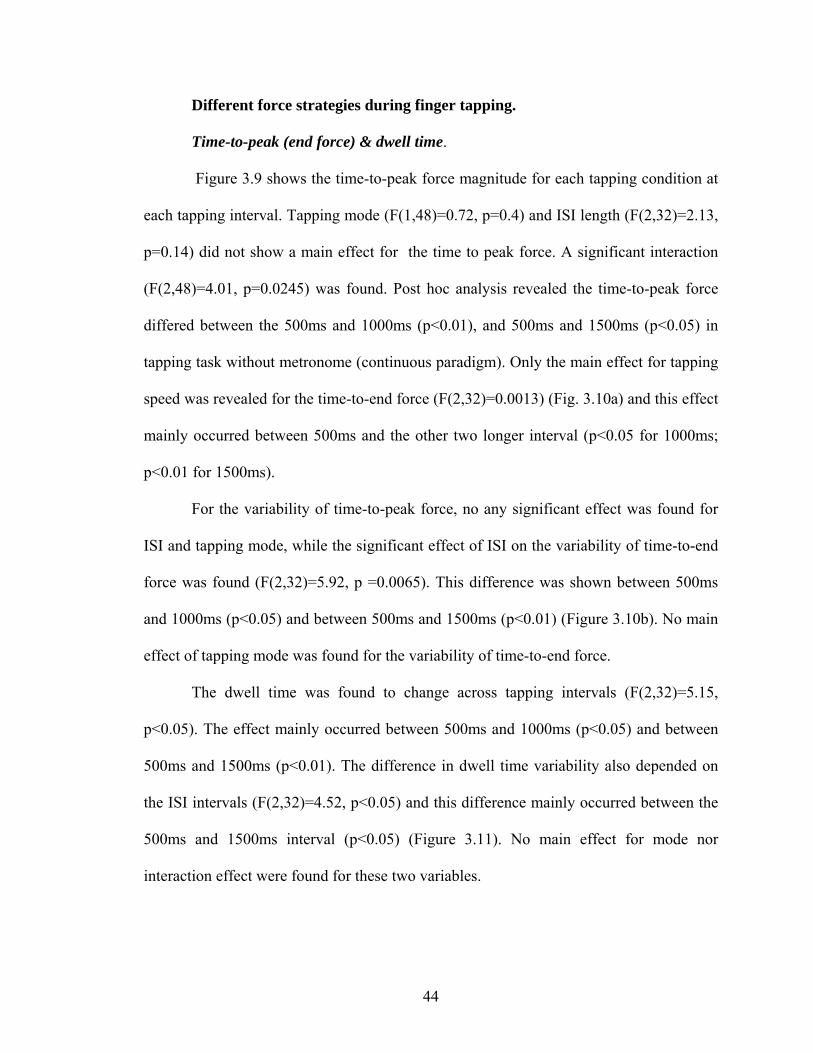
44
Different force strategies during finger tapping.
Time-to-peak (end force) & dwell time.
ms (p<0.05) in
tapping
ISI on the variability of time-to-end
rce was found (F(2,32)=5.92, p =0.0065). This difference was shown between 500ms
nd 1000ms (p<0.05) and between 500ms and 1500ms (p<0.01) (Figure 3.10b). No main
ffect of tapping mode was found for the variability of time-to-end force.
The dwell time was found to change across tapping intervals (F(2,32)=5.15,
0.05 The effect mainly occurred between 500ms and 1000ms (p<0.05) and between
00ms and 1500ms (p<0.01). The difference in dwell time variability also depended on
e ISI intervals (F(2,32)=4.52, p<0.05) and this difference mainly occurred between the
00ms and 1500ms interval (p<0.05) (Figure 3.11). No main effect for mode nor
teraction effect were found for these two variables.
Figure 3.9 shows the time-to-peak force magnitude for each tapping condition at
each tapping interval. Tapping mode (F(1,48)=0.72, p=0.4) and ISI length (F(2,32)=2.13,
p=0.14) did not show a main effect for the time to peak force. A significant interaction
(F(2,48)=4.01, p=0.0245) was found. Post hoc analysis revealed the time-to-peak force
differed between the 500ms and 1000ms (p<0.01), and 500ms and 1500
task without metronome (continuous paradigm). Only the main effect for tapping
speed was revealed for the time-to-end force (F(2,32)=0.0013) (Fig. 3.10a) and this effect
mainly occurred between 500ms and the other two longer interval (p<0.05 for 1000ms;
p<0.01 for 1500ms).
For the variability of time-to-peak force, no any significant effect was found for
ISI and tapping mode, while the significant effect of
fo
a
e
p< ).
5
th
5
in

Figure 3. 9: The mean and the standard error for the magnitude of timeto peak force across tapping modes and ISI.
Figure 3. 10: The mean and the standard error for the magnitude andvariability of time to end force across ISIs. See figure A.2 in Appendix E fortime to end force for each tapping condition.
45

Figure 3. 11: The mean and the standard error for the magnitude andvariability of dwell time across ISIs. See figure A.3 in Appendix E fordwell time for each tapping condition.
Peak force.
This variable, peak force, was analyzed after a logarithm transformation because
the peak force variable in the original scale violated the ANOVA assumption that
where ),0( 2~ σε Niid
i iε was the residual and was the normal distribution with
mean of zero and variance of . Due to the monotonicity of the logarithm function, the
magnitude relationship shown in figure 3.11 is consistent with the data in the original
scale.
),0( 2σN
2σ
In this finger tapping experiment participants were not required to meet a
specified force level. To determine if the ISI length and/or the tapping mode affected the
force strategies, peak force magnitude and variability were analyzed. Both the main effect
for tapping mode (F(1,48)=11.68), p<0.01) and ISI (F(2,32)=8.94, p<0.001) and the
interaction effect between those two factors were found (F(2,48)=3.26, p<0.05) for peak
force magnitude. Post hoc analysis revealed that continuous tapping showed smaller peak
46

force at 500ms interval length than 1000ms (p<0.01) and 1500ms (p<0.01). Larger peak
force was found at 1000ms (p<0.05) and 1500ms (p<0.05) for continuous tapping
compared to synchronization tapping task (Figure 2.12a).
For peak force variability, an effect for the tapping interval length was found
(F(2,32)=7.41, p=0.0023) while no main effect of tapping mode and the interaction
between mode and ISI were revealed. The significant ISI effects on variability of peak
force was shown between 500ms and 1000ms (p<0.01) and between 500ms and 1500ms
(p<0.05). Figure 3.12b graphically illustrates these relationships.
Figure 3. 12: The mean and the standard error for the magnitude andvariability of peak force across tapping modes and ISIs. The peak forcemagnitude is in logarithm scale. See figure A.4 in Appendix E for peakforce magnitude and variability for each tapping condition.
Force increasing (decreasing) rate & impulse.
These three variables (force increasing, decreasing rate and impulse) were
analyzed after logarithm transformations. Two-way ANOVA revealed the main effect of
tapping mode but not ISI on the force increasing rate (F(1,48)=8.31, p<0.01). As Figure
47

3.13a illustrates, subjects used larger force increasing rate in continuous tapping. In
contrast with the force increasing rate, no effects were found for the force decreasing rate.
The main effect of tapping interval was found (F(2,32)=12.4, p<0.0001) for the
variability of force increasing rate. In figure 3.13b, it can be seen that the force
increasing rate was less variable at the 500ms level than the 1000ms and 1500ms and less
variability at 1000ms than 1500ms (all p<0.01).
For impulse, the repeated measure ANOVA demonstrated a main effect for both
tapping mode (F(1,48)=13.56,p=0.0006) and tapping interval length
(F(2,32)=6.44,p=0.0044) and a significant interaction between these two factors
(F(2,48)=5.21, p=0.009) (Figure 3.14). The tapping interval length effect occurred in
continuous tapping only. Subjects produced higher impulse at 1500ms (p<0.001) and
1000ms (p<0.05) compared to 500ms during continuous tapping. The tapping mode
effect was significant at the 1000ms (p<0.01) tapping length interval. The main effect of
tapping interval was found on the variability of impulse (F(2,32)=12.9, p<0.0001). At the
same time, the variability of impulse also differed between the two tapping modes
(F(1,48)=5.02, p<0.05). In figure 3.15, the findings for impulse variability are illustrated.
Higher variability was produced during continuous tapping, and the tapping interval
effect existed between 500ms (p<0.0001) and 1000ms and between 500ms and 1500ms
(p<0.0001).
48

Figure 3. 13: The mean and the standard error for the magnitude and variabilityof force increasing rate across tapping modes and ISIs. The magnitude of theforce increasing rate is in logarithm scales. See figure A.5 in Appendix E for themagnitude and variability of force increasing rate for each tapping condition.
Figure 3. 14: The mean and the standard error for the magnitude ofimpulse across tapping modes and ISIs. The impulse is in logarithm scale.
49

Figure 3. 15: The mean and the standard error for the variability of impulseacross tapping modes and ISIs. The variability of impulse is in logarithmscale. See figure A.6 in Appendix E for the variability of impulse for eachtapping condition.
Time series structure of the temporal and force variables.
A negative lag one auto-correlation has been found theoretically (Wing &
Kristofferson, 1973) and practically (Wing, 1980) for IRI during continuous tapping
(without metronome). The lag one auto-correlation coefficients for both IRIC and IRIP
are shown in Figure 3.16 (top row). Most coefficients were out of the range (-0.5 to 0)
given by the two-level processing model (Wing & Kristofferson, 1973). When tapping
with 1000ms and 1500ms intervals, the lag one auto-correlations were shown to have
positive values. Figure 3.16 (bottom row) also illustrates the positive lag-one auto-
correlation for SE during synchronization tapping. This result was consistent with
literature.
The lag one auto-correlation was also tested for all dependent variables discussed
above. The only dependent variable that had a significant lag one coefficient for some
50

subjects was impulse (Figure 3.17). It was shown that the impulse production for some
subjects was positive correlated at each ISI level. A significant negative lag one auto-
correlation of impulse rarely appeared.
Discussion
Movements are assembled in time and space, and with force. In this experiment,
we examined the relationship between time and force. We used a finger tapping task to
probe if temporal control (as defined by variables such as inter-response interval (IRI)
and synchronization error (SE)) is coupled to a force parameter— namely, the peak force
magnitude. We proposed that the timing end point for finger tapping is the time of peak
force rather than the time of contact – the usual tapping endpoint. In other words, in
tapping the time of peak force would be precisely controlled while the time of the tap’s
Figure 3. 16: The lag one auto-correlation coefficient for IRI (top) and SE(bottom) across ISI. The two horizontal dashed lines are the theoreticalbounds for the lag one auto-correlation coefficient of IRIC. Each point isthe coefficient for one trial of one subject.
51

Figure 3. 17: Lag one auto-correlation for the impulse across tapping mode and ISI. The two horizontal dashed lines are the 95% confidence interval for the lagone auto-correlation coefficient. Each point is the coefficient for one trial of onesubject.
contact is less controlled. This would result in the IRI and SE at the time of contact
(IRIC/SEC) being less controlled than the IRI and SE defined at the time of peak force
(IRIP/SEP). In general, the results of our experiment support this hypothesis. In addition,
the synchronization error for the time of peak force (SEP) was shown to be smaller and
more stable than the synchronization error for the contact time (SEC).
If the tapping temporal control variable is the time of peak force, the time of
contact would be less well controlled. This variable time of contact and the more stable
time of peak force would cause different times to peak force (time duration between the
contact and peak force) at each tap. To precisely control the time of peak force, different
force production strategies would have to be used to compensate for the variable time to
peak force. For example, if the time of contact is earlier, then a larger time to peak force
52

is needed to make the time of peak force longer, which can be reached by producing
larger force or produce force slowly. Therefore, we examined the force production
patterns during different finger tapping tasks. As our results reveal, the force production
strategies differed across the tapping mode (with/without metronome) and the tapping
interval (ISI).
The temporal control variable is the time of peak force.
In our study, participants performed finger tapping with an external cue (i.e.,
synchronization to a metronome) and without an external cue (i.e., a continuation
paradigm) and with no force constraint at tapping intervals of 500, 1000 and 1500ms. We
chose these three tapping speed intervals because they have been shown to result in
different temporal control properties. For example, the variability of fast (e.g. 500ms)
and slow (e.g. larger than 1000ms) tapping is attributed to different sources, which might
indicate different temporal control mechanisms during tapping with these intervals
(Madison, 2001). The choice of two different tapping paradigms, continuous and
synchronization, was made as they have been hypothesized to utilize different temporal
control mechanisms (Repp, 2005). It was expected that, if temporal and force control are
coupled to each other, tapping tasks using different temporal control mechanisms would
result in a change in the force control when no constraint force control is imposed.
To repeat the previous results of temporal control found in the literature, this
study firstly tested the variability of IRI, during both continuous (without metronome)
and synchronization tapping (with metronome) and the variability of SE during
synchronization tapping. The commonly acknowledged positive relationship between
variability of IRI/SE and the length of ISI was found in the present study. Our results
53
also revealed the SE increases with the ISI. As we expected, the higher variability of IRI
in continuous tapping with the longer ISI than that in synchronization tapping was found
in this study. The auto-correlation structures of IRI and SE also are consistent with the
literature (Wing, 2002). The negative lag-one auto-correlation (coefficient range -0.5 to
0) of IRI was found for tapping with 500ms interval and positive lag-one auto-correlation
was found for tapping with 1000 and 1500ms interval. The former has been theoretically
suggested by the two level-process model (Wing & Kristofferson, 1973) and practically
suggested by experimental studies (Wing, 2002) for tapping with intervals from 200 to
800ms and the latter phenomenon has been found for tapping with longer intervals.
As shown in our results, both IRI at tap contact (IRIC) and at the time of peak
force (IRIP) had the same properties across tapping mode and intervals. The difference in
the variability between the IRIC and IRIP did not emerge as we expected. One reason for
this result could be due to the experimental task we used. No force constraints or
temporal perturbations were used in our study, so subjects did not need to change their
force production. For example, they could use a relative stable time to peak force to (the
time duration between contact and peak force) produce force so that the time difference
between IRIC and IRIP would be very stable. This should not be a problem for
synchronization tapping where there are external cues. In tapping with the external
metronome, subjects correct their taps when they are not perfectly synchronizing the
external cue. If the time of peak force is the temporal control target, the variability of
SEC (SE between the time of contact and the metronome) must be larger than the
variability of SEP (SE between the moment of peak force and the metronome). Indeed
our results were as expected. The SEC at each tap interval was more variable than the
54

SEP. The larger variability of SEC indicated the dynamics of the time at contact: the time
of contact was flexibly changed to minimize the SEP.
The magnitudes of SEP in our study offers further support for the hypothesis that
the time of peak force is the temporal control target during finger tapping. The SEP was
negative, but statistically, the SEP of the tapping with 500 ms interval was not
significantly different from 0. This result is contradictory to negative mean
synchronization error in literature. The range of negative SE in typical young adults
without musical training has been reported to be from -20 ms to -80 ms with individual
differences and musicians have been found to always have smaller or even no SE
(reviewed by Aschersleben, 2002). Although The SEP at 1000 ms and 1500 ms interval
conditions were not 0 statistically, when we checked the density distribution, most of taps
were close to 0 and below the 20ms suggested by previous studies. The non-significant t
test results might be due to the large standard deviation caused by large individual
differences within our sample. The difference of the SE range we found was caused by
the temporal variables we used that were defined at the time of peak force. SE has been
studied based on the moment of initiation in the literature (Hary & Moore, 1987; Keele,
et al., 1987; Semjen, et al., 2000; Semjen, et al., 1998; Thaut, et al., 1998; Wing, 1980),
while we used the SE at the time of peak force. In our study, we asked subjects after the
experiment if they tried to synchronize the time of the peak force or the time of the tap’s
contact to the external metronome. Some participants reported their temporal goal was
the time of the peak force, while a few participants were unable to report what their goal
was. Future studies should test the SEP of tapping within the 200 to 800ms interval to
check if SEPs are still 0 for these ISIs.
55

Different tapping force patterns across tapping mode and intervals
If the time of peak force is the variable that is controlled during finger tapping,
temporal and force control would be related to each other. Indeed, during finger tapping
with temporal requirements but without force constraints, the force production changed
when the temporal requirement changed (i.e. tapping interval).
In our experiment, we found that the variability of most force variables including
impulse, peak force, dwell time and the force increasing rate were larger at 1000ms and
1500ms than those at 500ms. As seen as well for the temporal control variability
(previous section), 1000ms seems to be the critical tapping interval for the variability of
force control, suggesting that the variability of the temporal and force variables might be
related. Other force parameters also depended on the tapping mode or ISI, but it was
difficult to tell which variable was influenced by the temporal property directly because
these force variables are correlated to each other. For example, force increasing rate is the
ratio between peak force and time-to-peak force. The change of force increasing rate
could be caused by the change of peak force, time-to-peak force or both.
It has been claimed that when a subject taps with a specific force magnitude and
preferred frequency, the IRIs are the same across force target including preferred force
(Sternad, et al., 2000). In combination with our results, this may indicate that temporal
control is more stable than force control. Therefore, those force parameters in our study
that changed would reflect the strategies used to optimize the temporal target. For
example, when the previous tap has a large SEP, to minimize the error in the following
tap, one could tap later so that the time of the peak force would be closer to the external
cue. Alternatively, slowly producing the same force for the previous tap or producing
56

larger force using the same speed for force production as the previous tap also could
correct the SEP.
Summary
The results from the present study indicate that the time of a tap’s peak force is
more precisely controlled than the time of the tap’s contact. The variability and
magnitude of the synchronization error are smaller at the former time than the latter. The
latter has been normally used to characterize the temporal control (as defined as inter-
response interval and synchronization error). Different force production strategies were
found across tapping tasks with different modes (with/without metronome) and different
tapping intervals. These results suggest that the tapping temporal control variable is the
time of peak force indicating that the temporal and force control are coupled to each
other. Furthermore, the force control strategies are flexibly adjusted to reach different
temporal targets during finger tapping task.
57

Chapter 4 Limitations And Future Direction
In this study, we examined the temporal-force control relationship in finger
tapping. Our results provide support for two conclusions. The first finding is that in
tapping the temporal control variable is the time of a force parameter – namely, the tap’s
peak force. The other is that force production strategies vary as the temporal targets vary.
In this last chapter, we discuss the limitations and possible future studies on the temporal-
force control relationship suggested by our findings and the limitations of the current
experiment.
Limitations
In the process of conducting the experiment, certain decisions were made that
may influence the results of the present study. First, compared to the literature that uses
the onset of external metronome as the referential time during synchronization tapping,
the entire 30ms duration of metronome was considered in the present study. For example,
if the time of a tap falls within the 30ms duration then the SE is calculated as zero. It is
difficult to determine at which time point the auditory signal (i.e., metronome) is
perceived by the subject and this perception might be different across subjects. Choosing
the entire duration of the metronome controls for the individual differences in perceptual
ability. Secondly, the time point when the force reaches 0.05% of peak force at each tap
was considered as the initial time of contact. The bias estimation of this time point would
be caused by the individual difference of the peak force production, because this time
point changed as the peak force changed, which was not stable across subjects. Finally,
the standard deviation was used to describe the variability of each variable in order to be
consistent with the extant literature. However, the data show large individual differences
58

on some variables’ magnitudes such as peak force and SE so the standard deviation might
not provide as much information as might be found if we had used coefficient of
variation.
Future Direction
Temporal Control Parameter Is the time of Peak Force
Three possible experiments are suggested based on our finding that the variable of
temporal control is the time of peak force. These include looking at musicians (those
with timing expertise), varying the force constraints within the tapping task
(accentuation), and using different effectors to test the generalizibility of the study.
Time of peak force in musicians.
In this study, we found the synchronization error at the time of peak force (SEP)
rather than the synchronization error at the time of contact (SEC) was closer to the
external metronome during synchronization tapping (with metronome). More than half
the subjects showed negative SE closer to zero than the range (-20ms to -80ms) reported
in the literature.(Aschersleben, 2002), even though tapping at 1500ms interval is closer to
the upper limit of sensorimotor synchronization(see Repp, 2005, for a review). Some
subjects also showed a positive SE which is rarely observed in the literature.
Based on our finding, we cannot say definitively that the time of peak force is the
variable of temporal control because our subjects were non-musicians and as such would
not have developed their temporal control abilities for synchronizing movement with
external events. It has been reported that musically training people show less SE than
non-musicians(Aschersleben, 2002), where the SE is defined by the contact time (SEC).
We might assume that a musician would have better sensorimotor synchronization ability
59

than a non-musician, so it is important to know how large the SEP is for musicians. We
would expect the musicians would show an SEP that would be much closer to zero. The
hypothesized result would indicate a strong temporal-force control coupling and this
coupling could be used to explain the negativity of the mean SE reported by the literature.
Time of peak force in continuous tapping (without metronome).
During synchronization tapping task, we found a difference in variability between
the SEC and SEP. This indicates that the SEP is precisely controlled while SEC is not.
The same result was expected for the difference between the variability of inter-response
interval at the time of peak force (IRIP) and the variability of inter-response interval at
the time of contact (IRIC) during continuous tapping. However, they were the same at
each tapping interval. One potential limitation for this finding might be that the tapping
pattern is stable when no force constraints are imposed on the tapping performance. To
determine if the time of peak force is also more precisely controlled than the time of
contact during continuous tapping, force perturbations are needed in a future study by
adding several accentuated taps in the tapping sequence. It is expected that the time of
contact changes while time of peak force would not. It is hypothesized that right before
the accentuate taps, subject might contact the tapping surface earlier to have a longer time
to produce larger force. This will extend our conclusion that the temporal control
parameter is the time of peak force we made for synchronization tapping to the
continuous tapping paradigm.
Time of peak force for different effectors.
Previous studies demonstrated that the foot always leads the finger in tapping for
both the synchronization (Aschersleben & Prinz, 1995; Billon, Bard, et al., 1996) and
60

continuous tapping tasks (Bard, et al., 1992; Billon, Bard, et al., 1996; Stenneken, et al.,
2002) and moreover, the synchronization error for these two effectors are both negative.
The neural-conduction hypothesis was used to explain this phenomenon (Repp, 2005). As
previously mentioned, the time of foot and finger tapping were defined for the time of
contact in these studies. Based on our findings in this study, we would expect that the
tapping of foot and finger would coincide with each other if we consider the time of peak
force as the temporal control variable. This hypothesized result would support our finding
and extent it to generalized tapping movements.
Force Strategies Used in Finger Tapping Task.
Temporal perturbation for error correction.
In the present study, different force patterns were shown during the different
finger tapping tasks. It is suggested that the central timer mechanism is robust for
different force constraints (Sternad, et al., 2000; Therrien & Balasubramaniam, 2010).
Based upon the preceding result that force production varies with different temporal
constraints and the findings in the extant literature, force control is expected to be flexible
so that force production can be adjusted to optimize the temporal control; for example,
for error correction during synchronization tapping. The error correction mechanism for
central timers has been studied for more than 50 years (Repp, 2005). According to the
literature, the central timer estimates the temporal error and adjusts the new tapping
interval in each tap. Rather than adjusting the temporal estimation in the central timer,
our hypothesis would predict that the error correction is made by adjusting the force
rather than to re-estimate the temporal interval in the central timer. By adding temporal
perturbations to the tapping sequence, we expect force production changes to be shown
61

after the perturbation. These hypothesized results would inform our understanding of the
temporal error correction mechanism in the force dimension.
Summary
The first goal for future study is to support the finding that temporal control
variable is the time of peak force and extend it to general tapping movement (such as
using other effectors). If the musician who has much better temporal control ability than
non-musician shows the zero synchronization error at the time of peak force, we would
find additional support for the findings in our study. Moreover, this finding can also be
used to explain why taps that are characterized by the time of contact in literature always
precedes the external events. Furthermore, the properties of the underlying mechanism of
this coupling are not so well understood. Thus, the other aspect for future study should
explore the relationship between time and force control. Based on the current study, we
would propose these experimental goals to extend our knowledge of temporal-force
control and eventually to the temporal-space-force control.
62
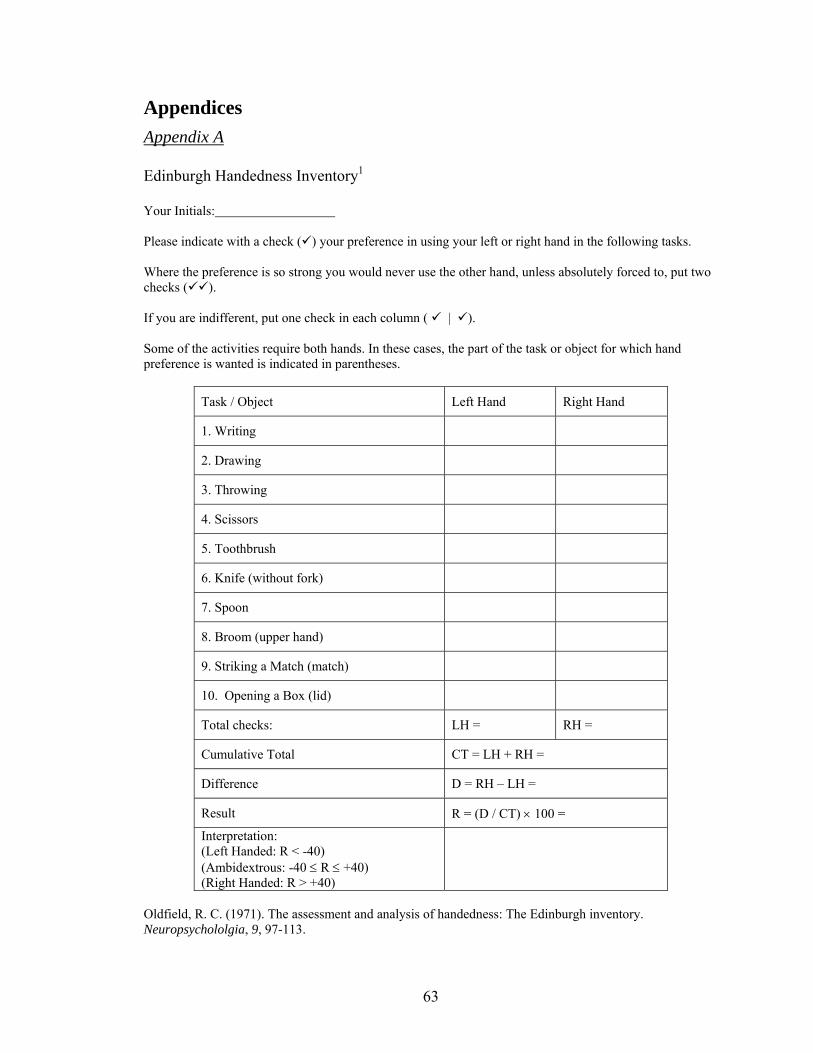
Appendices Appendix A
Edinburgh Handedness Inventory1 Your Initials: Please indicate with a check ( ) your preference in using your left or right hand in the following tasks. Where the preference is so strong you would never use the other hand, unless absolutely forced to, put two checks ( ). If you are indifferent, put one check in each column ( | ). Some of the activities require both hands. In these cases, the part of the task or object for which hand preference is wanted is indicated in parentheses.
Task / Object Left Hand Right Hand
1. Writing
2. Drawing
3. Throwing
4. Scissors
5. Toothbrush
6. Knife (without fork)
7. Spoon
8. Broom (upper hand)
9. Striking a Match (match)
10. Opening a Box (lid)
Total checks: LH = RH =
Cumulative Total CT = LH + RH =
Difference D = RH – LH =
Result R = (D / CT) × 100 =
Interpretation: (Left Handed: R < -40) (Ambidextrous: -40 ≤ R ≤ +40) (Right Handed: R > +40)
Oldfield, R. C. (1971). The assessment and analysis of handedness: The Edinburgh inventory. Neuropsychololgia, 9, 97-113.
63

Appendix B
Adult Neurological Health Questionnaire
Have you ever…(Please circle yes or no) 1) been seen by a neurologist or neurosurgeon? Yes No if yes, please explain___________________________________ 2) had a head injury involving unconsciousness? Yes No if yes, how long?______________________________________ 3) required overnight hospitalization for a head injury? Yes No if yes, please explain?______________________________________ 4) had any illness that caused a permanent decrease in memory or cognition? Yes No if yes, please explain___________________________________ 5) had a seizure? Yes No if yes, please explain___________________________________ 6) had any illness that caused a permanent decrease in motor ability (including speech)? Yes No if yes, please explain___________________________________ 7) had difficulty using your hands? Yes No if yes, please explain___________________________________
64

Appendix C
65

Appendix D
66

Appendix E
Figures:
Figure A. 1: The mean and standard error (SE) for variability of IRIC andIRIP for each tapping condition.
Figure A. 2: The mean and the standard error for the magnitude andvariability of time to end force for each tapping condition.
67

Figure A. 3: The mean and the standard error for the magnitude and variabilityof dwell time for each tapping condition.
Figure A. 4: The mean and the standard error for the magnitude and variabilityof peak force for each tapping condition. The peak force magnitude is in logarithm scale.
68

Figure A. 5: The mean and the standard error for the magnitude andvariability of force increasing rate for each tapping condition. The force increasing rate magnitude is in logarithm scale.
Figure A. 6: The mean and the standard error for the variability of impulsefor each tapping condition. The variability of impulse is in logarithm scale.
69

Bibliography
Aschersleben, G. (2002). Temporal control of movements in sensorimotor
synchronization. Brain and Cognition, 48, 66-79.
Aschersleben, G. (2003). Effects of training on the timing of simple repetitive
movements. In S. P. Shohov (Ed.), Advances in Psychology Research (Vol. 23,
pp. 15-30). Huntington, NY: Nova Science.
Aschersleben, G., Gehrke, J., & Prinz, W. (2001). Tapping with peripheral nerve block -
A role for tactile feedback in the timing of movements. Experimental Brain
Research, 136, 331-339.
Aschersleben, G., & Prinz, W. (1995). Synchronization actions with events - the role of
sensoryinformation. Perception & Psychophysics, 57, 305-317.
Aschersleben, G., & Prinz, W. (1997). Delayed auditory feedback in synchronization.
Journal of Motor Behavior, 29, 35-46.
Balasubramaniam, R., Wing, A. M., & Daffertshofer, A. (2004). Keeping with the beat:
Movement trajectories contribute to movement timing. Experimental Brain
Research, 159, 129-134.
Bard, C., Paillard, J., Lajoie, Y., Fleury, M., Teasdale, N., Forget, R., et al. (1992). Role
of afferent information in the timing of motor commands - a comparative-study
with a deafferented patient. Neuropsychologia, 30, 201-206.
Białuńska, A., Bella, S. D., & Jaśkowski, P. (2011). Increasing stimulus intensity does
not affect sensorimotor synchronization. Psychological Research, 75, 43-53.
70

Billon, M., Bard, C., Fleury, M., Blouin, J., & Teasdale, N. (1996). Simultaneity of two
effectors in synchronization with a periodic external signal. Human Movement
Science, 15, 25-38.
Billon, M., & Semjen, A. (1995). The timing effects of accent production in
synchronization and continuous tasks performed by musicians and nonmusicians.
Psychological Research-Psychologische Forschung, 58, 206-217.
Billon, M., Semjen, A., & Stelmach, G. E. (1996). The timing effects of accent
production in periodic finger-tapping sequences. Journal of Motor Behavior, 28,
198-210.
Bo, J., Bastian, A. J., Contreras-Vidal, J. L., Kagerer, F. A., & Clark, J. E. (2008).
Continuous and discontinuous drawing: High temporal variability exists only in
discontinuous circling in young children. Journal of Motor Behavior, 40, 391-
399.
Bo, J., Bastian, A. J., Kagerer, F. A., Contreras-Vidal, J. L., & Clark, J. E. (2008).
Temporal variability in continuous versus discontinuous drawing for children
with Developmental Coordination Disorder. Neuroscience Letters, 431, 215-220.
Buhusi, C. V., & Meck, W. H. (2005). What makes us tick? Functional and neural
mechanisms of interval timing. Nature Reviews Neuroscience, 6, 755-765.
Delignieres, D., Lemoine, L., & Torre, K. (2004). Time intervals production in tapping
and oscillatory motion. Human Movement Science, 23, 87-103.
Delignieres, D., Ramdani, S., Lemoine, L., Torre, K., Fortes, M., & Ninot, G. (2006).
Fractal analyses for 'short' time series: A re-assessment of classical methods.
Journal of Mathematical Psychology, 50, 525-544.
71

Delignieres, D., Torre, K., & Lemoine, L. (2008). Fractal models for event-based and
dynamical timers. Acta Psychologica, 127, 382-397.
Delignieres, D., Torre, K., & Lemoine, L. (2009). Long-range correlation in
synchronization and syncopation tapping: A linear phase correction model. Plos
One, 4.
Ding, M. Z., Chen, Y. Q., & Kelso, J. A. S. (2002). Statistical analysis of timing errors.
Brain and Cognition, 48, 98-106.
Drewing, K., & Aschersleben, G. (2003). Reduced timing variability during bimanual
coupling: A role for sensory information. Quarterly Journal of Experimental
Psychology Section a-Human Experimental Psychology, 56, 329-350.
Drewing, K., Aschersleben, G., & Li, S. C. (2006). Sensorimotor synchronization across
the life span. International Journal of Behavioral Development, 30, 280-287.
Drewing, K., Hennings, M., & Aschersleben, G. (2002). The contribution of tactile
reafference to temporal regularity during bimanual finger tapping. Psychological
Research-Psychologische Forschung, 66, 60-70.
Dunlap, K. (1910). Reaction to rhythmic stimuli with attempt to synchronize.
Psychological Review, 17, 399-416.
Fitts, P. M. (1954). The information capacity of the human motor system in controlling
the amplitude of movement. Journal of Experimental Psychology, 47, 381-391.
Franz, E. A., Ivry, R. B., & Helmuth, L. L. (1996). Reduced timing variability in patients
with unilateral cerebellar lesions during bimanual movements. Journal of
Cognitive Neuroscience, 8, 107-118.
72

Goebl, W., & Palmer, C. (2008). Tactile feedback and timing accuracy in piano
performance. Experimental Brain Research, 186, 471-479.
Greene, L. S., & Williams, H. G. (1993). Age-related differences in timing control of
repetitive movement - Application of the Wing-Kristorfferson model. Research
Quarterly for Exercise and Sport, 64, 32-38.
Grondin, S. (2010). Timing and time perception: A review of recent behavioral and
neuroscience findings and theoretical directions. Attention, Perception, &
Psychophysics, 72, 561-582.
Hary, D., & Moore, G. P. (1987). Synchronizing human movement with an external clock
source. Biological Cybernetics, 56, 305-311.
Helmuth, L. L., & Ivry, R. B. (1996). When two hands are better than one: Reduced
timing variability during bimanual movements. Journal of Experimental
Psychology-Human Perception and Performance, 22, 278-293.
Huxley, A. F. (1957). Muscle structure and theories of contraction. Progress in
Biophysics & Molecular Biology, 7, 255-318.
Inui, N., & Ichihara, T. (2001). Comparison of the relation between timing and force
control during finger-tapping sequences by pianists and nonpianists. Motor
Control, 5, 385-398.
Inui, N., Ichihara, T., Minami, T., & Matsui, A. (1998). Interactions: Timing and force
control of finger-tapping sequences. Perceptual and Motor Skills, 86, 1395-1401.
Ivry, R. B. (1996). The representation of temporal information in perception and motor
control. Current Opinion in Neurobiology, 6, 851-857.
73

Ivry, R. B., Keele, S. W., & Diener, H. C. (1988). Dissociation of the lateral and medial
cerebellum in movement timing and movement execution. Experimental Brain
Research, 73, 167-180.
Ivry, R. B., & Richardson, T. C. (2002). Temporal control and coordination: The multiple
timer model. Brain and Cognition, 48, 117-132.
Ivry, R. B., Spencer, R. M., Zelaznik, H. N., & Diedrichsen, J. (2002). The cerebellum
and event timing. In T. M. Highstein & W. T. Thach (Eds.), Cerebellum: Recent
Developments in Cerebellar Research (Vol. 978, pp. 302-317). New York: New
York Academic Sciences.
Ivry, R. B., & Spencer, R. M. C. (2004). The neural representation of time. Current
Opinion in Neurobiology, 14, 225-232.
Johnson, W. S. (1899). Researches in practice and habit. Science, 10, 527-529.
Keele, S. W., Ivry, R. I., & Pokorny, R. A. (1987). Force control and its relation to
timing. Journal of Motor Behavior, 19, 96-114.
Krause, V., Pollok, B., & Schnitzler, A. (2010). Perception in action: The impact of
sensory information on sensorimotor synchronization in musicians and non-
musicians. Acta Psychologica, 133, 28-37.
Lemoine, L., Torre, K., & Delignieres, D. (2006). Testing for the presence of 1/f noise in
continuation tapping data. Canadian Journal of Experimental Psychology-Revue
Canadienne De Psychologie Experimentale, 60, 247-257.
Loehr, J. D., & Palmer, C. (2009). Subdividing the beat: auditory and motor contribution
to synchronization. Music Perception, 26, 415-425.
74

Madison, G. (2001). Variability in isochronous tapping: Higher order dependencies as a
function of intertap interval. Journal of Experimental Psychology-Human
Perception and Performance, 27, 411-422.
Mates, J. (1994a). A model of synchronization of motor acts to a stimulus sequence .1.
Timing and error corrections. Biological Cybernetics, 70, 463-473.
Mates, J. (1994b). A model of synchronization of motor acts to a stimulus sequence: II.
Stability analysis, error estimation and simulations. Biological Cybernetics, 70,
475-484.
Mates, J., & Aschersleben, G. (2000). Sensorimotor synchronization: the impact of
temporally displaced auditory feedback. Acta Psychologica, 104, 29-44.
Mates, J., Muller, U., Radil, T., & Poppel, E. (1994). Temporal integration in
sensorimotor synchronization. Journal of Cognitive Neuroscience, 6, 332-340.
Newell, K. M., & Carlton, L. G. (1985). On The relationship between peak force and
peak force variability in isometric tasks. Journal of Motor Behavior, 17, 230-241.
Oldfield, R. C. (1971). The assessment and analysis of handness: The edinburgh
inventory. Neuropsychologia, 9, 97-113.
Patel, A. D., Iversen, J. R., Bregman, M. R., & Schuiz, I. (2009). Experimental evidence
for synchronization to a musical beat in a nonhuman animal. Current Biology, 19,
827-830.
Peters, M. (1989). The relationship between variability of intertap intervals and interval
duration. Psychological Research-Psychologische Forschung, 51, 38-42.
75

Piek, J. P., & Skinner, R. A. (1999). Timing and force control during a sequential tapping
task in children with and without motor coordination problems. Journal of the
International Neuropsychological Society, 5, 320-329.
Pressing, J. (1998). Error correction processes in temporal pattern production. Journal of
Mathematical Psychology, 42, 63-101.
Pressing, J. (1999). The referential dynamics of cognition and action. Psychological
Review, 106, 714-747.
Repp, B. H. (2005). Sensorimotor synchronization: A review of the tapping literature.
Psychonomic Bulletin & Review, 12, 969-992.
Repp, B. H., & Doggett, R. (2007). Taping to a very slow beat: A comparison of
musicians and nonmusicians. Music Perception, 24, 367-376.
Roberts, S., Eykholt, R., & Thaut, M. H. (2000). Analysis of correlations and search for
evidence of deterministic chaos in rhythmic-motor control by the human brain.
Physical Review E, 62, 2597-2607.
Rousanoglou, E. N., & Boudolos, K. D. (2006). Rhythmic performance during a whole
body movement: Dynamic analysis of force-time curves. Human Movement
Science, 25, 393-408.
Schmidt, R. A., Zelaznik, H., Hawkins, B., Frank, J. S., & Quinn, J. T. (1979). Motor-
output variability - theory for the accuracy of rapid motor acts. Psychological
Review, 86, 415-451.
Schoner, G. (2001). Timing, clocks, and dynamical systems. Brain and Cognition, 48,
31-51.
76

Schulze, H. H., & Vorberg, D. (2002). Linear phase correction models for
synchronization: Parameter identification and estimation of parameters. Brain and
Cognition, 48, 80-97.
Semjen, A., Schulze, H. H., & Vorberg, D. (2000). Timing precision in continuation and
synchronization tapping. Psychological Research-Psychologische Forschung, 63,
137-147.
Semjen, A., Vorberg, D., & Schulze, H. H. (1998). Getting synchronized with the
metronome: Comparisons between phase and period correction. Psychological
Research-Psychologische Forschung, 61, 44-55.
Spencer, R. M. C., Ivry, R. B., & Zelaznik, H. N. (2005). Role of the cerebellum in
movements: control of timing or movement transitions? Experimental Brain
Research, 161, 383-396.
Stein, R. B. (1982). What muscle variable(s) does the nervous system control in limb
movements? The Behavioral And Brain Science, 5, 535-577.
Stenneken, P., Aschersleben, G., Cole, J., & Prinz, W. (2002). Self-induced versus
reactive triggering of synchronous movements in a deafferented patient and
control subjects. Psychological Research-Psychologische Forschung, 66, 40-49.
Stenneken, P., Prinz, W., Cole, J., Paillard, J., & Aschersleben, G. (2006). The effect of
sensory feedback on the timing of movements: Evidence from deafferented
patients. Brain Research, 1084, 123-131.
Sternad, D., Dean, W. J., & Newell, K. M. (2000). Force and timing variability in
rhythmic unimanual tapping. Journal of Motor Behavior, 32, 249-267.
Stevens, L. T. (1886). On the time sense. Mind, 11, 393-404.
77

Thaut, M. H. (2003). Neural basis of rhythmic timing - Networks in the human brain.
Neurosciences and Music, 999, 364-373.
Thaut, M. H., Miller, R. A., & Schauer, L. M. (1998). Multiple synchronization strategies
in rhythmic sensorimotor tasks: phase vs period correction. Biological
Cybernetics, 79, 241-250.
Therrien, A. S., & Balasubramaniam, R. (2010). Timing and visual feedback constraints
on repetitive finger force production. Experimental Brain Research, 201, 673-
679.
Torre, K., Delignieres, D., & Lemoine, L. (2007). Detection of long-range dependence
and estimation of fractal exponents through ARFIMA modelling. British Journal
of Mathematical & Statistical Psychology, 60, 85-106.
Vaughan, J., Rosenbaum, D. A., Diedrich, F. J., & Moore, C. M. (1996). Cooperative
selection of movements: The optimal selection model. Psychological Research-
Psychologische Forschung, 58, 254-273.
Vorberg, D., & Schulze, H. H. (2002). Linear phase-correction in synchronization:
Predictions, parameter estimation, and simulations. Journal of Mathematical
Psychology, 46, 56-87.
Vorberg, D., & Wing, A. (1996). Modeling variability and dependence in timing. In H.
Heuer & S. W. Keele (Eds.), Handbook of perception and action (Vol. 2, pp.
181-262). London: Academic Press.
Wing, A. M. (1980). The long and short of timing in response sequences. In G. E.
Stelmach & J. Requin (Eds.), Tutorial in motor behaviour (pp. 469-486).
Amsterdam: North-Holland.
78

79
Wing, A. M. (2002). Voluntary timing and brain function: An information processing
approach. Brain and Cognition, 48, 7-30.
Wing, A. M., & Kristofferson, A. B. (1973). Response delays in the timing of discrete
motor responses. Perception & Psychophysic, 14, 5-12.
Yoshinaga, H., Miyazima, S., & Mitake, S. (2000). Fluctuation of biological rhythm in
finger tapping. Physica A, 280, 582-586.
Zelaznik, H. N., Spencer, R. M. C., & Ivry, R. B. (2002). Dissociation of explicit and
implicit timing in repetitive tapping and drawing movements. Journal of
Experimental Psychology-Human Perception and Performance, 28, 575-588.