Embed Size (px)
Citation preview

ABSTRACT
CHOI, WONCHANG. Flexural Behavior of Prestressed Girder with High Strength Concrete. (Under the direction of Dr. Sami Rizkalla)
The advantages of using high strength concrete (HSC) have led to an increase in the typical
span and a reduction of the weight of prestressed girders used for bridges. However, growing
demands to utilize HSC require a reassessment of current provisions of the design codes. The
objective of one of the research projects, recently initiated and sponsored by the National
Cooperative Highway Research Program (NCHRP), NCHRP Project 12-64, conducted at
North Carolina State University is to extend the use of the current AASHTO LRFD design
specifications to include compressive strength up to 18,000 psi (124 MPa) for reinforced and
prestressed concrete members in flexure and compression. This thesis deals with one part of
this project. Nine full-size AASHTO girders are examined to investigate the behavior of
using different concrete compressive strength and subjected to the flexural loadings. The
experimental program includes three different configurations of prestressed girders with and
without a deck slab to investigate the behavior for the following cases: 1) the compression
zone consists of normal strength concrete (NSC) only; 2) the compression zone consists of
HSC only; and 3) the compression zone consists of a combination of two different strengths
of concrete. An analytical model is developed to determine the ultimate flexural resistance
for prestressed girders with and without normal compressive strength concrete. The research
also includes investigation of the transfer length and the prestress losses of HSC prestressed
girders. Based on materials testing and extensive data collected from the literature, a new
equation is proposed to calculate the elastic modulus for normal and high strength concrete.

FLEXURAL BEHAVIOR OF PRESTRESSED GIRDER WITH HIGH STRENGTH CONCRETE
By
Wonchang Choi
A dissertation submitted to the Graduate Faculty of North Carolina State University
in partial fulfillment of the requirement for the degree of
Doctor of Philosophy
Civil Engineering
Raleigh, North Carolina
2006
Approved by:
Dr. Sami Rizkalla
Chair of Advisory Committee Civil Engineering
Dr. Paul Zia
Advisory Committee Civil Engineering
Dr. Amir Mirmiran Advisory Committee
Civil Engineering
Dr. Kara Peters Advisory Committee
Mechanical Engineering

ii
BIOGRAPHY
Wonchang Choi obtained a Bachelor’s Degree in Chemistry from Kyung Hee University,
and a second Bachelor’s Degree in Civil Engineering from Hongik University, Seoul Korea.
He continued his studies in structures and completed research with the use fiber reinforced
polymer girder for compression members, completing his Master’s Degree in 2002.
In 2003, he relocated to Raleigh, North Carolina State University under the supervision of Dr.
Sami Rizkalla to pursue his Doctor of Philosophy.

iii
ACKNOWLEGEMENTS
It would have been impossible to complete this dissertation without the intellectual,
emotional and financial support and friendship of my advisor, my colleague and my family.
It is with sincere gratitude that I thank my advisor, Dr. Sami Rizkalla, for his continuous
supervision and mentoring. I would also like to thank Dr. Paul Zia for providing valuable
insight. It is truly an honor to work with such an outstanding man who is willing to share his
wealth of knowledge and his extensive personal experience. Thanks are extended to Dr. Amir
Mirmiran for providing an opportunity to join this research program.
The technical assistance provided by the staff of the Constructed Facilities Laboratory (Bill
Dunleavy, Jerry Atkinson, and Amy Yonai) are greatly appreciated. Thanks are extended to
all of my fellow graduate students at the Constructed Facilities Laboratory for their help and
friendship. Special thanks are extended to Mina Dawood, as my officemate who was a
tremendous help to encourage me.
And lastly, I sincerely thank my parent and my lovely wife. I couldn’t imagine standing here
without their unconditional love and support.
I know that this thesis is not the conclusion, but rather the starting point.

iv
TABLE OF CONTENTS
LIST OF FIGURES ............................................................................................................v LIST OF TABLES ............................................................................................................vii 1 INTRODUCTION .......................................................................................................1
1.1 GENERAL ...............................................................................................................1 1.2 OBJECTIVES............................................................................................................2 1.3 SCOPE ....................................................................................................................3
2 LITERATURE REVIEW ...........................................................................................6 2.1 INTRODUCTION.......................................................................................................6 2.2 MATERIAL PROPERTIES ..........................................................................................8 2.3 STRESS BLOCK PARAMETERS ................................................................................12 2.4 PRESTRESS LOSSES ...............................................................................................14 2.5 FLEXURAL BEHAVIOR OF GIRDERS WITH HIGH STRENGTH CONCRETE....................16
3 EXPERIMENTAL PROGRAM ...............................................................................18 3.1 INTRODUCTION.....................................................................................................18 3.2 DESIGN OF THE TEST SPECIMENS...........................................................................18 3.3 FABRICATION OF TEST SPECIMENS ........................................................................22 3.4 INSTRUMENTATION...............................................................................................29 3.5 MATERIAL PROPERTIES ........................................................................................35 3.6 FLEXURAL TEST DETAILS .....................................................................................45
4 RESULTS AND DISCUSSION ................................................................................54 4.1 INTRODUCTION.....................................................................................................54 4.2 MATERIAL PROPERTIES STUDY .............................................................................55 4.3 PRESTRESS LOSSES ...............................................................................................65 4.4 TRANSFER LENGTH...............................................................................................72 4.5 CAMBER...............................................................................................................74 4.6 FLEXURAL RESPONSE ...........................................................................................75
5 ANALYTICAL MODEL ........................................................................................100 5.1 INTRODUCTION...................................................................................................100 5.2 CODE PROVISONS ...............................................................................................101 5.3 SECTION ANALYSIS ............................................................................................120
6 SUMMARY AND CONCLUSIONS.......................................................................135 6.1 SUMMARY ..........................................................................................................135 6.2 CONCLUSIONS ....................................................................................................136 6.3 RECOMMENDATION AND FUTURE WORK .............................................................140
v
LIST OF FIGURES
Figure 3-1 Cross-section showing prestressing strand configurations...................................21 Figure 3-2 Prestressing bed: a) Elevation schematic view of prestressing bed, b) Strand lay-
out, c) Pretensioning ..........................................................................................24 Figure 3-3 Sequence of girder fabrication............................................................................26 Figure 3-4 Formwork for the 5 ft. and 1 ft. wide deck slabs.................................................28 Figure 3-5 Load cell installation..........................................................................................30 Figure 3-6 Locations of weldable strain gauges ...................................................................33 Figure 3-7 Installation of weldable strain gauge ..................................................................34 Figure 3-8 Installation of the strain gauges attached to #3 steel rebar...................................35 Figure 3-9 Specimen preparation and test set-up for elastic modulus ...................................39 Figure 3-10 Test set-up for elastic modulus and modulus of rupture ....................................40 Figure 3-11 Material property for prestressing strand ..........................................................44 Figure 3-12 Test set-up schematic .......................................................................................45 Figure 3-13 Typical test set-up for nine AASHTO girder specimens ...................................46 Figure 3-14 Location of LMTs to measure deflections.........................................................49 Figure 3-15 Location of Strain and PI gages for 10PS – 5S, 14PS- 5S and 18PS-5S ............50 Figure 3-16 Location of Strain and PI gages for 10PS–1S, 14PS-1S and 18PS-1S...............51 Figure 3-17 Location of Strain and PI gages for 10PS-N, 14PS–N and 18PS-N...................53 Figure 4-1 Comparison of the elastic modulus between test results and predicted value.......57 Figure 4-2 Comparison between predicted E and measured E with various equations; a)
AASHTO LRFD and ACI318; b)ACI363R; c) Cook’s; d) Proposed ..................59 Figure 4-3 Normal distribution for the ratio of predicted to measured elastic modulus.........62 Figure 4-4 Modulus of rupture versus compressive strength ................................................64 Figure 4-5 Load-deflection behavior for 10, 14, 18PS-5S....................................................76 Figure 4-6 Strain envelopes for 18PS-5S.............................................................................78 Figure 4-7 Moment – N.A. depth location for 10PS – 5S, 14PS – 5S and 18PS – 5S ...........80 Figure 4-8 Typical failure mode for the AASHTO girder with a 5 ft. wide deck ..................81 Figure 4-9 Load-deflection behavior for 10PS – 1S, 14PS – 1S and 18PS-1S ......................84 Figure 4-10 Strain envelopes for 10PS-1S ...........................................................................86 Figure 4-11 Moment – N.A. depth location for 10PS – 1S, 14PS – 1S and 18PS – 1S .........88 Figure 4-12 Typical failure modes for the AASHTO girder with a 1 ft. wide deck...............90 Figure 4-13 Load-deflection behavior for 10PS - N, 14PS – N and 18PS-N.........................92 Figure 4-14 Strain envelopes for 18PS-N ............................................................................94 Figure 4-15 Moment – N.A. depth location for 10PS - N, 14PS – N and 18PS - N ..............96 Figure 4-16 Typical failure modes for the AASHTO girder without deck............................97 Figure 4-17 Ultimate strain at peak load for tested AASHTO girders ..................................99 Figure 5-1 Cracking strength ratio for three different calculations .....................................104 Figure 5-2 Compressive stress distribution (a) cross-section; (b) strain compatibility; (c)
meausred strain-stress distribution in compression zone; (d) the equivalent rectangular stress block in compression zone ...................................................111

vi
Figure 5-3 Compressive stress distribution (a) cross-section; (b) strain compatibility (c) measured strain-stress distrubution in compression zone, (d) simplified stress distribution (e) the equvalent rectagular stress block ........................................114
Figure 5-4 Compressive stress distribution (a) cross-section; (b) strain compatibility; (c) measured strain-stress distribution in compression zone; (d) the equivalent rectangular stress block....................................................................................116
Figure 5-5 Failure evaluation for each configuration .........................................................118 Figure 5-6 Cross-section and assumed strain profile for 18PS - 5S ....................................121 Figure 5-7 Measured stress-strain behavior of 10PS-5S and a best-fit curve with analytical
model...............................................................................................................124 Figure 5-8 Definition of the four factors adopted from Collins (1997) ...............................127 Figure 5-9 Analytical modeling of the prestressing strand .................................................127 Figure 5-10 Measured and predicted load deflection responses..........................................130 Figure 5-11 Measured and predicted load deflection responses..........................................131 Figure 5-12 Measured and predicted load deflection responses..........................................132 Figure 5-13 Flexural strength ratio of the measured versus predicted results......................134

vii
LIST OF TABLES
Table 3.1 Detailed Design of the Test Specimens ................................................................20 Table 3.2 Construction Sequence Summary ........................................................................23 Table 3.3 Measured Data from Load Cells ..........................................................................31 Table 3.4 Order of Prestressing Strands and Elongation ......................................................32 Table 3.5 Detailed Mix Design for Girder Specimens..........................................................36 Table 3.6 Concrete Properties for Girder Specimens............................................................37 Table 3.7 Concrete Mix Design for Deck Slab.....................................................................38 Table 3.8 Concrete Properties for Cast-in-place Deck..........................................................38 Table 3.9 Test Results for Material Properties .....................................................................42 Table 3.10 Compressive Strength Test for Deck Concrete ...................................................42 Table 3.11 Material Property for Each AASHTO Girder Specimen .....................................43 Table 4.1 Range of the Collected Data ................................................................................58 Table 4.2 Results of Statistical Analysis ..............................................................................61 Table 4.3 Elastic Shortening at Transfer ..............................................................................68 Table 4.4 Creep and Shrinkage Prediction Relationships by AASHTO LRFD.....................70 Table 4.5 Test Results for Prestressed Losses at Test Day ...................................................71 Table 4.6 Summary of End Slippage and Transfer Length...................................................73 Table 4.7 Summary of Camber Results ...............................................................................74 Table 4.8 Observed Test Results for 10PS–5S, 14PS–5S and 18PS-5S................................76 Table 4.9 Observed Test Results for 10PS-1S, 14PS–1S and 18PS-1S.................................84 Table 4.10 Observed Test Results for 10PS-N, 14PS–N and 18PS-N ..................................93 Table 5.1 Comparison between Observed and Computed Cracking Strength .....................103 Table 5.2 Calculation Method for the Flexural Strength ....................................................106 Table 5.3 Comparison of Design Calculation ....................................................................110 Table 5.4 Design Calculations for Composite AASHTO Girders.......................................112 Table 5.5 Design Calculation for Composite AASHTO Girders ........................................115 Table 5.6 Design Calculation for AASHTO Girders without a Deck .................................117 Table 5.7 Failure Evaluation for All Specimens.................................................................119 Table 5.8 Concrete Material Model for the Specimens ......................................................125

Chapter 1 Introduction
1
1 INTRODUCTION
1.1 GENERAL
1.1.1 High Performance versus High Strength Concrete
The performance of concrete has been improved through the use of chemical and mineral
admixtures such as fly ash, slag, silica fume, and high-range water reducing agents. These
admixtures have the potential to influence particular properties of concrete and, as such,
influence the compressive strength, control of hardening rate, workability, and durability of
the concrete. Thus, more rigid criteria are needed to define the performance of concrete.
Zia (1991), in a study undertaken through the Strategic Highway Research Program (SHRP),
defines high performance concrete (HPC) by using three requirements: a maximum water-
cementitious ratio less than 0.35; a minimum durability factor of 80 percent, and a minimum
compressive strength. Russell (1999) states that HPC in the ACI definition is that “concrete
meeting special combinations of performance and uniformity requirements that cannot
always be achieved routinely using conventional constituents and normal mixing, placing,
and curing practices.” Neville (4th Edition) specifies that HPC includes two major properties,
high compressive strength and low permeability.
The term, high performance concrete, may be a more comprehensive expression than high
strength concrete. However, this project focuses on the behavior of high compressive
strength. Therefore, instead of high performance concrete, the term, high strength concrete
(HSC), is used in this study.

Chapter 1 Introduction
2
1.1.2 High Strength Concrete
Research by Carasquillo et al. (1981) on HSC highlighted the uncertainty and potential
inaccuracy of using current code provisions that have been developed for normal concrete
strength. Accordingly, several studies have been conducted to gain a better understanding of
HSC flexural members including prestressed concrete girders. However, the definition and
boundaries of HSC contain too many ambiguities to specify stringent conditions. Therefore,
many specifications mainly specify the compressive strength for HSC. According to the ACI
363R State-of the Art Report on High Strength Concrete (1992), the definition of HSC is
based on the compressive strength of 6,000 psi (41 MPa) or greater at the age of 28-day.
However, one must note that the definition of HSC has changed over the years and will no
doubt continue to change.
1.2 OBJECTIVES
The main objective of this research is to evaluate the behavior of prestressed concrete girder
with high strength concrete with and without a cast-in-place normal strength deck slab. The
specific objective can be summarized as follows:
1. Due to the lack of complete knowledge of the material properties of HSC, the
prediction of the material properties using current design specifications may be
inaccurate in determining the behavior and the strength. This may include unreliable
predictions of the cracking strength and ultimate flexural strength. This introduced the

Chapter 1 Introduction
3
needs for reassessment of the material properties of HSC using more accurate test
results.
2. This research program proposes to validate the analytical models typically used to
determine the flexural response of prestressed HSC AASHTO type girders with and
without a cast-in-place normal strength deck. The intent of the tests is to validate the
use of stress block parameters in calculating the flexural resistance of flanged sections
with HSC. This experiment also investigates the effect of the presence of normal
strength deck in composite action with HSC girders.
3. Evaluate the applicability of the current code equations to predict the prestress losses
in HSC girders, including recently proposed equations by Tadors (2003), based on the
measured prestress losses of prestressed concrete girders.
4. Provide recommendations for the design of prestressed concrete girders with HSC.
1.3 SCOPE
To study the behavior and prestress loss of prestressed high strength concrete girder, a total
of nine AASHTO type II girders were tested with and without normal strength concrete deck
slab.
All girders were simply supported with 40 ft. long. The nine AASHTO Type II girders were
fabricated and tested up to failure under static loading conditions using four-point loading.
Chapter 1 Introduction
4
Three girders were cast without a concrete deck. Therefore, the entire section consists of
HSC only. The rest of the girders were cast with a concrete deck. The concrete decks were
cast at the Constructed Facilities Laboratory (CFL) at North Carolina State University,
Raleigh, NC after the girders were fabricated. The design concrete strengths for the nine
girders ranged from 10,000 psi (69 MPa) to 18,000 psi (124 MPa). The concrete strength of
the cast-in-place deck was in the range of 4,000 psi (28 MPa).
The flexural response of the prestressed girders was investigated in a three-phase
experimental research program. In the first phase, three HSC AASHTO with three different
target strength and a cast-in-place NSC deck were fabricated. This allowed the compression
zone will be located within the NSC deck slab. In the second phase, included three
prestressed girders with HSC and the narrow width cast-in-place NSC deck. Therefore, the
compression zone consists of HSC and NSC. In the third phase, three prestressed girder with
HSC without deck slab was subjected to flexure to study the behavior when the entire
compression zone consisted of HSC only.
The nine girders were extensively instrumented to measure the different limit states including
cracking and deflections at various loading stages, as well as prestress losses measurements.
The research includes modeling of the behavior of the prestressed girders based on strain
compatibility and equilibrium approach. The measured values were also compared to the
predictions according to code equations. Based on the findings, design model is proposed for
the prediction of the ultimate moment resistance of HSC prestressed girders.

Chapter 1 Introduction
5
Chapter 2 of this thesis presents a relevant literature review of the flexural behavior of
prestressed AASHTO girders with HSC. The literature review includes material properties,
stress block parameters, prestress losses, and the flexural behavior of HSC girders.
Chapter 3 of this thesis describes in details the experimental program, including design
considerations, fabrication procedures of the prestressed AASHTO girders, instrumentation,
the flexural test setup, and separate test results for each phase.
Chapter 4 summarizes the test results and discussion the material properties, transfer length,
prestress losses and flexural response of the tested girders under static loading conditions.
Chapter 5 presents the analytical model for the flexural behavior of the prestressed concrete
girders using HSC. A comparison of the measured and computed values is discussed.
The summary and conclusion of the research program are presented in Chapter 6.

Chapter 2 Literature Review
6
2 LITERATURE REVIEW
2.1 INTRODUCTION
High strength concrete has been used and studied as a workable construction material for
several decades. In the United States, HSC was applied to major prestressed girders in 1949.
Walnut Lane Bridge in Philadelphia was the first bridge reported to use HSC in its design
and construction (Russell, 1997). This bridge was constructed with a 160 ft. center main span
with two 74 ft. side spans. The required strength of 5,400 psi (37 MPa) was obtained in 14 to
17 days. Zollman (1951) reported that the compressive strength at 28 days was usually high
about 6,500 psi (45 MPa). ACI 363R-97 notes that concrete with a compressive strength of
5,000 psi (34 MPa) was considered to be HSC in the 1950s. However, at about that same
time, the introduction of prestress design methods would have been considered to be more
remarkable than the use of HSC. The development of high-range water reducing admixtures
in the 1960s and further improvements of material technology increased the possibilities for
HSC production in the construction industry.
From the late 1970s, the major research into the application of prestressed bridge girders
using HSC was conducted at Cornell University, the Louisiana Transportation Research
Center, the University of Texas at Austin, North Carolina State University, the Portland
Cement Association and Construction Technology Laboratory, the Minnesota Department of
Transportation and others. In general, this research focused on three subjects: the
development of concrete mix designs to produce HSC using regional materials; the
assessment of equations used to predict the material properties of HSC; and the application of
prestressed girders with HSC, including cost effectiveness.

Chapter 2 Literature Review
7
Additional research (Law and Rasoulian, 1980; Cook, 1989; Adelamn and Cousins, 1990)
shows that concrete compressive strength in excess of 10,000 psi (69 MPa) using regional
materials can be produced by the construction industry. In addition to mix design
development, an increase in concrete design compressive strength, from 6,000 psi (41 MPa)
to 10,000 psi (69 MPa), results in an average 10 percent increase in span capability for
prestressed girders used in routine bridge design (Adelamn and Cousins, 1990). For this type
of bridge construction, it has been shown that an increase in concrete strength and stiffness
can also result in increased cost effectiveness.
Concrete with a compressive strength of 10,000 psi (69 MPa) can now be routinely produced
commercially. Based on HSC’s advantages, the application of prestressed girders with HSC
has increased in the United States. Moreover, the need for a reassessment of current design
code has broadened.
This section provides a description of selected test results and the design parameters for
predicting the flexural behavior of prestressed girders with HSC. Topics in this section
include: 1) material properties, 2) stress block parameters, 3) prestress losses and 4) the
flexural behavior of girders with HSC.
Chapter 2 Literature Review
8
2.2 MATERIAL PROPERTIES
The material properties of HSC constitute the essential factors in the design and analysis of
longer bridge spans due to the increasing use of HSC in such bridge design. A more accurate
prediction methodology for the material properties of HSC is required to determine prestress
losses, deflection and camber, etc. Many researchers have proposed methods for the
prediction of material properties for HSC. This section addresses the major findings related
to the material properties for HSC.
2.2.1 Pauw (1960)
The ACI Committee 318 Building Code (ACI 318-77) has accepted the findings of Pauw
(1960) for the elastic modulus. Pauw utilized other researchers’ test results for the modulus
of elasticity and derived the empirical equation for normal-weight concrete by using the least
squares method based on a function of the unit weight and compressive strength of concrete.
The proposed empirical modulus of elasticity, Ec, equation shows good agreement for the
normal-weight concrete. These equations are recommended in the current ACI 318 Building
Code and in the AASHTO LRFD specifications. They are given as:
( ) 5.05.133 cc fwE ′⋅⋅= (psi) and Equation 2-1
( ) 5.05.1043.0 cc fwE ′⋅⋅= (MPa) , Equation 2-2 where wc = dry unit weight of concrete at time of test;
fc' = compressive strength of concrete.

Chapter 2 Literature Review
9
2.2.2 Carasquillo et al. (1981)
Research into HSC was conducted at Cornell University by Carasquillo et al. (1981). The
ACI Committee 363’s State-of-the-Art Report of High-Strength Concrete (ACI 363R-84
1984) accepted the findings of their research as well as their proposed equations for the
elastic modulus and the modulus of rupture for HSC. The Carasquillo team investigated the
compressive concrete strength range from about 3,000 to 11,000 psi (21 to 76 MPa).
Carasquillo et al. suggested that the ACI 318-77 equations, based on the proposal of Pauw
(1960), overestimate the modulus of elasticity for HSC ranging from 6,000 psi (41 MPa) or
more because the stiffness of the concrete is due to a combination of mortar and aggregate
strength. The Carasquillo study also discusses the effects of coarse aggregate type and
proportions on the modulus of rupture and the modulus of elasticity. However, no
consideration was given to the effects of the use of different aggregates on the modulus.
Regarding the Poisson’s ratio of concrete, Carasquillo et al. state that the value of Poisson’s
ratio of concrete is close to 0.2 regardless of the compressive strength or the age of the test.
Currently, ACI 363R-97 relates these properties to the specified compressive strength
ranging from 3,000 psi (21 MPa) to 12,000 psi (83 MPa) and still accepts the Carasquillo
research results. The equations are given below for the elastic modulus, Ec and modulus of
rupture, fr are;
( )[ ] ( ) 5.165.0 14510000,40 ccc wfE ⋅+′⋅= (psi), Equation 2-3
( )[ ] ( ) 5.15.0 23206900320,3 ccc wfE ⋅+′⋅= (Mpa), Equation 2-4
cr ff ′= 7.11 (psi) and Equation 2-5

Chapter 2 Literature Review
10
cr ff ′= 94.0 (Mpa) Equation 2-6
2.2.3 Ahmad and Shah (1985)
Empirical equations for the material properties of HSC were derived from experimental data
from other researchers. The research of Ahmad and Shah is limited to compressive concrete
strength up to 12,000 psi (84 MPa). Ahmad and Shah found that the difference in the
characteristics of the stress-strain curve between NSC and HSC is significant. They also
stated that the modulus of rupture of HSC in ACI318-83 is very conservative, while the
modulus of elasticity in ACI318-83 computes 20 percent higher values. Ahmad and Shah
suggested new equations for the modulus of rupture and the modulus of elasticity of HSC.
The equations are given below as reference.
( ) 325.05.2ccc fwE ′⋅= (psi) , Equation 2-7
( ) 325.05.2510385.3 ccc fwE ′⋅⋅⋅= −
(MPa), Equation 2-8
( ) 322 cr ff ′= (psi) and Equation 2-9
( ) 3238.0 cr ff ′= (MPa). Equation 2-10
2.2.4 Zia et al. (1993)
The Strategic Highway Research Program on mechanical behavior of high performance
concrete was conducted by Zia et al. at North Carolina State University. The concrete
specimens referred to as Very High Strength show 28-day compressive strengths ranging

Chapter 2 Literature Review
11
from 8,080 to 13,420 psi (55.7 to 92.5 MPa). Based on Zia et al.’s research findings, the test
results correlate well with the ACI 318 equation for the elastic modulus, which is similar to
the AASHTO LRFD. Zia et al. (1993) found that the equation in ACI 363R, developed by
Carasquillo et al. (1981), underestimates the measured elastic modulus. For the modulus of
rupture, they found that at the design age, the ratio of the observed value to the value
predicted by ACI 318 is 1.06 for concrete made with fly ash and 1.15 for concrete made with
silica fume. In a comparison of the modulus rupture between the measured values and those
predicted by ACI 363R, the ratio is as low as 0.68.
2.2.5 Mokhtarzadeh and French (2000)
More recent research has been conducted by Mokhtarzadeh and French (2000). Their
research included extensive test results and predictions regarding the material properties for
HSC. They conducted tests using 98 mixtures with compressive strengths ranging from 6,000
to 19,500 psi (41.4 to 135 MPa) for the modulus of elasticity and 280 modulus rupture beams
made from 90 HSC mixtures with compressive strengths ranging from 7,500 to 14,630 psi
(51.7 to 101 MPa), including heat-cured and moist-cured conditions. Their data showed that
the ACI 318-99 equation overestimates the elastic modulus of HSC, while the ACI 363R-92
equation provides a more reasonable prediction of the elastic modulus for moist-cured
specimens and slightly overestimates heat-cured test results. For the modulus of rupture,
Mokhtarzadeh and French found that values measured for the moist-cured specimens are
adequately predicted by the ACI 363R-92 equation. Values from the heat-cured specimens
fall in between the values predicted by the ACI 363R-92 and ACI 318-99 equations. The
authors proposed a new relationship for the modulus of rupture that uses a coefficient of 9.3
in lieu of the 7.5 in the ACI 318 equation.

Chapter 2 Literature Review
12
2.3 STRESS BLOCK PARAMETERS
The equivalent rectangular stress block has been widely used to determine the ultimate
flexural strength of reinforced and prestressed beams and columns. Through the application
of ultimate strength design theory, stress block parameters have been developed to make
equivalent rectangular stress blocks that can simplify the actual stress distribution. The
proposed stress block by many researches are given in Appendix A. This section presents
major findings in the use of stress block parameters for predicting the ultimate flexural
strength.
2.3.1 Mattock et al. (1961)
The ACI 318 and AASHTO LRFD specifications regarding the use of stress block
parameters to compute flexural strength were originally developed by Mattock et al. (1961).
The Mattock research used studies previously conducted by Whiney (1937) and Hognestad et
al. (1995) as reference. Mattock et al. suggested the use of stress block parameters, α1 and β1,
to determine ultimate strength and α1 is taken as 0.85 of the cylinder strength; β1 is taken as
0.85 for concrete cylinder strength up to 4,000 psi (28 MPa); and thereafter is reduced by
0.05 for each 1,000 psi of strength in excess of 4,000 psi. Based on design examples for
bending and compression, they concluded that the proposed stress block parameters allow
sufficient accuracy of the prediction of ultimate strength in bending and compression.

Chapter 2 Literature Review
13
2.3.2 Nedderman (1973)
In Nedderman’s research (1973), plain concrete columns with compressive strengths up to
14,000 (98 MPa) were tested under eccentric loading conditions. Nedderman suggests that
the depth of the stress block, β1 in ACI318 (ACI 318, 1971), becomes an unrealistic value at
a compressive concrete strength of 21,000 psi (147 MPa). This research also proposes the
lower limits of β1 to be 0.7 with a compressive concrete strength higher than 7,000 psi (49
MPa).
2.3.3 Ibrahim et al. (1996, 1997)
In the Ibrahim research, 20 HSC columns up to 14,500 psi (100 MPa) and UHSC with
the compressive concrete strength over 14,500 psi were tested that incorporates concrete
strength, confinement steel, and the shape of the compression zone. The test specimens
consisted of fourteen C-shaped sections with a rectangular cross-section and six C-
shaped sections with a triangular section. A better understanding of the flexural behavior
of HSC and UHSC sections without confinement or with less confinement than required
in seismic regions was also sought in this test. The Ibrahim study concluded that the ACI
stress block parameters (ACI 318, 1989) overestimate the moment capacity of HSC and
UHSC columns in compression. The researchers proposed new stress block parameters,
as follows:
cc f
f′≥
′−= 725.0
80085.01α
(MPa) and Equation 2-11
cc ff ′≥′
−= 70.0400
95.01β(MPa). Equation 2-12

Chapter 2 Literature Review
14
2.4 PRESTRESS LOSSES
Concrete is a time-dependent material. In particular, concrete experiences creep under a
sustained load and experiences shrinkage due to changes in moisture content. These physical
changes increase over time. The prestress losses due to concrete creep and shrinkage result in
the loss of compressive force onto the concrete. Ngab et al. (1981) measured less creep and
slightly more shrinkage of HSC in comparison to NSC. The creep coefficient for HSC was
50 to 70 percent that of NSC. In a similar study, Nilson (1985) found that the ultimate creep
coefficient for HSC is much less than that of NSC. This section describes findings regarding
the prestress losses of full-size prestressed girders with HSC.
2.4.1 Roller et al. (1995)
A project undertaken in Louisiana investigated prestress losses in HSC girders. Two bulb-tee
sections, 70 ft. (21.3 m) long and 54 in. (1372 mm) deep and designed according to
AASHTO standard specifications (AASHTO 1992), were tested for long-term study. The
design compressive strength at 28 days for the girders’ concrete and releasing strength was
10,000 psi (69MPa) and 6000 psi (41 MPa), respectively. The concrete strain due to prestress
losses of the girders was measured using internal Carlson strain meters under the full design
dead load for 18 months. Roller et al. concluded that concrete strains measured at 28 days
indicate that prestress losses are significantly less that the losses calculated using the
provisions found in the AASHTO standard specifications.
2.4.2 Tadros (2003)
A more recent published study, National Cooperative Highway Research Program (NCHRP)
Report 496 by Tadros (2003), developed design guidelines for estimating prestress losses in

Chapter 2 Literature Review
15
pretensioned HSC. Tadros’ research included a review of the extensive relevant literature to
determine the applicable range of concrete strengths for the AASHTO (2003) provisions for
estimating prestress losses in pretensioned concrete bridge girders. Based on this information,
Tadros investigated the affecting factors, such as material properties, curing, exposure, and
loading conditions. He concluded that the AASHTO LRFD (2003) refined method
overestimates creep because it ignores the reduction in the creep coefficient associated with
the increase in concrete strength. Tadros proposed new equations for each parameter to
calculate the creep coefficient and shrinkage of HSC. His research results are included in the
current AASHTO LRFD specifications (2004).
2.4.3 Waldron (2004)
Comprehensive research for prestress losses of HSC was conducted by Waldron (2004).
Comparisons between measured and calculated prestress losses were made using AASHTO
LRFD (1998) refined and lump sum methods, the AASHTO standard specifications, PCI-
1975, PCI BDM, and NCHRP Report 469. This research draws some conclusions for
estimating prestress losses. The methods for estimating prestress losses presented in the
AASHTO Standard Specification (AASHTO 1996) and LRFD Specification (AASHTO
1998) overestimate the measured total losses for each set of girders by 18 percent (5 ksi) to
98 percent (27 ksi). The NCHRP Report 496 refined and approximate methods for estimating
prestress losses predict within ±18 percent for the normal-weight HPC and over-predict the
measured total losses of the light-weight HPC by less than 22 percent (8 ksi). Consequently,
the NCHRP Report 496 refined the methods for estimating prestress losses. They
recommended for estimating the prestress losses at the end of the service life for girders with
normal-weight HPC.

Chapter 2 Literature Review
16
2.5 FLEXURAL BEHAVIOR OF GIRDERS WITH HIGH STRENGTH CONCRETE
The principle for determining flexural response has been well established by using
equilibrium of force and strain compatibility conditions. As described in the literature, due to
the different material characteristics of HSC, as compared to conventional strength concrete,
the flexural behavior, including prestress losses, transfer length, load-deflection relationship,
camber, ultimate flexural strength, and cracking load may be affected. This section describes
major findings regarding the flexural response for full-size prestressed girders with HSC.
2.5.1 Shin et al. (1990)
Shin, Kamara and Ghosh (1990) tested three sets of 12 specimens with compressive strengths
of 4, 12, and 15 ksi (27.6, 82.7 and 103.4 MPa). Although the specimens were clearly
reinforced as columns, they were cast horizontally and cured under field conditions. The
specimens were tested in flexure under two-point loading conditions. This research
concluded that the equivalent rectangular stress block parameters addressed in ACI318-83
are appropriate for determining the flexural strength of HSC beams to 15 ksi (103.4MPa).
Shin et al. also confirmed that there is no need for change in the ACI procedure for
computing flexural strength. However, the ultimate strain of HSC is recommended to be
0.0025 as a lower bound instead of 0.003.
2.5.2 Bruce and Martin (1994)
Bruce and Martin (1994) investigated the behavior of prestressed concrete girders with HSC
under sponsorship of the Louisiana Transportation Research Center. This research focused on
the flexure and shear behaviors of composite girders under static and fatigue loading
conditions. Four full-size prestress bulb-tee girders, 70 ft (21.3 m) long and 54 in. (1372 mm)

Chapter 2 Literature Review
17
deep and designed according to AASHTO standard specifications (AASHTO 1992), were
fabricated. Three of them had a 9 ½ in. (240 mm) thick and 10 ft. (3.05 m) wide deck. Each
girder specimen had a 28-day compressive concrete strength of 10,000 psi (69 MPa). Bruce
and Martin concluded that the AASHTO standard specification (AASHTO 1992) is
conservatively applicable for members with concrete compressive strengths up to 10,000 psi
(69 MPa). Based on the findings of this research, HSC has potential benefits for highway
bridge structures, including wider girder spacing and lower prestress losses. Bruce and
Martin recommended the use of HSC for highway bridge structures.
2.5.3 Ahlborn, French, and Shield (2000)
Ahlborn et al. (2000) investigated the long-term and flexural behavior of HSC prestressed
bridge girders under the sponsorship of the Minnesota Department of Transportation. This
study began with an extensive parametric study to better understand the limitations of using
HSC in prestressed bridge girder sections in Minnesota. Two long-span, high-strength,
composite, prestressed bridge girders (MNDOT 45M) were fabricated. Test specimens had a
28-day concrete compressive strength that exceeded 11,100 psi (77Mpa) for girders and
4,500 psi (31 MPa) for a composite deck. This research focused on the structural behavior
and the adequacy of AASHTO standard provisions (AASHTO 1993), including prestress
losses, transfer length, cyclic load response and ultimate flexural strength. Ahlborn et al.
suggest that the prediction of prestress losses using the AASHTO provisions ignores the
concrete stress prior to release as well as overestimates the elastic modulus of HSC and creep
and shrinkage. Their research indicates that the prediction of the ultimate flexural strength
using AASHTO standard specifications is conservative.

Chapter 3 Experimental Program
18
3 EXPERIMENTAL PROGRAM
3.1 INTRODUCTION
This experimental research program was conducted to evaluate the flexural behavior of
prestressed composite girders with high strength concrete (HSC). A total of nine prestressed
AASHTO girders were fabricated and tested under static loading conditions to determine the
different limit states behavior including ultimate and mode of failure of HSC girders. Each of
the AASHTO girders was instrumented with internal strain gauges to measure prestress loss.
Concrete cylinders for each of the AASHTO girders were also cast to determine material
properties. This section will provide details related to design considerations, fabrication
procedure, test set-up, loading scheme, instrumentation, and test descriptions.
3.2 DESIGN OF THE TEST SPECIMENS
A total of nine AASHTO girders with HSC were designed and tested to evaluate their
flexural response. All specimens for this research program were designed in accordance with
two specific design considerations.
The first design consideration is the concrete strength because the application of current code
provisions limits the use of HSC over 10,000 psi. Therefore, three different nominal design
concrete strengths, 10,000, 14,000, and 18,000 psi, were considered so that the current LRFD
provisions can be extended up to 18,000 psi compressive strength for reinforced and
prestressed concrete.

Chapter 3 Experimental Program
19
The second design consideration is the location of the compression zone of the specimens in
the flexure. Design of the girders allows three configurations of the compressive zone. The
first configuration of the compressive zone is located within the top flange of the girder
without the deck slab. Therefore, the strength of the concrete of the compressive zone is
controlled by the HSC. The second configuration allows the neutral axis to be located within
the top flange of the girder with the deck slab cast with NSC; therefore, the strength within
the compressive zone is controlled by the HSC used in the girder and the normal strength
concrete of the deck slab. The third type of configuration allows the neutral axis to be located
within the cast-in-place deck; therefore, the flexural strength is controlled entirely by the
NSC.
Depending on the strength of the concrete and the location of the compression zone, the
required number of prestressing strands were 16, 18 and 20 strands for the nominal design
compressive strength concrete of 10,000, 14,000, and 18,000 psi (69 to 124 MPa),
respectively. All strands were straight. The design of the nine AASHTO Type II prestressed
concrete girders were finalized using three design concrete strengths. Table 3.1 presents a
summary and identification of each girder specimen. Typical AASHTO Type II girder
sections, each shown with the order and location of strands, are given in Figure 3-1.
All girders are designed to avoid premature failure due to shear and bond slippage before
flexural failure. A preliminary design of this reinforcement is based on the AASHTO LRFD
specifications. Each girder employed No. 4 stirrups at a spacing of 3 in. near the end blocks
and every 6 in. along the entire length of the girder. More information about the
reinforcements of the test specimens are presented in Appendix B.

Chapter 3 Experimental Program
20
Table 3.1 Detailed Design of the Test Specimens
Girder
Design Strength 10 ksi (69 Mpa) 14 ksi (97 Mpa) 18 ksi (124 Mpa)
Section AASHTO Type II AASHTO Type II AASHTO Type II
Total Length 41 ft. (12.5 m) 41 ft. (12.5 m) 41 ft. (12.5 m)
Clear Span Length 40 ft. (12.2 m) 40 ft. (12.2 m) 40 ft. (12.2 m)
Strand (1/2" φ 270 k Low Relaxation)
Required Number 16 18 20
Pattern Straight Straight Straight
Deck Slab
Design Strength 4 ksi (28 Mpa) 4 ksi (28 Mpa) 4 ksi (28 Mpa)
Thickness 8 in. 8 in. 8 in.
Identification
None 10 PS - N 14 PS - N 18 PS - N
1 ft. 10 PS - 1 S 14 PS - 1 S 18 PS - 1 S Width of the deck
slab 5 ft. 10 PS - 5 S 14 PS - 5 S 18 PS - 5 S
*1 ft. = 30.48cm; 1 ksi = 6.9 Mpa

Chapter 3 Experimental Program
21
Dimensions
Type AASHTO TYPE II
D1 36.0 (in.) D2 6.0 D4 3.0 D5 6.0 D6 6.0 B1 12.0 B2 18.0 B3 6.0 B4 3.0 B6 6.0
Properties
Area 369 in.2 ybottom 15.83 in. Inertia 50,980 in.4 Weight 0.384 kip/ft.
For 18 PS-5 S, 1 S, and N
For 14 PS-5 S, 1 S, and N
For 10 PS-5 S, 1 S, and N
Figure 3-1 Cross-section showing prestressing strand configurations
6 5 4 3 2 1 7 8 13 9
17 18 15 10
11
12
16
14
19
20
D1
D2
D4
D5
D6
B3 B4
B6
B2
B1

Chapter 3 Experimental Program
22
3.3 FABRICATION OF TEST SPECIMENS
Fabrication of the composite girder specimens with variable deck widths consists of two
steps. First, the AASHTO girders were fabricated at a pre-cast, prestress plant. Second, the
cast-in-place decks were cast on the AASHTO girders at the CFL. This section presents a
description of the fabrication of the test specimens.
3.3.1 AASHTO Girder Specimens
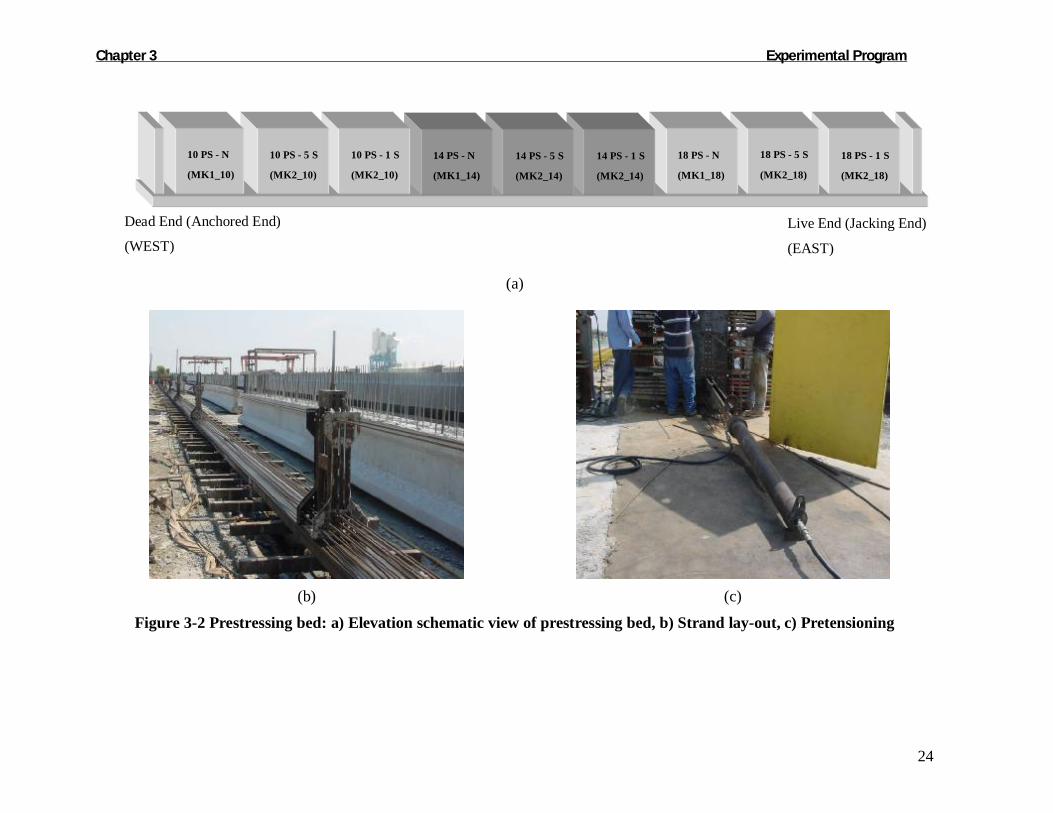
A total of nine prestressed concrete girders were fabricated by the Standard Concrete
Products prestressing plant in Savannah, GA. Construction of the prestressed girders can be
summarized in the following event, as presented in Table 3.2. All load cells and strain gauges
were attached before tensioning of the prestressing strands. A total of 20 strands were placed
on the prestressing bed simultaneously. The strands for the nine girder specimens were
tensioned individually, as shown in Figure 3-2 (b). Each prestressing strand was tensioned to
75 percent of its ultimate strength for a total load of 31 kips. Then, reinforcement and
formwork were positioned. The casting and curing of the girders were completed following
the typical procedure used by Standard Concrete Products. Figure 3-2 (a) and (c) show
elevation views of the prestressing bed for the nine girders and the prestressing procedure,
respectively.

Chapter 3 Experimental Program
23
Table 3.2 Construction Sequence Summary
Date Time Event
July 15 -17, 2005 7:00 am - 5:00 pm Load cell and strain gauge installation
Morning Tensioning 20 strands
July 18, 2005 Afternoon (4:00 - 6:00 pm)
Casting 18 ksi design strength
Morning Releasing 2 strands
July 19, 2005 Afternoon (4:00 - 6:00 pm)
Casting 14 ksi design strength
Morning Releasing 2 strands July 20, 2005
Afternoon None
July 21, 2005 Morning
(9:00 - 11:00 am) Casting 10 ksi design strength
July 22, 2005 Morning
(10:00 am - 1:00 pm) De-molding and releasing
remaining strands
Chapter 3 Experimental Program
24
(a)
(b)
(c)
Figure 3-2 Prestressing bed: a) Elevation schematic view of prestressing bed, b) Strand lay-out, c) Pretensioning
18 PS - 1 S
(MK2_18)
Dead End (Anchored End)
(WEST) Live End (Jacking End)
(EAST)
18 PS - 5 S
(MK2_18)
18 PS - N
(MK1_18)
14 PS - 1 S
(MK2_14)
14 PS - 5 S
(MK2_14)
14 PS - N
(MK1_14)
10 PS - 1 S
(MK2_10)
10 PS - 5 S
(MK2_10)
10 PS - N
(MK1_10)
Chapter 3 Experimental Program
25
After applying prestressing force to the strands and installing the instrumentations, steel
reinforcements were placed and the formwork was positioned. The three girders for each
design concrete strength were cast using four batches of the same concrete mix. In order to
determine the material property of each AASHTO girder, 15 concrete cylinders, 4 x 8 in. for
the modulus of elasticity and compressive strength and nine 6 x 6 x 20 in. beams for the
modulus of rupture, were made from each of the first three batches of concrete and cured
next to the girders prior to shipping to the CFL, then air-cured in the laboratory. Additionally,
the concrete supplier cast ten 4 x 8 in. concrete cylinders from each batch of mix for
determining compressive concrete strength. The supplier provided the results of the
compressive concrete strength at 1, 7, 14, 28, and 56 days.
The girders were vibrated using a internal vibrator while the concrete was placed. The top
surface of the girders was intentionally roughened. After the girders for each design concrete
strength were cast, they were then covered with burlap and plastic, and a water hose was
placed on top of the girders for curing. Pictures of this procedure are provided in Figure 3-3.
As seen in Table 3.2, there are three casting schedules for each design concrete strength.
After casting for the 18,000 psi (124 MPa) design compressive strength, two strands, the 18th
and 17th (see Figure 3-1), were released and removed. After casting for the 14,000 psi (97
MPa) design compressive strength, two more strands, the 13th and 16th (see Figure 3-1), were
also released and removed. Finally, 16 strands remained in the prestressing bed. Before their
release, the required compressive strength was tested and provided by the concrete supplier.
Most of the girders reached the required release strength after 1 day. All strands were flame
cut at both ends of the AASHTO girder. Strain data, obtained from installed weldable strain

Chapter 3 Experimental Program
26
gauges on the selected strands, were recorded before and after release, and the end slippage
was measured at specified points, as will be described in later sections.
(a) Reinforcing (b) Casting concrete
(c) Covering with burlap
(d) Curing
Figure 3-3 Sequence of girder fabrication

Chapter 3 Experimental Program
27
After the nine AASHTO Type II girders were fabricated, they were stored in the plants.
Approximately 56 days after fabrication, on September 19, 2005, three girders for the 10,000
psi design strength concrete were shipped from the plant to the CFL for testing. The others
also were shipped to the CFL within 3 months after fabrication. They were stored inside the
laboratory.
3.3.2 Cast-in-place Deck
Approximately three months after girder fabrication, deck slabs (three 1 ft. wide and three 5ft.
wide) were cast on six AASHTO girders at the CFL. The width of the deck slab was
determined based on the design consideration. The 28-day nominal design compressive
strength of the cast-in-place deck was specified as 4,000 psi (28 MPa). Other details,
including the deck slab dimensions and reinforcement specifications for the 5 ft. and 1 ft.
wide deck slabs, are presented in Appendix C.
A single 5 ft. wide cast-in-place deck was cast each week for three consecutive weeks, and
three 1 ft. wide cast-in-place decks were cast at the same time during the following week.
Concrete was provided by Thomas Concrete of Raleigh, NC. The measured concrete slump
was 3 to 4 in. at the time of casting. The concrete deck slabs were covered with plastic for 1
day, after which the forms were removed and the beams were air cured. The completed
formwork for 1 ft. and 5 ft. wide slabs is shown in Figure 3-4. Figure 3-4 (a) shows two
AASHTO girders that were used temporarily to support the deck concrete.
Internal strain gauges were embedded into the deck slabs during the fabrication process.
Detailed information about internal gauges can be found in the Section 3.4.

Chapter 3 Experimental Program
28
a) 5 ft. wide deck slab
b) 1ft. wide deck slab
Figure 3-4 Formwork for the 5 ft. and 1 ft. wide deck slabs

Chapter 3 Experimental Program
29
3.4 INSTRUMENTATION
3.4.1 AASHTO Girder Specimens
Applied prestressing force, strain, elongation, and end slippage, were measured during the
fabrication process. Specifically, load cells were used to verify the applied load on the
strands at the dead end of the prestressing bed. The locations of the load cells corresponds to
the strands are shown in Figure 3-5 (a). Four load cells were installed on the bottom-most
strands. A portable indicator, shown in Figure 3-5 (b), was used to measure the load indicated
by the load cells. The bearing plate was used only for the two outside strands due to the
limited space available, as shown in Figure 3-5 (c).
After the installation of the load cells, the strands were lightly tensioned to a load of 4 kips
and then fully tensioned up to 31 kips. The load cells measured the applied force after
jacking, during casting, curing, and at the release of the strands. Data obtained from the load
cells are given in Table 3.3.
In addition to the use of load cells, the applied prestressing force was verified by measuring
the elongation of the prestressing strands. After the strands were fully tensioned up to a
specified prestressing force, the elongation of each prestressing strand was measured. For a
comparison between applied force and computed force, 0.153 in.2 for the area of the
prestressing strand, 29,000 ksi for the modulus, and 5061 in. for the prestressing bed length
were used to calculate the prestressing force. Detailed results for elongation are given in
Table 3.4.

Chapter 3 Experimental Program
30
b) Installed load cell and indicator
a) Location of load cells (LC) and of de-tensioned strands
c) Bearing plate
Figure 3-5 Load cell installation
LC-4
LC-3 LC-2
LC-1
1st de-tensioned and removed strands 2nd de-tensioned and removed strands
Indicator
1
2
3
4
Bearing Plate

Chapter 3 Experimental Program
31
Table 3.3 Measured Data from Load Cells
Load Cell Date
(2005) Time
1 2 3 4 Etc.
1st reading (P.G. = 4 kips)
3.5 3.5 3.7 3.4
2nd reading (P.G. = 10 kips)
- - - 10.4
3rd reading
(P.G. = 20 kips) - - - 19.8
Jacking
4th reading
(P.G. = 30 kips) 30.5 30.9 29.5 30.8
July 18
After 18 ksi casting 30.7 30.8 29.7 30.8
Morning 30.8 31.0 29.8 31.1 1st de-tensioned, removed strands July
19 After 14 ksi casting 30.8 30.9 29.6 30.9
Morning 31.1 31.3 29.9 31.3 2nd de-tensioned, removed strands July
20 Afternoon 31.3 31.4 30 31.3
Morning 32.0 32.3 30.9 31.3 July
21 After 10 ksi casting 30.4 30.6 29.3 30.5
Morning 33.0 33.1 31.8 33.3
Afternoon 32.8 33.0 31.6 33.1 July 22
At release -0.1 -0.1 -0.2 0 Releasing

Chapter 3 Experimental Program
32
Table 3.4 Order of Prestressing Strands and Elongation
Strand # Applied force (lb.)
Measured Elongation
(in.)
Computed force (lb.) Applied/Com.
1 31600 30 5/8 26849 1.18
2 31600 31 1/2 27616 1.14
3 31600 30 3/8 26630 1.19
4 31600 30 1/8 26411 1.20
5 31600 31 27178 1.16
6 31600 31 27178 1.16
7 31600 30 7/8 27068 1.17
8 31600 31 3/8 27507 1.15
9 31600 31 7/8 27945 1.13
10 31600 31 1/4 27397 1.15
11 31600 31 27178 1.16
12 31600 31 1/4 27397 1.15
13 31600 31 27178 1.16
14 31600 30 1/4 26520 1.19
15 31600 31 7/8 27945 1.13
16 31600 31 27178 1.16
17 31600 31 3/4 27835 1.14
18 31600 31 7/8 27945 1.13
19 31600 30 3/4 26959 1.17
20 31600 30 3/8 26630 1.19

Chapter 3 Experimental Program
33
During the construction of the girder specimens, as indicated in Table 3.2, two internal
weldable strain gauges for each girder were attached to the selected bottom-most strands of
each girder near the mid-span prior to pretensioning the strands. These gauges were used to
indicate the strain of the embedded strands during the entire testing process. Welded strain
gauges provide prestress losses and the strain of the strand during flexural testing. The
weldable gauges were located in accordance with three phases. These locations, as shown in
Figure 3-6, were duplicated for each girder according to each girder’s design strength of
concrete. These gauges were located approximately at the middle of the span.
For 18 PS - 1 S
For 18 PS - 5 S
For 18 PS - N
Figure 3-6 Locations of weldable strain gauges
To install the weldable strain gauges, several steps were taken, as given in Figure 3-7. First,
the surfaces of the strands were polished with 180 grit sand paper and cleaned with acetone.
Second, the strain gauges were welded with a 10-12 watt-second spot welder with a 0.8 mm
diameter probe. Finally, the welded gauges were covered with friction tape for protection
against damage during the casting process.

Chapter 3 Experimental Program
34
a) Welder
b) Weldable strain gauge
c) Surface preparation
d) After installation
Figure 3-7 Installation of weldable strain gauge
3.4.2 Cast-in-place Deck
The deck slab was instrumented by strain gauges attached to #3 reinforcing bars located near
the mid-span of the girder, parallel to the top layer of the longitudinal reinforcement. These
gauges were used to measure the strain at the level of the top steel reinforcement and,
consequently, the concrete at the same level of the deck slab. Typical locations of the
instrumented individual bars for each specimen with various deck widths are shown in Figure
3-8.

Chapter 3 Experimental Program
35
Figure 3-8 Installation of the strain gauges attached to #3 steel rebar
3.5 MATERIAL PROPERTIES
3.5.1 Concrete Properties
All concrete mix designs were developed by the Standard Concrete Products prestressing
plant using several lab batches to achieve the specified design compressive concrete strength.
Representative concrete mix designs for each of the three target strengths are given in Table
3.5. As described in the section on fabrication of the girders, three concrete batches were
used for three girders. The concrete mix design for each batch is given in Appendix D.

Chapter 3 Experimental Program
36
Table 3.5 Detailed Mix Design for Girder Specimens
NCHRP12-64 HSC Mix
Design compressive strength (psi) 10,000 14,000 18,000
Cement (lbs.) 670 703 890
Fly ash (lbs.) 150 192 180
Microsilica (lbs.) 50 75 75
#67 Granite (lbs.) 1727 1700 1700
Concrete sand (river) (lbs.) 1100 1098 917
Water (lbs.) 280 250 265
Recover (hydration stabilizer) (oz.) 26 50 50
ADVA 170 (water reducer) (oz.) 98 125 135
W/cementitious material 0.32 0.26 0.23
As described earlier, one batch of concrete was insufficient for a single girder. Therefore, 15
4 x 8 in. concrete cylinders for measuring the modulus of elasticity and compressive strength,
and nine 6 x 6 x 20 in. beams for measuring the modulus of rupture were made from each of
the first three batches of concrete and cured next to the girder. Additionally, the concrete
supplier made ten 4 x 8 in. concrete cylinders for each batch mix for measuring compressive
strength. Table 3.6 shows the concrete properties for the first three batches for each design
mix. The unit weight for the concrete used in the girders indicates that the concrete is
normal-weight.

Chapter 3 Experimental Program
37
Table 3.6 Concrete Properties for Girder Specimens
Design Strength
Mix Design Batch
Con. Temp. (oF)
% Air Slump (in.)
Unit Weight (pcf)
1 91 3 8 1/2" 144.6 10 ksi MIX 1 P
3 82 3.5 8 3/4" 145.5
1 98 3.2 6 3/4" 148.5
2 100 2.9 8.75" - 14 ksi MIX 2 P
3 97 2.6 10" 148.9
1 100 2.98 7 1/2" -
2 98 1.48 10 1/2" - 18 ksi MIX 3 P
3 100 2.78 6 1/4" -
The decks for the three AASHTO girders with the 1 ft. wide deck slab and the 5 ft. wide deck
slab were cast at the CFL. The width of the deck slab was determined based on the design
consideration. The 28-day nominal design compressive strength of the deck concrete was
specified as 4,000 psi (28 MPa). The detailed mix design for the deck concrete is given in
Table 3.7. Concrete properties for the deck are given in Table 3.8.

Chapter 3 Experimental Program
38
Table 3.7 Concrete Mix Design for Deck Slab
5 ft. wide deck slab 1 ft. wide deck slab
Deck cast date 10-20-2005 11-10-2005
Amount (yd.3) 5.5 3.5
#67 Stone (lb.) 4978 6335
River Sand (lb.) 3742 4740
Cement (lb.) 1628 2072
Recycle water (gal.) 106 45
200 N (oz.) 47 60
Table 3.8 Concrete Properties for Cast-in-place Deck
Identification Air Content
(%) Slump (in.)
Unit Weight (pcf)
10 PS – 5 S 2.4 3.5 149.87
14 PS – 5 S 1.7 3 149.36
18 PS – 5 S 2 4 3/4 154.63
10, 14, and 18 PS – 1 S 1.3 4 1/2 149.84
3.5.2 Compressive Strength, Elastic Modulus, and Modulus of Rupture
Three concrete cylinders for compressive strength and elastic modulus were tested according
to ASTM C39-03 specifications. A review of the studies related to end treatments shows that

Chapter 3 Experimental Program
39
grinding the cylinders provides the highest strength and the lowest coefficient of variation
Zia et al. (1987). Therefore, all of the cylinders were first prepared by grinding both end
surfaces to remove irregularities in the surfaces and to ensure that the ends were
perpendicular to the sides of the cylinders, as shown in Figure 3-9 (a). As mentioned earlier,
the girder producers also provided cylinders for measuring the compressive strength of the
concrete in each girder at 1, 7, 14, 28, 56 days. Test cylinders were grinded on the both end
surfaces using a hand grinder, as shown in Figure 3-9 (b). Test results for the compressive
strength are given in Appendix E.
a) Grinder
b) Hand grinder
Figure 3-9 Specimen preparation and test set-up for elastic modulus
The concrete material property tests, that is, the elastic modulus and modulus of rupture tests,
were conducted at the concrete age of 28 and 56 days in the CFL. Tested cylinders were
placed in air-cured conditions at the CFL. Therefore, the compressive strength is slightly
different between the data provided by the concrete supplier and the data obtained from the
CFL. All of the tests for the determination of material properties were conducted in
accordance with ASTM designations. Each value represents the average of two cylinders

Chapter 3 Experimental Program
40
from one batch of one design strength. The test set-up for the elastic modulus and modulus of
rupture is shown in Figure 3-10 (a) and (b), respectively.
a) Cylinder test set-up
b) Beam test set-up
Figure 3-10 Test set-up for elastic modulus and modulus of rupture
The elastic modulus from the 4 x 8 in. concrete cylinders was determined in accordance with
ASTM C496. Firstly, one of the three cylinders was tested solely to determine the
compressive strength. Subsequently, the remaining two cylinders from each specified day
were used to determine the elastic modulus and then tested to failure to determine the
compressive strength. Strains were determined using four linear motion transducers (LMTs)
attached to two fixed rings. The LMTs were used to measure the axial deformation. The
collected data were used to calculate the elastic modulus. The apparatus consists of two
aluminum rings with set screws that attach to the cylinder. The rings were initially joined by
three aluminum bars to maintain the specified gauge length used to determine the axial
strains from the recorded deformation. The elastic modulus test consisted of three loading
cycles. The first loading cycle, which was only intended to seat the gauges and the specimen,

Chapter 3 Experimental Program
41
began at zero applied load and unloaded at 40 percent of the expected capacity of the
specimen. The second and third loading cycles were applied up to 40 percent of the expected
capacity of the specimen. Finally, the specimen was loaded to failure to obtain the
compressive strength. From the measured average strain under twice loading phase, the
elastic modulus was determined.
The modulus of rupture tests were carried out using the 6 x 6 x 20 in. beam specimens. The
specimens were tested under four-point loading in accordance with AASHTO T 97. A 90-kip
hydraulic jack mounted inside a structural steel test frame was used to apply the load. A load
cell was used to measure the applied load. A spherical head and a plate/roller assembly were
located beneath the load cell to distribute the load evenly on the two loading points at the top
surface of the specimen. The span length of the specimen was 18 in., and the spacing
between supports and the nearest loading point as well as the space between the two loading
points was 6 inches. The load was applied such that the stress at the extreme bottom surface
of the specimen increased at an approximate rate of 150 psi/sec.
As indicated in Table 3.9, the average 28- and 56-day compressive concrete strength of each
representative design mix reached the design strength except Mix 3P, which called for
18,000 psi (124 MPa) design compressive strength. However, a study of concrete shows that
fly ash redistributes the pore size in the concrete. Capillary pores are better able to retain
water, which can then be available for long-term hydration (Neville, 4th Edition). For this
possibility of long-term hydration, the development of the compressive strength for each
specimen at each test day could be expected.

Chapter 3 Experimental Program
42
As indicated in Table 3.10, the average 28-day compressive strength for the deck concrete
reached the design strength ranging from 3450 to 5560 psi. The deck concrete is considered
normal-strength concrete.
Table 3.9 Test Results for Material Properties
Mix Design Concrete Age fc (psi) E (ksi) fr (psi)
28 days 11430 5450 828 Mix 1P (10 ksi) 56 days 11880 5750 n/a
28 days 12960 5430 813 Mix 2P (14 ksi) 56 days 14020 5500 n/a
28 days 15870 6100 853 Mix 3P (18 ksi) 56 days 16810 5590 n/a
( ) is the design concrete strength
Table 3.10 Compressive Strength Test for Deck Concrete
Specimen Identifications fc (psi) at 28 days Average fc (psi)
10 PS – 5 S
3880
3770 3680
3780
14 PS – 5 S
5150* 4900*
4910* 4990
18 PS – 5 S 3390
3500 3450
10, 14, and 18 PS-1 S
5570
5350 5760
5560
* Concrete cylinders were tested at 31 days.

Chapter 3 Experimental Program
43
As indicated, using fly ash in concrete mix results in the development of compressive
concrete strength over longer time. Test results, as given in Table 3.11 for compressive
strength, elastic modulus, and modulus of rupture, indicate that the compressive cylinder
strengths of each AASHTO girder reached the design compressive strengths of 10,000,
14,000, and 18,000 psi, with the exception of girder 18 PS–1 S. These test results for
compressive strength were expected due to the test results provided by the concrete supplier,
as given in Appendix E.
Table 3.11 Material Property for Each AASHTO Girder Specimen
Specimens Age (days) fc (psi) E (ksi) fr (psi)
Girder 120 11490 5360 768 10 PS – 5 S
Deck 29 3780 2690 -
Girder 143 16160 5560 711 14 PS – 5 S
Deck 43 5340 3300 -
Girder 175 18060 5970 872 18 PS – 5 S
Deck 67 3990 2660 -
Girder 189 13190 5630 820 10 PS – 1S
Deck 77 5040 2770 -
Girder 184 15530 5440 751 14 PS- 1 S
Deck 70 5040 2770 -
Girder 199 14490 5150 680 18 PS – 1S
Deck 84 5040 2770 -
10 PS - N Girder 222 11810 5540 820
14 PS - N Girder 228 15660 5330 717
18 PS - N Girder 232 18110 6020 706

Chapter 3 Experimental Program
44
3.5.3 Prestressing Strands
Prestressing strands typically used in the girder specimens were ½ in. in diameter, 7-wire,
Grade 270, low relaxation strands. The material properties of the prestressing strands were
provided by the supplier. The strength-strain relationship is given in Figure 3-11.
0
6
12
18
24
30
36
42
48
54
60
0.0 0.2 0.4 0.6 0.8 1.0 1.2 1.4 1.6 1.8 2.0
Strain (%)
Stre
ngth
(lbf
)
Figure 3-11 Material property for prestressing strand
Ultimate breaking strength (lbf) 43,758 Load @ 1% extension (lbf) 40,348 Ultimate elongation, % 4.95 Actual area (in2) 0.1523 Average modulus of elasticity (Mpsi) 29.0

Chapter 3 Experimental Program
45
3.6 FLEXURAL TEST DETAILS
3.6.1 Test Set-up and-Procedure
The test setup used for the flexural tests is schematically shown in Figure 3-12. Girders were
simply supported with a steel plate above a neoprene pad. The load was commonly applied
for all of the girders at two locations spaced 6 ft. at mid-span. Load was applied to the girders
using a 440 kip MTS closed-loop actuator. The AASHTO girder specimens were loaded and
unloaded using a stroke control at a rate of 0.1in./min. prior to the cracking of the girders and
reloaded using a stroke control rate of 0.1in./min. up to the yielding of the prestressing
strands and a stroke control rate of 0.25 in./min. after the prestressing strands yielded. Then,
the specimens were loaded up to failure.
Figure 3-12 Test set-up schematic
The first test specimen, 10 PS–5 S, which is the 10 ksi girder with a 5 ft. wide slab, indicated
the possibility of rotation of the specimens at failure due to local crushing of the concrete as
Neoprene Pad
CFL Floor
480 in.
72 in.
204 in.
Steel Plate
Spread Beam
Neoprene Pad

Chapter 3 Experimental Program
46
shown in Figure 3-13 (a). To prevent any instability in the test set-up, a frame was installed
diagonally near the loading location. Figure 3-13 (b) indicates the supporting conditions with
a 1 in. steel place above a 2 in. neoprene pad, respectively. Figure 3-13 (c) and (d) show the
test set-up for the AASHTO girder specimens with 5 ft wide decks installed with and without
the lateral frame, respectively. Additionally, Figure 3-13 (e) and (f) show the test set-up for
AASHTO girder specimens with a 1ft wide deck and without a deck.
a) Local crushing at failure
b) Support conditions
c) Test set-up for girder with 5 ft. without lateral frame
Figure 3-13 Typical test set-up for nine AASHTO girder specimens

Chapter 3 Experimental Program
47
d) Test set-up for girder with 5 ft. with lateral frame
e) Test set-up for girder with 1 ft. deck with lateral frame
Figure 3-13 (continued) typical test set-up for nine AASHTO girder specimens

Chapter 3 Experimental Program
48
f) Test set-up for girder without deck with lateral frame
Figure 3-13 (continued) typical test set-up for nine AASHTO girder specimens
3.6.2 External Instrumentation
After placement on the supporting block, the girder specimens with the 1 ft. and 5 ft. wide
deck slab and without the deck slab, were instrumented for measurement of displacements
and strains at several locations along the beam.
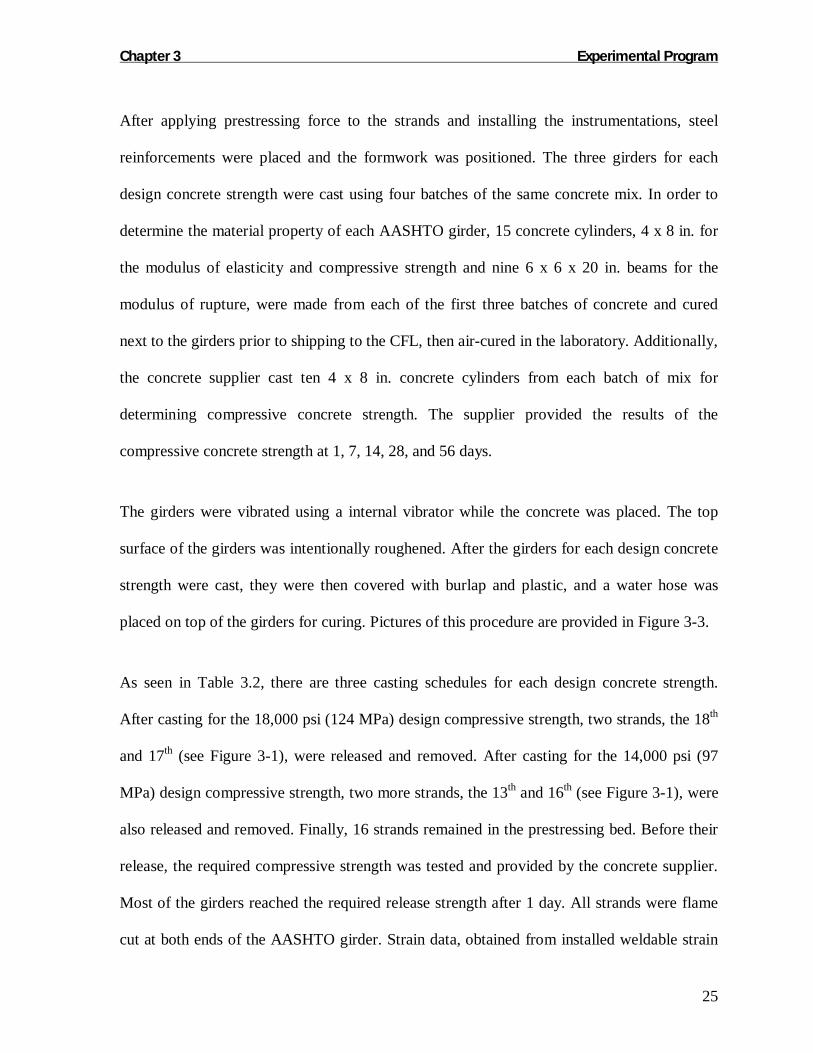
3.6.2.1 Deflection Measurement Device
As shown in Figure 3-14, both string transducers and linear motion transducers (LMTs) were
used to measure girder deflections at both ends, at the quarter-span location, at the loading
Chapter 3 Experimental Program
49
points, and at the mid-span of the girders. Two conventional linear transducers at the ends
were used to measure the relative deflection between the concrete girder and the neoprene
pad.
Figure 3-14 Location of LMTs to measure deflections
3.6.2.2 Strain Measurement Device
Strain measurement devices were placed on the top, bottom, and side surface of concrete
girder to measure the strains at the various loading stage. Both electrical resistance strain
gages and PI gages were installed on extreme top surface of concrete, and within constant
moment zone. Additionally, PI gages were attached to the bottom and side surface of girders
to obtain the strain profile at the given section. In particular, top surface instrumentations
were used to determine the ultimate strain of HSC girder. For the composite AASHTO girder
with a 5ft wide deck, Figure 3-15 shows the locations of both electric strain gages and PI
gages. In the case of AASHTO girder with a 1ft wide deck and without deck, the width of
deck is same with the flange width of AASHTO girder. The locations as shown in Figure
120 in. 84 in. 36 in. String or Conventional LMTs
C.L.
Conventional LMT Conventional LMT

Chapter 3 Experimental Program
50
3-16 and Figure 3-17 for both electric strain gages and PI gages represents AASHTO girders
with 1ft wide deck and without deck respectively. The locations for top and bottom surface
for AASHTO girder without deck are duplicated as same as Figure 3-16 (a) and (b).
a) Top surface
b) Cross section
Figure 3-15 Location of Strain and PI gages for 10PS – 5S, 14PS- 5S and 18PS-5S
19.5in.
4in.
15in.
4in.
24n.
36in.
8in.
SP1
SP2
SP3
NP1
NP2
P1 P2 P3
P4 P5 P6
SP2 SP1
60 in. 12 in. Flange Width of Girder
P1, P3 : 8 in. PI Gages
72 in.
12 in.
12 in.
12 in.
6 in.
12 in. 12 in. S1, S2 : Strain Gages
P1
S1
P2
S2
P3
P2 : 12 in. PI Gages

Chapter 3 Experimental Program
51
c) Bottom surface
Figure 3-15 (continued) Location of Strain and PI gages for 10PS-5S, 14PS–5S
and 18PS-5S
a) Top surface
Figure 3-16 Location of Strain and PI gages for 10PS–1S, 14PS-1S and 18PS-1S
18in.
P4, P6 : 8 in. PI Gages
72in.
12in. 24in.
5in.
4in.
P4
P5
P6
P5 : 12 in. PI Gages
12in.
P1, P3 : 8 in. PI Gages
72in.
12in.
12in.
12in.
2in. 2in. 2in. S1, S2 : Strain Gages
P1
S1
P2
S2
P3
P2 : 12 in. PI Gages

Chapter 3 Experimental Program
52
b) Cross section
c) Bottom surface
Figure 3-16 (continued) Location of Strain and PI gages for 10PS–1S, 14PS–1S and 18PS-1S
18in.
P4, P6 : 8 in. PI Gages
72in.
12in. 24in.
5in.
4in.
P4
P5
P6
P5 : 12 in. PI Gages
19.5in.
4in.
15in.
4in.
24n. 36in.
8in.
SP1
SP2
NP1
SP0
SP3 NP2
34in.
P1 P3
P4 P5 P6
P2
S1 S2

Chapter 3 Experimental Program
53
Figure 3-17 Location of Strain and PI gages for 10PS-N, 14PS–N and 18PS-N
3.6.3 Data Acquisition System
An OPTIM MEGADAC data acquisition system, controlled by the TCS (Test Control
Software) program, was used to record data, including load, stroke, strain, and deflection for
each test. Using this system, the results were graphically monitored using Microsoft Excel
during the data acquisition process.
19.5in.
4in.
15in.
4in.
24in. 36in.
SP1
SP2
NP1
SP0
SP3 NP2
34in.
P1
P4 P5 P6
P2 P3
S1 S2

Chapter 4 Results and Discussion
54
4 RESULTS AND DISCUSSION
4.1 INTRODUCTION
This chapter provides test results and the discussion regarding the flexural response of
prestressed AASHTO girders with HSC.
Section 4.2 summarizes the material properties of the specimens and proposes a
recommended equation for a prediction of the elastic modulus based on statistical analysis. In
addition, the test results are evaluated based on a comparison of the proposed equation and
previous research and current specifications.
Section 4.3 provides the measured prestress losses by the use of internal weldable strain
gauges. The test results are compared with the current AASHTO LRFD specifications (2004)
which contain the most recent research results for HSC, as obtained from tests conducted by
Tadros (2003).
Section 4.4 discusses the measured end slippage that are used to investigate transfer length.
These results are evaluated against the references, as found in AASHTO LRFD specification
(2004) and Oh and kim (2000).
Section 4.5 describes the flexural test results, including ultimate flexural strength and
cracking strength for each of the nine AASHTO girders with HSC tested under static loading
conditions. The measured load-deflection relationships and failure modes are also provided
in this section.

Chapter 4 Results and Discussion
55
4.2 MATERIAL PROPERTIES STUDY
4.2.1 Elastic Modulus
The measured material properties for this study were provided in Section 3.5.2. In addition to
the test results for material properties, the proposed equations for elastic modulus by the
statistical analysis were briefly discussed in Section 2.2.
As published in both AASHTO LRFD (2004), which is similar to the ACI318 (2005), and
ACI363R (1992), the predictive equation for elastic modulus is expressed in terms of the
compressive strength and the dry unit weight of concrete. More specifically, these code
provisions use the relationship of the root of the compressive strength of concrete, as seen in
the Chapter 2.
However, Cook (2005) has developed a predictive equation for the elastic modulus with the
following relationship:
( ) 2453.06738.2ccc fwE ′⋅= , Equation 4-1
where
wc = dry unit weight of concrete (pcf) and
f′c = specified strength of concrete (psi).
However, in practical application, Cook’s equation may be difficult to apply in design.
Therefore, that equation was modified using the experimental results obtained from this

Chapter 4 Results and Discussion
56
study and analytical results discussed in the following section. It is proposed that the
equation for the modulus of elasticity, Ec, be revised as follows:
( ) 33.05.2ccc fwE ′⋅= . Equation 4-2
The measured elastic modulus results obtained from each specimen in this study and other
researchers collected from test results by Andrew (2005) are shown in Figure 4-1 along with
the current code equations, Cook’s equation and the above proposed equation for the elastic
modulus. The predictive equations were generated using a unit weight of 149 pcf as an
average of the measured value. It indicates clearly that the AASHTO LRFD (2004) equation
overestimates the measured results in the high strength concrete. On the other hand, the
elastic modulus in the ACI363R (1992) equation shows a better agreement with measured
test results. In the case of the Cook and the above proposed equations, they were within the
predictions by the LRFD equation and ACI363R equation. However, the Cook’s equation
seems to overestimate the elastic modulus under 10,000 psi concrete compressive strength
and yields relatively high value beyond 10,000 psi concrete.
The research on material properties of HSC performed by Andrew (2005) at North Carolina
State University indicates that the measured values are generally in good agreement with the
ACI 363R-92 equation, regardless of the curing method or compressive strength. The test
results also support the findings of ACI 363R-92 that the AASHTO-LRFD (ACI318-05)
equation consistently overestimates the elastic modulus for HSC.

Chapter 4 Results and Discussion
57
However, it is difficult to judge which one provides more appropriate prediction due to the
limited number of test results and collected data from other researcher. Therefore, more
comprehensive comparison is required to evaluate the predictive equation for the elastic
modulus over the full range of the concrete compressive strength up to 18,000 psi or more.
0
1
2
3
4
5
6
7
8
9
6,000 8,000 10,000 12,000 14,000 16,000 18,000 20,000Compressive Strength (psi)
Elas
tic M
odul
us (p
si x
106 )
AASHTO-LRFD Data by Others *
PC Specimens at 28 Days & at 56 Days PC Specimens at Test Days
Proposed eq. ACI363R-92
Cook (2006)
AASHTO-LRFD
Proposed eq.
ACI363R
Cook
Figure 4-1 Comparison of the elastic modulus between test results and predicted value
To provide a more comprehensive comparison, the 4388 test data entries were collected from
J. Cook (2005), the Noguchi Lab in Japan, M. Tadros (2003), and NCHRP12-64 (2006). The
ranges of parameters in the collected data, including the compressive strength, unit weight,
and measured elastic modulus, are shown in Table 4.1. Detailed information, including the
distribution of the compressive concrete strength and the unit weight, is given in Appendix F.

Chapter 4 Results and Discussion
58
Table 4.1 Range of the Collected Data
Test Data Entries
Compressive Strength (psi)
Unit Weight (lbf)
Elastic Modulus (x106 psi)
4388 370 to 24000 90 to 175.95 0.71 to 10.78
Figure 4-2 (a), (b), (c) and (d) compare the measured elastic modulus data to the following
equations: AASHTO LRFD (2004), ACI 363R-92, Cook’s (2006) and the proposed,
respectively. The figures indicate that the collected data are widely scattered in terms of unit
weight. Based on a comparison of the predicted and measured elastic modulus, Cook’s
equation seems to have a better correlation with the highest R squared values. However, the
majority of the data beyond the elastic modulus value of 4 x 10⁶ psi is overestimated. This
comparison confirms the trend in the Figure 4-1. Similarly, the AASHTO LRFD equation
overestimates the majority of the data beyond the elastic modulus value of 4 x 10⁶ psi. On the
other hands, the ACI363-92 and the author’s proposed equation provide a slightly better
correlation with a higher R2 value.

Chapter 4 Results and Discussion
59
Predicted Vs. Measured Concrete Modulus of Elasticity, Ec = 33 · w1.5 · f'c0.5 (ACI318, AASHTO LRFD)
0
2
4
6
8
10
0 2 4 6 8 10Measured Modulus of Elasticity, E x10^6 psi
Pred
icte
d M
odul
us o
f Ela
stic
ity, E
x10
^6 p
si
90 ≤ w < 110 pcf 110 ≤ w < 120 pcf 120 ≤ w < 130 pcf
130 ≤ w < 140 pcf 140 ≤ w < 150 pcf w ≥ 150 pcf
R2=0.68
a) AASHTO LRFD and ACI318
Predicted Vs. Measured Concrete Modulus of Elasticity, Ec = (40,000 · f'c0.5+106) · (w/145)1.5 (ACI363R)
0
2
4
6
8
10
0 2 4 6 8 10Measured Modulus of Elasticity, E x10^6 psi
Pre
dict
ed M
odul
us o
f Ela
stic
ity, E
x10
^6 p
si
90 ≤ w < 110 pcf 110 ≤ w < 120 pcf 120 ≤ w < 130 pcf
130 ≤ w < 140 pcf 140 ≤ w < 150 pcf w ≥ 150 pcf
R2=0.71
b) ACI363R
Figure 4-2 Comparison between predicted E and measured E with various equations; a) AASHTO LRFD and ACI318; b)ACI363R; c) Cook’s; d) Proposed

Chapter 4 Results and Discussion
60
Predicted Vs. Measured Concrete Modulus of Elasticity, Ec = w2.6738 · f'c0.2453 (Cook's)
0
2
4
6
8
10
0 2 4 6 8 10
Measured Modulus of Elasticity, E x10^6 psi
Pre
dict
ed M
odul
us o
f Ela
stic
ity, E
x10
^6 p
si
90 ≤ w < 110 pcf 110 ≤ w < 120 pcf 120 ≤ w < 130 pcf
130 ≤ w < 140 pcf 140 ≤ w < 150 pcf w ≥ 150 pcf
R2=0.78
c) Cook’s equation
Predicted Vs. Measured Concrete Modulus of Elasticity, Ec = w2.5 · f'c0.33 (Proposed)
0
2
4
6
8
10
0 2 4 6 8 10Measured Modulus of Elasticity, E x10^6 psi
Pre
dict
ed M
odul
us o
f Ela
stic
ity, E
x10
^6 p
si
90 ≤ w < 110 pcf 110 ≤ w < 120 pcf 120 ≤ w < 130 pcf
130 ≤ w < 140 pcf 140 ≤ w < 150 pcf w ≥ 150 pcf
R2=0.76
d) Proposed equation
Figure 4-2 (continued) Comparison between predicted E and measured E with various equations; a) AASHTO LRFD and ACI318; b)ACI363R; c) Cook’s; d) Proposed

Chapter 4 Results and Discussion
61
To evaluate the accuracy of the current equations and the proposed equation, a statistical
analysis was conducted using the following normal distribution formula. The normal
distributions of the collected data with respect to the current AASHTO LRFD (2004), ACI
363R-92, Cook’s (2005) and the proposed equation are shown in Figure 4-3 in which P(x) is
the probability function, defined as follows:
( )2
21( ) exp
22x
P xµ
σσ π
−= −
, Equation 4-3
where
σ = the standard deviation,
exp = the exponential function,
µ = the mean and
x = the variable.
Results of the statistical analysis for the ratio of the predicted to the measured elastic
modulus with respect to the various predictive equations are shown in Table 4.2.
Table 4.2 Results of Statistical Analysis
Equation Mean (m) Standard Deviation (σ) ( )πσ 21
AASHTO LRFD 1.06 0.18 2.18
ACI363R 0.95 0.15 2.72
Cook’s 1.09 0.18 2.22
Proposed 0.99 0.16 2.48
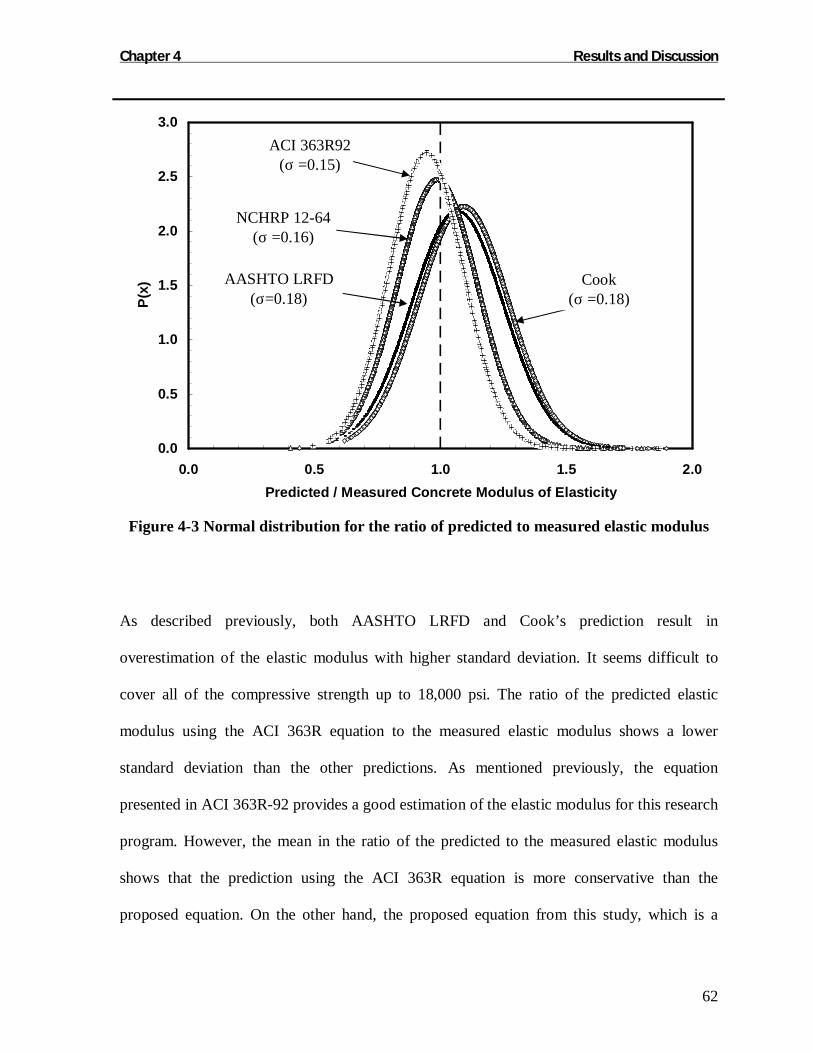
Chapter 4 Results and Discussion
62
0.0
0.5
1.0
1.5
2.0
2.5
3.0
0.0 0.5 1.0 1.5 2.0Predicted / Measured Concrete Modulus of Elasticity
P(x)
Figure 4-3 Normal distribution for the ratio of predicted to measured elastic modulus
As described previously, both AASHTO LRFD and Cook’s prediction result in
overestimation of the elastic modulus with higher standard deviation. It seems difficult to
cover all of the compressive strength up to 18,000 psi. The ratio of the predicted elastic
modulus using the ACI 363R equation to the measured elastic modulus shows a lower
standard deviation than the other predictions. As mentioned previously, the equation
presented in ACI 363R-92 provides a good estimation of the elastic modulus for this research
program. However, the mean in the ratio of the predicted to the measured elastic modulus
shows that the prediction using the ACI 363R equation is more conservative than the
proposed equation. On the other hand, the proposed equation from this study, which is a
ACI 363R92 (σ =0.15)
NCHRP 12-64 (σ =0.16)
AASHTO LRFD (σ=0.18)
Cook (σ =0.18)
Chapter 4 Results and Discussion
63
modified Cook’s equation, shows that the mean of the ratio of the predicted to the measured
elastic modulus is closest to 1, even though the standard deviation is slightly higher than that
of the ACI 363R-92 equation. On the basis of these findings, the proposed equation for the
elastic modulus is believed to be more appropriate for the compressive concrete strength up
to 18,000 psi.
4.2.2 Modulus of Rupture
The modulus of rupture provides an indirect measurement of tensile strength of concrete.
Typically, most design codes include an equation for the modulus of rupture of concrete as it
relates to the compressive strength. LRFD Specification gives two the modulus rupture value,
one is for calculating deflection and the other is used to determine the minimum
reinforcement ratio. The smaller value of the two, equation for calculating the deflection and
camber is presented as follows:
cr ff ′= 5.7 (psi), Equation 4-4
where
rf = the modulus of rupture and
'cf = the specified compressive strength.
On the other hand, the equation for determining minimum reinforcement in the LRFD
specification as well as the presented equation in ACI 363R-92 (1981) discussed in Section
2.2.2 is given as follows:

Chapter 4 Results and Discussion
64
cr ff ′= 7.11 (psi). Equation 4-5
The measured modulus of rupture for the nine girders given in Section 3.5.2, as well as the
data collected from Légeron and Paultre (2000), Paultre and Mitchell (2003), the Noguchi
Laboratory, and NCHRP 12-64 (2006) are graphically shown in Figure 4-4. This figure
obviously shows that the ACI 363R is in a good agreement with the measured test results
obtained from other researches, whereas, the smaller value in the LRFD specification shows
a better agreement with the test results conducted in this study. Andrew, (2006) and
Mokhtarzadeh, (1996) showed that the modulus of rupture was mainly affected by the
moisture condition and curing condition.
0
200
400
600
800
1,000
1,200
1,400
1,600
1,800
4,000 6,000 8,000 10,000 12,000 14,000 16,000 18,000 20,000Compressive Strength (psi)
Mod
ulus
of R
uptu
re (p
si)
PC Specimens at 28 Days PC Specimens at Test Days Data by Others *
ACI 363R-92
AASHTO LRFD
fr = 6√f’c psi
Figure 4-4 Modulus of rupture versus compressive strength

Chapter 4 Results and Discussion
65
The results from NCHRP 12-64 (2006) suggest that the equation published in ACI 363R-92
correlates well with the measured values obtained from specimens that are moist-cured
continuously up to the time of testing. However, in most practical applications, the curing
period of concrete is shorter than that study would suggest. Therefore, the case of the
prestressed concrete girders may be more similar to the specimens that had been air cured
after moist curing or heat curing for several days. The fabricated girder specimens for this
study were air cured the initial moist curing for one or two days.
The test results from this study provide good examples for practical applications. The smaller
value in the AASHTO LRFD specification (2004) appears to be more suitable for estimating
the modulus of rupture for those girder specimens. These test results are in good agreement
with the test results conducted by Andrew (2005). Andrew states that, “The equation
published in ACI 363R-92 overestimates the modulus of rupture for the ASTM curing
methods. The smaller value in the LRFD specification suggested applicable prediction of
modulus of rupture for these two different curing conditions which are moisture and heat
curing.” On the basis of these findings, the current AASHTO LRFD (2004) equation for the
modulus of rupture seems more appropriate for HSC. However, in this research, the lower
bound equation for modulus of rupture, which is 6√f'c was used for the following study.
4.3 PRESTRESS LOSSES
As described in the instrumentation Section 3.4.1 previously, internal weldable strain gauges
were installed on the bottom strand of each girder specimen and monitored regularly in order
Chapter 4 Results and Discussion
66
to monitor the prestress force in the strands. The measured strains from the internal strain
gauges were then used to determine the elastic shortening at transfer and the long-term
effects.
In prestressed concrete girders, the primary instant loss of prestress at transfer is due to the
elastic shortening of the concrete member. In addition to elastic shortening, the long-term
effects consist of concrete shrinkage, creep, and relaxation of the prestressing strand.
The AASHTO-LRFD Refined Method (2004), developed by Tadros (2003), is used in this
study to evaluate and compute the prestress losses in members that are constructed and
prestressed in a single stage. The equation is composed of the sum of individual loss
components, as follows:
pT pES pLTf f f∆ = ∆ + ∆ , Equation 4-6
where ΔfpT = total loss (ksi),
ΔfpES = sum of all losses or gains due to elastic shortening or extension at the time of
application of prestress and/or external loads (ksi),
ΔfpLT = losses due to long-term shrinkage and creep of concrete, and relaxation of the steel
(ksi).
After applying prestress force onto the girders, stress reduction occurs in the structure due to
elastic shortening, creep, shrinkage, and relaxation. These reductions, or prestress losses,
interact with each other. When the prestress force is transferred to the girder concrete through
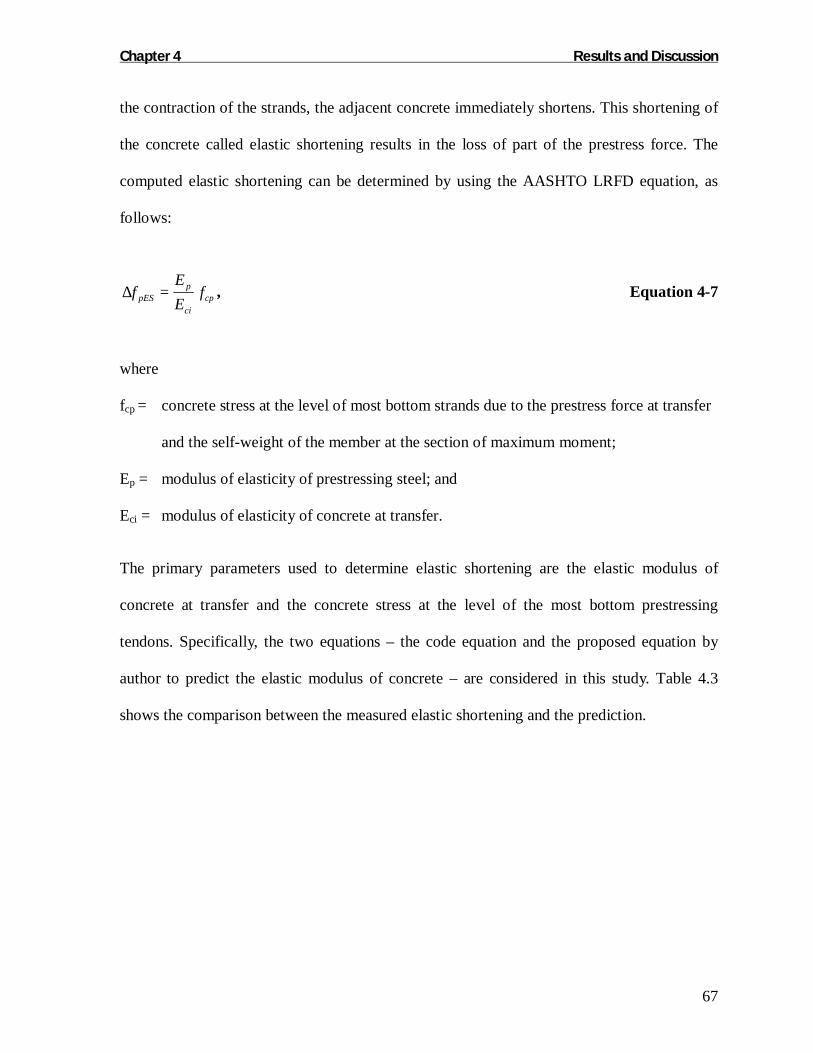
Chapter 4 Results and Discussion
67
the contraction of the strands, the adjacent concrete immediately shortens. This shortening of
the concrete called elastic shortening results in the loss of part of the prestress force. The
computed elastic shortening can be determined by using the AASHTO LRFD equation, as
follows:
cpci
ppES f
EE
f =∆ , Equation 4-7
where
fcp = concrete stress at the level of most bottom strands due to the prestress force at transfer
and the self-weight of the member at the section of maximum moment;
Ep = modulus of elasticity of prestressing steel; and
Eci = modulus of elasticity of concrete at transfer.
The primary parameters used to determine elastic shortening are the elastic modulus of
concrete at transfer and the concrete stress at the level of the most bottom prestressing
tendons. Specifically, the two equations – the code equation and the proposed equation by
author to predict the elastic modulus of concrete – are considered in this study. Table 4.3
shows the comparison between the measured elastic shortening and the prediction.

Chapter 4 Results and Discussion
68
Table 4.3 Elastic Shortening at Transfer
Computed Elastic Shortening with Identification Gauge
Number Measured
Strain (µε) Loss %
Measured Average Losses Code E Proposed E
1_4 465 7% 18PS-1S
1_6 761 12% 9.5% 7.9% 7.9%
2_3 261 4% 18PS-5S
2_4 396 6% 5.0% 7.8% 7.9%
3_1 403 7% 18PS-N
3_3 398 7% 7.0% 7.6% 7.7%
4_4 487 8% 14PS-1S
4_6 502 8% 8.0% 7.7% 7.5%
5_3 431 7% 14PS-5S
5_4 464 7% 7.0% 8.2% 7.9%
6_1 477 8% 14PS-N
6_3 486 9% 8.5% 8.2% 7.9%
7_4 498 8% 10PS-1S
7_6 545 9% 8.5% 6.8% 6.6%
10PS-5S 8_3 532 8% 8.0% 6.8% 6.6%
10PS-N 9_1 472 7% 7.0% 6.7% 6.6%
Average 7.6% 7.5% 7.4%
Based on the measured strain at the most bottom strands, the losses due to elastic shortening
are averages 7.6 percent of the initial prestressing stress. These results are slightly higher

Chapter 4 Results and Discussion
69
than the LRFD equation with using the elastic modulus in the code equation and in the
proposed equation. However, from the practical point of view, the measured results provide a
reasonable agreement with the LRFD equation.
After instantaneous prestress loss, concrete structures under a sustained load experience
creep and shrinkage at the same time. Test results measured by internal strain gauges were
compared to the current creep and shrinkage predictions specified by AASHTO LRFD
Bridge Design Specifications (2004), developed by Tadros (2003). The major equations to
calculate creep and shrinkage of concrete are given in Table 4.4. In the table:
εsh = the predicted shrinkage strain;
Ψ = the predicted creep coefficient;
t = he age of the concrete after loading, in days;
ti = the age of the concrete when the load is initially applied for accelerated curing or the
age minus 6 days for moist-curing, in days;
cif ' = the specified compressive strength in ksi at transfer for prestressed members or 80
percent of the strength at service for non-prestressed members;
V S = the volume-to-surface ratio, in inches; and
H = the relative humidity of the ambient air.
Several steps are required to determine the prestress losses based on the AASHTO LRFD
equation. For example, a detailed calculation procedure adopted from Tadros (2003) to
determine prestress losses for 10PS-5S is given in Appendix H.

Chapter 4 Results and Discussion
70
Table 4.4 Creep and Shrinkage Prediction Relationships by AASHTO LRFD
Shrinkage Creep
Equation 6480 10sh td s hs fk k k kε −= × ( ), 1.90i td la s hc ft t k k k k kΨ =
tdk (time development factor) 61 4 'td
ci
tkf t
=− +
hchsk , (humidity factor) Hkhs 0143.000.2 −= Hkhc 008.056.1 −=
sk (size factor) 735
/941064 SVk s−
=
fk (concrete strength factor) ci
f fk
'15
+=
lak (loading age factor) - 118.0−= ila tk
Table 4.5 shows the comparison between the measured prestress loss at test day and the
predicted value from the AASHTO LRFD (2004) using the two different equations of the
elastic modulus, i.e., code and proposed by author. As can be seen in the Table 4.5, the
measured prestress losses at the level of the most bottom strands result are not consistent.
However, it appears that roughly 11.4 percent of the losses stem from the initial prestressing
force. On the other hand, the predicted results in the LRFD specification with two types of
elastic modulus are approximately 15 percent of the initial prestressing force.
Additionally, the effective prestressing force can be evaluated with the cracking strength and
the measured modulus of rupture. Related study about the cracking strength will be discussed
in the following Section 5.2.1. Herein, the calculated prestress losses with the measured
values are also given in the same table. On the basis of the calculated prestressed losses with
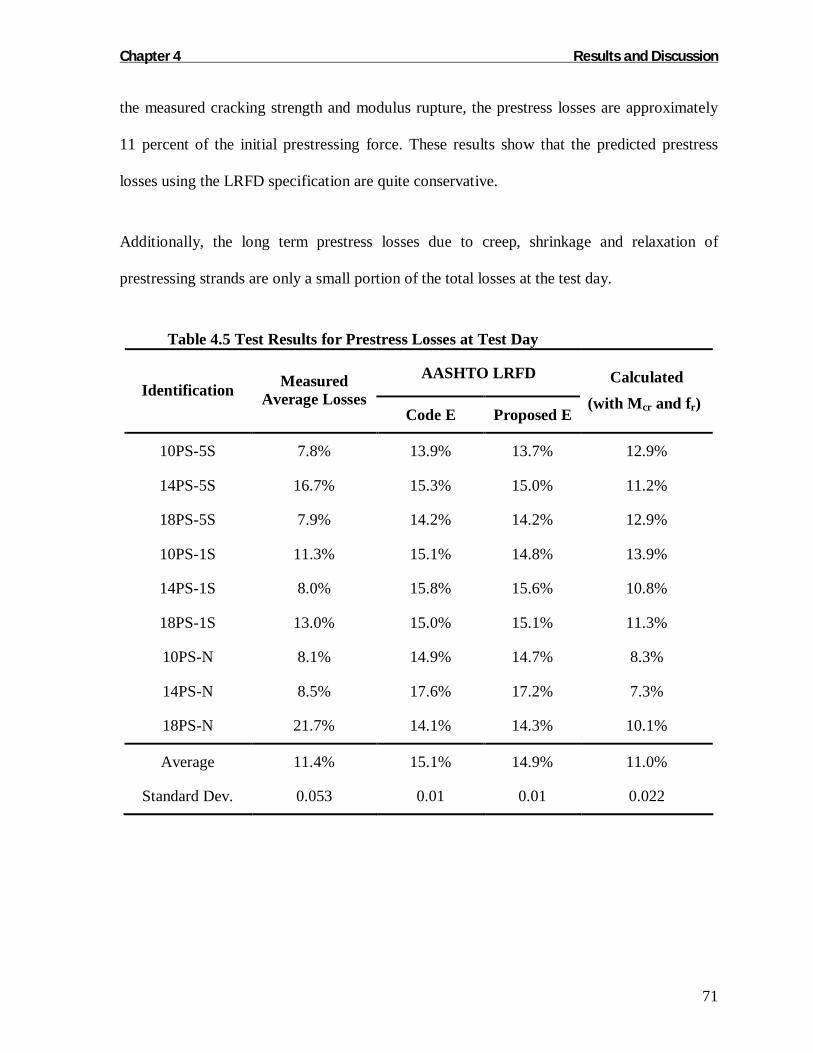
Chapter 4 Results and Discussion
71
the measured cracking strength and modulus rupture, the prestress losses are approximately
11 percent of the initial prestressing force. These results show that the predicted prestress
losses using the LRFD specification are quite conservative.
Additionally, the long term prestress losses due to creep, shrinkage and relaxation of
prestressing strands are only a small portion of the total losses at the test day.
Table 4.5 Test Results for Prestress Losses at Test Day
AASHTO LRFD Identification Measured
Average Losses Code E Proposed E
Calculated (with Mcr and fr)
10PS-5S 7.8% 13.9% 13.7% 12.9%
14PS-5S 16.7% 15.3% 15.0% 11.2%
18PS-5S 7.9% 14.2% 14.2% 12.9%
10PS-1S 11.3% 15.1% 14.8% 13.9%
14PS-1S 8.0% 15.8% 15.6% 10.8%
18PS-1S 13.0% 15.0% 15.1% 11.3%
10PS-N 8.1% 14.9% 14.7% 8.3%
14PS-N 8.5% 17.6% 17.2% 7.3%
18PS-N 21.7% 14.1% 14.3% 10.1%
Average 11.4% 15.1% 14.9% 11.0%
Standard Dev. 0.053 0.01 0.01 0.022

Chapter 4 Results and Discussion
72
4.4 TRANSFER LENGTH
In this study, the transfer length was not measured directly. However, the transfer length can
be evaluated for each of the AASHTO girders by measuring the end slippage of the
prestressing strand at transfer. End slippage was measured using tape measurement readings
taken before and after release at specified locations. The required transfer length for a
prestressing strand provided in the AASHTO LRFD specifications is:
bt dl 60= , Equation 4-8
where lt is the transfer length and db is the nominal diameter of the prestressing strand.
On the other hands, the predicted equation for transfer in ACI318 specifications is 50 db.
These required transfer length in the LRFD and ACI 318 for ½ in. diameter strand is 30 in.
and 25 in., respectively.
In addition to these code values, Oh et al. (2000) proposed an equation as a function of end
slippage to predict the transfer length. The equation for the transfer length is as follows:
pi
pt f
El
δ2= , Equation 4-9
where lt is the transfer length, Ep is the modulus of elasticity of the strand, δ is the strand end
slippage, and fpi is the initial prestress of the strand just before detensioning.
Using the above equations to compute the transfer length, the computed transfer lengths for
each girder specimen are listed in Table 4.6.

Chapter 4 Results and Discussion
73
Table 4.6 Summary of End Slippage and Transfer Length
Specimen δ* (in) Oh and Kim (2000)
(in.)
18PS-1S 2/16 29
18PS-5S 1/16 23
18PS-N 1/16 23
Average 1/16 25
14PS-1S 1/16 12
14PS-5S 2/16 35
14PS-N 2/16 29
Average 2/16 25.3
10PS-1S 2/16 29
10PS-5S 3/16 55
10PS-N 1/16 15
Average 2/16 33
* indicates a round up value
The average computed transfer length using end slippage as shown in Table 4-6 are in the
range from 25 to 33 in. These estimated transfer lengths within the requirement of these two
provisions are in reasonable agreement. Consequently, the equation in the LRFD
specification seems to predict the transfer length reasonably well.

Chapter 4 Results and Discussion
74
4.5 CAMBER
The measured cambers for each girder specimen were compared in the Table 4.7. To
calculate camber with different elastic modulus of concrete, the average initial prestressing
force by the load cells for each target strength girder, and assuming 10 percent prestress
losses were used. The elastic modulus was predicted with unit weight of concrete for 149 pcf.
As can be seen in Table 4.7, the calculated camber by the proposed elastic modulus provided
less value than that by the elastic modulus in the LRFD specification.
Table 4.7 Summary of Camber Results
Calculated Camber (in.) using Specimen Measured
Camber (in) Code E Proposed E Measured E
18PS-1S 5/8 0.51 0.51 0.49
18PS-5S 1/2 0.50 0.51 0.47
18PS-N 1/2 0.49 0.50 0.44
14PS-1S 5/8 0.50 0.49 0.42
14PS-5S 5/8 0.53 0.51 0.44
14PS-N 1/2 0.53 0.51 0.46
10PS-1S 1/2 0.44 0.43 0.38
10PS-5S 1/2 0.44 0.43 0.39
10PS-N 5/8 0.44 0.43 0.35

Chapter 4 Results and Discussion
75
4.6 FLEXURAL RESPONSE
This section presents the flexural test results of nine AASHTO girders under static loading
conditions. The ultimate flexural resistance, cracking resistance, load-deflection relationship
and failure mode for all the girder specimens are summarized in this section. Based on the
test results, the major findings in this study are discussed.
4.6.1 AASHTO Girders with a 5 ft. Wide Deck
Three composite AASHTO girders, each with a 5 ft. wide deck, and identified as 10PS-5S,
14-PS-5S and 18PS-5S, were tested under static loading conditions. As mentioned in the
design consideration, three girders were designed to be subjected to the compressive force
controlled by the deck concrete with NSC. The load-deflection relationships for the
composite girders with a 5 ft. deck slab are presented in Figure 4-5. The figure shows the net
deflection at mid span, after accounting for the deflections measured at both supports.
As described previously in the loading procedure, load was applied twice before failure of
the girders. Once the initial cracking of the concrete girder was observed, the girders was
unloaded and reloaded up to failure. The initial flexural stiffness of the three composite
girders was linearly elastic up to the yielding of the prestressing strands and the cracking of
the concrete girders. Moreover, the initial flexural stiffness of the composite girders prior to
initial cracking is not significantly different with respect to the strength of the girder, that is,
whether it is 10,000, 14,000 or 18,000 psi. Figure 4-5 indicates that the flexural stiffness of
the girders is not proportional to the compressive strength of the girder concrete. In the figure,
it is clear that the load-deflection behavior becomes nonlinear after the section was cracked.

Chapter 4 Results and Discussion
76
0
50,000
100,000
150,000
200,000
250,000
300,000
0 2 4 6 8 10 12 14
Net deflection at mid span (in.)
Load
(lbs
)
Figure 4-5 Load-deflection behavior for 10, 14, 18PS-5S
As can be seen in the above figure, the net deflection at mid span was relatively large at the
failure. The observed initial cracking load and ultimate load at failure for each specimen are
given in Table 4.8.
Table 4.8 Observed Test Results for 10PS – 5S, 14PS – 5S and 18PS-5S
Identification Cracking Load
(kips) Ultimate Load
(kips)
10PS-5S 129 229.0
14PS-5S 149 255.5
18PS-5S 162 278.4
10PS-5S
14PS-5S
18PS-5S
480 in.
72 in.
204 in.

Chapter 4 Results and Discussion
77
As discussed in section 3.4, during the static loading phase, the strain envelopes for each
specimen were measured at top surface of the deck concrete, at bottom surface and side
surface of the girder. For 18PS-5S, the measured strain envelopes at three locations were
given in the Figure 4-6. Locations of the strain gauge are given in Figure 4-6 (a). Figure 4-6
(b) indicates a typical strain envelope by the PI gauges and the concrete strain gauges at the
top surface of the deck. Figure 4-6 (c) provides the strain profile at the bottom surface.
Figure 4-6 (d) presents the strain at the bottom surface of the girder. All strain envelope
clearly show that the strain became a nonlinear response after the girder was cracked.
Detailed strain envelopes for the rest of two specimens are given in Appendix G. In all cases
of the three composite AASHTO girders with a 5 ft. wide deck, the measured strain at the top
surface of the deck concrete at failure was higher than the ultimate strain of the concrete, that
is, 0.003, as specified in AASHTO LRFD (2004).
Using the strain envelope at a specific location, the average strains at the top surface and
bottom surface under a given loading stage were used to determine the neutral axis location
by the plane section assumption. The applied moment at the mid span in Figure 4-7 was
determined from the measured load, but the dead load moment was not included in the
calculation.

Chapter 4 Results and Discussion
78
a) Location of the strain gauges
0
50,000
100,000
150,000
200,000
250,000
300,000
0 0.001 0.002 0.003 0.004 0.005
Strain (ε )
Load
(lbs
)
P2 P1 P3 S1 S2
S1, P2 and P3
P1 and S2
b) Strain at the top surface
Figure 4-6 Strain envelopes for 18PS-5S
SP1
SP2
SP3
NP1
NP2
P1 P2 P3
P4 P5 P6
S1 S2
Compression

Chapter 4 Results and Discussion
79
0
50,000
100,000
150,000
200,000
250,000
300,000
-0.04 -0.035 -0.03 -0.025 -0.02 -0.015 -0.01 -0.005 0
Strain (ε )
Load
(lbs
)P4 P5 P6
P6
P4P5
c) Strain at the bottom surface
0
50,000
100,000
150,000
200,000
250,000
300,000
-0.04 -0.035 -0.03 -0.025 -0.02 -0.015 -0.01 -0.005 0
Strain (ε )
Load
(lbs
)
SP1 SP2 SP3
NP1 NP2NP1 and SP1
SP3 NP2SP2
d) Strain at the side surface
Figure 4-6 (continued) Strain envelopes for 18PS-5S
Tension
Tension
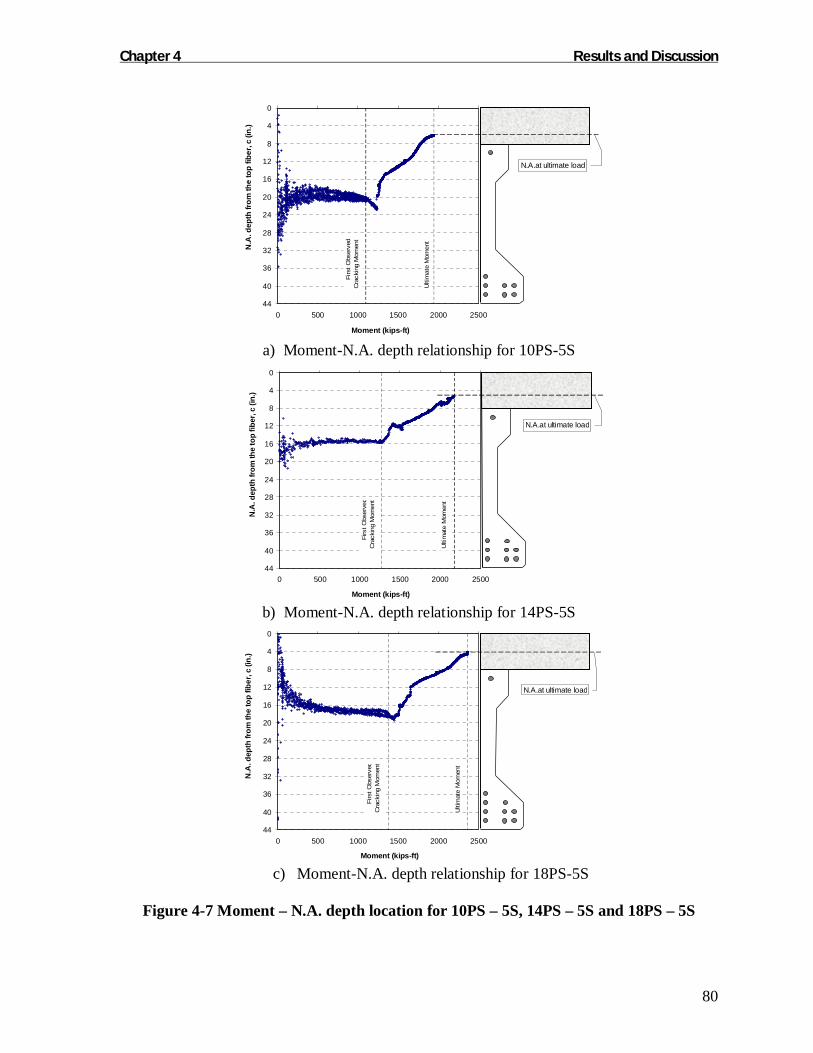
Chapter 4 Results and Discussion
80
0
4
8
12
16
20
24
28
32
36
40
440 500 1000 1500 2000 2500
Moment (kips-ft)
N.A
. dep
th fr
om th
e to
p fib
er, c
(in.
)
Firs
t Obs
erve
d C
rack
ing
Mom
ent
Ulti
mat
e M
omen
t
N.A.at ultimate load
a) Moment-N.A. depth relationship for 10PS-5S
0
4
8
12
16
20
24
28
32
36
40
440 500 1000 1500 2000 2500
Moment (kips-ft)
N.A
. dep
th fr
om th
e to
p fib
er, c
(in.
)
Firs
t Obs
erve
d C
rack
ing
Mom
ent
Ulti
mat
e M
omen
t
N.A.at ultimate load
b) Moment-N.A. depth relationship for 14PS-5S
0
4
8
12
16
20
24
28
32
36
40
440 500 1000 1500 2000 2500
Moment (kips-ft)
N.A
. dep
th fr
om th
e to
p fib
er, c
(in.
)
Firs
t Obs
erve
d C
rack
ing
Mom
ent
Ulti
mat
e M
omen
t
N.A.at ultimate load
c) Moment-N.A. depth relationship for 18PS-5S
Figure 4-7 Moment – N.A. depth location for 10PS – 5S, 14PS – 5S and 18PS – 5S

Chapter 4 Results and Discussion
81
It is clear that the neutral axis at the failure was located in the deck concrete as shown in
Figure 4.7.
Figure 4-8 indicates a typical failure mode for AASHTO girders with a 5 ft. wide deck. At
the first loading phase, once the initial crack was observed, the load was recorded and
unloaded as shown in Figure 4-8 (a). At the second loading phase, after the prestressing
strands were ruptured, failure of the specimens occurred due to the crushing of the deck
concrete near one of the load locations as shown in Figure 4-8 (b). Whereas, Figure 4-8 (c)
shows the typical deformed shape of the girders immediately after the deck concrete is
crushed. Deflection at failure of the composite girders was quite large (see Figure 5-4). All
three of the specimens failed due to the compressive force controlled by the NSC, and the
crack was propagated to the deck concrete as expected in the design. The flexural cracks
developed along the girder length. They seemed to match with the location of the stirrup with
every 6 in. along with the girder.
a) The initial observed crack b) Crushing of deck concrete at failure
Figure 4-8 Typical failure mode for the AASHTO girder with a 5 ft. wide deck
Crushed deck concrete

Chapter 4 Results and Discussion
82
c) Deformed shape after failure
Figure 4-8 (continued) Typical failure mode for the AASHTO girder with a 5 ft. wide deck

Chapter 4 Results and Discussion
83
4.6.2 AASHTO Girders with a 1 ft. Wide Deck
Three composite AASHTO girders, each with a 1 ft. wide deck and identified as 10PS-1S,
14-PS-1S and 18PS-1S, were tested under static loading conditions. As mentioned in the
design consideration, these girders were designed to have the compressive force controlled
by the combination of two types of concrete strength, that is, the NSC for the cast-in-place
deck and the HSC for the girder.
The load-deflection curves for the three composite girders with a 1 ft. deck slab are presented
in Figure 4-9. The figures show the net mid-span deflection after the deflections measured at
the support were accounted for.
In the same manner as the girders with the 5 ft. wide deck, the load was applied twice before
failure of the girders. Once the initial cracking of the concrete girder was observed, the
girders were unloaded and reloaded up to failure. The initial flexural stiffness of the three
composite girders was linearly elastic up to yielding of the prestressing strands and cracking
of the concrete girders. Moreover, the initial flexural stiffness of the composite girder prior to
the initial cracking was not proportional to the strength of girder, that is, whether it is 10,000,
14,000 or 18,000 psi. Figure 4-9 indicates that the flexural stiffness of girder 18PS-1S is
lower than that of 14PS-1S. This result is in good agreement with the test results of the
material properties of girder concrete. A small drop in load level was observed due to the
shifting of the internal compressive force to the HSC flange of the girder near the point of
failure. Deflection at failure of the composite girders was relatively small in compression
with that of the composite girder with 5 ft. wide deck slab.

Chapter 4 Results and Discussion
84
0
50,000
100,000
150,000
200,000
250,000
300,000
0 2 4 6 8 10 12 14
Net deflection at mid span (in.)
Load
(lbs
)
Figure 4-9 Load-deflection behavior for 10PS – 1S, 14PS – 1S and 18PS-1S
The observed initial cracking load and ultimate load at failure for each specimen are given in
Table 4.9.
Table 4.9 Observed Test Results for 10PS - 1S, 14PS – 1S and 18PS-1S
Identification Cracking Load
(kips) Ultimate Load
(kips)
10PS-1S 110 194.7
14PS-1S 124 217.0
18PS-1S 133 233.7
10PS-1S
14PS-1S
18PS-1S
480 in.
72 in.
204 in.

Chapter 4 Results and Discussion
85
Figure 4-10 (a), (b), (c) and (d) indicate the strain gauge locations, a typical strain envelope
by the PI gauges and the concrete strain gauges at the extreme top surface, at the bottom
surface and at the side surface of the specimen, respectively in 10PS-1S. The strain envelope
for specimens: 14PS-1S and 18PS-1S are given in Appendix G. In all three cases, the
measured strain at the top surface of the deck concrete where the concrete was crushed is
higher than the ultimate strain of the concrete, 0.003, as specified in AASHTO LRFD (2004).
The discrepancy in the strain envelope for each gauge on the top surface of the deck concrete
most likely resulted from the shrinkage cracks on the surface of the deck concrete. As the
composite girder with a 5ft wide deck, the moment versus neutral axis location from top fiber
is shown in Figure 4-11.

Chapter 4 Results and Discussion
86
a) Strain gauge location for 10PS-1S
0
50,000
100,000
150,000
200,000
250,000
0 0.001 0.002 0.003 0.004
Strain (ε )
Load
(lbs
)
P1 P2 P3
S1 S2
S1
S2 P3
P1
P2
b) Strain at the top surface
Figure 4-10 Strain envelopes for 10PS-1S
SP1
SP2
NP1
SP0
SP3 NP2
P1 P3
P4 P5 P6
P2
S1 S2
Compression

Chapter 4 Results and Discussion
87
0
50,000
100,000
150,000
200,000
250,000
-0.025 -0.02 -0.015 -0.01 -0.005 0Strain (ε )
Load
(lbs
)
P4 P5 P6
P4 P5P6
c) Strain at the bottom surface
0
50,000
100,000
150,000
200,000
250,000
-0.012 -0.01 -0.008 -0.006 -0.004 -0.002 0 0.002 0.004 0.006Strain (ε )
Load
(lbs
)
SP0 SP1 SP2SP3 NP1 NP2
SP3
NP2
SP0
CompressionTension
SP2
NP1
SP1
d) Strain at the side surface
Figure 4-10 (continued) Strain envelopes for 10PS-1S
Tension

Chapter 4 Results and Discussion
88
0
4
8
12
16
20
24
28
32
36
40
440 500 1000 1500 2000
Moment (kips-ft)
N.A
. dep
th fr
om th
e to
p fib
er, c
(in.
)
Firs
t Obs
erve
d C
rack
ing
Mom
ent
Ultim
ate
Mom
ent
N.A.at ultimate load
a) Moment-N.A. depth relationship for 10PS-1S
0
4
8
12
16
20
24
28
32
36
40
440 500 1000 1500 2000
Moment (kips-ft)
N.A
. dep
th fr
om th
e to
p fib
er, c
(in.
)
Firs
t Obs
erve
d C
rack
ing
Mom
ent
Ultim
ate
Mom
ent
N.A.at ultimate load
b) Moment-N.A. depth relationship for 14PS-1S
0
4
8
12
16
20
24
28
32
36
40
440 500 1000 1500 2000 2500
Moment (kips-ft)
N.A
. dep
th fr
om th
e to
p fib
er, c
(in.
)
Firs
t Obs
erve
d Cr
acki
ng M
omen
t
Ulti
mat
e M
omen
t
N.A.at ultimate load
c) Moment-N.A. depth relationship for 18PS-1S
Figure 4-11 Moment – N.A. depth location for 10PS – 1S, 14PS – 1S and 18PS – 1S

Chapter 4 Results and Discussion
89
As can be seen in Figure 4-11, the neutral axis depth is located in the flange of the girder as
called for by the design.
For this case, the internal compressive force was resisted by two types of concrete with
different compressive strength. Figure 4-12 shows the typical failure mode of the composite
girder with a 1ft wide deck. Failure of the AASHTO girder with a 1 ft. wide deck was
preceded by the crushing of the deck concrete and the crushing of the girder concrete. In the
first loading phase, once the initial crack was observed, the load was recorded and unloaded
as shown in Figure 4-12 (a). As described in the load-deflection relation for the composite
girder with a 1ft deck, the internal compressive force shifted downward onto the girder with
high strength concrete as can be seen in Figure 4-12 (b). Consequently, the equilibrium force
was slightly reduced after the peak load. For a while, the girder concrete resisted against the
compression force. Afterward, the sudden failure was observed at the constant moment
region as shown in Figure 4-12 (c). The strain envelope, SP0 in the Figure 4-10 (c) confirms
this phenomenon.
Additionally, the reinforcement on the deck and the strands on the girder were buckled at
failure as shown in Figure 4-12 (d).
Figure 4-12 (e) shows the typical deformed shape of the girders immediately after the girder
concrete was crushed. All three specimens failed due to the compressive force controlled by
the combination of the NSC for the deck and the HSC for the girder that was expected in the
design consideration.

Chapter 4 Results and Discussion
90
a) The initial observed crack
b) Transfer of compression force
c) At failure
d) Bucking of the reinforcement and strand
Figure 4-12 Typical failure modes for the AASHTO girder with a 1 ft. wide deck
NSC
HSC
Deck
Girder

Chapter 4 Results and Discussion
91
e) Deformed shape after failure
Figure 4-12 (continued) Typical failure modes for the AASHTO girder with a 1 ft. wide deck
4.6.3 AASHO Girder without Deck
Three AASHTO girders without a deck, 10PS-N, 14PS-N and 18PS-N, were tested under
static loading conditions. As mentioned in the design consideration, these girders were
designed to be have the compressive zone of the girder controlled only by HSC. The load-
deflection relationships for the three girders are presented in Figure 4-13. The figure shows
the net mid-span deflection, after eliminating the effect of the deflections at both supports.
In the same manner as noted for the other girders, the load was applied twice before the
failure of the girders. Once the initial cracking of the concrete girder was observed, the
girders were unloaded and reloaded up to failure. The initial flexural stiffness of the three
composite girders was linearly elastic up to the yielding of the prestressing strands and the
cracking of the concrete. Moreover, the initial flexural stiffness of the girder prior to the
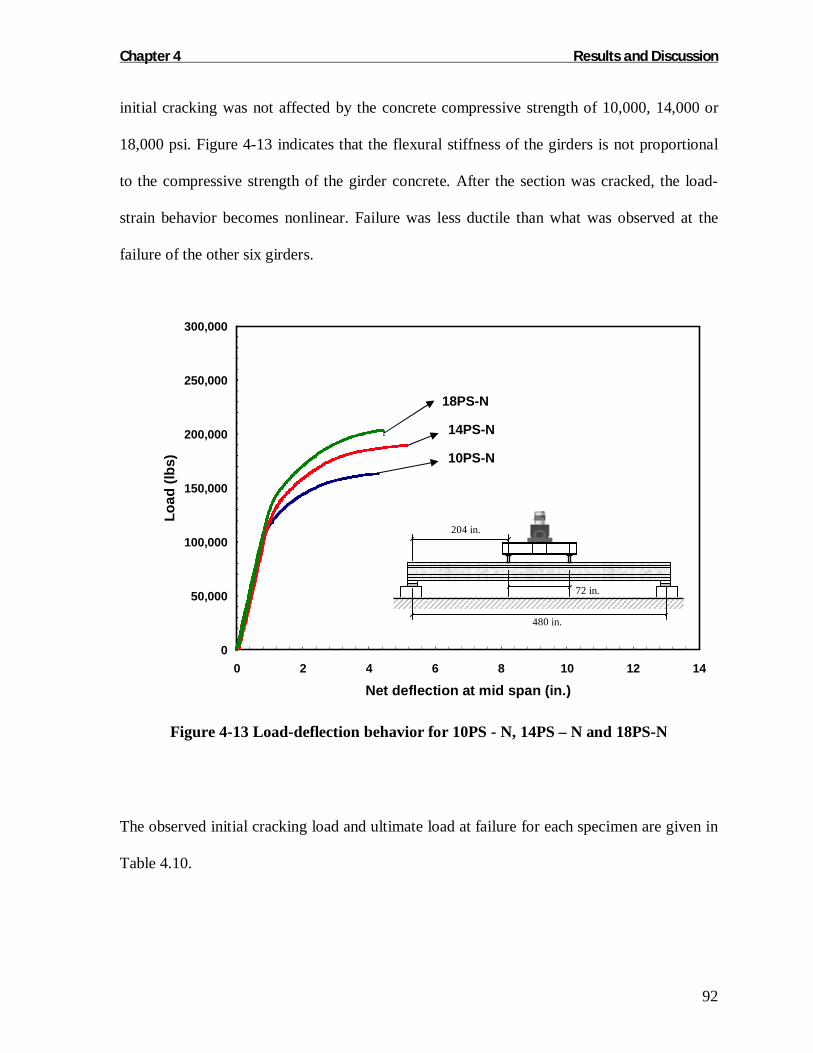
Chapter 4 Results and Discussion
92
initial cracking was not affected by the concrete compressive strength of 10,000, 14,000 or
18,000 psi. Figure 4-13 indicates that the flexural stiffness of the girders is not proportional
to the compressive strength of the girder concrete. After the section was cracked, the load-
strain behavior becomes nonlinear. Failure was less ductile than what was observed at the
failure of the other six girders.
0
50,000
100,000
150,000
200,000
250,000
300,000
0 2 4 6 8 10 12 14
Net deflection at mid span (in.)
Load
(lbs
)
Figure 4-13 Load-deflection behavior for 10PS - N, 14PS – N and 18PS-N
The observed initial cracking load and ultimate load at failure for each specimen are given in
Table 4.10.
10PS-N
14PS-N
18PS-N
480 in.
72 in.
204 in.
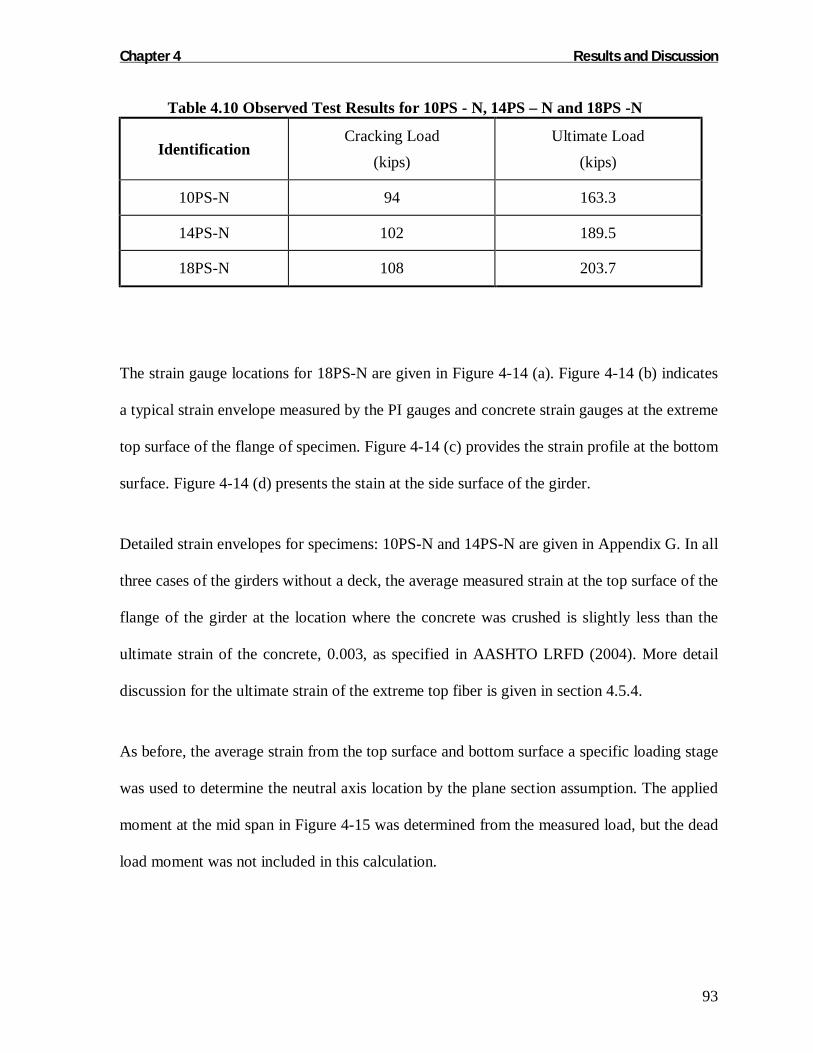
Chapter 4 Results and Discussion
93
Table 4.10 Observed Test Results for 10PS - N, 14PS – N and 18PS -N
Identification Cracking Load
(kips) Ultimate Load
(kips)
10PS-N 94 163.3
14PS-N 102 189.5
18PS-N 108 203.7
The strain gauge locations for 18PS-N are given in Figure 4-14 (a). Figure 4-14 (b) indicates
a typical strain envelope measured by the PI gauges and concrete strain gauges at the extreme
top surface of the flange of specimen. Figure 4-14 (c) provides the strain profile at the bottom
surface. Figure 4-14 (d) presents the stain at the side surface of the girder.
Detailed strain envelopes for specimens: 10PS-N and 14PS-N are given in Appendix G. In all
three cases of the girders without a deck, the average measured strain at the top surface of the
flange of the girder at the location where the concrete was crushed is slightly less than the
ultimate strain of the concrete, 0.003, as specified in AASHTO LRFD (2004). More detail
discussion for the ultimate strain of the extreme top fiber is given in section 4.5.4.
As before, the average strain from the top surface and bottom surface a specific loading stage
was used to determine the neutral axis location by the plane section assumption. The applied
moment at the mid span in Figure 4-15 was determined from the measured load, but the dead
load moment was not included in this calculation.

Chapter 4 Results and Discussion
94
a) Strain gauge locations for 18PS-N
0
50,000
100,000
150,000
200,000
250,000
0 0.001 0.002 0.003 0.004
Strain (ε )
Load
(lbs
)
P1 P2 P3
S1 S2
P1, P2, P3, S1 and S2
b) Strain at the top surface
Figure 4-14 Strain envelopes for 18PS-N
SP1
SP2
NP1
SP0
SP3 NP2
P1
P4 P5 P6
P2 P3
S1 S2
Compression
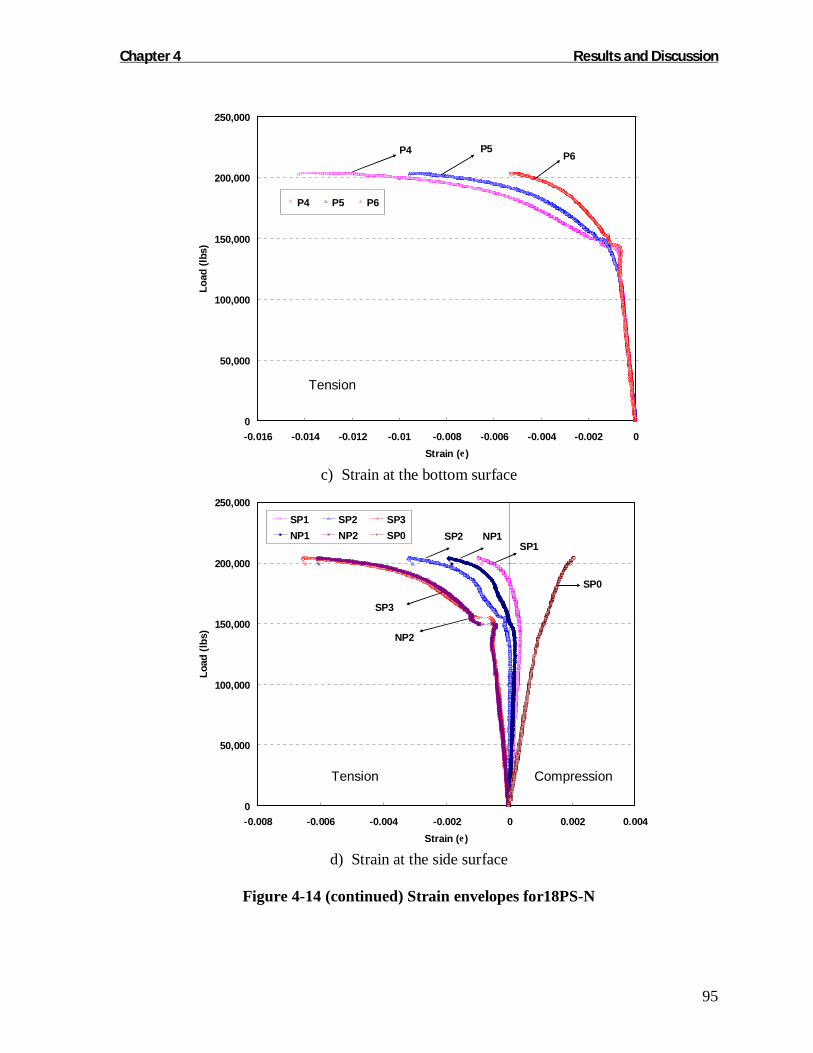
Chapter 4 Results and Discussion
95
0
50,000
100,000
150,000
200,000
250,000
-0.016 -0.014 -0.012 -0.01 -0.008 -0.006 -0.004 -0.002 0Strain (ε )
Load
(lbs
)P4 P5 P6
P4 P5P6
c) Strain at the bottom surface
0
50,000
100,000
150,000
200,000
250,000
-0.008 -0.006 -0.004 -0.002 0 0.002 0.004Strain (ε )
Load
(lbs
)
SP1 SP2 SP3NP1 NP2 SP0 NP1
SP3
SP2SP1
NP2
SP0
d) Strain at the side surface
Figure 4-14 (continued) Strain envelopes for18PS-N
Tension
Tension Compression

Chapter 4 Results and Discussion
96
0
4
8
12
16
20
24
28
32
360 500 1000 1500
Moment (kips-ft)
N.A
. dep
th fr
om th
e to
p fib
er, c
(in.
)
Firs
t Obs
erve
d C
rack
ing
Mom
ent
Ulti
mat
e M
omen
t
2nd Loading cycle
1st Loading cycle
N.A.at ultimate load
a) Moment-N.A. depth relationship for 10PS-N
0
4
8
12
16
20
24
28
32
360 500 1000 1500 2000
Moment (kips-ft)
N.A
. dep
th fr
om th
e to
p fib
er, c
(in.
)
Firs
t Obs
erve
d C
rack
ing
Mom
ent
Ulti
mat
e M
omen
t
N.A.at ultimate load
b) Moment-N.A. depth relationship for 14PS-N
0
4
8
12
16
20
24
28
32
360 500 1000 1500 2000
Moment (kips-ft)
N.A
. dep
th fr
om th
e to
p fib
er, c
(in.
)
Firs
t Obs
erve
d C
rack
ing
Mom
ent
Ulti
mat
e M
omen
t
N.A.at ultimate load
c) Moment-N.A. depth relationship for 18PS-N
Figure 4-15 Moment – N.A. depth location for 10PS - N, 14PS – N and 18PS - N

Chapter 4 Results and Discussion
97
Figure 4-16 (a) shows a typical crushing failure mode for the AASHTO girder without a deck.
Figure 4-16 (b) shows the typical deformed shape of the girders immediately after the girder
concrete is crushed. Brittle failure of all three specimens was caused by the internal
compressive force controlled by the HSC of the girders, as expected in the design.
a) Crushing of the flange concrete at failure
Figure 4-16 Typical failure modes for the AASHTO girder without deck

Chapter 4 Results and Discussion
98
b) Deformed shape after failure
Figure 4-16 (continued) Typical failure modes for the AASHTO girder without deck
4.6.4 Ultimate Strain of Concrete
The ultimate strains of the concrete measured prior to failure of a specimen can be by
whether the compression force was controlled by the normal strength concrete for a deck or
by the high strength concrete for the girder.
The measured maximum strain of concrete at flexural failure is shown in Figure 4-17. These
strains were based on reading of 5 strain gauges installed at the extreme top fiber of the
concrete in the compressive zone. Results indicate that measured strain for girder with NSC
deck slabs exceeds 0.003, as shown in the figure for concrete strength ranging from 4 to 6
ksi. The measured maximum ultimate strain for the girder without deck slabs was in the
proximity of 0.003. These results indicate that the limiting strain, 0.003 for concrete in
compression is acceptable for HSC up to 18,000 psi.

Chapter 4 Results and Discussion
99
0
0.001
0.002
0.003
0.004
0.005
0.006
0 2 4 6 8 10 12 14 16 18 20Concrete Stregnth at test day (fc)
Ulti
mat
e St
rain
( εcu
)Maximum strain
Figure 4-17 Ultimate strain at peak load for tested AASHTO girders

Chapter 5 Analytical Model
100
5 ANALYTICAL MODEL
5.1 INTRODUCTION
The major objective of this chapter is to validate the analytical models typically used for the
flexural response of prestressed girders with and without concrete decks. Specifically, an
analysis of the test results helps to validate the use of stress block parameters of the
compressive concrete strength up to 18,000 psi. Moreover, the tests help verify the analytical
models typically used for moment curvature and load deflections in prestressed girders
subjected to flexure.
The measured flexural resistance and cracking resistance for each girder specimen under
static loading conditions are validated by three analytical models, described in this chapter.
1. The ultimate flexural resistance and cracking resistance are determined by the
AASHTO LRFD specifications (2004) with the measured concrete strength.
2. The ultimate flexural resistance and cracking resistance are calculated by the
AASHTO LRFD specifications (2004) along with the measured concrete strength and
the proposed equation for the elastic modulus discussed in Chapter 4.
3. A sectional analysis based on the actual measured material properties and prestress
losses is used to predict the moment-curvature and load-deflection behavior of
prestressed girders in flexure.
Generally accepted assumptions – i.e., plane sections remaining plane after deformation,
force equilibrium and strain compatibility – are recognized in this study.

Chapter 5 Analytical Model
101
5.2 CODE PROVISONS
The required values used to determine flexural response, i.e., material properties and
prestress losses, are discussed earlier in Section 4.2 and Section 4.3. This section, however,
discusses the analytical model used to determine flexural strength and cracking strength
based on the code conditions and recommended conditions found in the LRFD specifications.
5.2.1 Analysis of Flexural Cracking Strength
Once the initial load phase is applied, the initially observed cracking load on the specimens is
recorded for each specimen. The initially observed cracking strength can be determined using
the observed cracking load as follows:
)2(PaM cr ⋅= , Equation 5-1
where
Mcr = observed cracking strength, ft.-kips;
a = length of shear span, ft.;
P = total applied load coincident with the first flexural crack, kips.
For the evaluation of the observed cracking strength in each specimen, this study considers
two calculation methods; based on the design conditions and the recommended conditions.
For the design conditions, the material properties for the specimens and prestress losses are
determined by the LRFD equation (2004), as discussed in the design calculation shown in
Table 5.3. For the recommended conditions, the revised equations for elastic modulus,

Chapter 5 Analytical Model
102
modulus of rupture and prestress losses are used. The equations used for computing flexural
cracking strength are summarized in detail in Table 5.3.
The computed cracking strength based on the design and recommended equations is obtained
using the following equation:
( )ncdcerbccr fffSM /−+= , Equation 5-2
where
Sbc = composite section moduli;
fr = modulus of rupture;
fce = compressive stress due to effective prestress only at the bottom fibers;
fd/nc = stress due to noncomposite dead loads.
As can be seen in Equation 5-2, the primary factors affecting the computed cracking strength
are the modulus of rupture and the effective prestressing stress. Previously, as explained in
Chapter 4, these factors of the equation were evaluated by the experimental program in this
research.
The observed cracking moment during the first loading phase is used to assess the cracking
moment ratio (Mmeasured/Mpredicted) for three different calculations, as shown in Table 5.1. The
following comparison shows that the computed results obtained from the AASHTO LRFD
specifications, recommendations and measured values for estimating cracking strength
provide an appropriate prediction in all cases. In particular, the recommended conditions

Chapter 5 Analytical Model
103
from this research provide more conservative results than the current AASHTO LRFD
specifications (2004). As can be seen in the prestress losses comparison, the design
conditions for prestress losses are slightly different between the LRFD specifications and the
recommended conditions due to the use of different elastic modulus of concrete.
Table 5.1 Comparison between Observed and Computed Cracking Strength
Computed Cracking Strength Experiment
AASHTO LRFD Recommendation with measured value
I.D.
(kips-ft) (kips-ft) Exp. /Pre. (kips-ft) Exp. /Pre. (kips-ft) Exp. /Pre.
10PS-5S 1097 1123 0.98 1061 1.03 1157 0.95
14PS-5S 1267 1314 0.96 1244 1.02 1189 1.07
18PS-5S 1377 1436 0.96 1373 1 1450 0.95
10PS-1S 935 974 0.96 922 1.01 959 0.98
14PS-1S 1054 1084 0.97 1034 1.02 1095 0.96
18PS-1S 1131 1183 0.96 1130 1 1111 1.02
10PS-N 799 751 1.06 708 1.13 800 1
14PS-N 867 843 1.03 796 1.09 879 0.99
18PS-N 918 964 0.95 908 1.01 814 1.13
Average 0.98 1.03 1.01
Standard. Dev. 0.04 0.05 0.06
The cracking moment ratio (Mmeasured/Mpredicted) for the three different calculations is
graphically shown in Figure 5-1. This figure clearly shows that the recommended conditions
are applicable for the purpose of design, because the lower bound equation for the modulus

Chapter 5 Analytical Model
104
of rupture is recommended in this study. Therefore, the lower the modulus of rupture value,
the more conservative the prediction.
Additionally, the computed cracking strength using the measured values provides more
precise results compared to the other predicted values, except in the case of two specimens,
14PS-5S and 18PS-N. This finding may be due to the measured prestress losses. Recall that
the measured prestress losses for 18PS-N are 21.7% of the initial prestressing force. This
factor may result in the underestimation of the cracking strength of the specimens: the more
the prestress losses, the less cracking strength. In addition, recall that the measured modulus
rupture for 14PS-5S is 711 psi, which is the relatively lower modulus rupture result
corresponding to the compressive concrete strength. This factor may result in the
underestimation of the cracking strength.
0.85
0.9
0.95
1
1.05
1.1
1.15
10PS-5S 14PS-5S 18PS-5S 10PS-1S 14PS-1S 18PS-1S 10PS-N 14PS-N 18PS-NIdentification
Mm
easu
red/M
pred
icte
d
LRFD Recommendation with measured value
Conservative
Unconservative
Figure 5-1 Cracking strength ratio for three different calculations

Chapter 5 Analytical Model
105
5.2.2 Analysis of Flexural Strength
Each girder is tested until failure under static loads to determine its nominal flexural strength.
The observed flexural strength for each specimen can be determined using the following
equation:
Dn MPaM +⋅= )2( , Equation 5-3
where Mn = observed flexural strength, ft.-kips;
a = length of shear span, ft.; P = total applied load at ultimate load, kips; and
MD = dead load moment.
According to Section 5.7.3 in the LRFD specifications (2004), a T-shape member subjected
to flexure can be analyzed as a rectangular section if the distance a = β1 c from the extreme
compression fiber is no less than the flange thickness, hf, in which the distance c shall be
measured perpendicular to the neutral axis, and the distance a can be determined by the force
equilibrium condition using the approximate stress distribution. The flexural moment may be
computed by using the following equations, described in Table 5.2.

Chapter 5 Analytical Model
106
Table 5.2 Calculation Method for the Flexural Strength
AASHTO LRFD specifications (2004) NCHRP 12-64 (2006)
The average stress in prestressing steel, fps
fpe is not less than 0.5 fpu
1ps pup
cf = f kd
−
in which : 2 1.04 py
pu
fk =
f
−
For rectangular section behavior 0.85
ps pu s y s y
puc ps1
p
A f + A f A fc f
f b+ kAd
′ ′−=
′β p
pupsc
ysyspups
df
kAbf
fAfAfAc
+′
′′−+=
11 βα
For rectangular section,
the nominal flexural resistance , in which case bw shall be taken as b
( ) ( )( ) ( )
2 2
0.852 2 2
n ps ps p s y s
f
s y s c w f
a aM A f d A f d
ha aA f d f b b h
= − + − −
′ ′ ′ ′− + − −
( ) ( )2 2n ps ps p s y s
a aM A f d A f d= − + − −
−−′+
−′′′
22)(
2 1f
fwcsys
hahbbfadfA α

Chapter 5 Analytical Model
107
As = area of mild steel tension reinforcement (in.2);
A's = area of compression reinforcement (in.2);
Aps = area of prestressing steel (in.2);
fpu = specified tensile strength of prestressing steel (ksi);
fpy = yield strength of prestressing steel (ksi);
fy = yield strength of tension reinforcement (ksi);
f′y = yield strength of compression reinforcement (ksi);
b = width of the compression face of the member (in.);
bw = width of web (in.);
c = distance between the neutral axis and the compressive face (in.);
dp = distance from extreme compression fiber to the centroid of the prestressing tendons (in.);
ds = distance from extreme compression fiber to the centroid of nonprestressed tensile reinforcement (in.);
d's = distance from extreme compression fiber to the centroid of compression reinforcement (in.);
f′c = specified compressive strength of concrete at 28 days, unless another age is specified (ksi);
β1 = stress block factor;
hf = compression flange depth of an I or T member (in.);
a = cβ1; depth of the equivalent stress block (in.)

Chapter 5 Analytical Model
108
The parameters of the stress-strain distribution in the compressive zone of concrete – k1, k2,
k3, α1 and β1 – are used to determine the ultimate flexural resistance in both the ACI 318-05
and AASHTO-LRFD specifications (2004). k1 is the ratio of average compressive stress to
maximum compressive stress. k2 is the ratio of the distance from the extreme fiber to the
resultant of the compressive force to the neutral axis. k3 is the ratio of the compressive
strength of the flexural test to the compressive strength of the cylinder test. α1 and β1 can be
obtained by using the relationships of k1, k2, and k3 as follows:
2
311 2k
kk=α
and Equation 5-4
21 2k=β . Equation 5-5
Both the ACI and AASHTO specifications use these parameters to generalize the equivalent
rectangular stress block for the compressive stress distribution in concrete. The current
specification is defined such that the α parameter has a constant value of 0.85, and states
that “β1 shall be taken as 0.85 for concrete strength, f′c, up to and including 4,000 psi. For
strengths above 4,000 psi, β1 shall be reduced continuously at a rate of 0.05 for each 1,000
psi of strength in excess of 4,000 psi, but β1 shall not be taken as less than 0.65.” These
parameters considered to be validated up to 10,000 psi concrete strength. As part of the
NCHRP 12-64 research project, the experimental study for the equivalent rectangular stress
block for HSC up to 18,000 psi concrete strength has been investigated by NCHRP12-64
(2006) at North Carolina State University. On the basis of the NCHRP 12-64 research
findings, the research team proposes that the equivalent rectangular stress block parameters,

Chapter 5 Analytical Model
109
α1 , shall be taken as 0.85 for concrete strengths not exceeding 10,000 psi. For concrete
strengths exceeding 10,000 psi, α1 shall be reduced at a rate of 0.02 for each 1,000 psi of
strength in excess of 10,000 psi, except that α1 shall not be taken to be less than 0.75. The
proposed equation for α1 is as follows:
( )
>′≥−′−≤′
=ksifforfksiffor
cc
c
1075.01002.085.01085.0
1α . Equation 5-6
The data in the literature and the test results from this research indicate that the equation for
β1 specified by the ACI 318 and AASHTO LRFD Bridge Design Specifications is still valid
for the compressive strength in concrete up to 18,000 psi (Mertol, 2006). Therefore, the
equation for β1 can be specified as follows:
( )
>′≥−′−≤′
=ksifforfksiffor
cc
c
465.0405.085.0485.0
1β . Equation 5-7
In addition to these proposed equivalent rectangular stress block parameters investigated
by NCHRP 12-64 (2006), the recommended equations for material properties and
prestress losses for HSC to evaluate the flexural behavior in this study are shown in
Table 5.3.
As described earlier in this chapter, Table 5.3 shows the final three design calculation
methods, including the sectional analysis method discussed in the following section.

Chapter 5 Analytical Model
110
Table 5.3 Comparison of Design Calculation
C.C.S. is the cylinder concrete strength
Design Calculation
AASHTO LRFD Specifications Recommended Method Section Analysis
fc C.C.S at test day C.C.S at test day
Ec 1.533,000c c c = fwE ′ ( ) 33.05.2ccc fwE ′⋅= Concrete
fr 7.5√fc psi 6√fc psi
Prestressing Strands fps
−
ppu d
ckf 1
−
ppu d
ckf 1
Prestress Loss Tadros Eq., (2003) Tadros Eq., (2003)
Measured Results
HSC Not available but α1: 0.85, β1: 0.65
Used in this study
α1: 0.75 ≤ 0.85-(fc-10 ksi)0.02 ≤ 0.85
β1: 0.65
HSC & NSC Not available Base on the deck concrete Stress Block
NSC α1:0.85,
β1:0.65 ≤ 0.85-(fc-4 ksi)0.05 ≤ 0.85
α1:0.85,
β1:0.65 ≤ 0.85-(fc-4 ksi)0.05 ≤ 0.85
Strain Compatibility

Chapter 5 Analytical Model
111
5.2.2.1 AASHTO Girders with a 5 ft. Wide Deck
For a composite girder section in which the neutral axis is located within the deck, the
nominal flexural moment, Mn of such specimens can be determined using the AASHTO
LRFD specifications. The design compressive strengths of concrete for the three girders are
10,000, 14,000 and 18,000 psi. The design strength of concrete for the deck slab is 4,000 psi.
In these cases, the neutral axis is located at the deck, and the compression force is developed
in the NSC. The nominal flexural resistance, Mn, is computed by using the concrete
compressive strength of the deck, as shown in Figure 5-2.
Figure 5-2 Compressive stress distribution (a) cross-section; (b) strain compatibility;
(c) meausred strain-stress distribution in compression zone; (d) equivalent rectangular stress block in compression zone
The flexural resistance of the composite girder with flanged sections depends on whether the
neutral axis is located within the flange or within the girder. If the neutral axis depth (c) is
greater than the thickness of the deck, the composite girder displays a T-section behavior.
36 in.
8 in.
T
C
18 in.
εps
εcu
c a d1 d2
dp
(a) (b) (c) (d)
6 in.
60 in.
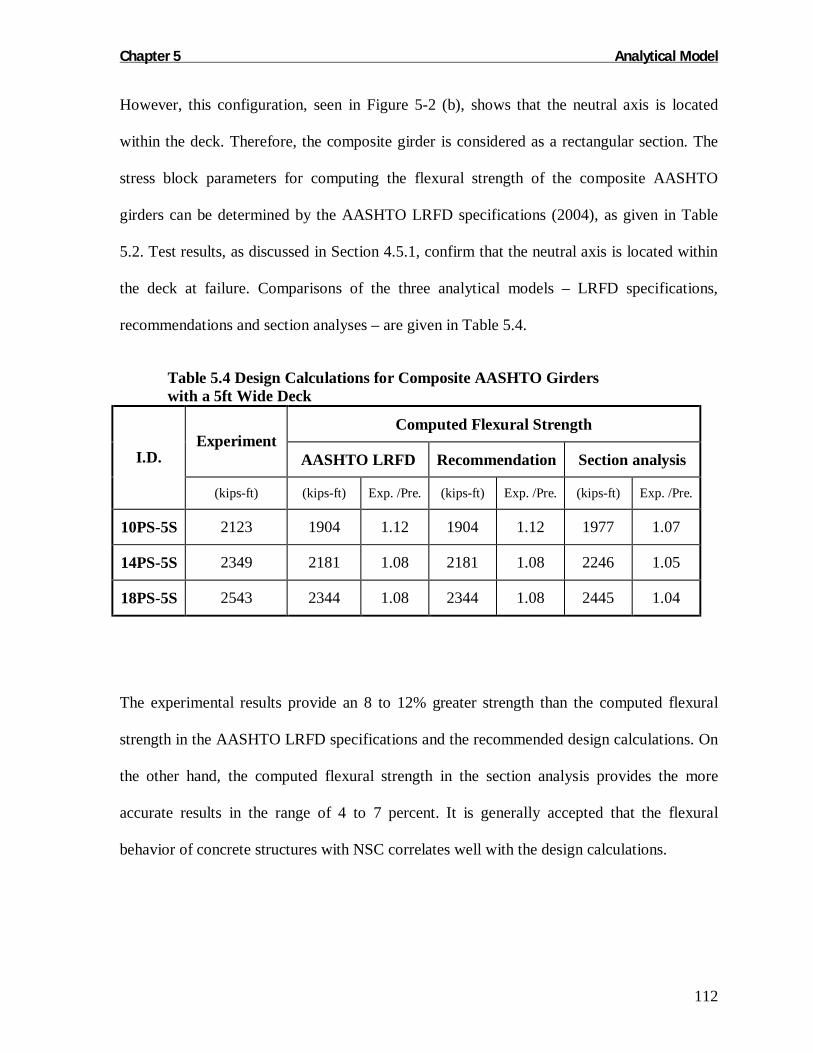
Chapter 5 Analytical Model
112
However, this configuration, seen in Figure 5-2 (b), shows that the neutral axis is located
within the deck. Therefore, the composite girder is considered as a rectangular section. The
stress block parameters for computing the flexural strength of the composite AASHTO
girders can be determined by the AASHTO LRFD specifications (2004), as given in Table
5.2. Test results, as discussed in Section 4.5.1, confirm that the neutral axis is located within
the deck at failure. Comparisons of the three analytical models – LRFD specifications,
recommendations and section analyses – are given in Table 5.4.
Table 5.4 Design Calculations for Composite AASHTO Girders with a 5ft Wide Deck
Computed Flexural Strength Experiment
AASHTO LRFD Recommendation Section analysis I.D.
(kips-ft) (kips-ft) Exp. /Pre. (kips-ft) Exp. /Pre. (kips-ft) Exp. /Pre.
10PS-5S 2123 1904 1.12 1904 1.12 1977 1.07
14PS-5S 2349 2181 1.08 2181 1.08 2246 1.05
18PS-5S 2543 2344 1.08 2344 1.08 2445 1.04
The experimental results provide an 8 to 12% greater strength than the computed flexural
strength in the AASHTO LRFD specifications and the recommended design calculations. On
the other hand, the computed flexural strength in the section analysis provides the more
accurate results in the range of 4 to 7 percent. It is generally accepted that the flexural
behavior of concrete structures with NSC correlates well with the design calculations.

Chapter 5 Analytical Model
113
5.2.2.2 AASHTO Girders with a 1 ft. Wide Deck
For a composite girder section, in which the neutral axis is located below the deck, typically
two types of concrete compressive strength in the compression zone must be considered.
However, the current AASHTO specifications (2004) do not specify the design method to
determine flexural strength with two types of concrete in the compression zone.
Figure 5-3 shows the stress distribution of the composite girder section in which the neutral
axis is located below the deck. As shown in Figure 5-3 (b), because the neutral axis is located
below the deck, the actual compressive stress, seen in Figure 5-3 (c), is distributed starting
from the flange of the girder with HSC to the NSC deck. Once the simplified stress
distribution is considered with only the stress distribution of the deck concrete, as shown in
Figure 5-3 (d), the location of the compressive resultant force moves downward slightly due
to an increase in the neutral axis depth. It may results in slight reduction of the lever arm of
the flexural moment. Therefore, the resultant decrease in flexural moment provides
conservative, yet quite accurate results. Finally, the equivalent rectangular stress block is
created using the simplified compressive stress distribution, as given in Figure 5-3 (e).
For the composite girder section that has a relatively small deck flange, as well as two types
of compressive strength subjected to the flexure, the nominal flexural resistance, Mn, may be
determined by using the AASHTO LRFD specifications, as listed in Table 5.2, with an
analysis based on the compressive strength of the deck concrete, which is usually lower than
that of the girder concrete.

Chapter 5 Analytical Model
114
Figure 5-3 Compressive stress distribution (a) cross-section; (b) strain compatibility (c) measured strain-stress distrubution in compression zone, (d) simplified stress
distribution (e) the equvalent rectagular stress block
A comparison between the measured flexural strength and the design calculation based on
code provisions and recommendations is shown in Table 5.5. The computed flexural strength
based on the section analysis is also given in the table.
36 in.
8 in.
T
C
12 in.
18 in.
c a
dp
(a) (c) (d) (e)
6 in.
36 in.
8 in.
12 in.
18 in.
εps
εcu
c
d1 d2
(b) (a) (c)
6 in.

Chapter 5 Analytical Model
115
Table 5.5 Design Calculation for Composite AASHTO Girders with a 1 ft. Wide Deck
Computed Flexural Strength Experiment
AASHTO LRFD Recommendation Section Analysis I.D.
(kips-ft) (kips-ft) Exp. /Pre. (kips-ft) Exp. /Pre. (kips-ft) Exp. /Pre.
10PS-1S 1752 N.A - 1558 1.12 1735 1.01
14PS-1S 1941 N.A - 1706 1.14 1928 1.01
18PS-1S 2083 N.A - 1830 1.14 2107 0.99
These results confirm that the recommended method to determine the nominal flexural
resistance, Mn, is reasonably conservative. However, the predicted nominal flexural
resistance based on the section analysis method using the measured material properties and
prestress losses shows more accurate results.
5.2.2.3 AASHTO Girders without a Deck
For a girder section in which the neutral axis is located within the flange, in the same manner
as Section 5.2.2.1, the nominal flexural moment of such specimens can be determined using
the AASHTO LRFD specifications. However, the current AASHTO LRFD specifications
(2004) have limits that restrict the use of α1 and β1 over 10,000 psi compressive concrete
strength. According to the part of NCHRP 12-64 (2006), the proposed equivalent rectangular
stress block parameters for HSC up to 18,000 psi was conducted to determine the flexural
strength for HSC girders. Figure 5-4 indicates the stress distribution of the girder section in

Chapter 5 Analytical Model
116
which the neutral axis is located within the flange of the girder and that can be computed as a
rectangular section.
Figure 5-4 Compressive stress distribution (a) cross-section; (b) strain compatibility; (c) measured strain-stress distribution in compression zone; (d) equivalent rectangular
stress block
The flexural resistance of the HSC girder can be calculated using the same equation
addressed in Table 5-2, with the exception of the rectangular stress block parameters. As
described previously in Section 5.2.2, the factor, α1 , shall be taken as 0.85 for concrete
strengths not exceeding 10,000 psi. For concrete strengths exceeding 10,000 psi, α1 shall be
reduced at a rate of 0.02 for each 1,000 psi of strength in excess of 10,000 psi, except that α1
shall not be taken to be less than 0.75. The test results in this research and in the literature
indicate that the equation for β1 , specified by ACI 318 and AASHTO LRFD Bridge Design
Specifications, is still valid for HSC up to 18,000 psi (NCHRP 12-64, 2006).
36 in.
T
C
12 in.
18in.
εps
εcu
c a
dp
(b) (a) (c) (d)
6 in.

Chapter 5 Analytical Model
117
A comparison between the measured flexural strength and the design calculation based on
the code provisions and recommendations is shown in Table 5.6. The computed flexural
strength based on the sectional analysis is also given in the same table.
Table 5.6 Design Calculation for AASHTO Girders without a Deck
Computed Flexural Strength Experiment
AASHTO LRFD Recommendation Section Analysis I.D.
(kips-ft) (kips-ft) Exp. /Pre. (kips-ft) Exp. /Pre. (kips-ft) Exp. /Pre.
10PS-N 1465 1334 1.10 1324 1.11 1433 1.02
14PS-N 1688 1548 1.09 1519 1.11 1623 1.04
18PS-N 1808 1723 1.05 1692 1.07 1813 1.00
As indicated in Table 5.6, the calculated flexural strength using the AASHTO LRFD
specifications is slightly less conservative than that using the recommended conditions due to
the reduced α1 value. The calculated flexural strength shows that the reduced α1 value assures
the safety of the flexural strength of AASHTO girders with HSC. For the section analysis,
the computed flexural strength using actual material properties and prestress losses provides
the most accurate prediction.
5.2.3 Failure Evaluation
The failure evaluation provides a comprehensive behavior analysis of the prestress girder.
This evaluation provides the potential to capture the flexural behavior of the tested girder

Chapter 5 Analytical Model
118
specimens. Figure 5-5 gives the failure evaluation, which is the moment ratio for the mid
span applied moment at the continuous loading stage and the computed nominal flexural
resistance using the current AASHTO LRFD specifications. The applied load does not
include the dead load.
As described in the previous section, all of the specimens with three configurations of the
neutral axis location can be determined using the current LRFD specifications (2004) except
in the case of a composite girder section in which the neutral axis is located below the deck,
as discussed previously. For this failure evaluation, the flexural strength is computed using
the recommended method based on the LRFD design conditions set out in Table 5.3. Figure
5-5 includes a representation of each phase of the girders, 18PS-5S, 10PS-1N, and 18PS-N.
0
0.2
0.4
0.6
0.8
1
1.2
1.4
0 2 4 6 8 10 12 14
Net deflection at mid span (in.)
Map
plie
d/MLR
FD
18PS-5S 10PS-1S 18PS-N
at cracking at peak at ultimate
18PS-5S10PS-1S
18PS-N
Figure 5-5 Failure evaluation for each configuration

Chapter 5 Analytical Model
119
It is difficult to draw general conclusions given the limited number of test results. As shown
in Table 5.7, it can be concluded that the initial cracking of the tested specimens is
approximately 60 percent of the flexural resistance using the current AASHTO LRFD
specifications. This range of the load may be considered as the service loading condition. The
calculated ultimate moment at the peak load is an average of 4 percent greater than the
computed flexural resistance using the LRFD specifications.
Table 5.7 Failure Evaluation for All Specimens
I.D. MLRFD Mcr (observed)
Mcr/MLRFD Mpeak
(at mid span) Mpeak/MLRFD
10PS-5S 1904 1097 0.58 1947 1.02
14PS-5S 2181 1267 0.58 2172 1.00
18PS-5S 2344 1377 0.59 2366 1.01
10PS-1S 1558 935 0.60 1655 1.06
14PS-1S 1706 1054 0.62 1845 1.08
18PS-1S 1830 1131 0.62 1986 1.09
10PS-N 1334 799 0.60 1388 1.04
14PS-N 1548 867 0.56 1611 1.04
18PS-N 1723 918 0.53 1731 1.00
Average 0.59 1.04
St. Dev. 0.027 0.033

Chapter 5 Analytical Model
120
5.3 SECTIONAL ANALYSIS
The computed ultimate flexural strength based on the sectional analysis is presented in
Section 5.2.2. This Section 5.3 presents a sectional analysis procedure to compute the
moment-curvature and load-deflection behavior of prestressed girders subjected to flexure.
Before conducting the sectional analysis, the material properties used in this experimental
study need to be defined using the proper equations.
5.3.1 Flexural Model
For the sectional analysis, the material properties for the concrete and the prestressing strands
used for the AASHTO girders tested under static loading conditions are determined by
testing representative concrete cylinders and prestressing strands, as discussed in Chapter 3.
The measured stress-strain curves for the concrete and the strands are used to gain accurate
material properties to be input into the analytical model. The material models are used to
generate a best fit to the experimentally determined stress-strain curves.
Based on the assumption that a plane remains in a plane after deformation, the strain profile
at any depth through the section can be determined from two variables: the strain of the top
surface of concrete (εc) and the depth of the neutral axis (c), as shown in Figure 5-6. The
corresponding curvature is defined as:
ccε
φ = . Equation 5-8

Chapter 5 Analytical Model
121
Figure 5-6 Cross-section and assumed strain profile for 18PS - 5S
Once the strain in the extreme compression fiber (εc) is fixed, the force distribution of
concrete, Fc , can be determined by the force equilibrium conditions with the variable, c. The
force contribution, F, of the different materials at a given section can be determined by the
integrating the stress profile into the equation.
First of all, the force contribution of the deck concrete, Fc, can be determined by the
following equation:
( )dyyfybFc
ccc ∫ ⋅=0
)( , Equation 5-9
where bc(y) is the width of the deck, which is generally constant; c is the assumed neutral
axis depth; and fc(y) is the stress distribution of the deck concrete.
εc y
φ
bc
c
fc(y)

Chapter 5 Analytical Model
122
Popovic’s equation, presented in Collins and Mitchell (1991) to model the stress-strain curve
of concrete, is used for this research. The stress in the concrete can be calculated using the
equation, as follows:
( ) ( )( )( )( )nk
cc
cccc yn
ynfyf
'/1'/'
εε
εε
+−
⋅⋅= , Equation 5-10
fc’ = the maximum strength of the concrete;
εc’ = the corresponding strain; and n is a curve fitting factor defined as Ec/(Ec-Ec’), where Ec
is the initial tangent modulus of the concrete and Ec’ = fc’/εc’; and
k = The post-peak decay in the concrete stress is defined by the curve fitting factor.
If the strength of the concrete, fc’, is the only known parameter, the remaining factors can be
calculated from the following relationships:
000,9'
67.0
1'
'
,00,2
'8.0
,000,000,1'000,40
c
cc
c
cc
fk
andn
nEf
fn
fE
+=
−=
+=
+=
ε Equation 5-11
with fc’ in units of psi.

Chapter 5 Analytical Model
123
Alternatively, the values of fc’, εc’, Ec and Ec’ can be determined directly if the full stress-
strain curve of a characteristic concrete cylinder is obtained experimentally. The value of k
can then be determined from the measured post-peak stress-strain data to provide a best fit.
Consequently, the force contribution of the concrete, Fc, can be expressed by substituting
Equation 5-11 into Equation 5-9, as follows:
( )( )( )( )
dyynynfbF
c
nkcc
ccccc ∫ +−
⋅⋅=
0 '/1'/'
εεεε . Equation 5-12
The material properties for the concrete used for the nine specimens tested under static
loading conditions are determined by testing representative concrete cylinders, as discussed
in Chapter 3. The measured stress-strain curves for the concrete and the steel are used to
obtain the material properties to be used in the analytical model. The material models for
concrete are used to generate a best fit of the experimentally determined stress-strain curves.
Two cylinders from each girder specimen were tested to determine the stress-strain
relationship of the concrete and a best-fit curve until failure at the final loading stage. Figure
5-7 represents the measured stress-strain curve of the cylinders as well as the best fits of the
measured data from 10PS-5S. The coefficients used for the concrete material model are
presented in Table 5.8. The remaining best-fit curves for each specimen are given in
Appendix I.

Chapter 5 Analytical Model
124
0
2,000
4,000
6,000
8,000
10,000
12,000
14,000
16,000
18,000
0 0.001 0.002 0.003 0.004 0.005
Strain (ε)
Stre
ss (p
si)
ε cu=
0.0
035
for H
SC
Cylinder 2 for girder
Cylinder 1 for girder
Cylinder 2 for deck
Cylinder 1 for deck
Best fit curve with analytical model
ε cu=
0.0
045
for N
SC
Figure 5-7 Measured stress-strain behavior of 10PS-5S and a best-fit curve with
analytical model
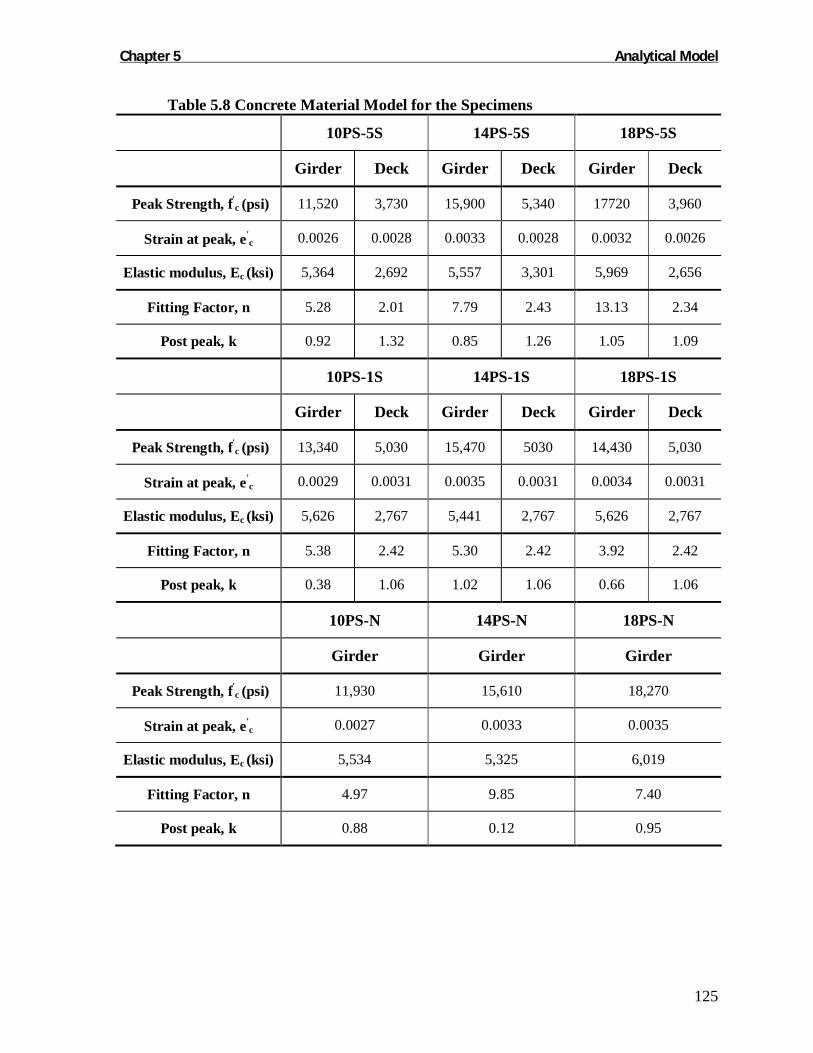
Chapter 5 Analytical Model
125
Table 5.8 Concrete Material Model for the Specimens
10PS-5S 14PS-5S 18PS-5S
Girder Deck Girder Deck Girder Deck
Peak Strength, f'c (psi) 11,520 3,730 15,900 5,340 17720 3,960
Strain at peak, ε'c 0.0026 0.0028 0.0033 0.0028 0.0032 0.0026
Elastic modulus, Ec (ksi) 5,364 2,692 5,557 3,301 5,969 2,656
Fitting Factor, n 5.28 2.01 7.79 2.43 13.13 2.34
Post peak, k 0.92 1.32 0.85 1.26 1.05 1.09
10PS-1S 14PS-1S 18PS-1S
Girder Deck Girder Deck Girder Deck
Peak Strength, f'c (psi) 13,340 5,030 15,470 5030 14,430 5,030
Strain at peak, ε'c 0.0029 0.0031 0.0035 0.0031 0.0034 0.0031
Elastic modulus, Ec (ksi) 5,626 2,767 5,441 2,767 5,626 2,767
Fitting Factor, n 5.38 2.42 5.30 2.42 3.92 2.42
Post peak, k 0.38 1.06 1.02 1.06 0.66 1.06
10PS-N 14PS-N 18PS-N
Girder Girder Girder
Peak Strength, f'c (psi) 11,930 15,610 18,270
Strain at peak, ε'c 0.0027 0.0033 0.0035
Elastic modulus, Ec (ksi) 5,534 5,325 6,019
Fitting Factor, n 4.97 9.85 7.40
Post peak, k 0.88 0.12 0.95

Chapter 5 Analytical Model
126
Secondly, the force contribution of the prestressing strand, Fpe, can be determined by
∑ ⋅= )()( yfnAF pspsps , Equation 5-13
where Aps(n) is the area of the prestressing strand at the nth layer, and fps(y) is the stress
distribution of a prestressing strand.
The actual material properties for the prestressing strands are provided by the supplier, as
described in Chapter 3. For the purpose of the analytical modeling of the prestressing strands,
the Ramberg-Osgood equation, given in Collins and Mitchell (1997), is used to model the
tension behavior of the prestressing strand, as follows:
[ ] uCCps
pspsps fB
AAEf ≤
+
−+= 1
)(1
1
εε , Equation 5-14
where fps is the prestressing steel tensile stress; Eps is the elastic modulus of the strand; and
εps is the tensile strain of the strand. The four factors, A, B, C and Eps, can be determined
from the actual stress-strain curve.
Figure 5-8 shows the definition of each parameter in the stress-strain curve. Based on the
defined parameters, the stress-strain curve of the prestressing strand used for the analytical
model is generated in Figure 5-9. As given in Section 3.5.3, the ultimate elongation is 4.5%.
The generated stress-strain curve shown in Figure 5-9 matches well with the measured stress-
strain curve.

Chapter 5 Analytical Model
127
Figure 5-8 Definition of the four factors adopted from Collins (1997)
0.0
6.0
12.0
18.0
24.0
30.0
36.0
42.0
48.0
54.0
60.0
0.0 0.2 0.4 0.6 0.8 1.0 1.2 1.4 1.6 1.8 2.0
Strain %
Load
(kip
s)
Test Results
Ramberg-Osgood
Figure 5-9 Analytical modeling of the prestressing strand
For simplification, due to the minor role of the force contribution, the longitudinal
reinforcement in the deck can be calculated using a bilinear relationship, described as
)()( yfAyF sss ⋅= , Equation 5-15
1
Eps
1
AEps
psEB
A1
−
εps
fps
Eps 29,000 ksi A 0.207 B 113.30 C 22

Chapter 5 Analytical Model
128
where As is the area of the longitudinal reinforcement in the deck concrete and fs(y) is the
stress of the steel. Typically, the elastic modulus of steel, Es, is 29,000 ksi, and the yield
stress, fy, is 60 ksi.
5.3.2 Flexural Behavior
After the section properties have been defined, as described above, the moment-curvature
and the load-deflection response are determined by using the layer-by-layer approach. Once
the moment-curvature response of the section is calculated, the load-deflection response of a
beam under known loading and support conditions can be determined by integrating the
curvature into the given moment value.
Once the strain in the extreme compression fiber (εc) is fixed, the force distribution of each
material in the section can be determined by the force equilibrium conditions with the
variable, c. For the first equilibrium equation, the resultant force acting on the section should
be equal to zero, if there is no axial load, N.
∑++= pssc FFFN . Equation 5-16
Here, the neutral axis depth, c, can be determined using the first equilibrium equation. For
the second equilibrium equation, the flexural moment can be taken at the location of the
neutral axis depth from the top fiber.
∑ ⋅+⋅+⋅= npssc yFyFyFM 21 , Equation 5-17

Chapter 5 Analytical Model
129
where Fc = the force contribution of concrete; y1 = the distance from the location of the
neutral axis to the location of the resultant force of concrete; Fs = the force contribution of
the reinforcement; y2 = the distance from the location of the neutral axis to the location of the
reinforcement; Fps = the force contribution of the prestressing strands; and yn = the distance
from the location of the neutral axis to the location of each prestressing strand layer.
From the two equilibrium conditions, the moment corresponding to the curvature of the
section can be obtained by the iteration method. The full moment-curvature relationship of
the section is obtained using the various strain levels at the top surface fiber. Then, the load-
deflection envelope of the member can be calculated using the moment-curvature
relationship by using numerical integration.
Using the defined analytical model for each material used in the specimen, the load-
deflection envelopes for the nine AASHTO girders are predicted. As described in Chapter 4,
the measured material properties and prestress losses for each specimen are input for the
design calculations. All of the girders are modeled to predict the behavior up to the ultimate
strain of the top surface of the extreme fiber. The ultimate strain for each specimen is
determined by the measured ultimate strain, discussed in Chapter 4. For a direct comparison
of the predicted values using the experimental results, the predicted deflection at midspan in
the analytical model offsets the camber of the prestressed girder. A comparison between the
predicted load-deflection envelope and the measured load-deflection envelope under static
loading conditions at the midspan is given in Figures 5-10 to 5-12, respectively.
As can be seen in the figures below, the predicted load-deflection relationship shows good
agreement with the measured response for the specimens.

Chapter 5 Analytical Model
130
0
50
100
150
200
250
0 2 4 6 8 10 12 14Net deflection at mid span (in.)
Load
(kip
s)
PredictedMeasured
a) 10PS–5S
0
50
100
150
200
250
300
0 2 4 6 8 10 12 14 16
Net deflection at mid span (in.)
Load
(kip
s)
Predicted
Measured
18PS-5S
14PS-5S
b) 14PS-5S and 18PS-5S
Figure 5-10 Measured and predicted load deflection responses

Chapter 5 Analytical Model
131
0
50
100
150
200
250
0 1 2 3 4 5 6 7
Net deflection at mid span (in.)
Load
(kip
s)
PredictedMeasured
a) 10PS-1S
0
50
100
150
200
250
0 1 2 3 4 5 6 7Net deflection at mid span (in.)
Load
(kip
s)
Predicted
Measured
18PS-1S
14PS-1S
b) 14PS-1S and 18PS–1S
Figure 5-11 Measured and predicted load deflection responses
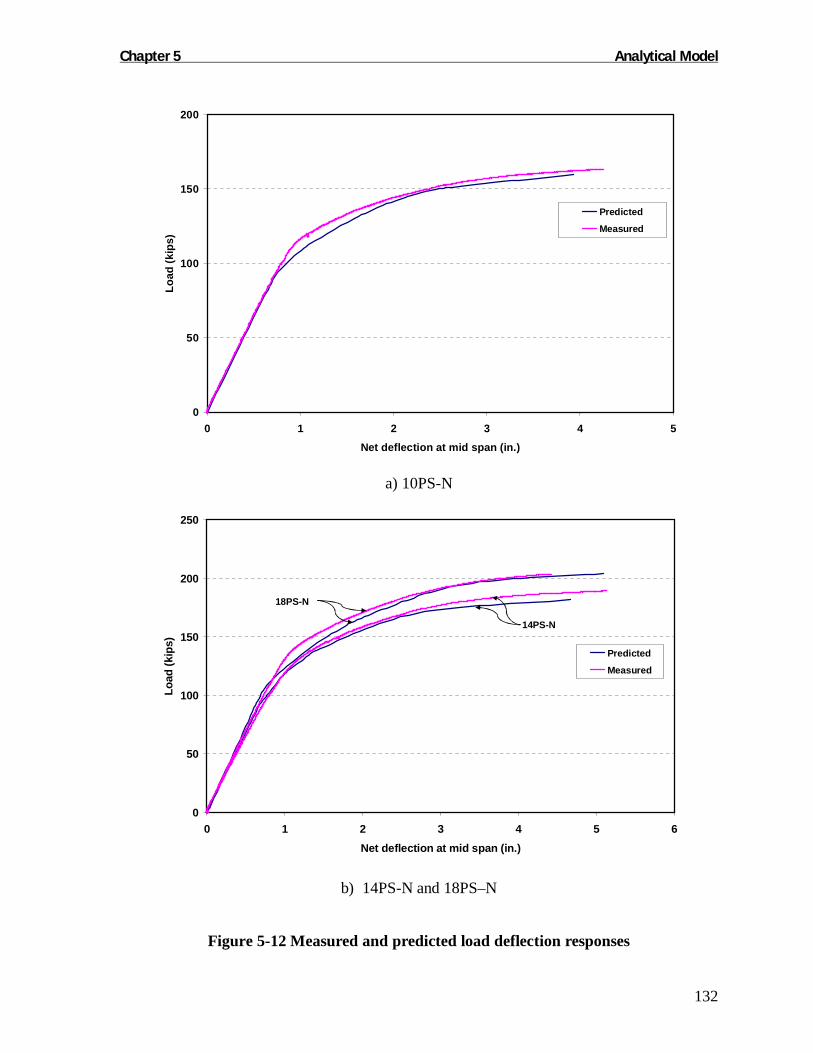
Chapter 5 Analytical Model
132
0
50
100
150
200
0 1 2 3 4 5
Net deflection at mid span (in.)
Load
(kip
s)
Predicted
Measured
a) 10PS-N
0
50
100
150
200
250
0 1 2 3 4 5 6Net deflection at mid span (in.)
Load
(kip
s)
Predicted
Measured
18PS-N
14PS-N
b) 14PS-N and 18PS–N
Figure 5-12 Measured and predicted load deflection responses

Chapter 5 Analytical Model
133
5.3.3 Summary of flexural strength behavior
The flexural strength determined in the second loading phase is used to evaluate the flexural
strength ratio (Mmeasured/Mpredicted) for the three design calculations.
The first three specimens;10PS, 14PS and 18PS-5S in Figure 5-13, which are prestressed
girders with a 5 ft. wide deck, are investigated to evaluate the flexural response for NSC.
The flexural strength ratio for these three specimens shows that the AASHTO LRFD
specifications provide a generally conservative estimate for the flexural strength of NSC.
For the three specimens; 10PS, 14PS and 18PS-1S in Figure 5-13, which are the composite
girders with a 1 ft. wide deck, the composite girder sections that have a relatively small deck
flange and that have two types of compressive strength subjected to the flexure, the current
AASHTO specifications (2004) do not specify the design method needed to determine the
flexural strength of girders with two types of concrete in the compression zone. In this study,
the nominal flexural resistance is recommended to be used to determine the flexural strength
by using the AASHTO LRFD specifications using an analysis based on the compressive
strength of deck concrete, which is usually lower than that of girder concrete. The flexural
strength ratio for these three specimens confirms that the recommended method to determine
the nominal flexural resistance, Mn, is reasonably conservative, yet still accurate.
Finally, the three specimens; 10PS, 14PS and 18PS-N in Figure 5-13, which are the girders
without a deck, are designed to evaluate the flexural response for HSC. The rectangular stress
block parameters in the current LRFD specifications are limited in their use to help determine
the flexural strength of HSC girders up to 10, 000 psi. On the basis of the research findings

Chapter 5 Analytical Model
134
from the related research presented in Section 2.2.2, the recommended stress block
parameters is applicable to determine the flexural strength for these three specimens.
0.90
0.95
1.00
1.05
1.10
1.15
10PS-5S 14PS-5S 18PS-5S 10PS-1S 14PS-1S 18PS-1S 10PS-N 14PS-N 18PS-N
Identification
Mm
easu
red/M
pred
icte
d
LRFD Recommendation Sectional Analysis
Conservative
Unconservative
Figure 5-13 Flexural strength ratio of the measured versus predicted results

Chapter 6 Summary and Conclusions
135
6 SUMMARY AND CONCLUSIONS
6.1 SUMMARY
The use of HSC has increased due to the advantages of its material characteristics that can
reduce the section depth or extend the span length in bridge construction. However, the
current code provisions cannot meet the demands of HSC design. The limits of the current
code provisions, the AASHTO LRFD specifications, lead to uncertainty regarding its ability
to predict the flexural response with reasonable accuracy. In order to validate the analytical
models typically used to determine the flexural response of prestressed HSC girders with and
without a cast-in-place deck, a total of nine girders were tested under static loading. In the
experimental program, valuable test results, which include material properties, transfer length,
prestress losses, cracking strength, and flexural strength, were obtained. In the analytical
program, these test results were evaluated by the current AASHTO LRFD specifications
(2004) or by using related equations from other research. On the basis of the research
findings, the proposed equation for the elastic modulus is in good agreement with the
measured test results. The modulus rupture, the transfer length and prestress losses equations
in the current AASHTO LRFD specifications correlate well with the measured values.
Additionally, the revised equivalent rectangular stress block parameters used to determine the
flexural response were reassessed for prestressed girders with HSC.

Chapter 6 Summary and Conclusions
136
6.2 CONCLUSIONS
The objective of this research is to reassess the current AASHTO LRFD specifications as
they apply to prestress girders with HSC, especially in terms of flexural response. On the
basis of the research findings along with the experimental and analytical programs, the
material properties, transfer length, prestress losses and equivalent rectangular stress block
parameters for the flexural response, several conclusions can be drawn. The following
conclusion section is divided according to the flexural behavior of each prestress girder with
HSC.
6.2.1 Material properties
In the experimental program, the equation addressed in ACI 363R-92 correlates well with the
measured elastic modulus with regard to the HSC region, whereas the current equation in the
AASHTO LRFD specifications overestimates the elastic modulus for all the tested
specimens. According to the statistical method using the collected data that include the
various compressive strength ranges and unit weights, the predicted value by ACI363R-92 is
slightly conservative. On the other hand, the proposed equation in Equation 6-1 for the elastic
modulus provides a more appropriate estimation, regardless of the compressive strength and
a unit weight of concrete.
( ) 33.05.2ccc fwE ′⋅= , (pcf, psi) Equation 6-1
Due to moisture conditions, the equation presented in ACI 363R-92 overestimates the
measured modulus of rupture for the air-cured cylinder. However, the equation in AASHTO
LRFD suggests an applicable prediction of the modulus of rupture regardless of the

Chapter 6 Summary and Conclusions
137
compressive strength. The equation for the modulus of rupture in the current AASHTO
LRFD specifications (2004) may be appropriate for HSC up to 18,000 psi. However, on the
basis of research findings, the lower bound equation for modulus of rupture, 6√f’c (psi) is
recommended to determine the cracking moment in this study.
6.2.2 Prestress losses
The total prestress loss, including elastic shortening, creep, shrinkage and relaxation, is
evaluated with the predicted results based on the recent AASHTO LRFD specifications
(2004). On the basis of these research findings, the instantaneous losses at transfer due to
elastic shortening and the prestress losses are approximately 7.6 percent and 15 percent of the
initial prestressing stress, respectively. Based on the research findings, among the prestress
losses, the elastic shortening results are slightly higher than found from the AASHTO LRFD
equation. However, the calculated prestress losses by the measured cracking moment and
modulus of rupture shows that the total prestress losses for each specimen at test day shows a
good agreement with the prediction in the LRFD specification.
6.2.3 Flexural behavior
For composite girder sections in which the neutral axis is located in the deck, the nominal
flexural resistance can be calculated using the current AASHTO LRFD specifications. The
computed flexural resistance is approximately 8 to 12 percent less strength than the measured
value. It is evident that the flexural behavior for NSC in the compression zone can be
estimated using the equivalent rectangular stress block parameters currently found in the
AASHO LRFD specifications for concrete strengths up to 10,000 psi. In addition to the code

Chapter 6 Summary and Conclusions
138
equation, the sectional analysis using measured material properties and prestress losses
provides more precise results with 4 to 7 percent less loss than the measured flexural
resistance.
The current AASHTO LRFD specifications (2004) do not specify a design method to
determine the flexural strength of two types of concrete in the compression zone. Typically,
the compressive concrete strength of the deck is less than the girder concrete strength. For
composite girder sections in which the neutral axis is located below the deck, two types of
concrete compressive strength in the compression zone must be considered. The nominal
flexural resistance can be determined by using AASHTO LRFD specifications based on the
compressive strength of the deck concrete. The computed flexural strengths using the
recommended method are approximately 12 to 14% less strength than the measured flexural
strengths. These results confirm that the recommended method to determine the nominal
flexural resistance, Mn, is reasonably conservative. Based on the same results, the predicted
nominal flexural resistance based on the sectional analysis that uses the measured material
properties and prestress losses shows more accurate results within a ±1% difference of the
measured flexural resistance.
For prestressed girder sections in which the neutral axis is located in the flange of the girder
subjected to flexure, the nominal flexural resistance computed by using the proposed
equivalent rectangular stress block parameters with the AASHTO LRFD specifications

Chapter 6 Summary and Conclusions
139
equation is approximately 5 to 10 percent less strength than the measured flexural strength.
This finding seems reasonably conservative. Therefore, the revised equivalent rectangular
stress block parameters listed below for the approximate stress in concrete may be applicable
for prestressed girders with HSC up to 18,000 psi.
( )
>′≥−′−≤′
=ksifforfksiffor
cc
c
1075.01002.085.01085.0
1α . Equation 6-2
( )
>′≥−′−≤′
=ksifforfksiffor
cc
c
465.0405.085.0485.0
1β . Equation 6-3
In addition to the computed flexural strength based on the LRFD equation, the predicted
nominal flexural resistance based on the section analysis with the measured material
properties and prestress losses is 0 to 4 percent less than the measured flexural resistance.
6.2.4 Transfer length and failure mode
An assessment of the transfer length presented in the current LRFD specifications has been
conducted. The calculated transfer length computed by the average end slippage
measurement of prestressing strands correlates well with the estimation obtained from the
AASHTO LRFD specifications.
Failure evaluation of the prestressed girders with and without a deck has been conducted.
Under a given applied load at the midsection, the failure procedure can be evaluated by
comparing the applied moment at mid-span to the computed flexural moment at mid-span in

Chapter 6 Summary and Conclusions
140
the current specifications. On the basis of this comparison, it is concluded that the initial
cracking of the tested specimens is approximately 60 percent of the computed flexural
resistance found in the current AASHTO LRFD specifications.
6.3 RECOMMENDATION AND FUTURE WORK
6.3.1 Recommendation
The following changes are recommended to the current LRFD specification.
5.4.2.4 Modulus of Elasticity
In the absence of measured data, the modulus of elasticity, Ec, for concretes with unit weights
between 0.090 and 0.155 kcf and specified compressive strengths up to 18.0 ksi may be taken
as:
33.05.21 )(000,310 ccc fwKE ′= (5.4.2.4-1)
K1 = correction factor for source of aggregate to be taken as 1.0 unless determined by physical test, and as approved by the authority of jurisdiction;
wc = unit weight of concrete (kcf);
f′c = specified compressive strength of concrete (ksi)
5.7.3.2.6 Composite Girder Section

Chapter 6 Summary and Conclusions
141
For composite girder section in which the neutral axis is located below the deck, the nominal
flexural resistance, Mn, may be determined by Eqs. 5.7.3.2.2-1, based on the lower
compressive strength of the deck concrete.
6.3.2 Future work
The experimental and analytical program in this study is mainly focused on the girders
subjected on the flexure under static loading. Therefore, further investigation for the fatigue
and shear behavior of the prestressed girder with high strength concrete is necessary.

142
REFERENCES
AASHTO LRFD Bridge Design Specifications, Second Edition, American Association of State Highway and Transportation Officials, Washington DC, 2005. ACI Committee 318, “Building Code Requirements for Structural Concrete (ACI 318-02) and Commentary (318R-02)”, American Concrete Institute, Farmington Hills, MI, 2002, 443 pp. ACI Committee 363, “State-of-the-Art Report on High-Strength Concrete (ACI 363R-92)”, American Concrete Institute, Detroit, 1992 (Revised 1997), 55 pp. ACI Committee 363, “Guide to Quality Control and Testing of High-Strength Concrete (ACI 363.2R-98)”, American Concrete Institute, Detroit, 1998, 18 pp. Ahlborn, T. M., French, C. E. and Shield, C. K., “High-Strength Concrete Prestressed Bridge Girders: Long Term and Flexural Behavior”, Final Report 2000-32, Minnesota Department of Transportation, 2000, 390 pp. Ahmad, S. H. and Lue, D. M., “Flexure-Shear Interaction of Reinforced High-Strength Concrete Beams”, ACI Structural Journal, Vol. 84, No.4, 1987, pp. 330-341. Bae, S. and Bayrak, O., “Stress Block Parameters for High-Strength Concrete Members”, ACI Structural Journal, Vol. 100, No. 5, 2003, pp. 626-636. Bayrak, O. and Sheikh, S. A., “Confinement Reinforcement Design Considerations for Ductile HSC Columns”, Journal of Structural Engineering, Vol. 124, No. 9, 1998, pp. 999-1010. Bernhardt, C. J. and Fynboe, C. C., “High Strength Concrete Beams”, Nordic Concrete Research, No. 5, 1986, pp. 19-26. Bhatia, S., “Continuous Prestressed Concrete Beams in the Inelastic Range”, M.Sc. Thesis, Department of Queen’s University, Kingston, Ontario, Canada, 1984. Bing, L., Park, R. and Tanaka, H., “Stress Strain Behavior of High Strength Concrete Confined by Ultra-High- and Normal-Strength Transverse Reinforcement”, ACI Structural Journal, Vol. 98, No. 3, 2001, pp. 395-406. Burns N. H., Gross S. P. and Byle K.A., “Instrumentation and Measurements - Behavior of Long-Span Prestressed High Performance Concrete Bridges”, PCI/FHWA International Symposium on High Performance Concrete October 20-22, New Orleans, Louisiana, 1997. Canadian Standards Association, “Design of Concrete Structures, CSA A23.3 1994”, Rexdale, Ontario, 1994, pp.199.

143
Carino, N. J., “Prediction of Potential Strength at Later Ages”, Concrete and Concrete-Making Materials, 1994, pp. 140. Carrasquillo, R. L., Nilson, A. H. and Slate, F., “Properties of High Strength Concrete Subject to Short- Term Loads”, ACI Structural Journal, Vol. 78, No.3, 1981, pp. 171-178. Carrasquillo, R. L., Slate, F. and Nilson, A. H., “Micro-Cracking and Behavior of High Strength Concrete Subject to Short- Term Loading”, ACI Structural Journal, Vol. 78, No.3, 1981, pp. 179-186. Chin, M. S., Mansur, M. A. and Wee, T. H., “Effect of Shape, Size and Casting Direction of Specimens on Stress-Strain Curves of High-Strength Concrete”, ACI Materials Journal, Vol. 94, No. 3, 1997, pp. 209-219. Cohn, M. Z. and Lounis, Z., “Moment Redistribution in Structural Concrete Codes”, Canadian Journal of Civil Engineering, Vol.18, No. 1, 1991, pp. 97-108. Collins, T. M., “Proportioning High-Strength Concrete to Control Creep and Shrinkage” ACI Materials Journal, Vol. 86, No. 6, 1989, pp. 576-580. Collins, M. P., Mitchell, D. and MacGregor, J. G., “Structural Design Considerations for High-Strength Concrete”, Concrete International, Vol. 15, No. 5, 1993, pp. 27-34. Comite Europeen de Normalisation (CEN), “Eurocode 2 : Design of Concrete Structures, Part 1 – General Rules and Rules for Buildings”, prEN 1992-1, 2002, pp. 211. Criteria for Prestressed Concrete Bridges, 1954, citation details not available. Cusson, D. and Paultre, P., “High-Strength Concrete Columns Confined by Rectangular Ties”, Journal of Structural Engineering, Vol. 120, No. 3, 1994, pp. 783-804. Hognestad, E., Hanson, N. W. and McHenry, D., “Concrete Stress Distribution in Ultimate Strength Design”, ACI Journal, Vol. 52, No. 4, 1955, pp. 455-479. Hueste, M. B. D. and Cuadros G. G., “Survey of Current Practice for Design of High Strength Concrete Prestressed Bridge Girders”, TRB Annual Meeting, Transportation Research Board, Washington, D.C., January 2004. Ibrahim, H. H. H. and MacGregor, G., “Tests of Eccentrically Loaded High-Strength Concrete Columns”, ACI Structural Journal, Vol. 93, No. 5, 1996, pp. 585-594. Ibrahim, H. H. H. and MacGregor, G., “Modification of the ACI Rectangular Stress Block for High-Strength Concrete”, ACI Structural Journal, Vol. 94, No. 1, 1997, pp. 40-48. Iravani, S., “Mechanical Properties of High-Performance Concrete”, ACI Materials Journal, Vol. 93, No. 5, 1996, pp. 416-426.

144
Le Roy, R., “Instantaneous and Time Dependant Strains of High-Strength Concrete”, Laboratoire Central des Ponts et Chaussees, Paris, France, 1996, pp. 376. Legeron, F. and Paultre, P., “Prediction of Modulus of Rupture of Concrete”, ACI Materials Journal, Vol. 97, No. 2, 2000, pp. 193-200. Mansur, M. A., Chin, M. S. and Wee, T. H., “Flexural Behavior of High-Strength Concrete Beams”, ACI Structural Journal, Vol. 94, No. 6, 1997, pp. 663-674. Miller, R. A., Castrodale, R., Mirmiran, A., and Hastak, M., “Connection between Simple Span Precast Concrete Girders Made Continuous”, Draft Final Report, NCHRP Project 12-53, University of Cincinnati, Cincinnati, OH, October 2003. Mokhtarzadeh, A. and French, C. E., “Mechanical Properties of High-Strength Concrete”, Final Report No. 1998-11, Minnesota Department of Transportation, 1988. Naaman, A. E. “Rectangular Stress Block and T-Section Behavior”, PCI Journal, Vol. 47, No.5, 2002, pp. 106-112. Nagashima, T., Sugano, S., Kimura, H. and Ichikawa, A., “Monotonic Axial Compression Test on Ultra-High-Strength Concrete Tied Columns”, Earthquake Engineering Tenth World Conference, Balkema, Rotterdam, the Netherlands, 1992, pp. 2983-2988. Nedderman, H., "Flexural Stress Distribution in Very-High Strength concrete”, M.Sc. Thesis, University of Texas at Arlington, 1973, 182 pp. Neville, A. M., Properties of Concrete, Fourth and Final Edition, New York: J. Wiley, New York, 1996, pp. 884.. Noguchi Laboratory Data, Department of Architecture, University of Tokyo, Japan, (http://bme.t.u-tokyo.ac.jp/index_e.html). Park, R. and Paulay, T., “Reinforced Concrete Structures”, John Wiley and Sons, New York, N. Y., 1975. Parrot, L. J., “The Properties of High-Strength Concrete”, Technical Report No. 42.417, Cement and Concrete Association, Wexham Springs, 1969, 12 pp. Paultre, P. and Mitchell, D., “Code Provisions for High-Strength Concrete - An International Perspective”, Concrete International, 2003, pp. 76-90. PCI Industry Handbook Committee, “PCI Design Handbook – Precast and Prestressed Concrete”, Precast/Prestressed Concrete Institute, Chicago, Illinois, 1999.

145
Priestley, M. J. N. and Park, R., “Moment Redistribution in Continuous Prestressed Concrete Beams”, Magazine of Concrete Research, Vol. 24, No. 80, 1972, pp. 157-166. Razvi, S. R. and Saatcioglu, M., “Confinement Model for High Strength Concrete”, Journal of Structural Engineering, Vol. 125, No. 3, 1999, pp. 281-289. Russell B. W. and Pang J. P., “Investigation of Allowable Compressive Stresses for High Strength, Prestressed Concrete Bridges”, PCI/FHWA International Symposium on High Performance Concrete October 20-22, New Orleans, Louisiana, 1997. Russell, H. G., “ACI Defines High-Performance Concrete”, Concrete International, February, 1999, pp. 56-57. Russell, H. G., Miller, R. A., Ozyildirim, H. C. and Tadros, M. K., “Compilation and Evaluation of Results from High Performance Concrete Bridge Projects, Volume 1”, Federal Highway Administration, 2003. Russell, H. G., Miller, R. A., Ozyildirim, H. C. and Tadros, M. K., “Compilation and Evaluation of Results from High Performance Concrete Bridge Projects, Volume 2”, Federal Highway Administration, 2003. Russell, H. G., Miller, R. A., Ozyildirim, H. C. and Tadros, M. K., “High Performance Concrete”, Compact Disc, Federal Highway Administration, Version 3.0, 2003. Sarkar, S., Adwan, O. and Munday, J. G. L., “High Strength Concrete: An Investigation of the Flexural Behavior of High Strength RC Beams” Structural Engineer, Vol. 75, No. 7, 1997, pp. 115-121. Schade, J. E., “Flexural Concrete Stress in High Strength Concrete Columns”, M. S. Thesis in Civil Engineering, the University of Calgary, Calgary, Alberta, Canada, 1992. Stallings, J. M., Barnes, R. W. and Eskildsen, S., “Camber and Prestress Losses in Alabama HPC Bridge Girders”, PCI Journal, Vol. 48, No. 5, 2003, pp. 90-104. Stanton, J. F., Barr, P. and Eberhard, M. O., “Behavior of High-Strength HPC Bridge Girders”, Research Report, University of Washington, Seattle, WA, 2000. Swartz, S. E., Nikaeen, A., Narayan Babu, H. D., Periyakaruppan, N. and Refai, T. M. E., “Structural Bending Properties of Higher Strength Concrete”, ACI Special Publication-87, High-Strength Concrete, 1985, pp. 145-178. Tadros, M., Al-Omaishi, N., Seguirant, J. S. and Galit, J. G., “Prestress Losses in Pretensioned High-Strength Concrete Bridge Girders”, NCHRP Report 496, Transportation Research Board, 2003.

146
Zia, P., Leming, M. L., Ahmad, S., Schemmel, J. J., Elliot, R. P. and Naaman, A. E., “Mechanical Behavior of High Performance Concrete, Vol. 1 – Summary Report”, SHRP Report C- 361, Strategic Highway Research Program, National Research Council, Washington, D. C., 1993. Zia, P., Leming, M. L., Ahmad, S., Schemmel, J. J. and Elliot, R. P., “Mechanical Behavior of High Performance Concrete, Vol. 2, - Production of High Performance Concrete”, SHRP ReportC-362, Strategic Highway Research Program, National Research Council, Washington, D. C., 1993. Zia, P., Ahmad, S., Leming, M. L., Schemmel, J. J. and Elliot, R. P., “Mechanical Behavior of High Performance Concrete, Vol. 3 - Very Early Strength Concrete”, SHRP Report C-363, Strategic Highway Research Program, National Research Council, Washington, D. C., 1993. Zia, P., Ahmad, S., Leming, M. L., Schemmel, J. J. and Elliot, R. P., “Mechanical Behavior of High Performance Concrete, Vol. 4 - High Early Strength Concrete”, SHRP Report C-364, Strategic Highway Research Program, National Research Council, Washington, D. C., 1993. Zia, P., Ahmad, S., Leming, M. L., Schemmel, J. J. and Elliot, R. P., “Mechanical Behavior of High Performance Concrete, Vol. 5 - Very High Strength Concrete”, SHRP Report C-365, Strategic Highway Research Program, National Research Council, Washington, D. C., 1993. Zia, P., “State-of-the-Art of HPC: An International Perspective”, Proceedings of the PCI/FHWA International Symposium on High Strength Concrete, New Orleans, Luisiana, 1997, pp. 49-59. Zollman, C. C., “Prestressed Concrete Construction”, The Military Engineer, No.291, 1951.

147
APPENDICES

148
Appendix A: Related Study for Stress Block Parameters (adopted from Mirmiran, 2003)
Reference2 α1 β1 LRFD and
ACI 318-02 (2002)
85.0 ( ) KSIfforfKSIffor
cc
c
4'65.04'05.085.04'85.0
>≥−−
≤
NZS 3101 (1995) (see Li,
Park and Tanaka 1994)
( ) KSIfforfKSIffor
cc
c
8'75.08'02758.085.08'85.0
>≥−−≤
( ) KSIfforfKSIffor
cc
c
35.4'65.035.4'05516.085.035.4'85.0
>≥−−
≤
CSA A23.3 (1994) 67.0'01034.085.0 ≥− cf 67.0'01724.097.0 ≥− cf
EC2-02 (2002) KSIfKSIforf
KSIffor
ckck
cc
ckcc
05.13'25.729
25.7'1
25.7'
≤≤
−
−
≤
α
α
KSIfKSIforfKSIffor
ckck
ck
05.13'25.768
25.7'80.0
25.7'80.0
≤≤−
−
≤
CEB-FIB (1990)
−
3.36'185.0 cf 1
AFREM (1995) 0.85
−
−cf '1724.05.4
7.00.1
ACI 441-R96 (1996) ( ) KSIfforf cc 10'60.010'05033.085.0 >≥−− KSIffor c 10'67.0 ≥
1 For consistency, the equations have been converted from SI units. 2 ACI 441-R96 (1996) is not a design code, and is only shown for comparison. For other design codes, see Appendix A as well as Paultre and Mitchell (2003) and Zia (1997).

149
Appendix B : Shop Drawing for AASHTO Girder
...... -
NO DRAPES I
.,. ................ ~. -, ..... -. --~
_ .. M ~ ~_ "' __ _
CI> '.h.<I< - -~ . .... -. = .. ~.:. '::. t.: -~'--'lI'·'~'l---------'''' .. ''----------;1 ,-.. - ~
...-.~--- .... ~ .-. _.- -'<
11 1' ->-0. .. .. ..., .... "
, " "
_ ..... .. _.~.-- .. " ..... -_.-
....... « • . . '''~
-.~=- .... '"
, '''' , 13

150
" -. ow _
,
i I • • $llW!D • [tips
.". ,,-,.
Ci.r;Ilo.'
'0 I DRAPES •
1!l1!" .
. ...

151
" ..
< , I NO I DRAf>ES
BEAll OIWH. :n"'oo '" . tHOS
.-'''' ' --" .. coo
=
~I=I.= .-. ... ,1, I"" ... .,:'
.~ - .-. --,.
"
/ L .. . ~.
p ... • ~ ..... "':""...:;::---
. . .;;:
;» . . ... -
.. =',=:t"':"'''':~~ 1-. :: .. - -=-";. -i. \.r.:. .... - - ,, '''''l
::
~ .:g ~ ;!;';.~."" - ~.--
... « , El
~ ~
~ ~
~

152
ItAW 001""
,
• .. , I • • 5JJWjP 9 [HIlS
.~-.-.- ...... . -
"' DRAPtS
"I" -
I
[lEV -~-_, _ _ _ , __ _ ~G!!!!I£II
'I!!~ '" -"~ ... _--
R[J~ • [HIlS
::
_ .. _-_.-:.-:;~
!
153
".dd--I-I
" ItAW DIlIH.
• $l'l!A!Il • [HM ' .... y • £BPS .... ~.- ......... , ..... - ....... ~
r ===:~:=· = .. nl .... ··: .... n ............... d I ,.
n'N YO'
.. .- ~ :..;.:,~..:: ~ . "' .. , , .... ""
,. _ ....... _-... -j-,:-- -"'-::'--,- -, '
•
[ ~---.... f' f ' ._ .. _u_ II '.. .'? ~. , . . --
'N~!:, :.; ~%.: !!.~~QlRprB
:::==-",=.:0:-... _ . •• .•• .. __ ....... . ..:. __ ._._-
""--1\
•
• •
"?~'&' --".-:,:::
,i' ,...- ,
f1~ ~
':3
-"'..... S2=.U "'" " ~
I

154
Appendix C : Shop Drawing for Cast-in place Deck

155
' - 0" OOTE, Fo, ono MS HTO c.roo , W ,. Co"not o S~r. t'\Q"'" .. , ,e' , ,. 04 , SPA t 6" on I 3
+ "'0
~, [0, M~ 2 !' , ~~2 18
, C· -)
,.~ C , for ~ " .. <WeI< "t~b . <OOOp.1
. . .
(' l ' .. ,
- , - ,' .. ' .
SECTIO N , SPA @ 6"
36 Sf _ .. ,. A CC BEAM
REIN!' , SY~.M. AEOJT CC
. . • . •• . . • . . . • • ' . . . . . .
• • . . . .. .' • • . · • . • . . ; • . . • ~ ','
",- . • . •• '';' . . • . . • • .. .. • . · . , . . . . • • . . . • . .' . . . · . . . " .. . .
, " . . . ,~ c
NCSU NC HRP 12 - 64 ELE VA TION V IE W' ALO NG GIRD ER
DEC~ CAS TING SLAB I'IDTH ~,
Do' e 00 I 05 200'5
TEl. , "~">-1'" '''' ' "~"H""

156
~.~
r " • • >e' 0 " o· f-:;?" • • ,eo " . , . . · .
' . . ·
SECTIO N A
r----r--;:<",··,,,',,·.·---o 36 S~ ' @ b-----,',·
CL BEAM REI~ , SY"M. AEOJT CL A
•• . • . . . . . . • . . . • .. . ., • • . .' . • • .
• . • . . . . . •
. • . , .... • .
• . . • . . . . . . • . •
'" " . '" . ,_ ,e
ELE VA TION V IE 'w' ALO NG GIRD ER
• • . . • · .. .
~TE' Fo " 0". AAS HTO r.lro .r p .... Conc".~. S~r.~~n
on ... 3
. ' .
•• . . .. •
, ' . • . .
NCSU NC HRP 12- 64 DEC~ CA STING SLAB Io'IDTH l rT
TEl. , "~">-1'" "" , "~">-1""

157
Appendix D : Concrete Batch Mixes
10 ksi Production (Mix 1P) Batch 1 Batch 2 Batch 3 Cement 675 661 663 Flyash 166 156 150 Microsilica 47 48 51 #67 Granite 1697 1647 1719 Concrete Sand (River) 1084 1058 1087 Water 33 36 35 Recover 26 25 29 ADVA 170 97 94 98
14 ksi Production (Mix 2P)
Batch 1 Batch 2 Batch 3 Cement 692 699 698 Flyash 196 205 197 Microsilica 76 72 75 #67 Granite 1684 1674 1681 Concrete Sand (River) 1073 1079 1092 Water 29 30 30 Recover 37 50 50 ADVA 170 123 124 125
18 ksi Production (Mix 3P)
Batch 1 Batch 2 Batch 3 Cement 946 896 873 Flyash 196 191 189 Microsilica 86 79 79 #67 Granite 1784 1759 1667 Concrete Sand (River) 854 931 914 Water 25 29 32 Recover 38 37 36 ADVA 170 142 137 145
• Water gallon/cubic yard • Recover oz/cubic yard • ADVA oz/cubic yard

158
Appendix E : Compressive Concrete Strength from Girder Producer Average Compressive Strength from 2, 4″x8″ Cylinders
Mix Design Batch 1days
(psi)
7days
(psi)
14days
(psi)
28days
(psi)
56days
(psi)
1 6180 9750 10610 13090 14100 Mix 1P
3 6320 8310 10080 11640 10890
1 6360 12750 13200 14170 14150
2 5560 13890 14170 14330 15880 Mix 2P
3 5560 12920 13550 14660 17540
1 7480 11120 14030 14430 15650
2 7700 - 17230 16580 18710 Mix 3P
3 8100 13730 15320 16090 17880

159
Appendix F : Distribution of the collected data
Compressive Strength of Concrete (psi)
< 6,00022%
6,000 - 10,00043%
10,000 - 15,00027%
> 15,0008%
Unit Weight (pcf)
90-1105% 120-130
4%130-140
9%
140-15046%
>15031%
110-1205%

160
Appendix G : Stain envelopes for each specimens
a) Strain gauge location
0
50,000
100,000
150,000
200,000
250,000
0 0.001 0.002 0.003 0.004 0.005 0.006
Strain (ε)
Load
(lbs
)
P1 P2 P3S1 S2
P2
P1, P3, S1 and S2
b) Strain at the top surface
0
50,000
100,000
150,000
200,000
250,000
-0.035 -0.030 -0.025 -0.020 -0.015 -0.010 -0.005 0.000
Strain (ε )
Load
(lbs
)
P4 P5 P6P4 P5P6
c) Strain at the bottom surface
0
50,000
100,000
150,000
200,000
250,000
-0.004 -0.003 -0.002 -0.001 0
Strain (ε )
Load
(lbs
)
SP1 SP2 SP3
NP1 NP2
NP2
SP1SP2
SP3
NP1
d) Strain at the side surface
Figure G-1 Strain envelopes for10PS-5S
SP1
SP2
SP3
NP1
NP2
P1 P2 P3
P4 P5 P6
S1 S2

161
a) Strain gauge location
0
50,000
100,000
150,000
200,000
250,000
300,000
0 0.001 0.002 0.003 0.004 0.005 0.006
Strain (ε)
Load
(lbs
)
P2 P3 P1
S1 S2
P1, P2 and P3S1, S2
b) Strain at the top surface
0
50,000
100,000
150,000
200,000
250,000
300,000
-0.01 -0.008 -0.006 -0.004 -0.002 0
Strain (ε)
Load
(lbs
)
WG4 WG3 P4P6 P5
WG3P5
P6
WG4
P4
c) Strain at the bottom surface
0
50,000
100,000
150,000
200,000
250,000
300,000
-0.006 -0.005 -0.004 -0.003 -0.002 -0.001 0
Strain (ε)
Load
(lbs
)
SP1 SP2 SP3
NP1 NP2
SP2
NP1
NP2
SP3
SP1
d) Strain at the side surface
Figure G-2 Strain envelopes for14PS-5S
SP1
SP2
SP3
NP1
NP2
P1 P2 P3
P4 P5 P6
S1 S2

162
a) Strain gauge location
0
50,000
100,000
150,000
200,000
250,000
0 0.001 0.002 0.003 0.004
Strain (ε )
Load
(lbs
)
P1 P2 P3
S1 S2
S1
S2
P3
P1
P2
b) Strain at the top surface
0
50,000
100,000
150,000
200,000
250,000
-0.03 -0.025 -0.02 -0.015 -0.01 -0.005 0Strain (ε )
Load
(lbs
)
P4 P5 P6
P4
P5P6
c) Strain at the bottom surface
0
50,000
100,000
150,000
200,000
250,000
-0.012 -0.01 -0.008 -0.006 -0.004 -0.002 0 0.002 0.004Strain (ε)
Load
(lbs
)
SP0 SP1 SP2SP3 NP1 NP2 SP0
SP1CompressionTension
SP2SP3
NP1
NP2
d) Strain at the side surface
Figure G-3 Strain envelopes for 14PS-1S
SP1
SP2
NP1
SP0
SP3 NP2
P1 P3
P4 P5 P6
P2
S1 S2

163
a) Strain gauge location
0
50,000
100,000
150,000
200,000
250,000
0 0.001 0.002 0.003 0.004 0.005 0.006
Strain (ε )
Load
(lbs
)
P1 P2 P3
S1 S2
S1
S2
P3
P1
P2
b) Strain at the top surface
0
50,000
100,000
150,000
200,000
250,000
-0.025 -0.02 -0.015 -0.01 -0.005 0Strain (ε)
Load
(lbs
)
P4 P5 P6P6
P5
P4
c) Strain at the bottom surface
0
50,000
100,000
150,000
200,000
250,000
-0.012 -0.01 -0.008 -0.006 -0.004 -0.002 0 0.002 0.004Strain (ε)
Load
(lbs
)
SP0 SP1 SP2SP3 NP1 NP2 SP2
SP3
NP2
CompressionTension
NP1
SP0
SP1
d) Strain at the side surface
Figure G-4 Strain envelopes for 18PS-1S
SP1
SP2
NP1
SP0
SP3 NP2
P1 P3
P4 P5 P6
P2
S1 S2

164
a) Strain gauge location
0
50,000
100,000
150,000
200,000
0 0.001 0.002 0.003 0.004
Strain (ε)
Load
(lbs
)
P1 P2 P3
S1 S2S1
S2
P3
P1
P2
b) Strain at the top surface
0
50,000
100,000
150,000
200,000
-0.012 -0.01 -0.008 -0.006 -0.004 -0.002 0Strain (ε )
Load
(lbs
)
P4 P5 P6P4
P5
P6
c) Strain at the bottom surface
0
50,000
100,000
150,000
200,000
-0.01 -0.008 -0.006 -0.004 -0.002 0 0.002 0.004Strain (ε )
Load
(lbs
)
SP1 SP2 SP3NP1 NP2 SP0
SP2
SP0
NP1SP1
SP3
NP2
d) Strain at the side surface
Figure G-5 Strain envelopes for 10PS-N
SP1
SP2
NP1
SP0
SP3 NP2
P1
P4 P5 P6
P2 P3
S1 S2
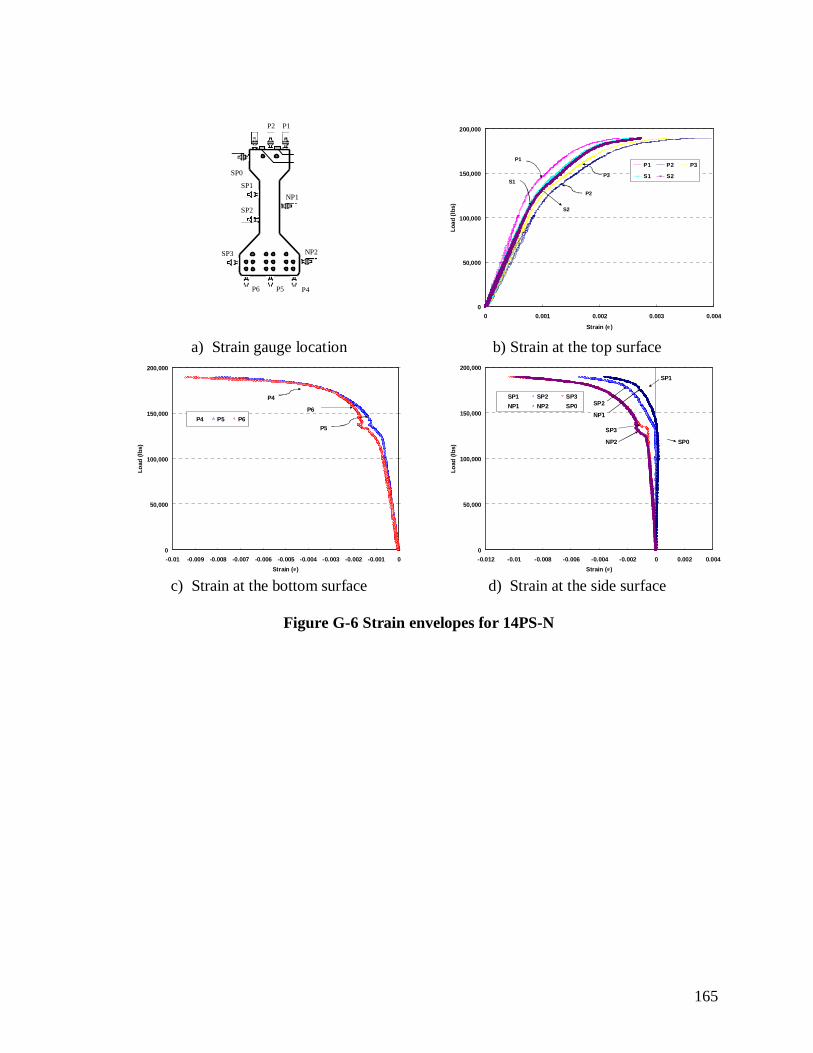
165
a) Strain gauge location
0
50,000
100,000
150,000
200,000
0 0.001 0.002 0.003 0.004
Strain (ε )
Load
(lbs
)
P1 P2 P3
S1 S2S1
S2
P3
P1
P2
b) Strain at the top surface
0
50,000
100,000
150,000
200,000
-0.01 -0.009 -0.008 -0.007 -0.006 -0.005 -0.004 -0.003 -0.002 -0.001 0Strain (ε)
Load
(lbs
)
P4 P5 P6P6
P4
P5
c) Strain at the bottom surface
0
50,000
100,000
150,000
200,000
-0.012 -0.01 -0.008 -0.006 -0.004 -0.002 0 0.002 0.004Strain (ε)
Load
(lbs
)
SP1 SP2 SP3NP1 NP2 SP0
SP3
SP0
SP1
SP2
NP2
NP1
d) Strain at the side surface
Figure G-6 Strain envelopes for 14PS-N
SP1
SP2
NP1
SP0
SP3
NP2
P1
P4 P5 P6
P2

166
Appendix H : Prestress losses Calculation (adopted from Tadros, 2003)
NCHRP 12-64 AAHSTO girderProposed Detailed Method Using Estimated Material PropertiesPrecast 10PS-5S
Span 40 ft H 70 %A 369.00 in2 fci 6.200 ksiI 50980 in4 f'c 11.490 ksiyb 15.83 inh 36 inV/S 3.37 inDeckWidth 60 in f'cd 3.78 ksiThickness 8 inArea 480 in2
Steel Age at release ti 2 daysAps 2.448 in2 Age at deck placement 91 daysfpi 202.5 ksi Age at Final 120 daysEs 29000 ksiypb 7.25 inLoads Midspan MomentsGirder self wt 0.3840 kip/ft Girder self wt 922 kip-inDeck wt 0.500 kip/ft Deck wt 1200 kip-inHaunch wt 0.000 kip/ft Haunch wt 0 kip-inDiaph. wt 0.000 kip/ft Diaph. Wt 0.0 kip-in 1200 kip-inSI dead ld. 0.000 kip/ft SI dead ld. 0 kip-in
Live load plus impact 0 kip-inSolutionModulus of Elasticity 33000*w^1.5*(f'c)^0.5 Beam Eci 4726
w=0.15 (kcf) Ec 6434Deck Ecd 3690
Shrinkage 0.00043(5/(1+fci))kskhktd Beam εbif 0.000259kh 2.0-0.0143H εbid 0.000241ktd t/(61-4fci+t) Precast εbdf 0.000018
Deck εddf 0.000182
Creep 1.80*ks*kh*(5/(1+fci))*kla*ktd Beam ψbif 0.965kh (1.58-0.008*H) ψbid 0.896kla ti^-0.118 Formula for girder only ψbdf 0.357ktd t/(61-4fci+t) Deck ψddf 1.294
Precast CompositeSection Properties Gross Section Transf. Rel Tr. Final Deck Gross Tr.Steel modular ratio,ni Es/Eci 6.1363 A 369.00 381.57 377.59 275.31 644.31 652.90Steel modular ratio,n Es/Ec 4.5076 yb (to bottom fiber of beam) 15.83 15.55 15.63 40 26.16 25.91Deck modular ratio Ed/Ec 0.5736 I 50980 51875 51598 1468 144559 147588.3
ep 8.58 8.30 8.38 18.91 18.66ed -13.84α=1+A*e2/I 1.5328 2.593
Transfromed section factors, K Kr Elastic (at release) 0.94126 Kdc Elastic(at SIDL) 0.95747K=1/(1+n*α*As/Ac*(1+0.7*C)) Kd Elastic(at deck pl.) 0.95617
Krd Long-term 0.90535 Kdf Long-term 0.90802Gross Section Transf. Section
Steel Stress Concrete Stress Concrete StressStress Calculation Change Net Change Net Change Net
202.500(1) Elastic due to Pi Pi*α*Kr*ni/A 11.894 190.606 1.938 1.938 1.957 1.957
(2) Elastic due to self weight M*e/I*Kr*ni -0.896 191.502 -0.146 1.792 -0.147 1.810
(3) Shrinkage between release and deck place εbid*Ep*Krd 6.318 185.183
(4) Creep between release and deck place ni*fcir*Kr*ψbid*Krd 8.924 176.260
(5) Relaxation between release and deck place 1.200 175.060 -0.167 1.625 -0.159 1.651
(6) Elastic due to deck weight n*δfcdp*Kd -0.870 175.930 -0.193 1.432 -0.195 1.456
(7) Elastic due to superimposed DL (on composite section) n*δfcsp*Kdc 0.000 175.930 0.000 1.432 0.000 1.456
(8) Shrinkage of beam bet.deck place and final εbdf*Ep*Kdf 0.485 175.445
(9) Creep of beam bet.deck place and final, due to initial loads ni*fpc*(ψbif-ψbid)*Kdf 0.685 174.761
(10) Creep of beam due to deck and SIDL n*dfpc*ψbdf*Kdf -0.527 175.288
(11) Relaxation between deck place and final φd*Ld*Kdf 1.200 174.088
(12) Shrinkage of deck εbdf*Ecd/(1+0.7*ψddf)*Ad*α/A*Kdf*n*(1+0.7*ψbdf) -0.223 174.311 -0.016 1.416 -0.015 1.440
Total Prestress Loss prior to Live Load Application 28.189

167
Appendix I : Concrete material model
0
2,000
4,000
6,000
8,000
10,000
12,000
14,000
16,000
18,000
20,000
0 0.001 0.002 0.003 0.004 0.005
Strain (ε)
Stre
ss (p
si)
Cylinder Test
Best Fit Curve
Best fit curve for 14PS-5S girder
Best fit curve for 18PS-5S girder
Best fit curve for 14PS-5S deck
Best fit curve for 18PS-5S deck
Figure I-1 Best fit curve for 14PS-5S and18PS-5S
0
2,000
4,000
6,000
8,000
10,000
12,000
14,000
16,000
18,000
20,000
0 0.001 0.002 0.003 0.004 0.005Strain (ε)
Stre
ss (p
si)
Cylinder Test
Best Fit Curve
Best fit curve for 14PS-1S girder
Best fit curve for 18PS-1S girder
Best fit curve for 10PS-1S girder
Best fit curve for 1ft. wide deck concrete
Figure I-2 Best fit curve for 10PS-1S, 14PS-1S and 18PS-1S

168
0
2,000
4,000
6,000
8,000
10,000
12,000
14,000
16,000
18,000
20,000
0 0.001 0.002 0.003 0.004 0.005
Strain (ε)
Stre
ss (p
si)
Cylinder test
Best fit curve
Best fit curve for 10PS-N
Best fit curve for 14PS-N
Best fit curve for 18PS-N
Figure I-3 Best fit curve for 10PS-N, 14PS-N and 18PS-N