Embed Size (px)
Citation preview
Transactions of the ASABE
Vol. 56(3): 901-910 2013 American Society of Agricultural and Biological Engineers ISSN 2151-0032 901
MEASURING SOIL ERODIBILITY USING A LABORATORY “MINI” JET
A. T. Al-Madhhachi, G. J. Hanson, G. A. Fox, A. K. Tyagi, R. Bulut
ABSTRACT. Typically soil erodibility is quantified using an excess shear stress equation, dependent on two major soil parameters: the critical shear stress (τc) and the erodibility coefficient (kd). A submerged jet test (JET, Jet Erosion Test) is one method that has been developed and methodology of use established in the literature for measuring these parameters. In this study, a new miniature version of the JET device (“mini” JET), with the advantage of being easier to use in the field, was used to measure τc and kd for two soils (silty sand and clayey sand), and results were compared to the larger original laboratory JET. The objective of this research was to determine if the “mini” JET measured equivalent values for τc and kd compared to the original JET device. In-order to compare the performance and repeatability of both JET devices, tests were performed on paired samples prepared in the same way and tested at the same time. Samples of the soils tested were prepared at different water contents with a standard compaction effort of 600 kN-m/m3 (ASTM). Some variability in measuring τc and kd was observed between paired samples due to variability in the soil texture of the soil samples and differences in soil moisture levels. The kd values measured by the two JET devices for both soils were not significantly different. The τc values measured by the “mini” JET were consistently lower than those measured by the original JET. This was hypothesized to be due to the structure of the soil sample due to the compaction method and the procedure utilized to determine τc. Adjustment of the equilibrium depth of the “mini” JET resulted in small differences in the estimated τc between both JET devices. Both JET devices also demonstrated consistent performance in measuring τc-kd relationships, which were compared with those observed in previous field research.
Keywords. Critical shear stress, Erodibility coefficient, Jet erosion test, Soil erodibility.
uantifying soil erodibility is an important challenge for many engineers and scientists because erosion is one of the major water resources issues in the world. One indication of the
importance of quantifying the erodibility of soil materials is the sheer number of methods that have recently been developed to measure it in the laboratory and the field (Hanson, 1990b; Briaud et al., 2001; Hanson and Cook, 2004; Wan and Fell, 2004; Mazurek, 2010; Marot et al., 2011). Quantifying erodibility of soil materials has implications for predicting the erosion of disturbed and undisturbed landscapes, riparian areas, streambanks and beds, bridge pier and abutment scour, dams, and levees. Many factors influence soil erodibility, such as texture, structure, unit weight, water content, swell, clay mineral-
ogy, pore water chemistry, etc. Normally, the erosion rate of soils is approximated using an excess shear stress equation, dependent on the hydraulic boundary shear stress (τ, Pa) and two major soil parameters: the critical shear stress (τc, Pa) and the erodibility coefficient (kd, m3/N-s). The τc represents the flow condition where stress is great enough to begin soil detachment, while the kd is the rate of soil detachment when the boundary shear stress is greater than τc (Hanson and Cook, 2004). The erosion rate is typically expressed as (Partheniades, 1965; Hanson, 1990a, 1990b):
( )ar d ckε = τ − τ (1)
where εr is the erosion rate (m s-1), and a is an empirical exponent usually assumed to be unity (Hanson, 1990a, 1990b; Hanson and Cook, 1997).
Numerous studies have measured τc and kd for soils using different techniques; large flumes (Hanson, 1990a; Hanson and Cook, 2004), small flumes (Briaud et al., 2001), laboratory hole erosion test (Wan and Fell, 2004), and a submerged jet (Hanson and Cook, 2004; Mazurek, 2010; Marot et al., 2011). The submerged jet test (JET, Jet Erosion Test) apparatus is one of the methods for measuring these parameters in situ as well as in the laboratory (Hanson, 1990b; Hanson and Cook, 1997; Hanson and Simon, 2001; Hanson et al., 2002a; Hanson and Cook, 2004; Hanson and Hunt, 2007) and is the focus of the study reported in this article.
A description of JET, step-by-step testing methodology,
Submitted for review in October 2011 as manuscript number SW
9472; approved for publication by the Soil & Water Division of ASABE inMarch 2013.
The authors are Abdul-Sahib T. Al-Madhhachi, ASABE Member,Department of Environmental Engineering, College of Engineering, Al-Mustansiriya University, Baghdad, Iraq; Gregory J. Hanson, ASABEMember, Research Leader (Retired), USDA-ARS Hydraulic Laboratory,Stillwater, Oklahoma; Garey A. Fox, ASABE Member, Associate Professor and Orville L. and Helen L. Buchanan Endowed Chair,Department of Biosystems and Agricultural Engineering, Oklahoma StateUniversity, Stillwater, Oklahoma; Avdhesh K. Tyagi, Associate Professor,and Rifat Bulut, Assistant Professor, Department of Civil andEnvironmental Engineering, Oklahoma State University, Stillwater,Oklahoma. Corresponding author: Gregory J. Hanson, USDA-ARS Hydraulic Laboratory, 1301 N. Western, Stillwater, OK 74075; phone:405-624-4135; e-mail: [email protected].
Q
902 TRANSACTIONS OF THE ASABE
and development of analytical procedures were presented in numerous studies (Hanson and Cook, 1997; Hanson and Simon, 2001; Hanson et al., 2002a; Hanson and Cook, 2004). Hanson (1990b) performed seven tests on four types of soils using the JET device, and the results were calibrated with those measured in a large open channel in another study by Hanson (1990a). Hanson and Cook (1997) and Hanson et al. (2002a) developed the analytical methods to directly measure τc and kd based on diffusion principles using an Excel spreadsheet. Hanson and Simon (2001) measured the soil erodibility of streambeds in the Midwestern U.S. They employed the JET apparatus to measure τc and kd and observed an inverse relationship between the two parameters.
Other research has focused on the impact of soil parameters, such as the influence of water content, soil texture, bulk density, and soil compaction on measuring soil erodibility using the JET apparatus (Hanson and Robinson, 1993; Hanson and Hunt, 2007; Regazzoni et al., 2008). Hanson and Robinson (1993) utilized two types of soils (lean clay and silty clay) to measure soil erodibility relative to soil compaction and moisture content in earthen spillways using the JET device. Their results showed that water content, compaction, and density of soil had a considerable effect on the measured τc and kd parameters. A laboratory version of the JET device (referred to as the original JET in this study) was employed to examine the influence of soil compaction on measured kd by Hanson and Hunt (2007). They utilized a soil sample of 944 cm3 packed at different compaction water contents with a variety of compaction energies. They found that the resistance of erosion increased (decreased kd) when soil compaction reached optimum water content and maximum dry density. Regazzoni et al. (2008) also demonstrated the impact of water content and different compaction energies on the measured erosion rate parameters (τc and kd) using the original JET laboratory apparatus. Their results confirmed the previous findings by Hanson and Hunt (2007) that the kd of clay soil was dependent on the water content at different compaction energies.
A new miniature version of the JET device, which is referred to as the “mini” JET, has been developed. The “mini” JET device is smaller (975 cm3) and lighter (4.2 kg) than the original JET device (28,130 cm3 and 12.6 kg) and thus can be more easily handled in the field as well as in laboratory. The “mini” JET requires a smaller water supply in the field, resulting in less effort for transporting the required volume of water as compared to the original JET. The “mini” JET device was first used by Simon et al. (2010) in the field, where they performed 279 tests using the “mini” JET to measure τc and kd. They compared the “mini” JET results with the original JET device at 35 sites in the Tualatin River basin, Oregon. They observed good agreement in measured values of τc, but observed differences in kd and the τc-kd relationships between the two JET devices. Simon et al. (2010) hypothesized that these differences may be due to differences in the size of both submergence cans for these JET devices. These tests were conducted in situ at side-by-side locations, but results may
have been influenced by in situ heterogeneity and possible differences in methodology and setup.
The objective of this research was to determine if the “mini” JET device established equivalent values for τc and kd compared to the original JET device under controlled laboratory conditions without the influence of hetero-geneity. The laboratory submerged jet test device, which was used by Hanson and Hunt (2007), was used as the original JET device in this study. Two types of soils were employed in this study: silty sand and clayey sand. The τc-kd relationships were derived and compared with previous study for both JET devices.
MATERIALS AND METHODS ORIGINAL JET DEVICE
The original JET device used in this study was the same as that used by Hanson and Hunt (2007). This laboratory JET apparatus consists of the following parts: jet tube, adjustable head tank, point gauge, nozzle, deflection plate (deflector), jet submergence tank, lid, and hoses, as shown in figure 1a. The jet tube had a 50 mm inner diameter with 6.4 mm wall thickness and an 89 mm diameter orifice plate with a nozzle at the center of this plate. The nozzle was 6.4 mm in diameter. The adjustable head tank was 910 mm in height with a 50 mm inner diameter and was utilized to provide a desired water head upstream of the nozzle. Scour readings were taken using the point gauge, which was passed through the jet nozzle and extended to the soil surface. The point gauge diameter was equivalent to the jet nozzle diameter; therefore, the water jet was shut off during scour readings. The deflection plate (deflector) was used to prevent the water jet from impinging on the soil sample at the beginning of the test and at each scour reading. During the first filling of the jet tube, the air relief valve was used to remove air from the jet tube. The jet submergence tank was 305 mm in height and 305 mm in diameter with a 6.4 mm wall thickness. The submergence tank opened from the top with the jet tube and attached lid (Hanson and Hunt, 2007).
“MINI” JET DEVICE The “mini” JET apparatus (fig. 1b) consists of the
following parts: pressure gauge, outlet and inlet water, depth gauge, rotatable plate (depth gauge and nozzle), submergence tank, foundation ring, valve, and hoses. The same adjustable head tank, as was used in the original JET device, was used for the “mini” JET to provide the desired water head. The scour readings were taken using the depth gauge. The depth gauge of the “mini” JET was different from the point gauge of the original JET, but both have the same function of reading the scour depth. The rotatable plate had a 3.18 mm diameter nozzle (fig. 1c). This rotatable plate was used to prevent the water from impinging upon the soil sample at the beginning of testing and during scour depth readings at different times during the test runs. The submergence tank was 70 mm in height and 101.6 mm in diameter with a 6.4 mm wall thickness. The submergence tank did not open from the top, and the

56(3): 901-910 903
Water inlet Pressure
gauge
Valve
Depth gauge
Rotatableplate
Foundationring
Soil specimen (standard mold)
Submergence tank
Water outlet
rotatable plate and depth gauge were attached to the top of the tank. The foundation ring was 180 mm in diameter and was pushed into the soil 51 mm when used in the field.
ANALYSIS METHODS The analytical methods for the original JET presented by
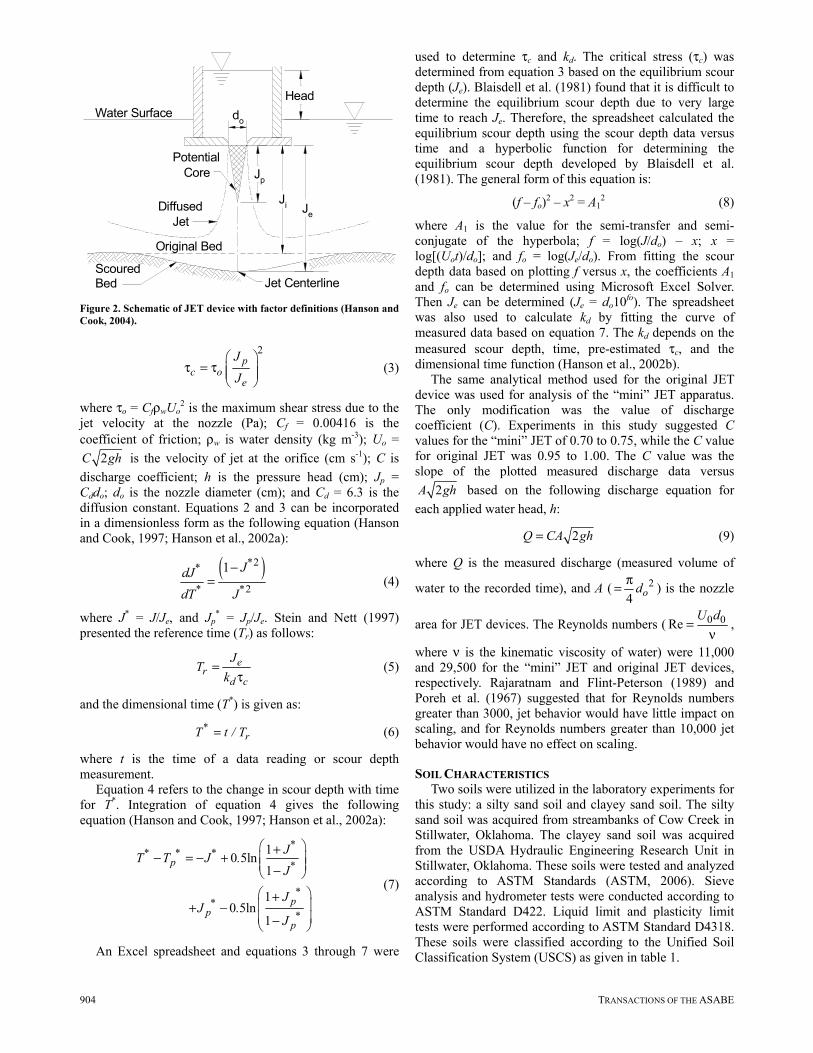
Hanson and Cook (1997) were based on diffusion principles developed by Stein and Nett (1997). They assumed that the rate of variation in the depth of scour (dJ/dt) was the erosion rate as a function of the maximum stress at the boundary, which was determined by the diameter of the jet nozzle and the distance from jet origin to
the initial channel bed (fig. 2). Therefore, the erosion rate equation for jet scour is written as (Hanson and Cook, 1997):
2
2o p
d cJdJ
kdt J
τ = − τ
, for J >= Jp (2)
where J is the scour depth (cm), and Jp is the potential core length from jet origin (cm). Accordingly, the critical shear stress was assumed to occur when the rate of scour was equal to zero at the equilibrium depth, Je (Hanson and Cook, 1997; Hanson et al., 2002a):
(a) Original JET device (b) “Mini” JET device
(c) Rotatable plate of the “mini” JET device
Figure 1. Laboratory JET devices.
Depth gauge
Rotatable plate
Foundation ring (18 cm dia. x 5.1 cm)
Rotatable nozzle (3.18 mm dia.)
Submergence tank (7 cm high x 10.16 cm)
Deflector
Adjustable head tank
(0.91 m high)
Hoses
Point gauge
Water source
Jet tube (50 mm dia.)
Nozzle (6.4 mm dia.)
Soil specimen (standard mold) (11.64 cm high
x 10.16 cm dia.)
Lid
Deflector
Submergence tank (30.5 cm high x 30.5 cm dia.)
904 TRANSACTIONS OF THE ASABE
2p
c oe
J
J
τ = τ
(3)
where τo = CfρwUo2 is the maximum shear stress due to the
jet velocity at the nozzle (Pa); Cf = 0.00416 is the coefficient of friction; ρw is water density (kg m-3); Uo =
2C gh is the velocity of jet at the orifice (cm s-1); C is
discharge coefficient; h is the pressure head (cm); Jp = Cddo; do is the nozzle diameter (cm); and Cd = 6.3 is the diffusion constant. Equations 2 and 3 can be incorporated in a dimensionless form as the following equation (Hanson and Cook, 1997; Hanson et al., 2002a):
( )2
2
1 **
* *
JdJ
dT J
−= (4)
where J* = J/Je, and Jp* = Jp/Je. Stein and Nett (1997)
presented the reference time (Tr) as follows:
er
d c
JT
k=
τ (5)
and the dimensional time (T*) is given as:
*rT t / T= (6)
where t is the time of a data reading or scour depth measurement.
Equation 4 refers to the change in scour depth with time for T*. Integration of equation 4 gives the following equation (Hanson and Cook, 1997; Hanson et al., 2002a):
10 5ln
1
10 5ln
1
** * *
p *
*p*
p *p
JT T J .
J
JJ .
J
+− = − + − + + − −
(7)
An Excel spreadsheet and equations 3 through 7 were
used to determine τc and kd. The critical stress (τc) was determined from equation 3 based on the equilibrium scour depth (Je). Blaisdell et al. (1981) found that it is difficult to determine the equilibrium scour depth due to very large time to reach Je. Therefore, the spreadsheet calculated the equilibrium scour depth using the scour depth data versus time and a hyperbolic function for determining the equilibrium scour depth developed by Blaisdell et al. (1981). The general form of this equation is:
(f – fo)2 – x2 = A1
2 (8)
where A1 is the value for the semi-transfer and semi-conjugate of the hyperbola; f = log(J/do) – x; x = log[(Uot)/do]; and fo = log(Je/do). From fitting the scour depth data based on plotting f versus x, the coefficients A1 and fo can be determined using Microsoft Excel Solver. Then Je can be determined (Je = do10fo). The spreadsheet was also used to calculate kd by fitting the curve of measured data based on equation 7. The kd depends on the measured scour depth, time, pre-estimated τc, and the dimensional time function (Hanson et al., 2002b).
The same analytical method used for the original JET device was used for analysis of the “mini” JET apparatus. The only modification was the value of discharge coefficient (C). Experiments in this study suggested C values for the “mini” JET of 0.70 to 0.75, while the C value for original JET was 0.95 to 1.00. The C value was the slope of the plotted measured discharge data versus
2A gh based on the following discharge equation for
each applied water head, h:
2Q CA gh= (9)
where Q is the measured discharge (measured volume of
water to the recorded time), and A ( 2
4 odπ= ) is the nozzle
area for JET devices. The Reynolds numbers ( 0 0ReU d
=ν
,
where ν is the kinematic viscosity of water) were 11,000 and 29,500 for the “mini” JET and original JET devices, respectively. Rajaratnam and Flint-Peterson (1989) and Poreh et al. (1967) suggested that for Reynolds numbers greater than 3000, jet behavior would have little impact on scaling, and for Reynolds numbers greater than 10,000 jet behavior would have no effect on scaling.
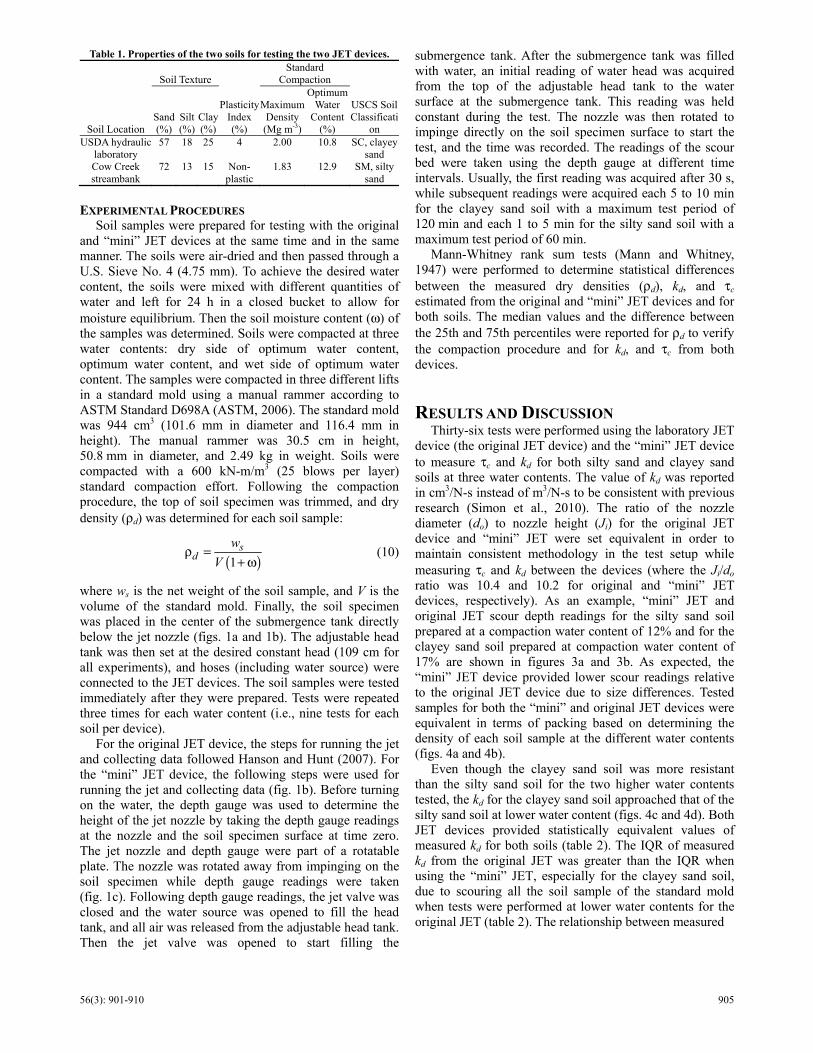
SOIL CHARACTERISTICS Two soils were utilized in the laboratory experiments for
this study: a silty sand soil and clayey sand soil. The silty sand soil was acquired from streambanks of Cow Creek in Stillwater, Oklahoma. The clayey sand soil was acquired from the USDA Hydraulic Engineering Research Unit in Stillwater, Oklahoma. These soils were tested and analyzed according to ASTM Standards (ASTM, 2006). Sieve analysis and hydrometer tests were conducted according to ASTM Standard D422. Liquid limit and plasticity limit tests were performed according to ASTM Standard D4318. These soils were classified according to the Unified Soil Classification System (USCS) as given in table 1.
Head Water Surface
Original Bed
Je
Potential Core
Diffused Jet
Scoured Bed Jet Centerline
do
Ji
Jp
Figure 2. Schematic of JET device with factor definitions (Hanson andCook, 2004).
56(3): 901-910 905
EXPERIMENTAL PROCEDURES Soil samples were prepared for testing with the original
and “mini” JET devices at the same time and in the same manner. The soils were air-dried and then passed through a U.S. Sieve No. 4 (4.75 mm). To achieve the desired water content, the soils were mixed with different quantities of water and left for 24 h in a closed bucket to allow for moisture equilibrium. Then the soil moisture content (ω) of the samples was determined. Soils were compacted at three water contents: dry side of optimum water content, optimum water content, and wet side of optimum water content. The samples were compacted in three different lifts in a standard mold using a manual rammer according to ASTM Standard D698A (ASTM, 2006). The standard mold was 944 cm3 (101.6 mm in diameter and 116.4 mm in height). The manual rammer was 30.5 cm in height, 50.8 mm in diameter, and 2.49 kg in weight. Soils were compacted with a 600 kN-m/m3 (25 blows per layer) standard compaction effort. Following the compaction procedure, the top of soil specimen was trimmed, and dry density (ρd) was determined for each soil sample:
( )1s
dw
Vρ =
+ ω (10)
where ws is the net weight of the soil sample, and V is the volume of the standard mold. Finally, the soil specimen was placed in the center of the submergence tank directly below the jet nozzle (figs. 1a and 1b). The adjustable head tank was then set at the desired constant head (109 cm for all experiments), and hoses (including water source) were connected to the JET devices. The soil samples were tested immediately after they were prepared. Tests were repeated three times for each water content (i.e., nine tests for each soil per device).
For the original JET device, the steps for running the jet and collecting data followed Hanson and Hunt (2007). For the “mini” JET device, the following steps were used for running the jet and collecting data (fig. 1b). Before turning on the water, the depth gauge was used to determine the height of the jet nozzle by taking the depth gauge readings at the nozzle and the soil specimen surface at time zero. The jet nozzle and depth gauge were part of a rotatable plate. The nozzle was rotated away from impinging on the soil specimen while depth gauge readings were taken (fig. 1c). Following depth gauge readings, the jet valve was closed and the water source was opened to fill the head tank, and all air was released from the adjustable head tank. Then the jet valve was opened to start filling the
submergence tank. After the submergence tank was filled with water, an initial reading of water head was acquired from the top of the adjustable head tank to the water surface at the submergence tank. This reading was held constant during the test. The nozzle was then rotated to impinge directly on the soil specimen surface to start the test, and the time was recorded. The readings of the scour bed were taken using the depth gauge at different time intervals. Usually, the first reading was acquired after 30 s, while subsequent readings were acquired each 5 to 10 min for the clayey sand soil with a maximum test period of 120 min and each 1 to 5 min for the silty sand soil with a maximum test period of 60 min.
Mann-Whitney rank sum tests (Mann and Whitney, 1947) were performed to determine statistical differences between the measured dry densities (ρd), kd, and τc estimated from the original and “mini” JET devices and for both soils. The median values and the difference between the 25th and 75th percentiles were reported for ρd to verify the compaction procedure and for kd, and τc from both devices.
RESULTS AND DISCUSSION Thirty-six tests were performed using the laboratory JET
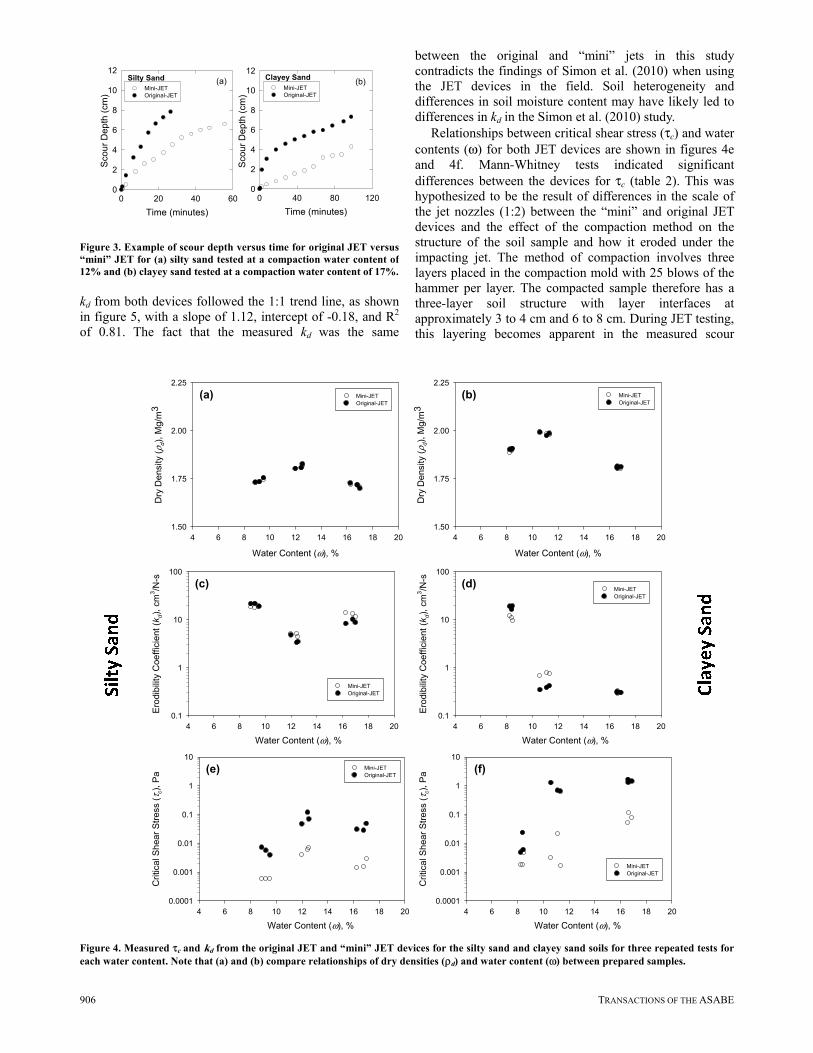
device (the original JET device) and the “mini” JET device to measure τc and kd for both silty sand and clayey sand soils at three water contents. The value of kd was reported in cm3/N-s instead of m3/N-s to be consistent with previous research (Simon et al., 2010). The ratio of the nozzle diameter (do) to nozzle height (Ji) for the original JET device and “mini” JET were set equivalent in order to maintain consistent methodology in the test setup while measuring τc and kd between the devices (where the Ji/do ratio was 10.4 and 10.2 for original and “mini” JET devices, respectively). As an example, “mini” JET and original JET scour depth readings for the silty sand soil prepared at a compaction water content of 12% and for the clayey sand soil prepared at compaction water content of 17% are shown in figures 3a and 3b. As expected, the “mini” JET device provided lower scour readings relative to the original JET device due to size differences. Tested samples for both the “mini” and original JET devices were equivalent in terms of packing based on determining the density of each soil sample at the different water contents (figs. 4a and 4b).
Even though the clayey sand soil was more resistant than the silty sand soil for the two higher water contents tested, the kd for the clayey sand soil approached that of the silty sand soil at lower water content (figs. 4c and 4d). Both JET devices provided statistically equivalent values of measured kd for both soils (table 2). The IQR of measured kd from the original JET was greater than the IQR when using the “mini” JET, especially for the clayey sand soil, due to scouring all the soil sample of the standard mold when tests were performed at lower water contents for the original JET (table 2). The relationship between measured
Table 1. Properties of the two soils for testing the two JET devices.
Soil Location
Soil Texture
Plasticity Index (%)
Standard Compaction
USCS SoilClassificati
on Sand (%)
Silt (%)
Clay (%)
Maximum Density (Mg m-3)
Optimum Water
Content (%)
USDA hydraulic laboratory
57 18 25 4 2.00 10.8 SC, clayey sand
Cow Creek streambank
72 13 15 Non-plastic
1.83 12.9 SM, silty sand
906 TRANSACTIONS OF THE ASABE
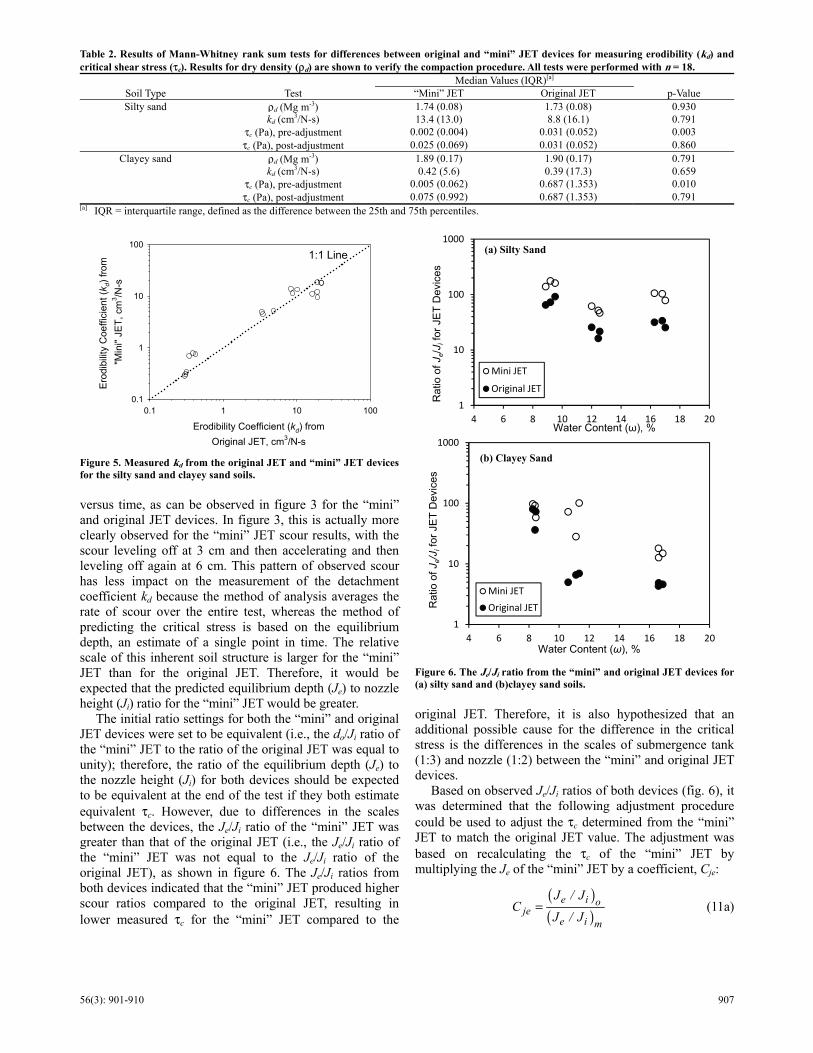
kd from both devices followed the 1:1 trend line, as shown in figure 5, with a slope of 1.12, intercept of -0.18, and R2 of 0.81. The fact that the measured kd was the same
between the original and “mini” jets in this study contradicts the findings of Simon et al. (2010) when using the JET devices in the field. Soil heterogeneity and differences in soil moisture content may have likely led to differences in kd in the Simon et al. (2010) study.
Relationships between critical shear stress (τc) and water contents (ω) for both JET devices are shown in figures 4e and 4f. Mann-Whitney tests indicated significant differences between the devices for τc (table 2). This was hypothesized to be the result of differences in the scale of the jet nozzles (1:2) between the “mini” and original JET devices and the effect of the compaction method on the structure of the soil sample and how it eroded under the impacting jet. The method of compaction involves three layers placed in the compaction mold with 25 blows of the hammer per layer. The compacted sample therefore has a three-layer soil structure with layer interfaces at approximately 3 to 4 cm and 6 to 8 cm. During JET testing, this layering becomes apparent in the measured scour
Silty Sand
Time (minutes)
0 20 40 60
Sco
ur
De
pth
(cm
)
0
2
4
6
8
10
12
Mini-JETOriginal-JET
Clayey Sand
Time (minutes)
0 40 80 120
Sco
ur
De
pth
(cm
)
0
2
4
6
8
10
12
Mini-JETOriginal-JET
(a) (b)
Figure 3. Example of scour depth versus time for original JET versus“mini” JET for (a) silty sand tested at a compaction water content of12% and (b) clayey sand tested at a compaction water content of 17%.
Figure 4. Measured τc and kd from the original JET and “mini” JET devices for the silty sand and clayey sand soils for three repeated tests foreach water content. Note that (a) and (b) compare relationships of dry densities (ρd) and water content (ω) between prepared samples.
(a)
Water Content (ω), %
4 6 8 10 12 14 16 18 20
Dry
Den
sity
(ρ d)
, M
g/m
3
1.50
1.75
2.00
2.25
Mini-JETOriginal-JET
(b)
Water Content (ω), %
4 6 8 10 12 14 16 18 20
Dry
Den
sity
(ρ d)
, M
g/m
3
1.50
1.75
2.00
2.25
Mini-JETOriginal-JET
(c)
4 6 8 10 12 14 16 18 20
Ero
dib
ility
Coe
ffic
ient
(k d
), c
m3/N
-s
0.1
1
10
100
Mini-JETOriginal-JET
Water Content (ω), %
(d)
4 6 8 10 12 14 16 18 20
Ero
dib
ility
Coe
ffic
ient
(k d
), c
m3/N
-s
0.1
1
10
100
Mini-JETOriginal-JET
Water Content (ω), %
(e)
4 6 8 10 12 14 16 18 20
Crit
ical
Sh
ear
Str
ess
(τc)
, P
a
0.0001
0.001
0.01
0.1
1
10Mini-JETOriginal-JET
Water Content (ω), %
(f)
4 6 8 10 12 14 16 18 20
Crit
ical
Sh
ear
Str
ess
(τc)
, P
a
0.0001
0.001
0.01
0.1
1
10
Mini-JETOriginal-JET
Water Content (ω), %
56(3): 901-910 907
versus time, as can be observed in figure 3 for the “mini” and original JET devices. In figure 3, this is actually more clearly observed for the “mini” JET scour results, with the scour leveling off at 3 cm and then accelerating and then leveling off again at 6 cm. This pattern of observed scour has less impact on the measurement of the detachment coefficient kd because the method of analysis averages the rate of scour over the entire test, whereas the method of predicting the critical stress is based on the equilibrium depth, an estimate of a single point in time. The relative scale of this inherent soil structure is larger for the “mini” JET than for the original JET. Therefore, it would be expected that the predicted equilibrium depth (Je) to nozzle height (Ji) ratio for the “mini” JET would be greater.
The initial ratio settings for both the “mini” and original JET devices were set to be equivalent (i.e., the do/Ji ratio of the “mini” JET to the ratio of the original JET was equal to unity); therefore, the ratio of the equilibrium depth (Je) to the nozzle height (Ji) for both devices should be expected to be equivalent at the end of the test if they both estimate equivalent τc. However, due to differences in the scales between the devices, the Je/Ji ratio of the “mini” JET was greater than that of the original JET (i.e., the Je/Ji ratio of the “mini” JET was not equal to the Je/Ji ratio of the original JET), as shown in figure 6. The Je/Ji ratios from both devices indicated that the “mini” JET produced higher scour ratios compared to the original JET, resulting in lower measured τc for the “mini” JET compared to the
original JET. Therefore, it is also hypothesized that an additional possible cause for the difference in the critical stress is the differences in the scales of submergence tank (1:3) and nozzle (1:2) between the “mini” and original JET devices.
Based on observed Je/Ji ratios of both devices (fig. 6), it was determined that the following adjustment procedure could be used to adjust the τc determined from the “mini” JET to match the original JET value. The adjustment was based on recalculating the τc of the “mini” JET by multiplying the Je of the “mini” JET by a coefficient, Cje:
( )( )
e i oje
e i m
J / JC
J / J= (11a)
Figure 6. The Je/Ji ratio from the “mini” and original JET devices for (a) silty sand and (b)clayey sand soils.
Table 2. Results of Mann-Whitney rank sum tests for differences between original and “mini” JET devices for measuring erodibility (kd) and critical shear stress (τc). Results for dry density (ρd) are shown to verify the compaction procedure. All tests were performed with n = 18.
Soil Type Test Median Values (IQR)[a]
p-Value “Mini” JET Original JET Silty sand ρd (Mg m-3) 1.74 (0.08) 1.73 (0.08) 0.930
kd (cm3/N-s) 13.4 (13.0) 8.8 (16.1) 0.791 τc (Pa), pre-adjustment 0.002 (0.004) 0.031 (0.052) 0.003 τc (Pa), post-adjustment 0.025 (0.069) 0.031 (0.052) 0.860
Clayey sand ρd (Mg m-3) 1.89 (0.17) 1.90 (0.17) 0.791 kd (cm3/N-s) 0.42 (5.6) 0.39 (17.3) 0.659 τc (Pa), pre-adjustment 0.005 (0.062) 0.687 (1.353) 0.010 τc (Pa), post-adjustment 0.075 (0.992) 0.687 (1.353) 0.791
[a] IQR = interquartile range, defined as the difference between the 25th and 75th percentiles.
Figure 5. Measured kd from the original JET and “mini” JET devicesfor the silty sand and clayey sand soils.
1
10
100
1000
4 6 8 10 12 14 16 18 20
Rat
io o
f J e
/Jif
or J
ET
Dev
ices
Water Content (ω), %
Mini JET
Original JET
(a) Silty Sand
1
10
100
1000
4 6 8 10 12 14 16 18 20
Rat
io o
f J e
/Jif
or J
ET
Dev
ices
Water Content (ω), %
Mini JETOriginal JET
(b) Clayey Sand
Erodibility Coefficient (kd) from
Original JET, cm3/N-s
0.1 1 10 100
Ero
dibi
lity
Coe
ffic
ient
(k d
) fr
om
"Min
i" J
ET
, cm
3/N
-s
0.1
1
10
1001:1 Line
908 TRANSACTIONS OF THE ASABE
2p
c oje e
J
C J
τ = τ
(11b)
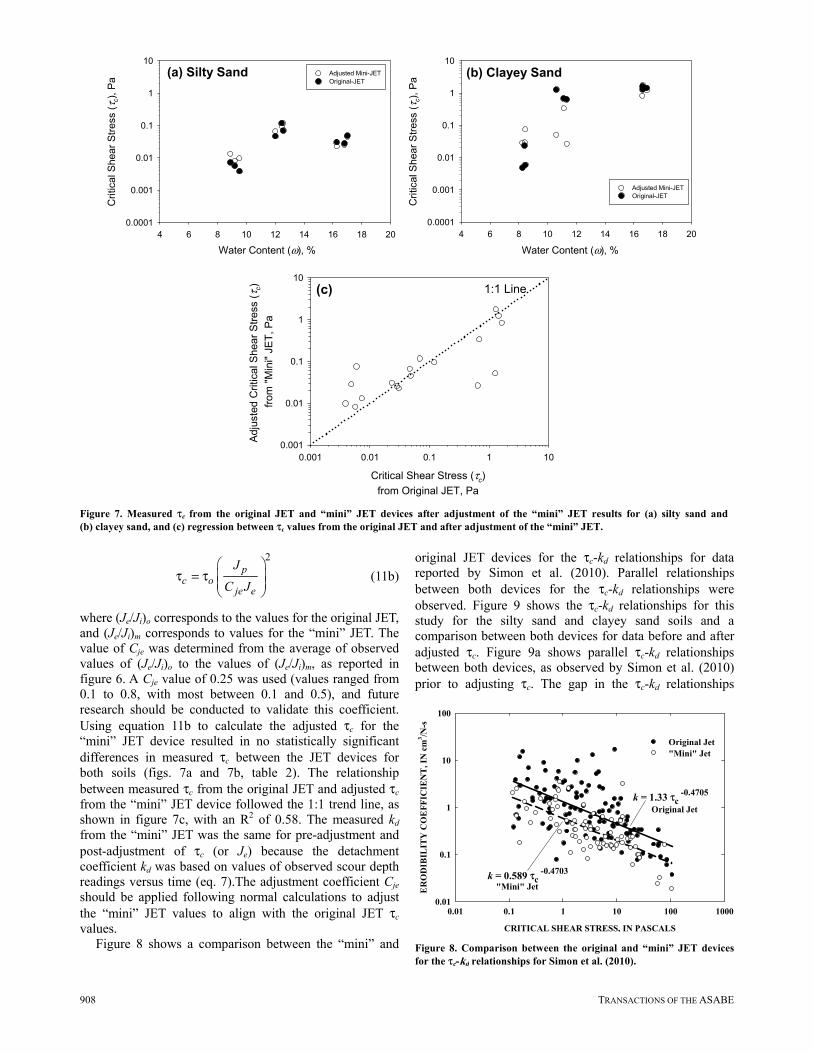
where (Je/Ji)o corresponds to the values for the original JET, and (Je/Ji)m corresponds to values for the “mini” JET. The value of Cje was determined from the average of observed values of (Je/Ji)o to the values of (Je/Ji)m, as reported in figure 6. A Cje value of 0.25 was used (values ranged from 0.1 to 0.8, with most between 0.1 and 0.5), and future research should be conducted to validate this coefficient. Using equation 11b to calculate the adjusted τc for the “mini” JET device resulted in no statistically significant differences in measured τc between the JET devices for both soils (figs. 7a and 7b, table 2). The relationship between measured τc from the original JET and adjusted τc from the “mini” JET device followed the 1:1 trend line, as shown in figure 7c, with an R2 of 0.58. The measured kd from the “mini” JET was the same for pre-adjustment and post-adjustment of τc (or Je) because the detachment coefficient kd was based on values of observed scour depth readings versus time (eq. 7).The adjustment coefficient Cje should be applied following normal calculations to adjust the “mini” JET values to align with the original JET τc values.
Figure 8 shows a comparison between the “mini” and
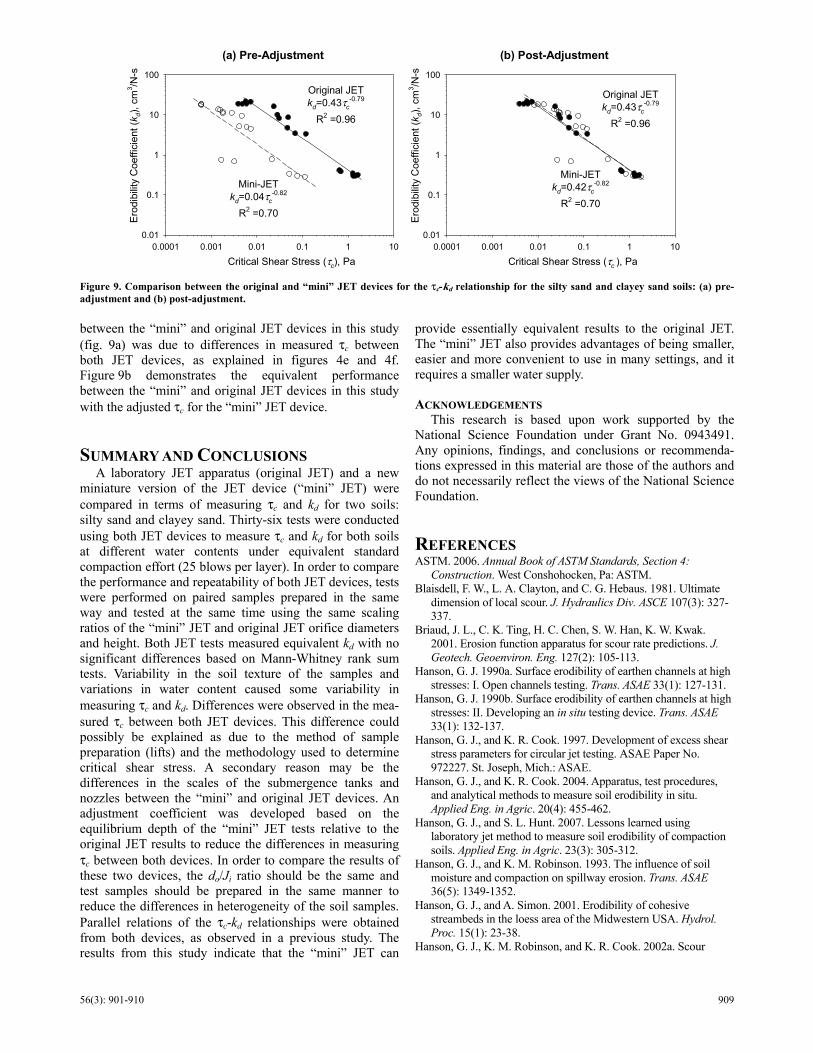
original JET devices for the τc-kd relationships for data reported by Simon et al. (2010). Parallel relationships between both devices for the τc-kd relationships were observed. Figure 9 shows the τc-kd relationships for this study for the silty sand and clayey sand soils and a comparison between both devices for data before and after adjusted τc. Figure 9a shows parallel τc-kd relationships between both devices, as observed by Simon et al. (2010) prior to adjusting τc. The gap in the τc-kd relationships
Figure 7. Measured τc from the original JET and “mini” JET devices after adjustment of the “mini” JET results for (a) silty sand and(b) clayey sand, and (c) regression between τc values from the original JET and after adjustment of the “mini” JET.
Figure 8. Comparison between the original and “mini” JET devices for the τc-kd relationships for Simon et al. (2010).
(a) Silty Sand
4 6 8 10 12 14 16 18 20
Crit
ical
She
ar S
tre
ss (
τ c),
Pa
0.0001
0.001
0.01
0.1
1
10Adjusted Mini-JETOriginal-JET
Water Content (ω), %
(b) Clayey Sand
4 6 8 10 12 14 16 18 20
Crit
ical
She
ar S
tres
s (τ
c),
Pa
0.0001
0.001
0.01
0.1
1
10
Adjusted Mini-JETOriginal-JET
Water Content (ω), %
(c)
Critical Shear Stress (τc)
from Original JET, Pa
0.001 0.01 0.1 1 10
Adj
uste
d C
ritic
al S
hea
r S
tres
s (τ
c)
fro
m "
Min
i" J
ET
, P
a
0.001
0.01
0.1
1
101:1 Line
CRITICAL SHEAR STRESS, IN PASCALS
0.01 0.1 1 10 100 1000
ER
OD
IBIL
ITY
CO
EF
FIC
IEN
T, I
N c
m3 /N
-s
0.01
0.1
1
10
100
Original Jet"Mini" Jet
k = 0.589 τc -0.4703
"Mini" Jet
k = 1.33 τc -0.4705
Original Jet
56(3): 901-910 909
between the “mini” and original JET devices in this study (fig. 9a) was due to differences in measured τc between both JET devices, as explained in figures 4e and 4f. Figure 9b demonstrates the equivalent performance between the “mini” and original JET devices in this study with the adjusted τc for the “mini” JET device.
SUMMARY AND CONCLUSIONS A laboratory JET apparatus (original JET) and a new
miniature version of the JET device (“mini” JET) were compared in terms of measuring τc and kd for two soils: silty sand and clayey sand. Thirty-six tests were conducted using both JET devices to measure τc and kd for both soils at different water contents under equivalent standard compaction effort (25 blows per layer). In order to compare the performance and repeatability of both JET devices, tests were performed on paired samples prepared in the same way and tested at the same time using the same scaling ratios of the “mini” JET and original JET orifice diameters and height. Both JET tests measured equivalent kd with no significant differences based on Mann-Whitney rank sum tests. Variability in the soil texture of the samples and variations in water content caused some variability in measuring τc and kd. Differences were observed in the mea-sured τc between both JET devices. This difference could possibly be explained as due to the method of sample preparation (lifts) and the methodology used to determine critical shear stress. A secondary reason may be the differences in the scales of the submergence tanks and nozzles between the “mini” and original JET devices. An adjustment coefficient was developed based on the equilibrium depth of the “mini” JET tests relative to the original JET results to reduce the differences in measuring τc between both devices. In order to compare the results of these two devices, the do/Ji ratio should be the same and test samples should be prepared in the same manner to reduce the differences in heterogeneity of the soil samples. Parallel relations of the τc-kd relationships were obtained from both devices, as observed in a previous study. The results from this study indicate that the “mini” JET can
provide essentially equivalent results to the original JET. The “mini” JET also provides advantages of being smaller, easier and more convenient to use in many settings, and it requires a smaller water supply.
ACKNOWLEDGEMENTS This research is based upon work supported by the
National Science Foundation under Grant No. 0943491. Any opinions, findings, and conclusions or recommenda-tions expressed in this material are those of the authors and do not necessarily reflect the views of the National Science Foundation.
REFERENCES ASTM. 2006. Annual Book of ASTM Standards, Section 4:
Construction. West Conshohocken, Pa: ASTM. Blaisdell, F. W., L. A. Clayton, and C. G. Hebaus. 1981. Ultimate
dimension of local scour. J. Hydraulics Div. ASCE 107(3): 327-337.
Briaud, J. L., C. K. Ting, H. C. Chen, S. W. Han, K. W. Kwak. 2001. Erosion function apparatus for scour rate predictions. J. Geotech. Geoenviron. Eng. 127(2): 105-113.
Hanson, G. J. 1990a. Surface erodibility of earthen channels at high stresses: I. Open channels testing. Trans. ASAE 33(1): 127-131.
Hanson, G. J. 1990b. Surface erodibility of earthen channels at high stresses: II. Developing an in situ testing device. Trans. ASAE 33(1): 132-137.
Hanson, G. J., and K. R. Cook. 1997. Development of excess shear stress parameters for circular jet testing. ASAE Paper No. 972227. St. Joseph, Mich.: ASAE.
Hanson, G. J., and K. R. Cook. 2004. Apparatus, test procedures, and analytical methods to measure soil erodibility in situ. Applied Eng. in Agric. 20(4): 455-462.
Hanson, G. J., and S. L. Hunt. 2007. Lessons learned using laboratory jet method to measure soil erodibility of compaction soils. Applied Eng. in Agric. 23(3): 305-312.
Hanson, G. J., and K. M. Robinson. 1993. The influence of soil moisture and compaction on spillway erosion. Trans. ASAE 36(5): 1349-1352.
Hanson, G. J., and A. Simon. 2001. Erodibility of cohesive streambeds in the loess area of the Midwestern USA. Hydrol. Proc. 15(1): 23-38.
Hanson, G. J., K. M. Robinson, and K. R. Cook. 2002a. Scour
Figure 9. Comparison between the original and “mini” JET devices for the τc-kd relationship for the silty sand and clayey sand soils: (a) pre-adjustment and (b) post-adjustment.
(a) Pre-Adjustment
0.0001 0.001 0.01 0.1 1 100.01
0.1
1
10
100
Critical Shear Stress (τc), Pa
Ero
dibi
lity
Coe
ffici
ent
(k d
), c
m3/N
-s
Original JETkd=0.43τc
-0.79
R2 =0.96
Mini-JETkd=0.04τc
-0.82
R2 =0.70
(b) Post-Adjustment
0.0001 0.001 0.01 0.1 1 100.01
0.1
1
10
100
Critical Shear Stress (τc ), Pa
Ero
dibi
lity
Coe
ffici
ent
(k d
), c
m3/N
-s
Original JETkd=0.43τc
-0.79
R2 =0.96
Mini-JETkd=0.42τc
-0.82
R2 =0.70
910 TRANSACTIONS OF THE ASABE
below an overfall: Part II. Prediction. Trans. ASAE 45(4): 957-964.
Hanson, G. J., K. R. Cook, and A. Simon. 2002b. Non-vertical jet testing of cohesive streambank materials. ASAE Paper No. 022119. St. Joseph, Mich.: ASAE.
Mann, H. B., and D. R. Whitney. 1947. On a test of whether one of two random variables is stochastically larger than the other. Annals Math. Stat. 18(1): 50-60.
Marot, D., P. L. Regazzoni, and T. Wahl. 2011. An energy-based method for providing soil surface erodibility rankings. J. Geotech. Geoenviron. Eng. 137(12): 1290-1293.
Mazurek, K. A. 2010. Erodibility of a cohesive soil using a submerged circular turbulent impinging jet test. In Proc. 2nd Joint Federal Interagency Conference. Reston, Va.: ASCE.
Partheniades, E. 1965. Erosion and deposition of cohesive soils. J. Hydraulics Div. ASCE 91(1): 105-139.
Poreh, M., Y. G. Tsuel, and J. E. Cermak. 1967. Investigation of a
turbulent radial wall jet. J. Appl. Mech. 34(2): 457-463. Rajaratnam, N., and L. Flint-Petersen. 1989. Low Reynolds number
circular turbulent jets. Proc. Inst. Civil Eng. 87(2): 299-305. Regazzoni, P. L., G. J. Hanson, T. Wahl, D. Marot, and J. R.
Courivaud. 2008. The influence of some engineering parameters on the erosion of soils. In Proc. 4th Intl. Conf. on Scour and Erosion (ICSE-4). Tokyo, Japan: Japanese Geotechnical Society.
Simon, A., R. E. Thomas, and L. Klimetz. 2010. Comparison and experiences with field techniques to measure critical shear stress and erodibility of cohesive deposits. In Proc. 2nd Joint Federal Interagency Conference. Reston, Va.: ASCE.
Stein, O. R., and D. D. Nett. 1997. Impinging jet calibration of excess shear sediment detachment parameters. Trans. ASAE 40(6): 1573-1580.
Wan, C. F., and R. Fell. 2004. Investigation of rate of erosion of soils in embankment dams. J. Geotech. Geoenviron. Eng. 130(4): 373-380.