Embed Size (px)
Citation preview
,.......,
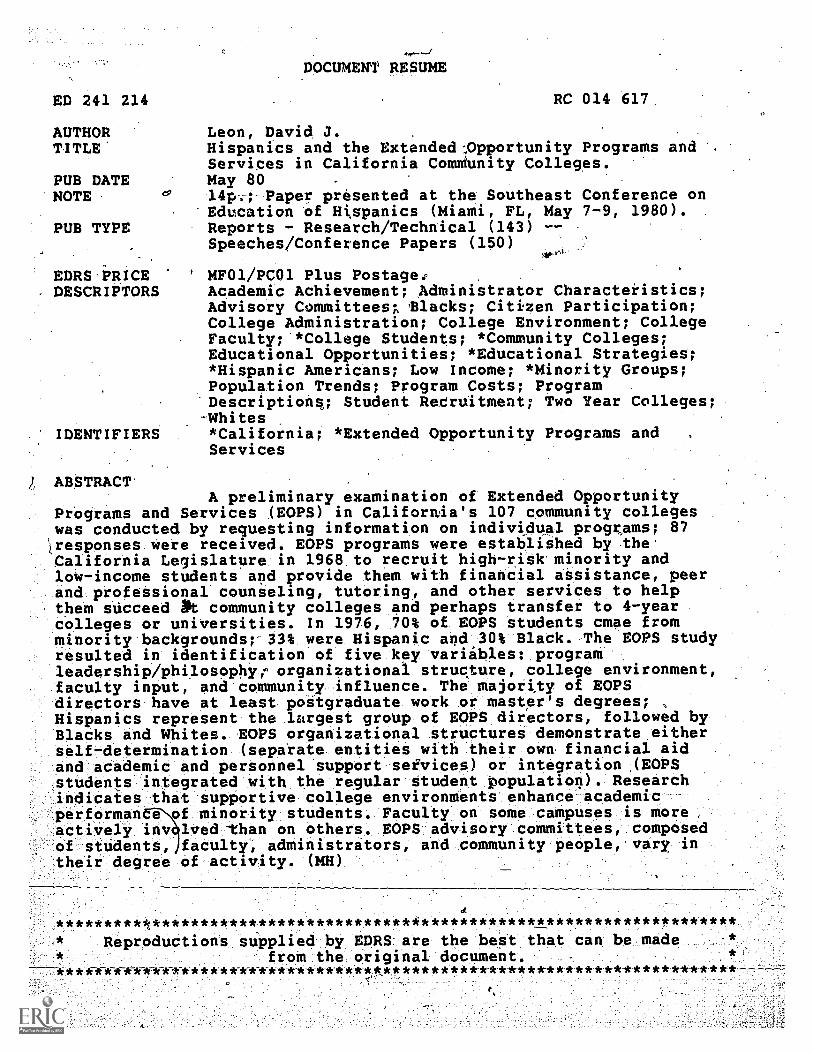
DOCUMENT RESUME
ED 241 214 RC 014 617
AUTHOR Leon, David J. ,
TITLE Hispanics and the Extended-,Opportunity Programs andServices in California ComMunity Colleges.
PUB DATE May 80 -
NOTE e 14p,-; Paper presented at the Southeast Conference onEducation of Hispanics (Miami, FL, May 7-9, 1980).
PUB TYPE Reports - Research/Technical (143) --Speeches/Conference Papers (150)
EDRS PRICE MF01/PC01 Plus PostageDESCRIPTORS Academic Achievement; Administrator Characteristics;
Advisory Committees;, Slacks; Citizen Participation;College Administration; College Environment; CollegeFaculty; *College Students; *Community Colleges;Educational Opportunities; *Educational Strategies;*Hispanic Americans; Low Income; *Minority Groups;Population Trends; Program Costs; Program'Descriptions; Student Recruitment; Two Year Colleges;Whites
IDENTIFIERS *California; *Extended Opportunity Programs andServices
) ABSTRACT'A preliminary examination of Extended Opportunity
Programs and Services (EOPS) in California's 107 community collegeswas conducted by requesting information on individual programs; 87responses were received. EOPS programs were esta6lished by theCalifornia Legislature in 1968 to recruit high-risk minority andlow-income students and provide them with financial assistance, peerand professional counseling, tutoring, and other services to helpthem succeed Mt community colleges and perhaps transfer to 4-yearcolleges or universities. In 1976, 70% of EOPS students cmae fromminority backgrounds;- 33% were Hispanic and 30% Black. The EOPS studyresulted in identification of five key variables: programleadership/philosophy; organizational structure, college environment,faculty input, and community influence. The majority of EOPSdirectors have at least postgraduate work or master's degrees;Hispanics represent the largest group of EOPS directors, followed byBlacks and Whites. EOPS organizational structures demonstrate eitherself-determination (separate entities with their own financial aidand academic and personnel support sefvices) or integration (EOPSstudents integrated with the regular student population). Researchindicates that supportive college environments enhance -academicperforman e of minority students. Faculty on some campuses is more ,actively inv lved than on others. EOPS advisory committees, composedof students, faculty, administrators, and community people, vary intheir degree of activity. (MR)
4*********ft************************************************************** Reproductions supplied by EDRS are the best that can be made ** from the original document. *
***********-*-*******-**-*************,*************************************
0
HISPANICS AND THE EXTENDED OPPORTUNITY PROGRAMS
AND'SERVICES IN CALIFORNIA COMMUNITY COLLEGES
"PERMISSION TO TO REPRODUCE THISMATERIAL HAS BEE GRANTED BY
IR: IRO,
TO THE EDUCATIONAL RESOURCESINFORMATION CENTER (ERIC)."
U.S. DEPARTMENT OF EDUCATIONNATIONAL INSTITUTE OF EDUCATION
EDUCATIONAL RESOURCES INFORMATION. CENTER IERICI
This document has been reproduced asreceived from the person or organizationoriginating it.
C./ Minor changes havebeen made to improve
reproduction quality,
Points of view or opinions stated in this docu-ment do not necessarily represent
official NIEposition or policy,
David J. Leon
Prbgram Coordinator/Scholar-in-ResidenceMinOrities and Women Project
Mexicar.: American Legal Defense & EdUCationa1-FundSan Francisco
Assistant ProfessorSchool of Education
UC Berkeley
C3
Paper presented at the Southeast Conference'On Education of Hispanics, Miami,
Florida, May 7-9, 1980. I gratefully.acknowledge aid from the National
.Institute of Education's Minority and Women Project,
Introduction
hispanics and the Extended OpportunityProyransand Services in California Community Colleges
Public institutions of higher education in Californi.a currently face
two serious and pressing problems, namely, fiscal cutbacks coupled with a
drop in student enrollments. Patrick Callan, director of California's Post-
secondary Education Commission (CPEE), offers a solution which will effect
both problems. He urges collegeS and universities to actively seek the re-
cruitment and enhance the retention of minority students or they willsuffer.
a drastic decline in their enrolments by a third or More in the next decade.'
This stiategy is consistent with both the changing racial' coMpositionof-the
public school population and the dramatic growth of minorities in the state.
Public officials are thus faced with imoortant social policy issues. Is
it possible for public institutions of higher education to increase their re-
presentation of minorities on their Cauyuees? Haw can it be done given their
'1' . ,
fiscal problems? What models exist for the recruitment and retention of min-
ority students? 2\n examination of Extended Opportunity Programs and Services
(EOPS) in California's community college system may shed,some light on the
problems and prospects of minorities in higher education, and on the future
of public higher education in general.
California's Changing Population
A recent report indicates that the minority population will douLle by the
year 2000. This dramatic increase of minorities in,the coming years necessi-:
tates public officials to closely examine how institutions can best meet their
educational needs.
-2--
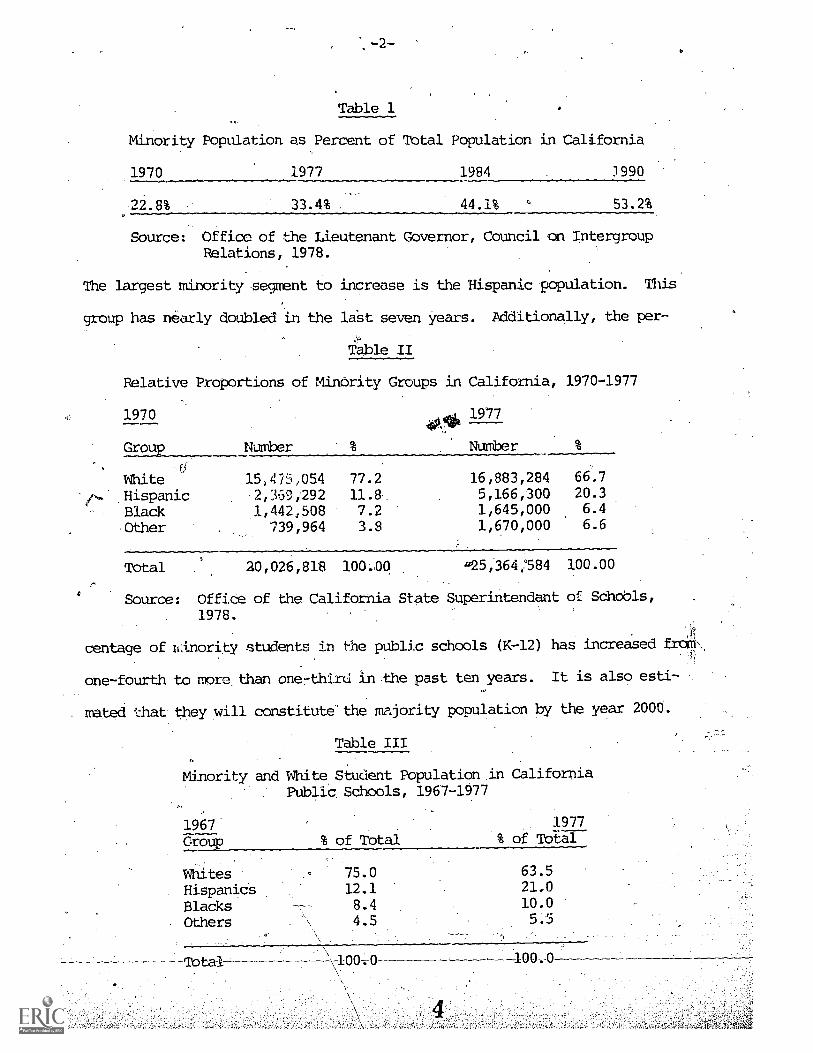
Table 1
Minority Population as Percent of Total Population in California
1970 1977 1984 3990
22.8% 33.4% 44.1% ' 53.2%
Source: Office of the Lieutenant Governor, Council 'on IntergroupRelations, 1978.
The largest minority segment to increase is the Hispanic population. This
group has nearly doubled in the list seven years. Additionally, the per-
Table II
Relative Proportions of Minority Groups in California, 1970-1977
1970
Number %
i 1977
%Group
40.,..717
Number
Ci
White 15,475,054 77.2 16,883,284 66.7
Hispanic -2,369,292 11.8.. 5,166,300 20.3
Black 1,442,508 7.2 1,645,000 6.4
Other 739,964 3.8 1,670,000 6.6
Total 20,026,818 100.00 925,364:584 100.00
Source: Office of the California State Superintendent of Schobls,1978.
centage of ItAnority students in the public schools (K-12) has increased froiri\
one-fourth to more than onethird in.the past ten years. It is also esti-
mated that they will constitute"the majority population by the year 2000.
Table III
Minority and White Student Population.in CaliforniaPublic. Schools, 1967-1977
1967Group % of Total
1977% of Total
Whites - 75.0 63.5
Hispanics 12.1 21.0
Blacks 8.4 10.0
Others 4.5 5.5
Total \100.0 100.0
-3-
Ps the President of the State Board of Education, Professor Michael
Kirst of Stanford University remarked: "The high leap in the Hispanic
student population is the thing that stands out." In the pest ten years,
Hispanics have increased from 616,226 to 892,113, making them the largest
minority group,in the state's public school system. Further, while the me-
dian age of whites is growing older, that of Hispanics -- currently 0 years
old -- is expected to remain quite young for the next 25 years. Thus, Hispanics
could potentially occupy a greater and greater proportion of our university
classrooms in the'future.
Public Higher Education
`Public higher education in California is characterized by a three-tier
system of community colleges, state colleges and universities (CSUC), and the
University of California (UC) . Approximately 1,400,000 students are enrolled
in these postsecondary7institutions: 70% are enrolled in community colleges,
.20% .in the state colleges an3 universities, and 8% in the University of
California (cf. CPEC, 1970). These percentages reflect the different admissions'
requirements of each system: community colleges operate with an open door phil-
osophy; state colleges and universities enroll the top 25% of high schoograd-
uates; and the University of California selectively accepts the top 12-1/2 %
of high school gradUates. This publicly supported system ofhigher education
enables residents the opportunity for, postsecOnclary training regardless of
previous academic background.
Since the 107 community colleges have liberal admission§ requirements
minimal fees, and are easily accessible in virtually all regions of the state,
they attract a substantial number of minority stUdents. Of the total number
of black and Hispanic students enrolled in public postsecondary education,
-4-
89.5% were in the community colleges, 6.7% in the CSUC, and 3.8% in 'the UC
system (cf. California Legislature, 1979). These figures indicate that there
is a greater 9roportional representation of Hispanics and other minorities in
the two-year colleges than in the tworemainingfour-yearssystems. The data
is consistent with minority representation in higher education across the na-
tion (cf. Olivas, 1979; Karabel 1972).
The most obvious disparity between institutional and comparison' group
figures among ethnic groups is with Hispanics. They represent of the
K-12 student population, yet only constitute 9% of the community college students,
6% of the state college and university population, and 5.6% of the University
of California undergraduates, Thus, all three systems exhibit a significant
P
underrepresentation of Hispanics.
44,
Statement of the Problem
Since Hispanics are largely represented in two-year colleges, this re-,
search focuses do the following questions:' what kinds of programs in commun-
ity colleges best serve the_ educational needs of Hispanics and other minorities?
Are there:models that can be followed? If so, what theories provide workable
suggestions to meet the needs of minorities? Examination of EOPS programs
may provide insights into the future'of minorities in'higher education.
BOPS in California Community Colleges
EOPS programs in California community colleges were established by Senate
Bill 164, passed in 1968 which mandated four major educational objectives:*
1. "Community colleges should recognize the need an91accept the responsibility for extending the opportunities for community college education to
all who maylprofit therefrom regardless of economic, social and educational
status."
-5-
2. "Community colleges should establish and develop services directedto the identification of potential students affected by language, socialand economic disadvantages;."
3. "Ccmmunity colleges should establish and develop services, techniquesand activities directed to the recruitmmtand retention of such students(to the completion of their educational goals)."
4. "Community c011eges should establish services, techniques and activ-ities directed to stimulating-such students' interest in rhtellectual,educational and vocational attainment." ABridgetheGap, 1976)
EOPS programs were thus established to recruit high risk minority and low inL
come students and provide them with financial assistance, peer and profession-'
al counseling, tutoring and other services in an effort to help them succeed
at the community college, and hopefully, transfer to a four-year college or
university.
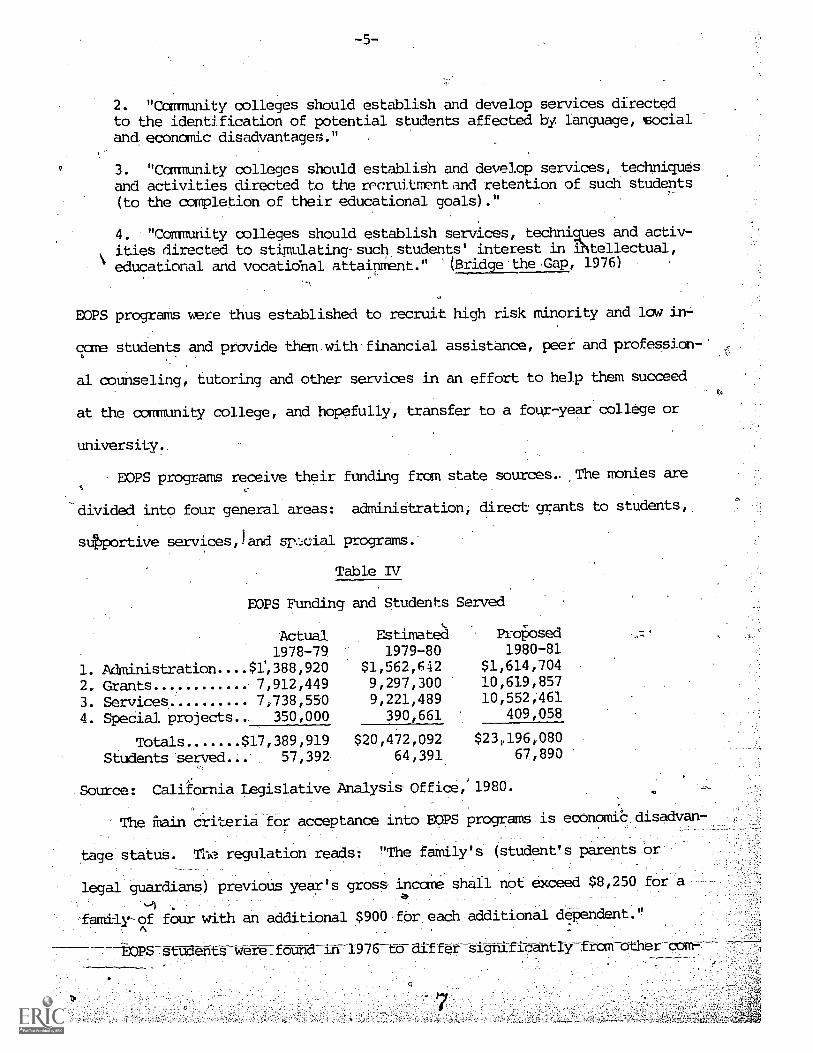
EOPS programs receive their funding from state sources.. ,The monies are
divided into four general areas: administration, direct grants to students,
supportive services,Jand ur.11cial programs.
EOPS Funding
Actual
Table TV
Proposed
and Students Served
Estimates1978-79 1979-80 1980-81
1. Administration....$1',388,920 $1,562,642 $1,614,704
2. Grants 7,912,449 9,297,300 10,619,857
3. Services 7,738,550 9,221,489 10,552;461
4. Special projects 350,000 390,661 409,058
Totals $17,389,919Students served... 57,392
$20,472,09264,391
$23,196,08067,890
Source: California Legislative Analysis Office,'1980.
The Main criteria for acceptance into EOPS programs is economic disadvan-
tage status. The regulation reads: "The family's (student's parents or
legal guardians) previous year's gross. income shall not exceed $8,250 for a
:
-family-of four with an additional $900 fOr each:.additiOnal dependent.", A
EOPS students were found in 1976-to dif fer si-grilfi-eantly-from-other com
munity college students on one important variable - ethnic identification.
70% of EOP students came from minority backgrounds, and 28% were whites.
This compares to 35%\Minority/61% white among regular community college stu-
dents. The largest proportions of EOPS students are Hispanic (33%) followed
by blacks (30%), whites (2M) and others (9%).
Bata Collection\
This explbratory study is divided into three stages: initial contact
and feedback: questionnaire construction and administration; and analysis
of findings. At this point, the firsL stage has been completed.
Contact has been made with EOPS directors at all comunity 'college cam-
puses. Letters requesting descriptive information on the individual programs
were sent. Eighty-seven responses were received - a 63%<tate of return. As
can be noted in Figure 1, a diverse cross section of community colleges from
urban/rural areas have responded.
'Preliminary Data Analysis
An'analysis of information.`0
received' through the mail and via phone conver-
sations with EOPS directors resulted in the identification of five key var-
iables:
1.. Program leadership and philosophy, 2. Organizational structure of the program
3. College envirbliment4. Faculty inpUt5 Community influence
These variables will form the basis of a questionnaire to be sent to EOPS'
directors at a later date.
Program Leadership and Philosophy
___This_variable_will_descrihe and analyze the_different_management_styles
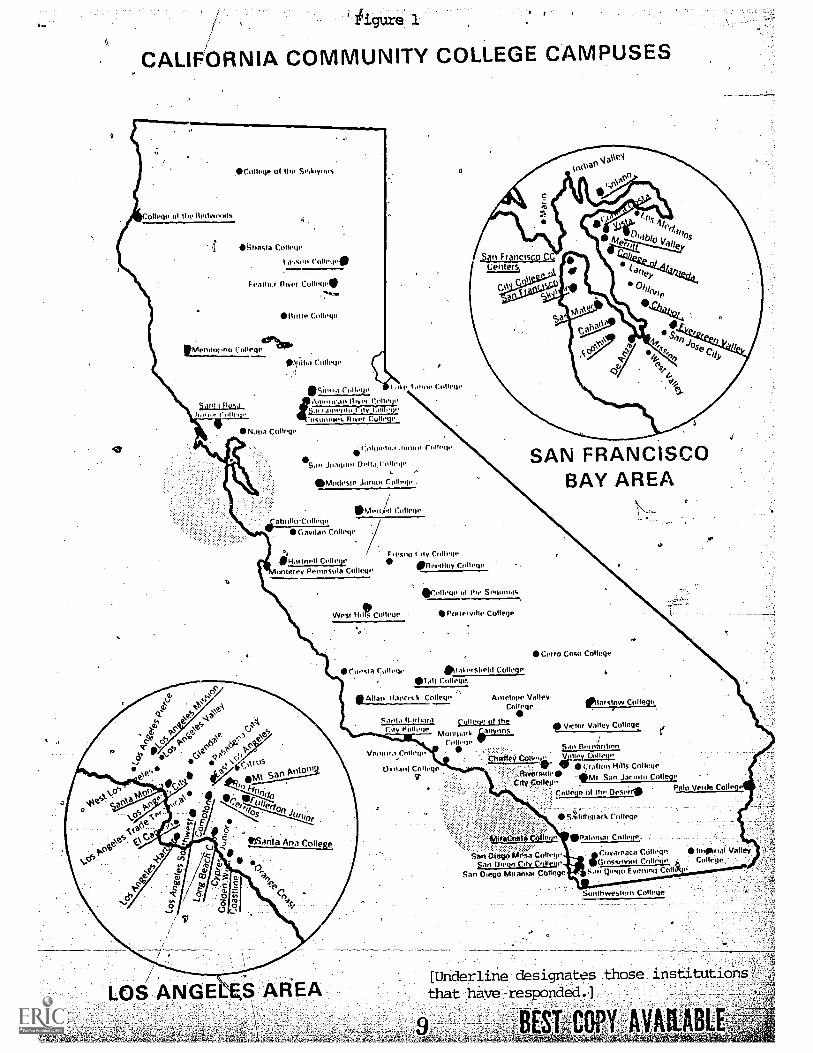
figure 1
CALIFORNIA COMMUNITY COLLEGE CAMPUSES
°liege el the lielloccoHls
C.ollege 01 go. S.lyoos
tillasla Collegeasset. Colley,.
Featly.1 Rive! College"
11010 College
Mendocino
NiIlm College
Some Collet
botoo Coeur. 4111.o ..... rty CoilogeSoli Amel.r.111 Collage
Ake 1,loo. College
'OSMIUM'S Role, Collage
N.I113 C011.1,`
0,J1131111iil
oCol000loo college
abollo-CollegeMertfrcl College
SAN FRANCISCOBAY AREA
Gavilao Collevle
or
Hamlet! Collcienteley Peronsola College
6.estec I'lmy College
"lieetlley College
VVesr 1-1,1,1; cuilue
"College of (he Segicolos
Pet ter wile College
Ctisla college "0.1lecslield College1'.111 College.
Allan llanroc.h College Aotelope ValleyCollege
Obit slow CollegerSalo,' 11.0100a rollecrul theCoy 0.ollege Vireo Valley College
leMoghtll. iii1,a2;l5College
Cerro Coso College
Chola Id College
San lielfrallliOn
C7:i..cCri.:1:04","OMI San Jarocto College(.1%;iggife, eV Ha's C011000
Colin e. 01 thePale Vesde College
SaittlIeltarlt College
Atitenteto 0110.9.
Stot Mirk; MOs., Collew.San Diego City College
Sari Diego Miramar College
Palonlat Coliec e..
e Cqyaleaca College,osstontit College
Sao tlogo Evening Calk
Sooll,westecn College
Ingliklial Valley
IctColl. go
-q
[Underline designates those institutions
that,
bayerespOnded.1-
.144,
-7-
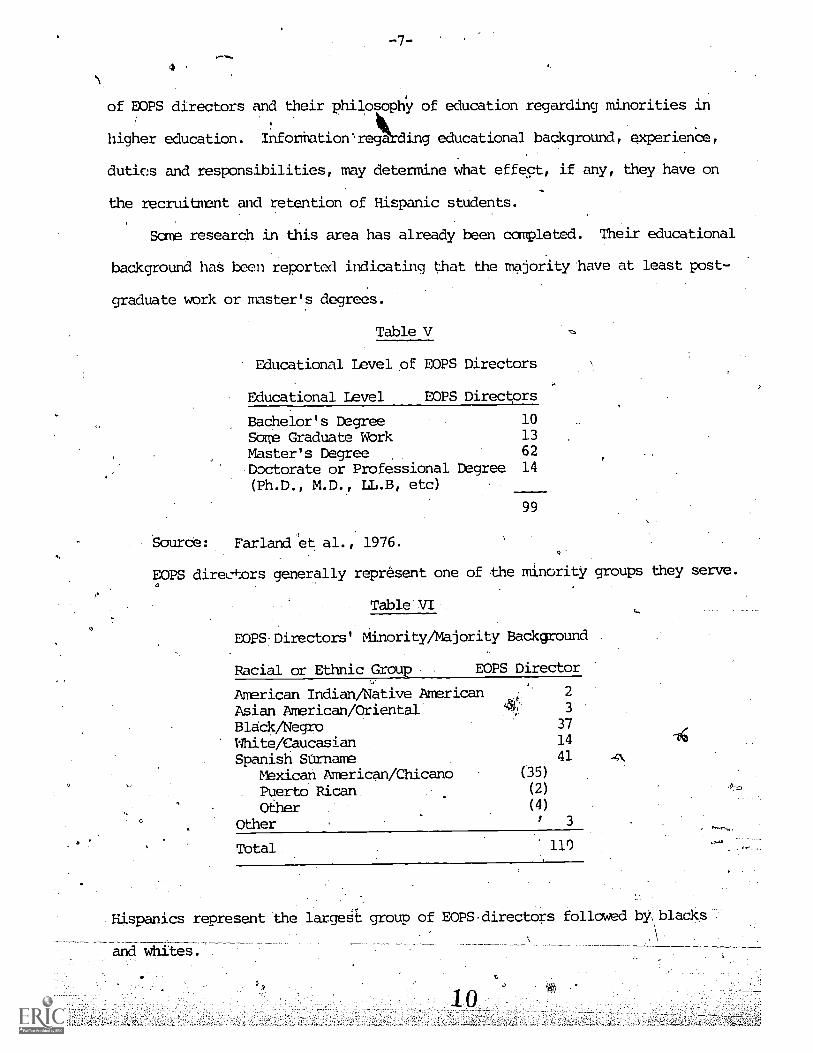
of BOPS directors and their philosophy of education regarding minorities in
higher education. InforMation'.reg ing educational background, experience,
duties and responsibilities, may determine what effect, if any, they have on
the recruitment and retention of Hispanic students.
Some research in this area has already been completed. Their educational
background has been reported indicating that the majority have at least post-
graduate work or master's degrees.
Table V
Educational Level of EOPS Directors
Educational Level EOPS Directors
Bachelor's Degree 10
Some Graduate Work 13
Master's Degree 62
Doctorate or Professional Degree 14
(Ph.D., M.D. LL.B, etc)
99
Source: Farland'et al., 1976.
EOPS directors generally represent one of the minority groups they serve.
Table VI
Background
Director
EOPS Directors' Minority/Majority
Racial or Ethnic Group . EOPSCr'
American Indian/Native AmericanAsian American/OrientalBlack/NegroWhite/CaucasianSpanish Stirname
2
3
37
14 1G
41 a;\Mexican American/Chicano (35)
Puerto Rican (2)
Other (4)
Other3
Total '110
Hispanics represent the largest group of EOPS.directors followed by, blacks
and whites.
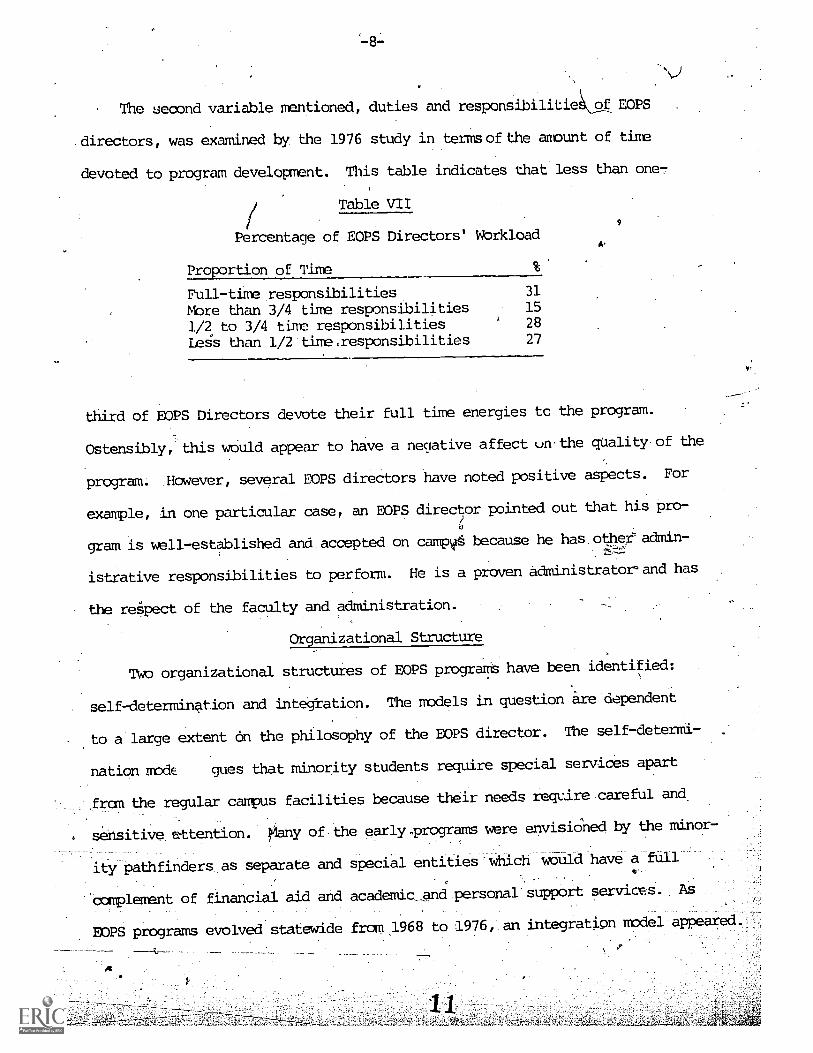
The second variable mentioned, duties and responsibilitie& of EOPS
directors, was examined by the 1976 study in terms of the amount of time
devoted to program development. This table indicates that less than one7
Table VII
Percentage of EOPS Directors' Workload
Proportion of Time %
Full-time responsibilities 31
More than 3/4 time responsibilities 15
1/2 to 3/4 time responsibilities 28
Le4s than 1/2 time responsibilities 27
third of EOPS Directors devote their full time energies to the program.
Ostensibly, this would appear to have a negative affect un.the quality of the
program. However, several BOPS directors have noted positive aspects. For
example, in one particular case, an EOPS director pointed out that his pro-
gram is well-established and accepted on camps because he has.othefadmin-
istrative responsibilities to perform. He is a proven administrator and has
the respect of the faculty and administration.
Organizational Structure
Two organizational structures of EOPS programS have been identified:
self-determination and integration. The models in question are dependent
to a large extent on the philosophy of the EOPS director. The self-determi-
nation nrxk gues that minority students require special services apart
from the regular campus facilities because their needs require careful and
sensitive attention. .y of the early .programs were envisioned by the minor-
ity pathfinders as separate and special entities which would have a full
complement of financial aid and academic_and personal support services. As
EOPS programs evolved statewide from 1968 to 1976, an integration model appeared.
4.
Supporters of this model argued that EOPS students should be integrated with
the regular student population so that they do not feel 'different" or "spe-,
cial."
College Environment
Although EOPS programs. were established on most comliNnit5, college cam-
puses between 1969 to 1976, some institutions had supportive services for
minority students'kiorto that time. Interviews with FOPS dire4ors in-.
dicate that in scare cases their. programs have gained acceptance and recogni-
tion, whereas others are still struggling for legitimacy. How do these two
types of environnents affect the performance of BOPS students on the various
campvses? ReCent research on college environments indicates that a puppoA.-
ive one helps to enhance academic performance Of minority students (cf.
Gurin, 1966 Klingelhofer & Hbllander, 1973; Leon, 1979; Sedlacek & Brooks,
41976).
Faculty Input
To what extent is the faculty involved in'EOPS programs? Since th'
faculty and administration govern the campus, it i8 therefore imperative to
measure their contributi n. On some campuses, the faculty is'actively in-
voilved, whereas on others the Level of participation is not quite as high.
How does this activity,affect the growth and development of EOPS programs?
Comiriunity-Inflt;ence,
BOPS programs are mandated by law to establish and maintain an advisory
24
committee composed.of students, faculty, administrators and community
people. These committees can be an important voice in the determination of
V
the "prograFs goals as well as providd important, political pressure when ilec7
essary.t However, some advisory committees are much more active than others.
To what-extent ddes this_cdmmitteebelp to build and -maintaiiiprogrOnstrength?

0
Conclusion ,
Examination of these variables will hopefully lead to the development of
model programs for Hispanics and other minorities in'California's community
colleges. This is an important effort since the future of minorities depends
to a large extent on their access to and success in'our educational institur-
tions.
D
.0
'21 21 01
Bridge the GET1976, "Summary of report on:EOPS in California community colleges.",
Special edition, August.
California Legislature1979 Increasing the }`rate and retention of community college transfers
tram underrepresened groups. Sacramento, CA: Staff Report.
'California Postsecondary Education Commission1979 Information digest 1979. Sacramento, CA: California Postsecond-
ary Education CommisSion.,
Farland, Ronald;.Clare Rose; Glenn Nyre; James Trent 7 0..e
1976.-' -The-study-of extended opportunity programs andserviceS in'California community colleges. Sacramento, CA: The Board of.
,Governors, California community Colleges.3
Gurin, Patricia1966 Motivation and aspiration in the N-ro college. Ann Arbor:
Survey Research Center, University of Michigan.
IKarabels, Jerana_1972 "Community colleges and social stratification." Harvard
Educational Review. 42 (November): 521-562.
Klingelhofer, E. and L. Hollander1973 Educational characteristics and needs of new students. University
.of California, Berkeley: Center for Research and Developmentin Higher. Education.
Leon, David1979 "Institutional racism and the_ educational opportunity program:-
a study of organizational change and strategies for reform."
Paper presented at the annual meeting of the-Awerican Socio
logical Association, BostonSeptember. _
Olivas, Michael1979 The dilemma of access. Washington 'D.C.: Howard University Press4
Sedlacek, William and G. Brooks1976 Racism in American education: a model for change. Chicago,
Nelson-Hall.