Embed Size (px)
Citation preview
ABSTRACT
LLOYD, MICHELLE ANN. Flavor and Stability of Whole Milk Powder. (Under the direction of Dr. MaryAnne Drake.)
Flavor variability and stability of US-produced whole milk powder (WMP) are
important parameters for maximizing quality and global competitiveness of this commodity.
The US industry standard for shelf-life of whole milk powder (WMP) is 6-9 mo, although
previous research has demonstrated flavor changes by 3 mo at ambient storage. Two studies
were conducted using sensory and instrumental techniques to (1) characterize flavor and
flavor stability of domestic WMP and (2) evaluate the influence of packaging atmosphere,
storage temperature, and storage time on WMP shelf-life. Descriptive analysis was
conducted using a 10-member trained panel. Selected volatiles were quantified using solid
phase microextraction (SPME) with gas chromatography/mass-spectrometry: dimethyl
sulfide, 2-methylbutanal, 3-methylbutanal, hexanal, 2-heptanone, heptanal, 1-octen-3-ol,
octanal, 3-octen-2-one, and nonanal. For the first study, freshly produced (<1 mo) WMP was
collected from 4 US production facilities 5 times over a 1 y period. Each sample was
analyzed initially and every 2 mo for sensory profile, volatiles, color, water activity, and
moisture through 12 mo storage. Multiple linear regression with backwards elimination was
applied to generate equations to predict grassy and painty flavors based on selected volatiles.
All WMP were between 2-3% moisture and 0.11-0.25 water activity initially. WMP varied
in initial flavor profiles with varying levels of cooked, milkfat, and sweet aromatic flavors.
During storage, grassy and painty flavors developed, while sweet aromatic flavor intensities
decreased. WMP developed painty flavor between 4 and 6 mo. Painty and grassy flavors

were confirmed by increased levels (p<0.05) of lipid oxidation products such as hexanal,
heptanal, and octanal. Hexanal, 2-heptanone, 1-octen-3-ol and nonanal concentrations were
the best predictors of grassy flavor (r=0.62, R2=0.38, p<0.0001) while hexanal, 2-
methylbutanal, 3-methylbutanal, octanal, and 3-octen-2-one concentrations were the best
predictors of painty flavor (r=0.78, R2=0.61, p<0.0001). For the second study, two batches
of WMP were repackaged in plastic laminate pouches with air or nitrogen and stored at 2 ˚C
or 23 ˚C for one y. In addition to sensory and volatile compound analyses, consumer
acceptance testing (n=75) was conducted every 3 mo with reconstituted WMP and white and
milk chocolate made from each treatment. Data were analyzed using analysis of variance
with Fisher’s LSD, Pearson’s correlation analysis, and principal component analysis, with
significance at p<0.05. Air stored WMP had higher peroxide values, lipid oxidation volatiles
and grassy and painty flavors than nitrogen flushed WMP. Storage temperature did not
impact levels of straight chain lipid oxidation volatiles; 23 ˚C storage resulted in higher
cooked and milkfat flavors and lower levels of grassy flavor compared with 2 ˚C storage.
Consumer acceptance was negatively correlated with lipid oxidation volatiles and painty
flavor. Nitrogen flushing prevented the development of painty flavor in WMP stored up to 1
y at either temperature, resulting in chocolate with high consumer acceptance. Nitrogen
flushing can be applied to extend the shelf life of WMP; refrigerated storage also plays a
role, but to a lesser extent. These results provide baseline information to determine specific
factors that can be controlled to optimize US WMP flavor and flavor stability.
Flavor and Stability of Whole Milk Powder
by Michelle Ann Lloyd
A dissertation submitted to the Graduate Faculty of North Carolina State University
In partial fulfillment of the Requirements for the degree of
Doctor of Philosophy
Food Science
Raleigh, NC
Dec 2008
APPROVED BY:
______________________________ ______________________________ Dr. MaryAnne Drake Dr. E. Allen Foegeding Chair of Advisory Committee ______________________________ ______________________________ Dr. Timothy Sanders Dr. Donn Ward

ii
DEDICATION
This book is dedicated to my family and friends who encouraged and supported me in all
of my educational pursuits.
iii
BIOGRAPHY
Michelle Lloyd was born at Ellsworth Air Force Base (AFB), South Dakota. She
was the first of 10 children born to Bruce and Esther Lloyd. Her family moved a lot
while she was growing up, so she had the opportunity to live in the following places:
Orem, UT; Grand Forks AFB, ND; Bennion, UT; Hanscom AFB, MA; Kearns, UT and
Layton, UT, where her family currently resides.
She discovered the major of food science when filling out her college application
and has enjoyed it ever since. She received a BS and MS degree in food science from
Brigham Young University (BYU) in Provo, UT. As an undergraduate student, she
worked part-time in the BYU Food Quality Assurance Lab, testing the quality and safety
of canned food produced by LDS Welfare Services. Upon graduation, she became the
supervisor of the lab and worked full-time in this position while earning her master’s
degree. Her thesis was on the sensory and nutritional quality of nonfat dry milk in long
term storage. After receiving her MS degree, she spent a year and a half at BYU
mentoring undergraduate students in food storage research before beginning a PhD at NC
State under the direction of Dr. MaryAnne Drake. During her time at NC State, she has
been an active member of the Food Science Club, serving in the following positions:
secretary, historian, publicity committee, outreach committee, website co-chair, and
college bowl team member (with a 2nd place win at the Annual Meeting of the Institute of
Food Technologists in New Orleans in 2008).
In her spare time, she enjoys preserving memories through taking pictures,
scrapbooking, editing home movies, and compiling information about her ancestors. She
iv
also enjoys vegetable gardening, cooking, and sharing her food with others. Anyone she
associates with will quickly learn that she is passionate about food science and loves to
conduct experiments and taste tests, even in her own kitchen. She hopes to use her
talents and skills to make the world a better place to live.
Her future plans include returning to Brigham Young University as a faculty
member in the Department of Nutrition, Dietetics and Food Science where she will teach
food chemistry and food analysis classes and conduct research related to food flavor,
stability, and shelf-life.

v
ACKNOWLEDGMENTS
Thank you to everyone who helped me throughout my PhD program, including:
□ My committee
□ My lab (especially those on the whole milk powder descriptive panel)
□ School friends
□ Church friends
□ My family
□ Those who provided funding and research assistance
o California Dairy Research Foundation (Davis, CA)
o WMP suppliers
o California Dairies, Inc. (for their assistance with proximate analyses)
o The Hershey Company
Finally, thank you to King Benjamin, an exemplary leader who lived over 2100 years ago
(and those who preserved his words so that we can have them today). His inspiring
words have been my motto throughout my PhD program: “And see that all these things
are done in wisdom and order; for it is not requisite that a man should run faster than he
has strength. And again, it is expedient that he should be diligent, that thereby he might
win the prize; therefore, all things must be done in order” (Book of Mormon, Mosiah
4:27).

vi
TABLE OF CONTENTS
List of Tables ........................................................................................................................ viii List of Figures ......................................................................................................................... ix Chapter 1. General Introduction to Whole Milk Powder ....................................................1
Production and Processing .................................................................................1 Flavor and Flavor Stability ..............................................................................22 Conclusions ......................................................................................................33 References ........................................................................................................34
Chapter 2. Flavor Variability and Stability of Whole Milk Powder .................................46 Abstract ............................................................................................................47 Introduction ......................................................................................................49 Materials and Methods .....................................................................................52 Results and Discussion ....................................................................................58 Conclusions ......................................................................................................71 References ........................................................................................................73 Acknowledgements ..........................................................................................79
Chapter 3. Effect of Nitrogen Flushing and Storage Temperature on Flavor and Stability of Whole Milk Powder ...........................................................................................97
Abstract ............................................................................................................98 Introduction ......................................................................................................99 Materials and Methods ...................................................................................102 Results and Discussion ..................................................................................109 Conclusions ....................................................................................................117 References ......................................................................................................119 Acknowledgements ........................................................................................124
Appendices ............................................................................................................................143 Appendix 1. Guide to reconstitute whole milk powder (WMP) to 10% solids not fat, based on International Dairy Federation Method 99C:1997 ...144 Appendix 2. Sample descriptive analysis ballot ..........................................148 Appendix 3. Consumer panel questionnaire for reconstituted whole milk powder............................................................................................................149 Appendix 4. Consumer panel questionnaire for chocolate ..........................154 Appendix 5. Standard curve summary for selected volatiles, based on E-2-hexenal internal standard ............................................................................158 Appendix 6. Selected volatiles in whole milk powder from four facilities stored up to 12 months ...................................................................................160 Appendix 7. Flavor intensities of whole milk powder from four facilities stored up to 12 months ...................................................................................162 Appendix 8. Color, water activity (aw), and moisture of whole milk powder from four facilities stored up to 12 months .......................................163
vii
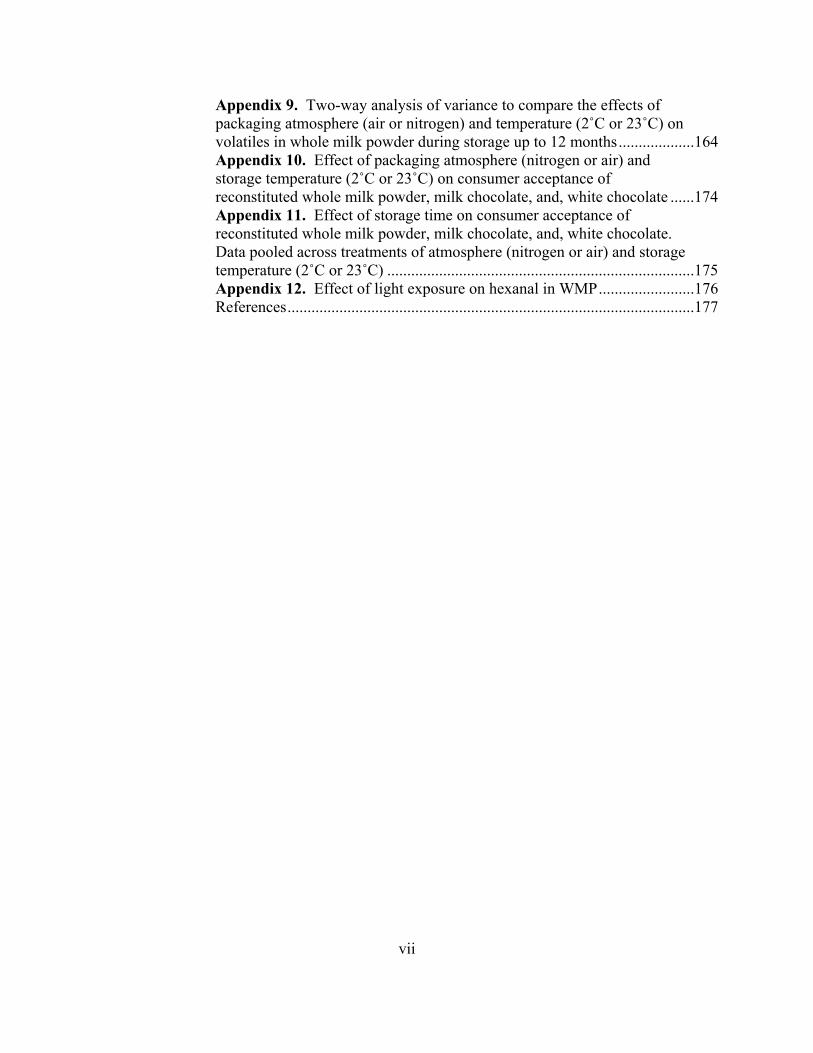
Appendix 9. Two-way analysis of variance to compare the effects of packaging atmosphere (air or nitrogen) and temperature (2˚C or 23˚C) on volatiles in whole milk powder during storage up to 12 months ...................164 Appendix 10. Effect of packaging atmosphere (nitrogen or air) and storage temperature (2˚C or 23˚C) on consumer acceptance of reconstituted whole milk powder, milk chocolate, and, white chocolate ......174 Appendix 11. Effect of storage time on consumer acceptance of reconstituted whole milk powder, milk chocolate, and, white chocolate. Data pooled across treatments of atmosphere (nitrogen or air) and storage temperature (2˚C or 23˚C) .............................................................................175 Appendix 12. Effect of light exposure on hexanal in WMP ........................176 References ......................................................................................................177
viii
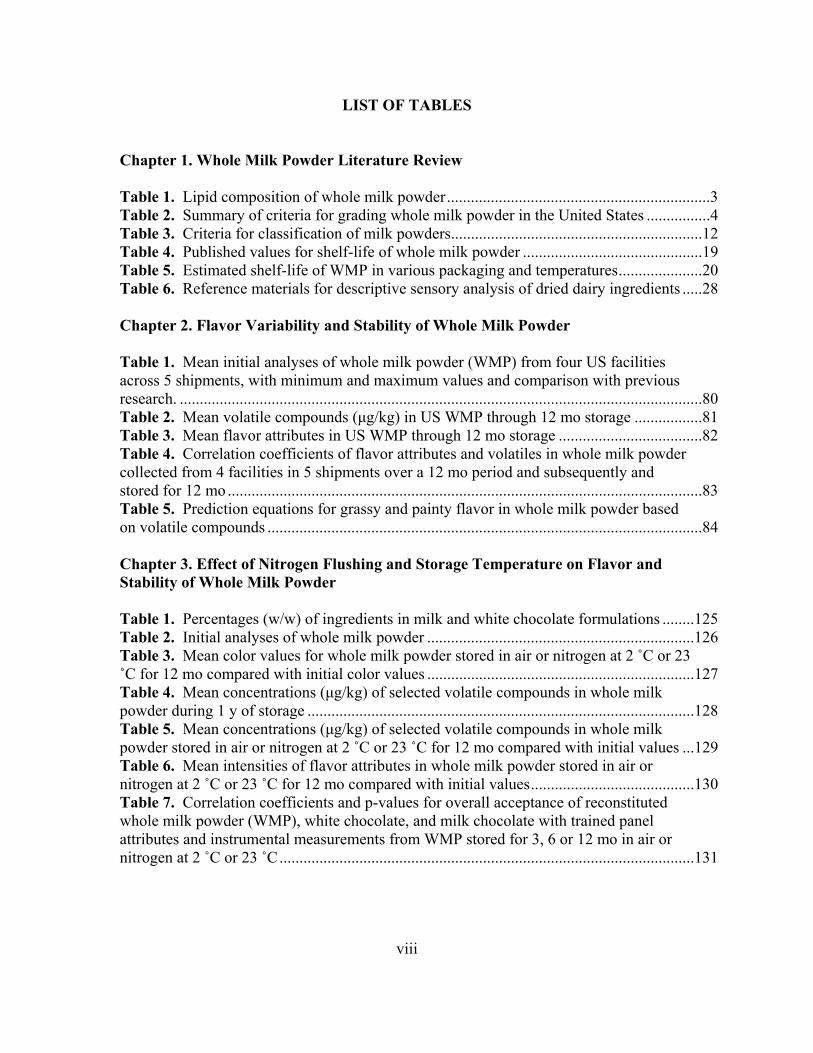
LIST OF TABLES
Chapter 1. Whole Milk Powder Literature Review
Table 1. Lipid composition of whole milk powder ..................................................................3 Table 2. Summary of criteria for grading whole milk powder in the United States ................4 Table 3. Criteria for classification of milk powders ...............................................................12 Table 4. Published values for shelf-life of whole milk powder .............................................19 Table 5. Estimated shelf-life of WMP in various packaging and temperatures .....................20 Table 6. Reference materials for descriptive sensory analysis of dried dairy ingredients .....28 Chapter 2. Flavor Variability and Stability of Whole Milk Powder Table 1. Mean initial analyses of whole milk powder (WMP) from four US facilities across 5 shipments, with minimum and maximum values and comparison with previous research. ...................................................................................................................................80 Table 2. Mean volatile compounds (μg/kg) in US WMP through 12 mo storage .................81 Table 3. Mean flavor attributes in US WMP through 12 mo storage ....................................82 Table 4. Correlation coefficients of flavor attributes and volatiles in whole milk powder collected from 4 facilities in 5 shipments over a 12 mo period and subsequently and stored for 12 mo .......................................................................................................................83 Table 5. Prediction equations for grassy and painty flavor in whole milk powder based on volatile compounds .............................................................................................................84
Chapter 3. Effect of Nitrogen Flushing and Storage Temperature on Flavor and Stability of Whole Milk Powder
Table 1. Percentages (w/w) of ingredients in milk and white chocolate formulations ........125 Table 2. Initial analyses of whole milk powder ...................................................................126 Table 3. Mean color values for whole milk powder stored in air or nitrogen at 2 ˚C or 23 ˚C for 12 mo compared with initial color values ...................................................................127 Table 4. Mean concentrations (μg/kg) of selected volatile compounds in whole milk powder during 1 y of storage .................................................................................................128 Table 5. Mean concentrations (μg/kg) of selected volatile compounds in whole milk powder stored in air or nitrogen at 2 ˚C or 23 ˚C for 12 mo compared with initial values ...129 Table 6. Mean intensities of flavor attributes in whole milk powder stored in air or nitrogen at 2 ˚C or 23 ˚C for 12 mo compared with initial values .........................................130 Table 7. Correlation coefficients and p-values for overall acceptance of reconstituted whole milk powder (WMP), white chocolate, and milk chocolate with trained panel attributes and instrumental measurements from WMP stored for 3, 6 or 12 mo in air or nitrogen at 2 ˚C or 23 ˚C ........................................................................................................131
ix
LIST OF FIGURES
Chapter 1. Whole Milk Powder Literature Review Figure 1. Proximate composition of whole milk powder.........................................................2 Figure 2. Lumps in whole milk powder ...................................................................................5 Figure 3. Graininess in whole milk powder after reconstitution ..............................................5 Figure 4. Solubility index measurement ..................................................................................9 Figure 5. Gas chromatography-olfactometry .........................................................................30 Chapter 2. Flavor Variability and Stability of Whole Milk Powder Figure 1. Experimental design ...............................................................................................85 Figure 2. CIE L* a* b* color values for dry and reconstituted (wet) whole milk powder stored up to 12 mo at 21˚C and 45% relative humidity ...........................................................86 Figure 3. Principal component analysis biplot showing initial volatiles of whole milk powder from four facilities ......................................................................................................87 Figure 4. Principal component analysis biplot showing volatiles in whole milk powder from four facilities stored up to 12 mo ....................................................................................88 Figure 5. Hexanal development in whole milk powder from four facilities over 12 mo storage ......................................................................................................................................89 Figure 6. Variation in hexanal concentration in whole milk powder stored for 12 mo at 21˚C and 45% relative humidity ..............................................................................................90 Figure 7. Principal component analysis biplot showing initial descriptive analysis of whole milk powder from four facilities ...................................................................................91 Figure 8. Principal component analysis biplot descriptive analysis of whole milk powder from four facilities stored up to 12 mo ....................................................................................92 Figure 9. Grassy flavor development in whole milk powder from four facilities over 12 mo storage ................................................................................................................................93 Figure 10. Painty flavor development in whole milk powder from four facilities over 12 mo storage ................................................................................................................................94 Figure 11. Variation in painty flavor intensity in whole milk powder stored for 12 mo at 21˚C and 45% relative humidity ..............................................................................................95 Figure 12. Consumer acceptance of fluid whole milk compared with reconstituted whole milk powder (WMP) of different ages .....................................................................................96
x
Chapter 3. Effect of Nitrogen Flushing and Storage Temperature on Flavor and Stability of Whole Milk Powder Figure 1. Experimental scheme for whole milk powder packaging study ...........................132 Figure 2. Oxygen content of whole milk powder stored in air or nitrogen at 2 ˚C or 23 ˚C............................................................................................................................................133 Figure 3. Development of peroxides in whole milk powder stored in air or nitrogen at 2 ˚C or 23 ˚C .............................................................................................................................134 Figure 4. Principal component analysis biplot of whole milk powder volatiles ..................135 Figure 5. Development of hexanal in whole milk powder stored in air or nitrogen at 2 ˚C or 23 ˚C ..................................................................................................................................136 Figure 6. Principal component analysis biplot of whole milk powder descriptive sensory
analysis ...................................................................................................................................137 Figure 7. Principal component analysis biplot showing initial descriptive analysis of whole milk powder from four facilities .................................................................................138 Figure 8. Principal component analysis biplot of whole milk powder volatiles and descriptive sensory analysis profiles ......................................................................................139 Figure 9. Consumer acceptance of reconstituted whole milk powder (WMP) stored up to one year in air or nitrogen at 2 ˚C or 23 ˚C, evaluated every 3 mo .......................................140 Figure 10. Consumer acceptance of white chocolate made from whole milk powder stored up to a year in air or nitrogen at 2 ˚C or 23 ˚C, evaluated every 3 mo .......................141 Figure 11. Consumer acceptance of milk chocolate made from whole milk powder stored up to a year in air or nitrogen at 2 ˚C or 23 ˚C, evaluated every 3 mo .......................142

1
Whole Milk Powder Literature Review
Production and Processing
Production Statistics
Production of dried milk products can be traced back to ancient times when milk
was dried in the sun (Caric and Kalab, 1987). The development of industrial production
equipment and techniques for dried milk began in the early 1800’s and became
commercially available in the late 1800’s (Caric and Kalab, 1987). Since that time, the
milk powder production industry has grown significantly, with production of both whole
milk powder (WMP) and skim milk powder (SMP). Worldwide production of WMP in
2006 was approximately 3.5 million metric tons, with the European Union, China, New
Zealand and Brazil and Argentina ranked as the top producing countries, and the United
States ranked 10th (USDA-FAS, 2008). In 2006, the United States produced
approximately 14 thousand metric tons of WMP and 656 thousand metric tons of SMP,
accounting for nearly 10% of worldwide milk powder production (USDA-FAS, 2008).
Standard of Identity
WMP, which is also known as full cream milk powder, is properly labeled “dry
whole milk” by US standard of identity, and can be made from removing the water from
fluid whole milk, or by making a powder which reconstitutes to the same specifications
as fluid whole milk, such as mixing skim milk powder with anhydrous milkfat or spray
drying with a stream of cream along with a stream of skim milk (CFR, 2008; Kelly,
2006). The final product must have a fat content between 26% and 40% by weight, and a
moisture content less than 5% on a milk solids not fat basis (CFR, 2008). Vitamins A
2
and/or D may be added, along with any necessary carriers, as long as they reconstitute to
2000 IU/qt and 400 IU/qt, respectively (CFR, 2008). Other optional ingredients include
emulsifiers, stabilizers, anticaking agents, antioxidants, and flavorings (CFR, 2008).
Most WMP in the US does not contain any optional ingredients, but lecithin is sometimes
used to make agglomerated, or instantized WMP, which is often used for infant formulas
(Dan Meyer, American Dairy Products Institute, personal communication, 2008).
According to Codex Alimentarius, which sets recommended standards for food on an
international basis, WMP must meet the following criteria: 26-42% fat, <5% moisture,
and 34% protein on a solids not fat basis (CODEX, 1999). Other standards include
approved additives, proper hygiene, limits on heavy metals and pesticide residues, and
labeling requirements (CODEX, 1999).
Composition
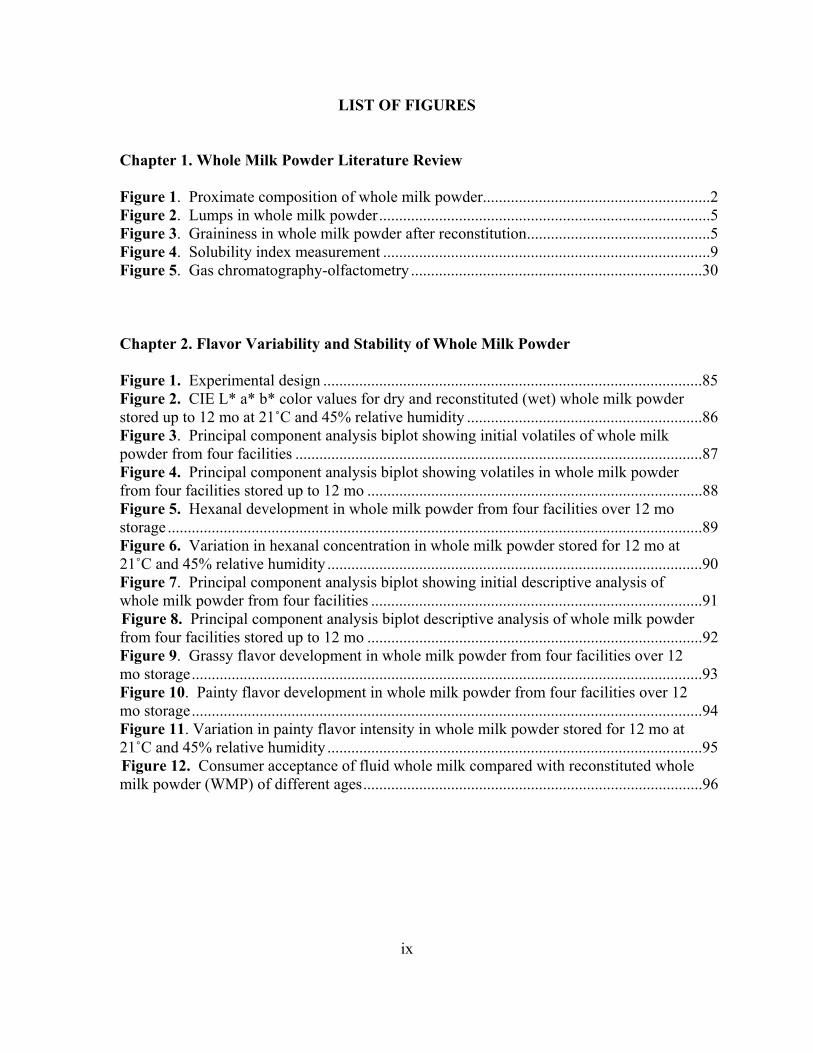
Typically, WMP has a composition
of 24.5-27% protein, 36-38.5% lactose, 26-
28.5% fat, 5.5-6.5% ash and 2.0-4.5%
moisture, as shown in Figure 1 (Chandan,
1997; USDEC, 2005). In contrast, SMP
contains higher proportions of protein (34-
37%), lactose (49.5-52%), and ash (8.2-
8.6%), due to a much lower fat content (0.6-
24.5-27% Protein
36-38.5% Lactose
26-28.5% Fat
5.5-6.5% Ash
2.0-4.5% Moisture
Figure 1. Proximate composition of whole milk powder.
3
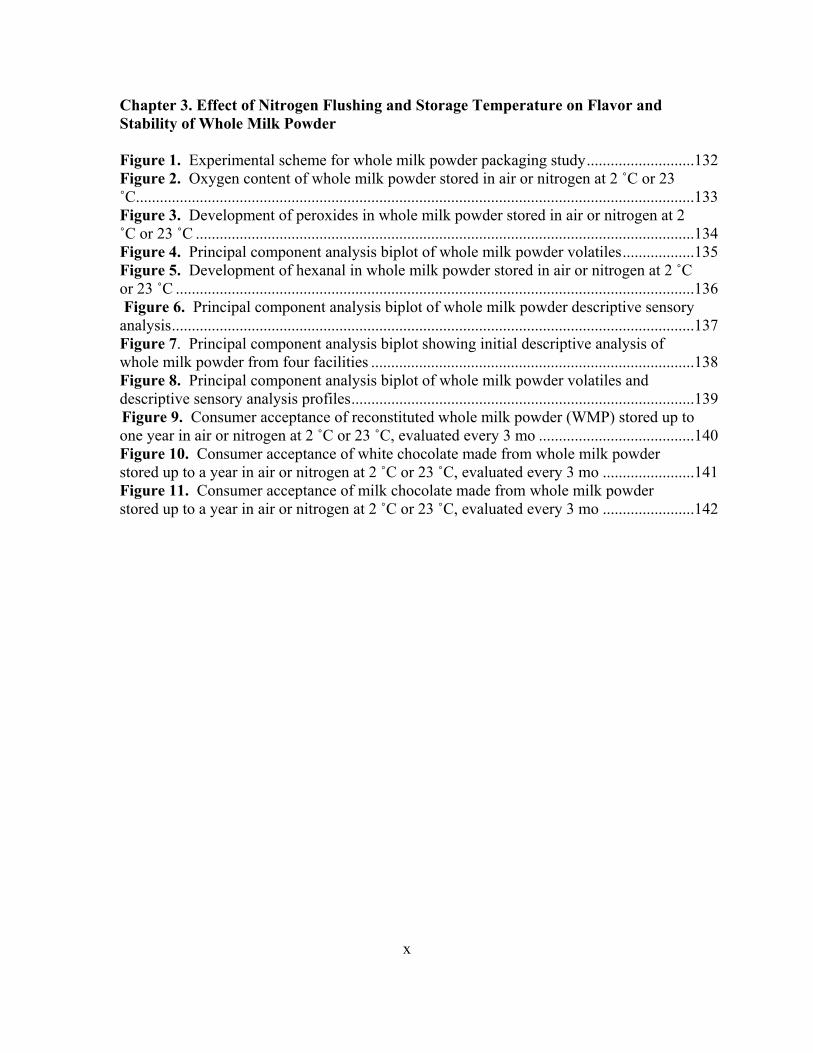
1.25%), but moisture content is similar to WMP (USDEC, 2005). In WMP,
approximately 66% of the milkfat is
saturated fat, with 31%
monounsaturated fat and nearly 3%
polyunsaturated fat (Table 1) (USDA-
ARS, 2007). The composition of
milkfat can vary depending on the feed
of the cows, especially with regard to
the amount and type of fat in the diet
(Palmquist et al., 1993). Diets higher in
unsaturated fat result in milkfat with higher levels of C18 fatty acids, which decrease the
stability of the milkfat (Palmquist et al., 1993). Kim et al. (2002) determined that the
surface composition of a 29% fat WMP was 98% fat and 2% lactose, with negligible
protein.
Quality Parameters
Grading. In the United States, WMP may be graded on a voluntary basis to
facilitate marketing (USDA-AMS, 2001). There are two grades for WMP: US Extra
Grade and US Standard Grade. Grades are based on the following criteria: flavor,
physical appearance, microbial counts, milkfat, moisture, scorched particles, solubility
index, and titratable acidity (USDA-AMS, 2001). A summary of the grading criteria is
found in Table 2. The details for many of these test procedures are described elsewhere
(ADPI, 2002; Wehr and Frank, 2004). Other tests used to evaluate WMP quality include
Table 1. Lipid composition of whole milk powdera Fatty acids g per 100 g Total saturated 16.7 4:0 0.87 6:0 0.24 8:0 0.27 10:0 0.60 12:0 0.61 14:0 2.82 16:0 7.52 18:0 2.85 Total monounsaturated 7.92 16:1 1.20 18:1 6.19 Total polyunsaturated 0.67 18:2 0.46 18:3 0.20 aFrom USDA-ARS, 2007
4
free fat (FF), peroxide value (PV), thiobarbituric acid (TBA), hydroxymethylfurfural
(HMF), sulfhydryl group concentration, whey protein nitrogen index (WPN), bulk
density, dispersibility, and mineral content.
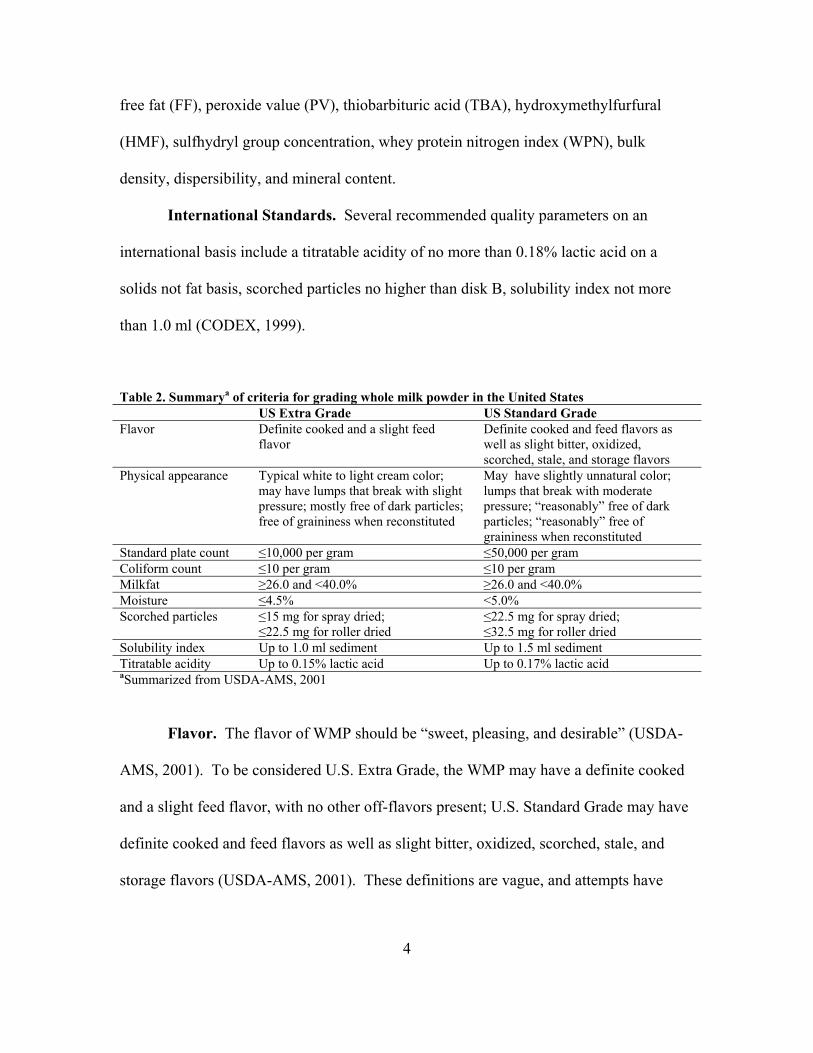
International Standards. Several recommended quality parameters on an
international basis include a titratable acidity of no more than 0.18% lactic acid on a
solids not fat basis, scorched particles no higher than disk B, solubility index not more
than 1.0 ml (CODEX, 1999).
Table 2. Summarya of criteria for grading whole milk powder in the United States US Extra Grade US Standard Grade Flavor Definite cooked and a slight feed
flavor Definite cooked and feed flavors as well as slight bitter, oxidized, scorched, stale, and storage flavors
Physical appearance Typical white to light cream color; may have lumps that break with slight pressure; mostly free of dark particles; free of graininess when reconstituted
May have slightly unnatural color; lumps that break with moderate pressure; “reasonably” free of dark particles; “reasonably” free of graininess when reconstituted
Standard plate count ≤10,000 per gram ≤50,000 per gram Coliform count ≤10 per gram ≤10 per gram Milkfat ≥26.0 and <40.0% ≥26.0 and <40.0% Moisture ≤4.5% <5.0% Scorched particles ≤15 mg for spray dried;
≤22.5 mg for roller dried ≤22.5 mg for spray dried; ≤32.5 mg for roller dried
Solubility index Up to 1.0 ml sediment Up to 1.5 ml sediment Titratable acidity Up to 0.15% lactic acid Up to 0.17% lactic acid aSummarized from USDA-AMS, 2001
Flavor. The flavor of WMP should be “sweet, pleasing, and desirable” (USDA-
AMS, 2001). To be considered U.S. Extra Grade, the WMP may have a definite cooked
and a slight feed flavor, with no other off-flavors present; U.S. Standard Grade may have
definite cooked and feed flavors as well as slight bitter, oxidized, scorched, stale, and
storage flavors (USDA-AMS, 2001). These definitions are vague, and attempts have
5
been made to develop more clear standards for flavor using descriptive analysis (Hough
et al., 1992; Drake et al., 2003). Hough et al. (1992) developed a methodology to create
specific flavor defects in milk and determined threshold concentrations for these defects.
Drake et al. (2003) developed a dried dairy ingredient lexicon for use with descriptive
analysis of dairy products, including
WMP, which will be discussed later.
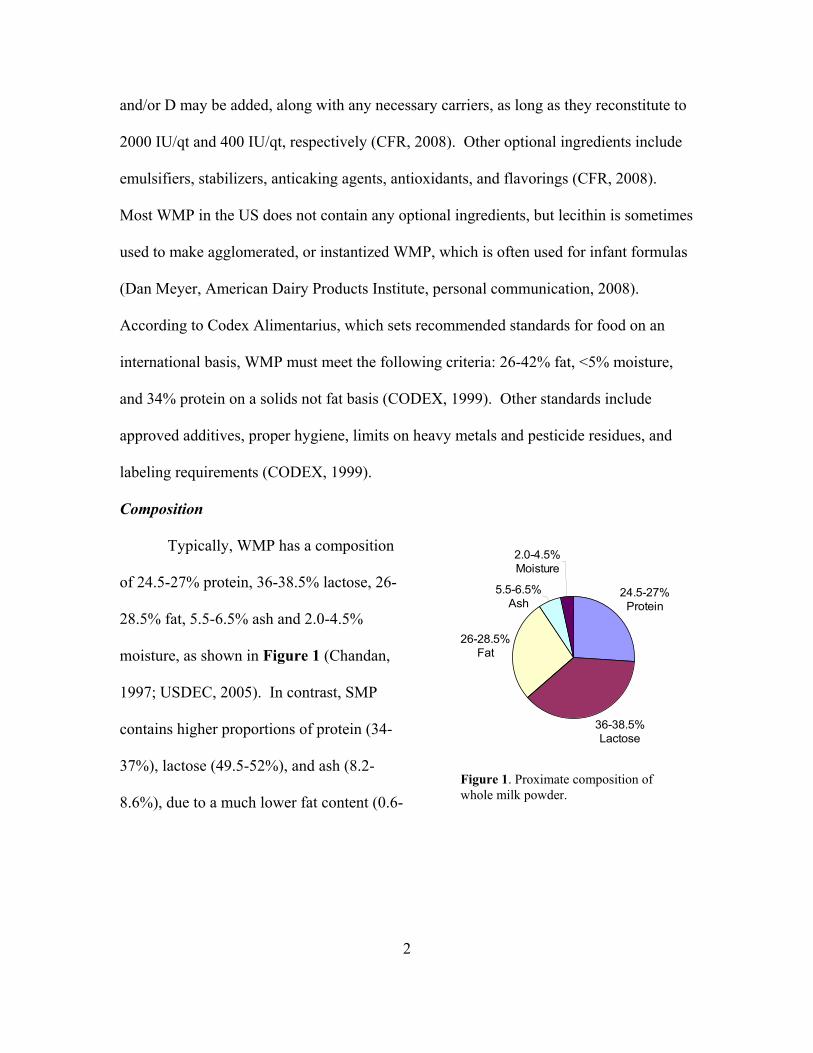
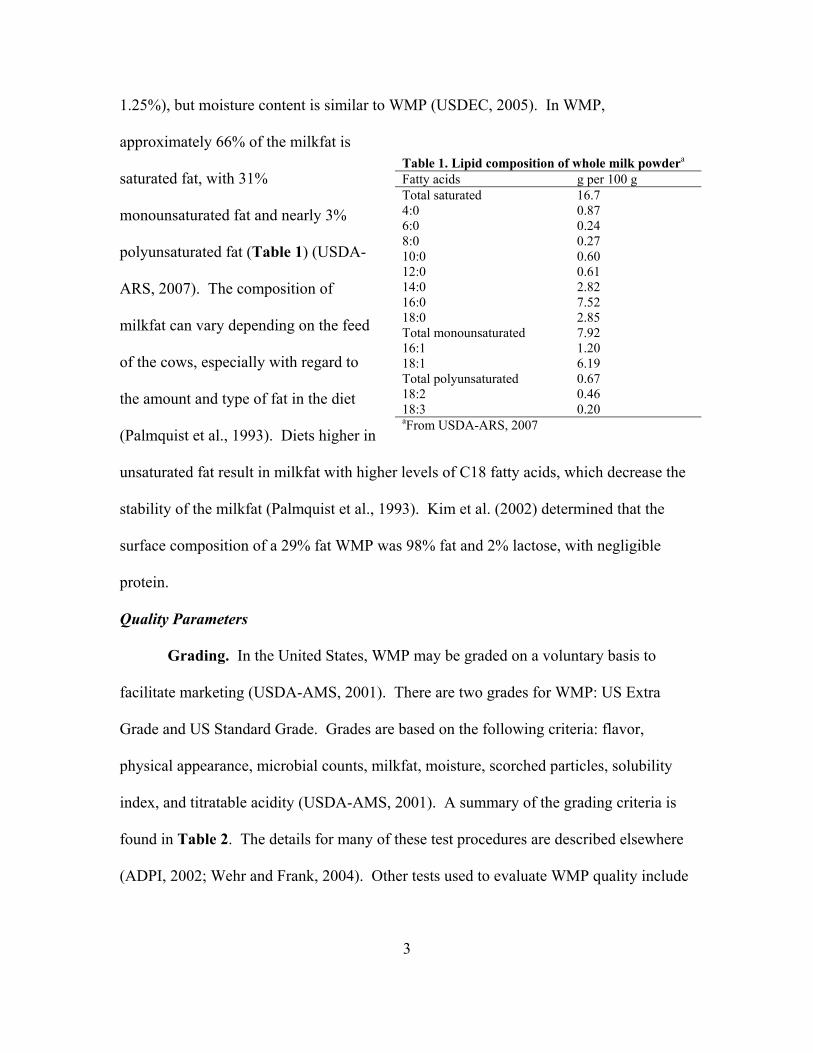
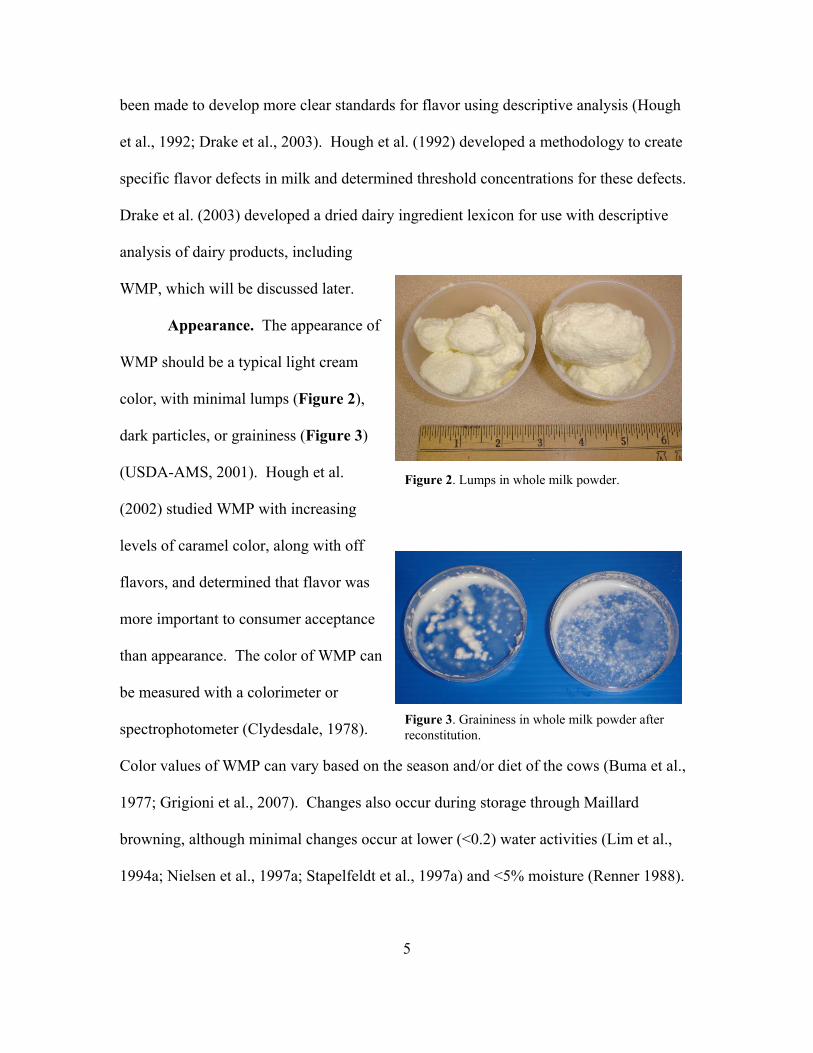
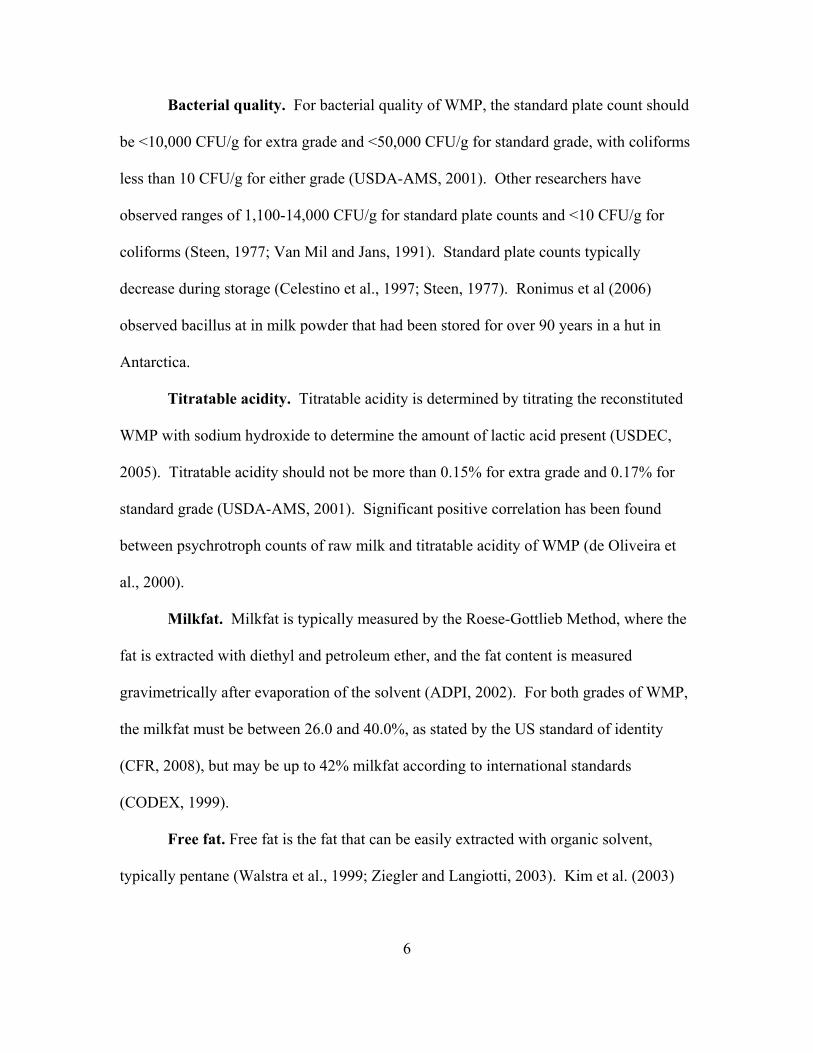
Appearance. The appearance of
WMP should be a typical light cream
color, with minimal lumps (Figure 2),
dark particles, or graininess (Figure 3)
(USDA-AMS, 2001). Hough et al.
(2002) studied WMP with increasing
levels of caramel color, along with off
flavors, and determined that flavor was
more important to consumer acceptance
than appearance. The color of WMP can
be measured with a colorimeter or
spectrophotometer (Clydesdale, 1978).
Color values of WMP can vary based on the season and/or diet of the cows (Buma et al.,
1977; Grigioni et al., 2007). Changes also occur during storage through Maillard
browning, although minimal changes occur at lower (<0.2) water activities (Lim et al.,
1994a; Nielsen et al., 1997a; Stapelfeldt et al., 1997a) and <5% moisture (Renner 1988).
Figure 3. Graininess in whole milk powder after reconstitution.
Figure 2. Lumps in whole milk powder.
6
Bacterial quality. For bacterial quality of WMP, the standard plate count should
be <10,000 CFU/g for extra grade and <50,000 CFU/g for standard grade, with coliforms
less than 10 CFU/g for either grade (USDA-AMS, 2001). Other researchers have
observed ranges of 1,100-14,000 CFU/g for standard plate counts and <10 CFU/g for
coliforms (Steen, 1977; Van Mil and Jans, 1991). Standard plate counts typically
decrease during storage (Celestino et al., 1997; Steen, 1977). Ronimus et al (2006)
observed bacillus at in milk powder that had been stored for over 90 years in a hut in
Antarctica.
Titratable acidity. Titratable acidity is determined by titrating the reconstituted
WMP with sodium hydroxide to determine the amount of lactic acid present (USDEC,
2005). Titratable acidity should not be more than 0.15% for extra grade and 0.17% for
standard grade (USDA-AMS, 2001). Significant positive correlation has been found
between psychrotroph counts of raw milk and titratable acidity of WMP (de Oliveira et
al., 2000).
Milkfat. Milkfat is typically measured by the Roese-Gottlieb Method, where the
fat is extracted with diethyl and petroleum ether, and the fat content is measured
gravimetrically after evaporation of the solvent (ADPI, 2002). For both grades of WMP,
the milkfat must be between 26.0 and 40.0%, as stated by the US standard of identity
(CFR, 2008), but may be up to 42% milkfat according to international standards
(CODEX, 1999).
Free fat. Free fat is the fat that can be easily extracted with organic solvent,
typically pentane (Walstra et al., 1999; Ziegler and Langiotti, 2003). Kim et al. (2003)
7
used petroleum ether, following the method of (Buma, 1971a). Free fat includes the fat
that is on the surface of the WMP or within cracks (Walstra et al., 1999). The free fat in
spray dried WMP is typically around 2% to 3%, while roller-dried WMP has free fat in
the range of 60% to 90% (Liang and Hartel, 2004). High levels of free fat in WMP have
been associated with greater susceptibility to oxidation (Koc et al., 2003; Vignolles et al.,
2007), but other research contradicts this conclusion. Buma (1971a, b, c, d, e, f, g, h, i, j)
performed extensive research on free fat in spray dried WMP and did not find any
correlation between the development of oxidized flavor and free fat of 1.1%-79% in
WMP stored at 30 ºC for 6 mo, although the flavor of the larger particles (containing less
free fat) was slightly better than that of smaller particles (containing a larger proportion
of free fat). Higher amounts of free fat in WMP decrease its wettability (Kim et al.,
2002), which could be an important factor to consider in an industrial setting. Free fat is
important when WMP is used in the production of chocolate, because it reduces the
amount of cocoa butter, which is a more expensive ingredient, that must be added to
produce the desired rheological properties of the chocolate (Chandan, 1997).
Moisture. Moisture is often measured by vacuum or convection oven, but may
also be measured by titration (USDEC, 2005). The moisture of WMP must not be more
then 4.5% for extra grade and 5% for standard grade, on a milk solids not fat basis
(USDA-AMS, 2001), which corresponds to a water activity of around 0.3 (Vuataz, 2002).
WMP is typically manufactured to around 2-3% moisture (Van Mil and Jans 1991; Steen
1997), which corresponds to a water activity around 0.2 (Jouppila and Roos, 1994,
Thomsen et al., 2005b). Above a water activity of 0.4, lactose is predominately found in
8
the crystallized form and deterioration reactions are more prevalent, including Maillard
browning (Jouppila and Roos, 1994; Thomsen et al., 2005b). Van Mil and Jans (1991)
concluded that WMP should have a moisture content near 3% to provide optimal stability
during storage with regard to flavor and peroxide value.
Scorched particles. Scorched particles are undesirable in WMP; they develop
when WMP particles get held up somewhere in the drying process and receive extra
heating, causing them to turn a golden brown color (Celestino et al., 1997). For spray
dried WMP, the scorched particle content is measured by filtering reconstituted WMP
(32.5 g in 250 ml of water) through a cotton disc, allowing it to dry, and comparing it to a
photograph of standard discs corresponding to the following amounts of scorched
particles: Disc A, 7.5 mg; Disc B, 15.0 mg; Disc C, 22.5 mg; Disc D, 32.5 mg (ADPI,
2002; USDA-AMS, 2001). For extra grade, the scorched particle content should not be
more than Disc B if spray dried and Disc C if roller dried. For standard grade, the
scorched particle content should not be more than Disc C if spray dried and Disc D if
roller dried. A score of B or better is recommended for WMP that will be used for direct
reconstitution (Sanderson, 1979 as cited by Celestino et al., 1997). Celestino et al. (1997)
observed that WMP processed in the spring and summer were comparable to Disc A for
scorched particles, while WMP processed in the fall had a Disc B rating. They gave
several possibilities for this difference, including variation in spray dryer operation
parameters, higher protein content, and higher calcium content. However, Steen (1977)
also measured scorched particles in WMP produced across all seasons at 2 facilities, and
did not observe any seasonal effect; 23 out of 24 samples possessed Disc A ratings, with
9
1 sample out of 6 produced in the spring receiving a B rating. Thus, scorched particle
content may be more related to operation of the drier than season.
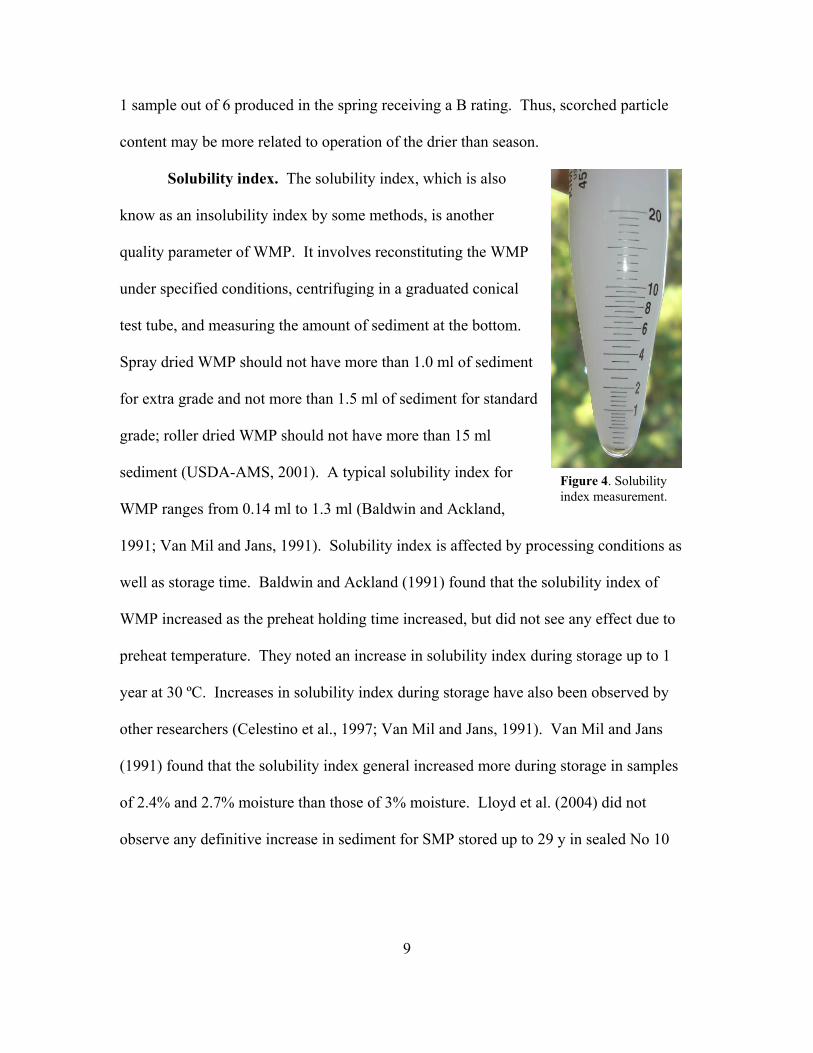
Solubility index. The solubility index, which is also
know as an insolubility index by some methods, is another
quality parameter of WMP. It involves reconstituting the WMP
under specified conditions, centrifuging in a graduated conical
test tube, and measuring the amount of sediment at the bottom.
Spray dried WMP should not have more than 1.0 ml of sediment
for extra grade and not more than 1.5 ml of sediment for standard
grade; roller dried WMP should not have more than 15 ml
sediment (USDA-AMS, 2001). A typical solubility index for
WMP ranges from 0.14 ml to 1.3 ml (Baldwin and Ackland,
1991; Van Mil and Jans, 1991). Solubility index is affected by processing conditions as
well as storage time. Baldwin and Ackland (1991) found that the solubility index of
WMP increased as the preheat holding time increased, but did not see any effect due to
preheat temperature. They noted an increase in solubility index during storage up to 1
year at 30 ºC. Increases in solubility index during storage have also been observed by
other researchers (Celestino et al., 1997; Van Mil and Jans, 1991). Van Mil and Jans
(1991) found that the solubility index general increased more during storage in samples
of 2.4% and 2.7% moisture than those of 3% moisture. Lloyd et al. (2004) did not
observe any definitive increase in sediment for SMP stored up to 29 y in sealed No 10
Figure 4. Solubility index measurement.
10
cans. Decreases in solubility during storage are related to the Maillard reaction and
oxidation (Thomas et al., 2004).
Measures of lipid oxidation. The peroxide value (PV) is a commonly used test to
measure primary lipid oxidation products in high fat foods. Nielsen et al. (2003)
compared 5 wet-chemistry methods for PV of various foods, including tuna oil, a milk
drink (with added oil), rapeseed oil, fish oil, and mayonnaise. All of the methods used
were based on the principle that peroxides oxidize iron or iodide, which is further reacted
to produce a colored complex that can be measured by titration or spectrophotometer.
They selected the method of the International Dairy Federation (IDF) as the most
optimal. The IDF method (IDF, 1991) is a standard method for PV of anhydrous milkfat.
It is performed by dissolving the milkfat in a chloroform and methanol mixture, followed
by addition of ferrous chloride and ammonium thiocyanate to form the red ferric
isothiocyanate complex which is measured spectrophotometrically. This method has
been applied to WMP following fat extraction, which is typically done with a mixture of
chloroform and methanol (Baldwin et al., 1991; Celestino et al., 1997; Liang, 2000;
McCluskey et al., 1997b; Newstead and Headifen, 1981; Van Mil and Jans, 1991). The
PV procedure should be conducted in the absence of light to prevent false high values
(Newstead and Headifen, 1981). PV is expressed as milli-equivalents of oxygen per kg
fat. At 2 meq/kg fat, off-flavors may become detectable in WMP (Van Mil and Jans,
1991). Since primary lipid oxidation products break down over time, the peroxide value
is not highly correlated with oxidized flavor perception (Baldwin et al., 1991; Pyenson
and Tracy, 1946).
11
The thiobarbituric acid reactive substances (TBARS) assay measures the amount
of malondialdehyde, a secondary lipid oxidation product, present in a sample. Some
researchers consider TBARS a better measure of oxidation than PV (Chan et al., 1993).
TBARS has been found to correlate well with sensory data (Nielsen et al., 1997b;
Stapelfeldt et al., 1997b), but not always (Tuohy and Kelly, 1989). Stapelfeldt et al.
(1997b) found that TBARS was more highly correlated with sensory data when measured
spectrophotometrically at 450 nm rather than the standard 532 nm.
Heat treatment. Upon heating, lactose and free amino groups in milk react in the
Maillard reaction (Ellis, 1959). This reaction has been extensively studied in WMP (Hall
and Lingnert, 1984; Morales and Jimenez-Perez, 1998; Muir, 1996; Pizzoferrato et al.,
1998; Thomas et al., 2004; Thomsen et al., 2005a, b). Maillard reaction products have
been shown to possess antioxidant properties (Elias et al., 2008; Hall and Lingnert,
1984). Several tests can be used to indicate the level of heat treatment of WMP:
hydroxymethylfurfural (HMF), sulfhydryl group concentration (SH), and whey protein
nitrogen index (WPN). Measurement of HMF, a Maillard reaction intermediate, was
proposed by Baldwin and Ackland (1991) as an indicator of poor storage conditions
because it increases during processing and storage. Sulfhydryl groups formed during
processing have been shown to possess antioxidant activity and decrease during storage
(Baldwin and Ackland, 1991). WPN measures the amount of undenatured whey protein
in a milk powder sample, which varies according to the heat treatment the milk received
before drying. It is expressed as mg undenatured whey protein nitrogen per g powder.
Lower values indicate a more extreme heat treatment of the fluid milk before spray
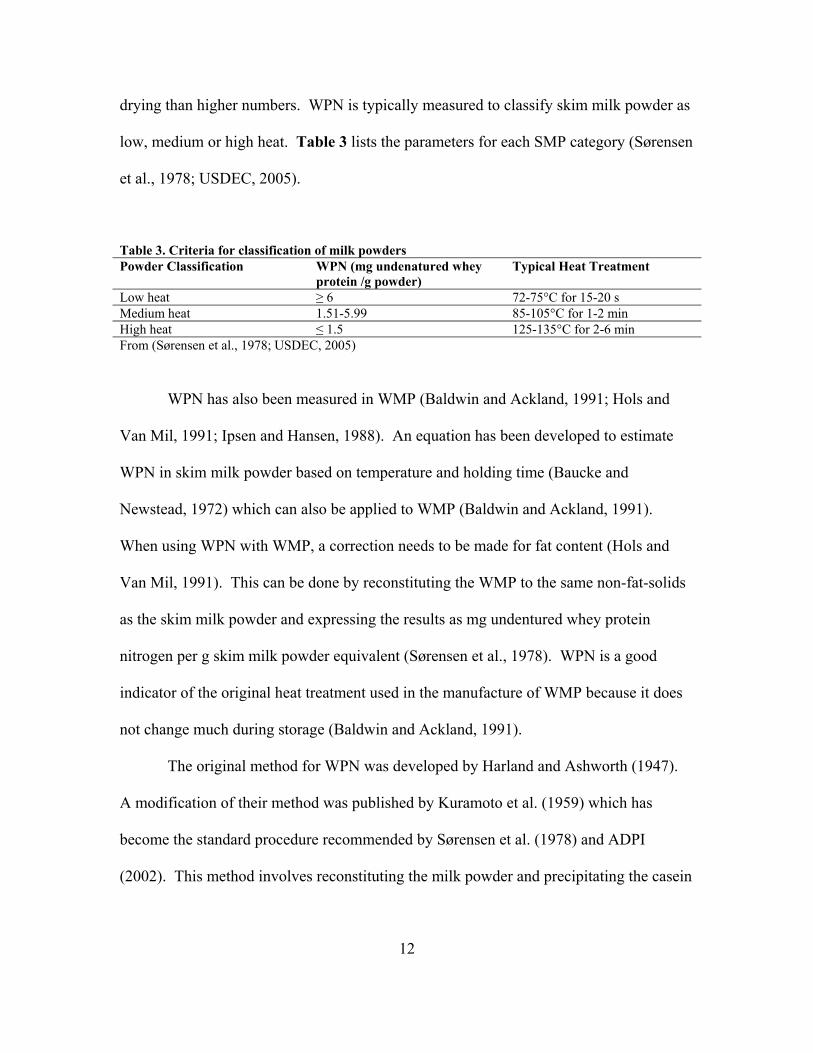
12
drying than higher numbers. WPN is typically measured to classify skim milk powder as
low, medium or high heat. Table 3 lists the parameters for each SMP category (Sørensen
et al., 1978; USDEC, 2005).
Table 3. Criteria for classification of milk powders Powder Classification WPN (mg undenatured whey
protein /g powder) Typical Heat Treatment
Low heat ≥ 6 72-75°C for 15-20 s Medium heat 1.51-5.99 85-105°C for 1-2 min High heat ≤ 1.5 125-135°C for 2-6 min From (Sørensen et al., 1978; USDEC, 2005)
WPN has also been measured in WMP (Baldwin and Ackland, 1991; Hols and
Van Mil, 1991; Ipsen and Hansen, 1988). An equation has been developed to estimate
WPN in skim milk powder based on temperature and holding time (Baucke and
Newstead, 1972) which can also be applied to WMP (Baldwin and Ackland, 1991).
When using WPN with WMP, a correction needs to be made for fat content (Hols and
Van Mil, 1991). This can be done by reconstituting the WMP to the same non-fat-solids
as the skim milk powder and expressing the results as mg undentured whey protein
nitrogen per g skim milk powder equivalent (Sørensen et al., 1978). WPN is a good
indicator of the original heat treatment used in the manufacture of WMP because it does
not change much during storage (Baldwin and Ackland, 1991).
The original method for WPN was developed by Harland and Ashworth (1947).
A modification of their method was published by Kuramoto et al. (1959) which has
become the standard procedure recommended by Sørensen et al. (1978) and ADPI
(2002). This method involves reconstituting the milk powder and precipitating the casein

13
and the denatured whey protein with sodium chloride, followed by filtration. The filtrate
contains all of the undenatured whey protein, which is denatured with hydrochloric acid,
forming a turbid solution. The turbidity is measured with a spectrophotometer as a
measure of the amount of protein present. An alternative method suggested by Sanderson
(1970) uses amido black dye to bind the protein rather than acid precipitation and was
shown to be more reliable than the turbidity method. Other potential methods to measure
heat treatment of milk powders have also been compared with WPN, including fast
protein liquid chromatography (Manji and Kakuda, 1987) and reactive sulfhydryl groups
(Anema and Lloyd, 1999).
Bulk density. Bulk density refers to the volume of a specific mass of milk
powder and is often measured by placing a sample of milk powder in a graduated
cylinder and tapping it by hand or with an instrument until the volume no longer changes
(Walstra et al., 1999). Nijdam and Langrish (2005) did not find this technique very
useful for WMP because due to its high fat content, the powder was sticky and formed
clumps in the tapping process. Often a high bulk density and a small particle size is
desired for shipping because it conserves space. In contrast, a lower bulk density with
larger particle size is often desired for beverage application and direct reconstitution, as
in the case of agglomerated powders. Agglomerated powders take up more space and
may not transport as readily because stacking large bags may result in destruction of the
agglomerated particles, but these products have the benefit of dissolving more easily in
water. The bulk density may be expressed as g per 100 ml; its inverse is bulk volume,
would be expressed as ml per 100 g (Westergaard, 2005).
14
The particle size can affect flowability and cohesion of WMP, which relate to
how the dry powder moves through equipment, such as a hopper (Fitzpatrick et al.,
2004). Fitzpatrick et al. (2004) found that WMP with a finer particle size was more
cohesive, but increasing free fat had no effect. Flowability may be measured by the time
it takes for a powder to flow through a funnel, although more sophisticated techniques
have been developed (Westergaard, 2005).
Dispersibility. Dispersibility measures how well instantized (agglomerated)
WMP goes into solution (USDEC, 2004). The International Dairy Federation (IDF) has a
standard method to determine dispersibility and wettability of instantized milk powders
(IDF, 1979). The method involves dissolving milk powder in water and filtering it
through a sieve. The dispersibility is calculated based on the solids content of the filtrate,
the mass of the powder sample, and the water content of the powder. A similar property
is wetting time, which is the amount of time for instantized WMP to become wetted when
placed on the surface of a beaker of water (IDF, 1979). Kim et al. (2005) suggested that
the wettability of WMP was related to the melting point of the fat on the surface of the
powder and that a water temperature above this melting point drastically reduced the
wetting time. Wettability may also be improved by coating the powder surface with a
surfactant such as lecithin (Kim et al., 2005).
Mineral content. The mineral content of WMP can be measured using
inductively coupled plasma-optical emission spectroscopy (ICP-OES). Transitional
metals such as copper have been analyzed by a number of researchers due to concerns
that they promote lipid oxidation (Havemose et al., 2006). Both iron and copper are the

15
main minerals that have been associated with oxidized flavors (Greenbank 1948). Steen
(1977) observed that copper content of WMP was higher during the winter (around 0.7
mg/kg) months than the summer (0.4 mg/g), with no seasonal variation observed for iron
or zinc.
Processing Methods
Overview. WMP is made from raw whole milk through the following processing
steps: (1) standardization (2) heat treatment (3) evaporation (4) homogenization (5) and
drying, as described by USDEC (2005) and Walstra et al. (1999). Since raw whole milk
has a variable fat content (Palmquist et al., 1993), the milk is first separated into cream
and skim milk and then recombined in specific proportions to reach a standard fat
content. Second, the milk is heat treated to pasteurize it, to inactivate enzymes such as
lipase, and to increase the abundance of sulfhydryl groups, which stabilize the WMP
against oxidation (Baldwin et al., 1991; Contarini et al., 1997; Van Mil and Jans, 1991).
Third, the milk is evaporated to 40-50% solids to make the drying process much more
efficient. Fourth, the milk is homogenized. This step is optional, depending on the
desired product. It is useful because is breaks up the fat into small globules that are more
stable against oxidation. If the milk is not homogenized, the resulting powder will have a
greater free fat content. The final step is drying, which can be accomplished by spray
drying or roller drying.
Spray drying. Spray drying involves spraying the concentrated milk into tiny
droplets in a heated chamber. The small mist of droplets is generated most commonly by
either a pressure atomizer or a centrifugal atomizer (USDEC, 2005). The water
16
evaporates from the small droplets and the milk powder is created. The fine powder
formed has a small particle size, which varies with the operating parameters of the spray
dryer (Birchal et al., 2005; Caric and Kalab, 1987). If it is a one stage process, the WMP
achieves its final moisture content inside the spray dryer (Westergaard, 2005). Most
WMP is produced with a two stage process, where the WMP moves from the spray drier
to a vibrating fluidized bed and is exposed to additional heated air to complete the drying
process (USDEC, 2005; Westergaard, 2005).
Agglomeration. Sometimes the WMP is agglomerated, or instantized, to make it
easier to disperse in water. The process makes the particles less dense by incorporation
of air. Typically, a small amount (0.1-0.3%) of lecithin is also added during the final
stage of spray drying as a wetting agent to facilitate reconstitution (USDEC, 2005;
Westergaard, 2005). There are two main agglomeration techniques: “straight through” or
“single pass” and “re-wet” agglomeration (USDEC, 2005). The single pass process
allows the WMP to be agglomerated during the initial drying process, while the re-wet
process uses previously dried WMP that is then re-wetted to around 5-10% moisture,
agglomerated, and dried (USDEC, 2005). Agglomerated WMP is typically used in infant
formula (Dan Meyer, American Dairy Products Institute, personal communication, 2008).
Roller drying. Roller drying is done by bringing milk into contact with heated
cylindrical drums and scraping the dried milk from the drum once in has dried (USDEC,
2005; Westergaard, 2005). Roller drying has become an antiquated process for WMP
(Kelly, 2006), with only a couple of plants in the US that are capable of making this
product (Dan Meyer, American Dairy Products Institute, personal communication, 2008).
17
Most, if not all powdered milk is currently spray dried because roller drying is not as
consistent and produces milk powder that has more scorched particles and is less soluble
(USDEC, 2005; Walstra et al., 1999). Roller dried milk powder has traditionally been
preferred in making chocolate, but spray drying has become the preferred drying method
in the dairy industry for economic reasons (Keogh et al., 2004).
Processing variables. During processing, there are also a host of factors that
influence the quality of WMP produced, including, milk preheat temperature, adherence
to good manufacturing practices, and spray dryer operating variables. The preheat
temperature of the milk has a major impact on the quality of the resulting WMP (Baldwin
and Ackland, 1991; Baldwin et al., 1991; Christensen et al., 1951; Decker et al., 1951;
Deruyck, 1991; Oldfield et al., 2000; Stapelfeldt et al., 1997a). The widely used heat
treatment for milk being made into WMP is 85-95C for several minutes (Varnam and
Sutherland, 1994), which would result in an undenatured whey protein nitrogen (WPN)
value of less than 4.0 mg /g powder (Baldwin and Ackland, 1991). Nanua et al. (2000)
used heat treatments of 74C for 20 s for low heat WMP and 88C for 15 min for high
heat WMP. Ulberth and Roubicek (1995) used 90C for 60 s in their WMP research.
Baldwin and Ackland (1991) recommended a high (125°C) preheat temperature and a
short holding time (20 s) for good WMP storage stability. McCluskey et al. (1997b)
found good oxidative stability in WMP preheated to 120°C for 20 min, although higher
amounts of cholesterol oxidation products were formed in the process. Baldwin et al.
(1991) concluded that a heat treatment of 95°C for 20 s would give WMP a shelf life of 9
months at 30 ºC. Recently, Birchal et al. (2005) determined optimal settings for several
18
spray drying variables (emulsion feed flow rate of 1.4 kg/h, atomization flow rate of
50,000 rpm, and inlet air temperature or 160 ºC) to produce agglomerated WMP with the
best reconstitution quality. This research was conducted on a pilot scale spray dryer, so
the results may not directly apply to an industrial setting with full scale equipment. A
spray-drying process has been developed that can produce WMP with around 90% free
fat (Koc et al., 2003). Faldt and Sjoholm (1996) found that WMP produced in a pilot-
scale spray dryer had a higher free fat content then WMP from large scale equipment.
They attributed this to the smaller particle size produced by the pilot-scale dryer,
resulting in a greater surface area of fat available for extraction.
Projected Shelf Life
Overview. Some factors that influence shelf-life of WMP include initial milk
quality, processing variables, moisture content, packaging, oxygen exposure, exposure to
light, and storage temperature (Hough et al., 2002; Lloyd et al., 2004; Nielsen et al.,
1997b; Ruckold et al., 2003). The shelf-life of WMP is closely tied to the development
of off-flavors, especially those attributed to lipid oxidation. US WMP is reported to have
a shelf-life of 6-9 months when stored at temperatures less than 27C and relative
humidity less than 65% (USDEC, 2005), while international WMP claims a shelf life of
12 mo (S. Hess, Hershey Foods, personal communication, 2008). Values in the literature
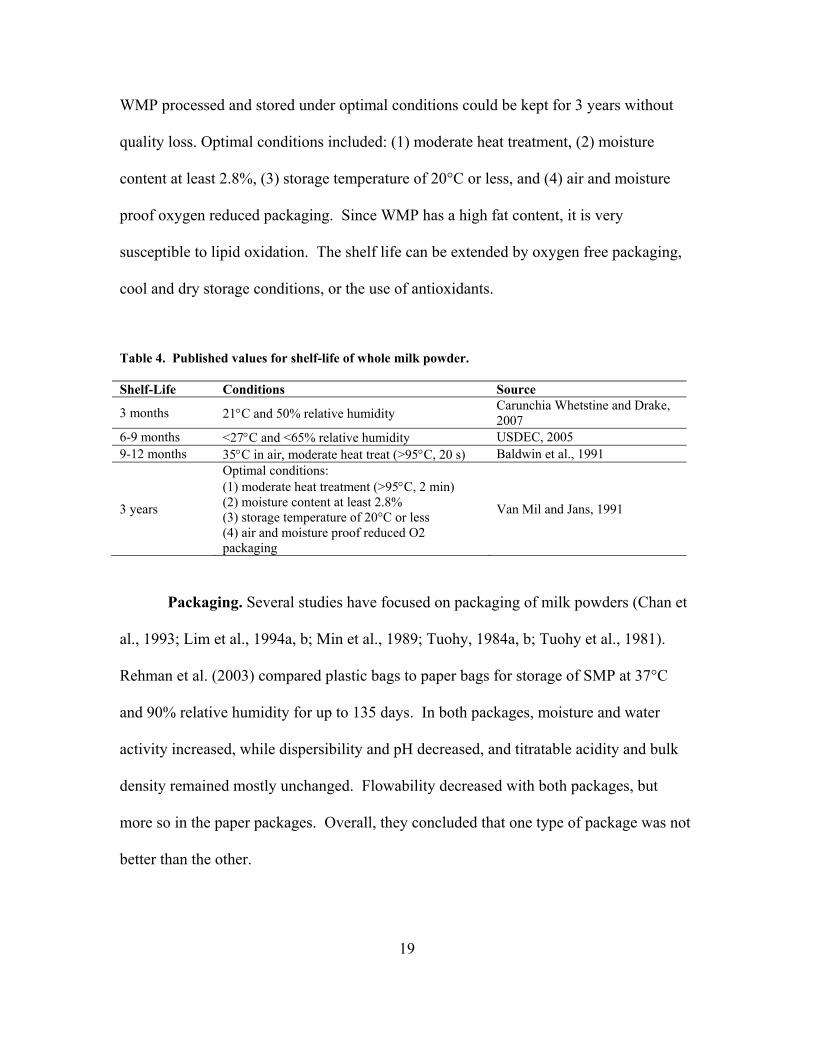
for shelf life of WMP range from 3 months (Carunchia Whetstine and Drake, 2007) to 3
years (Van Mil and Jans, 1991) (Table 4). Baldwin et al. (1991) detected oxidized flavor
in WMP stored in air at 35C after 9-12 months. Van Mil and Jans (1991) reported that
19
WMP processed and stored under optimal conditions could be kept for 3 years without
quality loss. Optimal conditions included: (1) moderate heat treatment, (2) moisture
content at least 2.8%, (3) storage temperature of 20°C or less, and (4) air and moisture
proof oxygen reduced packaging. Since WMP has a high fat content, it is very
susceptible to lipid oxidation. The shelf life can be extended by oxygen free packaging,
cool and dry storage conditions, or the use of antioxidants.
Packaging. Several studies have focused on packaging of milk powders (Chan et
al., 1993; Lim et al., 1994a, b; Min et al., 1989; Tuohy, 1984a, b; Tuohy et al., 1981).
Rehman et al. (2003) compared plastic bags to paper bags for storage of SMP at 37°C
and 90% relative humidity for up to 135 days. In both packages, moisture and water
activity increased, while dispersibility and pH decreased, and titratable acidity and bulk
density remained mostly unchanged. Flowability decreased with both packages, but
more so in the paper packages. Overall, they concluded that one type of package was not
better than the other.
Table 4. Published values for shelf-life of whole milk powder.
Shelf-Life Conditions Source
3 months 21C and 50% relative humidity Carunchia Whetstine and Drake, 2007
6-9 months <27C and <65% relative humidity USDEC, 2005 9-12 months 35C in air, moderate heat treat (>95C, 20 s) Baldwin et al., 1991
3 years
Optimal conditions: (1) moderate heat treatment (>95C, 2 min) (2) moisture content at least 2.8% (3) storage temperature of 20°C or less (4) air and moisture proof reduced O2 packaging
Van Mil and Jans, 1991
20
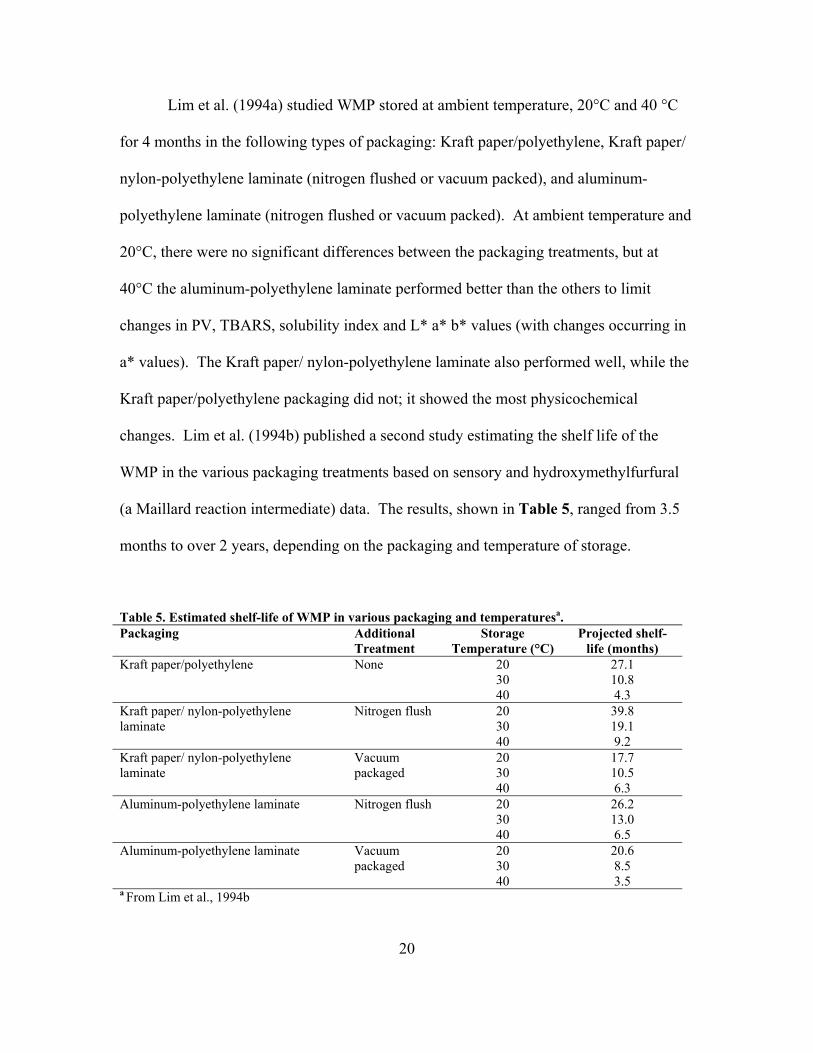
Lim et al. (1994a) studied WMP stored at ambient temperature, 20°C and 40 °C
for 4 months in the following types of packaging: Kraft paper/polyethylene, Kraft paper/
nylon-polyethylene laminate (nitrogen flushed or vacuum packed), and aluminum-
polyethylene laminate (nitrogen flushed or vacuum packed). At ambient temperature and
20°C, there were no significant differences between the packaging treatments, but at
40°C the aluminum-polyethylene laminate performed better than the others to limit
changes in PV, TBARS, solubility index and L* a* b* values (with changes occurring in
a* values). The Kraft paper/ nylon-polyethylene laminate also performed well, while the
Kraft paper/polyethylene packaging did not; it showed the most physicochemical
changes. Lim et al. (1994b) published a second study estimating the shelf life of the
WMP in the various packaging treatments based on sensory and hydroxymethylfurfural
(a Maillard reaction intermediate) data. The results, shown in Table 5, ranged from 3.5
months to over 2 years, depending on the packaging and temperature of storage.
Table 5. Estimated shelf-life of WMP in various packaging and temperaturesa. Packaging Additional
Treatment Storage
Temperature (°C) Projected shelf-
life (months) Kraft paper/polyethylene None 20
30 40
27.1 10.8 4.3
Kraft paper/ nylon-polyethylene laminate
Nitrogen flush 20 30 40
39.8 19.1 9.2
Kraft paper/ nylon-polyethylene laminate
Vacuum packaged
20 30 40
17.7 10.5 6.3
Aluminum-polyethylene laminate Nitrogen flush 20 30 40
26.2 13.0 6.5
Aluminum-polyethylene laminate Vacuum packaged
20 30 40
20.6 8.5 3.5
a From Lim et al., 1994b
21
Numerous storage studies have shown that WMP and cream powder flavor is
better preserved under low oxygen conditions (Andersson and Lingnert, 1998; Coulter,
1947; Hall and Andersson, 1985; Steen, 1977; Van Mil and Jans, 1991). Van Mil and
Jans (1991) concluded that WMP should be made with a moderate heat treatment and a
moisture content of 2.8-5%, then stored at less than 20°C with lowered oxygen levels.
Some research has shown slight benefits from added antioxidants in WMP (Abbot and
Waite, 1962, 1965; Decker and Ashworth, 1951; Findlay and Smith, 1945; Hall and
Andersson, 1985), but this is not a common commercial practice (Dan Meyer, American
Dairy Products Institute, personal communication, 2008).
Ingredient Applications
WMP is a versatile food ingredient that provides calcium and high quality protein
(USDEC, 2005). In the US, over 75% of the WMP produced goes into confectionary
products such as chocolate, with the remainder used in baked goods, dry sauce and soup
mixes, dairy beverages, ice cream, recombined milk, or other uses (Chandan, 1997;
USDEC, 2005). If the WMP used in these applications has off flavors, these flavors may
carry through into the final product and result in consumer complaints. Off-flavor carry-
through was reported by Caudle et al. (2005) for SMP used in yogurt, hot cocoa, and
white chocolate. Wright et al. (2008) also reported that off flavors noted in dried whey
protein could be detected in protein beverages, resulting in decreased consumer
acceptance.
22
Bolenz et al. (2003) made 16 different milk chocolate samples using a variety of
milk ingredients of various free-fat contents, including roller or spray dried WMP, skim
milk powder with anhydrous milk fat, or cream powder. All samples were produced to
meet legal requirements for milk chocolate. Significant differences were observed
between chocolate samples made from different milk ingredients in particle size,
viscosity and descriptive sensory attributes. In consumer testing, the parameters that
were important to consumer liking included small particle size, more intense milky
flavor, and the lack of malty and off-note flavors. Chocolates made with higher free
milkfat had a smaller particle size and were better liked by consumers. Liang and Hartel
(2004) focused on rheology of chocolate made with various milk powders and observed
that the free fat content of the milk powder was the most important property. As free fat
increased, the final chocolate product generally had reduced hardness and better bloom
inhibition. However, the observed instrumental differences did not affect consumer
acceptability, as none of the samples scored significantly different in overall acceptability
by a consumer panel. Currently, most chocolate manufacturers use anhydrous milkfat
and skim milk powder for economic reasons (Steve Hess, Hershey Foods, personal
communication, 2008).
Flavor and Flavor Stability
Flavor
Dairy products with consistent, high quality flavor are essential to maintain
consumer loyalty to a brand (Drake, 2004). Milk powders available on the market exhibit
wide variation in flavor quality (Drake et al., 2003; Kamath et al., 1999; Lloyd et al.,
23
2004). Drake et al. (2003) evaluated several samples of whole milk powder during the
development of a dried dairy ingredients lexicon (standardized descriptive language).
Attributes noted in the samples at various intensities included 9 flavors (cooked,
caramelized, sweet aromatic, milkfat, cereal, fried/fatty/painty, sweet and salty) and a
feeling factor (astringency). During development of the lexicon, one WMP sample also
had a fishy flavor that was not detected in any of the other samples. A review of dairy
flavors, including WMP, was provided by Nursten (1997). Kinsella et al. (1967)
reviewed the flavor of milk fat, and compiled a list of volatile compounds associated with
oxidized, cardboard, oily, painty, fishy, grassy, metallic, and other flavors associated with
oxidized milkfat, along with threshold values for these compounds in 3.8% milk.
Before the milk arrives at the processing plant, many variables can affect its
flavor quality, including the diet of the herd, season of the year, and microbiological
quality. The diet that a cow eats will affect the flavor of the milk it produces (Al-Mabruk
et al., 2004; Bendall, 2001; Coulon and Priolo, 2002; Croissant et al., 2007; Fearon et al.,
1998; Mounchili et al., 2004; Palmquist et al., 1993; Randby et al., 1999; Toso et al.,
2002; Urbach, 1990). Several researchers have found that the season of the year affects
WMP quality and stability (Baldwin and Ackland, 1991; Baldwin et al., 1991; Biolatto et
al., 2007; Negri et al., 2004; Steen, 1977; Van Mil and Jans, 1991). Steen (1977)
collected WMP from 2 manufacturing facilities in Denmark over a year period to observe
the effect of season on a number of quality attributes, including physical properties,
flavor, and storage stability up to 24 mo. The thiobarbituric acid (TBA) value, a measure
of lipid oxidation, was higher in the summer, which was consistent with Biolatto and
24
others (2007) who found that straight chain aldehydes were higher in WMP produced
during the spring and summer compared to fall and winter. They explained that the
variation was likely due to the feed of the cows, which is consistent with Toso and others
(2002), who reported higher levels of straight chain aldehydes in raw milk from cows fed
grass silage, compared to hay or maize silage. Van Mil and Jans (1991) also found that
WMP produced in the spring was less stable and decreased in flavor score more rapidly
than WMP produced in other seasons. The microbiological profile of raw milk can also
affect the quality of WMP made from it (Celestino et al., 1997; de Oliveira et al., 2000).
Ipsen and Hansen (1988) found that high coliform counts in raw milk were detrimental to
the flavor of WMP stored for a year.
Storage conditions also have a major impact on flavor of WMP. The two main
reactions that generate off-flavors in WMP during storage are lipid oxidation and
Maillard browning. Lipid oxidation occurs when oxygen reacts with lipids to form
hydroperoxides, which react further to produce aldehydes and ketones, contributing off
flavors to the WMP. Lipid oxidation produces tallowy, grassy, metallic, cardboard,
fatty/fryer oil, and painty flavors in WMP (Carunchia Whetstine and Drake, 2007; Hall
and Lingnert, 1984; Walstra et al., 1999). Control of lipid oxidation is of concern from a
quality as well as a safety standpoint, as McCluskey et al. (1997a) found a positive
correlation (p<0.001) between lipid and cholesterol oxidation products, which have been
associated with adverse health effects (Chan et al., 1993).
Hall and Andersson (1985) studied the formation kinetics of volatile compounds
in WMP containing various antioxidants and stored in an atmosphere of air or nitrogen
25
for 84 weeks. Many reactions for formation of straight chain aldehydes were zero order
(linear); a couple were first order (exponential), with the remainder as mixed models.
Formation of other compounds (2-ketones, Strecker aldehydes, alkyl furans, sulfur
compounds, and hydrocarbons) best fit a zero order model. The storage atmosphere
affected the formation of Strecker aldehydes and alkyl furans, with higher formation rates
in air. In general, dimethyl sulfide increased more rapidly in the nitrogen atmosphere.
Formation of butane and butene was significantly affected by the storage atmosphere and
the addition of antioxidants, but not pentane.
Maillard browning in WMP occurs when a free amino group from the milk
protein reacts with lactose. At ambient temperature, Maillard browning occurs in
powdered dairy products if the moisture content is greater than or equal to 5% (Renner,
1988). A small amount of Maillard browning may be desirable because some Maillard
browning products have antioxidant properties (Benjakul et al., 2005; Calligaris et al.,
2004; Yilmaz and Toledo, 2005) and produce desirable aromas and flavor if at low
concentrations (Renner, 1988). A large amount of Maillard browning will adversely
affect the protein quality as lysine becomes biologically unavailable (Renner, 1988). Van
Mil and Jans (1991) observed minimal loss of lysine (<2%) in 2.4-3.0% moisture WMP
stored for 3 years at 20 ºC and 10-20% loss for the same WMP stored at 35 ºC.
The Maillard reaction can also adversely affect appearance and flavor. The
Maillard reaction produces gluey flavors in WMP (Walstra et al., 1999). Some research
suggests that the Maillard reaction is also influenced by lipid oxidation (Hidalgo and
Zamora, 2008; Hall et al., 1985; Andersson and Lingnert, 1998). A review on dairy

26
powder stability related to lactose crystallization was compiled by Roos (2002). Lactose
in WMP is typically found in the amorphous or glassy state and remains in that state as
long as the lactose remains below the temperature of glass transition (Tg); above Tg,,
lactose crystallizes. Amorphous lactose is very hygroscopic and will begin to crystallize
at increased temperature and relative humidity (Thomas et al., 2004). For amorphous
lactose with a moisture content of 6.8% (corresponding to a relative humidity of 37% and
water activity of 0.27), Tg is around room temperature (Roos, 2002). A more detailed
discussion of Tg has been given by Thomas et al. (2004). The transition from amorphous
to crystalline lactose causes a release of water, resulting in powder caking and Maillard
browning. Also, there is increased oxidation because the milkfat is no longer
encapsulated by the lactose. Thomsen et al. (2005b) reviewed the effects of Maillard
browning on WMP and found that Maillard browning, lactose crystallization and
formation of radicals were closely connected. Stapelfeldt et al. (1997a) stored WMP at 3
different water activities (0.1, 0.2, 0.3) and determined that the quality was best
maintained between a water activity of 0.1 and 0.2. Samples stored at 45°C and 0.3
water activity showed the most Maillard browning. Both 3-methylbutanal and 2-
methylbutanal are flavor compounds produced by the Maillard reaction in milk and
WMP, resulting from Strecker degradation of isoleucine and leucine (Bendall, 2001;
Carunchia Whetstine and Drake, 2007).
Sensory Analysis
Sensory analysis involves using the human senses to evaluate food properties.
Sensory techniques include consumer testing and analytical sensory techniques (Drake,

27
2007). Consumer testing is used to find out how well a particular product is liked or
accepted by the average consumer. Consumer panels typically require large (>50)
numbers of people to get statistically valid data (Man and Jones, 2000; Drake, 2007).
Descriptive analysis is used to document a complete picture of the sensory properties of a
food product from an analytical perspective. Descriptive panels require extensive
training of a small group (generally 6-10) of people (Drake, 2007). Trained panels are
more frequently used in storage studies and flavor research.
Hough et al. (2002) correlated consumer panel data with trained panel scores for
WMP and found that changes in the flavor affected consumer acceptability more than
changes in appearance. Baldwin et al. (1991) produced 16 WMP samples with all
combinations of 4 preheat temperatures and 4 holding times. This experiment was
replicated on 3 occasions to account for variations in season. Samples were stored at
30C in an air atmosphere and were evaluated by descriptive analysis every 3 months
over an 18-month period. Aroma descriptors included cooked, feedy/cabbagey, and
oxidized. Flavor descriptors included cooked, creamy, oxidized, and sweet. Texture
descriptors included astringency and body. Samples with higher heat treatments and
holding times were more intense in cooked aroma and flavor, and feedy/cabbagey aroma.
Oxidized aroma and flavor were minimized by high preheat treatments (125 ºC for 10-
240 s). Several attributes increased during the dairying season, including sweetness,
creaminess, astringency, and body.
Hough et al. (1992) determined the detection and recognition thresholds for the
following flavors in reconstituted WMP: cooked, chalky, feed, flat burnt, bitter, oxidized,

28
lipolysis, salty, acid, and chemical. Andersson and Lingnert (1998) used the following
descriptors for odor and flavor of cream powder: total odor, total flavor, boiled, buttery,
chemical, cardboard. Drake et al. (2003) developed a lexicon for sensory profiling of
dried dairy ingredients, including WMP (Table 6).
Table 6. Reference materials for descriptive sensory analysis of dried dairy ingredients Descriptor Reference Preparation Cooked/sulfurous Heated milk Heat pasteurized skim milk to 85 ºC for 45
min Caramelized/ butterscotch
Autoclaved milk Caramel syrup
Autoclave whole milk at 121 ºC for 30 min Dilute a tablespoon of caramel syrup in 400mL ski milk
Sweet aromatic/ cake mix Pillsbury White cake mix Vanillin
Dilute 5mg of vanillin in skim milk
Cereal/grass-like Breakfast cereals (corn flakes, oat and wheaties)
Soak one cup cereal into three cups milk for 30 min and filter to remove cereals
Barny p-cresol 20 ppm in skim milk Brothy/potato-like Kroger canned white potato
slices Methional
Remove the sliced potatoes from the broth Several drops of 20 ppm methional in methanol in sniffing jars
Animal/gelatin-like/wet dog
Knox-unflavored gelatin Dissolve one bag of gelatin (28g) in two cups of distilled water
Milkfat/lactone Heavy cream Delta dodecalactone
40 ppm on filter paper
Fried fatty/painty (E,E)-2,4-decadienal 2 ppb in skim milk Fishy Fresh fish with skin
Canned tuna juice
Mushroom/metallic Fresh mushroom Slice fresh mushroom in skim milk for 30 min and filter to remove mushroom slices
Papery/cardboard Cardboard paper Soak pieces of cardboard paper in skim milk overnight
Burnt/charcoal Over toasted bread slice Vitamin/rubber Enfamil liquid Polyvisol
vitamins
Diacetyl Diacetyl Diacetyl, 20 ppm on filter paper Earthy/musty Potting soil, odor
reminiscent of damp basement
Sweet taste Sucrose 5% sucrose solution Salty NaCl 2% NaCl solution Sour Citric acid 1% citric acid solution Bitter Caffeine 0.5% caffeine solution Umami Monosodium glutamate 1% MSG in water Astringent Tea Soak 6 tea bags in water for 10 min From Drake et al. (2003)
29
Instrumental Analysis
Overview. Instrumental analysis techniques are used to characterize the volatile
compounds in a food that affect its flavor. These compounds can be separated, identified,
and quantified using gas chromatography (GC). GC analysis became available in the
1950’s and became more prevalent in flavor research in the 1960’s, which has expanded
and improved since that time (Harper, 2007). A number of extraction and concentration
techniques have been developed to prepare samples for GC, including direct solvent
extraction (DSE) with solvent assisted flavor extraction (SAFE), static and dynamic
headspace, supercritical fluid extraction (SFE), and solid-phase microextraction (SPME).
Further detail about these and other techniques may be obtained from Mariaca and Bosset
(1997) who reviewed instrumental analysis techniques for volatile flavor components in
milk and dairy products.
It is important to note that no single extraction technique will obtain all of the
volatile compounds in a food. It is wise to use a combination of techniques if possible, or
to use a technique that will target a compound of interest. Each extraction technique has
advantages and disadvantages. For example, solvent extraction works well for semi-
volatile compounds, but is very time consuming and highly volatile compounds may be
lost or poorly recovered. SPME is a more rapid extraction technique and can extract
highly volatile compounds, but may not extract higher molecular weight volatile
compounds. Kataoka et al. (2000) reviewed the use of solid-phase microextraction
(SPME) in food analysis. Another instrument to analyze volatile compounds is an
30
electronic nose, which has been reviewed by Ampuero and Bosset (2003) in relation to
dairy products.
Once volatile compounds have been extracted from a food, they are injected into a
gas chromatograph to separate the component compounds. Once the compounds have
been separated, they pass through a detector which gives a response corresponding
ideally to the amount of a compound that is present. A
commonly used detector for flavor research is a flame
ionization detector (FID) because it is widely available,
reliable, and inexpensive, with good sensitivity for most
organic compounds (10-100 pg), along with a wide linear
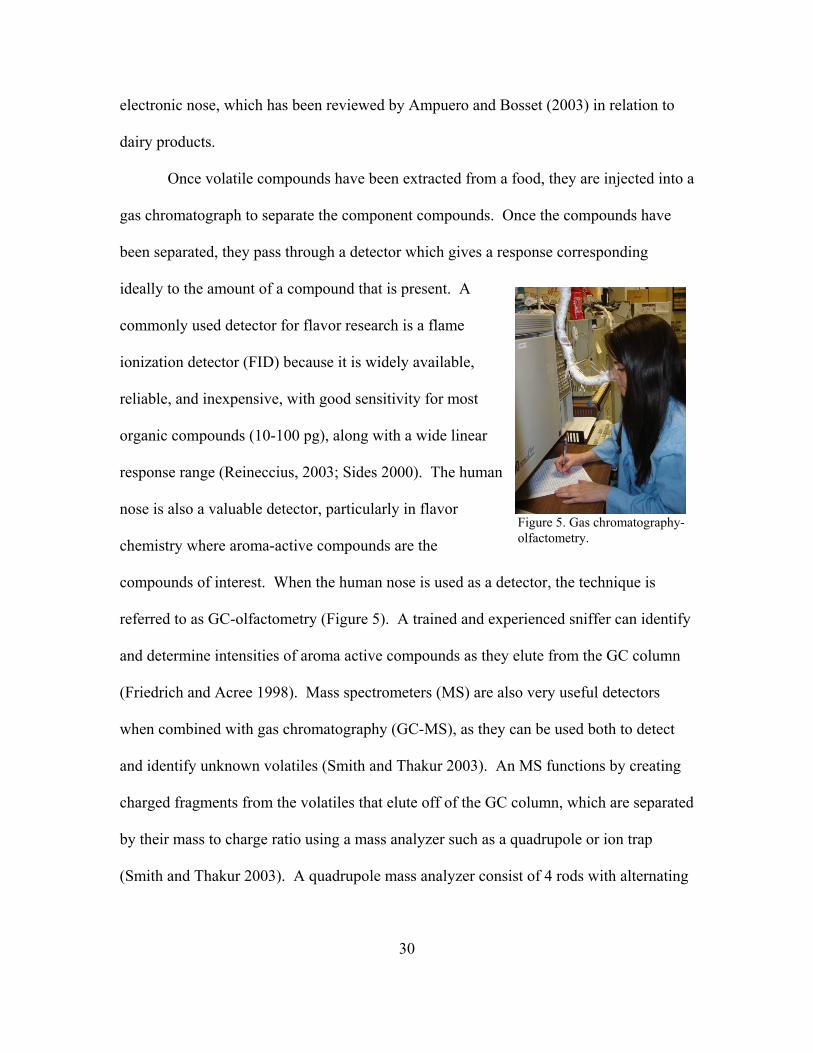
response range (Reineccius, 2003; Sides 2000). The human
nose is also a valuable detector, particularly in flavor
chemistry where aroma-active compounds are the
compounds of interest. When the human nose is used as a detector, the technique is
referred to as GC-olfactometry (Figure 5). A trained and experienced sniffer can identify
and determine intensities of aroma active compounds as they elute from the GC column
(Friedrich and Acree 1998). Mass spectrometers (MS) are also very useful detectors
when combined with gas chromatography (GC-MS), as they can be used both to detect
and identify unknown volatiles (Smith and Thakur 2003). An MS functions by creating
charged fragments from the volatiles that elute off of the GC column, which are separated
by their mass to charge ratio using a mass analyzer such as a quadrupole or ion trap
(Smith and Thakur 2003). A quadrupole mass analyzer consist of 4 rods with alternating
Figure 5. Gas chromatography-olfactometry.
31
currents that allow stable ions to be detected, while unstable ions are pumped away
(Smith and Thakur 2003). With an ion trap mass analyzer, all ions are held within the
mass analyzer by a series of electrodes and the unstable ions are released to the detector
according to their mass to charge ratios (Smith and Thakur 2003).
Three methods to identify volatile compounds include mass spectra, odor
properties, and retention indices. Mass spectrometry results in “fingerprint” spectra of
ion fragments that can be compared with a database of known spectra to identify the
compounds in question. Mass spectral matching of an unknown compound with that of a
known standard is considered the gold standard for compound identification. The aroma
of a compound is also a potentially unique and identifying attribute. Gas
chromatography-olfactometry (GC-O) may be used to characterize and identify aroma-
active compounds and then compare the aromas and retention indices (RIs) of those
compounds with known standards. The third criterion for compound identification is
comparison of RIs with those of known standards. In the absence of mass spectra,
identical aroma properties and RI values on more than one column that match with a
known standard may be considered robust identification. The reason that RI on more
than one column is required (without mass spectra) for compound identification is simply
because multiple compounds may co-elute and have the same RI on a single column, but
this probability is drastically diminished if RI on more than one column is evaluated. The
RI (van Den Dool and Kratz, 1963) adjusts the retention time of a compound relative to
the retention times of a standard alkane series. This standardized value allows for better
comparison of research conducted in different labs, as retention times will vary

32
depending on the GC conditions used, the columns length, and other factors. RI values
for various aroma-active volatiles are available through the NIST library (National
Institute of Standards and Technology, Gaithersburg, MD) as well as an online database
compiled by Terry Acree & Heinrich Arn: http://www.flavornet.org/flavornet.html.
Relating sensory to instrumental analysis. Some research has performed both
sensory and instrumental volatile analyses on WMP (Carunchia Whetstine and Drake,
2007; Hall and Andersson, 1985), which gives a more complete understanding of WMP
flavor. Hall and Andersson (1985) performed multiple regression analysis to determine
which volatile compounds in reconstituted WMP best contributed to various flavor
attributes. A 10-member trained panel rated the following flavor attributes: total
intensity, like cooked milk, sweet, creamy, like whey cheese, like casein, like cardboard,
musty, sourish, green, like mushroom, and flavor acceptance. Twenty-five volatile
compounds were measured quantitatively including straight-chain aldehydes (ethanal,
propanal plus 2-propanone, n-butanal, n-pentanal, n-hexanal, n-heptanal, n-nonanal),
ketones (2-butanone, 2-pentanone, 2-heptanone, 2-nonanone, 2,3-butandione), Strecker
aldehydes (2-methyl propanal, 3-methyl butanal, 2-methyl butanal), furans (2-methyl
furan, 2-ethyl furan), sulfur compounds (methyl mercapatan, carbon disulfide, dimethyl
sulfide, dimethyl disulfide), and hydrocarbons (n-butane, n-pentane, n-heptane). Of
these, the following were selected as having an odor threshold high enough to contribute
to the flavor of reconstituted WMP: ethanal, propanal plus 2-propanone, n-butanal, n-
pentanal, n-hexanal, n-heptanal, n-nonanal, 2,3-butandione, 2-methyl propanal, 3-methyl

33
butanal, 2-methyl butanal, methyl mercaptan, carbon disulfide, dimethyl sulfide, and
dimethyl disulfide.
Carunchia Whetstine and Drake (2007) studied flavor volatiles and sensory
characteristics of WMP stored for 24 months using a combination of descriptive sensory
analysis and GC-O. They found 65 aroma active volatile compounds in WMP. Many of
the volatiles were lipid oxidation products with fatty aromas, which increased during
storage. This corresponded well with their descriptive analysis results, which showed an
increase in fatty/fryer oil flavor during storage.
Conclusions
Although much research has been conducted on the flavor and stability of WMP,
the food industry continues to have quality and flavor problems with WMP. These
problems are major issues for food companies who use WMP as a food ingredient.
Additional research may hold the answers to producing a more consistent quality WMP
with good flavor stability for use in the food industry. The objectives of this dissertation
are to (1) survey flavor variability and flavor stability of US WMP stored up to 1 y and to
(2) evaluate the influence of nitrogen flushing and storage temperature on flavor and
shelf-life of WMP.
34
References
Abbot, J. and R. Waite. 1962. Effect of antioxidants on keeping quality of whole milk powder.1. Flavones, gallates, butylhydroxyanisole and nordihydroguaiaretic acid. J. Dairy Res. 29(1):55-61. Abbot, J. and R. Waite. 1965. Effect of antioxidants on keeping quality of whole milk powder. 2. Tocopherols. J. Dairy Res. 32(2):143-146. ADPI. 2002. Standards for grades of dry milks, including methods of analysis (Bulletin 916). American Dairy Products Institute, Elmhurst, Ill. Al-Mabruk, R. M., N. F. G. Beck, and R. J. Dewhurst. 2004. Effects of silage species and supplemental vitamin E on the oxidative stability of milk. J. Dairy Sci. 87(2):406-412. Ampuero, S. and J. O. Bosset. 2003. The electronic nose applied to dairy products: a review. Sensors and Actuators B-Chemical 94(1):1-12. Andersson, K. and H. Lingnert. 1998. Influence of oxygen concentration on the flavour and chemical stability of cream powder. Food Science and Technology-Lebensmittel-Wissenschaft & Technologie 31(3):245-251. Anema, S. G. and R. J. Lloyd. 1999. Analysis of whey protein denaturation: a comparative study of alternative methods. Milchwissenschaft-Milk Science International 54(4):206-210. Baldwin, A. J. and J. D. Ackland. 1991. Effect of preheat treatment and storage on the properties of whole milk powder - changes in physical and chemical-properties. Neth. Milk Dairy J. 45(3):169-181. Baldwin, A. J., H. R. Cooper, and K. C. Palmer. 1991. Effect of preheat treatment and storage on the properties of whole milk powder - changes in sensory properties. Neth. Milk Dairy J. 45(2):97-116. Baucke, A. G. and D. F. Newstead. 1972. Preheat treatments and their effect on the whey protein nitrogen index. Pages 60-62 in New Zealand Dairy Research Institute 44th Annual Report. New Zealand Dairy Research Institute, Palmerston North. Bendall, J. G. 2001. Aroma compounds of fresh milk from New Zealand cows fed different diets. J. Agric. Food Chem. 49(10):4825-4832. Benjakul, S., W. Lertittikul, and F. Bauer. 2005. Antioxidant activity of Maillard reaction products from a porcine plasma protein-sugar model system. Food Chem. 93(2):189-196.
35
Biolatto, A., G. Grigioni, M. Irurueta, A. M. Sancho, M. Taverna, and N. Pensel. 2007. Seasonal variation in the odour characteristics of whole milk powder. Food Chem. 103(3):960-967. Birchal, V. S., M. L. Passos, G. R. S. Wildhagen, and A. S. Mujumdar. 2005. Effect of spray-dryer operating variables on the whole milk powder quality. Drying Technol. 23(3):611-636. Bolenz, S., T. Thiessenhusen, and R. Schape. 2003. Influence of milk components on properties and consumer acceptance of milk chocolate. European Food Res. Technol. 216(1):28-33. Buma, T. J. 1971a. Free fat in spray-dried whole milk. 2. Evaluation of methods for determination of free-fat content. Neth. Milk Dairy J. 25(1):42-52. Buma, T. J. 1971b. Free fat in spray-dried whole milk. 4. Significance of free fat for other properties of practical importance. Neth. Milk Dairy J 25(2):88-106. Buma, T. J. 1971c. Free fat in spray-dried whole milk.1. General introduction and brief review of literature. Neth. Milk Dairy J. 25(1):33-41. Buma, T. J. 1971e. Free fat in spray-dried whole milk. 3. Particle Size - its estimation, influence of processing parameters and its relation to free-fat content. Neth. Milk Dairy J. 25(1):53-87. Buma, T. J. 1971g. Free fat in spray-dried whole milk. 5. Cohesion - determination, influence of particle size, moisture content and free-fat content. Neth. Milk Dairy J. 25(2):107-122. Buma, T. J. 1971h. Free fat in spray-dried whole milk. 8. Relation between free-fat content and particle porosity of spray-dried whole milk. Neth. Milk Dairy J. 25(2):123-140. Buma, T. J. 1971i. Free fat in spray-dried whole milk. 9. Size distribution of fat globules in concentrated milk and in spray-dried milk. Neth. Milk Dairy J. 25(3):151-158. Buma, T. J. 1971j. Free fat in spray-dried whole milk.10. Final report with a physical model for free fat in spray-dried milk. Neth. Milk Dairy J. 25(3):159-174. Buma, T. J., H. K. C. Vanderveen, and R. Weerstra. 1977. Seasonal-variation of color of milk. Neth. Milk Dairy J. 31(1):31-39. Calligaris, S., L. Manzocco, M. Anese, and M. C. Nicoli. 2004. Effect of heat-treatment on the antioxidant and pro-oxidant activity of milk. Int. Dairy J. 14(5):421-427.
36
Caric, M. and M. Kalab. 1987. Effects of drying techniques on milk powders quality and microstructure - A review. Food Microstructure 6(2):171-180. Carunchia Whetstine, M. E. and M. A. Drake. 2007. The flavor and flavor stability of skim and whole milk powders. Pages 217-251 in Flavor of Dairy Products. K. R. Cadwallader, M. A. Drake, and R. McGorrin, ed. ACS Publishing, Washington, DC. Caudle, A. D., Y. Yoon, and M. Drake. 2005. Influence of flavor variability in skim milk powder on consumer acceptability of ingredient applications. Journal of Food Science 70(7):S427-S431. Celestino, E. L., M. Iyer, and H. Roginski. 1997. The effects of refrigerated storage of raw milk on the quality of whole milk powder stored for different periods. Int. Dairy J. 7(2-3):119-127. CFR. Code of Federal Regulations. 2008. Title 21, Part 131.147. http://www.gpoaccess.gov/CFR/INDEX.HTML. Accessed Aug 30, 2008. Chan, S. H., J. I. Gray, E. A. Gomaa, B. R. Harte, P. M. Kelly, and D. J. Buckley. 1993. Cholesterol oxidation in whole milk powders as influenced by processing and packaging. Food Chem. 47(4):321-328. Chandan, R. 1997. Dairy Based Ingredients. Eagen Press, St. Paul, Minnesota. Christensen, L. J., C. W. Decker, and U. S. Ashworth. 1951. The keeping quality of whole milk powder. 1. The effect of preheat temperature of the milk on the development of rancid, oxidized and stale flavors with different storage conditions. J. Dairy Sci. 34(5):404-411. Clydesdale, F. M. 1978. Colorimetry-methodology and applications. Crit. Rev. Food Sci. Nutr. 10(3):243-301. CODEX. Codex Alimentarius. (1999). Codex Stan 207-1999. http://www.codexalimentarius.net/download/standards/333/CXS_207e.pdf. Accessed Aug 22, 2008. Contarini, G., M. Povolo, R. Leardi, and P. M. Toppino. 1997. Influence of heat treatment on the volatile compounds of milk. J. Agric. Food Chem. 45(8):3171-3177. Coulon, J. B. and A. Priolo. 2002. Sensory properties of meat and dairy products are affected by the forages consumed by the animals. Productions Animales. 15(5):333-342.

37
Coulter, S. 1947. The keeping quality of dry whole milk spray dried in an atmosphere of an inert gas. J. Dairy Sci. 995-1002. Croissant, A. E., S. P. Washburn, L. L. Dean, and M. A. Drake. 2007. Chemical properties and consumer perception of fluid milk from conventional and pasture-based production systems. J. Dairy Sci. 90:4942-4953. de Oliveira, C. A. F., L. Mestieri, M. V. Santos, J. F. G. Moreno, A. Spers, and P. M. L. Germano. 2000. Effect of microbiological characteristics of raw milk on the quality of whole milk powder. Brazil. J. Micro. 31(2):95-98. Decker, C. W. and U. S. Ashworth. 1951. The keeping quality of whole milk powder. 3. The use of antioxidants-ascorbic acid and sodium citrate. J. Dairy Sci. 34(7):633-640. Decker, C. W., U. S. Ashworth, and L. J. Christensen. 1951. The keeping quality of whole milk powder. 2. The effect of preheat temperatures on the development of peroxides and ferricyanide-reducing groups under different storage conditions. J. Dairy Sci. 34(5):412-418. Deruyck, H. 1991. Avoiding white flecks during the production of instant whole milk powder. Landbouwtijdschrift-Revue De L Agriculture. 44(4):751-762. Drake, M. A. 2004. ADSA Foundation Scholar Award: Defining dairy flavors. J. Dairy Sci. 87(4):777-784. Drake, M. A., Y. Karagul-Yuceer, K. R. Cadwallader, G. V. Civille, and P. S. Tong. 2003. Determination of the sensory attributes of dried milk powders and dairy ingredients. J. Sensory Stud. 18(3):199-216. Drake, M.A. 2007. Sensory analysis of dairy foods. J. Dairy Sci. 90:4925-4937. Elias, R. J., S. S. Kellerby, and E. A. Decker. 2008. Antioxidant activity of proteins and peptides. Crit. Rev. Food Sci. Nutr. 48(5):430-441. Ellis, G. P. 1959. The Maillard Reaction. Advances in Carbohydrate Chemistry. 14:63-134. Faldt, P. and I. Sjoholm. 1996. Characterization of spray-dried whole milk. Milchwissenschaft-Milk Science International. 51(2):88-92. Fearon, A. M., C. S. Mayne, and C. T. Charlton. 1998. Effect of naked oats in the dairy cow's diet on the oxidative stability of the milk fat. J. Sci. Food Agric. 76(4):546-552.
38
Findlay, J. D. and J. A. B. Smith. 1945. Experiments on the use of antioxidants in spray-dried whole-milk powder. J. Dairy Res. 14(1-2):165-175. Fitzpatrick, J. J., T. Iqbal, C. Delaney, T. Twomey, and M. K. Keogh. 2004. Effect of powder properties and storage conditions on the flowability of milk powders with different fat contents. J. Food Engin. 64(4):435-444. Friedrich, J. E. and T. E. Acree. 1998. Gas chromatography olfactometry (GC/O) of dairy products. Int. Dairy J. 8(3):235-241. Greenbank, G. R. 1948. The oxidized flavor in milk and dairy products - A review. J. Dairy Sci. 31(10):913-933. Grigioni, G., A. Biolatto, M. Irurueta, A. M. Sancho, R. Paez, and N. Pensel. 2007. Color changes of milk powder due to heat treatments and season of manufacture. Ciencia Y Tecnologia Alimentaria. 5:335-339. Hall, G. and J. Andersson. 1985. Flavor changes in whole milk powder during storage. Relationships between flavor properties and volatile compounds.3. Relationships between flavor properties and volatile compounds. J. Food Qual. 7(4):237-253. Hall, G. and H. Lingnert. 1984. Flavor changes in whole milk powder during storage. 1. Odor and flavor profiles of dry milk with additions of antioxidants and stored under air or nitrogen. J. Food Qual. 7(2):131-151. Harland, H. A. and U. S. Ashworth. 1947. A rapid method for estimation of whey proteins as an indication of baking quality of nonfat dry-milk solids. Food Res. 12(3):247-251. Harper, W. 2007. Sixty Years of research associated with flavor in dairy foods. Pages 3-19 in Flavor of Dairy Products. M. D. K. Cadwallader, and R. McGorrin, ed. ACS Publishing, Washington, DC. Havemose, M. S., M. R. Weisbjerg, W. L. P. Bredie, H. D. Poulsen, and J. H. Nielsen. 2006. Oxidative stability of milk influenced by fatty acids, antioxidants, and copper derived from feed. J. Dairy Sci. 89(6):1970-1980. Hidalgo, F. J. and R. Zamora. 2008. Food anoxia and the formation of either flavor or toxic compounds by amino acid degradation initiated by oxidized lipids. Pages 25-29 in Maillard Reaction: Recent Advances in Food and Biomedical Sciences. Vol. 1126. Annals of the New York Academy of Sciences. Hough, G., E. Martinez, and T. Barbieri. 1992. Sensory thresholds of flavor defects in reconstituted whole milk powder. J. Dairy Sci. 75(9):2370-2374.
39
Hough, G., R. H. Sanchez, G. G. de Pablo, R. G. Sanchez, S. C. Villaplana, A. M. Gimenez, and A. Gambaro. 2002. Consumer acceptability versus trained sensory panel scores of powdered milk shelf-life defects. J. Dairy Sci. 85(9):2075-2080. IDF. 1979. Standard 087:1979 - Instant dried milk - Determination of the dispersibility & wettability. International Dairy Federation, Brussels, Belgium. IDF. 1991. Standard 74A:1991 - Anhydrous milkfat - Determination of peroxide value. International Dairy Federation, Brussels, Belgium. Ipsen, R. and P. S. Hansen. 1988. Factors affecting the storage stability of whole milk powder. in Report No. 274. Statens Mejeriforsøg, Hillerød, Denmark. Jouppila, K. and Y. H. Roos. 1994. Water sorption and time-dependent phenomena of milk powders. J. Dairy Sci. 77(7):1798-1808. Kamath, A., R. Ravi, and D. Rajalakshmi. 1999. Sensory profiling and positioning of commercial samples of milk powder. J. Sens. Stud. 14(3):303-319. Kataoka, H., H. L. Lord, and J. Pawliszyn. 2000. Applications of solid-phase microextraction in food analysis. J. Chromat. A 880(1-2):35-62. Kelly, P. M. 2006. Innovation in milk powder technology. Int. J. Dairy Technol. 59(2):70-75. Keogh, K., C. Murray, J. Kelly, and B. O'Kennedy. 2004. Effect of the particle size of spray-dried milk powder on some properties of chocolate. Lait. 84(4):375-384. Kim, E. H. J., X. D. Chen, and D. Pearce. 2002. Surface characterization of four industrial spray-dried dairy powders in relation to chemical composition, structure and wetting property. Colloids and Surfaces B-Biointerfaces 26(3):197-212. Kim, E. H. J., X. D. Chen, and D. Pearce. 2003. On the mechanisms of surface formation and the surface compositions of industrial milk powders. Drying Technol. 21(2):265-278. Kim, E. H. J., X. D. Chen, and D. Pearce. 2005. Melting characteristics of fat present on the surface of industrial spray-dried dairy powders. Colloids and Surfaces B-Biointerfaces. 42(1):1-8. Kinsella, J. E., S. Patton, and P. S. Dimick. 1967. Flavor potential of milkfat – a review of its chemical nature and biochemical origin. J. Amer. Oil Chem. Soc. 44(7):449-454.
40
Koc, A. B., P. H. Heinemann, and G. R. Ziegler. 2003. A process for increasing the free fat content of spray-dried whole milk powder. J. Food Sci. 68(1):210-216. Kuramoto, S., R. Jenness, S. T. Coulter, and R. P. Choi. 1959. Standardization of the harland-ashworth test for whey protein nitrogen. J. Dairy Sci. 42(1):28-38. Liang, B. and R. W. Hartel. 2004. Effects of milk powders in milk chocolate. J. Dairy Sci. 87(1):20-31. Liang, J. H. 2000. Kinetics of fluorescence formation in whole milk powders during oxidation. Food Chem. 71(4):459-463. Lim, S. D., K. S. Kim, D. J. Park, T. S. Kang, and N. H. Lee. 1994a. Effects of packaging conditions on the quality of whole milk powder. I. Changes in physico-chemical properties during storage. Korean J. Anim. Sci. 36:90-99. Lim, S. D., K. S. Kim, W. M. Park, D. J. Park, and T. S. Kang. 1994b. Effects of packaging conditions on the quality of whole milk powder. II. The shelf-life prediction of whole milk powder by packaging conditions. Korean J. Anim. Sci. 36:90-99. Lloyd, M. A., J. Zou, H. Farnsworth, L. V. Ogden, and O. A. Pike. 2004. Quality at time of purchase of dried milk products commercially packaged in reduced oxygen atmosphere. Journal of Dairy Science 87(8):2337-2343. Man, D. and A. Jones. 2000. Shelf-Life Evaluation of Foods. Page 272. 2nd ed. Aspen Publishers, Gaithersburg, MD. Manji, B. and Y. Kakuda. 1987. Determination of whey-protein denaturation in heat-processed milks - comparison of 3 methods. J. Dairy Sci. 70(7):1355-1361. Mariaca, R. and J. O. Bosset. 1997. Instrumental analysis of volatile (flavour) compounds in milk and dairy products. Lait. 77(1):13-40. McCluskey, S., J. F. Connolly, and R. Devery. 1997a. Lipid and cholesterol oxidation in whole milk powder during processing and storage. J. Food Sci. 62(Mar/Apr):331-337. McCluskey, S., J. F. Connolly, R. Devery, B. Obrien, J. Kelly, D. Harrington, and C. Stanton. 1997b. Lipid and cholesterol oxidation in whole milk powder during processing and storage. J. Food Sci. 62(2):331-337. Min, D. B., S. H. Lee, and J. B. Lindamood. 1989. Effect of packaging conditions on the flavor stability of dry whole milk. J. Food Sci. 54(Sept/Oct):1222-1224, 1245.

41
Morales, F. J. and S. Jimenez-Perez. 1998. Study of hyroxymethylfufural formation from acid degradation of the Amadori product in milk resembling systems. J. Agric. Food Chem. 46(10):3885-3890. Mounchili, A., J. J. Wichtel, I. R. Dohoo, G. P. Keefe, and L. J. Halliday. 2004. Risk factors for milk off-flavours in dairy herds from Prince Edward Island, Canada. Preventative Vet. Med. 64(2-4):133-145. Muir, D. D. 1996. The shelf-life of dairy products. 3. Factors influencing intermediate and long life dairy products. J. Society Dairy Technol. 49(3):67-72. Nanua, J. N., J. U. McGregor, and J. S. Godber. 2000. Influence of high-oryzanol rice bran oil on the oxidative stability of whole milk powder. J. Dairy Sci. 83(11):2426-2431. Negri, L. M., M. S. Chavez, M. A. Taverna, A. L. Cuatrin, and A. C. Rubiolo. 2004. Note: The effect of silo milk composition parameters on heat stability of whole milk powder. Food Sci. Technol. Int. 10(6):415-420. Newstead, D. F. and J. M. Headifen. 1981. A reappraisal of the method for estimation of the peroxide value of fat in whole milk powder. New Zealand J. Dairy Sci. Technol. 16(1):13-18. Nielsen, B. R., H. Stapelfeldt, and L. H. Skibsted. 1997a. Differentiation between 15 whole milk powders in relation to oxidative stability during accelerated storage: Analysis of variance and canonical variable analysis. Int. Dairy J. 7(8-9):589-599. Nielsen, B. R., H. Stapelfeldt, and L. H. Skibsted. 1997b. Early prediction of the shelf-life of medium-heat whole milk powders using stepwise multiple regression and principal component analysis. Int. Dairy J. 7(5):341-348. Nielsen, N. S., M. Timm-Heinrich, and C. Jacobsen. 2003. Comparison of wet-chemical methods for determination of lipid hydroperoxides. J. Food Lipids. 10(1):35-50. Nijdam, J. J. and T. A. G. Langrish. 2005. An investigation of milk powders produced by a laboratory-scale spray dryer. Drying Technol. 23(5):1043-1056. Nursten, H. E. 1997. The flavour of milk and dairy products .1. Milk of different kinds, milk powder, butter and cream. Int. J. Dairy Technol. 50(2):48-56. Oldfield, D. J., C. M. Teehan, and P. M. Kelly. 2000. The effect of preheat treatment and other process parameters on the coffee stability of instant whole milk powder. Int. Dairy J. 10(9):659-667.
42
Palmquist, D. L., A. D. Beaulieu, and D. M. Barbano. 1993. Feed and Animal Factors Influencing Milk-Fat Composition. J. Dairy Sci. 76(6):1753-1771. Pizzoferrato, L., P. Manzi, and V. Vivanti. 1998. Maillard Reaction in Milk-Based Foods: Nutritional Consequences. J. Food Prot. 61(2):235-239. Pyenson, H. and P. H. Tracy. 1946. A spectrophotometric study of the changes in peroxide value of spray dried whole milk powder during storage. J. Dairy Sci. 29(1):1-12. Randby, A. T., I. Selmer-Olsen, and L. Baevre. 1999. Effect of ethanol in feed on milk flavor and chemical composition. J. Dairy Sci. 82(2):420-428. Shakeel Ur, R., N. Y. Farkye, and A. A. Schaffner. 2003. The effect of multiwall Kraft paper or plastic bags on physico-chemical changes in milk powder during storage at high temperature and humidity. International Journal Of Dairy Technology 56(1):12-16. Reineccius, G. 2003. Gas Chromatography. Pages 479-499 in Food Analysis. 3rd ed. S. Nielsen, ed. Kluwer Academic/Plenum Publishers, New York. Renner, E. 1988. Storage stability and some nutritional aspects of milk powders and ultra high-temperature products at high ambient-temperatures. J. Dairy Res. 55(1):125-142. Ronimus, R. S., A. Rueckert, and H. W. Morgan. 2006. Survival of thermophilic spore-forming bacteria in a 90(+) year old milk powder from Ernest Shackelton's Cape Royds Hut in Antarctica. Journal of Dairy Research 73(2):235-243. Roos, Y. H. 2002. Importance of glass transition and water activity to spray drying and stability of dairy powders. Lait. 82(4):475-484. Ruckold, S., H. D. Isengard, J. Hanss, and K. H. Grobecker. 2003. The energy of interaction between water and surfaces of biological reference materials. Food Chem. 82(1):51-59. Sanderson, W. 1970. Determination of undenatured whey protein nitrogen in skim milk powder by dye binding. New Zealand J. Dairy Sci. Technol. 5:46-48. Shakeel Ur, R., N. Y. Farkye, and A. A. Schaffner. 2003. The effect of multiwall Kraft paper or plastic bags on physico-chemical changes in milk powder during storage at high temperature and humidity. Int. J. Dairy Technol. 56(1):12-16. Sides, A., K. Robards, and S. Helliwell. 2000. Developments in extraction techniques and their application to analysis of volatiles in foods. Trac-Trends in Analytical Chemistry 19(5):322-329.
43
Smith, J. S. and R. A. Thakur. 2003. Mass spectrometry. Pages 423-433 in Food Analysis. 3rd ed. S. Nielsen, ed. Kluwer Academic/Plenum Publishers, New York. Stapelfeldt, H., B. R. Nielsen, and L. H. Skibsted. 1997a. Effect of heat treatment, water activity and storage temperature on the oxidative stability of whole milk powder. Int. Dairy J. 7(5):331-339. Stapelfeldt, H., B. R. Nielsen, and L. H. Skibsted. 1997b. Towards use of electron spin resonance spectrometry in quality control of milk powder. Correlation between sensory score of instant whole milk powders and concentration of free radicals and 2-thiobarbituric acid reactive substances. Milchwiss.-Milk Sci. Int. 52(12):682-685. Stashenko, E. E. and J. R. Martinez. 2007. Sampling volatile compounds from natural products with headspace/solid-phase micro-extraction. J. Biochem. Biophysical Meth. 70(2):235-242. Steen, K. 1977. Seasonal variations in the composition of dry whole milk and its keeing qualities under storing. Maelkeritidende 90(5-6):126-140, 152-168. Sørensen, I. H., J. Krag, J. Pisecky, and V. Westergaard. 1978. Analytical Methods for Dry Milk Products. 4th ed. NIRO A/S, Copenhagen. http://www.niro.dk/niro/cmsdoc.nsf/WebDoc/ndkw6dknxs. Accessed Aug 18, 2008. Thomas, M. E. C., J. Scher, S. Desobry-Banon, and S. Desobry. 2004. Milk powders ageing: Effect on physical and functional properties. Crit. Rev. Food Sci. Nutr. 44(5):297-322. Thomsen, M. K., L. Lauridsen, L. H. Skibsted, and J. Risbo. 2005a. Temperature effect on lactose crystallization, Maillard reactions, and lipid oxidation in whole milk powder. J. Agric. Food Chem. 53(18):7082-7090. Thomsen, M. K., L. Lauridsen, L. H. Skibsted, and J. Risbo. 2005b. Two types of radicals in whole milk powder. Effect of lactose crystallization, lipid oxidation, and browning reactions. Journal of Agricultural and Food Chemistry 53(5):1805-1811. Toso, B., G. Procida, and B. Stefanon. 2002. Determination of volatile compounds in cows' milk using headspace GC-MS. J. Dairy Res. 69(4):569-577. Tuohy, J. J. 1984a. Developments in the packaging of whole milk powder. Farm and Food Res. 15(1):7-9. Tuohy, J. J. 1984b. Vacuum packaging and shelf life of whole milk powder. Irish J. Food Sci. Technol. 8(2):147.
44
Tuohy, J. J. and P. M. Kelly. 1989. Effect of direct gas-fired heating on the oxidative stability of whole milk powder. Irish J. Food Sci. Technol. 13(1):33-41. Tuohy, J. J., D. O'Leary, and P. M. Kelly. 1981. Packaging and storage of whole milk powder. Irish J. Food Sci. Technol. 5(1):82. Ulberth, F. and D. Roubicek. 1995. Monitoring of oxidative deterioration of milk powder by headspace gas-chromatography. Int. Dairy J. 5(6):523-531. Urbach, G. 1990. Effect of feed on flavor in dairy foods. J. Dairy Sci. 73(12):3639-3650. USDA-AMS. United States Department of Agriculture-Agricultural Marketing Service. 2001. United States Standards for Grades of Whole Dry Milk. http://www.ams.usda.gov/standards/dry_whole_milk_04-13-01.pd. Accessed Jun 5, 2005. USDA-ARS. United States Department of Agriculture-Agricultural Research Service. 2007. USDA National Nutrient Database for Standard Reference, Release 20. http://www.ars.usda.gov/main/site_main.htm?modecode=12354500. Accessed Aug 18, 2008. USDA-FAS. United States Department of Agriculture-Foreign Agricultural Service. 2008. Dairy: World Markets and Trade July 2008. 25 p. http://www.fas.usda.gov/dlp/circular/2008/dairy_07-2008.pdf. Accessed Jul 22, 2008. USDEC. United States Dairy Export Council. 2005. Reference Manual for US Milk Powders: 2005 Revised Edition. http://www.usdec.org/publications/PubDetail.cfm?ItemNumber=213 Accessed Jul 22, 2008. van Den Dool, H. and P. D. Kratz. 1963. A generalization of retention index system including linear temperature programmed gas-liquid partition chromatography. J. Chromat. 11(4):463-471. Van Mil, P. and J. A. Jans. 1991. Storage stability of whole milk powder: effects of process and storage conditions on product properties. Neth. Milk Dairy J. 45(3):145-167. Varnam, A. and J. Sutherland. 1994. Milk and milk products: technology, chemistry, and microbiology. Chapman and Hall, New York, NY. Vignolles, M. L., R. Jeantet, C. Lopez, and P. Schuck. 2007. Free fat, surface fat and dairy powders: interactions between process and product. A review. Lait. 87(3):187-236.

45
Vuataz, G. 2002. The phase diagram of milk: a new tool for optimising the drying process. Lait. 82(4):485-500. Walstra, P., T. Geurts, A. Noomen, A. Jellema, and M. van Boekel, Eds. 1999. Dairy technology: principles of milk properties and processes. Marcel Dekker, New York. Wehr, H. and J. Frank. 2004. Standard Methods for the Examination of Dairy Products. American Public Health Association, Washington, DC. Westergaard, V. 2005. Milk Powder Technology - Evaporation and Spray Drying. 5th ed. NIRO A/S, Copenhagen. http://www.niro.com/niro/cmsdoc.nsf/WebDoc/ndkw5y4brlLibrary. Accessed Aug 18, 2008. Yilmaz, Y. and R. Toledo. 2005. Antioxidant activity of water-soluble Maillard reaction products. Food Chem. 93(2):273-278. Ziegler, G. R. and J. P. Langiotti. 2003. Grinding spray-dried milk powder near the glass transition temperature. J. Food Process Engin. 26(2):149-160.
46
Flavor Variability and Flavor Stability of US-Produced Whole Milk Powder
M.A. Lloyd1, M.A. Drake1*, and P.D. Gerard2
1Department of Food, Bioprocessing, and Nutrition Sciences Southeast Dairy Foods Research Center
North Carolina State University Raleigh, NC 27695
2Department of Applied Economics and Statistics Clemson University Clemson, SC 29634
*MaryAnne Drake Department of Food, Bioprocessing, and Nutrition Sciences
North Carolina State University Raleigh, NC 27695-7624 Telephone: 919-513-4598
Fax: 919-515-7124 Email: [email protected]
Flavor of Whole Milk Powder… Journal section: Sensory and Food Quality
47
ABSTRACT:
Flavor variability and stability of US-produced whole milk powder (WMP) are
important parameters for maximizing quality and global competitiveness of this
commodity. This study characterized flavor and flavor stability of domestic WMP.
Freshly produced (<1 mo) WMP was collected from 4 US production facilities 5 times
over a 1 y period. Each sample was analyzed initially and every 2 mo for sensory profile,
volatiles, color, water activity, and moisture through 12 mo storage. The following
volatiles were quantified using solid phase microextraction (SPME) with gas
chromatography/mass-spectrometry: dimethyl sulfide, 2-methylbutanal, 3-methylbutanal,
hexanal, 2-heptanone, heptanal, 1-octen-3-ol, octanal, 3-octen-2-one, and nonanal.
Multiple linear regression with backwards elimination was applied to generate equations
to predict grassy and painty flavors based on selected volatiles. All WMP were between
2-3% moisture and 0.11-0.25 water activity initially. WMP varied in initial flavor profiles
with varying levels of cooked, milkfat, and sweet aromatic flavors. During storage,
grassy and painty flavors developed, while sweet aromatic flavor intensities decreased.
At 12 mo storage, all WMP displayed grassy and painty flavors. Painty and grassy
flavors were confirmed by increased levels (p<0.05) of lipid oxidation products such as
hexanal, heptanal, and octanal. Hexanal, 2-heptanone, 1-octen-3-ol and nonanal
concentrations were best predictors of grassy flavor (r=0.62, R2=0.38, p<0.0001) while
hexanal, 2-methylbutanal, 3-methylbutanal, octanal, and 3-octen-2-one concentrations
were best predictors of painty flavor (r=0.78, R2=0.61, p<0.0001). These results provide
48
baseline information to determine specific factors that can be controlled to optimize US
WMP flavor and flavor stability.
Key words: dairy, flavor, storage, volatiles, dry whole milk
49
Introduction
In recent years, demand for dairy products has increased on the world market
(Wiley 2007; USDEC 2008). In 2007, over 9.5% of US dairy production (on a total
solids basis) was exported, which is a significant increase from the 5% exported in 2002
(USDEC 2007). The US is the top producer of skim milk powder (SMP) worldwide,
with 656,000 metric tons produced in 2006, representing approximately 21% of world
production; whole milk powder production was 14,000 metric tons in 2006, accounting
for less than 1% of world production (USDA-FAS 2008). As of 2006, close to 44% of
US-produced SMP and 7% of WMP were exported; current forecasts predict increased
production and export of both of these commodities (USDA-FAS 2008). Most (78.1%)
WMP in the US goes into confectionary products such as chocolate, with the remainder
used in dairy products (8%), dry sauce and soup mixes (6.5%), baked goods (4.8%),
retail/home (0.7%), institutions (0.2%), meats (0.2%), soups (0.4%) and animal feed
(1.1%) (USDEC 2005).
Milk and WMP flavor and stability can be influenced by animal feed (Croissant
and others 2007; Urbach 1990; Toso and others 2002; Havemose and others 2006; Shipe
and others 1978), season (Baldwin and others 1991; Biolatto and others 2007; Steen
1977; van Mil and Jans 1991) microbiological quality (de Oliveira and others 2000;
Shipe and others 1978), storage time before drying (Celestino and others 1997), heat
treatment and other processing conditions (Baldwin and Ackland 1991; Stapelfeldt and
others 1997; van Mil and Jans 1991; Schuck 2002; Birchal and others 2005), air pollution
(Kurtz and others 1969), and storage conditions, including water activity, moisture,
50
packaging, light and temperature (Stapelfeldt and others 1997; Hall and others 1985; Hall
and Andersson 1985; Van Mil and Jans 1991; Baldwin and Ackland 1991). Lipid
oxidation in WMP is of concern from a flavor as well as a safety standpoint since lipid
oxidation products have been positively correlated with cholesterol oxidation products,
which have been linked with negative health effects (McCluskey and others 1997; Chan
and others 1993).
The shelf-life of whole milk powder has been reported as anywhere from 3 mo
(Carunchia Whetstine and Drake 2007) to 3 y (Van Mil and Jans 1991). According to the
US Dairy Export Council (2005), the shelf-life of WMP at <27°C and <65% relative
humidity is 6-9 mo. A shelf life of 12 mo or longer has been purported with
internationally-produced WMP (Van Mil and Jans 1991; Steve Hess, Hershey Foods,
personal communication, 2008). The two main deterioration reactions in WMP include
the Maillard reaction and lipid oxidation, but lipid oxidation is the main factor limiting
the shelf-life of WMP (Farkye 2006; Renner 1988), as US WMP has a fat content
between 26-40% (ADPI 2002) with unsaturated fatty acids representing close to 34% of
the fat in WMP (31% monounsaturated and nearly 3 % polyunsaturated fat) (USDA-ARS
2007).
Lipid oxidation produces volatile compounds that can be measured by sensory
and instrumental techniques to gain a better understanding of the flavor (Drake 2004,
2007). A trained descriptive panel has been used by a number of researchers to evaluate
WMP flavor (Carunchia Whetstine and Drake 2007; Drake and others 2003; Hall and
Lingnert 1984; Hall and Andersson 1985; Hough and others 2002). Instrumental
51
techniques used to measure lipid oxidation in WMP include peroxide value (PV)
(Baldwin and others 1991; Doka and others 2000; van Mil and Jans 1991; Celestino and
others 1997; McCluskey and others 1997; Newstead and Headifen 1981; Ulberth and
Roubicek 1995; Tuohy and Kelly 1989), thiobarbituric acid reactive substances (TBARS)
(McCluskey and others 1997; Ulberth and Roubicek 1995; Tuohy and Kelly 1989), and
volatile analysis by gas chromatography (Ulberth and Roubicek 1995; Carunchia
Whetstine and Drake 2007; Hall and others 1985; Hall and Andersson 1985).
Comprehensive storage studies on flavor and storage stability of international
WMP have been conducted (Steen 1977; van Mil and Jans 1991; Baldwin and others
1991; Baldwin and Ackland 1991), but quantitative information is lacking on flavor and
storage stability of US WMP. Some work was conducted by Carunchia Whetstine and
Drake (2007), who tracked the flavor of WMP with a trained panel and volatile changes
with gas chromatography-olfactometry of two samples of WMP milk powder from a
single U.S. facility over 24 mo storage. Their results indicated that the shelf stability of
US WMP was 3 mo or less, significantly less than what other studies reported with
internationally produced WMP. Flavor variability and stability of US-produced WMP
warrants further research so that manufacturers can identify process methods to maximize
WMP quality. The objectives of this study were to characterize flavor variability and
stability of US WMP. WMP was collected from four US facilities at five different
occasions and stored for 12 mo. Both sensory and instrumental analyses were applied to
characterize flavor and flavor variability.
52
Materials and Methods
Samples
Freshly produced (<1 mo) spray dried WMP was obtained from four US
production facilities (2 east coast and 2 west coast) in 5 shipments over a year period
(Jan, May, Aug, Nov, and the following Jan) (Figure 1). These facilities were selected
based on their location and total production capacity (continuous rather than seasonal
production). Collectively, these facilities represented more than 50% of the 2005 US
WMP supply. At each shipment, two 23-kg bags from different production runs were
collected from each facility and shipped by expedited carrier to North Carolina State
University. One facility was unable to send samples for one shipment due to lack of
production at that time, so the total samples received was 38. Upon receipt, each sample
was repackaged into a 19-liter bucket with a tight-fitting lid (M&M Industries,
Chattanooga, TN, USA) lined with a Teflon® liner (Welch Fluorocarbon, Dover, NH,
USA). Initial analyses included moisture, free fat, fat, undenatured whey protein nitrogen
(WPN), mineral content, water activity, color, volatile analysis, and descriptive analysis.
Samples were stored at 21 ºC and 45% relative humidity and evaluated at two mo
intervals for moisture, water activity, color, volatiles, and flavor. At each timepoint,
WMP was stirred, a composite sample (1000 g) was removed, and then the bag was
twisted closed and the bucket re-sealed. Where indicated, WMP was reconstituted to
10% solids not fat (SNF) before analysis with odor-free deionized water according to the
equation in International Dairy Federation Method 99C (IDF 1997): g whole milk powder

53
in 90 g water = 1000/(100% fat). WMP were protected from light exposure during
storage as well as during preparation for volatile and sensory analysis.
Physical, Chemical and Microbiological Properties
Samples were evaluated in duplicate by an independent lab (Tulare, CA) for
moisture, free fat, fat, and WPN. Moisture was measured by the vacuum oven method
from DA Instruction 918-RL (USDA-AMS 2001). Free fat was evaluated based on the
method of Sørensen and others (1978). WPN, fat, standard plate counts, and coliforms
were measured according to standard methods described by Wehr and Frank (2004).
Iron, copper, manganese, and zinc were measured in duplicate by the NCSU
Analytical Services Laboratory (Raleigh, NC) using a standard dry ash method with
inductively coupled plasma optical emission spectroscopy (ICP-OES). Briefly, 2.5g
samples were (1) ashed overnight at 500 ºC in a muffle furnace, (2) cooled, (3) mixed
with approximately 1.5 ml distilled water and 4 ml 6N HCl (VWR, West Chester, PA,
USA) and heated to dryness on a steam plate to remove silicates, (4) transferred to a 50
ml volumetric flask with approximately 4 ml of 6N HCl, and (5) brought to volume with
distilled water for ICP-OES analysis (Lisa Lentz, Analytical Services Lab, North
Carolina State University, Personal Communication, 2008).
Water activity was measured in duplicate using an Aqualab series 3 TE water
activity meter (Decagon Devices, Pullman, WA, USA). CIE L*a*b* values were
obtained in triplicate with a Minolta CR-300 Chroma Meter using light source “C”
(Konica Minolta Sensing Americas, Inc., Ramsey, NJ, USA) and a 60 x 15 mm Petri dish
54
(Becton Dickinson Labware, Franklin Lakes, NJ, USA). Dry as well as reconstituted
powders (10% SNF) and liquid were filled to the brim (ca 9mm depth) of the larger
diameter Petri dish top; the dry powder was compressed with the smaller diameter bottom
portion of the dish. Samples were measured at approximately 22 ºC.
Volatile Analysis
Volatile compounds were analyzed in triplicate using solid phase microextraction
(SPME) similar to techniques used by Wright and others (2008) and Vazquez-
Landaverde (2005) with a Varian CP-3380 gas chromatograph (GC) equipped with a
Saturn 2000 ion trap mass selective detector (MSD) from Varian, Inc. (Palo Alto, CA.,
USA). Chromatography was performed using a 30 m length x 0.25 mm i.d. x .25 μm df
Rtx®-5 ms column (Restek, Bellefonte, PA, USA) with helium carrier gas at a flow rate
of 1 ml/min. Oven temperature was ramped from 40°C to 250°C at a rate of 8°C/min
with 5 min initial and final hold times. MSD conditions were as follows: 80°C manifold,
120°C transfer line 150°C ion trap. Chemical standards and alkanes were obtained from
Sigma Aldrich (St. Louis, MO, USA); methanol was obtained from VWR (West Chester,
PA, USA).
WMP was reconstituted to 10% SNF using 90 ml odor-free deionized water. Five
μl of internal standard (5 μl E-2-hexenal in 5 ml methanol) were added to reconstituted
milk to make a final concentration of 45 (μg/kg). Twenty g of the reconstituted sample
with internal standard were added to a 40 ml amber vial with 1.0 g sodium chloride
(Fisher Scientific, Pittsburgh, PA, USA) and an 8 mm x 13 mm stir bar (VWR, West
Chester, PA, USA). A poly(tetrafluoroethyene) coated septum (Supelco, Bellefont, PA,
55
USA) was placed facing the liquid and screwed into place. A water blank was made by
adding internal standard to 90 ml deodorized water and then adding 20 g of this solution
to a 40 ml vial as described above. An alkane series was prepared by adding 1 μl of
alkane solution (approximately 40 mg/kg C7-C24 in hexane) into an empty 40 ml vial
and sealed as described above and used to calculate retention indices (RI) of volatile
compounds.
Sample vials were placed in a heating block at 40 ºC for 30 min to equilibrate. A
2.0 cm DVB/CarboxenTM/PDMS StablefexTM (Supelco, Bellefont, PA, USA) was
inserted and exposed at a depth of 2.0 cm in the heating block for an additional 30 min,
followed by injection into the GC for 5 min at a depth of 3.0 cm. All fibers were
conditioned before use according to manufacturer’s directions. Volatile compounds were
identified using the NIST05 mass spectral library (National Institute of Standards and
Technology, Gaithersburg, MD), retention indices (RI) (van Den Dool and Kratz 1963),
and by comparison with authentic standard compounds injected under the same
conditions. Compounds were selected for quantification based on previous literature
(Hall and others 1985; Hall and Andersson 1985; Carunchia Whetstine and Drake 2007;
Vazquez-Landaverde and others 2005) and comparison of chromatogram peaks over
storage. Multiple point internal standard curves were generated in odor-free water using
the same protocol described above to cover five concentration levels in the range found in
the samples for each of the following compounds: dimethyl sulfide, 3-methylbutanal, 2-
methylbutanal, 2-heptanone, 1-octen-3-ol, 3-octen-2-one, hexanal, heptanal, octanal, and
nonanal. Stock solutions were made by dissolving compounds in methanol, with final
56
dilution into 90 ml odor free water with internal standard and evaluating each
concentration in duplicate. Data were plotted with the response ratio (peak area of
standard/peak area of internal standard) on the y-axis and concentration ratio
(concentration of standard/concentration of internal standard) on the x-axis. Regression
equations were generated based on the best linear fit of the data.
Sensory Analysis
Approval for use of human subjects was obtained from the Institutional Review
Board (IRB) at North Carolina State University. WMP was reconstituted to 10% SNF
with odor-free deionized water for descriptive analysis and freshly purchased spring
water for consumer testing. All samples were served with 3-digit codes. Evaluations
were conducted in individual sensory booths using Compusense® five (Compusense,
Guelph, Canada) software for data collection. Sample order was determined using a
randomized balanced Williams design (MacFie and others 1989).
Descriptive Analysis. A 10-member trained panel scored WMP flavor attributes
of aroma intensity, cooked, milkfat, sweet aromatic, grassy, painty, musty/earthy, and
cardboard flavors and sweet taste and astringency using the SpectrumTM method and the
dried dairy ingredient lexicon developed by Drake and others (2003) and previously
applied to WMP by Carunchia Whetstine and Drake (2007). About 25 ml of
reconstituted product was poured into 60 ml plastic soufflé cups with lids (Solo Cup
Company, Highland Park, IL, USA) and served at about 20 ºC. Samples were evaluated
in duplicate by each panelist every 2 mo.

57
Panelists were trained using fresh and aged WMP samples. Panelists received a
set of eight samples to evaluate in each session, with a half hour break between sessions.
Deionized water was provided for panelists to refresh their palates between samples.
Empty cups were also provided for sample expectoration. At each session, separate fresh
(free of grassy or painty flavors), grassy and painty flavored reconstituted WMP
(previously identified and discussed by the panel) and a fluid whole milk sample were
provided to help calibrate panelists.
Consumer Acceptance. Two representative WMP samples were selected for
consumer testing: one was 3 mo old and characterized by grassy flavor (intensity 2); the
other was 6 mo old and characterized by grassy (intensity 1.5) and painty flavors
(intensity 3). WMP was reconstituted in 11.4-liter buckets (M&M Industries,
Chattanooga, TN, USA) using wire whisks. Consumer testing (n=75) compared overall
acceptance of these samples to a fresh fluid control and two freshly produced WMP (<1
mo, free of grassy or painty flavors, confirmed by descriptive sensory analysis) using a 9-
point hedonic scale where 1 = dislike extremely and 9 = like extremely. Approximately
90 ml of reconstituted WMP was served in 177 ml foam cups with lids (Dart Container
Corporation, Mason, MI, USA) and straws (Solo Cup Company, Highland Park, IL,
USA). Samples were prepared a day in advance and stored at 5 ºC until served.
Evaluations were conducted in individual sensory booths using Compusense®
five v 4.6 (Compusense, Guelph, Canada) software for data collection. Sample order was
determined using a Williams design (MacFie and others 1989). Room temperature

58
filtered water was provided for panelists to cleanse their palates between samples.
Panelists were compensated with food treats and grocery store gift cards.
Data Analysis
XLSTAT version 2007.5 software (Addinsoft USA, New York, New York, USA)
was used for data analysis, including analysis of variance with Fisher’s LSD, Pearson’s
correlation analysis, and principal component analysis (PCA). P-values <0.05 were
considered significant. Multiple linear regression using a mixed model with backward
elimination was performed using SAS v 9.1 (SAS Institute, Cary, NC, USA) to determine
the best prediction equations for grassy and painty flavors based on the following
volatiles: dimethyl sulfide, 3-methylbutanal, 2-methylbutanal, hexanal, 2-heptanone,
heptanal, 1-octen-3-ol, octanal, 3-octen-2-one, nonanal. Multiple linear regression was
also performed to determine if physicochemical attributes (water activity, moisture, fat,
free fat, WPN, mineral content) could predict grassy or painty flavor or hexanal content.
Results and Discussion
Physical, Chemical and Microbiological Properties
In general, US WMP from the 4 facilities was similar to international WMP in
moisture, free fat, fat, and other properties (Steen 1977; van Mil and Jans 1991) and
values were within recommended domestic WMP guidelines (ADPI 2002), although
some differences were noted (Table 1). Water activity values ranged from 0.11-0.24,
with the mean values from each facility close to 0.2, which has been recommended as
59
optimal to preserve WMP quality during 25 ºC storage (Stapelfeldt and others, 1997;
Schuck and others 2007). The moisture content ranged 2.0-3.3%, which was similar to
previous reports of international WMP (Steen 1977; van Mil and Jans 1991). WMP from
Facility B was higher in moisture and water activity than WMP from other facilities
(p<0.05). Total fat content was similar between facilities and within domestic (26-40%
fat) and international standards (26-42% fat) (CFR 2005, CODEX 1999). Free fat ranged
from 1.1-7.7, which was comparable to international WMP (Steen 1977; van Mil and
Jans 1991). WMP from Facility C was significantly higher in free fat than the other
facilities, with a mean of 4.2%, compared with 3.2%, 2.0%, and 1.6% for Facilities B, A,
and D, respectively (p<0.05). WMP with high free fat content have been associated with
greater susceptibility to oxidation (Vignolles and others 2007). However, Buma (1971)
did not find any correlation between the development of oxidized flavor and free fat of
1.1-79% in WMP stored at 30 ºC for 6 mo, although the flavor of the larger particles
(containing less free fat) was slightly better than that of smaller particles (containing a
larger proportion of free fat). There were no differences for fat or free fat with relation to
season (p>0.05), but higher values for water activity and moisture were observed with
WMP produced in the spring and summer from both west and east coast facilities
(p<0.05).
US WMP were all classified as medium heat powders, as indicated by a WPN
between 1.51-5.99 mg undenatured whey protein/g WMP (USDEC 2005). WMP were
higher (p<0.05) in WPN (3.7-5.9 mg/g) than international WMP (1.2-4.2 mg/g), which
indicates the heat treatment before drying was generally less severe than international

60
WMP (USDEC 2005; Steen 1977; van Mil and Jans 1991). Research on New Zealand
WMP with a WPN from 0.6-6.0 mg/g determined that a lower WPN resulted in higher
cooked flavor and delayed the development of oxidized flavor (Baldwin and others 1991;
Baldwin and Ackland 1991). Stapelfeldt and others (1997) found medium (WPN 4.5)
and high heat (WPN 1.3) WMP to be more stable than low heat (WPN 7.0) WMP.
Facility C WMP was lower in WPN than WMP from the other facilities (p<0.05), which
indicated that fluid milk from this facility received a more severe heat treatment before
spray drying (USDEC 2005). There were no differences in WPN related to season
(p>0.05).
Both iron and copper were below the recommended limits of 10 mg/kg and 1.5
mg/kg, respectively, for WMP (ADPI 2002). These limits have been set because both
iron and copper have been associated with oxidized flavor in milk, while other minerals
such as manganese and zinc have not been associated with any off flavors (Greenbank
1948). Copper, zinc and manganese were close to previously reported values, while iron
was lower (USDA-ARS 2007, Steen 1977). The observed difference in iron content
could be due to efforts to keep the iron content of milk as low as possible. Some
differences were observed in mineral content between facilities, with Facility A
significantly higher (p<0.05) in manganese and lower in zinc (p<0.05). These observed
differences might be due to differences in feed. No clear seasonal variation was observed
for any of the minerals (p<0.05). Steen (1977) reported that copper content of WMP was
higher during the winter (around 0.7 mg/kg) months than during the summer (0.4 mg/kg),
with no seasonal variation observed for iron or zinc.
61
For microbiological quality, 1 of 38 WMP exceeded the recommended standard
plate count limit <10,000 CFU/g for extra grade WMP, although it was still within the
limit of <50,000 for standard grade WMP; 10 of 38 WMP exceeded the coliform limit of
<10 CFU/g with coliform levels of 15 to 256 CFU/g (ADPI 2002). No seasonal variation
was observed for standard plate counts or coliforms (p>0.05).
There were some color differences between facilities in dry WMP and
reconstituted (wet) WMP (Figure 2). Compared to the other facilities, Facility A
exhibited higher dry L* scores and wet b* scores, which were correlated with WPN (r =
0.43 and 0.50, respectively, p<0.01). The higher yellow color (wet b*) from Facility A
could be due to milk from pasture fed cows used at this facility, because wet b* values
were also correlated with grassy flavor (r = 0.53, p=0.001). Croissant and others (2007)
observed higher Hunter b-values in milk from pasture fed cows compared to milk from
cows fed a total mixed ration. Some seasonal variation was observed, with initial dry L*
values (lightness) lowest in the fall (data not shown, p<0.05). Grigioni and others (2007)
observed the opposite, with higher L* values in WMP produced in the fall and winter,
concluding that this was due to feed differences throughout the year, which could explain
our results as well. Buma and others (1977) attributed the seasonal color variation in
milk to β-carotene content, which resulted in lower % reflectance (milk was darker in
color) during summer and early fall when cows were fed a pasture based diet, with higher
levels of beta-carotene. This agrees with our dry b* values, which were higher (more
yellow) during the spring, summer, and early fall (p<0.05). Comparison of 12 mo color
values to initial values revealed an increase for dry L* (p<0.0001) and a decrease for dry
62
b*(p<0.0001), and wet a* (p<0.001) values during storage. There were no significant
changes for dry a*, wet L*, or wet b* values (p>0.05). Stapelfeldt and others (1997)
noted only minor changes in color values for WMP stored for 2 mo at 25 ºC and water
activity of 0.1-0.2, which is in agreement with our research. Lim and others (1994) also
observed an increase in L* value and decrease b* for dry WMP at 20 ºC during storage,
but unlike our research, they also observed an increase in a* values.
Volatile Analysis
Volatiles detected in WMP by SPME included straight chain aldehydes (hexanal,
heptanal, octanal, and nonanal), Strecker aldehydes (2- and 3-methylbutanal), 2-
heptanone, dimethyl sulfide, 1-octen-3-ol, and 3-octen-2-one. These compounds have
been previously documented in WMP and were associated with grassy and painty flavors
(Carunchia Whetstine and Drake 2007; Hall and others 1985; Hall and Andersson 1985;
Biolatto and others 2007). Straight chain aldehydes have been reported to be the most
important volatiles from lipid oxidation (Hall and others 1985). Hexanal, 1-octen-3-ol,
and 3-octen-2-one have been identified as important flavor compounds resulting from
oxidation of linoleic acid (Ulrich and Grosch 1987), which is the main polyunsaturated
fatty acid in WMP (USDA-ARS 2007). The Strecker aldehydes 2- and 3-methylbutanal
result from isoleucine and leucine degradation in the Maillard reaction (Bendall 2001),
but previous research suggests that their formation is also influenced by lipid oxidation
(Hidalgo and Zamora 2008; Hall and others 1985; Andersson and Lingnert 1998).
Wide variation was observed in initial concentrations of WMP volatiles between
63
different facilities and shipments (Figure 3). Some WMP were characterized by a lack
of volatiles, while some WMP were differentiated from each other by the presence of
certain volatiles. WMP from shipments 2 (May) and 3 (Aug) contained higher
(p<0.0001) initial levels of hexanal, heptanal, octanal and nonanal compared with the
other shipments (Nov and Jan). This is consistent with Biolatto and others (2007) who
found that straight chain aldehydes were higher in WMP produced during the spring and
summer compared to fall and winter, which they related back to the feed of the cows.
Toso and others (2002) also reported higher levels of hexanal, heptanal, and nonanal in
raw milk from cows fed grass silage, compared to hay or maize silage. Initial dimethyl
sulfide levels were highest in WMP from shipment 3 (Aug), which is also in agreement
with Biolatto and others (2007). Reddy and others (1967) also observed higher levels of
dimethyl sulfide (31 μg/kg against 11 μg/kg) in milk from cows fed freshly cut alfalfa
compared to milk from cows fed bromegrass or rye. Higher concentrations of dimethyl
sulfide in our WMP may be associated with feed flavors. Patton and others (1956)
reported that when dimethyl sulfide was added to water at levels above sensory threshold
(12 μg/kg), a cowy or malty flavor was observed. Initial concentrations of 2- and 3-
methylbutanal were significantly higher (p<0.05) in WMP from Facilities C and D,
which also had the lowest WPN (most severe heat treatment). This suggests that the
more severe heat treatment resulted in more Maillard reaction products which underwent
Strecker degradation to form Strecker aldehydes. Higher levels of 2- and 3-
methylbutanal have also been noted in raw milk from cows fed hay, compared to diets of
maize silage or grass silage (Toso and others 2002), which could also explain some of the
64
variation we observed in initial concentrations of these volatiles. Facilities C and D also
possessed higher levels of 2-heptanone, which has been observed at higher concentrations
in fluid milk with more severe heat treatments (Contarini and others 1997; 2002).
Contarini and others (2002) suggested that 2-heptanone could be used as a marker for
heat treatment of milk. Our research showed that initial 2-heptanone and WPN values
were correlated (r=-0.40, p=0.01), suggesting that initial 2-heptanone formation increases
with more severe heat treatments (lower WPN).
Lipid oxidation volatiles (1-octen-3-ol, 3-octen-2-one, hexanal, heptanal, octanal,
and nonanal) as well as Strecker aldehydes (2- and 3-methylbutanal), 2-heptanone and
dimethyl sulfide increased during storage (p<0.05) (Table 2). Initial levels of hexanal
ranged from 0.8 μg/kg to 50 μg/kg, with a mean of 13μg/g. Ulberth and Roubicek (1995)
reported that fresh WMP contained less than 10 μg/kg of hexanal, which was the case for
22 of our 38 samples. During storage, concentrations of dimethyl sulfide, 3-
methylbutanal, hexanal, and heptanal were observed at levels above previously reported
sensory threshold concentrations (van Gemert 2003). Carunchia Whetstine and Drake
(2007) also observed hexanal, octanal, nonanal, and 2- and 3-methylbutanal to be
important odor active compounds in stored WMP by gas chromatography-olfactometry.
During storage, some samples developed lipid oxidation volatiles faster than
others (p<0.05). Combined data across shipments from each facility during storage are
presented in Figure 4. Facilities A, C, and D were highly characterized by lipid
oxidation volatiles at 12 mo storage, while Facility B at 12 mo was more closely related
to the other facilities at 10 mo. Facility D was characterized by higher concentrations of
65
dimethyl sulfide, as well as 2- and 3- methylbutanal during storage compared to other
facilities. Hexanal did not increase as rapidly in WMP from Facility B compared to other
facilities (Figure 5), and WMP from facility B was lower in hexanal than WMP from
other facilities after 12 mo storage (p<0.05).
It is possible that the slower development of hexanal in facility B WMP was
related to its higher moisture content (close to 3%) which has been shown by some
researchers to improve storage stability of WMP (van Mil and Jans 1991), or to other
factors that were not measured. Hexanal content of WMP at 12 mo varied widely,
ranging from 490 to 4400 μg/kg (Figure 6), with differences between and within
facilities (p<0.05). Facilities A and D exhibited the widest variation in hexanal content,
while the least variation was observed in facility B. Overall there were no significant
correlations between WPN and any of the volatiles (p>0.05), which may be explained by
the relatively small range of WPN values (3.7-5.9 mg/kg) observed in this study
compared to the wide range (0.6-6.0 mg/kg) evaluated by Baldwin and others (1991) and
Baldwin and Ackland (1991), especially considering that they found the best WMP
stability with WPN below 2.7 mg/kg.
Sensory Analysis
Descriptive Analysis. Descriptive analysis of WMP at time zero revealed
differences in initial flavor profiles between facilities as well as within each facility
(Figure 7). Variations were noted between facilities for cooked and milkfat flavor, with
more contrasting differences in sweet aromatic/caramelized and additional flavor notes.
WMP from Facility C was higher than the others in sweet aromatic/caramelized flavor
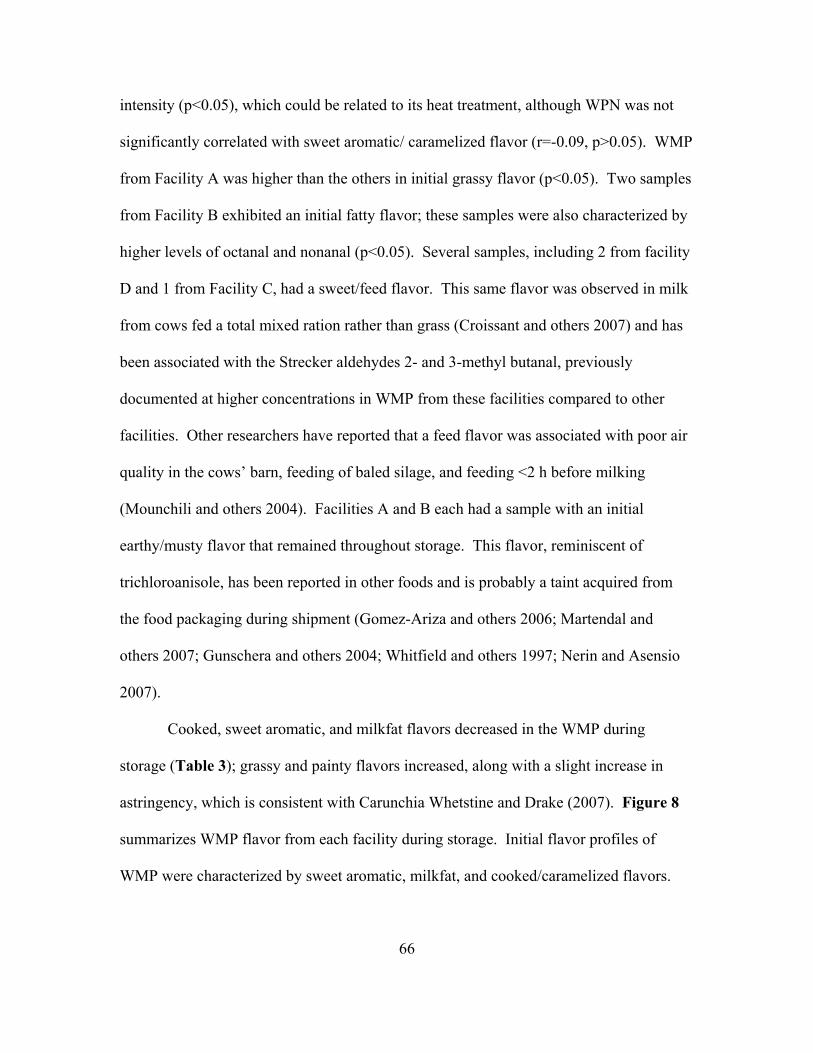
66
intensity (p<0.05), which could be related to its heat treatment, although WPN was not
significantly correlated with sweet aromatic/ caramelized flavor (r=-0.09, p>0.05). WMP
from Facility A was higher than the others in initial grassy flavor (p<0.05). Two samples
from Facility B exhibited an initial fatty flavor; these samples were also characterized by
higher levels of octanal and nonanal (p<0.05). Several samples, including 2 from facility
D and 1 from Facility C, had a sweet/feed flavor. This same flavor was observed in milk
from cows fed a total mixed ration rather than grass (Croissant and others 2007) and has
been associated with the Strecker aldehydes 2- and 3-methyl butanal, previously
documented at higher concentrations in WMP from these facilities compared to other
facilities. Other researchers have reported that a feed flavor was associated with poor air
quality in the cows’ barn, feeding of baled silage, and feeding <2 h before milking
(Mounchili and others 2004). Facilities A and B each had a sample with an initial
earthy/musty flavor that remained throughout storage. This flavor, reminiscent of
trichloroanisole, has been reported in other foods and is probably a taint acquired from
the food packaging during shipment (Gomez-Ariza and others 2006; Martendal and
others 2007; Gunschera and others 2004; Whitfield and others 1997; Nerin and Asensio
2007).
Cooked, sweet aromatic, and milkfat flavors decreased in the WMP during
storage (Table 3); grassy and painty flavors increased, along with a slight increase in
astringency, which is consistent with Carunchia Whetstine and Drake (2007). Figure 8
summarizes WMP flavor from each facility during storage. Initial flavor profiles of
WMP were characterized by sweet aromatic, milkfat, and cooked/caramelized flavors.

67
Between 2-4 mo, WMP were characterized by sweet and grassy flavors. Beyond 4 mo,
WMP were highly characterized by painty and grassy flavors.
WMP from Facilities B, C, and D developed a detectable (mean score of > 1)
grassy flavor by 3-4 mo (Figure 9), which corresponded with a hexanal concentration of
200-300 μg/kg (Figure 5). WMP from facility A was significantly higher than the other
facilities in grassy flavor initially and throughout 12 mo storage. The milk used by this
facility to manufacture WMP came from cows that were primarily pasture fed rather than
receiving a total mixed ration. The initial grassy flavor of WMP from this facility was
probably due to milk from pasture fed cows rather than storage-associated lipid
oxidation; this flavor was correlated with 2-methylbutanal (r=0.69), hexanal (r=0.65), 2-
heptanone (r=0.73), and 2-octene-2-one (r=0.76) (p<0.05).
WMP from Facilities A, C and D developed a detectable (score of > 1) painty
flavor around 6 mo, while the onset of this flavor was delayed by a couple of mo in WMP
from facility B (Figure 10), corresponding with a hexanal concentration around 300
μg/kg (Figure 5). Facility B WMP was less painty than WMP from the other facilities at
12 mo (Figure 10 and 11). This could be related to the higher moisture content in WMP
from Facility B as well as other processing parameters and properties that were not
measured. Van Mil and Jans (1991) noted that WMP stored at 3% moisture had a higher
flavor score and lower peroxide value than WMP stored at 2.7% or 2.4 % moisture for up
to 36 mo, which supports our observation. There was wide variation in the intensity of
painty flavor from each shipment and facility at 12 mo (Figure 11). These differences
occurred across different facilities as well as within each facility. Nielsen and others
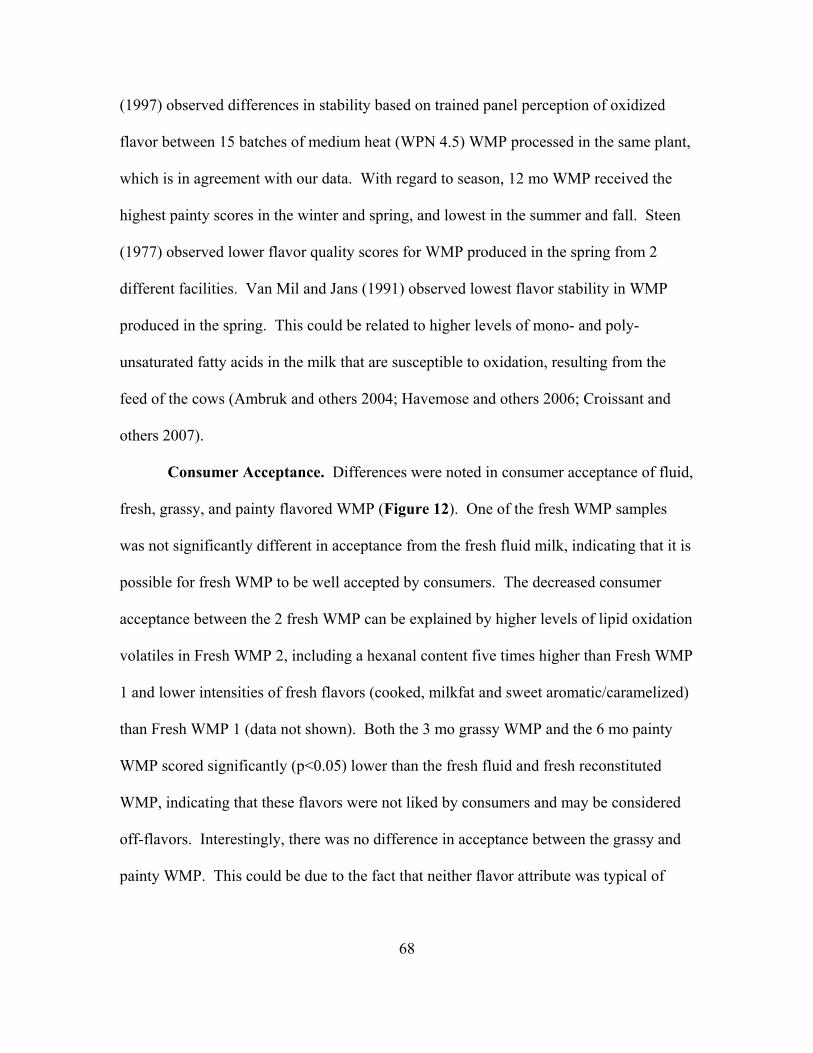
68
(1997) observed differences in stability based on trained panel perception of oxidized
flavor between 15 batches of medium heat (WPN 4.5) WMP processed in the same plant,
which is in agreement with our data. With regard to season, 12 mo WMP received the
highest painty scores in the winter and spring, and lowest in the summer and fall. Steen
(1977) observed lower flavor quality scores for WMP produced in the spring from 2
different facilities. Van Mil and Jans (1991) observed lowest flavor stability in WMP
produced in the spring. This could be related to higher levels of mono- and poly-
unsaturated fatty acids in the milk that are susceptible to oxidation, resulting from the
feed of the cows (Ambruk and others 2004; Havemose and others 2006; Croissant and
others 2007).
Consumer Acceptance. Differences were noted in consumer acceptance of fluid,
fresh, grassy, and painty flavored WMP (Figure 12). One of the fresh WMP samples
was not significantly different in acceptance from the fresh fluid milk, indicating that it is
possible for fresh WMP to be well accepted by consumers. The decreased consumer
acceptance between the 2 fresh WMP can be explained by higher levels of lipid oxidation
volatiles in Fresh WMP 2, including a hexanal content five times higher than Fresh WMP
1 and lower intensities of fresh flavors (cooked, milkfat and sweet aromatic/caramelized)
than Fresh WMP 1 (data not shown). Both the 3 mo grassy WMP and the 6 mo painty
WMP scored significantly (p<0.05) lower than the fresh fluid and fresh reconstituted
WMP, indicating that these flavors were not liked by consumers and may be considered
off-flavors. Interestingly, there was no difference in acceptance between the grassy and
painty WMP. This could be due to the fact that neither flavor attribute was typical of
69
milk that the consumers were accustomed to, making them equally unacceptable. These
results suggest that off-flavors detected in WMP by trained panelists can also be
recognized by consumers. This is consistent with the results of Hough and others (2002)
who determined that increased levels of oxidized flavor (produced by adding copper to
reconstituted WMP) in WMP documented by a trained panel resulted in decreased
consumer acceptance. Caudle and others (2005) noted lower consumer acceptance scores
for SMP with trained panel documented fatty or animal off-flavors, when compared to
two SMP lacking those flavor attributes. They also performed consumer acceptance on
vanilla ice cream, strawberry yogurt, hot cocoa and white chocolate with each SMP
incorporated and noted that some applications masked these off-flavors better than
others; this could be an area for further research with WMP.
Key Relationships
Grassy flavor in WMP at 12 mo was positively correlated with WPN (r=0.49,
p=0.002), indicating that the heat treatment of the WMP can have an effect on stability,
which is in agreement with research by Stapelfeldt and others (1997). However, grassy
flavor at 12 mo was not significantly correlated with water activity, moisture, fat, free fat,
or mineral content (p<0.05). Painty flavor at 12 mo was not significantly correlated with
any of the aforementioned attributes (p<0.05). This indicates that these variables may not
be directly related to stability in the ranges we observed or that the attributes measured
did not have enough variation to draw conclusions related to stability. Still, there is
evidence that initial moisture/water activity can play a role on stability, as WMP from the
facility with the highest moisture/water activity also exhibited lower painty flavor
70
intensity at 12 mo, which is in accordance with research of Van Mil and Jans (1991).
Our research did not show any differences in stability related to free fat content at the
levels found in our WMP samples, which is in agreement with Buma (1971).
Correlations were observed between volatiles and flavor attributes across 12 mo
storage (Table 4). Aroma intensity, grassy flavor, fatty/painty flavor, and astringency
were positively correlated with each other as well as Strecker aldehydes, lipid oxidation
products, and 2-heptanone; these flavor attributes and volatiles were negatively correlated
with cooked, milkfat, sweet aromatic, and sweetness. Hexanal was strongly correlated
with 2-methylbutanal (r=0.55), 2-heptanone (r=0.74), heptanal (r=0.96), 1-octen-3-ol
(r=0.88), octanal (r=0.92), 3-octen-2-one (r=0.89), and nonanal (r=0.90) (p<0.0001).
This indicates that as hexanal content increased in WMP, these other volatiles also
increased. Strong correlations were observed between painty flavor and lipid oxidation
volatiles, including hexanal (r=0.70), heptanal (r=0.65), 1-octen-3-ol (r=0.58), octanal
(r=0.60), 3-octen-2-one (r=0.55) and nonanal (r=0.58) (p<0.0001). The painty flavor in
WMP from Facility C was consistently described as “like old rice” by one of the trained
panelists. This is reasonable because raw milled rice contains volatiles resulting from
oleic, linoleic, and linolenic acids, including hexanal, heptanal, octanal, 2-nonenal, 3-
penten-2-one, and 2-pentylfuran (Lam and Proctor 2003).
Regression equations were generated to predict grassy (r=0.62, R2=0.38) and
painty (r=0.78, R2=0.61) flavors based on volatiles in WMP (Table 5). The correlation
was lower for grassy flavor, which is likely due to other volatiles that predict grassy
flavor that were not measured. Grassy flavor is not solely a storage flavor so it is

71
possible that other non lipid oxidation compounds may contribute to this flavor. Hexanal
was a key compound in our predictive equations (p<0.0001) for both grassy and painty
flavors. The other volatile compounds ranked as follows for grassy flavor: nonanal,
p=0.002, 2-heptanone, p=0.012; 1-octen-3-ol, p=0.047. For painty flavor, the terms were
ranked as follows: 3-octen-2-one, p=0.0025; octanal, p=0.0098; 3-methylbutanal,
p=0.010; 2-methylbutanal, p=0.021. Regression on individual volatiles revealed that
hexanal explained the most variation in grassy (31%) and painty (59%) flavor intensities.
Other volatiles explained 18-28% of the variation in grassy flavor (p<0.0001). Nonanal
also explained 59% of the variation of painty flavor. Other volatiles individually
explained 26-52% of the variation in painty flavor (p<0.0001), excluding, dimethyl
sulfide and 3-methylbutanal, which were not significant predictors of this flavor (p>0.05).
Hall and Andersson (1985) generated regression equations using 25 volatile compounds,
including 7 of the 10 quantified in the current study (dimethyl sulfide, 3-methylbutanal,
2-methylbutanal, hexanal, 2-heptanone, heptanal, and nonanal) to predict a variety of
flavor attributes including cooked milk, creamy, whey cheese, casein, and cardboard,
with r values of 0.85-0.95. Cardboard was the main flavor attribute they associated with
off-flavor development in WMP during storage. They determined that hexanal alone
could account for 79% of the variation in cardboard off-flavor, while their best predictive
equation accounted for 86% of the variation in this flavor.
Conclusions
In general, flavor changes occurred in US WMP by 3-4 mo, indicating that the
optimal shelf life of WMP was not as long as the 6-9 mo purported or the desired shelf
72
life of 12 mo claimed by international WMP, which is often subjected to higher heat
treatments (lower WPN) and flushed with nitrogen to extend shelf-life. Wide variation
existed in flavor and flavor stability of US WMP, even within an individual facility.
Some of the sources of variability included water activity, moisture, WPN, and feed
source. Of the volatiles studied, hexanal was the best predictor of grassy flavor and
either hexanal or nonanal could be used as predictors of painty flavor. For optimum
quality, hexanal content of WMP should be less than 50 µg/kg. If hexanal or nonanal
concentrations are greater than 600 µg/kg or 4 µg/kg, respectively, painty flavors are
evident. This study has established the current status of US WMP and provides a
baseline for future studies. Future research should determine what feasible measures can
be taken by US manufacturing facilities to produce WMP with more consistent flavor and
flavor stability and should directly compare flavor and flavor stability of US WMP with
international WMP.
73
References
[ADPI]. American Dairy Products Institute. 2002. Standards for grades of dry milks, including methods of analysis (Bulletin 916). Elmhurst, Ill.: American Dairy Products Institute. Andersson K, Lingnert H. 1998. Influence of oxygen concentration on the flavour and chemical stability of cream powder. Lebensm Wiss Technol 31(3):245-51. Baldwin AJ, Ackland JD. 1991. Effect of preheat treatment and storage on the properties of whole milk powder - changes in physical and chemical properties. Neth Milk Dairy J 45(3):169-81. Baldwin AJ, Cooper HR, Palmer KC. 1991. Effect of preheat treatment and storage on the properties of whole milk powder - changes in sensory properties. Neth Milk Dairy J 45(2):97-116. Bendall, JG. 2001. Aroma compounds of fresh milk from New Zealand cows fed different diets. J Agric Food Chem 49(10):4825-32. Biolatto A, Grigioni G, Irurueta M, Sancho AM, Taverna M, Pensel N. 2007. Seasonal variation in the odour characteristics of whole milk powder. Food Chem 103(3):960-67. Birchal VS, Passos ML, Wildhagen GRS, Mujumdar AS. 2005. Effect of spray-dryer operating variables on the whole milk powder quality. Drying Technology 23(3):611-36. Buma TJ, Vanderveen HKC, Weerstra R. 1977. Seasonal-variation of color of milk. Neth Milk Dairy J 31(1):31-9. Buma TJ. 1971. Free fat in spray-dried whole milk.4. Significance of free fat for other properties of practical importance. Neth Milk Dairy J. 25(2):88-106. Carunchia Whetstine ME, Drake MA. 2007. The flavor and flavor stability of skim and whole milk powders. In: Cadwallader, K. R., Drake, M. A. and McGorrin, R., editors. Flavor of Dairy Products. Washington, DC.: ACS Publishing. p. 217-51. Celestino EL, Iyer M, Roginski H. 1997. The effects of refrigerated storage of raw milk on the quality of whole milk powder stored for different periods. Int Dairy J. 7(2-3):119-27. [CFR]. Code of Federal Regulations. 2008. Title 21, Part 131.147. Code of Federal Regulations. http://www.gpoaccess.gov/CFR/INDEX.HTML. Accessed Aug 30, 2008.
74
Chan SH, Gray JI, Gomaa EA, Harte BR, Kelly PM, Buckley DJ. 1993. Cholesterol oxidation in whole milk powders as influenced by processing and packaging. Food Chem 47(4):321-28. [CODEX]. Codex Alimentarius. (1999). Codex Stan 207-1999. Available from: http://www.codexalimentarius.net/download/standards/333/CXS_207e.pdf. Accessed Aug 18, 2008. Contarini G, Povolo M, Leardi R, Toppino PM. 1997. Influence of heat treatment on the volatile compounds of milk. J Agric Food Chem 45(8):3171-77. Contarini G, Pavolo M. 2002. Volatile fraction of milk: Comparison between purge and trap and solid phase microextraction techniques. J Agric Food Chem 50(25):7350-7355. Croissant AE, Washburn SP, Dean LL, Drake MA. 2007. Chemical properties and consumer perception of fluid milk from conventional and pasture-based production systems. J Dairy Sci 90:4942-53. de Oliveira CAF, Mestieri L, Santos MV, Moreno JFG, Spers A, Germano PML. 2000. Effect of microbiological characteristics of raw milk on the quality of whole milk powder. Brazil J Micro 31(2):95-98. Doka O, Ajtony Z, Bicanic D, Koehorst R. 2000. Assessing the extent of degradation in the UV radiation and heat-catalyzed oxidized whole milk powder: The UV photoacoustic and diffuse reflectance spectroscopies versus the peroxide value. Applied Spect 54(9):1405-1408. Drake MA, Karagul-Yuceer Y, Cadwallader KR, Civille GV, Tong PS. 2003. Determination of the sensory attributes of dried milk powders and dairy ingredients. J Sens Stud 18(3):199-216. Drake MA. 2004. ADSA Foundation Scholar Award: Defining dairy flavors. J Dairy Sci 87(4):777-84. Drake MA. 2007. Invited review: Sensory analysis of dairy foods. J Dairy Sci 90(11):4925-4937. Farkye N. 2006. Significance of milk fat in milk powder. In: Fox P, McSweeney P, editors. Advanced dairy chemistry volume 2: lipids, 3rd ed. New York: Springer US. p. 451-65. Burdock GA. 2004. Fenaroli's handbook of flavor ingredients, 5th edition. Boca Raton: CRC Press. 2040 p.
75
Gomez-Ariza JL, Garcia-Barrera T, Lorenzo F, Beltran R. 2006. Use of multiple headspace solid-phase microextraction and pervaporation for the determination of off-flavours in wine. J Chromat A 1112(1-2):133-140. Greenbank GR. 1948. The oxidized flavor in milk and dairy products - A review. J Dairy Sci 31(10):913-33. Hall G, Lingnert H. 1984. Flavor changes in whole milk powder during storage. 1. Odor and flavor profiles of dry milk with additions of antioxidants and stored under air or nitrogen. J Food Quality 7(2):131-51. Hall G, Andersson J, Lingnert H, Olofsson B. 1985. Flavor changes in whole milk powder during storage. 2. The kinetics of the formation of volatile fat oxidation-products and other volatile compounds. J Food Quality 7(3):153-90. Hall G, Andersson J. 1985. Flavor changes in whole milk powder during storage. 3. Relationships between flavor properties and volatile compounds. J Food Quality 7(4):237-53. Havemose MS, Weisbjerg MR, Bredie WLP, Poulsen HD, Nielsen JH. 2006. Oxidative stability of milk influenced by fatty acids, antioxidants, and copper derived from feed. J Dairy Sci 89(6):1970-80. Hidalgo FJ, Zamora R. 2008. Food anoxia and the formation of either flavor or toxic compounds by amino acid degradation initiated by oxidized lipids. Maillard reaction: recent advances in food and biomedical sciences. p. 25-29. Hough G, Sanchez RH, de Pablo GG, Sanchez RG, Villaplana SC, Gimenez AM, Gambaro A. 2002. Consumer acceptability versus trained sensory panel scores of powdered milk shelf-life defects. J Dairy Sci 85(9):2075-80. IDF. 1997. Standard 99C: Sensory evaluation of dairy products by scoring reference methodology. Brussels, Belgium: International Dairy Federation. Kurtz FE, Tamsma A, Selman RL, Pallansch MJ. 1969. Effect of pollution of air with ozone on flavor of spray-dried milks. J Dairy Sci 52(2):158-61. Lam HS, Proctor A. 2003. Milled rice oxidation volatiles and odor development. J Food Sci 68(9):2676-2681. Maarse H. 1991. Volatile compounds in foods and beverages. Boca Raton: CRC Press. 784 p.

76
MacFie H, NB, Greenhoff K, Vallis I. 1989. Designs to balance the effect of order of presentation and first-order carry-over effects in hall tests. J Sens Stud 4:129-48. Martendal E, Budziak D, Debastiani R, Carasek E. 2007. Determination of haloanisoles in paper samples for food packaging by solid-phase microextraction and gas chromatography. Microchimica Acta 159(3-4):229-34. McCluskey S, Connolly JF, Devery R, O'Brien B, Kelly J, Harrington D, Stanton C. 1997. Lipid and cholesterol oxidation in whole milk powder during processing and storage. J Food Sci 62(2):331-37. Meilgaard MM, Civille GV, Carr T. 1999. Sensory Evaluation Techniques. 3rd Ed. CRC Press, New York, NY. 387 p. Mounchili A, Wichtel JJ, Dohoo IR, Keefe GP, Halliday LJ. 2004. Risk factors for milk off-flavours in dairy herds from Prince Edward Island, Canada. Prev Vet Med 64(2-4):133-45. Nerin C, Asensio E. 2007. Migration of organic compounds from a multilayer plastic-paper material intended for food packaging. Analytical and Bioanalytical Chemistry 389(2):589-96. Nielsen BR, Stapelfeldt H, Skibsted LH. 1997. Early prediction of the shelf-life of medium-heat whole milk powders using stepwise multiple regression and principal component analysis. Int Dairy J 7(5):341-48. Patton S, Forss DA, Day EA. 1956. Methyl sulfide and the flavor of milk. J Dairy Sci 39(10):1469-70. Reddy MC, Bassette R, Ward G, Dunham JR. 1967. Relationship of dimethyl sulfide and flavor score of milk. J Dairy Sci 50(2):147-150. Renner E. 1988. Storage stability and some nutritional aspects of milk powders and ultra high-temperature products at high ambient-temperatures. J Dairy Res 55(1):125-42. Schuck P, Mejean S, Dolivet A, Jeantet R, Bhandari B. 2007. Keeping quality of dairy ingredients. Lait 87(4-5):481-8. Schuck P. 2002. Spray drying of dairy products: state of the art. Lait 82(4):375-382. Shipe WF, Bassette R, Deane DD, Dunkley WL, Hammond EG, Harper WJ, Kleyn DH,

77
Sørensen IH, Krag J, Pisecky J, Westergaard V. 1978. Analytical Methods for Dry Milk Products, 4th ed. Copenhagen: NIRO A/S. Available from: http://www.niro.dk/niro/cmsdoc.nsf/WebDoc/ndkw6dknxs. Accessed Aug 18, 2008. Stapelfeldt H, Nielsen BR, Skibsted LH. 1997. Effect of heat treatment, water activity and storage temperature on the oxidative stability of whole milk powder. International Dairy Journal 7(5):331-9. Steen K. 1977. Seasonal variations in the composition of dry whole milk and its keeping qualities under storing. Maelkeritidende 90(5-6):126-140, 152-68. Toso B, Procida G, Stefanon B. 2002. Determination of volatile compounds in cows' milk using headspace GC-MS. J Dairy Res 69(4):569-77. Tuohy J. 1984. Developments in the packaging of whole milk powder. Farm and Food Res 15(1):7-9. [USDA-AMS]. United States Department of Agriculture-Agricultural Marketing Service. 2001. DA Instruction No. 918-RL. Available from: Dairy Grading Branch, Dairy Division. Washington, DC 20090-6456. [USDA-ARS]. United States Department of Agriculture-Agricultural Research Service. 2007. USDA National Nutrient Database for Standard Reference, Release 20. Available from: http://www.ars.usda.gov/main/site_main.htm?modecode=12354500. Accessed Aug 18, 2008. [USDA-FAS]. United States Department of Agriculture-Foreign Agricultural Service. 2008. Dairy: World Markets and Trade July 2008. 25 p. Available from: http://www.fas.usda.gov/dlp/circular/2008/dairy_07-2008.pdf. Accessed August 18, 2008. [USDEC]. United States Dairy Export Council. 2005. Reference Manual for US Milk Powders: 2005 Revised Edition. Available from: http://www.usdec.org/publications/PubDetail.cfm?ItemNumber=213 Accessed July 22, 2008. [USDEC]. United States Dairy Export Council. 2007. Unprecedented: Markets, Demand, Delivery. 2007 Annual Report. Arlington, VA. 20 p. Available from: http://usdec.files.cms-plus.com/PDFs/USDEC2007AnnualReport.pdf. Accessed July 22, 2008. [USDEC]. United States Dairy Export Council. 2008. Export Profile. 8 p. Available from: http://usdec.files.cms-plus.com/ExportProfile/Export%20Profile%20July%2008.pdf. Accessed July 22, 2008.
78
Ulberth F, Roubicek D. 1995. Monitoring of oxidative deterioration of milk powder by headspace gas-chromatography. Int Dairy J 5(6):523-31. Ullrich F, Grosch W. 1987. Identification of the most intense volatile flavor compounds formed during autoxidation of linoleic acid. Zeitschrift Fur Lebensmittel-Untersuchung Und-Forschung 184(4):277-82. Urbach G. 1990. Effect of feed on flavor in dairy foods. J Dairy Sci 73(12):3639-3650. van Den Dool H, Kratz PD. 1963. A generalization of retention index system including linear temperature programmed gas-liquid partition chromatography. J Chromatogr 11(4):463-71. van Gemert LJ. 2003. Flavor thresholds: compilations of flavour threshold values in water and other media. The Netherlands: Oliemans Punter and Partners BV. 400 p. van Mil P, Jans JA. 1991. Storage stability of whole milk powder: effects of process and storage conditions on product properties. Neth Milk Dairy J 45(3):145-67. Vazquez-Landaverde PA, Velazquez G, Torres JA, Qian MC. 2005. Quantitative determination of thermally derived off-flavor compounds in milk using solid-phase microextraction and gas chromatography. J Dairy Sci 88(11):3764-72. Vignolles ML, Jeantet R, Lopez C, Schuck P. 2007. Free fat, surface fat and dairy powders: interactions between process and product. A review. Lait 87(3):187-236. Wehr H, Frank J. 2004. Standard methods for the examination of dairy products. 17 ed. Washington, DC: American Public Health Association. 570 p. Whitfield FB, Hill JL, Shaw KJ. 1997. 2,4,6-tribromoanisole: A potential cause of mustiness in packaged food. J Agric Food Chem 45(3):889-893. Wiley AS. 2007. Transforming milk in a global economy. American Anthropologist 109(4):666-677. Wright BJ, Zevchak SE, Wright JM, Drake MA. 2008. Impact of agglomeration on flavor and flavor stability of whey proteins. J Food Sci Forthcoming.
79
Acknowledgments
The authors wish to express thanks to the participating WMP suppliers for donating
samples, to California Dairies, Inc., for their assistance with proximate analyses, to the
California Dairy Research Foundation (Davis, CA) for their support of this research, and
to the members of the whole milk powder descriptive panel for evaluating so many
samples.

80
Tables
Table 1. Mean initial analysesa of whole milk powder (WMP) from four US facilities across 5 shipments, with minimum and maximum values and comparison with previous research.
Facility
A Facility
B Facility
C Facility
D US WMPb
International WMPc
Recommended valuesd
aw 0.16b 0.18a 0.15b 0.15b 0.11-0.24 --- --- (0.004) (0.008) (0.007) (0.007) Moisture (%) 2.5b 2.9a 2.4b 2.4b 2.0-3.3 2.2-3.0 <4.5 (0.05) (0.06) (0.07) (0.07) WPN (mg/g) 5.4a 4.7b 4.2c 4.5b 3.7-5.9 1.2-4.2 --- (0.06) (0.05) (0.07) (0.06) Fat (%) 29.3a 29.0a 28.7a 29.5a 26.2-32.0 26.1-27.6 26-40 (0.18) (0.08) (0.26) (0.32) Free fat (%) 2.0c 3.2b 4.2a 1.6c 1.1-7.7 2.8-6.7 --- (0.07) (0.09) (0.44) (0.12) Iron (mg/kg) 1.2a 1.0a 1.5a 1.0a 0.2-3.1 4.7-7.3 <10 (0.13) (0.09) (0.25) (0.13) Copper (mg/kg) 0.24b 0.35ab 0.47a 0.27b 0.1-0.9 0.4-0.9 <1.5 (0.03) (0.03) (0.07) (0.05) Mn (mg/kg) 0.66a 0.14b 0.18b 0.13b 0.1-2.1 --- --- (0.14) (0.01) (0.03) (0.01) Zn (mg/kg) 32.3c 34.2a 34.4a 32.9b 30.7-35.7 37.0-40.7 --- (0.16) (0.13) (0.22) (0.30) Standard plate count (CFU/g) 215a 3904a 495a 273a 84-34,000 1100-14,000 <10,000 (38.4) (2341.7) (126.9) (81.1) Coliforms (CFU/g) 13a 7a 33a 24a <10-256 --- <10 (6.9) (3.1) (17.6) (8.7) a Different letters within a row indicate significant differences (p<0.05). Values in parenthesis are standard errors of the means. b Ranges from this study. cRanges compiled from Steen 1977; Van Mil and Jans 1991. d From ADPI 2002.
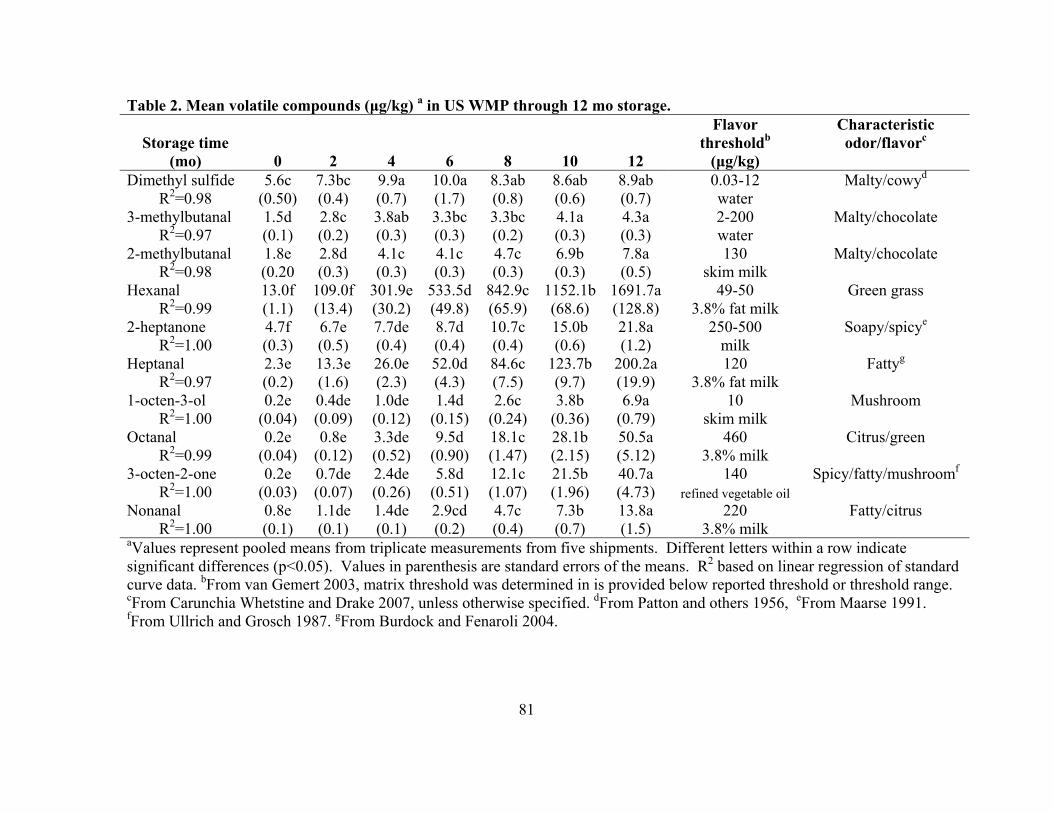
81
Table 2. Mean volatile compounds (μg/kg) a in US WMP through 12 mo storage.
Storage time (mo) 0 2 4 6 8 10 12
Flavor thresholdb
(μg/kg)
Characteristic odor/flavorc
Dimethyl sulfide 5.6c 7.3bc 9.9a 10.0a 8.3ab 8.6ab 8.9ab 0.03-12 Malty/cowyd R2=0.98 (0.50) (0.4) (0.7) (1.7) (0.8) (0.6) (0.7) water
3-methylbutanal 1.5d 2.8c 3.8ab 3.3bc 3.3bc 4.1a 4.3a 2-200 Malty/chocolate R2=0.97 (0.1) (0.2) (0.3) (0.3) (0.2) (0.3) (0.3) water
2-methylbutanal 1.8e 2.8d 4.1c 4.1c 4.7c 6.9b 7.8a 130 Malty/chocolate R2=0.98 (0.20 (0.3) (0.3) (0.3) (0.3) (0.3) (0.5) skim milk
Hexanal 13.0f 109.0f 301.9e 533.5d 842.9c 1152.1b 1691.7a 49-50 Green grass R2=0.99 (1.1) (13.4) (30.2) (49.8) (65.9) (68.6) (128.8) 3.8% fat milk
2-heptanone 4.7f 6.7e 7.7de 8.7d 10.7c 15.0b 21.8a 250-500 Soapy/spicye R2=1.00 (0.3) (0.5) (0.4) (0.4) (0.4) (0.6) (1.2) milk
Heptanal 2.3e 13.3e 26.0e 52.0d 84.6c 123.7b 200.2a 120 Fattyg R2=0.97 (0.2) (1.6) (2.3) (4.3) (7.5) (9.7) (19.9) 3.8% fat milk
1-octen-3-ol 0.2e 0.4de 1.0de 1.4d 2.6c 3.8b 6.9a 10 Mushroom R2=1.00 (0.04) (0.09) (0.12) (0.15) (0.24) (0.36) (0.79) skim milk
Octanal 0.2e 0.8e 3.3de 9.5d 18.1c 28.1b 50.5a 460 Citrus/green R2=0.99 (0.04) (0.12) (0.52) (0.90) (1.47) (2.15) (5.12) 3.8% milk
3-octen-2-one 0.2e 0.7de 2.4de 5.8d 12.1c 21.5b 40.7a 140 Spicy/fatty/mushroomf R2=1.00 (0.03) (0.07) (0.26) (0.51) (1.07) (1.96) (4.73) refined vegetable oil
Nonanal 0.8e 1.1de 1.4de 2.9cd 4.7c 7.3b 13.8a 220 Fatty/citrus R2=1.00 (0.1) (0.1) (0.1) (0.2) (0.4) (0.7) (1.5) 3.8% milk
aValues represent pooled means from triplicate measurements from five shipments. Different letters within a row indicate significant differences (p<0.05). Values in parenthesis are standard errors of the means. R2 based on linear regression of standard curve data. bFrom van Gemert 2003, matrix threshold was determined in is provided below reported threshold or threshold range. cFrom Carunchia Whetstine and Drake 2007, unless otherwise specified. dFrom Patton and others 1956, eFrom Maarse 1991. fFrom Ullrich and Grosch 1987. gFrom Burdock and Fenaroli 2004.
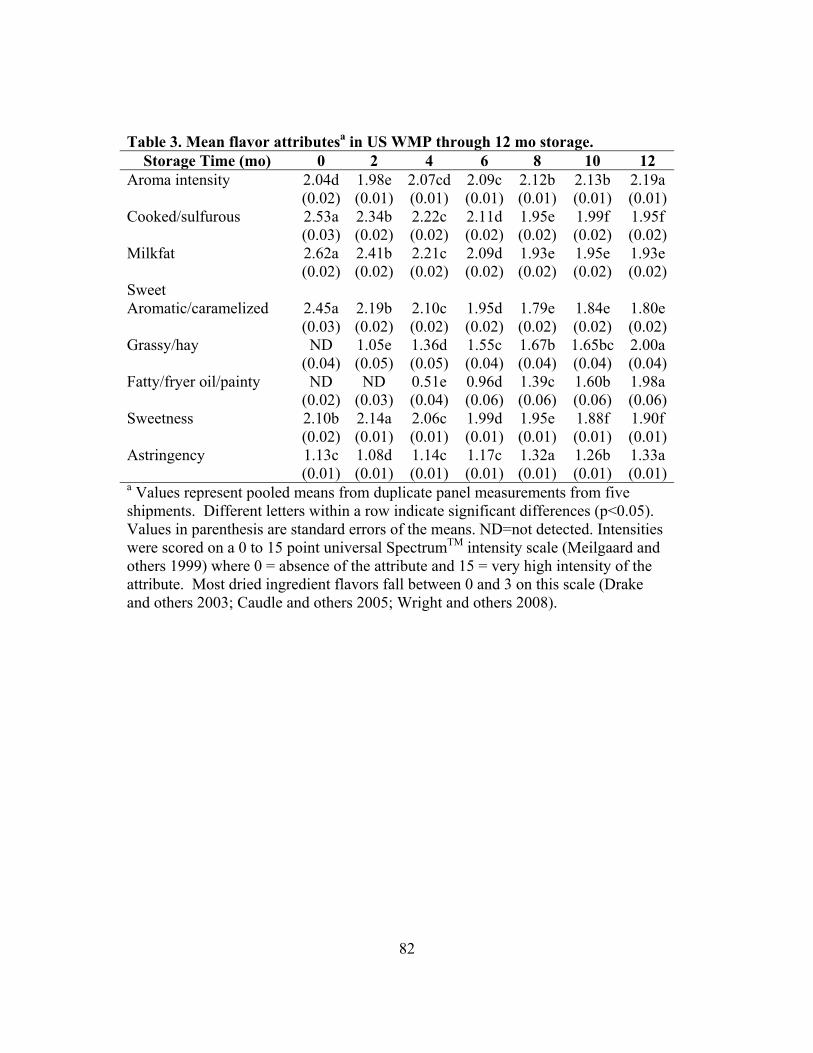
82
Table 3. Mean flavor attributesa in US WMP through 12 mo storage. Storage Time (mo) 0 2 4 6 8 10 12
Aroma intensity 2.04d 1.98e 2.07cd 2.09c 2.12b 2.13b 2.19a (0.02) (0.01) (0.01) (0.01) (0.01) (0.01) (0.01)Cooked/sulfurous 2.53a 2.34b 2.22c 2.11d 1.95e 1.99f 1.95f (0.03) (0.02) (0.02) (0.02) (0.02) (0.02) (0.02)Milkfat 2.62a 2.41b 2.21c 2.09d 1.93e 1.95e 1.93e (0.02) (0.02) (0.02) (0.02) (0.02) (0.02) (0.02)Sweet Aromatic/caramelized 2.45a 2.19b 2.10c 1.95d 1.79e 1.84e 1.80e (0.03) (0.02) (0.02) (0.02) (0.02) (0.02) (0.02)Grassy/hay ND 1.05e 1.36d 1.55c 1.67b 1.65bc 2.00a (0.04) (0.05) (0.05) (0.04) (0.04) (0.04) (0.04)Fatty/fryer oil/painty ND ND 0.51e 0.96d 1.39c 1.60b 1.98a (0.02) (0.03) (0.04) (0.06) (0.06) (0.06) (0.06)Sweetness 2.10b 2.14a 2.06c 1.99d 1.95e 1.88f 1.90f (0.02) (0.01) (0.01) (0.01) (0.01) (0.01) (0.01)Astringency 1.13c 1.08d 1.14c 1.17c 1.32a 1.26b 1.33a (0.01) (0.01) (0.01) (0.01) (0.01) (0.01) (0.01)a Values represent pooled means from duplicate panel measurements from five shipments. Different letters within a row indicate significant differences (p<0.05). Values in parenthesis are standard errors of the means. ND=not detected. Intensities were scored on a 0 to 15 point universal SpectrumTM intensity scale (Meilgaard and others 1999) where 0 = absence of the attribute and 15 = very high intensity of the attribute. Most dried ingredient flavors fall between 0 and 3 on this scale (Drake and others 2003; Caudle and others 2005; Wright and others 2008).
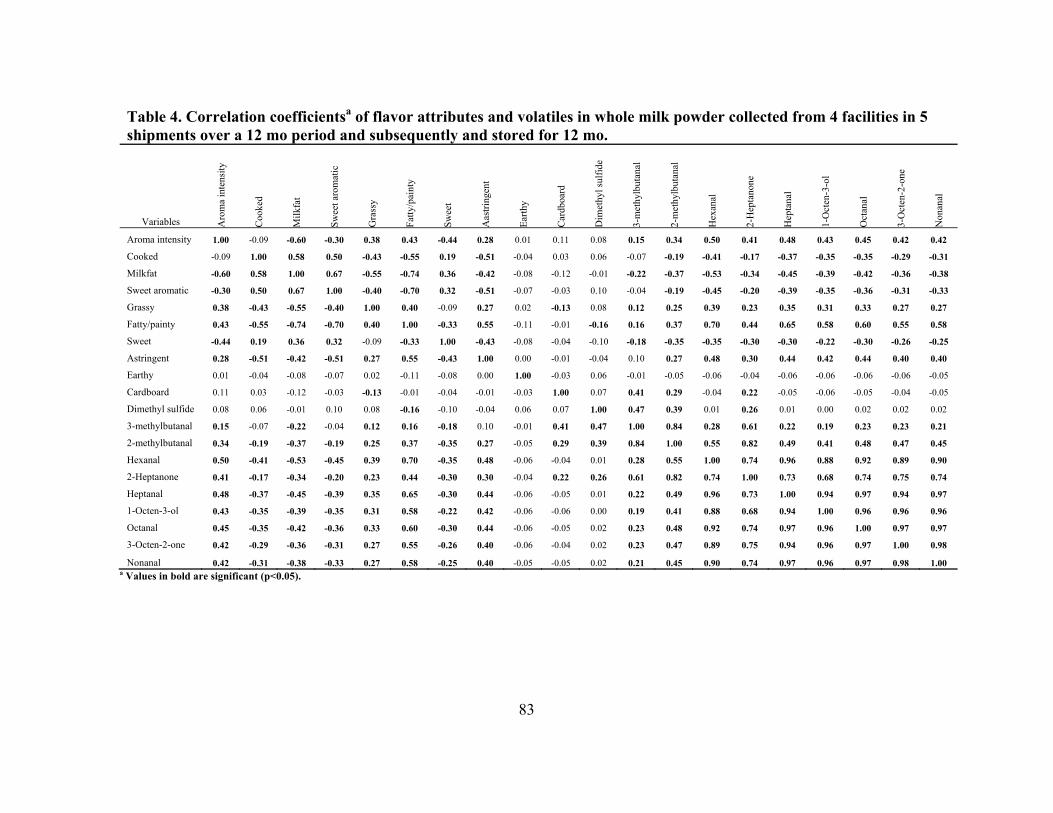
83
Table 4. Correlation coefficientsa of flavor attributes and volatiles in whole milk powder collected from 4 facilities in 5 shipments over a 12 mo period and subsequently and stored for 12 mo.
Variables Aro
ma
inte
nsity
Coo
ked
Mil
kfat
Sw
eet a
rom
atic
Gra
ssy
Fat
ty/p
aint
y
Sw
eet
Aas
trin
gent
Ear
thy
Car
dboa
rd
Dim
ethy
l sul
fide
3-m
ethy
lbut
anal
2-m
ethy
lbut
anal
Hex
anal
2-H
epta
none
Hep
tana
l
1-O
cten
-3-o
l
Oct
anal
3-O
cten
-2-o
ne
Non
anal
Aroma intensity 1.00 -0.09 -0.60 -0.30 0.38 0.43 -0.44 0.28 0.01 0.11 0.08 0.15 0.34 0.50 0.41 0.48 0.43 0.45 0.42 0.42
Cooked -0.09 1.00 0.58 0.50 -0.43 -0.55 0.19 -0.51 -0.04 0.03 0.06 -0.07 -0.19 -0.41 -0.17 -0.37 -0.35 -0.35 -0.29 -0.31
Milkfat -0.60 0.58 1.00 0.67 -0.55 -0.74 0.36 -0.42 -0.08 -0.12 -0.01 -0.22 -0.37 -0.53 -0.34 -0.45 -0.39 -0.42 -0.36 -0.38
Sweet aromatic -0.30 0.50 0.67 1.00 -0.40 -0.70 0.32 -0.51 -0.07 -0.03 0.10 -0.04 -0.19 -0.45 -0.20 -0.39 -0.35 -0.36 -0.31 -0.33
Grassy 0.38 -0.43 -0.55 -0.40 1.00 0.40 -0.09 0.27 0.02 -0.13 0.08 0.12 0.25 0.39 0.23 0.35 0.31 0.33 0.27 0.27
Fatty/painty 0.43 -0.55 -0.74 -0.70 0.40 1.00 -0.33 0.55 -0.11 -0.01 -0.16 0.16 0.37 0.70 0.44 0.65 0.58 0.60 0.55 0.58
Sweet -0.44 0.19 0.36 0.32 -0.09 -0.33 1.00 -0.43 -0.08 -0.04 -0.10 -0.18 -0.35 -0.35 -0.30 -0.30 -0.22 -0.30 -0.26 -0.25
Astringent 0.28 -0.51 -0.42 -0.51 0.27 0.55 -0.43 1.00 0.00 -0.01 -0.04 0.10 0.27 0.48 0.30 0.44 0.42 0.44 0.40 0.40
Earthy 0.01 -0.04 -0.08 -0.07 0.02 -0.11 -0.08 0.00 1.00 -0.03 0.06 -0.01 -0.05 -0.06 -0.04 -0.06 -0.06 -0.06 -0.06 -0.05
Cardboard 0.11 0.03 -0.12 -0.03 -0.13 -0.01 -0.04 -0.01 -0.03 1.00 0.07 0.41 0.29 -0.04 0.22 -0.05 -0.06 -0.05 -0.04 -0.05
Dimethyl sulfide 0.08 0.06 -0.01 0.10 0.08 -0.16 -0.10 -0.04 0.06 0.07 1.00 0.47 0.39 0.01 0.26 0.01 0.00 0.02 0.02 0.02
3-methylbutanal 0.15 -0.07 -0.22 -0.04 0.12 0.16 -0.18 0.10 -0.01 0.41 0.47 1.00 0.84 0.28 0.61 0.22 0.19 0.23 0.23 0.21
2-methylbutanal 0.34 -0.19 -0.37 -0.19 0.25 0.37 -0.35 0.27 -0.05 0.29 0.39 0.84 1.00 0.55 0.82 0.49 0.41 0.48 0.47 0.45
Hexanal 0.50 -0.41 -0.53 -0.45 0.39 0.70 -0.35 0.48 -0.06 -0.04 0.01 0.28 0.55 1.00 0.74 0.96 0.88 0.92 0.89 0.90
2-Heptanone 0.41 -0.17 -0.34 -0.20 0.23 0.44 -0.30 0.30 -0.04 0.22 0.26 0.61 0.82 0.74 1.00 0.73 0.68 0.74 0.75 0.74
Heptanal 0.48 -0.37 -0.45 -0.39 0.35 0.65 -0.30 0.44 -0.06 -0.05 0.01 0.22 0.49 0.96 0.73 1.00 0.94 0.97 0.94 0.97
1-Octen-3-ol 0.43 -0.35 -0.39 -0.35 0.31 0.58 -0.22 0.42 -0.06 -0.06 0.00 0.19 0.41 0.88 0.68 0.94 1.00 0.96 0.96 0.96
Octanal 0.45 -0.35 -0.42 -0.36 0.33 0.60 -0.30 0.44 -0.06 -0.05 0.02 0.23 0.48 0.92 0.74 0.97 0.96 1.00 0.97 0.97
3-Octen-2-one 0.42 -0.29 -0.36 -0.31 0.27 0.55 -0.26 0.40 -0.06 -0.04 0.02 0.23 0.47 0.89 0.75 0.94 0.96 0.97 1.00 0.98
Nonanal 0.42 -0.31 -0.38 -0.33 0.27 0.58 -0.25 0.40 -0.05 -0.05 0.02 0.21 0.45 0.90 0.74 0.97 0.96 0.97 0.98 1.00 a Values in bold are significant (p<0.05).
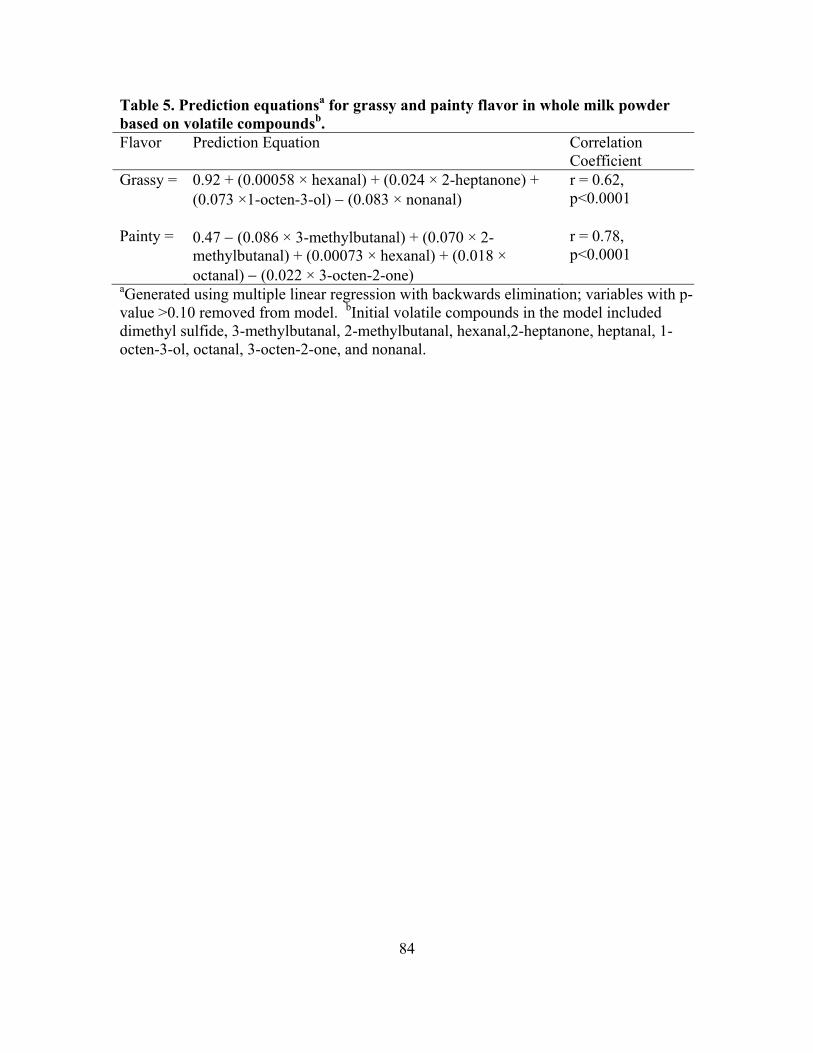
84
Table 5. Prediction equationsa for grassy and painty flavor in whole milk powder based on volatile compoundsb. Flavor Prediction Equation Correlation
Coefficient Grassy = 0.92 + (0.00058 × hexanal) + (0.024 × 2-heptanone) +
(0.073 ×1-octen-3-ol) (0.083 × nonanal)
r = 0.62, p<0.0001
Painty = 0.47 (0.086 × 3-methylbutanal) + (0.070 × 2-methylbutanal) + (0.00073 × hexanal) + (0.018 × octanal) (0.022 × 3-octen-2-one)
r = 0.78, p<0.0001
aGenerated using multiple linear regression with backwards elimination; variables with p-value >0.10 removed from model. bInitial volatile compounds in the model included dimethyl sulfide, 3-methylbutanal, 2-methylbutanal, hexanal,2-heptanone, heptanal, 1-octen-3-ol, octanal, 3-octen-2-one, and nonanal.

85
Figures
Figure 1. Experimental design.
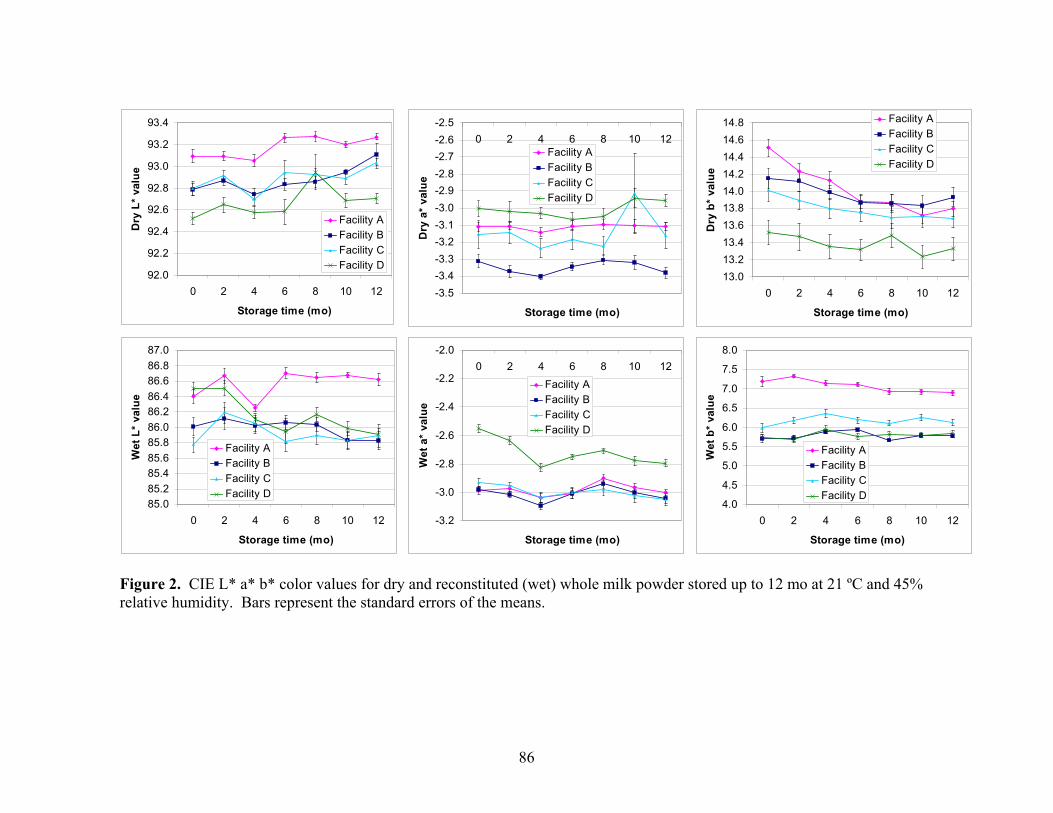
86
Figure 2. CIE L* a* b* color values for dry and reconstituted (wet) whole milk powder stored up to 12 mo at 21 ºC and 45% relative humidity. Bars represent the standard errors of the means.
92.0
92.2
92.4
92.6
92.8
93.0
93.2
93.4
0 2 4 6 8 10 12
Storage time (mo)
Dry
L*
valu
e
Facility A
Facility B
Facility C
Facility D
-3.5
-3.4
-3.3
-3.2
-3.1
-3.0
-2.9
-2.8
-2.7
-2.6
-2.5
0 2 4 6 8 10 12
Storage time (mo)
Dry
a*
valu
e
Facility A
Facility B
Facility C
Facility D
13.0
13.2
13.4
13.6
13.8
14.0
14.2
14.4
14.6
14.8
0 2 4 6 8 10 12
Storage time (mo)
Dry
b*
valu
e
Facility A
Facility B
Facility C
Facility D
85.0
85.2
85.4
85.6
85.8
86.0
86.2
86.4
86.6
86.8
87.0
0 2 4 6 8 10 12
Storage time (mo)
Wet
L*
valu
e
Facility A
Facility B
Facility C
Facility D
-3.2
-3.0
-2.8
-2.6
-2.4
-2.2
-2.0
0 2 4 6 8 10 12
Storage time (mo)
Wet
a*
valu
e
Facility A
Facility B
Facility C
Facility D
4.0
4.5
5.0
5.5
6.0
6.5
7.0
7.5
8.0
0 2 4 6 8 10 12
Storage time (mo)
Wet
b*
valu
e
Facility A
Facility B
Facility C
Facility D
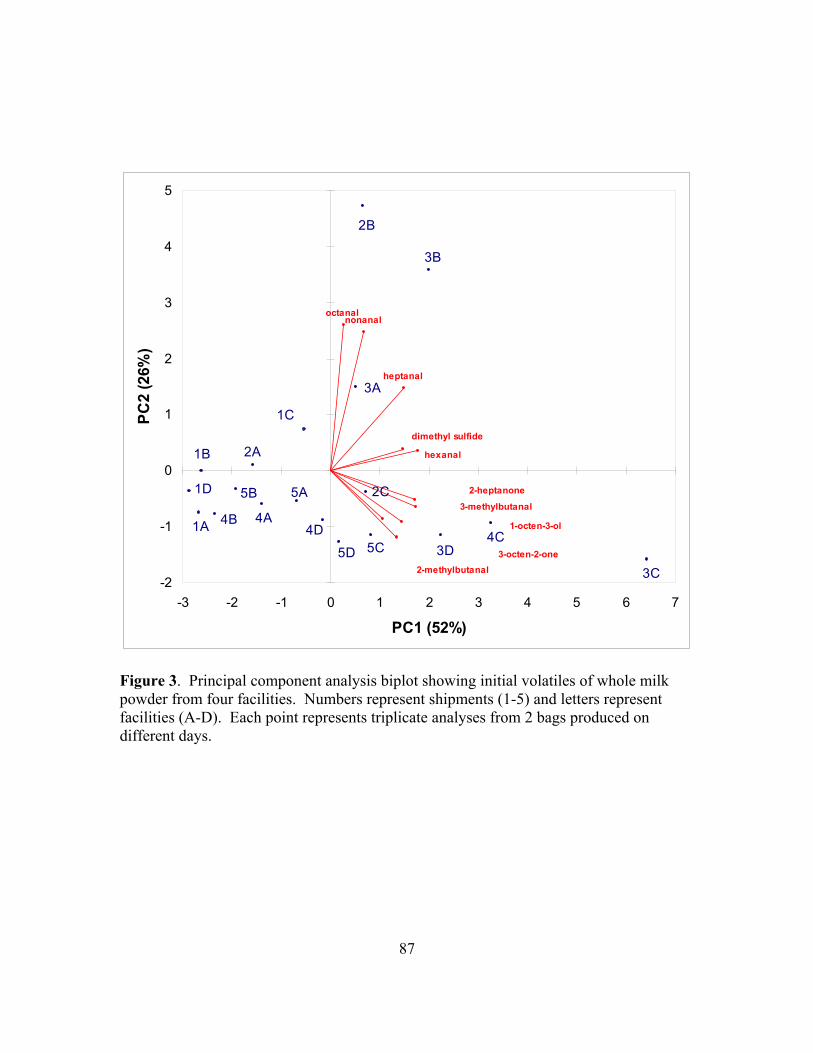
87
5D
4D
3D
1D
5C4C
3C
2C
1C
5B
4B
3B
2B
1B
5A
4A
3A
2A
1A
nonanal
3-octen-2-one
octanal
1-octen-3-ol
heptanal
2-heptanone
hexanal
2-methylbutanal
3-methylbutanal
dimethyl sulfide
-2
-1
0
1
2
3
4
5
-3 -2 -1 0 1 2 3 4 5 6 7
PC1 (52%)
PC2
(26%
)
Figure 3. Principal component analysis biplot showing initial volatiles of whole milk powder from four facilities. Numbers represent shipments (1-5) and letters represent facilities (A-D). Each point represents triplicate analyses from 2 bags produced on different days.
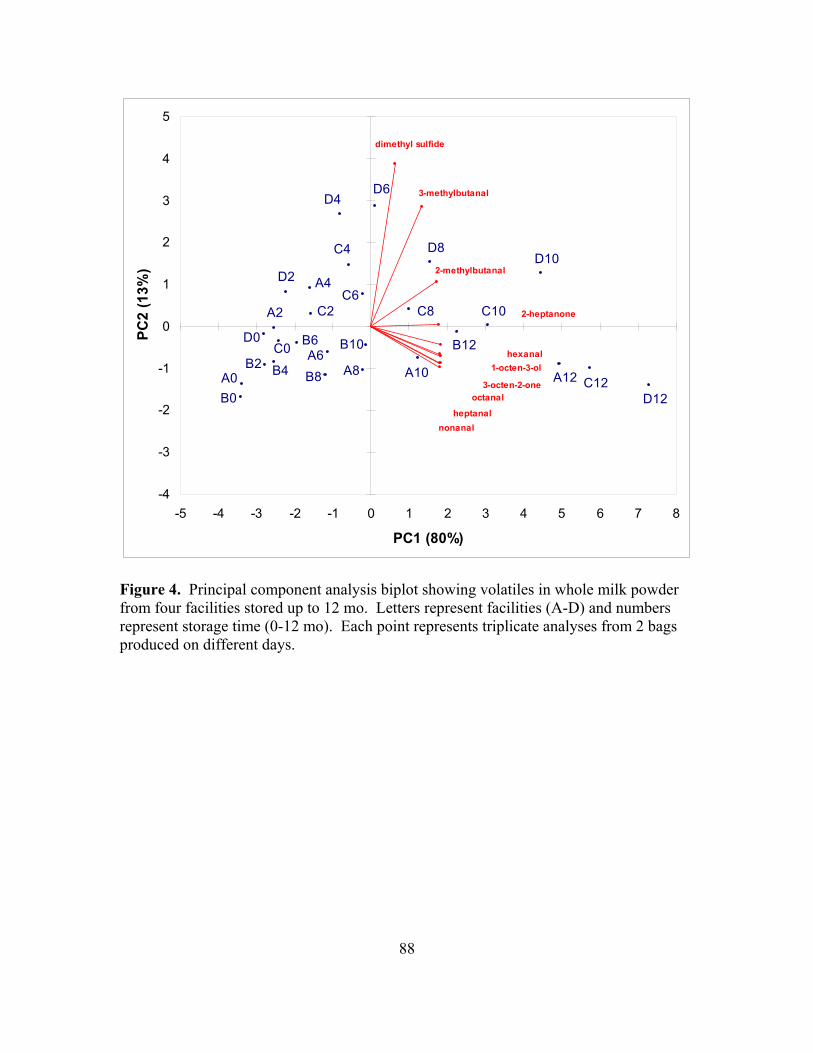
88
A0
A2
A4
A6A8 A10 A12
B0
B2 B4
B6
B8
B10 B12C0
C2
C4
C6C8 C10
C12
D0
D2
D4D6
D8D10
D12
1-octen-3-ol
2-heptanone
2-methylbutanal
3-methylbutanal
3-octen-2-one
dimethyl sulfide
heptanal
hexanal
nonanal
octanal
-4
-3
-2
-1
0
1
2
3
4
5
-5 -4 -3 -2 -1 0 1 2 3 4 5 6 7 8
PC1 (80%)
PC2
(13%
)
Figure 4. Principal component analysis biplot showing volatiles in whole milk powder from four facilities stored up to 12 mo. Letters represent facilities (A-D) and numbers represent storage time (0-12 mo). Each point represents triplicate analyses from 2 bags produced on different days.
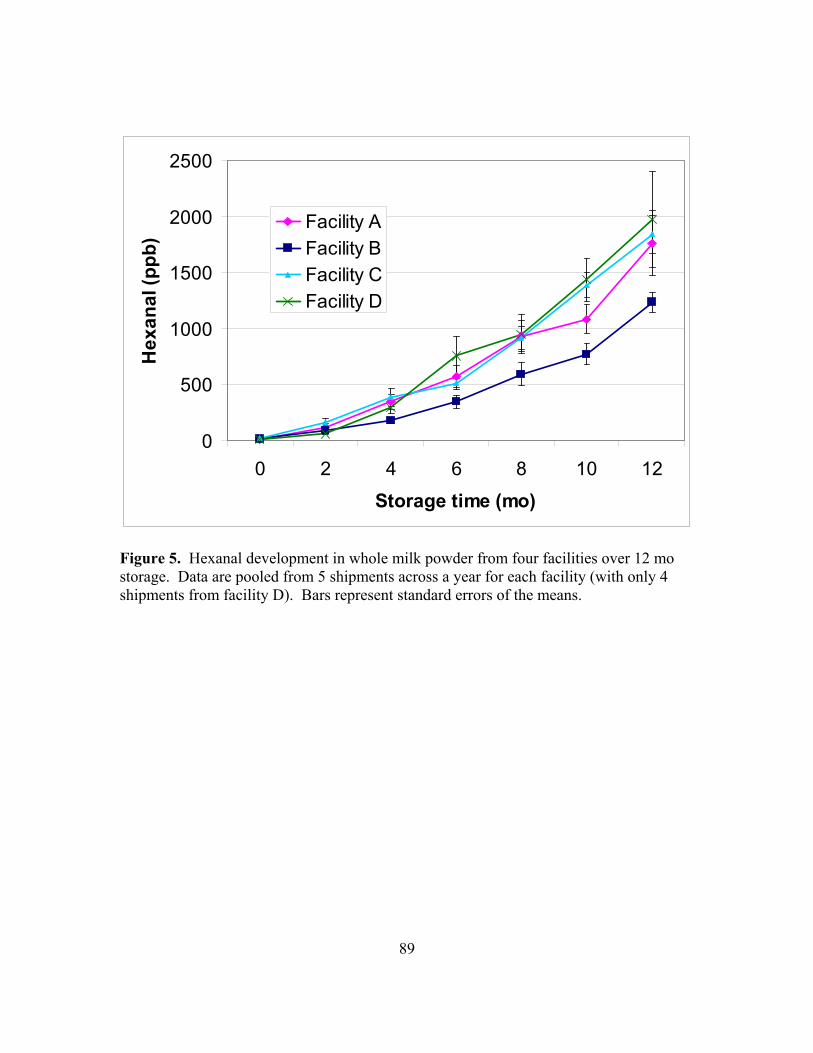
89
0
500
1000
1500
2000
2500
0 2 4 6 8 10 12
Storage time (mo)
Hex
anal
(ppb
)
Facility AFacility BFacility CFacility D
Figure 5. Hexanal development in whole milk powder from four facilities over 12 mo storage. Data are pooled from 5 shipments across a year for each facility (with only 4 shipments from facility D). Bars represent standard errors of the means.
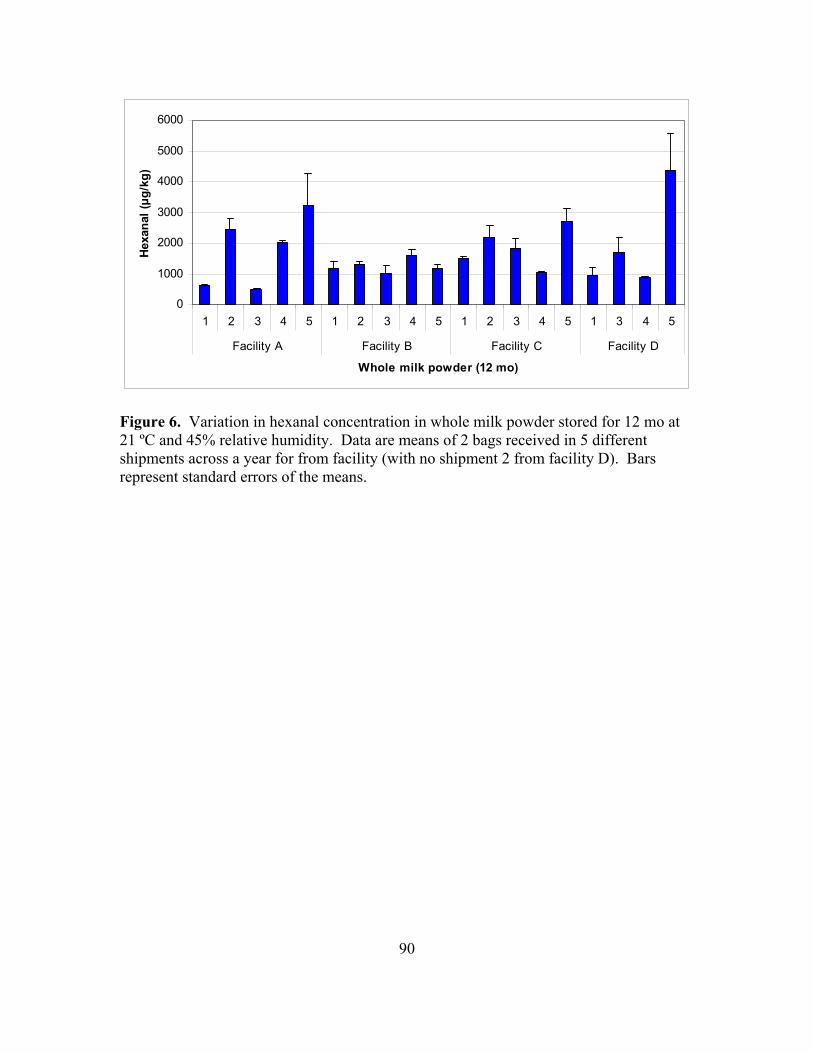
90
0
1000
2000
3000
4000
5000
6000
1 2 3 4 5 1 2 3 4 5 1 2 3 4 5 1 3 4 5
Facility A Facility B Facility C Facility D
Whole milk powder (12 mo)
Hexa
nal (μ
g/kg
)
Figure 6. Variation in hexanal concentration in whole milk powder stored for 12 mo at 21 ºC and 45% relative humidity. Data are means of 2 bags received in 5 different shipments across a year for from facility (with no shipment 2 from facility D). Bars represent standard errors of the means.
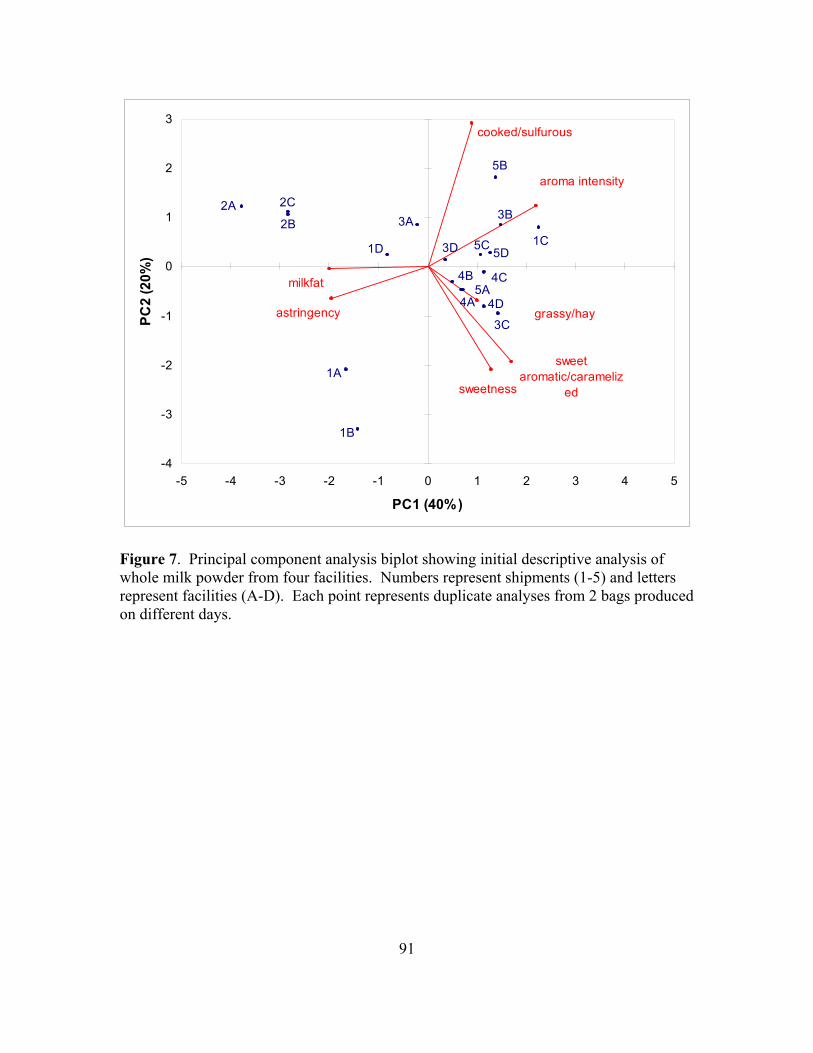
91
1A
2A3A
4A5A
1B
2B3B
4B
5B
1C
2C
3C
4C
5C1D 3D
4D
5D
aroma intensity
cooked/sulfurous
milkfat
sweet aromatic/carameliz
ed
grassy/hay
sweetness
astringency
-4
-3
-2
-1
0
1
2
3
-5 -4 -3 -2 -1 0 1 2 3 4 5
PC1 (40%)
PC2
(20%
)
Figure 7. Principal component analysis biplot showing initial descriptive analysis of whole milk powder from four facilities. Numbers represent shipments (1-5) and letters represent facilities (A-D). Each point represents duplicate analyses from 2 bags produced on different days.
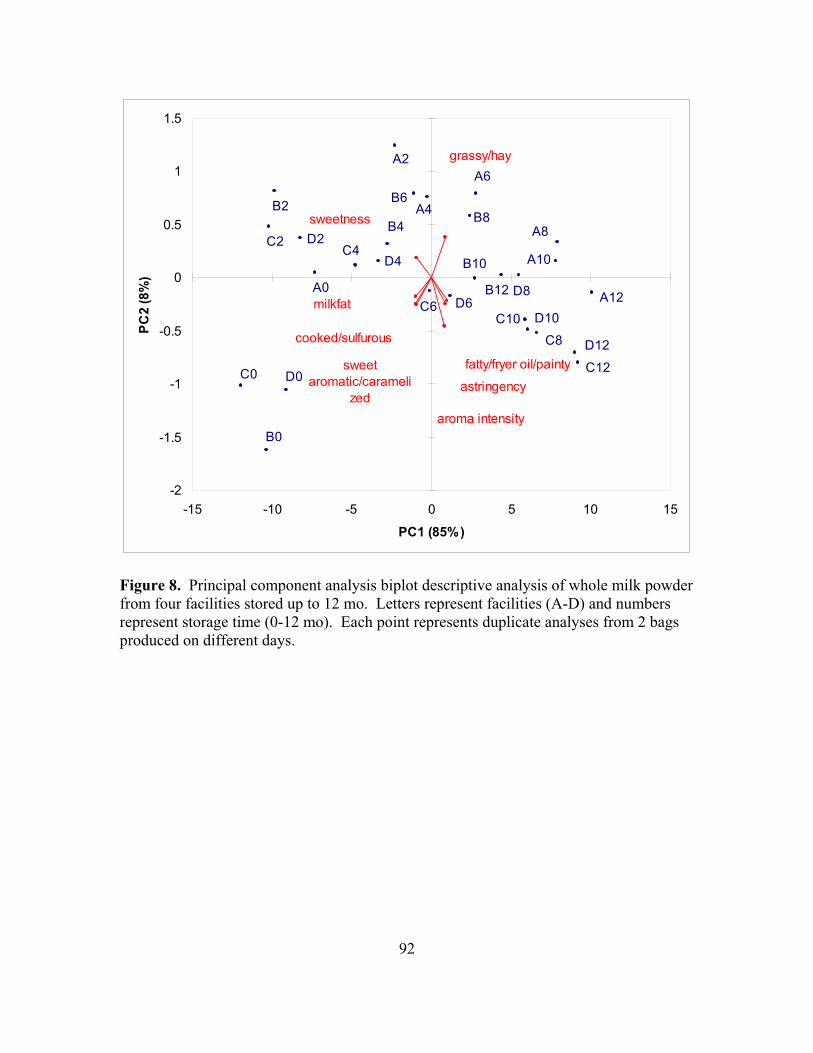
92
A0
A10
A12
A2
A4
A6
A8
B0
B10
B12
B2
B4
B6
B8
C0
C10
C12
C2C4
C6
C8
D0
D10
D12
D2
D4
D6D8
aroma intensity
cooked/sulfurous
milkfat
sweet aromatic/carameli
zed
grassy/hay
fatty/fryer oil/painty
sweetness
astringency
-2
-1.5
-1
-0.5
0
0.5
1
1.5
-15 -10 -5 0 5 10 15
PC1 (85%)
PC2
(8%
)
Figure 8. Principal component analysis biplot descriptive analysis of whole milk powder from four facilities stored up to 12 mo. Letters represent facilities (A-D) and numbers represent storage time (0-12 mo). Each point represents duplicate analyses from 2 bags produced on different days.
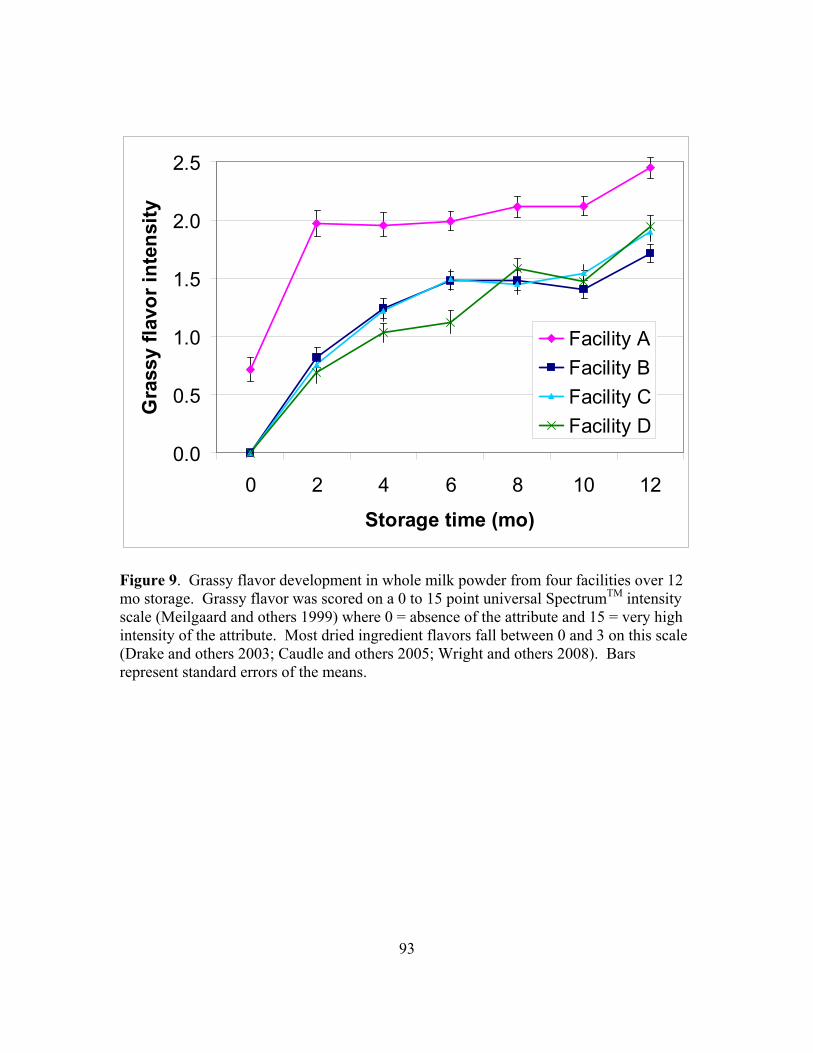
93
0.0
0.5
1.0
1.5
2.0
2.5
0 2 4 6 8 10 12
Storage time (mo)
Gra
ssy
flavo
r int
ensi
ty
Facility A
Facility B
Facility C
Facility D
Figure 9. Grassy flavor development in whole milk powder from four facilities over 12 mo storage. Grassy flavor was scored on a 0 to 15 point universal SpectrumTM intensity scale (Meilgaard and others 1999) where 0 = absence of the attribute and 15 = very high intensity of the attribute. Most dried ingredient flavors fall between 0 and 3 on this scale (Drake and others 2003; Caudle and others 2005; Wright and others 2008). Bars represent standard errors of the means.
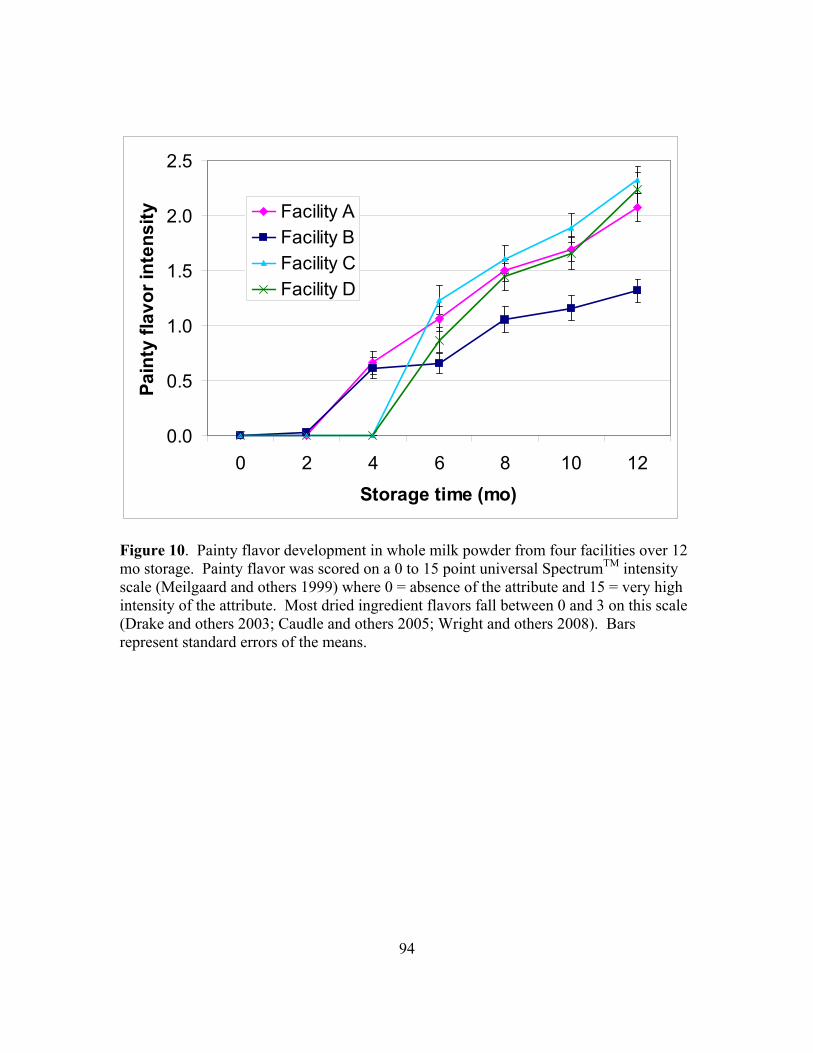
94
0.0
0.5
1.0
1.5
2.0
2.5
0 2 4 6 8 10 12
Storage time (mo)
Pain
ty fl
avor
inte
nsity Facility A
Facility BFacility CFacility D
Figure 10. Painty flavor development in whole milk powder from four facilities over 12 mo storage. Painty flavor was scored on a 0 to 15 point universal SpectrumTM intensity scale (Meilgaard and others 1999) where 0 = absence of the attribute and 15 = very high intensity of the attribute. Most dried ingredient flavors fall between 0 and 3 on this scale (Drake and others 2003; Caudle and others 2005; Wright and others 2008). Bars represent standard errors of the means.
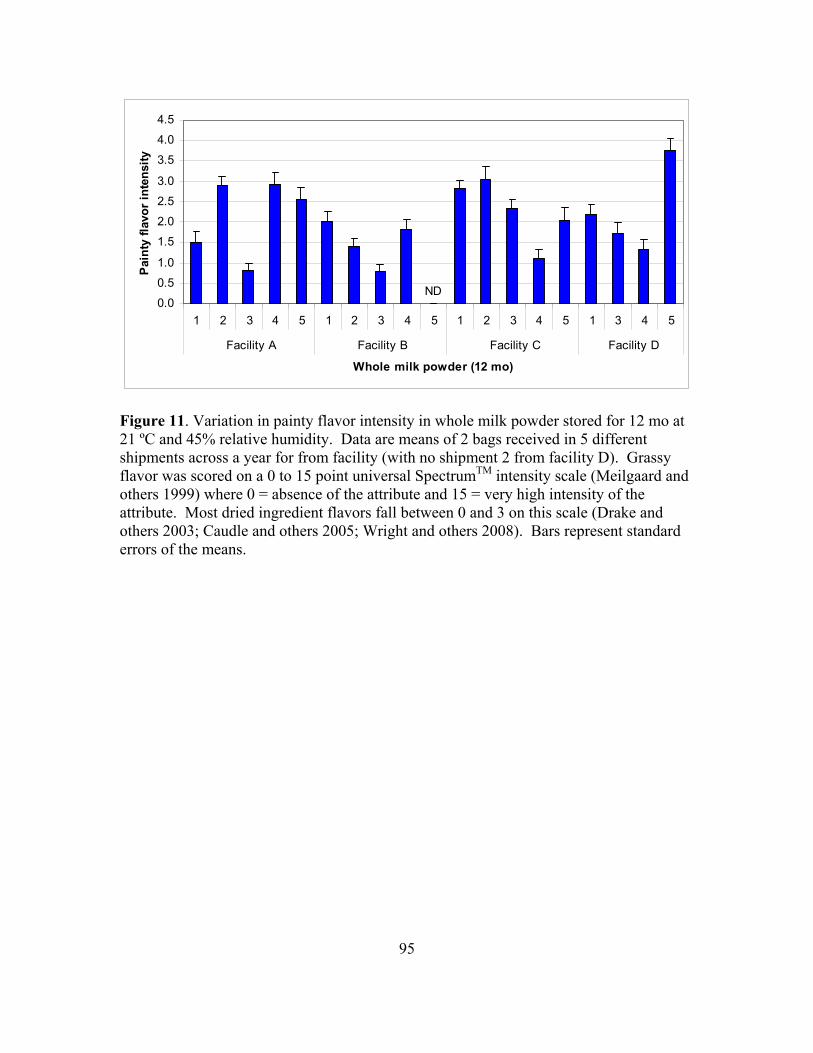
95
0.0
0.5
1.0
1.5
2.0
2.5
3.0
3.5
4.0
4.5
1 2 3 4 5 1 2 3 4 5 1 2 3 4 5 1 3 4 5
Facility A Facility B Facility C Facility D
Whole milk powder (12 mo)
Pain
ty fl
avor
inte
nsity
ND
Figure 11. Variation in painty flavor intensity in whole milk powder stored for 12 mo at 21 ºC and 45% relative humidity. Data are means of 2 bags received in 5 different shipments across a year for from facility (with no shipment 2 from facility D). Grassy flavor was scored on a 0 to 15 point universal SpectrumTM intensity scale (Meilgaard and others 1999) where 0 = absence of the attribute and 15 = very high intensity of the attribute. Most dried ingredient flavors fall between 0 and 3 on this scale (Drake and others 2003; Caudle and others 2005; Wright and others 2008). Bars represent standard errors of the means.
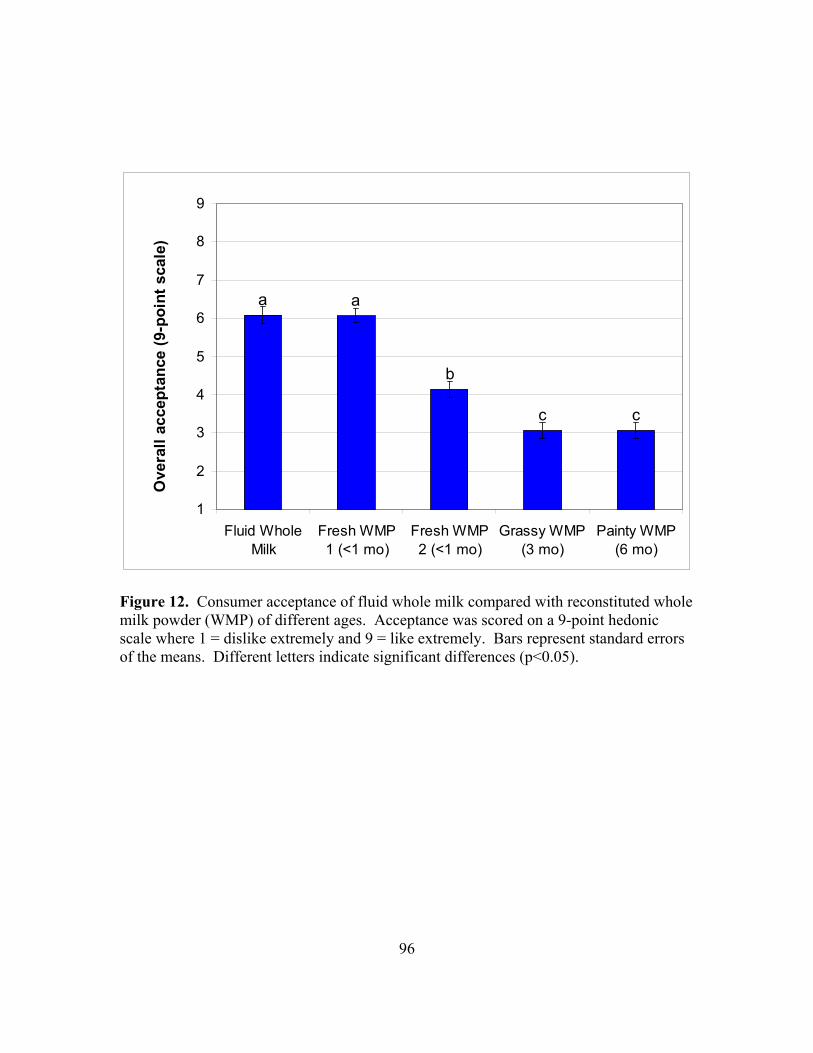
96
a a
b
c c
1
2
3
4
5
6
7
8
9
Fluid WholeMilk
Fresh WMP1 (<1 mo)
Fresh WMP2 (<1 mo)
Grassy WMP(3 mo)
Painty WMP(6 mo)
Ove
rall
acce
ptan
ce (9
-poi
nt s
cale
)
Figure 12. Consumer acceptance of fluid whole milk compared with reconstituted whole milk powder (WMP) of different ages. Acceptance was scored on a 9-point hedonic scale where 1 = dislike extremely and 9 = like extremely. Bars represent standard errors of the means. Different letters indicate significant differences (p<0.05).
97
Effect of Nitrogen Flushing and Storage Temperature on Flavor and Shelf-life of Whole Milk Powder
M.A. Lloyd1, S.J. Hess2, and M.A. Drake1*
1Department of Food, Bioprocessing, and Nutrition Sciences Southeast Dairy Foods Research Center
North Carolina State University Raleigh, NC 27695
2The Hershey Company,
Technical Center 1025 Reese Avenue Hershey, PA 17033
*MaryAnne Drake Telephone: 919-513-4598
Fax: 919-515-7124 Email: [email protected]
Flavor of Whole Milk Powder… Journal section: Sensory and Food Quality
98
ABSTRACT:
The US industry standard for shelf-life of whole milk powder (WMP) is 6-9 mo, although
previous research has demonstrated flavor changes by 3 mo at ambient storage. This
study evaluated the influence of packaging atmosphere, storage temperature, and storage
time on WMP shelf-life through sensory and instrumental techniques. Two batches of
WMP were repackaged in plastic laminate pouches with air or nitrogen and stored at 2 ºC
or 23 ºC for one y. Descriptive analysis was conducted using a 10-member trained panel;
volatile analysis was performed using solid-phase microextraction (SPME) with gas
chromatography-mass spectrometry (GC-MS). Consumer acceptance (n=75) was
conducted every 3 mo with reconstituted WMP and white and milk chocolate made from
each treatment. Data were analyzed using analysis of variance with Fisher’s LSD,
Pearson’s correlation analysis, and principal component analysis with significance at
p<0.05. Air stored WMP had higher peroxide values, lipid oxidation volatiles and grassy
and painty flavors than nitrogen flushed WMP. Storage temperature did not impact
levels of straight chain lipid oxidation volatiles; 23 ºC storage resulted in higher cooked
and milkfat flavors and lower levels of grassy flavor compared with 2 ºC storage.
Consumer acceptance was negatively correlated with lipid oxidation volatiles and painty
flavor. Nitrogen flushing prevented the development of painty flavor in WMP stored up
to 1 y at either temperature, resulting in chocolate with high consumer acceptance.
Nitrogen flushing can be applied to extend the shelf life of WMP for use in chocolate;
storage temperature also plays a role, but to a lesser extent.
Key words: dairy, flavor, storage, volatiles, whole dry milk
99
Introduction
Whole milk powder (WMP) contains 26-40% fat, making it very susceptible to
oxidation, which can result in off-flavors (USDEC 2005). The US industry standard for
shelf-life of WMP is 6-9 mo under storage at <27 ºC and <65% relative humidity
(USDEC 2005), although previous research demonstrated flavor changes by 3 mo in
ambient temperature storage (Carunchia Whetstine and Drake 2007). Increasing the
storage stability of this commodity is of great interest to producers and end users. Some
factors that influence WMP flavor and shelf-life include initial milk quality, processing
variables, air quality, moisture content, packaging, oxygen exposure, addition of
antioxidants, light exposure, and storage temperature (Nielsen and others 1997; Baldwin
and Ackland, 1991; Kurtz and others 1969; Christensen and others 1951; Stapelfeldt and
others 1997; van Mil and Jans 1991; Hough and others 2002; Heiss and Eichner 1971;
Hall and Lingnert 1984; Tamsma and Pallansch 1964).
Van Mil and Jans (1991) reported a 3-year shelf-life for WMP processed and
stored under optimal conditions, including: (1) moderate heat treatment of 95 ºC for 2
min (undenatured whey protein nitrogen of 1.7), (2) moisture content at least 2.8%, (3)
storage 20 ºC, and (4) air and moisture proof oxygen reduced packaging. Many
researchers have found substantial benefits with reduced oxygen storage for WMP (Chan
and others 1993; Tuohy 1984; McCluskey and others 1997; Pyenson and Tracy 1946; van
Mil and Jans 1991). Most WMP storage studies have evaluated WMP at ambient or
elevated storage temperatures (Stapelfeldt and others 1997; Tamsma and Pallansch 1964;
van Mil and Jans 1991), but information is lacking on WMP stored at cooler
100
temperatures. WMP may be classified as low, medium, or high heat based on
undenatured whey protein nitrogen (WPN), with values of ≥6, 1.51-5.99, and 1.5 mg
undenatured whey protein /g powder, respectively (USDEC 2005). Stapelfeldt and others
(1997) found WMP to be most stable when the fluid product was heated under medium
(80 ºC/20s) or high (88 ºC/20s) heat treatments before spray drying, with water activities
between 0.1 and 0.2 (as opposed to 0.3), stored at 25 ºC (rather than 45 ºC). Solubility
index has been used by a number of researchers to evaluate WMP quality (Baldwin and
Ackland 1991; van Mil and Jans 1991; Nielsen and others 1997; Celestino and others
1997), and peroxide value (PV) is commonly used to evaluate lipid oxidation in WMP
(McCluskey and others 1997; Pyenson and Tracy 1946; van Mil and Jans 1991; Decker
and others 1951). The development of off-flavors in WMP has been monitored by the
development of lipid oxidation volatiles as well as through descriptive sensory analysis
(Biolatto and others 2007; Hall and Andersson 1985; Hall and others 1985; Carunchia
Whetstine and Drake 2007; Baldwin and others 1991; van Mil and Jans 1991). Off-
flavors observed in WMP during storage have been described as fatty, grassy, painty,
oxidized (tallowy, waxy, metallic, oily), green, cardboard, casein, and mushroom (Hall
and Lingnert 1984; Carunchia Whetstine and Drake 2007; Baldwin and others 1991).
Lipid oxidation volatiles detected in WMP included hexanal, heptanal, octanal, nonanal,
decanal, Z-4-heptenal, E, E-2,4-heptadienal, E-2-octanal, E-2-decanal, and 3-octen-2-one
(Biolatto and others 2007; Carunchia Whetstine and Drake 2007; Hall and others 1985).
Flavor is the main factor influencing consumer acceptance of WMP and other
foods (Lee and Morr 1994; Drake 2004; Hough and others 2002; Nursten 1997). Over
101
75% of the WMP manufactured in the US goes into confectionary products such as
chocolate, with the remainder used in baked goods, dry sauce and soup mixes, dairy
beverages, ice cream, or other uses (Chandan 1997; USDEC 2001). If the WMP used in
these applications has off flavors, these flavors may carry through into the final product
and result in consumer complaints. Several researchers have related descriptive analysis
to consumer acceptance (Sather and others 1963; Hough and others 2002; Caudle and
others 2005; Bolenz and others 2003). Caudle and others (2005) found that off flavors in
skim milk powder (SMP) carried though into yogurt, hot cocoa, and white chocolate,
resulting in decreased consumer acceptance. Drake (2006) and Wright and others (2008)
also reported decreased consumer acceptance of ingredient applications (protein
beverages) made from dried whey protein with trained panel documented off-flavors.
Bolenz and others (2003) studied milk chocolate made with a variety of dairy ingredients,
including WMP, SMP, anhydrous milkfat, and whey protein concentrate, and found that
consumer acceptance decreased with the presence of malty or off-notes contributed by
dairy ingredients from particular suppliers. However, research is lacking on consumer
acceptance of stored WMP and chocolate made from stored WMP.
The objective of this research was to evaluate the influence of WMP packaging
atmosphere, storage temperature, and storage time on WMP shelf life, as measured by (1)
flavor and stability of WMP and (2) consumer acceptance of WMP and chocolate made
with WMP. Both instrumental and sensory tests were conducted to achieve these
objectives.

102
Materials and Methods
WMP
The experimental design for the study was replicated twice (Figure 1). Freshly
produced (<1 mo), non-agglomerated, WMP (500 kg) was shipped from a commercial
production facility in CA to Hershey, PA where it was repackaged in pouches made up of
a 340 gauge nylon-vinyl alcohol-polyethylene laminate with an oxygen transmission rate
of 1.5 ml/m2/day (Weldon, Oshkosh, WI, USA). Approximately 5.4 kg WMP were put
into each pouch. Half of the pouches were treated with a vacuum to -0.9 bar and nitrogen
to -0.2 bar before sealing. The other half were sealed with ambient air and no vacuum.
Each treatment was protected from light and stored at 2 ºC or 23 ºC in temperature
controlled rooms at 50% relative humidity for one year and evaluated every 2 mo, unless
otherwise specified. Where indicated, WMP was reconstituted to 10% solids not fat
(SNF) before analysis with odor-free deionized water according to the equation in
International Dairy Federation Method 99C (IDF 1997): g whole milk powder in 90 g
water = 1000/(100% fat). WMP were protected from light exposure during storage as
well as during preparation for volatile and sensory analysis.
Physicochemical Tests
Initial Tests. Upon receipt, a subsample of each WMP was sent to an
independent lab (Tulare, CA) for duplicate measurements of moisture, undenatured whey
protein nitrogen index (WPN), fat, and free fat. Moisture content was measured using the
vacuum oven method from DA Instruction 918-RL (USDA-AMS 2001). WPN and fat
103
(Mojonnier method) were measured as described by Wehr and Frank (2004). Free fat
was measured based on the method of Sørensen and others (1978). Copper and iron were
measured in duplicate by the NCSU Analytical Services Laboratory (Raleigh, NC) using
a standard dry ash method with inductively coupled plasma optical emission
spectroscopy (ICP-OES). Briefly, 2.5 g WMP were (1) ashed overnight at 500 ºC in a
muffle furnace, (2) cooled, (3) mixed with approximately 1.5 ml distilled water and 4 ml
6N HCl (VWR West Chester, PA, USA) and heated to dryness on a steam plate to
remove silicates, (4) transferred to a 50 ml volumetric flask with approximately 4 ml of
6N HCl, and (5) brought to volume with distilled water for ICP-OES analysis (Lisa
Lentz, Analytical Services Lab, North Carolina State University, Personal
Communication, 2008). Water activity was measured in duplicate using an Aqualab
series 3 TE water activity meter (Decagon Devices, Pullman, WA, USA). Both water
activity and moisture were also measured at 2 mo intervals through 12 mo storage.
Headspace Oxygen. Headspace oxygen of each WMP package was measured
before other analyses at each time point (every 2 mo) using a Mocon HS750 headspace
analyzer (Mocon Inc., Minneapolis, MN, USA) calibrated to ambient air (20.9% oxygen).
A 1 cm rubber septum with adhesive on one side was attached to the package. Then, 10
ml of headspace gas was drawn out with a syringe and injected into the analyzer to
generate a percent oxygen reading. If a nitrogen flushed treatment was above 6.5%
oxygen (indicative of a poor package seal), this package was excluded from further study.
Extra packages were stored to replace packages that indicated a poor seal by oxygen
measurement.
104
Peroxide Value. Peroxide value (PV) was measured every 2 mo using the
PeroxysafeTM STD Kit with the SaftestTM System (MP Biomedicals United States, Solon,
OH).
Color. CIE L*a*b* values were obtained in triplicate every 2 mo with a Minolta
CR-300 Chroma Meter using light source “C” (Konica Minolta Sensing Americas, Inc.,
Ramsey, NJ , USA) using a 60 x 15 mm petri dish (Becton Dickinson Labware, Franklin
Lakes, NJ, USA). Dry as well as reconstituted powders (10% SNF) and liquid were filled
to the brim (ca 9mm depth) of the larger diameter petri dish top; the dry powder was
compressed with the smaller diameter bottom portion of the dish. Samples were
measured at approximately 22 ºC.
Solubility Index. Every 4 mo, solubility index was determined in duplicate
according to the American Dairy Products Institute (ADPI, 2002). WMP was
reconstituted to 10% SNF based on the equation described previously. Solubility index
was reported as ml sediment in conical centrifuge tubes (Kimble No. 45167-50, Fisher
Scientific, Pittsburgh, PA, USA) after centrifugation at 164 x g.
Volatile Analysis
Volatile compounds of WMP were analyzed in triplicate at 0, 2, 3, 4, 6, 8, 10, and
12 mo using solid phase microextraction (SPME) and a Varian CP-3380 gas
chromatograph (GC) equipped with a Saturn 2000 ion trap mass selective detector (MSD)
from Varian, Inc. (Palo Alto, CA., USA), similar to the method reported by Wright and
others (2008). Briefly, chromatography was performed using a 30 m length x 0.25 mm
i.d. x .25 μm df Rtx®-5 ms column (Restek, Bellefonte, PA, USA) with helium carrier
105
gas at a flow rate of 1 ml/min. Oven temperature was ramped from 40 ºC to 250 ºC at a
rate of 8 ºC/min with 5 min initial and final hold times. MSD conditions were as follows:
80 ºC manifold, 120 ºC transfer line 150 ºC ion trap. Chemical standards and alkanes
were obtained from Sigma Aldrich (St. Louis, MO, USA); methanol was obtained from
VWR (West Chester, PA, USA).
WMP was reconstituted to 10% SNF using 90 ml odor-free deionized water. Five
μl internal standard (5 μl E-2-hexenal in 5 ml methanol) were added to reconstituted milk
to make a final concentration of 45 (μg/kg). Twenty g of the reconstituted sample with
internal standard were added to a 40 ml amber vial with 1.0 g sodium chloride (Fisher
Scientific, Pittsburgh, PA, USA) and an 8 mm x 13 mm stir bar (VWR, West Chester,
PA, USA). A poly(tetrafluoroethyene) coated septum (Supelco, Bellefont, PA, USA)
was placed facing the liquid and screwed into place. A water blank was made by adding
internal standard to 90 ml deodorized water and then adding 20 g of this solution to a 40
ml vial as described above. An alkane series was prepared by adding 1 μl of alkane
solution (approximately 40 mg/kg C7-C24 in hexane) into an empty 40 ml vial and sealed
as described above and used to calculate retention indices (RI) of volatile compounds
(van Den Dool and Kratz 1963).
Sample vials were placed in a heating block at 40 ºC for 30 min to equilibrate. A
2.0 cm DVB/CarboxenTM/PDMS StablefexTM (Supelco, Bellefont, PA, USA) was
inserted and exposed at a depth of 2.0 cm in the heating block for an additional 30 min,
followed by injection into the GC for 5 min at a depth of 3.0 cm. All fibers were
conditioned before use according to manufacturer’s directions. Volatile compounds were
106
identified using the NIST05 mass spectral library (National Institute of Standards and
Technology, Gaithersburg, MD), retention indices (RI), and by comparison with
authentic standard compounds injected under the same conditions. Compounds were
selected for quantification based on previous literature (Hall and others 1985; Hall and
Andersson 1985; Carunchia Whetstine and Drake 2007; Vazquez-Landaverde and others
2005) and comparison of chromatogram peaks over storage. Multiple point internal
standard curves were generated in odor-free water using the same protocol described
above to cover five concentration levels in the range found in the samples for each of the
following compounds: dimethyl sulfide, 3-methylbutanal, 2-methylbutanal, 2-heptanone,
1-octen-3-ol, 3-octen-2-one, hexanal, heptanal, octanal, and nonanal. Stock solutions
were made by dissolving compounds in methanol, with final dilution into 90 ml odor free
water with internal standard. Data were plotted with the response ratio (peak area of
standard /peak area of internal standard) on the y-axis and concentration ratio
(concentration of standard/concentration of internal standard on the x-axis. Regression
equations were generated based on the best linear fit of the data.
Sensory Analysis
Approval for use of human subjects was obtained from the Institutional Review
Board (IRB) at North Carolina State University. WMP was reconstituted to 10% SNF
with odor-free deionized water for descriptive and consumer testing. All samples were
served with 3-digit blinding codes. Samples were presented using a Williams design for
a balanced order of presentation (MacFie and others 1989).
107
Descriptive Analysis. Descriptive analysis profiles for each sample were
determined by 10-member trained panel (7 females, 3 males, ages 22 – 47 y, each with at
least 100 h of prior experience with descriptive analysis of dairy ingredients) using the
SpectrumTM method (Meilgaard and others 1999) and the dried dairy ingredient lexicon
developed by Drake and others (2003) and previously applied to WMP by (Carunchia
Whetstine and Drake 2007). The following attributes were rated: aroma intensity,
cooked, milkfat, sweet aromatic/caramelized, grassy, painty, and cardboard flavors and
sweet taste and astringency, About 25 ml were poured into 60 ml plastic soufflé cups
with lids (Solo Cup Company, Highland Park, IL, USA) and served at 20 ºC. Samples
were evaluated in duplicate by each panelist initially and after 2, 3, 4, 6, 8, 10 and 12 mo
storage.
Panelists were trained using fresh and aged WMP samples. Evaluations were
conducted in individual sensory booths using Compusense® five version 4.6
(Compusense, Guelph, Ontario, Canada) software for data collection. Panelists received
a set of eight samples to evaluate in each session, with a half hour break between
sessions. Deionized water was provided for panelists to refresh their palates between
samples. Empty cups were also provided for sample expectoration. Warm-up samples of
fresh fluid milk, as well as examples of fresh (free of grassy or painty flavors), grassy and
painty flavored reconstituted WMP (previously evaluated and discussed by the panel)
were provided at each session for panelist calibration.
Consumer Acceptance. Consumer acceptance was conducted every 3 mo with
reconstituted WMP and white and milk chocolate made from each treatment, with each

108
product tested on separate days. A freshly produced WMP or chocolate manufactured
with freshly produced WMP was also included as a control. A fresh fluid milk control
purchased from a local retail outlet was also included as a control in the reconstituted
WMP testing. Consumers (n=75) rated overall acceptance (9-point hedonic scale, 1=
dislike extremely and 9 = like extremely). For WMP, approximately 90 ml reconstituted
WMP was served in 177 ml foam cups with lids (Dart Container Corporation, Mason,
MI, USA) and straws (Solo Cup Company, Highland Park, IL, USA). Samples were
prepared a day in advance and stored at 5 ºC until served.
Both milk and white chocolate bars were made by an industry partner using a
fresh control WMP and each of the treatments (Table 1). Ingredients were mixed with
part of the cocoa butter and refined to 25 microns. Then the remainder of the cocoa
butter was added and the mixture was conched for 3 h at 70C. Then, the chocolate was
tempered using seed crystal formed from a small amount of the chocolate. The
tempering progress was monitored using a Chocolate Temper Meter (Tricore, Elgin, IL,
USA). Once a proper temper was reached, samples were molded into bars and sealed in
foil laminate packages (Printpack, Inc., Elgin, IL, USA). Chocolate was shipped to North
Carolina State University and stored for 2 weeks at 20 ºC before consumer testing.
Two 25 x 25 mm squares of each chocolate treatment were served in 60 ml
soufflé cups with lids. Consumers included faculty, staff, and students from North
Carolina State University. Evaluations were conducted in individual sensory booths
using Compusense® five version 4.6 (Compusense Inc., Guelph, Ontario, Canada)
software for data collection. Room temperature filtered water was provided for panelists
109
to cleanse their palates between samples. Panelists were compensated with food treats
and grocery store gift cards.
Statistical Analysis
Statistical analysis was performed using XLSTAT version 2007.5 (Addinsoft
USA, New York, New York, USA), with p<0.05 considered significant. The following
tests were performed: analysis of variance with Fisher’s least significant difference,
Pearson’s correlation analysis, and principal component analysis (PCA).
Results and Discussion
Physicochemical Tests
Initial Testing. The initial properties of the WMP were typical compared with
previously reported US WMP values (Table 2) (USDEC 2005; Farkye 2006; USDA-
ARS 2007; Liang and Hartel 2004). Initial values for moisture and water activity were
2.5% ± 0.2 and 0.17 ± 0.03, respectively. By 12 mo, both moisture and water activity
increased (p<0.05) to levels of 3.3% ± 0.4 and 0.28 ± 0.04, respectively. The 0.8%
increase in moisture we observed was reasonable, considering the 0.6% increase in
moisture noted by Lim and others (1994) in WMP stored in a paper/nylon/polyethylene
laminate for 4 mo. Initial water activity was near the 0.2 recommended by other
researchers (Stapelfeldt and others 1997; Schuck and others 2007). The WPN values
were within in the range recommended by Baldwin and others (1991) to improve storage
stability and to prevent oxidized flavor. Both iron and copper content were well below
the recommended limits of 10 mg/kg and 1.5 mg/kg, respectively (ADPI 2002).
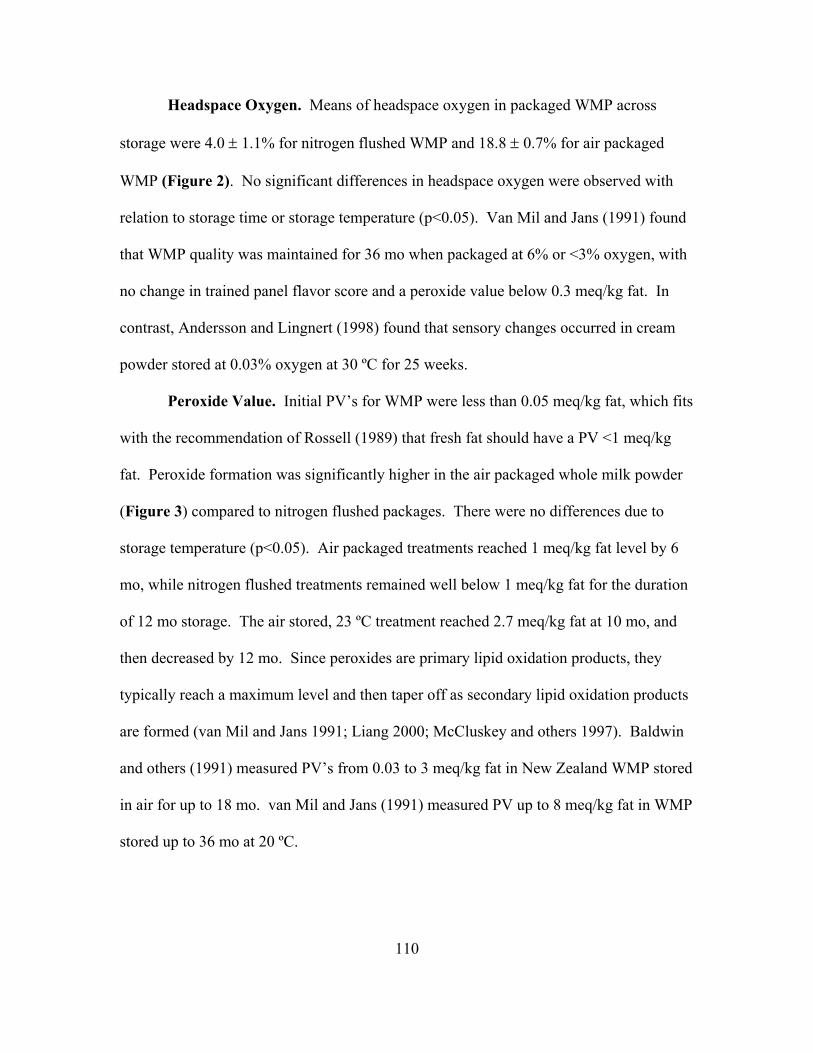
110
Headspace Oxygen. Means of headspace oxygen in packaged WMP across
storage were 4.0 1.1% for nitrogen flushed WMP and 18.8 0.7% for air packaged
WMP (Figure 2). No significant differences in headspace oxygen were observed with
relation to storage time or storage temperature (p<0.05). Van Mil and Jans (1991) found
that WMP quality was maintained for 36 mo when packaged at 6% or <3% oxygen, with
no change in trained panel flavor score and a peroxide value below 0.3 meq/kg fat. In
contrast, Andersson and Lingnert (1998) found that sensory changes occurred in cream
powder stored at 0.03% oxygen at 30 ºC for 25 weeks.
Peroxide Value. Initial PV’s for WMP were less than 0.05 meq/kg fat, which fits
with the recommendation of Rossell (1989) that fresh fat should have a PV <1 meq/kg
fat. Peroxide formation was significantly higher in the air packaged whole milk powder
(Figure 3) compared to nitrogen flushed packages. There were no differences due to
storage temperature (p<0.05). Air packaged treatments reached 1 meq/kg fat level by 6
mo, while nitrogen flushed treatments remained well below 1 meq/kg fat for the duration
of 12 mo storage. The air stored, 23 ºC treatment reached 2.7 meq/kg fat at 10 mo, and
then decreased by 12 mo. Since peroxides are primary lipid oxidation products, they
typically reach a maximum level and then taper off as secondary lipid oxidation products
are formed (van Mil and Jans 1991; Liang 2000; McCluskey and others 1997). Baldwin
and others (1991) measured PV’s from 0.03 to 3 meq/kg fat in New Zealand WMP stored
in air for up to 18 mo. van Mil and Jans (1991) measured PV up to 8 meq/kg fat in WMP
stored up to 36 mo at 20 ºC.

111
Color. When compared to the initial value, differences in color values among the
treatments were noted after 12 mo storage (Table 3). Dry L* values for all treatments
were all significantly lighter than the control, with 23 ºC stored samples closer to the
control than the 2 ºC samples. None of the treatments were different from the control for
dry a*. For dry b*, the 2 ºC stored samples were significantly lower than the 23 ºC
samples. For wet L* and wet a*, the 2 ºC samples were not significantly different from
the control. All samples were significantly higher than the control for wet b* values.
Stapelfeldt and others (1997) found increased lightness (Hunter L-value) and yellowness
(Hunter b-value) during storage for dry WMP, with only small changes in Hunter L- and
b- values for WMP at low water activity, which was in agreement with our results.
Solubility Index. Solubility index was 0.1 ml for all treatments initially and
did not change significantly during 12 mo of storage (data not shown). These results
agree with those of Lloyd and others (2004), who did not find any correlation between
age and solubility index of SMP stored up to 29 y. Unlike our results, Celestino and
others 1997 noted an increase from 0.1 ml to 0.4 ml in WMP stored up to 8 mo at 25 ºC;
similar increases were observed by Baldwin and Ackland (1991) and van Mil and Jans
(1991), who observed increases from 0.3 ml to 0.9 ml and <0.1 to 0.6, respectively, for
WMP stored up to 12 mo at 30 ºC. Differences in solubility index have been noted with
preheat holding time before drying, season, and other factors, but further research is
needed to understand the mechanism for these differences, which could be related to
denaturation of whey proteins, aggregation of casein micelles, or crystallization of lactose
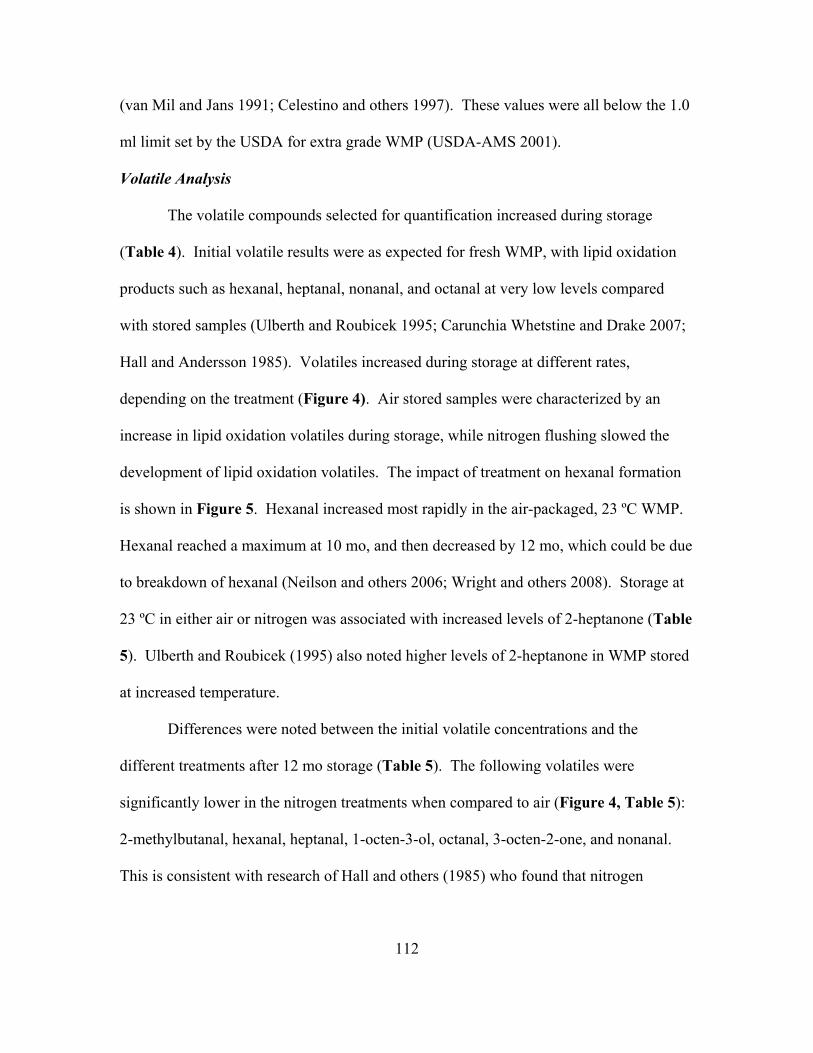
112
(van Mil and Jans 1991; Celestino and others 1997). These values were all below the 1.0
ml limit set by the USDA for extra grade WMP (USDA-AMS 2001).
Volatile Analysis
The volatile compounds selected for quantification increased during storage
(Table 4). Initial volatile results were as expected for fresh WMP, with lipid oxidation
products such as hexanal, heptanal, nonanal, and octanal at very low levels compared
with stored samples (Ulberth and Roubicek 1995; Carunchia Whetstine and Drake 2007;
Hall and Andersson 1985). Volatiles increased during storage at different rates,
depending on the treatment (Figure 4). Air stored samples were characterized by an
increase in lipid oxidation volatiles during storage, while nitrogen flushing slowed the
development of lipid oxidation volatiles. The impact of treatment on hexanal formation
is shown in Figure 5. Hexanal increased most rapidly in the air-packaged, 23 ºC WMP.
Hexanal reached a maximum at 10 mo, and then decreased by 12 mo, which could be due
to breakdown of hexanal (Neilson and others 2006; Wright and others 2008). Storage at
23 ºC in either air or nitrogen was associated with increased levels of 2-heptanone (Table
5). Ulberth and Roubicek (1995) also noted higher levels of 2-heptanone in WMP stored
at increased temperature.
Differences were noted between the initial volatile concentrations and the
different treatments after 12 mo storage (Table 5). The following volatiles were
significantly lower in the nitrogen treatments when compared to air (Figure 4, Table 5):
2-methylbutanal, hexanal, heptanal, 1-octen-3-ol, octanal, 3-octen-2-one, and nonanal.
This is consistent with research of Hall and others (1985) who found that nitrogen
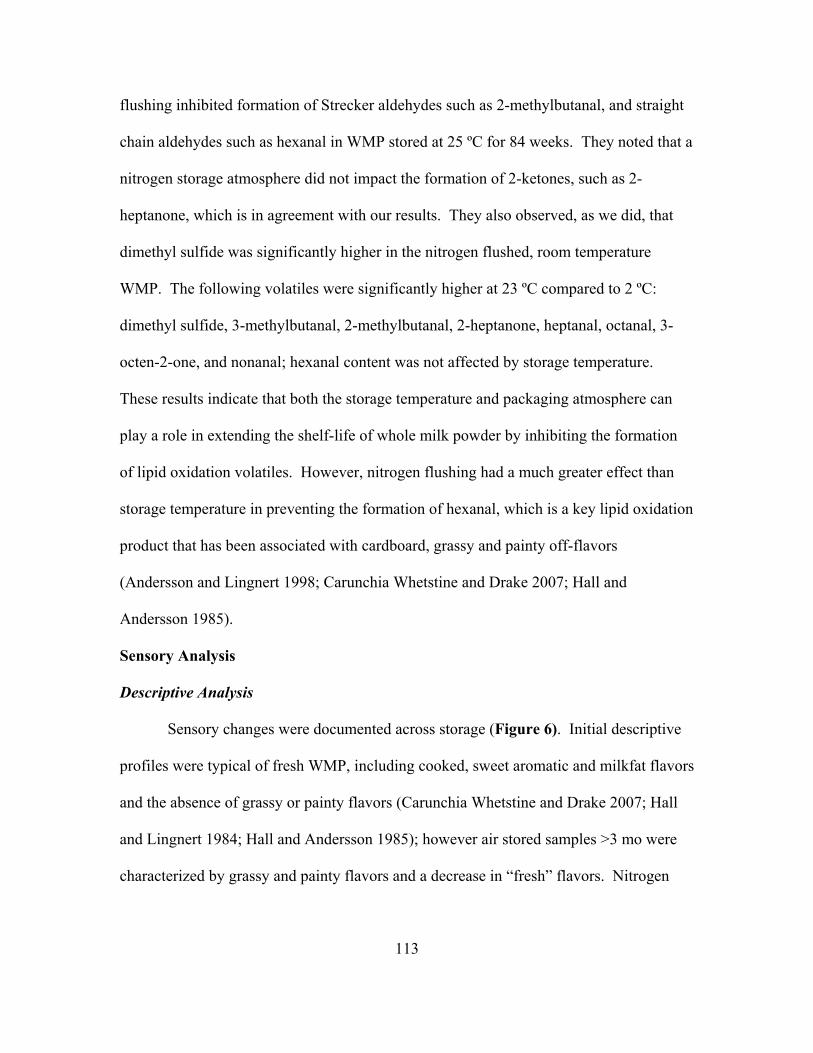
113
flushing inhibited formation of Strecker aldehydes such as 2-methylbutanal, and straight
chain aldehydes such as hexanal in WMP stored at 25 ºC for 84 weeks. They noted that a
nitrogen storage atmosphere did not impact the formation of 2-ketones, such as 2-
heptanone, which is in agreement with our results. They also observed, as we did, that
dimethyl sulfide was significantly higher in the nitrogen flushed, room temperature
WMP. The following volatiles were significantly higher at 23 ºC compared to 2 ºC:
dimethyl sulfide, 3-methylbutanal, 2-methylbutanal, 2-heptanone, heptanal, octanal, 3-
octen-2-one, and nonanal; hexanal content was not affected by storage temperature.
These results indicate that both the storage temperature and packaging atmosphere can
play a role in extending the shelf-life of whole milk powder by inhibiting the formation
of lipid oxidation volatiles. However, nitrogen flushing had a much greater effect than
storage temperature in preventing the formation of hexanal, which is a key lipid oxidation
product that has been associated with cardboard, grassy and painty off-flavors
(Andersson and Lingnert 1998; Carunchia Whetstine and Drake 2007; Hall and
Andersson 1985).
Sensory Analysis
Descriptive Analysis
Sensory changes were documented across storage (Figure 6). Initial descriptive
profiles were typical of fresh WMP, including cooked, sweet aromatic and milkfat flavors
and the absence of grassy or painty flavors (Carunchia Whetstine and Drake 2007; Hall
and Lingnert 1984; Hall and Andersson 1985); however air stored samples >3 mo were
characterized by grassy and painty flavors and a decrease in “fresh” flavors. Nitrogen
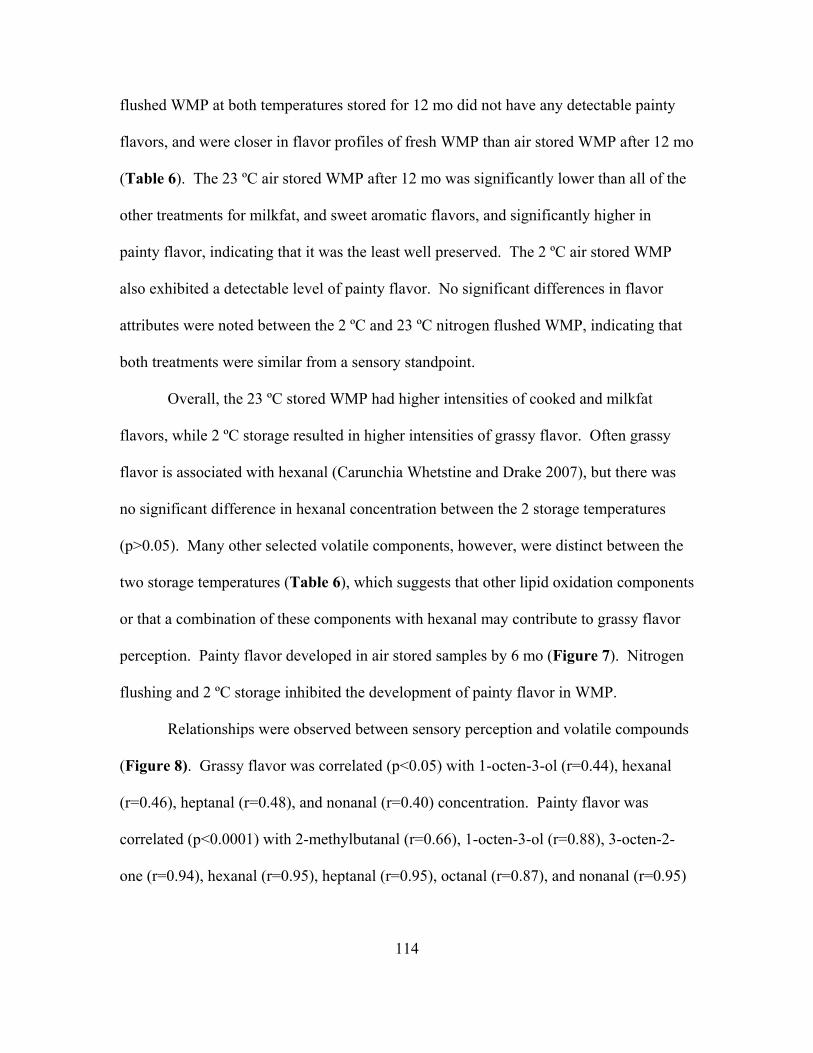
114
flushed WMP at both temperatures stored for 12 mo did not have any detectable painty
flavors, and were closer in flavor profiles of fresh WMP than air stored WMP after 12 mo
(Table 6). The 23 ºC air stored WMP after 12 mo was significantly lower than all of the
other treatments for milkfat, and sweet aromatic flavors, and significantly higher in
painty flavor, indicating that it was the least well preserved. The 2 ºC air stored WMP
also exhibited a detectable level of painty flavor. No significant differences in flavor
attributes were noted between the 2 ºC and 23 ºC nitrogen flushed WMP, indicating that
both treatments were similar from a sensory standpoint.
Overall, the 23 ºC stored WMP had higher intensities of cooked and milkfat
flavors, while 2 ºC storage resulted in higher intensities of grassy flavor. Often grassy
flavor is associated with hexanal (Carunchia Whetstine and Drake 2007), but there was
no significant difference in hexanal concentration between the 2 storage temperatures
(p>0.05). Many other selected volatile components, however, were distinct between the
two storage temperatures (Table 6), which suggests that other lipid oxidation components
or that a combination of these components with hexanal may contribute to grassy flavor
perception. Painty flavor developed in air stored samples by 6 mo (Figure 7). Nitrogen
flushing and 2 ºC storage inhibited the development of painty flavor in WMP.
Relationships were observed between sensory perception and volatile compounds
(Figure 8). Grassy flavor was correlated (p<0.05) with 1-octen-3-ol (r=0.44), hexanal
(r=0.46), heptanal (r=0.48), and nonanal (r=0.40) concentration. Painty flavor was
correlated (p<0.0001) with 2-methylbutanal (r=0.66), 1-octen-3-ol (r=0.88), 3-octen-2-
one (r=0.94), hexanal (r=0.95), heptanal (r=0.95), octanal (r=0.87), and nonanal (r=0.95)
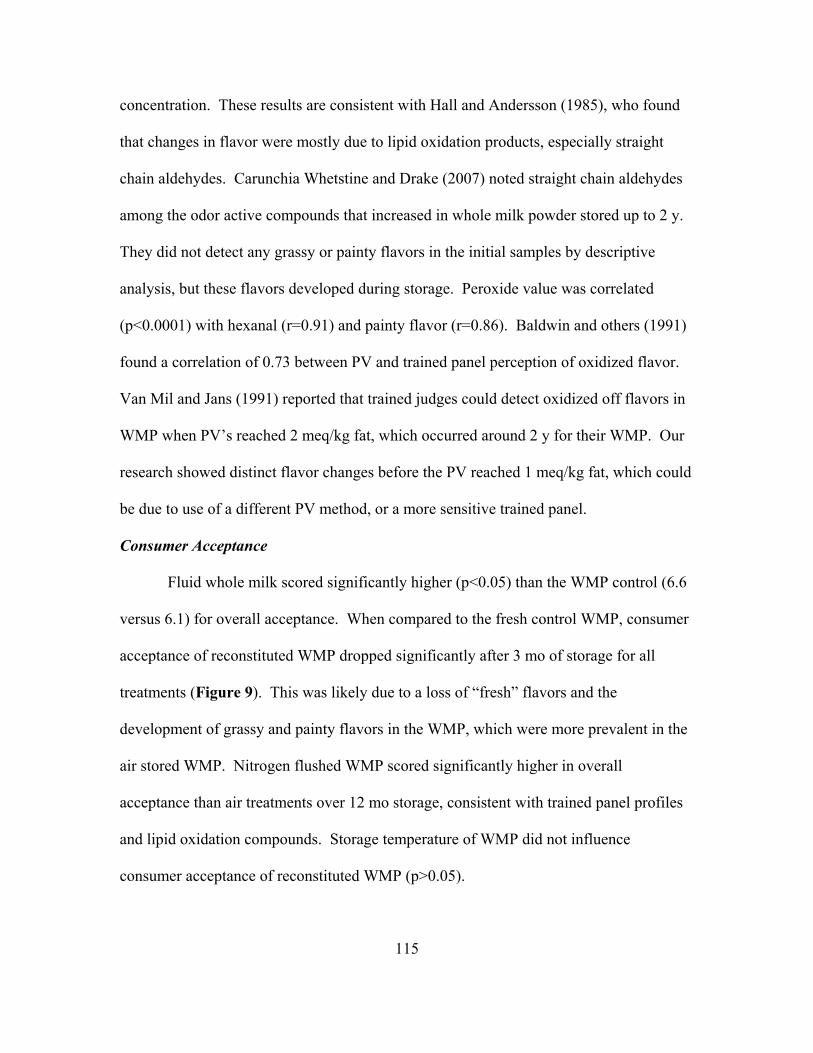
115
concentration. These results are consistent with Hall and Andersson (1985), who found
that changes in flavor were mostly due to lipid oxidation products, especially straight
chain aldehydes. Carunchia Whetstine and Drake (2007) noted straight chain aldehydes
among the odor active compounds that increased in whole milk powder stored up to 2 y.
They did not detect any grassy or painty flavors in the initial samples by descriptive
analysis, but these flavors developed during storage. Peroxide value was correlated
(p<0.0001) with hexanal (r=0.91) and painty flavor (r=0.86). Baldwin and others (1991)
found a correlation of 0.73 between PV and trained panel perception of oxidized flavor.
Van Mil and Jans (1991) reported that trained judges could detect oxidized off flavors in
WMP when PV’s reached 2 meq/kg fat, which occurred around 2 y for their WMP. Our
research showed distinct flavor changes before the PV reached 1 meq/kg fat, which could
be due to use of a different PV method, or a more sensitive trained panel.
Consumer Acceptance
Fluid whole milk scored significantly higher (p<0.05) than the WMP control (6.6
versus 6.1) for overall acceptance. When compared to the fresh control WMP, consumer
acceptance of reconstituted WMP dropped significantly after 3 mo of storage for all
treatments (Figure 9). This was likely due to a loss of “fresh” flavors and the
development of grassy and painty flavors in the WMP, which were more prevalent in the
air stored WMP. Nitrogen flushed WMP scored significantly higher in overall
acceptance than air treatments over 12 mo storage, consistent with trained panel profiles
and lipid oxidation compounds. Storage temperature of WMP did not influence
consumer acceptance of reconstituted WMP (p>0.05).
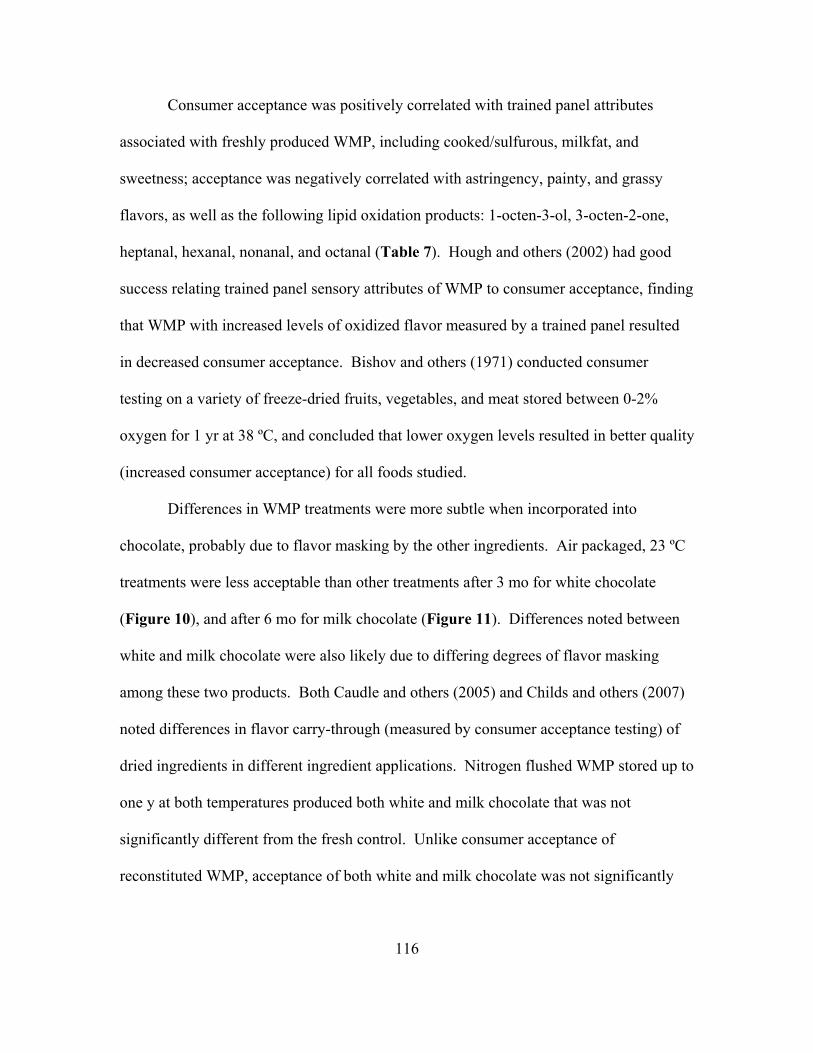
116
Consumer acceptance was positively correlated with trained panel attributes
associated with freshly produced WMP, including cooked/sulfurous, milkfat, and
sweetness; acceptance was negatively correlated with astringency, painty, and grassy
flavors, as well as the following lipid oxidation products: 1-octen-3-ol, 3-octen-2-one,
heptanal, hexanal, nonanal, and octanal (Table 7). Hough and others (2002) had good
success relating trained panel sensory attributes of WMP to consumer acceptance, finding
that WMP with increased levels of oxidized flavor measured by a trained panel resulted
in decreased consumer acceptance. Bishov and others (1971) conducted consumer
testing on a variety of freeze-dried fruits, vegetables, and meat stored between 0-2%
oxygen for 1 yr at 38 ºC, and concluded that lower oxygen levels resulted in better quality
(increased consumer acceptance) for all foods studied.
Differences in WMP treatments were more subtle when incorporated into
chocolate, probably due to flavor masking by the other ingredients. Air packaged, 23 ºC
treatments were less acceptable than other treatments after 3 mo for white chocolate
(Figure 10), and after 6 mo for milk chocolate (Figure 11). Differences noted between
white and milk chocolate were also likely due to differing degrees of flavor masking
among these two products. Both Caudle and others (2005) and Childs and others (2007)
noted differences in flavor carry-through (measured by consumer acceptance testing) of
dried ingredients in different ingredient applications. Nitrogen flushed WMP stored up to
one y at both temperatures produced both white and milk chocolate that was not
significantly different from the fresh control. Unlike consumer acceptance of
reconstituted WMP, acceptance of both white and milk chocolate was not significantly
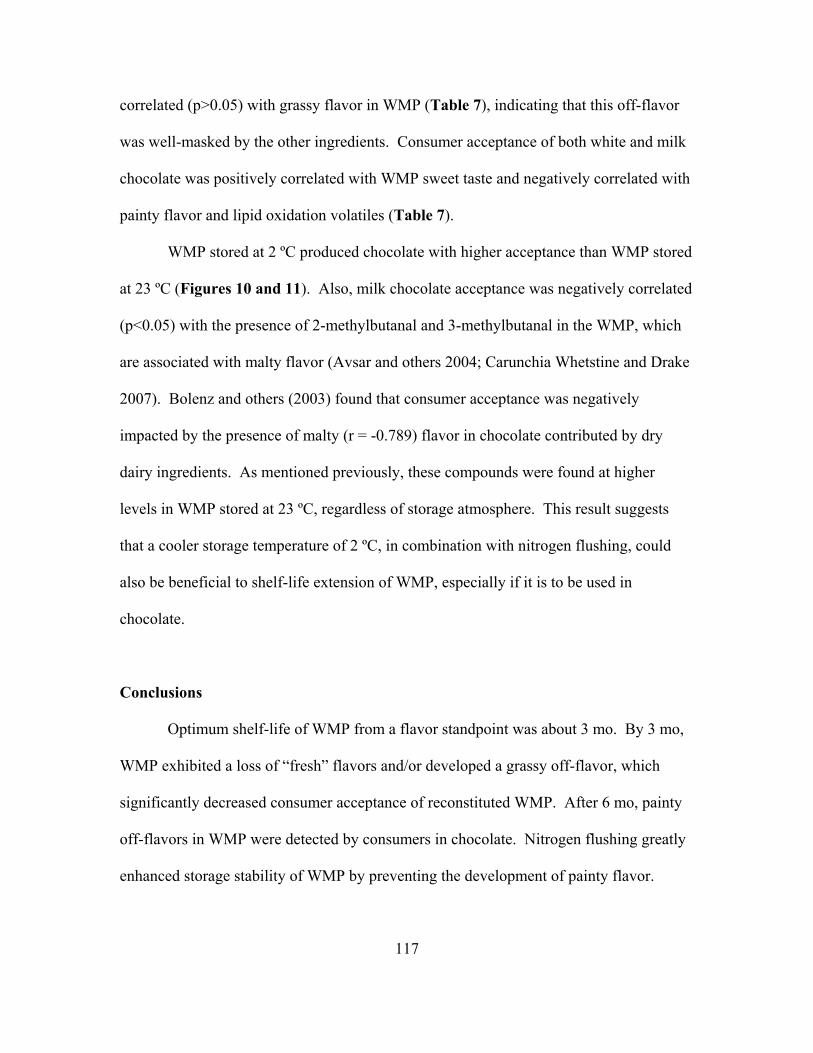
117
correlated (p>0.05) with grassy flavor in WMP (Table 7), indicating that this off-flavor
was well-masked by the other ingredients. Consumer acceptance of both white and milk
chocolate was positively correlated with WMP sweet taste and negatively correlated with
painty flavor and lipid oxidation volatiles (Table 7).
WMP stored at 2 ºC produced chocolate with higher acceptance than WMP stored
at 23 ºC (Figures 10 and 11). Also, milk chocolate acceptance was negatively correlated
(p<0.05) with the presence of 2-methylbutanal and 3-methylbutanal in the WMP, which
are associated with malty flavor (Avsar and others 2004; Carunchia Whetstine and Drake
2007). Bolenz and others (2003) found that consumer acceptance was negatively
impacted by the presence of malty (r = -0.789) flavor in chocolate contributed by dry
dairy ingredients. As mentioned previously, these compounds were found at higher
levels in WMP stored at 23 ºC, regardless of storage atmosphere. This result suggests
that a cooler storage temperature of 2 ºC, in combination with nitrogen flushing, could
also be beneficial to shelf-life extension of WMP, especially if it is to be used in
chocolate.
Conclusions
Optimum shelf-life of WMP from a flavor standpoint was about 3 mo. By 3 mo,
WMP exhibited a loss of “fresh” flavors and/or developed a grassy off-flavor, which
significantly decreased consumer acceptance of reconstituted WMP. After 6 mo, painty
off-flavors in WMP were detected by consumers in chocolate. Nitrogen flushing greatly
enhanced storage stability of WMP by preventing the development of painty flavor.
118
Packaging headspace oxygen levels should be as low as possible (<6.5% oxygen) to
prevent lipid oxidation and off flavors. Cooler storage temperatures also enhanced
storage stability of WMP, but to a lesser extent than nitrogen flushing. WMP stored in
nitrogen flushed packaging for up to a year could be used to manufacture milk chocolate
with a high level of consumer acceptance. However, the shelf life of chocolate made
from fresh or stored WMP has not been compared. Further research should track changes
in consumer acceptance and flavor changes in chocolate bars for up to a year after
production (standard shelf life).
119
References
Andersson K, Lingnert H. 1998. Influence of oxygen concentration on the flavour and chemical stability of cream powder. Lebensm Wiss Technol 31(3):245-51. Avsar YK, Karagul-Yuceer Y, Drake MA, Singh TK, Yoon Y, Cadwallader KR. 2004. Characterization of nutty flavor in Cheddar cheese. J Dairy Sci 87(7):1999-2010. Baldwin AJ, Ackland JD. 1991. Effect of preheat treatment and storage on the properties of whole milk powder - changes in physical and chemical properties. Neth Milk Dairy J 45(3):169-81. Baldwin AJ, Cooper HR, Palmer KC. 1991. Effect of preheat treatment and storage on the properties of whole milk powder - changes in sensory properties. Neth Milk Dairy J 45(2):97-116. Biolatto A, Grigioni G, Irurueta M, Sancho AM, Taverna M, Pensel N. 2007. Seasonal variation in the odour characteristics of whole milk powder. Food Chem 103(3):960-67. Bishov SJ, Henick AS, Giffee JW, Nii IT, Prell PA, Wolf M. 1971. Quality and stability of some freeze-dried foods in “zero” oxygen headspace. J Food Sci 36(3):532-35. Bolenz S, Thiessenhusen T, Schape R. 2003. Influence of milk components on properties and consumer acceptance of milk chocolate. Eur Food Res Technol 216(1):28-33. Carunchia Whetstine ME, Drake MA. 2007. The flavor and flavor stability of skim and whole milk powders. In: Cadwallader KR, Drake MA, McGorrin R, editors. Flavor of Dairy Products. Washington, DC.: ACS Publishing. p. 217-51. Caudle AD, Yoon Y, Drake M. 2005. Influence of flavor variability in skim milk powder on consumer acceptability of ingredient applications. J Food Sci 70(7):S427-31. Celestino EL, Iyer M, Roginski H. 1997. The effects of refrigerated storage of raw milk on the quality of whole milk powder stored for different periods. Int Dairy J. 7(2-3):119-27. Chan SH, Gray JI, Gomaa EA, Harte BR, Kelly PM, Buckley DJ. 1993. Cholesterol oxidation in whole milk powders as influenced by processing and packaging. Food Chem 47(4):321-28. Childs JL, Yates MD, Drake, MA. 2007. Sensory properties of meal replacement bars and beverages made from whey or soy proteins. J Food Sci. 72:S425-34.
120
Christensen LJ, Decker CW, Ashworth US. 1951. The keeping quality of whole milk powder.1. The effect of preheat temperature of the milk on the development of rancid, oxidized and stale flavors with different storage conditions. J Dairy Sci 34(5):404-11. Decker CW, Ashworth US, Christensen LJ. 1951. The keeping quality of whole milk powder. 2. The effect of preheat temperatures on the development of peroxides and ferricyanide-reducing groups under different storage conditions. J Dairy Sci 34(5):412-18. Drake MA. 2004. ADSA Foundation Scholar Award: Defining dairy flavors. J Dairy Sci 87(4):777-84. Farkye N. 2006. Significance of milk fat in milk powder. In: Fox P, McSweeney P, editors. Advanced dairy chemistry volume 2: lipids, 3rd ed. New York: Springer US. p 451-65. Hall G, Andersson J. 1985. Flavor changes in whole milk powder during storage. 3. Relationships between flavor properties and volatile compounds. J Food Quality 7(4):237-53. Hall G, Andersson J, Lingnert H, Olofsson B. 1985. Flavor changes in whole milk powder during storage. 2. The kinetics of the formation of volatile fat oxidation-products and other volatile compounds. J Food Quality 7(3):153-90. Hall G, Lingnert H. 1984. Flavor changes in whole milk powder during storage. 1. Odor and flavor profiles of dry milk with additions of antioxidants and stored under air or nitrogen. J Food Quality 7(2):131-51. Heiss R, Eichner E. 1971. Moisture content and shelf life. Food Manuf 46(6 June):37-8, 41-2. Hough G, Sanchez RH, de Pablo GG, Sanchez RG, Villaplana SC, Gimenez AM, Gambaro A. 2002. Consumer acceptability versus trained sensory panel scores of powdered milk shelf-life defects. J Dairy Sci 85(9):2075-80. IDF. 1997. Standard 99C: Sensory evaluation of dairy products by scoring reference methodology. Brussels, Belgium: International Dairy Federation. Kurtz FE, Tamsma A, Selman RL, Pallansch MJ. 1969. Effect of pollution of air with ozone on flavor of spray-dried milks. J Dairy Sci 52(2):158-61. Lee YB, Morr CV. 1994. Changes of headspace volatile compounds due to oxidation of milk-fat during storage of dried dairy-products. Lipids in Food Flavors. Washington: Amer Chemical Soc. p. 98-107.
121
Liang B, Hartel RW. 2004. Effects of milk powders in milk chocolate. J Dairy Sci 87(1):20-31. Liang JH. 2000. Kinetics of fluorescence formation in whole milk powders during oxidation. Food Chem 71(4):459-63. Lloyd MA, Zou J, Ogden LV, Pike OA. 2004. Sensory and nutritional quality of nonfat dry milk in long-term residential storage. J Food Sci 69(8):S326-31. MacFie H, N B, Greenhoff K, Vallis I. 1989. Designs to balance the effect of order of presentation and first-order carry-over effects in hall tests. J Sens Stud 4:129-48. McCluskey S, Connolly JF, Devery R, O'Brien B, Kelly J, Harrington D, Stanton C. 1997. Lipid and cholesterol oxidation in whole milk powder during processing and storage. J Food Sci 62(2):331-37. Meilgaard MM, Civille GV, Carr T. 1999. Sensory Evaluation Techniques. 3rd Ed. CRC Press, New York, NY. 387 p. Min D, Lee S, Lindamood J. 1989. Effect of packaging conditions on the flavor stability of dry whole milk. J Food Sci 54(Sept/Oct):1222-24, 45. Neilson AP, Pahulu HF, Ogden LV, Pike OA. 2006. Sensory and nutritional quality of dehydrated potato flakes in long-term storage. J Food Sci 71(6):S461-66. Nielsen BR, Stapelfeldt H, Skibsted LH. 1997. Early prediction of the shelf-life of medium-heat whole milk powders using stepwise multiple regression and principal component analysis. Int Dairy J 7(5):341-48. Nursten HE. 1997. The flavour of milk and dairy products.1. Milk of different kinds, milk powder, butter and cream. Int J Dairy Technol 50(2):48-56. Pyenson H and Tracy PH. 1946. A spectrophotometric study of the changes in peroxide value of spray-dried whole milk powder during storage. J Dairy Sci 29(1):1-12. Rossell J. 1989. Measurement of rancidity. In: Allen J, Hamilton R, editors. Rancidity in Foods. London: Elsevier Applied Science. p 22-51. Sather LA, Tamsma A, Calvin LD. 1963. Relation of preference panel and trained panel scores on dry whole milk. J Dairy Sci 46(10):1054-58 Schuck P, Mejean S, Dolivet A, Jeantet R, Bhandari B. 2007. Keeping quality of dairy ingredients. Lait 87(4-5):481-88.
122
Stapelfeldt H, Nielsen BR, Skibsted LH. 1997. Effect of heat treatment, water activity and storage temperature on the oxidative stability of whole milk powder. Int Dairy J 7(5):331-39. Sørensen IH, Krag J, Pisecky J, Westergaard V. 1978. Analytical Methods for Dry Milk Products, 4th ed. Copenhagen: NIRO A/S. Available from: http://www.niro.dk/niro/cmsdoc.nsf/WebDoc/ndkw6dknxs. Accessed Aug 18, 2008. Tamsma A, Pallansch MJ. 1964. Factors related to storage stability of foam dried whole milk. 4. Effect of powder moisture content + in-pack oxygen at different storage temperatures. J Dairy Sci 47(9):970-6. Tuohy J. 1984. Developments in the packaging of whole milk powder. Farm and Food Res 15(1):7-9. Ulberth F, Roubicek D. 1995. Monitoring of oxidative deterioration of milk powder by headspace gas-chromatography. Int Dairy J 5(6):523-31. [USDA-AMS]. United States Department of Agriculture-Agricultural Marketing Service. 2001. DA Instruction No. 918-RL. Available from: Dairy Grading Branch, Dairy Division. Washington, DC. [USDA-ARS]. United States Department of Agriculture-Agricultural Research Service. 2007. USDA National Nutrient Database for Standard Reference, Release 20. Available from: http://www.ars.usda.gov/main/site_main.htm?modecode=12354500. Accessed Aug 18, 2008. [USDEC]. United States Dairy Export Council. 2005. Reference Manual for US Milk Powders: 2005 Revised Edition. Available from: http://www.usdec.org/publications/PubDetail.cfm?ItemNumber=213 Accessed July 22, 2008. van Den Dool H, Kratz PD. 1963. A generalization of retention index system including linear temperature programmed gas-liquid partition chromatography. J Chromatogr 11(4):463-71. van Mil P, Jans JA. 1991. Storage stability of whole milk powder: effects of process and storage conditions on product properties. Neth Milk Dairy J 45(3):145-67. Vazquez-Landaverde PA, Velazquez G, Torres JA, Qian MC. 2005. Quantitative determination of thermally derived off-flavor compounds in milk using solid-phase microextraction and gas chromatography. J Dairy Sci 88(11):3764-72.
123
Wehr H, Frank J. 2004. Standard methods for the examination of dairy products. 17th ed. Washington, DC: American Public Health Association. 570 p. Wright BJ, Zevchak SE, Wright JM, Drake MA. 2008. Impact of agglomeration on flavor and flavor stability of whey proteins. J Food Sci Forthcoming.
124
Acknowledgments
Funding was provided by the California Dairy Research Foundation (Davis, CA) and the
Hershey Company. The assistance of Mike Zanos and Foster Farms Dairy (Modesto,
CA) and Ron Thompson and California Dairies, Inc. (Visalia, CA) are gratefully
acknowledged.

125
Tables
Table 1. Percentages (w/w) of ingredients in milk and white chocolate formulations.
Ingredient Milk
Chocolate White
Chocolate Sucrose (Domino Specialty Ingredients, Baltimore, MD, USA) 45.47 50.47 Chocolate liquor (The Hershey Company, Hershey, PA, USA) 11 0 Whole milk powder 25 25 Deodorized cocoa butter (ADM, Decatur, IL, USA) 18 24 Vanillin (Rhodia, Inc., Cranbury, NJ, USA) 0.03 0.03 Lecithin (Degussa Texturant Systems; Atlanta, GA, USA) 0.4 0.4 PGPRa (Danisco USA, New Century, KS, USA) 0.1 0.1
a = polyglycerol polyricinoleate, an emulsifier

126
Table 2. Initial analyses of whole milk powder. Meana Typical value aw 0.17 0.16-0.18b (0.01) Moisture (%) 2.46 2.5d (0.06) Fat (%) 30.05 26.1-40c,e (0.45 WPN (mg/g) 4.40 1.2-4.2e,f (0.10) Free Fat (%) 1.61 2.8-6.7e (0.09) Iron (mg/kg) 1.35 4.7d (0.06) Copper (mg/kg)
0.19 0.8d
(0.09) aMeans from duplicate analyses of 2 batches of WMP before storage. Values in parentheses are standard errors of the means.. b Farkye 2006. cUSDEC 2005. dASDA-ARS 2007. eSteen 1977. fVan Mil and Jans 1991
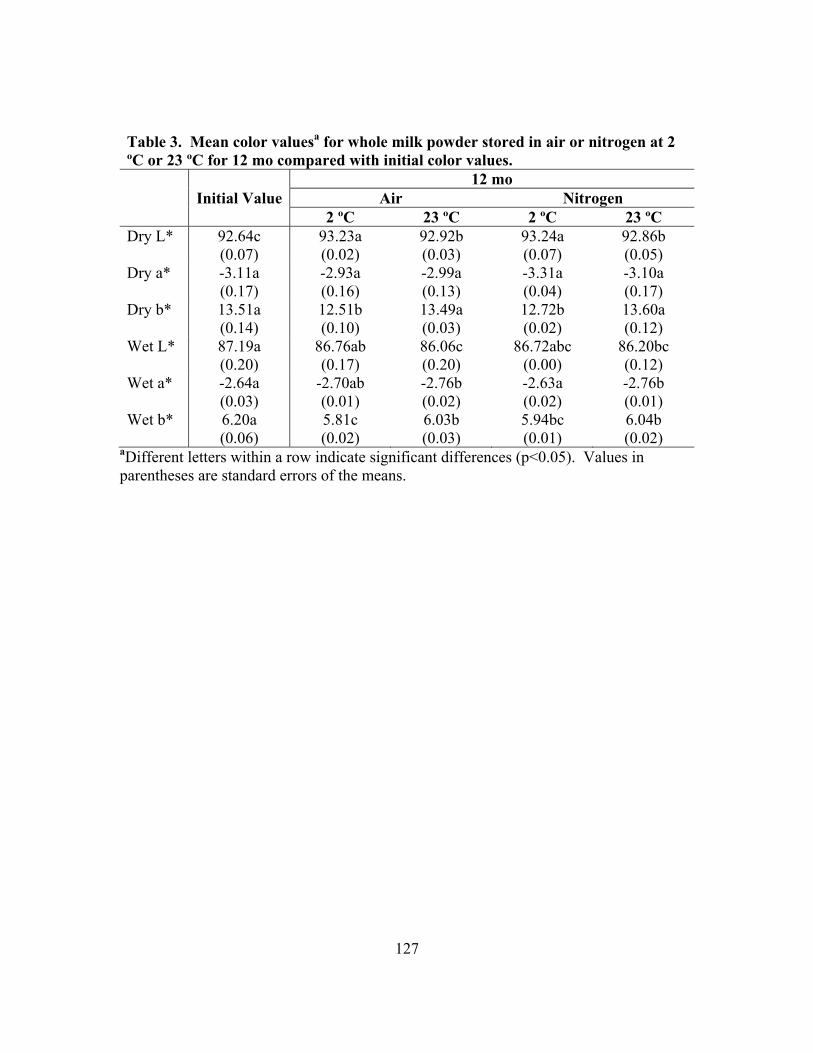
127
Table 3. Mean color valuesa for whole milk powder stored in air or nitrogen at 2 ºC or 23 ºC for 12 mo compared with initial color values.
Initial Value 12 mo
Air Nitrogen 2 ºC 23 ºC 2 ºC 23 ºC
Dry L* 92.64c (0.07)
93.23a (0.02)
92.92b (0.03)
93.24a (0.07)
92.86b (0.05)
Dry a* -3.11a (0.17)
-2.93a (0.16)
-2.99a (0.13)
-3.31a (0.04)
-3.10a (0.17)
Dry b* 13.51a (0.14)
12.51b (0.10)
13.49a (0.03)
12.72b (0.02)
13.60a (0.12)
Wet L* 87.19a (0.20)
86.76ab (0.17)
86.06c (0.20)
86.72abc (0.00)
86.20bc (0.12)
Wet a* -2.64a (0.03)
-2.70ab (0.01)
-2.76b (0.02)
-2.63a (0.02)
-2.76b (0.01)
Wet b* 6.20a (0.06)
5.81c (0.02)
6.03b (0.03)
5.94bc (0.01)
6.04b (0.02)
aDifferent letters within a row indicate significant differences (p<0.05). Values in parentheses are standard errors of the means.
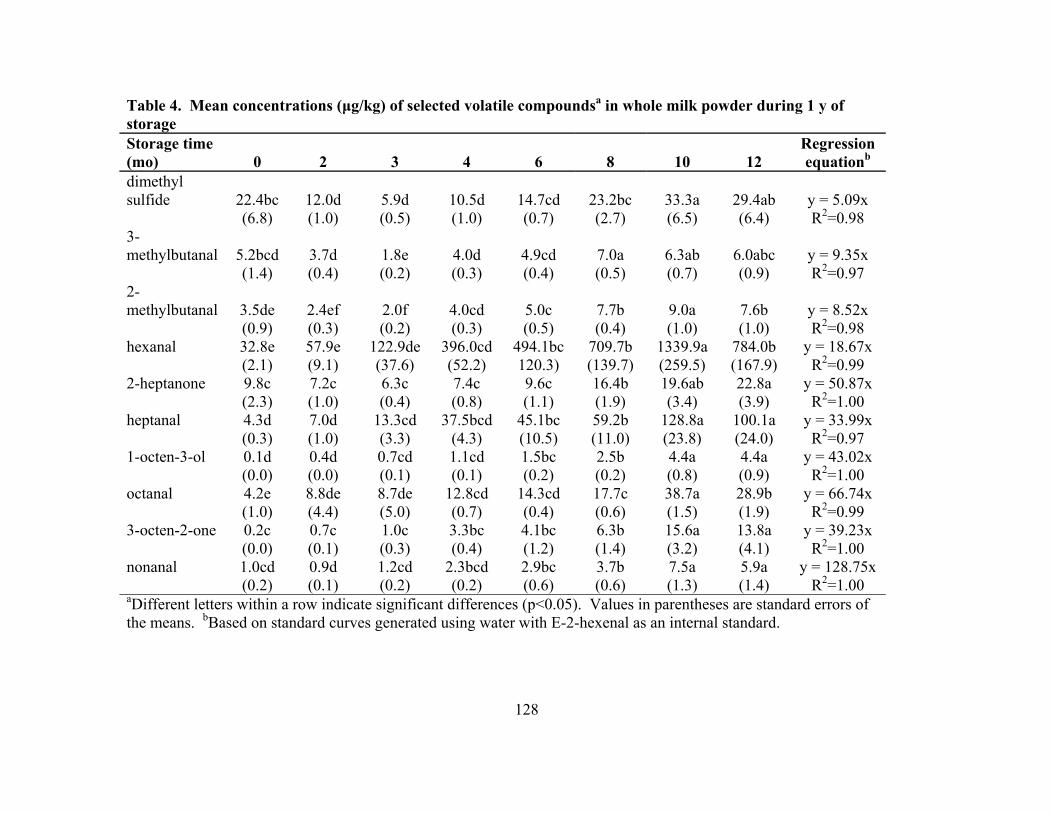
128
Table 4. Mean concentrations (μg/kg) of selected volatile compoundsa in whole milk powder during 1 y of storage Storage time (mo) 0 2 3 4 6 8 10 12
Regression equationb
dimethyl sulfide 22.4bc 12.0d 5.9d 10.5d 14.7cd 23.2bc 33.3a 29.4ab y = 5.09x (6.8) (1.0) (0.5) (1.0) (0.7) (2.7) (6.5) (6.4) R2=0.98 3-methylbutanal 5.2bcd 3.7d 1.8e 4.0d 4.9cd 7.0a 6.3ab 6.0abc y = 9.35x (1.4) (0.4) (0.2) (0.3) (0.4) (0.5) (0.7) (0.9) R2=0.97 2-methylbutanal 3.5de 2.4ef 2.0f 4.0cd 5.0c 7.7b 9.0a 7.6b y = 8.52x (0.9) (0.3) (0.2) (0.3) (0.5) (0.4) (1.0) (1.0) R2=0.98 hexanal 32.8e 57.9e 122.9de 396.0cd 494.1bc 709.7b 1339.9a 784.0b y = 18.67x (2.1) (9.1) (37.6) (52.2) 120.3) (139.7) (259.5) (167.9) R2=0.99 2-heptanone 9.8c 7.2c 6.3c 7.4c 9.6c 16.4b 19.6ab 22.8a y = 50.87x (2.3) (1.0) (0.4) (0.8) (1.1) (1.9) (3.4) (3.9) R2=1.00 heptanal 4.3d 7.0d 13.3cd 37.5bcd 45.1bc 59.2b 128.8a 100.1a y = 33.99x (0.3) (1.0) (3.3) (4.3) (10.5) (11.0) (23.8) (24.0) R2=0.97 1-octen-3-ol 0.1d 0.4d 0.7cd 1.1cd 1.5bc 2.5b 4.4a 4.4a y = 43.02x (0.0) (0.0) (0.1) (0.1) (0.2) (0.2) (0.8) (0.9) R2=1.00 octanal 4.2e 8.8de 8.7de 12.8cd 14.3cd 17.7c 38.7a 28.9b y = 66.74x (1.0) (4.4) (5.0) (0.7) (0.4) (0.6) (1.5) (1.9) R2=0.99 3-octen-2-one 0.2c 0.7c 1.0c 3.3bc 4.1bc 6.3b 15.6a 13.8a y = 39.23x (0.0) (0.1) (0.3) (0.4) (1.2) (1.4) (3.2) (4.1) R2=1.00 nonanal 1.0cd 0.9d 1.2cd 2.3bcd 2.9bc 3.7b 7.5a 5.9a y = 128.75x (0.2) (0.1) (0.2) (0.2) (0.6) (0.6) (1.3) (1.4) R2=1.00 aDifferent letters within a row indicate significant differences (p<0.05). Values in parentheses are standard errors of the means. bBased on standard curves generated using water with E-2-hexenal as an internal standard.
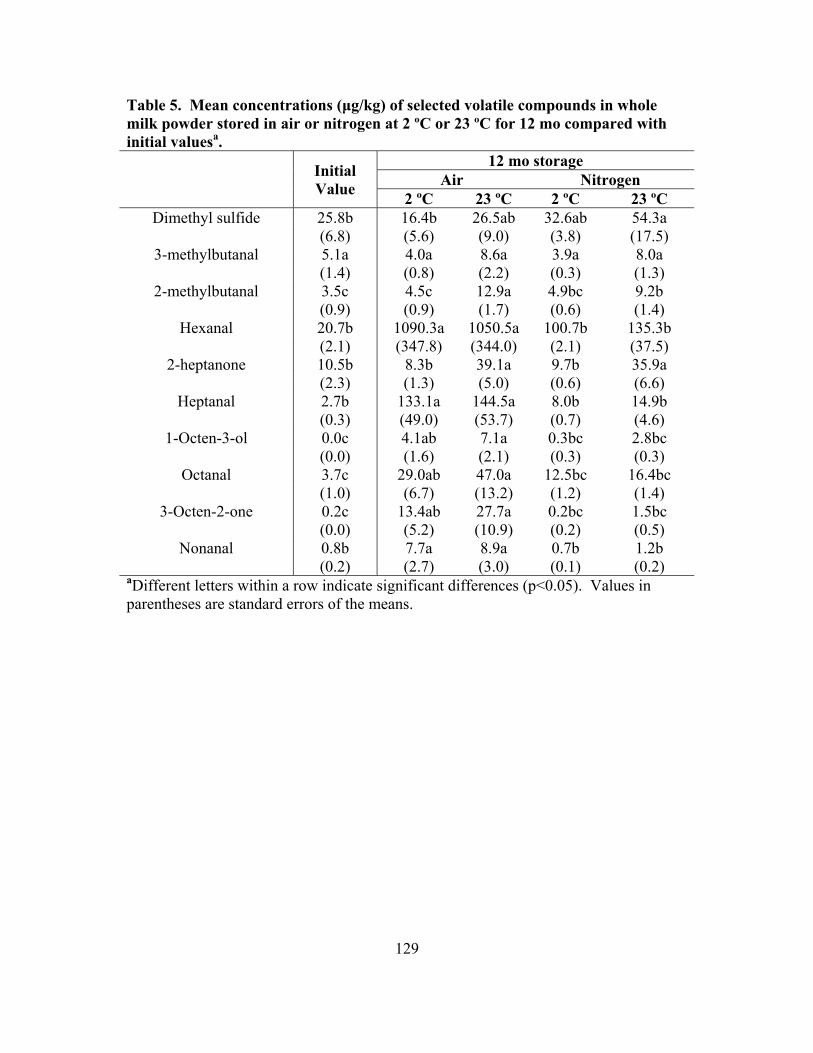
129
Table 5. Mean concentrations (μg/kg) of selected volatile compounds in whole milk powder stored in air or nitrogen at 2 ºC or 23 ºC for 12 mo compared with initial valuesa.
Initial Value
12 mo storage Air Nitrogen
2 ºC 23 ºC 2 ºC 23 ºC Dimethyl sulfide 25.8b 16.4b 26.5ab 32.6ab 54.3a
(6.8) (5.6) (9.0) (3.8) (17.5) 3-methylbutanal 5.1a 4.0a 8.6a 3.9a 8.0a
(1.4) (0.8) (2.2) (0.3) (1.3) 2-methylbutanal 3.5c 4.5c 12.9a 4.9bc 9.2b
(0.9) (0.9) (1.7) (0.6) (1.4) Hexanal 20.7b 1090.3a 1050.5a 100.7b 135.3b
(2.1) (347.8) (344.0) (2.1) (37.5) 2-heptanone 10.5b 8.3b 39.1a 9.7b 35.9a
(2.3) (1.3) (5.0) (0.6) (6.6) Heptanal 2.7b 133.1a 144.5a 8.0b 14.9b
(0.3) (49.0) (53.7) (0.7) (4.6) 1-Octen-3-ol 0.0c 4.1ab 7.1a 0.3bc 2.8bc
(0.0) (1.6) (2.1) (0.3) (0.3) Octanal 3.7c 29.0ab 47.0a 12.5bc 16.4bc
(1.0) (6.7) (13.2) (1.2) (1.4) 3-Octen-2-one 0.2c 13.4ab 27.7a 0.2bc 1.5bc
(0.0) (5.2) (10.9) (0.2) (0.5) Nonanal 0.8b 7.7a 8.9a 0.7b 1.2b
(0.2) (2.7) (3.0) (0.1) (0.2) aDifferent letters within a row indicate significant differences (p<0.05). Values in parentheses are standard errors of the means.
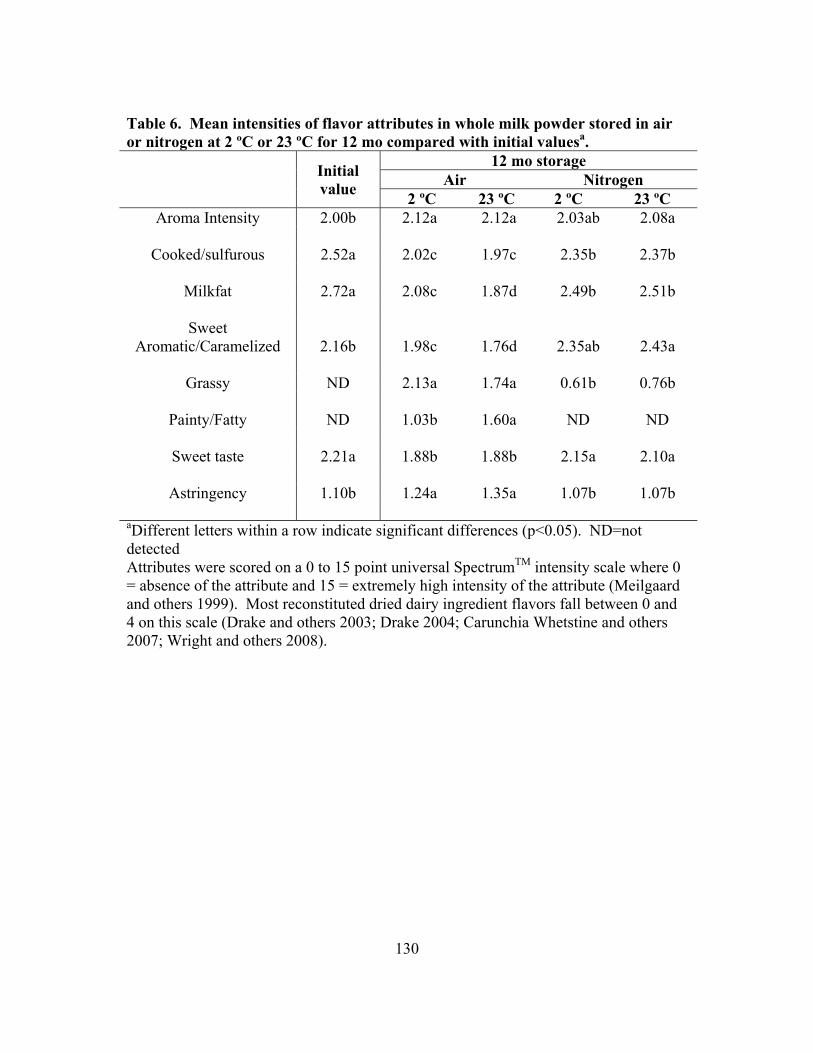
130
Table 6. Mean intensities of flavor attributes in whole milk powder stored in air or nitrogen at 2 ºC or 23 ºC for 12 mo compared with initial valuesa.
Initial value
12 mo storage Air Nitrogen
2 ºC 23 ºC 2 ºC 23 ºC Aroma Intensity 2.00b 2.12a 2.12a 2.03ab 2.08a
Cooked/sulfurous 2.52a 2.02c 1.97c 2.35b 2.37b
Milkfat 2.72a 2.08c 1.87d 2.49b 2.51b
Sweet
Aromatic/Caramelized 2.16b 1.98c 1.76d 2.35ab 2.43a
Grassy ND 2.13a 1.74a 0.61b 0.76b
Painty/Fatty ND 1.03b 1.60a ND ND
Sweet taste 2.21a 1.88b 1.88b 2.15a 2.10a
Astringency 1.10b 1.24a 1.35a 1.07b 1.07b
aDifferent letters within a row indicate significant differences (p<0.05). ND=not detected Attributes were scored on a 0 to 15 point universal SpectrumTM intensity scale where 0 = absence of the attribute and 15 = extremely high intensity of the attribute (Meilgaard and others 1999). Most reconstituted dried dairy ingredient flavors fall between 0 and 4 on this scale (Drake and others 2003; Drake 2004; Carunchia Whetstine and others 2007; Wright and others 2008).
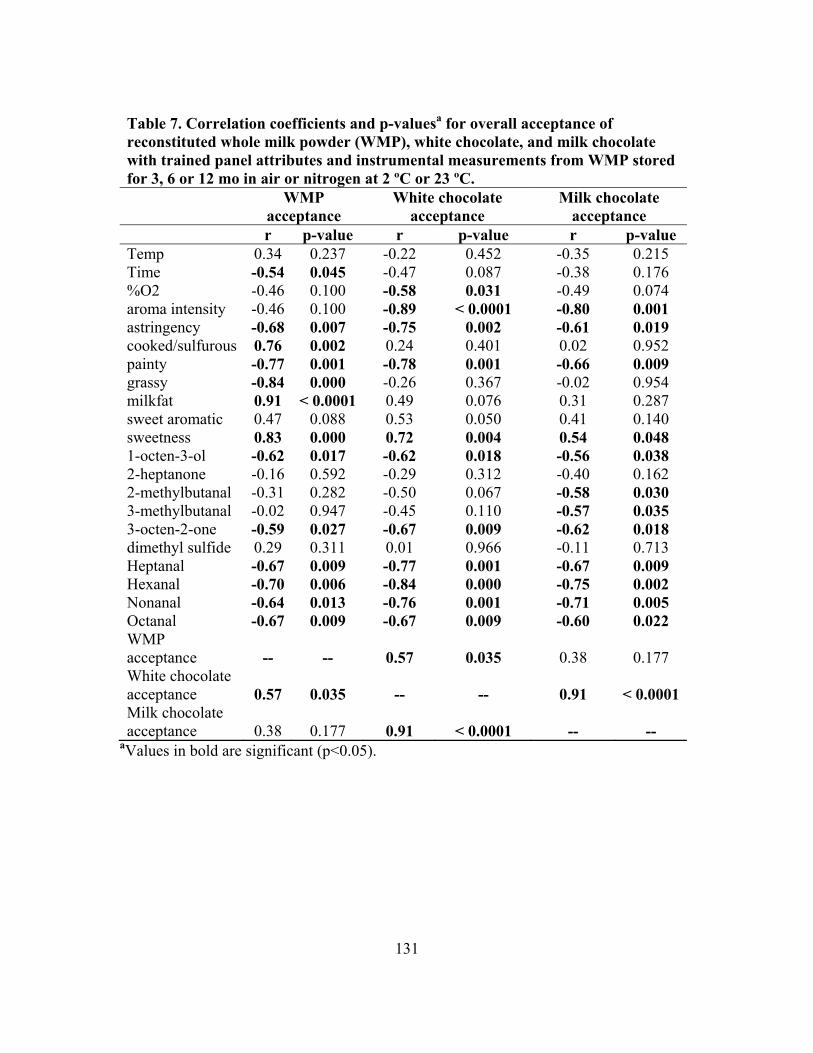
131
Table 7. Correlation coefficients and p-valuesa for overall acceptance of reconstituted whole milk powder (WMP), white chocolate, and milk chocolate with trained panel attributes and instrumental measurements from WMP stored for 3, 6 or 12 mo in air or nitrogen at 2 ºC or 23 ºC.
WMP
acceptance White chocolate
acceptance Milk chocolate
acceptance r p-value r p-value r p-value Temp 0.34 0.237 -0.22 0.452 -0.35 0.215 Time -0.54 0.045 -0.47 0.087 -0.38 0.176 %O2 -0.46 0.100 -0.58 0.031 -0.49 0.074 aroma intensity -0.46 0.100 -0.89 < 0.0001 -0.80 0.001 astringency -0.68 0.007 -0.75 0.002 -0.61 0.019 cooked/sulfurous 0.76 0.002 0.24 0.401 0.02 0.952 painty -0.77 0.001 -0.78 0.001 -0.66 0.009 grassy -0.84 0.000 -0.26 0.367 -0.02 0.954 milkfat 0.91 < 0.0001 0.49 0.076 0.31 0.287 sweet aromatic 0.47 0.088 0.53 0.050 0.41 0.140 sweetness 0.83 0.000 0.72 0.004 0.54 0.048 1-octen-3-ol -0.62 0.017 -0.62 0.018 -0.56 0.038 2-heptanone -0.16 0.592 -0.29 0.312 -0.40 0.162 2-methylbutanal -0.31 0.282 -0.50 0.067 -0.58 0.030 3-methylbutanal -0.02 0.947 -0.45 0.110 -0.57 0.035 3-octen-2-one -0.59 0.027 -0.67 0.009 -0.62 0.018 dimethyl sulfide 0.29 0.311 0.01 0.966 -0.11 0.713 Heptanal -0.67 0.009 -0.77 0.001 -0.67 0.009 Hexanal -0.70 0.006 -0.84 0.000 -0.75 0.002 Nonanal -0.64 0.013 -0.76 0.001 -0.71 0.005 Octanal -0.67 0.009 -0.67 0.009 -0.60 0.022 WMP acceptance -- -- 0.57 0.035 0.38 0.177 White chocolate acceptance 0.57 0.035 -- -- 0.91 < 0.0001Milk chocolate acceptance 0.38 0.177 0.91 < 0.0001 -- --
aValues in bold are significant (p<0.05).
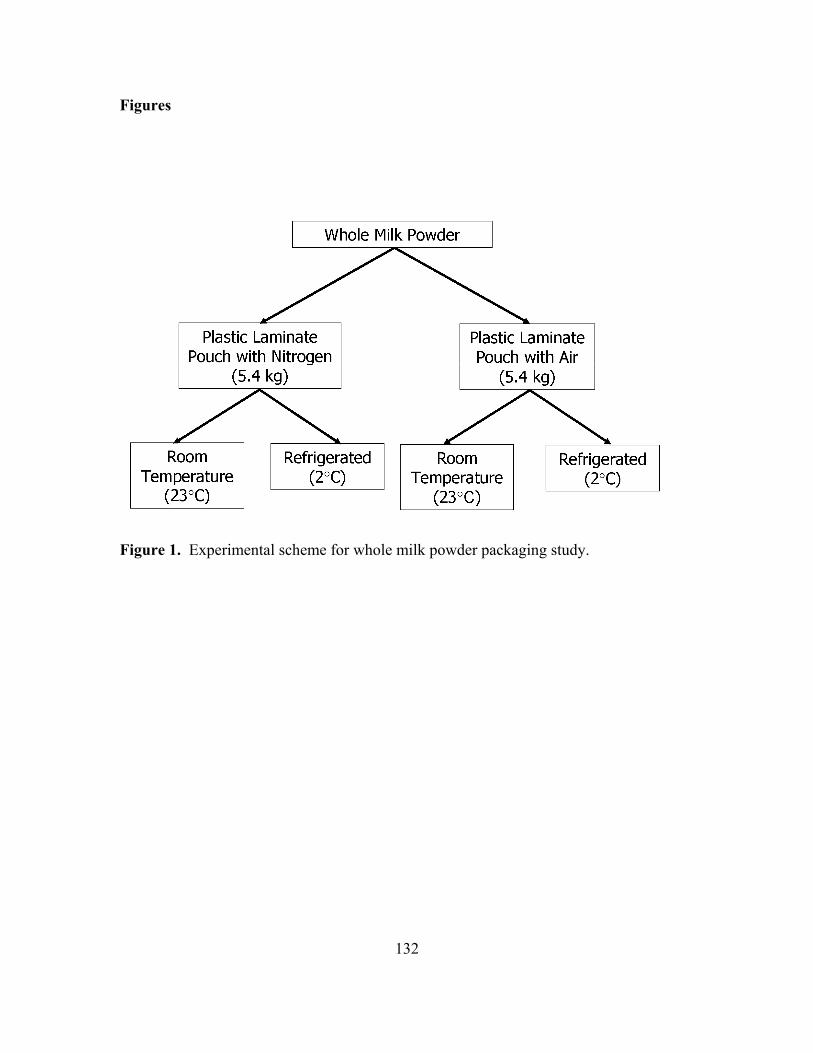
132
Figures
Figure 1. Experimental scheme for whole milk powder packaging study.
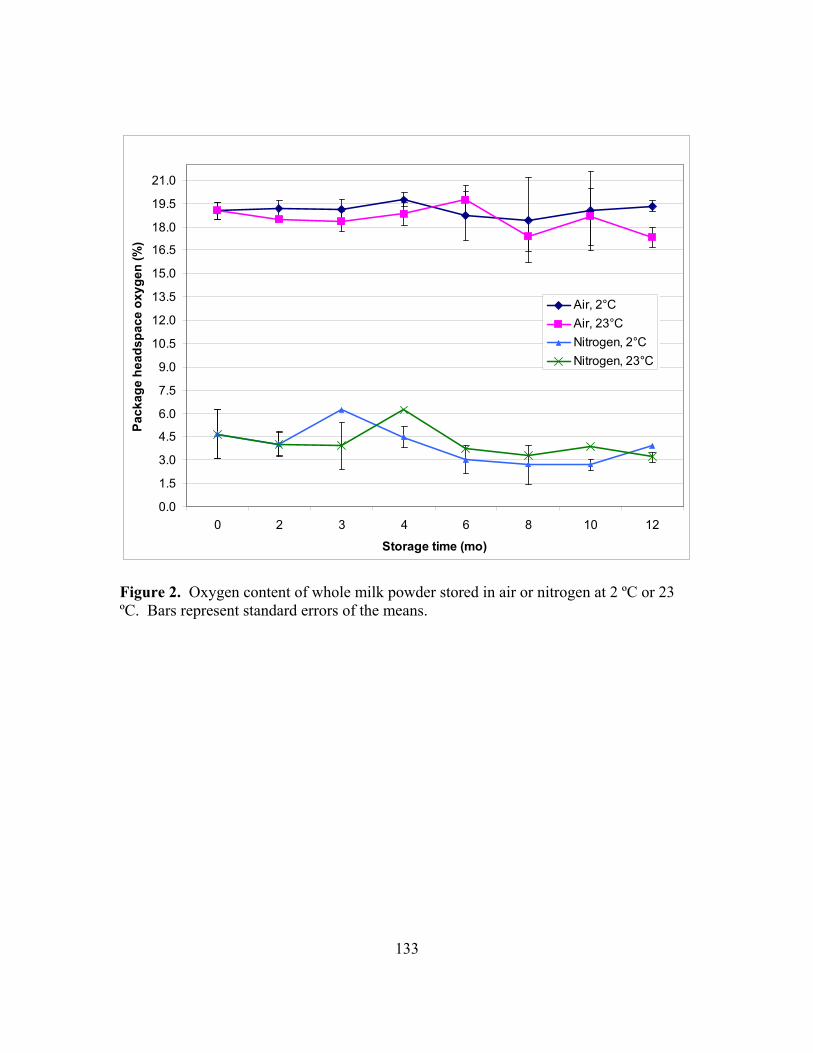
133
0.0
1.5
3.0
4.5
6.0
7.5
9.0
10.5
12.0
13.5
15.0
16.5
18.0
19.5
21.0
0 2 3 4 6 8 10 12
Storage time (mo)
Pack
age
head
spac
e ox
ygen
(%)
Air, 2°C
Air, 23°C
Nitrogen, 2°C
Nitrogen, 23°C
Figure 2. Oxygen content of whole milk powder stored in air or nitrogen at 2 ºC or 23 ºC. Bars represent standard errors of the means.
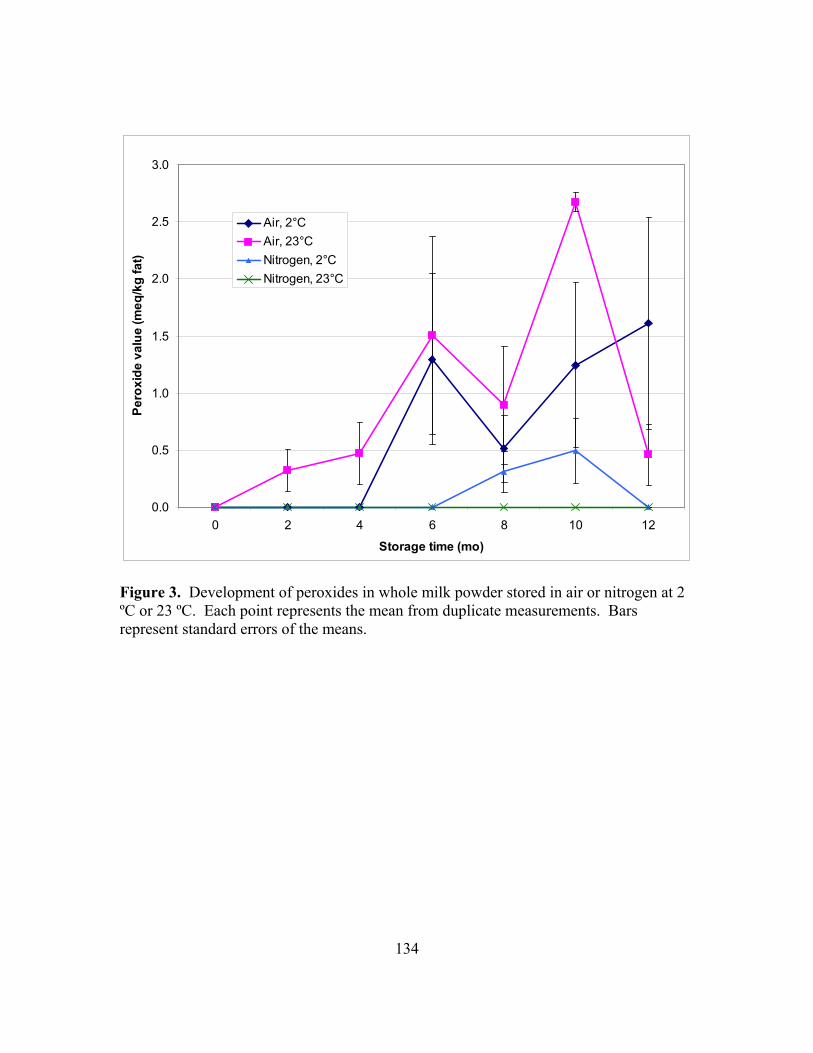
134
0.0
0.5
1.0
1.5
2.0
2.5
3.0
0 2 4 6 8 10 12
Storage time (mo)
Pero
xide
val
ue (m
eq/k
g fa
t)
Air, 2°C
Air, 23°C
Nitrogen, 2°C
Nitrogen, 23°C
Figure 3. Development of peroxides in whole milk powder stored in air or nitrogen at 2 ºC or 23 ºC. Each point represents the mean from duplicate measurements. Bars represent standard errors of the means.
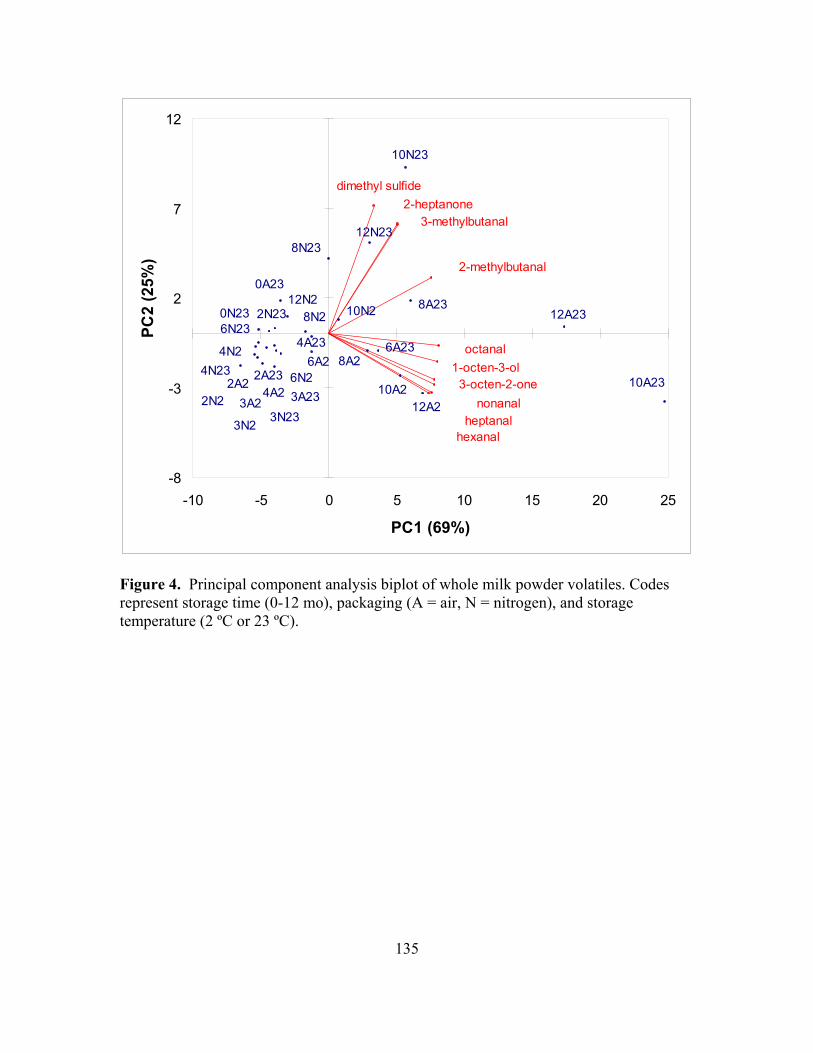
135
0A23
0N23
2A22A23
2N2
2N23
3A2 3A23
3N23N23
4A2
4A234N2
4N236A2
6A23
6N2
6N23
8A2
8A238N2
8N23
10A210A23
10N2
10N23
12A2
12A2312N2
12N23
1-octen-3-ol
2-heptanone
2-methylbutanal
3-methylbutanal
3-octen-2-one
dimethyl sulfide
heptanalhexanal
nonanal
octanal
-8
-3
2
7
12
-10 -5 0 5 10 15 20 25
PC1 (69%)
PC2
(25%
)
Figure 4. Principal component analysis biplot of whole milk powder volatiles. Codes represent storage time (0-12 mo), packaging (A = air, N = nitrogen), and storage temperature (2 ºC or 23 ºC).

136
0
500
1000
1500
2000
2500
3000
0 2 3 4 6 8 10 12Storage time (mo)
Hex
anal
(μg/
kg)
Air, 2°C
Air, 23°C
Nitrogen, 2°C
Nitrogen, 23°C
Figure 5. Development of hexanal in whole milk powder stored in air or nitrogen at 2 ºC or 23 ºC. Each point represents the mean from triplicate measurements. Bars represent standard errors of the means.
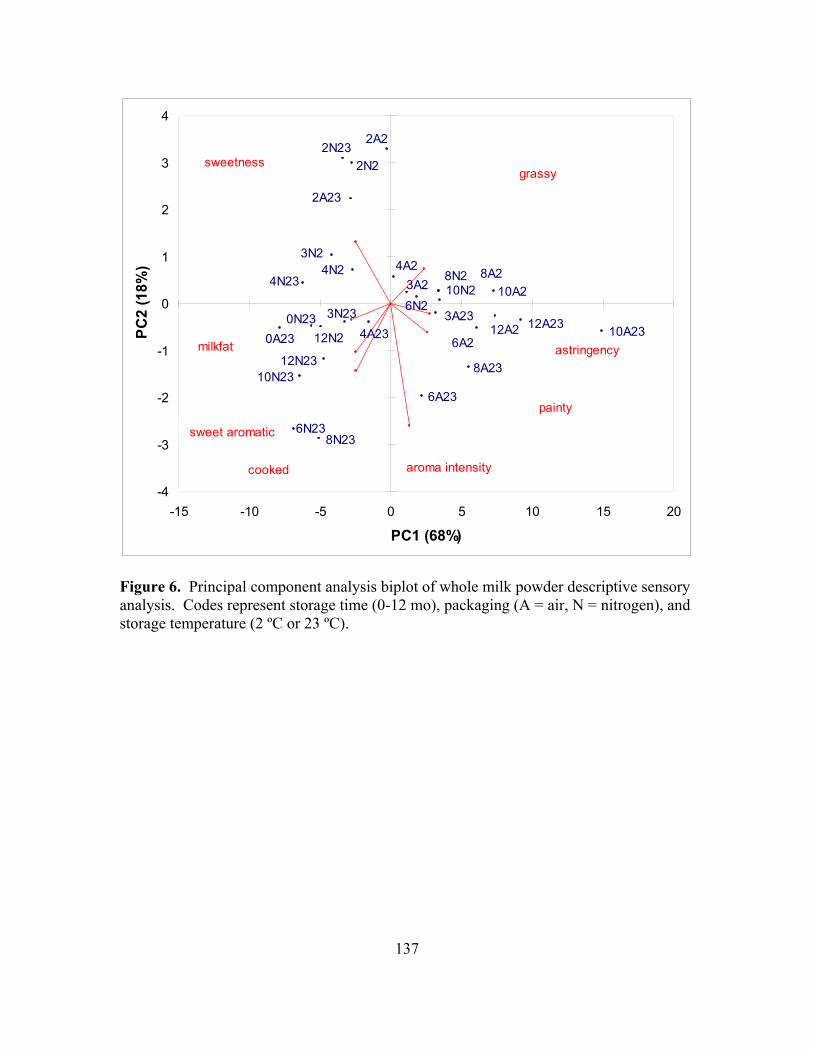
137
12N23
12N212A2312A2
10N23
10N2
10A23
10A2
8N23
8N2
8A23
8A2
6N23
6N2
6A23
6A2
4N234N2
4A23
4A2
3N23
3N2
3A23
3A2
2N23
2N2
2A23
2A2
0N23
0A23
sweetness
sweet aromatic
milkfat
grassy
painty
cooked
astringency
aroma intensity
-4
-3
-2
-1
0
1
2
3
4
-15 -10 -5 0 5 10 15 20
PC1 (68%)
PC2
(18%
)
Figure 6. Principal component analysis biplot of whole milk powder descriptive sensory analysis. Codes represent storage time (0-12 mo), packaging (A = air, N = nitrogen), and storage temperature (2 ºC or 23 ºC).
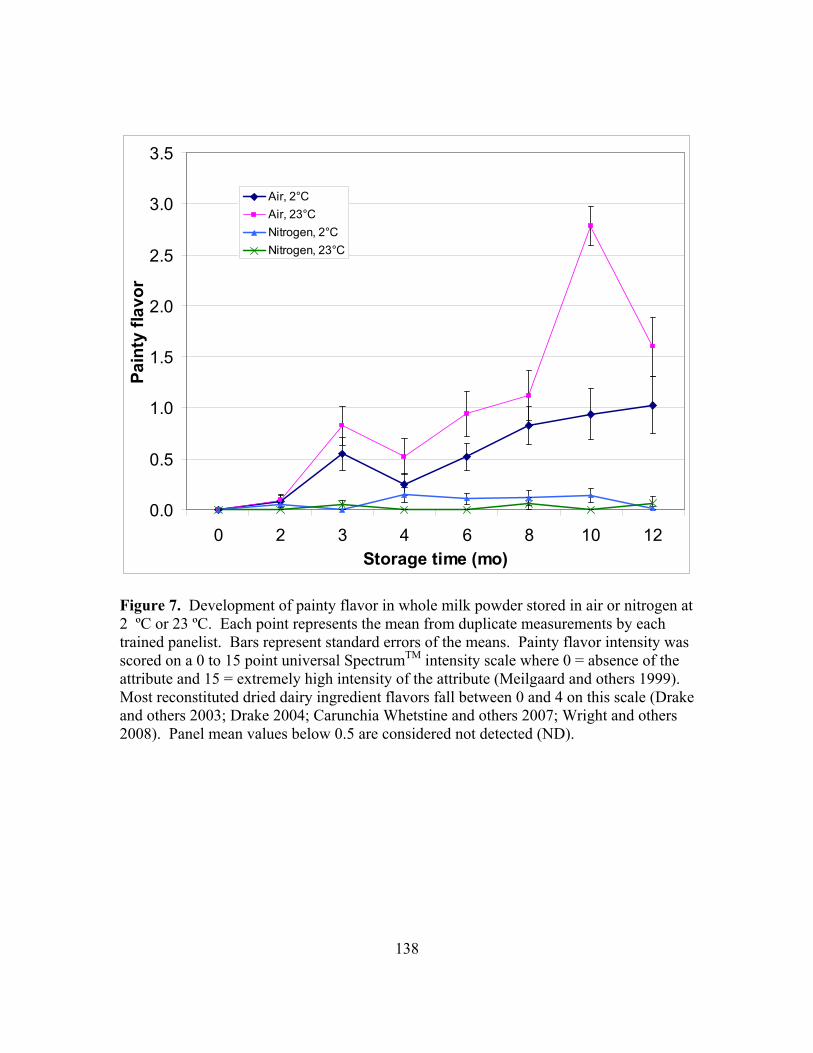
138
0.0
0.5
1.0
1.5
2.0
2.5
3.0
3.5
0 2 3 4 6 8 10 12Storage time (mo)
Pain
ty fl
avor
Air, 2°C
Air, 23°C
Nitrogen, 2°C
Nitrogen, 23°C
Figure 7. Development of painty flavor in whole milk powder stored in air or nitrogen at 2 ºC or 23 ºC. Each point represents the mean from duplicate measurements by each trained panelist. Bars represent standard errors of the means. Painty flavor intensity was scored on a 0 to 15 point universal SpectrumTM intensity scale where 0 = absence of the attribute and 15 = extremely high intensity of the attribute (Meilgaard and others 1999). Most reconstituted dried dairy ingredient flavors fall between 0 and 4 on this scale (Drake and others 2003; Drake 2004; Carunchia Whetstine and others 2007; Wright and others 2008). Panel mean values below 0.5 are considered not detected (ND).
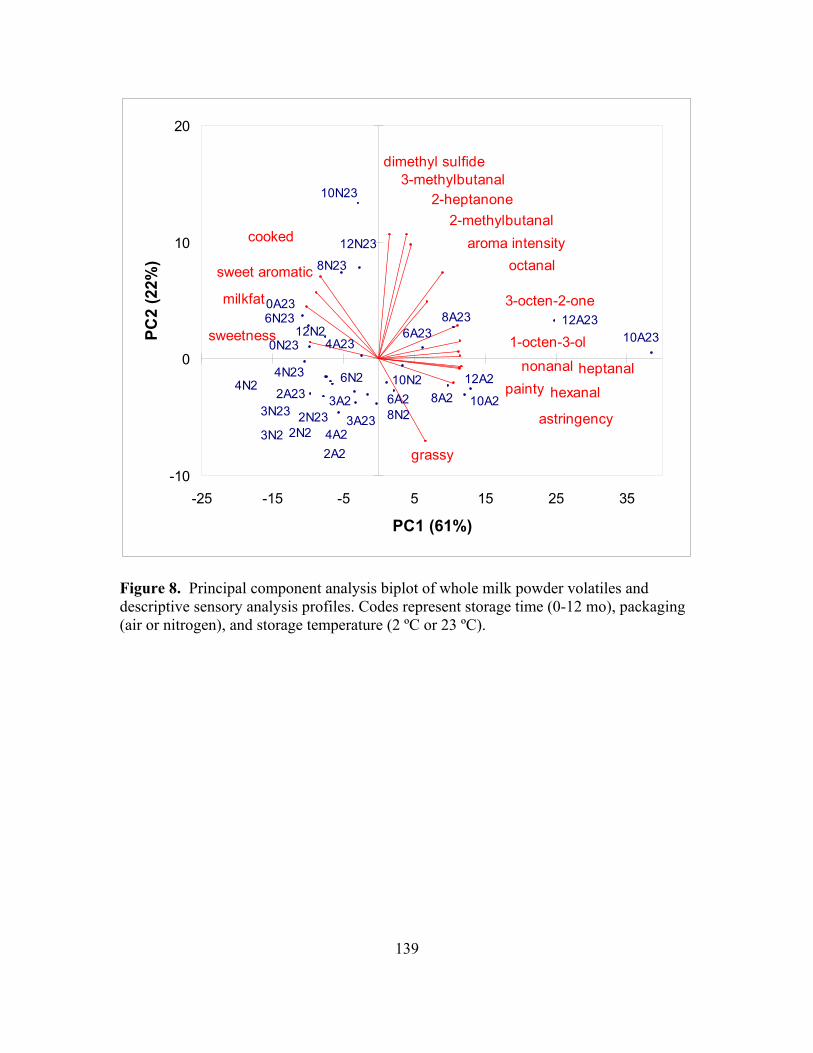
139
12N23
12N212A23
12A2
10N23
10N2
10A23
10A2
8N23
8N2
8A23
8A2
6N23
6N2
6A23
6A2
4N234N2
4A23
4A2
3N23
3N23A23
3A22N23
2N2
2A23
2A2
0N23
0A23
octanal
nonanal
hexanal
heptanal
dimethyl sulfide
3-octen-2-one
3-methylbutanal
2-methylbutanal
2-heptanone
1-octen-3-olsweetness
sweet aromatic
milkfat
grassy
painty
cooked
astringency
aroma intensity
-10
0
10
20
-25 -15 -5 5 15 25 35
PC1 (61%)
PC2
(22%
)
Figure 8. Principal component analysis biplot of whole milk powder volatiles and descriptive sensory analysis profiles. Codes represent storage time (0-12 mo), packaging (air or nitrogen), and storage temperature (2 ºC or 23 ºC).
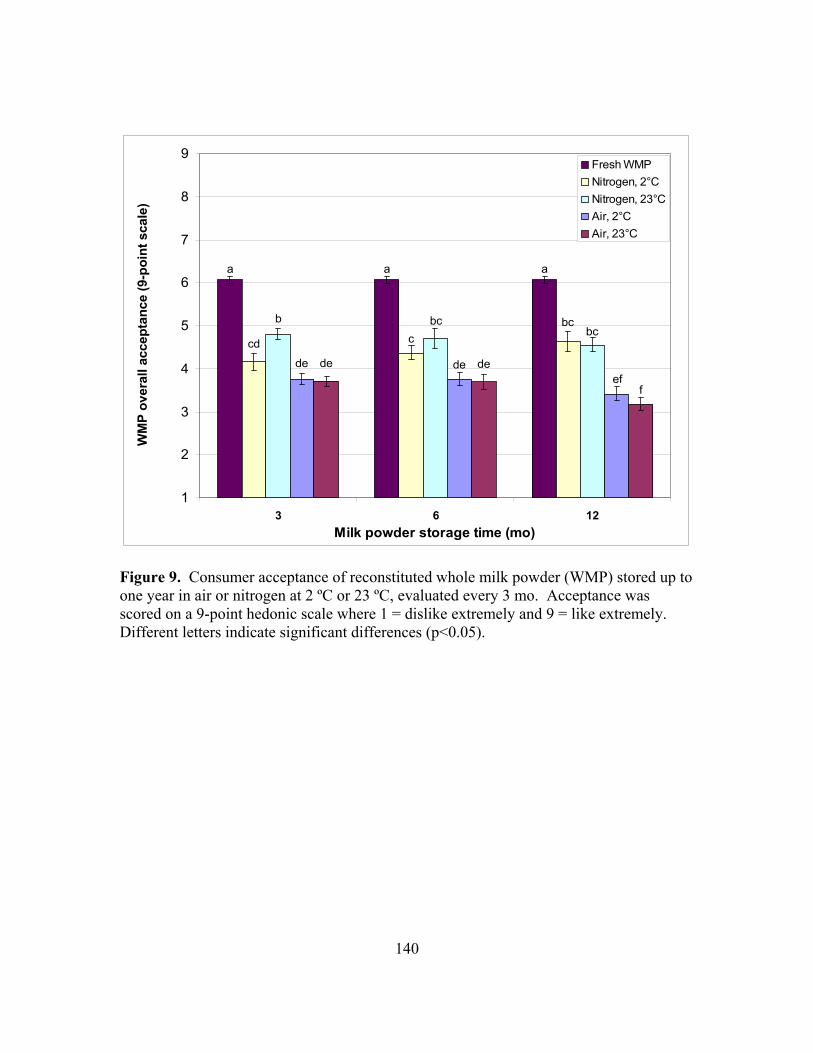
140
a a a
cd c
bcb bcbc
de deef
de de
f
1
2
3
4
5
6
7
8
9
3 6 12Milk powder storage time (mo)
WM
P ov
eral
l acc
epta
nce
(9-p
oint
sca
le)
Fresh WMP
Nitrogen, 2°C
Nitrogen, 23°C
Air, 2°C
Air, 23°C
Figure 9. Consumer acceptance of reconstituted whole milk powder (WMP) stored up to one year in air or nitrogen at 2 ºC or 23 ºC, evaluated every 3 mo. Acceptance was scored on a 9-point hedonic scale where 1 = dislike extremely and 9 = like extremely. Different letters indicate significant differences (p<0.05).
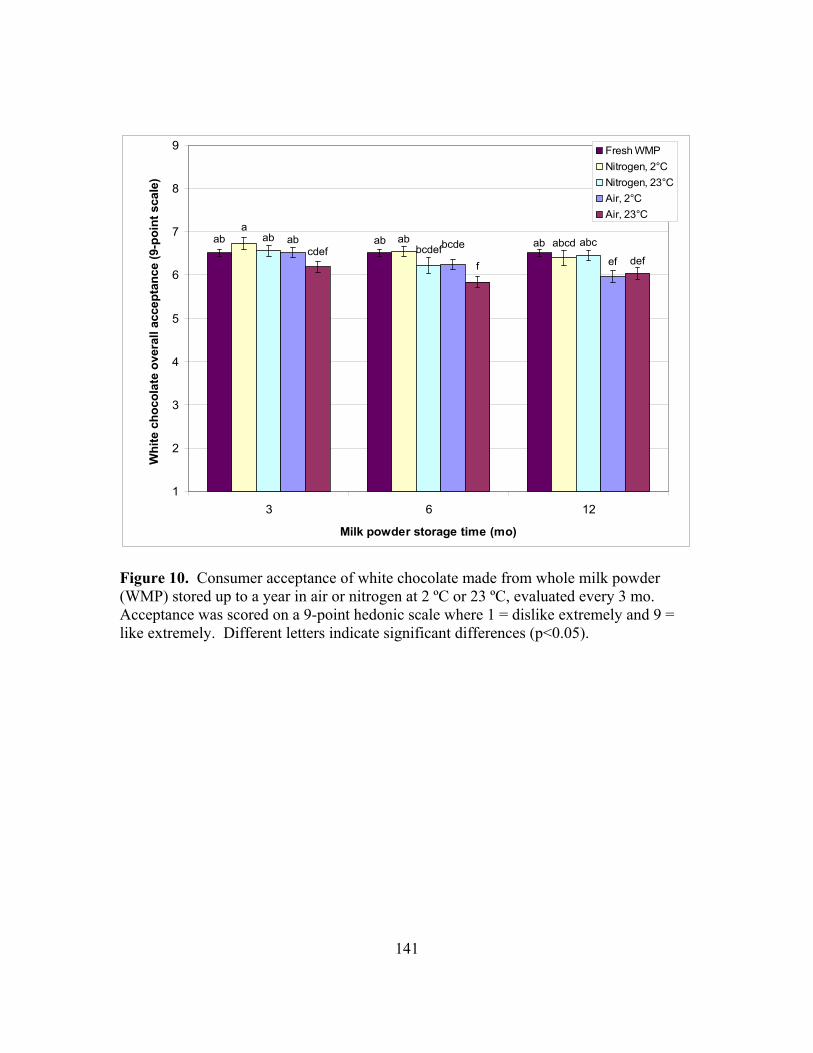
141
ab ab ab
aab abcdab
bcdefabcab bcde
efcdef
f def
1
2
3
4
5
6
7
8
9
3 6 12
Milk powder storage time (mo)
Whi
te c
hoco
late
ove
rall
acce
ptan
ce (9
-poi
nt s
cale
)Fresh WMP
Nitrogen, 2°C
Nitrogen, 23°C
Air, 2°C
Air, 23°C
Figure 10. Consumer acceptance of white chocolate made from whole milk powder (WMP) stored up to a year in air or nitrogen at 2 ºC or 23 ºC, evaluated every 3 mo. Acceptance was scored on a 9-point hedonic scale where 1 = dislike extremely and 9 = like extremely. Different letters indicate significant differences (p<0.05).
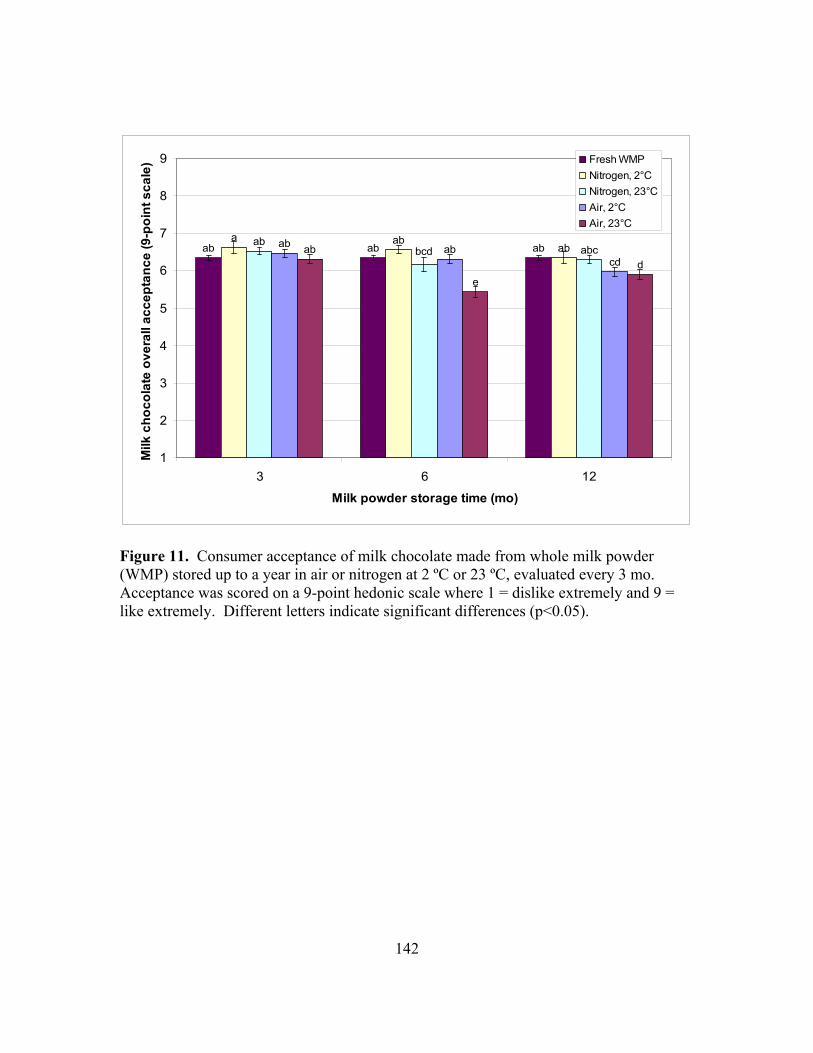
142
ab ab aba ab
abab
bcd abcab
abcd
ab
e
d
1
2
3
4
5
6
7
8
9
3 6 12
Milk powder storage time (mo)
Milk
cho
cola
te o
vera
ll ac
cept
ance
(9-p
oint
sca
le) Fresh WMP
Nitrogen, 2°C
Nitrogen, 23°C
Air, 2°C
Air, 23°C
Figure 11. Consumer acceptance of milk chocolate made from whole milk powder (WMP) stored up to a year in air or nitrogen at 2 ºC or 23 ºC, evaluated every 3 mo. Acceptance was scored on a 9-point hedonic scale where 1 = dislike extremely and 9 = like extremely. Different letters indicate significant differences (p<0.05).
143
APPENDICIES
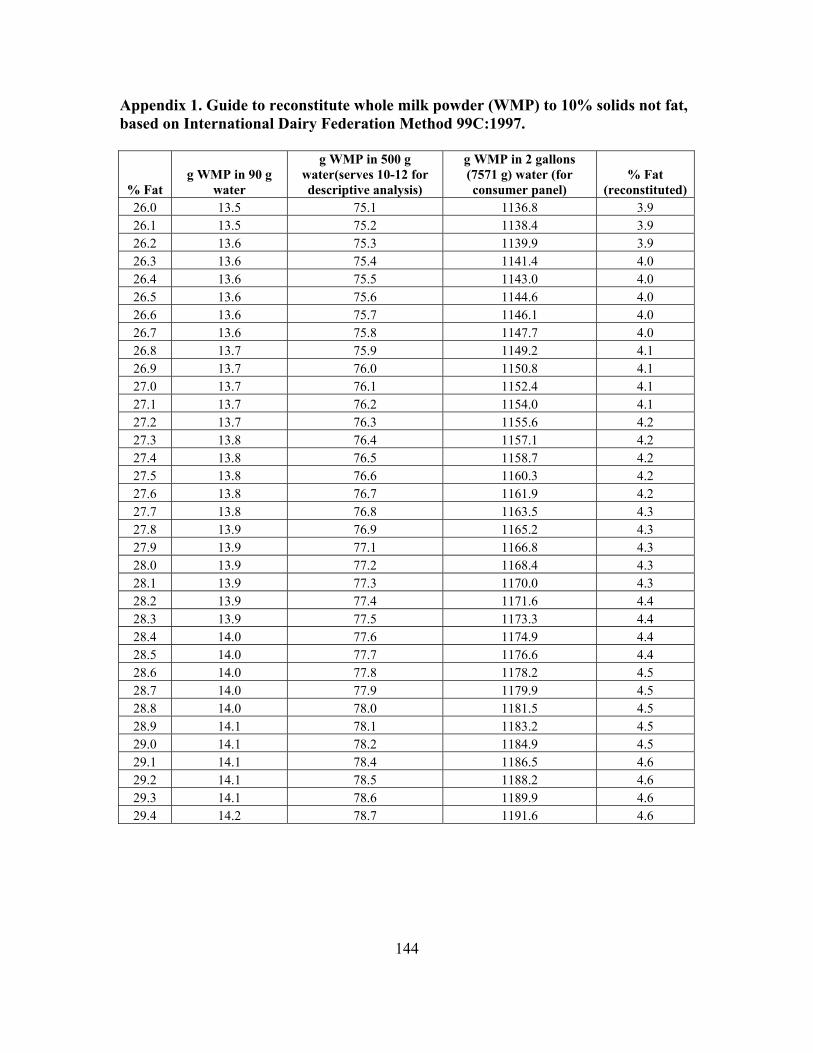
144
Appendix 1. Guide to reconstitute whole milk powder (WMP) to 10% solids not fat, based on International Dairy Federation Method 99C:1997.
% Fat g WMP in 90 g
water
g WMP in 500 g water(serves 10-12 for descriptive analysis)
g WMP in 2 gallons (7571 g) water (for consumer panel)
% Fat (reconstituted)
26.0 13.5 75.1 1136.8 3.9 26.1 13.5 75.2 1138.4 3.9 26.2 13.6 75.3 1139.9 3.9 26.3 13.6 75.4 1141.4 4.0 26.4 13.6 75.5 1143.0 4.0 26.5 13.6 75.6 1144.6 4.0 26.6 13.6 75.7 1146.1 4.0 26.7 13.6 75.8 1147.7 4.0 26.8 13.7 75.9 1149.2 4.1 26.9 13.7 76.0 1150.8 4.1 27.0 13.7 76.1 1152.4 4.1 27.1 13.7 76.2 1154.0 4.1 27.2 13.7 76.3 1155.6 4.2 27.3 13.8 76.4 1157.1 4.2 27.4 13.8 76.5 1158.7 4.2 27.5 13.8 76.6 1160.3 4.2 27.6 13.8 76.7 1161.9 4.2 27.7 13.8 76.8 1163.5 4.3 27.8 13.9 76.9 1165.2 4.3 27.9 13.9 77.1 1166.8 4.3 28.0 13.9 77.2 1168.4 4.3 28.1 13.9 77.3 1170.0 4.3 28.2 13.9 77.4 1171.6 4.4 28.3 13.9 77.5 1173.3 4.4 28.4 14.0 77.6 1174.9 4.4 28.5 14.0 77.7 1176.6 4.4 28.6 14.0 77.8 1178.2 4.5 28.7 14.0 77.9 1179.9 4.5 28.8 14.0 78.0 1181.5 4.5 28.9 14.1 78.1 1183.2 4.5 29.0 14.1 78.2 1184.9 4.5 29.1 14.1 78.4 1186.5 4.6 29.2 14.1 78.5 1188.2 4.6 29.3 14.1 78.6 1189.9 4.6 29.4 14.2 78.7 1191.6 4.6
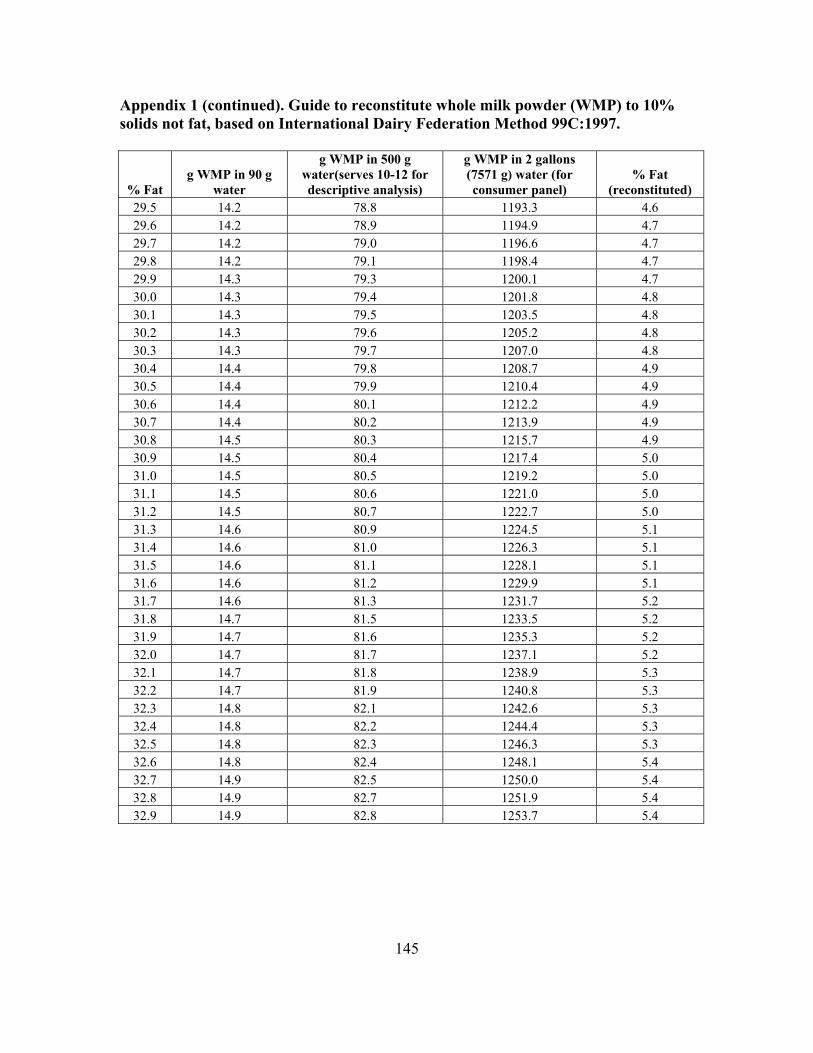
145
Appendix 1 (continued). Guide to reconstitute whole milk powder (WMP) to 10% solids not fat, based on International Dairy Federation Method 99C:1997.
% Fat g WMP in 90 g
water
g WMP in 500 g water(serves 10-12 for descriptive analysis)
g WMP in 2 gallons (7571 g) water (for consumer panel)
% Fat (reconstituted)
29.5 14.2 78.8 1193.3 4.6 29.6 14.2 78.9 1194.9 4.7 29.7 14.2 79.0 1196.6 4.7 29.8 14.2 79.1 1198.4 4.7 29.9 14.3 79.3 1200.1 4.7 30.0 14.3 79.4 1201.8 4.8 30.1 14.3 79.5 1203.5 4.8 30.2 14.3 79.6 1205.2 4.8 30.3 14.3 79.7 1207.0 4.8 30.4 14.4 79.8 1208.7 4.9 30.5 14.4 79.9 1210.4 4.9 30.6 14.4 80.1 1212.2 4.9 30.7 14.4 80.2 1213.9 4.9 30.8 14.5 80.3 1215.7 4.9 30.9 14.5 80.4 1217.4 5.0 31.0 14.5 80.5 1219.2 5.0 31.1 14.5 80.6 1221.0 5.0 31.2 14.5 80.7 1222.7 5.0 31.3 14.6 80.9 1224.5 5.1 31.4 14.6 81.0 1226.3 5.1 31.5 14.6 81.1 1228.1 5.1 31.6 14.6 81.2 1229.9 5.1 31.7 14.6 81.3 1231.7 5.2 31.8 14.7 81.5 1233.5 5.2 31.9 14.7 81.6 1235.3 5.2 32.0 14.7 81.7 1237.1 5.2 32.1 14.7 81.8 1238.9 5.3 32.2 14.7 81.9 1240.8 5.3 32.3 14.8 82.1 1242.6 5.3 32.4 14.8 82.2 1244.4 5.3 32.5 14.8 82.3 1246.3 5.3 32.6 14.8 82.4 1248.1 5.4 32.7 14.9 82.5 1250.0 5.4 32.8 14.9 82.7 1251.9 5.4 32.9 14.9 82.8 1253.7 5.4
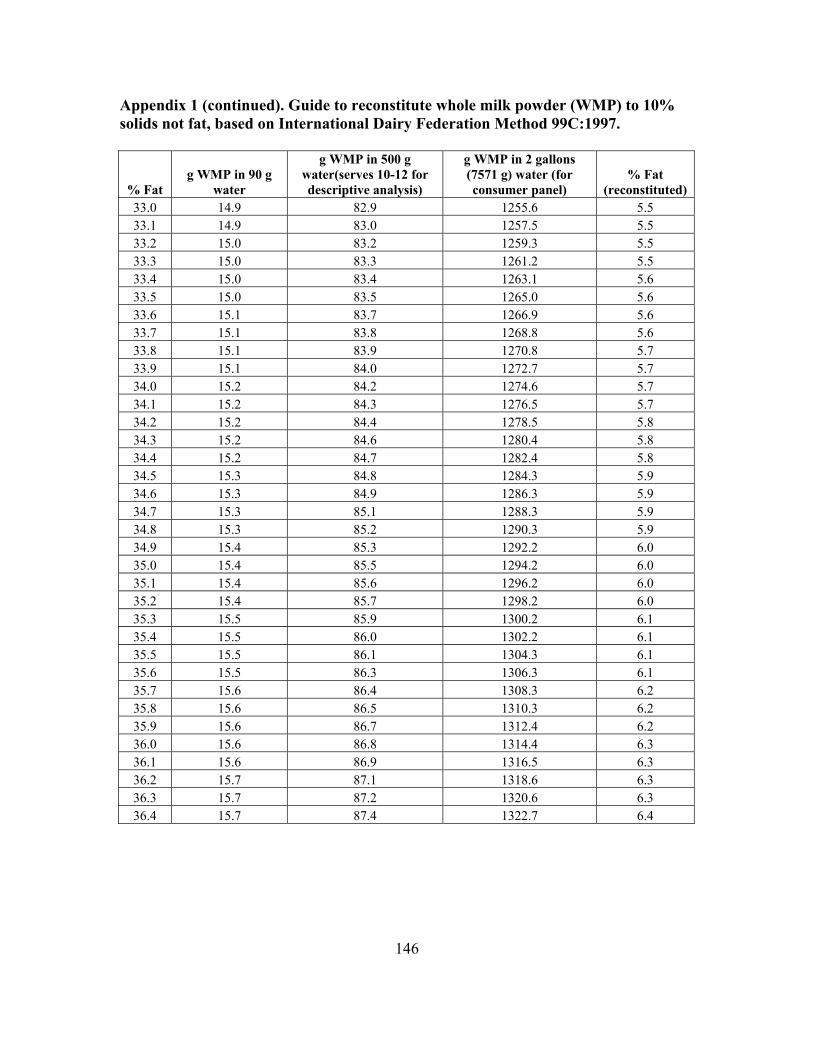
146
Appendix 1 (continued). Guide to reconstitute whole milk powder (WMP) to 10% solids not fat, based on International Dairy Federation Method 99C:1997.
% Fat g WMP in 90 g
water
g WMP in 500 g water(serves 10-12 for descriptive analysis)
g WMP in 2 gallons (7571 g) water (for consumer panel)
% Fat (reconstituted)
33.0 14.9 82.9 1255.6 5.5 33.1 14.9 83.0 1257.5 5.5 33.2 15.0 83.2 1259.3 5.5 33.3 15.0 83.3 1261.2 5.5 33.4 15.0 83.4 1263.1 5.6 33.5 15.0 83.5 1265.0 5.6 33.6 15.1 83.7 1266.9 5.6 33.7 15.1 83.8 1268.8 5.6 33.8 15.1 83.9 1270.8 5.7 33.9 15.1 84.0 1272.7 5.7 34.0 15.2 84.2 1274.6 5.7 34.1 15.2 84.3 1276.5 5.7 34.2 15.2 84.4 1278.5 5.8 34.3 15.2 84.6 1280.4 5.8 34.4 15.2 84.7 1282.4 5.8 34.5 15.3 84.8 1284.3 5.9 34.6 15.3 84.9 1286.3 5.9 34.7 15.3 85.1 1288.3 5.9 34.8 15.3 85.2 1290.3 5.9 34.9 15.4 85.3 1292.2 6.0 35.0 15.4 85.5 1294.2 6.0 35.1 15.4 85.6 1296.2 6.0 35.2 15.4 85.7 1298.2 6.0 35.3 15.5 85.9 1300.2 6.1 35.4 15.5 86.0 1302.2 6.1 35.5 15.5 86.1 1304.3 6.1 35.6 15.5 86.3 1306.3 6.1 35.7 15.6 86.4 1308.3 6.2 35.8 15.6 86.5 1310.3 6.2 35.9 15.6 86.7 1312.4 6.2 36.0 15.6 86.8 1314.4 6.3 36.1 15.6 86.9 1316.5 6.3 36.2 15.7 87.1 1318.6 6.3 36.3 15.7 87.2 1320.6 6.3 36.4 15.7 87.4 1322.7 6.4
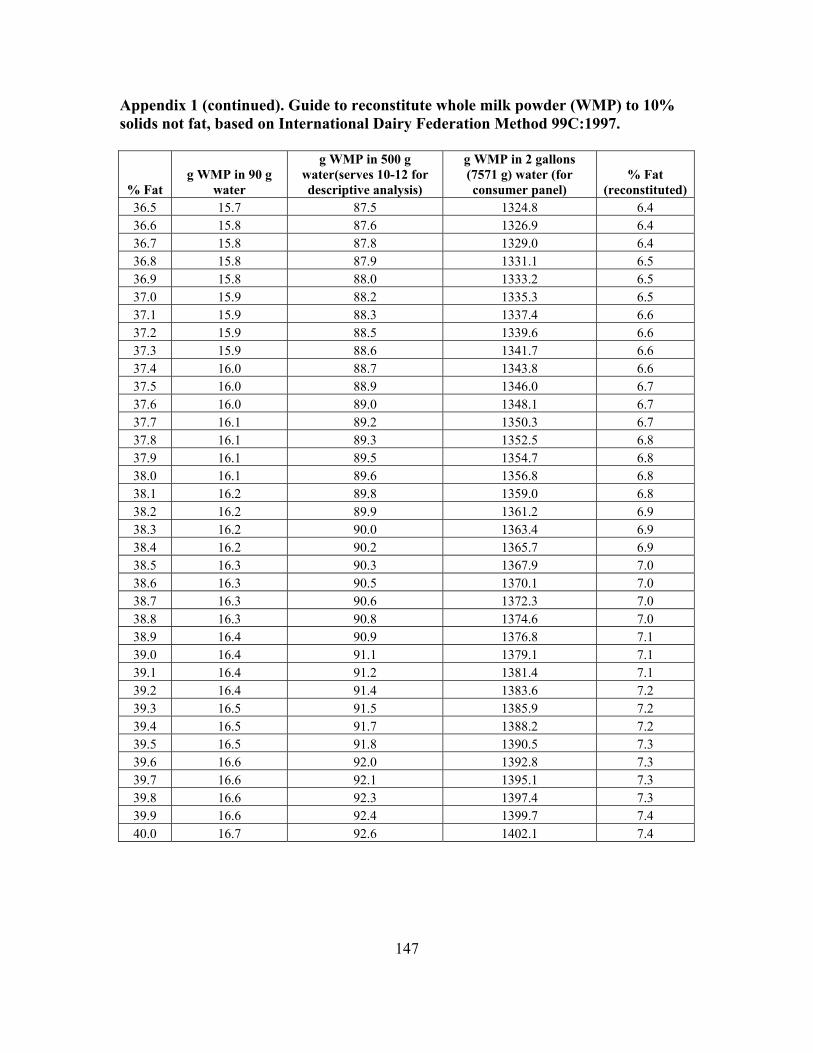
147
Appendix 1 (continued). Guide to reconstitute whole milk powder (WMP) to 10% solids not fat, based on International Dairy Federation Method 99C:1997.
% Fat g WMP in 90 g
water
g WMP in 500 g water(serves 10-12 for descriptive analysis)
g WMP in 2 gallons (7571 g) water (for consumer panel)
% Fat (reconstituted)
36.5 15.7 87.5 1324.8 6.4 36.6 15.8 87.6 1326.9 6.4 36.7 15.8 87.8 1329.0 6.4 36.8 15.8 87.9 1331.1 6.5 36.9 15.8 88.0 1333.2 6.5 37.0 15.9 88.2 1335.3 6.5 37.1 15.9 88.3 1337.4 6.6 37.2 15.9 88.5 1339.6 6.6 37.3 15.9 88.6 1341.7 6.6 37.4 16.0 88.7 1343.8 6.6 37.5 16.0 88.9 1346.0 6.7 37.6 16.0 89.0 1348.1 6.7 37.7 16.1 89.2 1350.3 6.7 37.8 16.1 89.3 1352.5 6.8 37.9 16.1 89.5 1354.7 6.8 38.0 16.1 89.6 1356.8 6.8 38.1 16.2 89.8 1359.0 6.8 38.2 16.2 89.9 1361.2 6.9 38.3 16.2 90.0 1363.4 6.9 38.4 16.2 90.2 1365.7 6.9 38.5 16.3 90.3 1367.9 7.0 38.6 16.3 90.5 1370.1 7.0 38.7 16.3 90.6 1372.3 7.0 38.8 16.3 90.8 1374.6 7.0 38.9 16.4 90.9 1376.8 7.1 39.0 16.4 91.1 1379.1 7.1 39.1 16.4 91.2 1381.4 7.1 39.2 16.4 91.4 1383.6 7.2 39.3 16.5 91.5 1385.9 7.2 39.4 16.5 91.7 1388.2 7.2 39.5 16.5 91.8 1390.5 7.3 39.6 16.6 92.0 1392.8 7.3 39.7 16.6 92.1 1395.1 7.3 39.8 16.6 92.3 1397.4 7.3 39.9 16.6 92.4 1399.7 7.4 40.0 16.7 92.6 1402.1 7.4
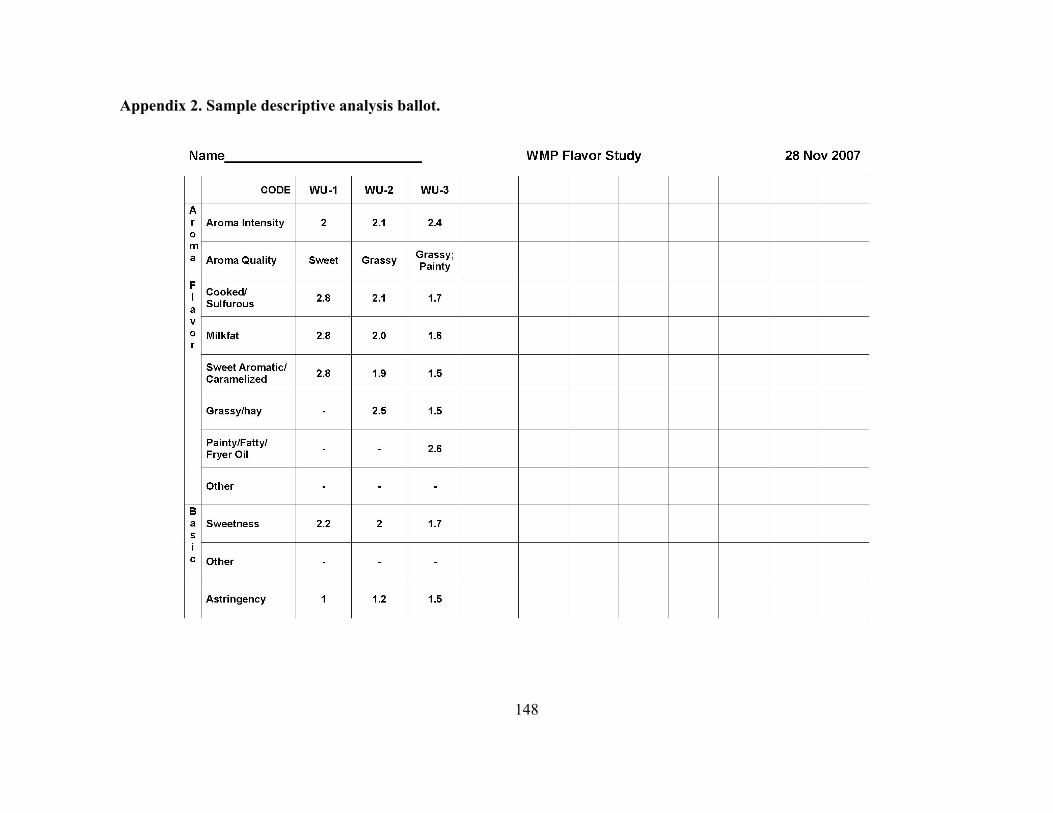
148
Appendix 2. Sample descriptive analysis ballot.

149
Appendix 3. Consumer panel questionnaire for reconstituted whole milk powder.
Welcome to Milk Panel!
Panelist Code: ________________________ Panelist Name: ________________________________________________ Review Instructions
Today you will be evaluating
6 samples of milk.
Please take a drink of water between samples to refresh your sense of taste.
There are 4 questions about each sample.
There are no right or wrong answers. Just give us your
honest opinion.
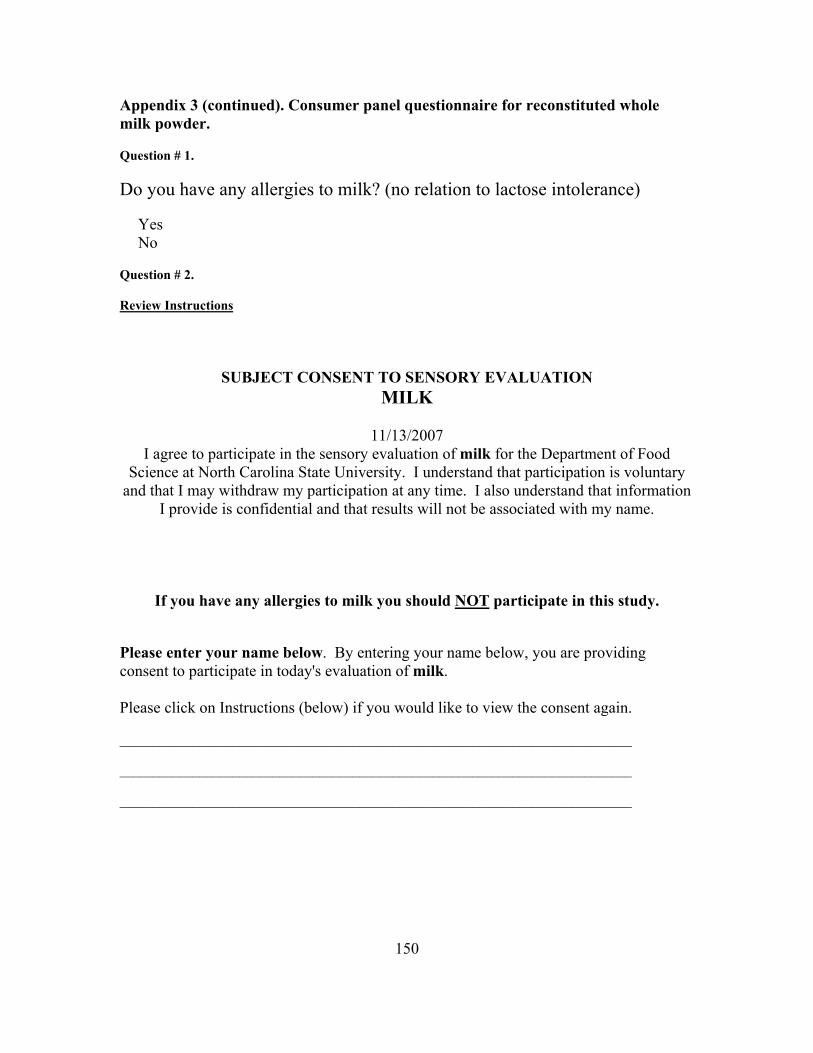
150
Appendix 3 (continued). Consumer panel questionnaire for reconstituted whole milk powder. Question # 1.
Do you have any allergies to milk? (no relation to lactose intolerance) � Yes � No Question # 2. Review Instructions
SUBJECT CONSENT TO SENSORY EVALUATION MILK
11/13/2007
I agree to participate in the sensory evaluation of milk for the Department of Food Science at North Carolina State University. I understand that participation is voluntary
and that I may withdraw my participation at any time. I also understand that information I provide is confidential and that results will not be associated with my name.
If you have any allergies to milk you should NOT participate in this study.
Please enter your name below. By entering your name below, you are providing consent to participate in today's evaluation of milk. Please click on Instructions (below) if you would like to view the consent again. _____________________________________________________________________________ _____________________________________________________________________________ _____________________________________________________________________________
151
Appendix 3 (continued). Consumer panel questionnaire for reconstituted whole milk powder. Question # 3.
Please indicate your gender. � Male � Female Question # 4.
Please indicate your age. � 18 or younger � 19-24 � 25-29 � 30-39 � 40-49 � 50-59 � 60 and over Question # 5.
How often do you typically consume milk? � Never � Less than once per month (occasionally) � At least once per month � At least 2-3 times per month � At least once per week � Several times per week � Everyday Question # 6.
What do you use milk for? Check all that apply. � To drink
� With cereal
� Milkshake/smoothie
� Baking
� Soups/sauces
� Do not use
� Other

152
Appendix 3 (continued). Consumer panel questionnaire for reconstituted whole milk powder. Question # 7.
Please list other ways that you use milk: _____________________________________________________________________________ _____________________________________________________________________________ Question # 8.
What type of milk do you typically consume? Check all that apply: � Nonfat (skim) milk
� 1% milk
� 2% milk
� Whole milk
� Other Question # 9.
Please list what other types of milk you consume: _____________________________________________________________________________ _____________________________________________________________________________ Question # 10 - Sample ______
Please indicate how you feel about the OVERALL ACCEPTANCE of sample _____. Overall Acceptance
Overall Acceptance dislike dislike dislike dislike neither like like like like extremely very moderately slightly like nor slightly moderately very extremely much dislike much
1 2 3 4 5 6 7 8 9
Question # 11 - Sample ______
Please indicate how you feel about the following attributes in sample _____.
153
Appendix 3 (continued). Consumer panel questionnaire for reconstituted whole milk powder. Flavor
Flavor dislike dislike dislike dislike neither like like like like extremely very moderately slightly like nor slightly moderately very extremely much dislike much
1 2 3 4 5 6 7 8 9
Mouthfeel/Texture
Mouthfeel/Texture dislike dislike dislike dislike neither like like like like extremely very moderately slightly like nor slightly moderately very extremely much dislike much
1 2 3 4 5 6 7 8 9
Question # 12 - Sample ______
Please rate the intensity of the following attributes in sample _____. Freshness Intensity
Freshness Intensity low moderate high
1 2 3 4 5 6 7 8 9
Question # 13 - Sample ______
Please share any comments you have about sample _____. _____________________________________________________________________________ _____________________________________________________________________________
THANK YOU!
Please return your samples
to the booth turntable and get your treat
from the workers in the kitchen.
Come back tomorrow to taste milk chocolate!

154
Appendix 4. Consumer panel questionnaire for chocolate.
Welcome to Chocolate Panel!
We are glad to have you participate!
Panelist Code: ________________________ Panelist Name: ________________________________________________ Question # 1.
Do you have any allergies to milk or soy? m Yes m No Question # 2. Review Instructions
SUBJECT CONSENT TO SENSORY EVALUATION
Chocolate
2/14/2007 I agree to participate in a consumer panel on chocolate for the Department of Food
Science at North Carolina State University. I understand that participation is voluntary and that I may withdraw my participation at any time. I also understand that information
I provide is confidential and that results will not be associated with my name.
If you have any allergies to MILK or SOY you should NOT participate in this study.
155
Appendix 4 (continued). Consumer panel questionnaire for chocolate.
Please enter your name below. By entering your name below, you are providing consent to participate in today's evaluation of chocolate which contains milk and soy ingredients. Please click on Instructions (below) if you would like to view the consent again. _____________________________________________________________________________ _____________________________________________________________________________ Question # 3.
Please indicate your gender. � Male � Female Question # 4.
Please indicate your age. � 18 or younger � 19-24 � 25-29 � 30-39 � 40-49 � 50-59 � 60 and over Question # 5.
What types of chocolate do you typically consume? (check all that apply) � Milk Chocolate
� Semi-sweet Chocolate
� Dark Chocolate
� White Chocolate
� Other
156
Appendix 4 (continued). Consumer panel questionnaire for chocolate. Question # 6.
Please explain what other types of chocolate you consume: _____________________________________________________________________________ _____________________________________________________________________________ Question # 7.
How often do you typically consume any kind of chocolate (milk chocolate, semi-sweet, dark, white, etc.)? � Never � Less than once per month (occasionally) � At least once per month � At least 2-3 times per month � At least once per week � Several times per week � Everyday Question # 8 - Sample ______
Please indicate how you feel about the OVERALL ACCEPTANCE of sample _____ Overall Acceptance
Overall Acceptance dislike dislike dislike dislike neither like like like like extremely very moderately slightly like nor slightly moderately very extremely much dislike much
1 2 3 4 5 6 7 8 9
Question # 9 - Sample ______
Please indicate how you feel about the following attributes in sample _____. Appearance
Appearance dislike dislike dislike dislike neither like like like like extremely very moderately slightly like nor slightly moderately very extremely much dislike much
1 2 3 4 5 6 7 8 9

157
Appendix 4 (continued). Consumer panel questionnaire for chocolate. Milk Chocolate Flavor
Milk Chocolate Flavor dislike dislike dislike dislike neither like like like like extremely very moderately slightly like nor slightly moderately very extremely much dislike much
1 2 3 4 5 6 7 8 9
Mouthfeel/Texture
Mouthfeel/Texture dislike dislike dislike dislike neither like like like like extremely very moderately slightly like nor slightly moderately very extremely much dislike much
1 2 3 4 5 6 7 8 9
Question # 10 - Sample ______
Please rate the intensity of the following attributes in sample _____. Chocolate Flavor Intensity
Chocolate Flavor Intensity low moderate high
1 2 3 4 5 6 7 8 9
Freshness Intensity
Freshness Intensity low moderate high
1 2 3 4 5 6 7 8 9
Question # 11 - Sample ______
Do you have any comments about sample _____? _____________________________________________________________________________
THANK YOU!
Please return any unwanted samples to the booth turntable and collect your treat from the workers in the kitchen.
Come back tomorrow to taste white chocolate.
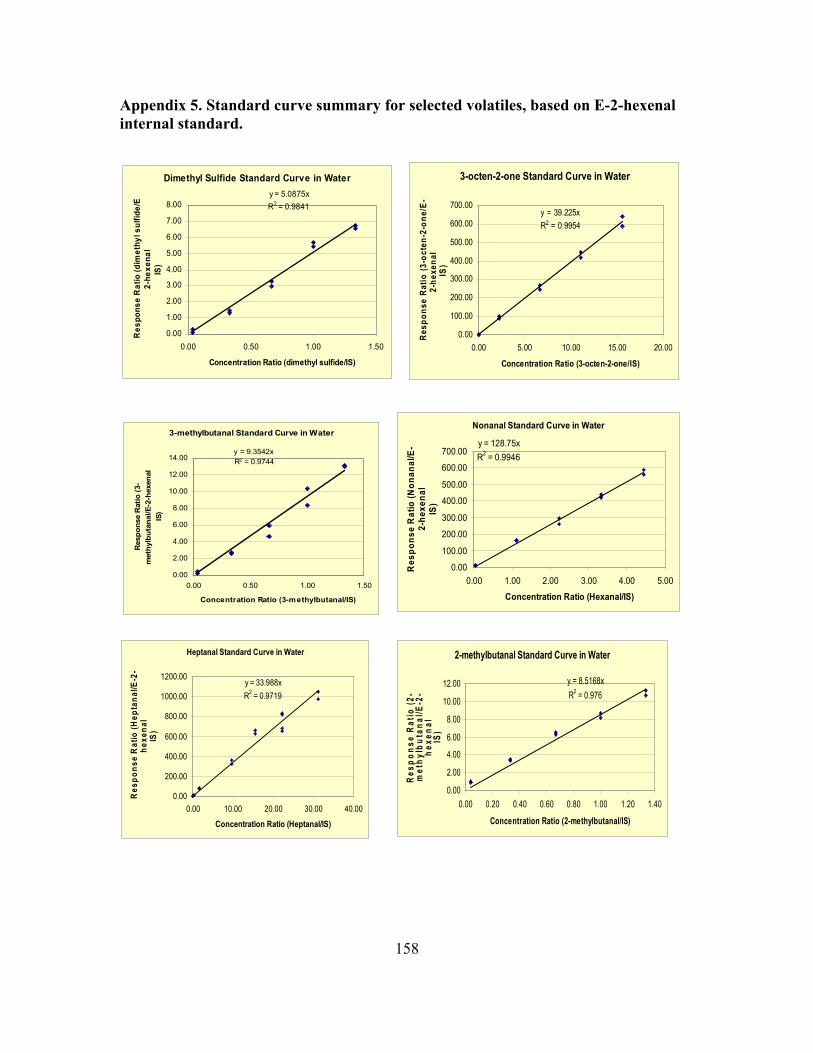
158
Appendix 5. Standard curve summary for selected volatiles, based on E-2-hexenal internal standard.
3-methylbutanal Standard Curve in Water
y = 9.3542xR2 = 0.9744
0.00
2.00
4.00
6.00
8.00
10.00
12.00
14.00
0.00 0.50 1.00 1.50
Concentration Ratio (3-methylbutanal/IS)
Res
pons
e R
atio
(3-
met
hylb
utan
al/E
-2-h
exen
alIS
)
Dimethyl Sulfide Standard Curve in Watery = 5.0875x
R2 = 0.9841
0.00
1.00
2.00
3.00
4.00
5.00
6.00
7.00
8.00
0.00 0.50 1.00 1.50
Concentration Ratio (dimethyl sulfide/IS)
Res
pons
e R
atio
(dim
ethy
l sul
fide/
E2-
hexe
nal
IS)
3-octen-2-one Standard Curve in Water
y = 39.225x
R2 = 0.9954
0.00
100.00
200.00
300.00
400.00
500.00
600.00
700.00
0.00 5.00 10.00 15.00 20.00
Concentration Ratio (3-octen-2-one/IS)
Res
pons
e R
atio
(3-o
cten
-2-o
ne/E
-2-
hexe
nal
IS)
2-methylbutanal Standard Curve in Water
y = 8.5168x
R2 = 0.976
0.00
2.00
4.00
6.00
8.00
10.00
12.00
0.00 0.20 0.40 0.60 0.80 1.00 1.20 1.40
Concentration Ratio (2-methylbutanal/IS)
Res
pons
e R
atio
(2-
met
hylb
utan
al/E
-2-
hexe
nal
IS)
Nonanal Standard Curve in Water
y = 128.75x
R2 = 0.9946
0.00
100.00
200.00
300.00
400.00
500.00
600.00
700.00
0.00 1.00 2.00 3.00 4.00 5.00
Concentration Ratio (Hexanal/IS)
Res
pons
e R
atio
(Non
anal
/E-
2-he
xena
lIS
)
Heptanal Standard Curve in Water
y = 33.988x
R2 = 0.9719
0.00
200.00
400.00
600.00
800.00
1000.00
1200.00
0.00 10.00 20.00 30.00 40.00
Concentration Ratio (Heptanal/IS)
Res
pons
e R
atio
(Hep
tana
l/E-2
-he
xena
lIS
)
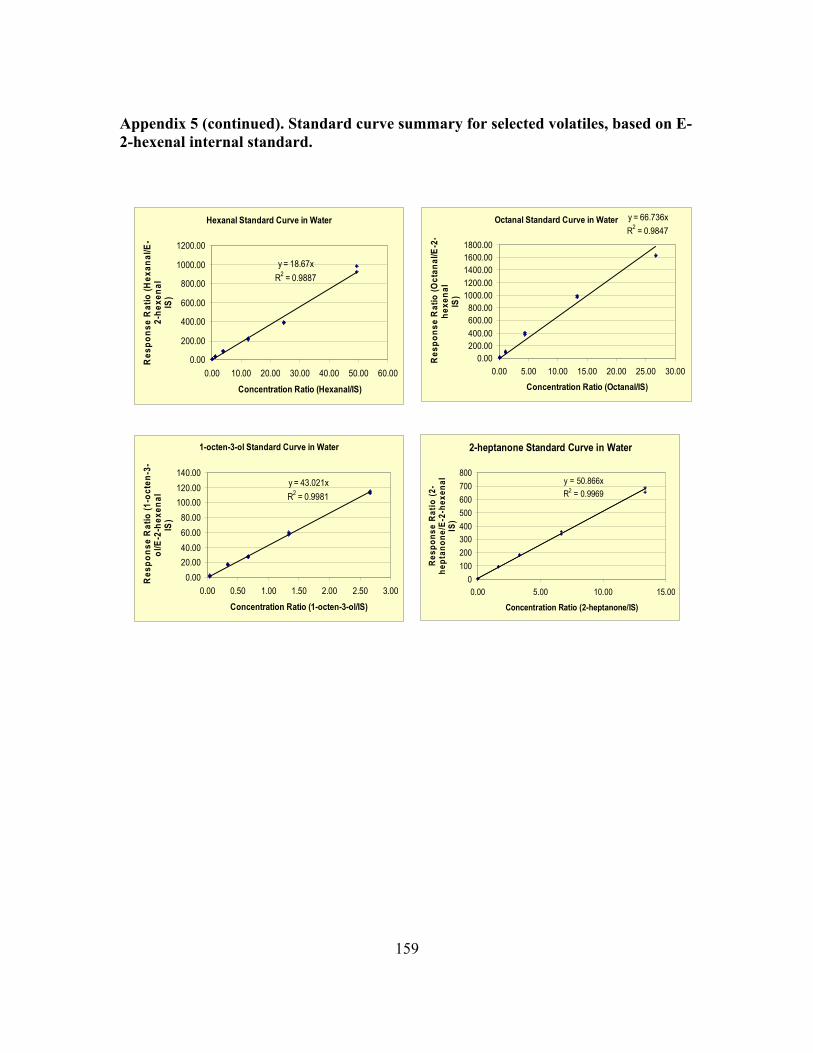
159
Appendix 5 (continued). Standard curve summary for selected volatiles, based on E-2-hexenal internal standard.
Hexanal Standard Curve in Water
y = 18.67x
R2 = 0.9887
0.00
200.00
400.00
600.00
800.00
1000.00
1200.00
0.00 10.00 20.00 30.00 40.00 50.00 60.00
Concentration Ratio (Hexanal/IS)
Res
pons
e R
atio
(Hex
anal
/E-
2-he
xena
lIS
)
Octanal Standard Curve in Water y = 66.736x
R2 = 0.9847
0.00200.00400.00
600.00800.00
1000.001200.00
1400.001600.001800.00
0.00 5.00 10.00 15.00 20.00 25.00 30.00
Concentration Ratio (Octanal/IS)
Res
pons
e R
atio
(Oct
anal
/E-2
-he
xena
lIS
)1-octen-3-ol Standard Curve in Water
y = 43.021x
R2 = 0.9981
0.00
20.00
40.00
60.00
80.00
100.00
120.00
140.00
0.00 0.50 1.00 1.50 2.00 2.50 3.00
Concentration Ratio (1-octen-3-ol/IS)
Res
pons
e R
atio
(1-o
cten
-3-
ol/E
-2-h
exen
alIS
)
2-heptanone Standard Curve in Water
y = 50.866x
R2 = 0.9969
0
100
200
300
400
500
600
700
800
0.00 5.00 10.00 15.00
Concentration Ratio (2-heptanone/IS)
Res
pons
e R
atio
(2-
hept
anon
e/E-
2-he
xena
lIS
)
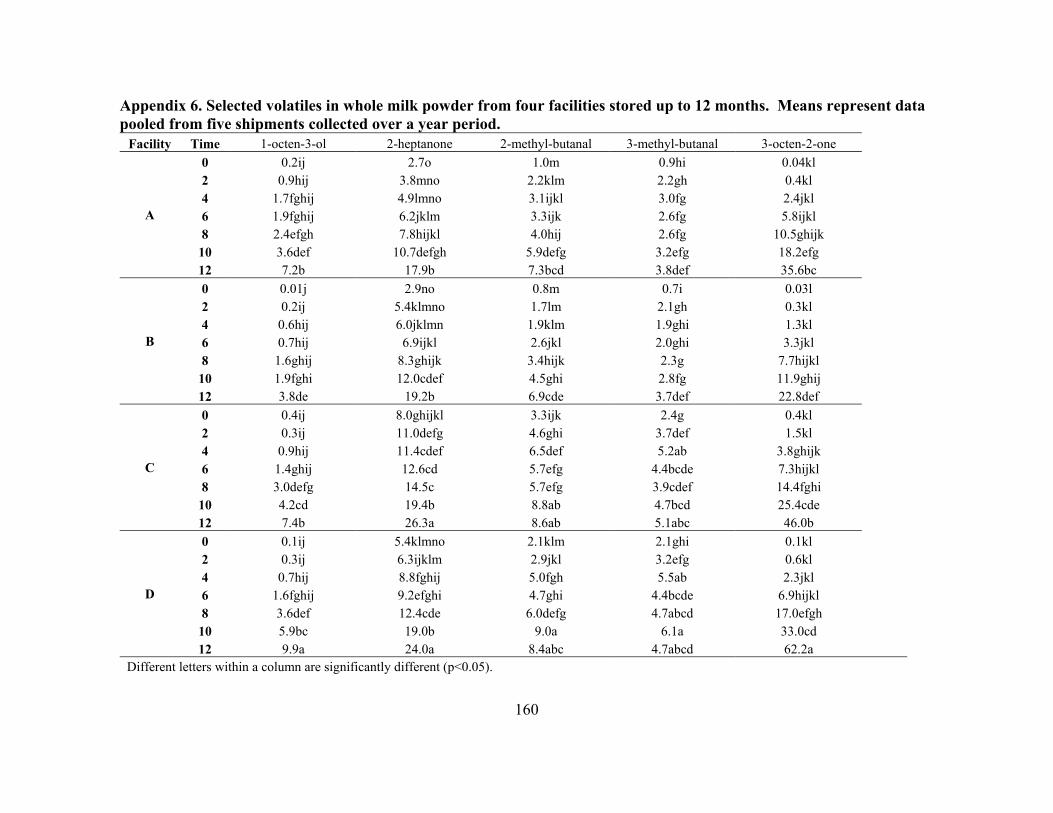
160
Appendix 6. Selected volatiles in whole milk powder from four facilities stored up to 12 months. Means represent data pooled from five shipments collected over a year period.
Facility Time 1-octen-3-ol 2-heptanone 2-methyl-butanal 3-methyl-butanal 3-octen-2-one
A
0 0.2ij 2.7o 1.0m 0.9hi 0.04kl 2 0.9hij 3.8mno 2.2klm 2.2gh 0.4kl 4 1.7fghij 4.9lmno 3.1ijkl 3.0fg 2.4jkl 6 1.9fghij 6.2jklm 3.3ijk 2.6fg 5.8ijkl 8 2.4efgh 7.8hijkl 4.0hij 2.6fg 10.5ghijk
10 3.6def 10.7defgh 5.9defg 3.2efg 18.2efg 12 7.2b 17.9b 7.3bcd 3.8def 35.6bc
B
0 0.01j 2.9no 0.8m 0.7i 0.03l 2 0.2ij 5.4klmno 1.7lm 2.1gh 0.3kl 4 0.6hij 6.0jklmn 1.9klm 1.9ghi 1.3kl 6 0.7hij 6.9ijkl 2.6jkl 2.0ghi 3.3jkl 8 1.6ghij 8.3ghijk 3.4hijk 2.3g 7.7hijkl
10 1.9fghi 12.0cdef 4.5ghi 2.8fg 11.9ghij 12 3.8de 19.2b 6.9cde 3.7def 22.8def
C
0 0.4ij 8.0ghijkl 3.3ijk 2.4g 0.4kl 2 0.3ij 11.0defg 4.6ghi 3.7def 1.5kl 4 0.9hij 11.4cdef 6.5def 5.2ab 3.8ghijk 6 1.4ghij 12.6cd 5.7efg 4.4bcde 7.3hijkl 8 3.0defg 14.5c 5.7efg 3.9cdef 14.4fghi
10 4.2cd 19.4b 8.8ab 4.7bcd 25.4cde 12 7.4b 26.3a 8.6ab 5.1abc 46.0b
D
0 0.1ij 5.4klmno 2.1klm 2.1ghi 0.1kl 2 0.3ij 6.3ijklm 2.9jkl 3.2efg 0.6kl 4 0.7hij 8.8fghij 5.0fgh 5.5ab 2.3jkl 6 1.6fghij 9.2efghi 4.7ghi 4.4bcde 6.9hijkl 8 3.6def 12.4cde 6.0defg 4.7abcd 17.0efgh
10 5.9bc 19.0b 9.0a 6.1a 33.0cd 12 9.9a 24.0a 8.4abc 4.7abcd 62.2a
Different letters within a column are significantly different (p<0.05).
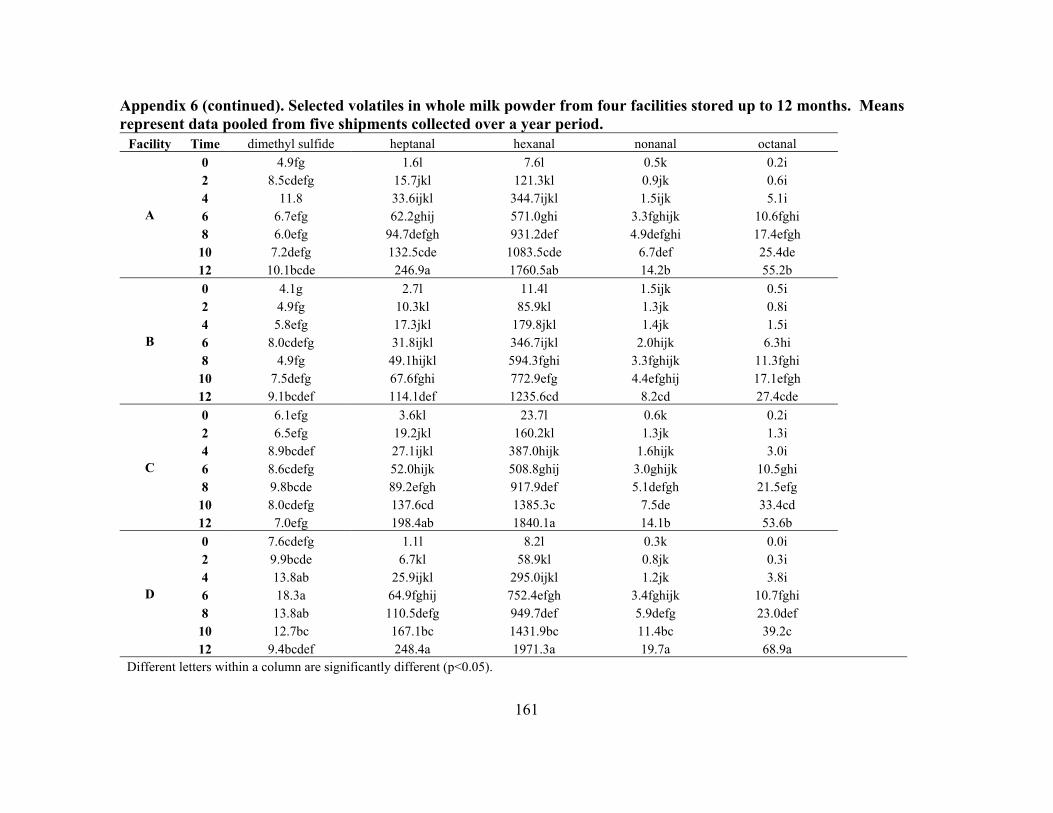
161
Appendix 6 (continued). Selected volatiles in whole milk powder from four facilities stored up to 12 months. Means represent data pooled from five shipments collected over a year period.
Facility Time dimethyl sulfide heptanal hexanal nonanal octanal
A
0 4.9fg 1.6l 7.6l 0.5k 0.2i 2 8.5cdefg 15.7jkl 121.3kl 0.9jk 0.6i 4 11.8 33.6ijkl 344.7ijkl 1.5ijk 5.1i 6 6.7efg 62.2ghij 571.0ghi 3.3fghijk 10.6fghi 8 6.0efg 94.7defgh 931.2def 4.9defghi 17.4efgh
10 7.2defg 132.5cde 1083.5cde 6.7def 25.4de 12 10.1bcde 246.9a 1760.5ab 14.2b 55.2b
B
0 4.1g 2.7l 11.4l 1.5ijk 0.5i 2 4.9fg 10.3kl 85.9kl 1.3jk 0.8i 4 5.8efg 17.3jkl 179.8jkl 1.4jk 1.5i 6 8.0cdefg 31.8ijkl 346.7ijkl 2.0hijk 6.3hi 8 4.9fg 49.1hijkl 594.3fghi 3.3fghijk 11.3fghi
10 7.5defg 67.6fghi 772.9efg 4.4efghij 17.1efgh 12 9.1bcdef 114.1def 1235.6cd 8.2cd 27.4cde
C
0 6.1efg 3.6kl 23.7l 0.6k 0.2i 2 6.5efg 19.2jkl 160.2kl 1.3jk 1.3i 4 8.9bcdef 27.1ijkl 387.0hijk 1.6hijk 3.0i 6 8.6cdefg 52.0hijk 508.8ghij 3.0ghijk 10.5ghi 8 9.8bcde 89.2efgh 917.9def 5.1defgh 21.5efg
10 8.0cdefg 137.6cd 1385.3c 7.5de 33.4cd 12 7.0efg 198.4ab 1840.1a 14.1b 53.6b
D
0 7.6cdefg 1.1l 8.2l 0.3k 0.0i 2 9.9bcde 6.7kl 58.9kl 0.8jk 0.3i 4 13.8ab 25.9ijkl 295.0ijkl 1.2jk 3.8i 6 18.3a 64.9fghij 752.4efgh 3.4fghijk 10.7fghi 8 13.8ab 110.5defg 949.7def 5.9defg 23.0def
10 12.7bc 167.1bc 1431.9bc 11.4bc 39.2c 12 9.4bcdef 248.4a 1971.3a 19.7a 68.9a
Different letters within a column are significantly different (p<0.05).

162
Appendix 7. Flavor intensities of whole milk powder from four facilities stored up to 12 months. Means represent data pooled from five shipments collected over a year period.
Facility Time aroma
intensity sweet
aromatic/caramelized milkfat sweetness cooked/sulfurous grassy/hay fatty/fryer oil/painty astringency
A
0 1.95j 2.25c 2.54b 2.04defg 2.36de 0.75k ND 1.21efgh 2 2.04ghi 2.002fghi 2.21cd 2.11abcd 2.13ghi 1.97bc ND 1.13hijk 4 2.08efgh 2.00ghi 2.13def 2.04efg 2.15gh 1.96bc 0.66ij 1.14ghijk 6 2.10defg 1.86klmn 1.99hijk 1.99ghi 2.03jkl 1.99bc 1.06gh 1.17fghi 8 2.15bcd 1.69q 1.86lm 1.94ijk 1.88n 2.14bc 1.49de 1.33abc
10 2.15bcd 1.76opq 1.88lm 1.87l 1.93mn 2.12b 1.65cd 1.28cd 12 2.21a 1.72pq 1.86m 1.90kl 1.90mn 2.45a 2.08ab 1.34abc
B
0 2.09efgh 2.44b 2.70a 2.08bcde 2.70a ND ND 1.14ghijk 2 1.94j 2.27c 2.47b 2.17a 2.38de 0.82jk ND 1.05l 4 2.07fgh 2.08efg 2.21cd 2.08bcde 2.19gh 1.24ghi 0.61ij 1.15ghijk 6 2.03hi 1.98ghij 2.14de 2.01fgh 2.11hij 1.48f 0.65ij 1.15ghijk 8 2.06gh 1.86klmn 2.00ghij 2.00gh 1.97klm 1.48f 1.06gh 1.26de
10 2.09efg 1.92ijkl 2.05efgh 1.90kl 2.04ijk 1.40fgh 1.16fgh 1.21ef 12 2.12cdef 1.88jklm 2.04fghi 1.94ijk 1.99klm 1.70de 1.33efg 1.28cd
C
0 2.04ghi 2.61a 2.73a 2.13abc 2.60ab ND ND 1.07kl 2 1.95j 2.25c 2.49b 2.14ab 2.54bc 0.75k ND 1.05l 4 2.07fgh 2.18cde 2.30c 2.07cdef 2.34de 1.22hi ND 1.10jkl 6 2.14bcde 1.94hijk 2.11def 1.99ghi 2.19gh 1.49ef 1.23efg 1.6fghij 8 2.18ab 1.78nopq 1.91klm 1.93jkl 2.02kl 1.46fgh 1.58d 1.32bc
10 2.16bc 1.83lmno 1.95ijkl 1.89kl 1.96lmn 1.55ef 1.96bc 1.26de 12 2.22a 1.79nopq 1.92jklm 1.8kl 1.95lmn 1.90cd 2.32a 1.35ab
D
0 2.10cdefg 2.47b 2.48b 2.15ab 2.44cd ND ND 1.11ijkl 2 1.99ij 2.23cd 2.46b 2.15ab 2.30ef 0.69 ND 1.10jkl 4 2.06gh 2.13def 2.19d 2.04efg 2.22fg 1.04ij ND 1.15fghijk 6 2.08efgh 2.05fgh 2.10defg 1.98ghij 2.14ghi 1.13i 0.86hi 1.21efg 8 2.10defg 1.81mnop 1.93jklm 1.96hij 1.97klmn 1.61ef 1.44def 1.37ab
10 2.14bcde 1.86klmn 1.91jklm 1.89kl 1.99klm 1.44fg 1.66cd 1.31bcd 12 2.19ab 1.80mnop 1.93jklm 1.90kl 1.96klmn 1.94bcd 2.31a 1.39a
Different letters within a column are significantly different (p<0.05). ND=not detected
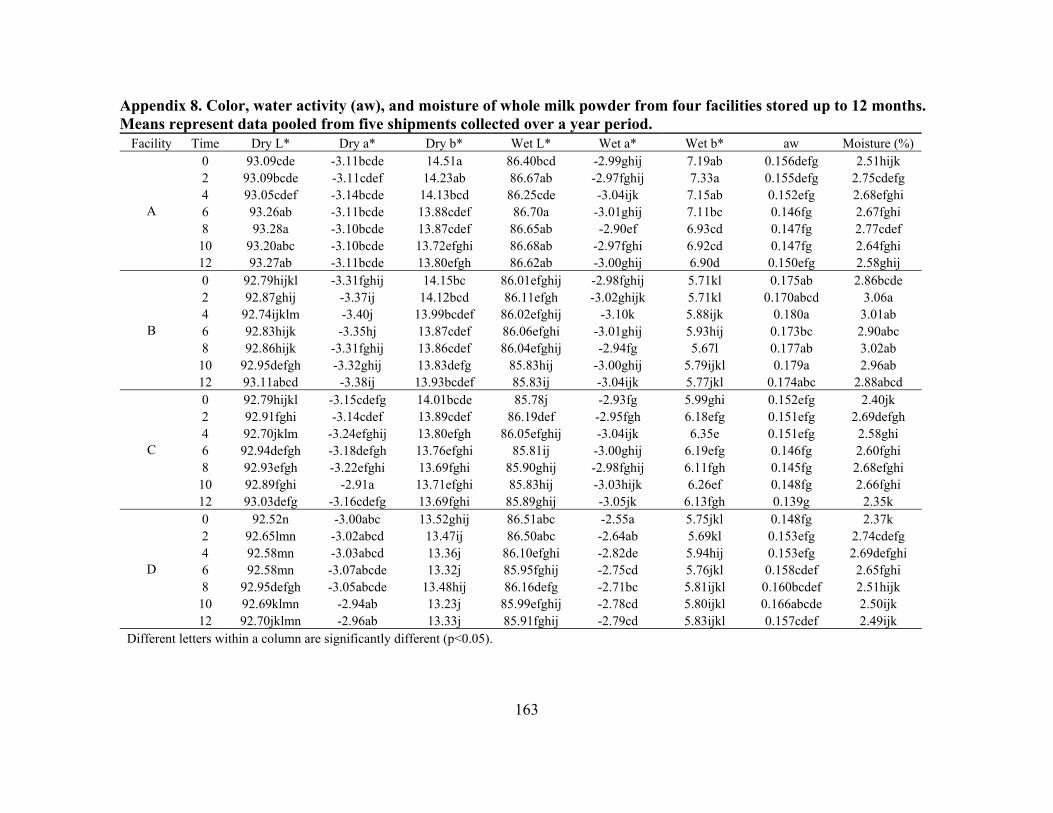
163
Appendix 8. Color, water activity (aw), and moisture of whole milk powder from four facilities stored up to 12 months. Means represent data pooled from five shipments collected over a year period.
Facility Time Dry L* Dry a* Dry b* Wet L* Wet a* Wet b* aw Moisture (%)
A
0 93.09cde -3.11bcde 14.51a 86.40bcd -2.99ghij 7.19ab 0.156defg 2.51hijk 2 93.09bcde -3.11cdef 14.23ab 86.67ab -2.97fghij 7.33a 0.155defg 2.75cdefg 4 93.05cdef -3.14bcde 14.13bcd 86.25cde -3.04ijk 7.15ab 0.152efg 2.68efghi 6 93.26ab -3.11bcde 13.88cdef 86.70a -3.01ghij 7.11bc 0.146fg 2.67fghi 8 93.28a -3.10bcde 13.87cdef 86.65ab -2.90ef 6.93cd 0.147fg 2.77cdef
10 93.20abc -3.10bcde 13.72efghi 86.68ab -2.97fghi 6.92cd 0.147fg 2.64fghi 12 93.27ab -3.11bcde 13.80efgh 86.62ab -3.00ghij 6.90d 0.150efg 2.58ghij
B
0 92.79hijkl -3.31fghij 14.15bc 86.01efghij -2.98fghij 5.71kl 0.175ab 2.86bcde 2 92.87ghij -3.37ij 14.12bcd 86.11efgh -3.02ghijk 5.71kl 0.170abcd 3.06a 4 92.74ijklm -3.40j 13.99bcdef 86.02efghij -3.10k 5.88ijk 0.180a 3.01ab 6 92.83hijk -3.35hj 13.87cdef 86.06efghi -3.01ghij 5.93hij 0.173bc 2.90abc 8 92.86hijk -3.31fghij 13.86cdef 86.04efghij -2.94fg 5.67l 0.177ab 3.02ab
10 92.95defgh -3.32ghij 13.83defg 85.83hij -3.00ghij 5.79ijkl 0.179a 2.96ab 12 93.11abcd -3.38ij 13.93bcdef 85.83ij -3.04ijk 5.77jkl 0.174abc 2.88abcd
C
0 92.79hijkl -3.15cdefg 14.01bcde 85.78j -2.93fg 5.99ghi 0.152efg 2.40jk 2 92.91fghi -3.14cdef 13.89cdef 86.19def -2.95fgh 6.18efg 0.151efg 2.69defgh 4 92.70jklm -3.24efghij 13.80efgh 86.05efghij -3.04ijk 6.35e 0.151efg 2.58ghi 6 92.94defgh -3.18defgh 13.76efghi 85.81ij -3.00ghij 6.19efg 0.146fg 2.60fghi 8 92.93efgh -3.22efghi 13.69fghi 85.90ghij -2.98fghij 6.11fgh 0.145fg 2.68efghi
10 92.89fghi -2.91a 13.71efghi 85.83hij -3.03hijk 6.26ef 0.148fg 2.66fghi 12 93.03defg -3.16cdefg 13.69fghi 85.89ghij -3.05jk 6.13fgh 0.139g 2.35k
D
0 92.52n -3.00abc 13.52ghij 86.51abc -2.55a 5.75jkl 0.148fg 2.37k 2 92.65lmn -3.02abcd 13.47ij 86.50abc -2.64ab 5.69kl 0.153efg 2.74cdefg 4 92.58mn -3.03abcd 13.36j 86.10efghi -2.82de 5.94hij 0.153efg 2.69defghi 6 92.58mn -3.07abcde 13.32j 85.95fghij -2.75cd 5.76jkl 0.158cdef 2.65fghi 8 92.95defgh -3.05abcde 13.48hij 86.16defg -2.71bc 5.81ijkl 0.160bcdef 2.51hijk
10 92.69klmn -2.94ab 13.23j 85.99efghij -2.78cd 5.80ijkl 0.166abcde 2.50ijk 12 92.70jklmn -2.96ab 13.33j 85.91fghij -2.79cd 5.83ijkl 0.157cdef 2.49ijk
Different letters within a column are significantly different (p<0.05).
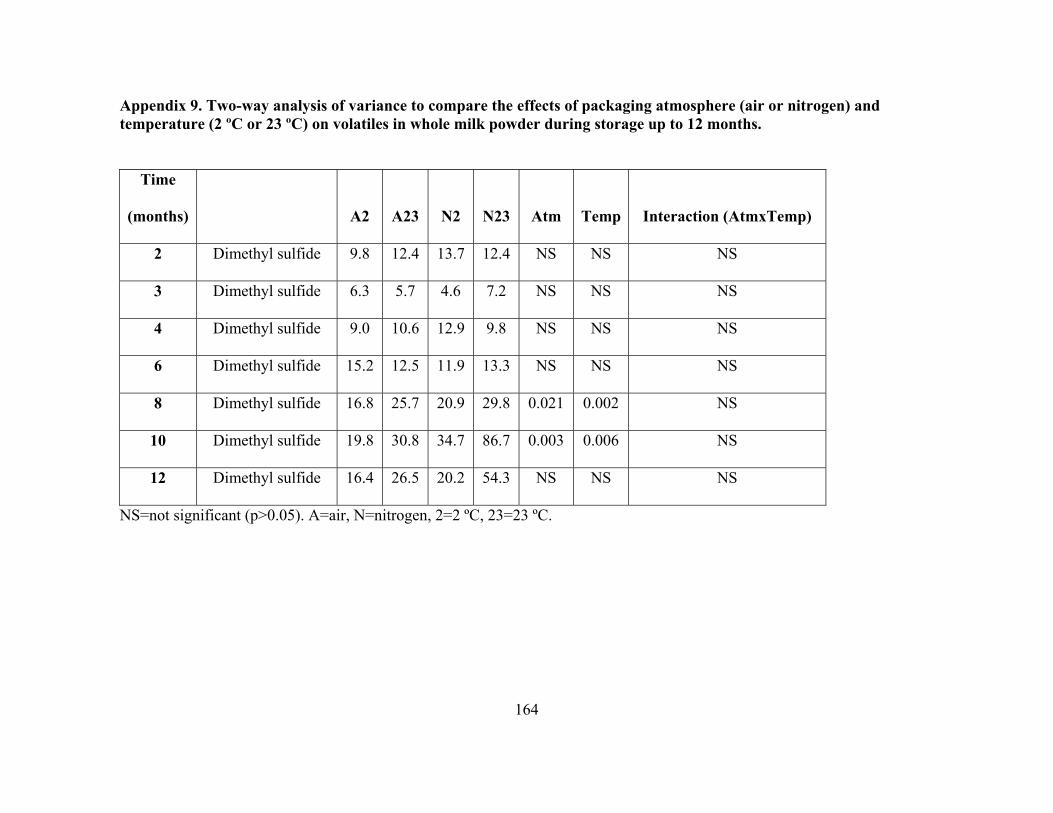
164
Appendix 9. Two-way analysis of variance to compare the effects of packaging atmosphere (air or nitrogen) and temperature (2 ºC or 23 ºC) on volatiles in whole milk powder during storage up to 12 months.
Time
(months) A2 A23 N2 N23 Atm Temp Interaction (AtmxTemp)
2 Dimethyl sulfide 9.8 12.4 13.7 12.4 NS NS NS
3 Dimethyl sulfide 6.3 5.7 4.6 7.2 NS NS NS
4 Dimethyl sulfide 9.0 10.6 12.9 9.8 NS NS NS
6 Dimethyl sulfide 15.2 12.5 11.9 13.3 NS NS NS
8 Dimethyl sulfide 16.8 25.7 20.9 29.8 0.021 0.002 NS
10 Dimethyl sulfide 19.8 30.8 34.7 86.7 0.003 0.006 NS
12 Dimethyl sulfide 16.4 26.5 20.2 54.3 NS NS NS
NS=not significant (p>0.05). A=air, N=nitrogen, 2=2 ºC, 23=23 ºC.

165
Appendix 9 (continued). Two-way analysis of variance to compare the effects of packaging atmosphere (air or nitrogen) and temperature (2 ºC or 23 ºC) on volatiles in whole milk powder during storage up to 12 months.
Time (months) A2 A23 N2 N23 Atm Temp Interaction (AtmxTemp)
2 3-methylbutanal 2.7 2.9 3.0 6.2 0.003 0.005 0.013
3 3-methylbutanal 2.1 2.0 1.3 2.0 NS NS NS
4 3-methylbutanal 3.2 5.0 3.4 4.4 0.007 0.003 0.019
6 3-methylbutanal 4.5 6.0 3.3 3.7 0.013 NS NS
8 3-methylbutanal 6.3 9.1 5.1 6.7 NS 0.001 NS
10 3-methylbutanal 4.7 6.6 5.2 12.3 0.003 < 0.0001 0.009
12 3-methylbutanal 4.0 8.6 3.4 8.0 NS NS NS
NS=not significant (p>0.05). A=air, N=nitrogen, 2=2 ºC, 23=23 ºC.

166
Appendix 9 (continued). Two-way analysis of variance to compare the effects of packaging atmosphere (air or nitrogen) and temperature (2 ºC or 23 ºC) on volatiles in whole milk powder during storage up to 12 months.
Time (months) A2 A23 N2 N23 Atm Temp Interaction (AtmxTemp)
2 2-methylbutanal 1.7 2.6 2.5 2.8 NS NS NS
3 2-methylbutanal 2.0 2.1 1.7 2.2 NS NS NS
4 2-methylbutanal 3.1 4.8 3.5 4.5 0.006 NS 0.006
6 2-methylbutanal 4.2 6.6 3.0 2.9 0.008 NS 0.134
8 2-methylbutanal 6.1 10.0 5.1 8.5 < 0.0001 < 0.0001 0.007
10 2-methylbutanal 5.3 13.7 6.3 10.7 NS 0.000 NS
12 2-methylbutanal 4.5 12.9 3.8 9.2 NS 0.000 NS
NS=not significant (p>0.05). A=air, N=nitrogen, 2=2 ºC, 23=23 ºC.
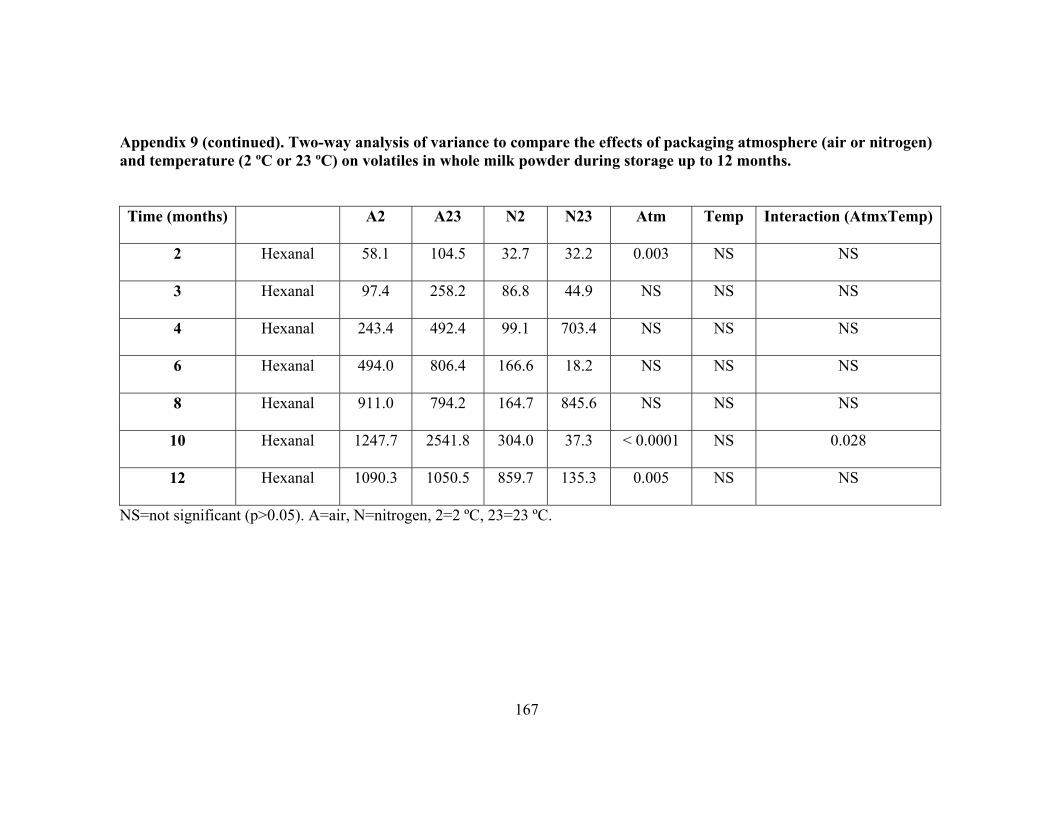
167
Appendix 9 (continued). Two-way analysis of variance to compare the effects of packaging atmosphere (air or nitrogen) and temperature (2 ºC or 23 ºC) on volatiles in whole milk powder during storage up to 12 months.
Time (months) A2 A23 N2 N23 Atm Temp Interaction (AtmxTemp)
2 Hexanal 58.1 104.5 32.7 32.2 0.003 NS NS
3 Hexanal 97.4 258.2 86.8 44.9 NS NS NS
4 Hexanal 243.4 492.4 99.1 703.4 NS NS NS
6 Hexanal 494.0 806.4 166.6 18.2 NS NS NS
8 Hexanal 911.0 794.2 164.7 845.6 NS NS NS
10 Hexanal 1247.7 2541.8 304.0 37.3 < 0.0001 NS 0.028
12 Hexanal 1090.3 1050.5 859.7 135.3 0.005 NS NS
NS=not significant (p>0.05). A=air, N=nitrogen, 2=2 ºC, 23=23 ºC.
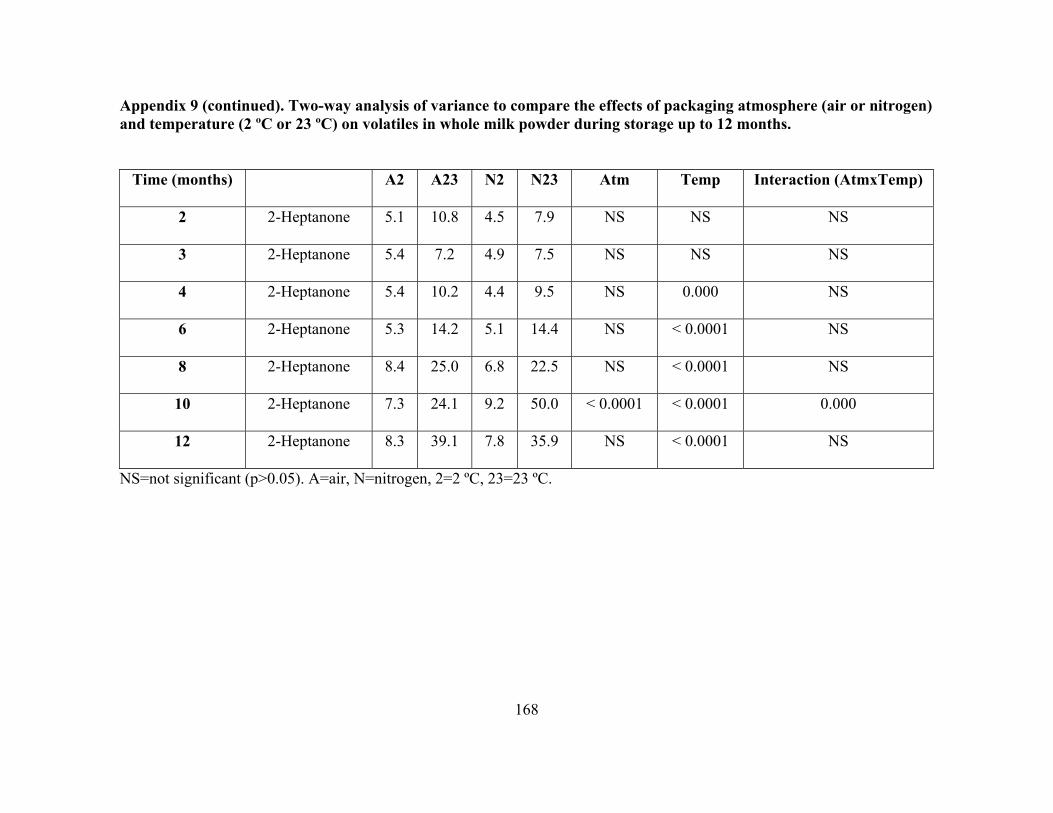
168
Appendix 9 (continued). Two-way analysis of variance to compare the effects of packaging atmosphere (air or nitrogen) and temperature (2 ºC or 23 ºC) on volatiles in whole milk powder during storage up to 12 months.
Time (months) A2 A23 N2 N23 Atm Temp Interaction (AtmxTemp)
2 2-Heptanone 5.1 10.8 4.5 7.9 NS NS NS
3 2-Heptanone 5.4 7.2 4.9 7.5 NS NS NS
4 2-Heptanone 5.4 10.2 4.4 9.5 NS 0.000 NS
6 2-Heptanone 5.3 14.2 5.1 14.4 NS < 0.0001 NS
8 2-Heptanone 8.4 25.0 6.8 22.5 NS < 0.0001 NS
10 2-Heptanone 7.3 24.1 9.2 50.0 < 0.0001 < 0.0001 0.000
12 2-Heptanone 8.3 39.1 7.8 35.9 NS < 0.0001 NS
NS=not significant (p>0.05). A=air, N=nitrogen, 2=2 ºC, 23=23 ºC.
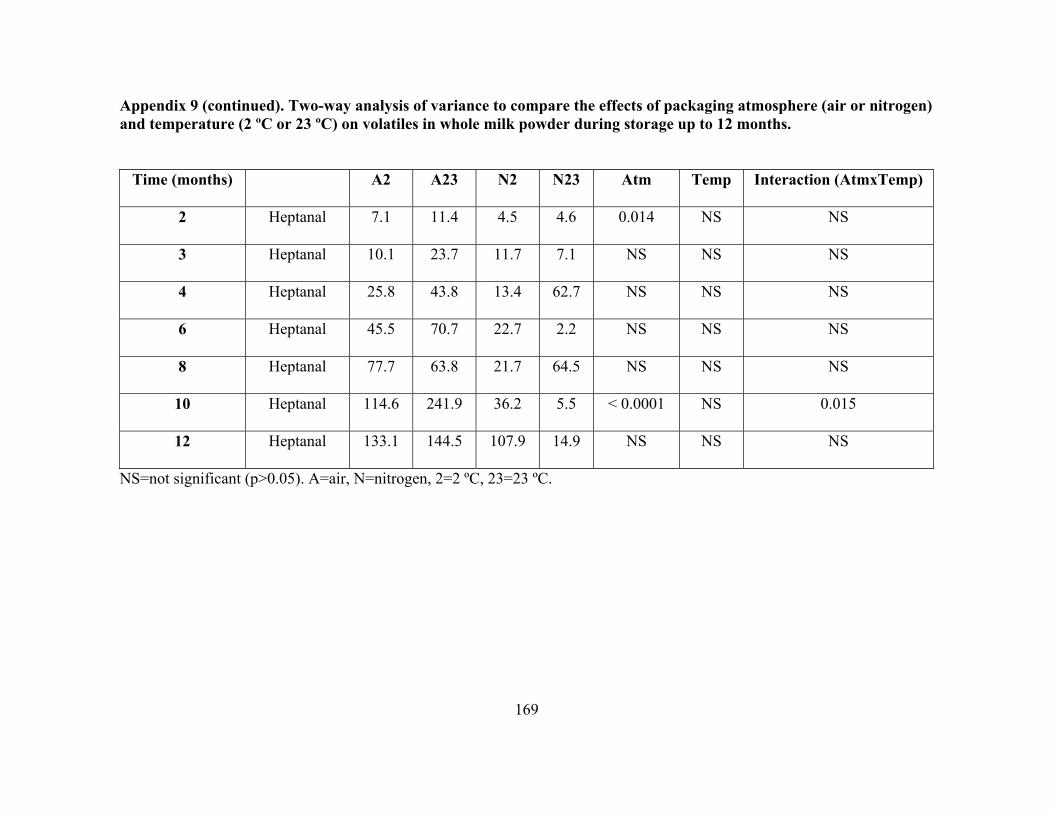
169
Appendix 9 (continued). Two-way analysis of variance to compare the effects of packaging atmosphere (air or nitrogen) and temperature (2 ºC or 23 ºC) on volatiles in whole milk powder during storage up to 12 months.
Time (months) A2 A23 N2 N23 Atm Temp Interaction (AtmxTemp)
2 Heptanal 7.1 11.4 4.5 4.6 0.014 NS NS
3 Heptanal 10.1 23.7 11.7 7.1 NS NS NS
4 Heptanal 25.8 43.8 13.4 62.7 NS NS NS
6 Heptanal 45.5 70.7 22.7 2.2 NS NS NS
8 Heptanal 77.7 63.8 21.7 64.5 NS NS NS
10 Heptanal 114.6 241.9 36.2 5.5 < 0.0001 NS 0.015
12 Heptanal 133.1 144.5 107.9 14.9 NS NS NS
NS=not significant (p>0.05). A=air, N=nitrogen, 2=2 ºC, 23=23 ºC.
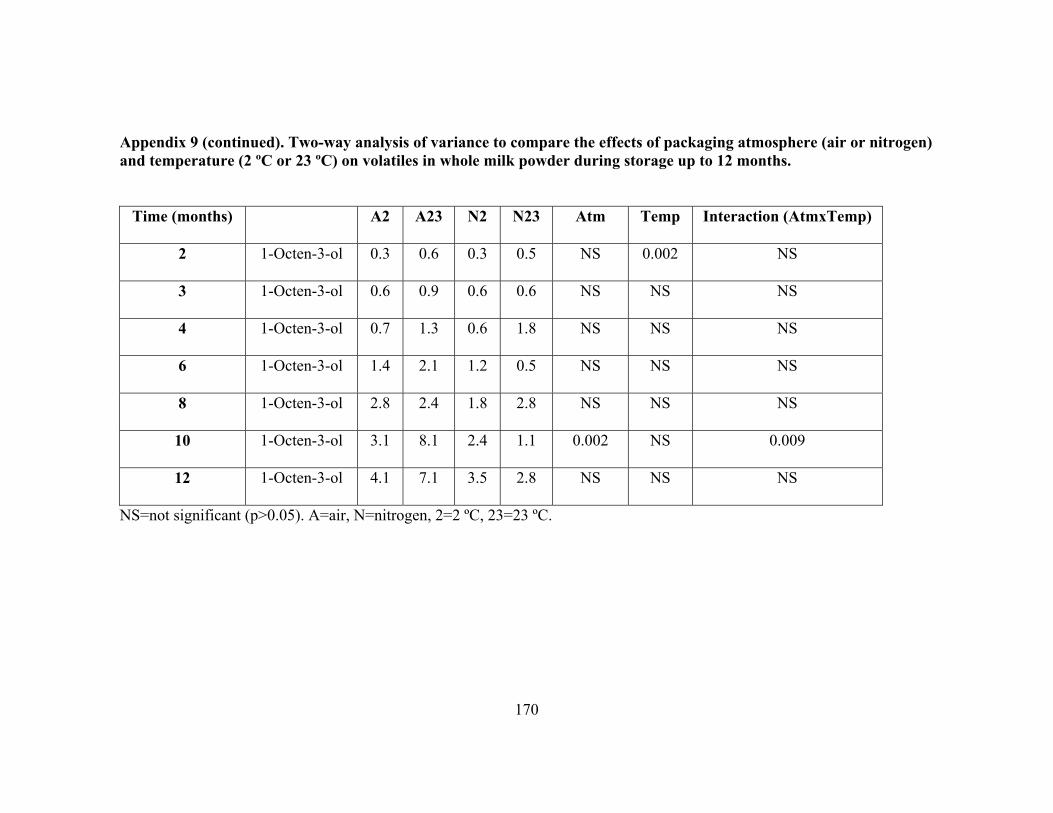
170
Appendix 9 (continued). Two-way analysis of variance to compare the effects of packaging atmosphere (air or nitrogen) and temperature (2 ºC or 23 ºC) on volatiles in whole milk powder during storage up to 12 months.
Time (months) A2 A23 N2 N23 Atm Temp Interaction (AtmxTemp)
2 1-Octen-3-ol 0.3 0.6 0.3 0.5 NS 0.002 NS
3 1-Octen-3-ol 0.6 0.9 0.6 0.6 NS NS NS
4 1-Octen-3-ol 0.7 1.3 0.6 1.8 NS NS NS
6 1-Octen-3-ol 1.4 2.1 1.2 0.5 NS NS NS
8 1-Octen-3-ol 2.8 2.4 1.8 2.8 NS NS NS
10 1-Octen-3-ol 3.1 8.1 2.4 1.1 0.002 NS 0.009
12 1-Octen-3-ol 4.1 7.1 3.5 2.8 NS NS NS
NS=not significant (p>0.05). A=air, N=nitrogen, 2=2 ºC, 23=23 ºC.

171
Appendix 9 (continued). Two-way analysis of variance to compare the effects of packaging atmosphere (air or nitrogen) and temperature (2 ºC or 23 ºC) on volatiles in whole milk powder during storage up to 12 months.
Time (months) A2 A23 N2 N23 Atm Temp Interaction (AtmxTemp)
2 Octanal 8.2 11.0 6.2 9.2 NS NS NS
3 Octanal 9.2 10.3 7.8 7.4 0.004 NS NS
4 Octanal 10.6 13.9 9.6 16.5 0.007 NS NS
6 Octanal 12.3 19.7 10.5 8.0 0.019 NS NS
8 Octanal 16.1 20.8 11.0 21.5 NS NS NS
10 Octanal 25.7 64.6 21.5 28.0 < 0.0001 < 0.0001 0.001
12 Octanal 29.0 47.0 23.2 16.4 NS NS NS
NS=not significant (p>0.05). A=air, N=nitrogen, 2=2 ºC, 23=23 ºC.
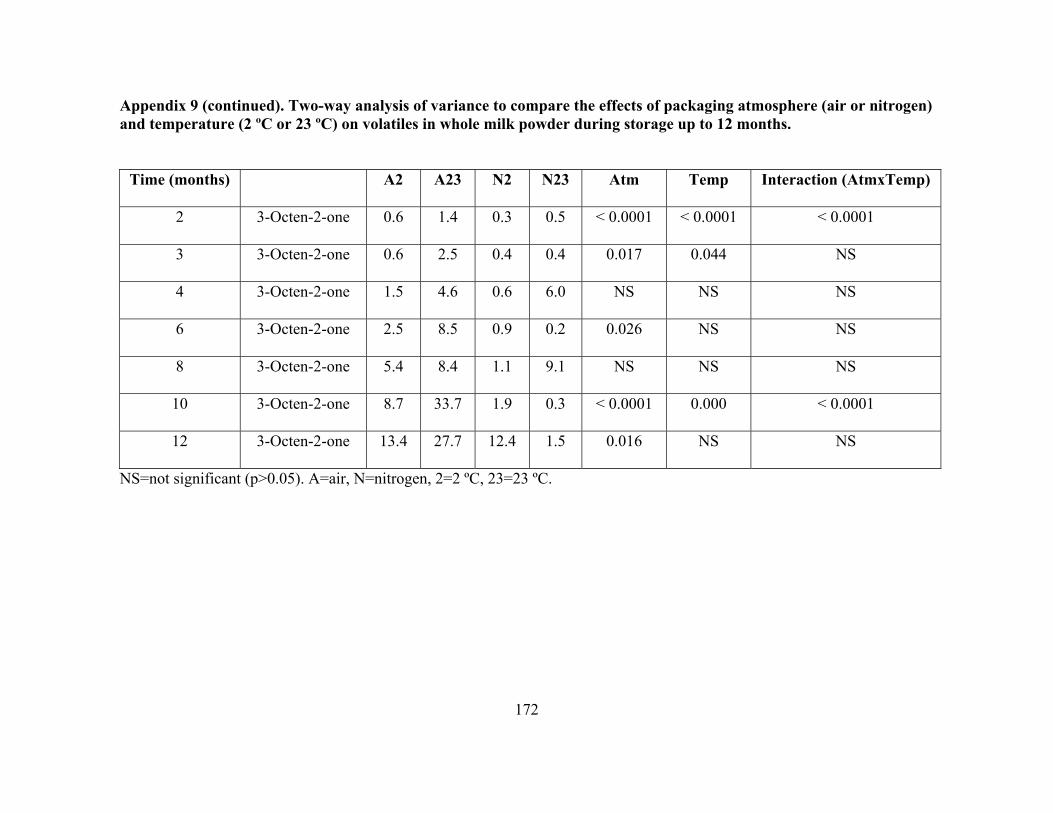
172
Appendix 9 (continued). Two-way analysis of variance to compare the effects of packaging atmosphere (air or nitrogen) and temperature (2 ºC or 23 ºC) on volatiles in whole milk powder during storage up to 12 months.
Time (months) A2 A23 N2 N23 Atm Temp Interaction (AtmxTemp)
2 3-Octen-2-one 0.6 1.4 0.3 0.5 < 0.0001 < 0.0001 < 0.0001
3 3-Octen-2-one 0.6 2.5 0.4 0.4 0.017 0.044 NS
4 3-Octen-2-one 1.5 4.6 0.6 6.0 NS NS NS
6 3-Octen-2-one 2.5 8.5 0.9 0.2 0.026 NS NS
8 3-Octen-2-one 5.4 8.4 1.1 9.1 NS NS NS
10 3-Octen-2-one 8.7 33.7 1.9 0.3 < 0.0001 0.000 < 0.0001
12 3-Octen-2-one 13.4 27.7 12.4 1.5 0.016 NS NS
NS=not significant (p>0.05). A=air, N=nitrogen, 2=2 ºC, 23=23 ºC.
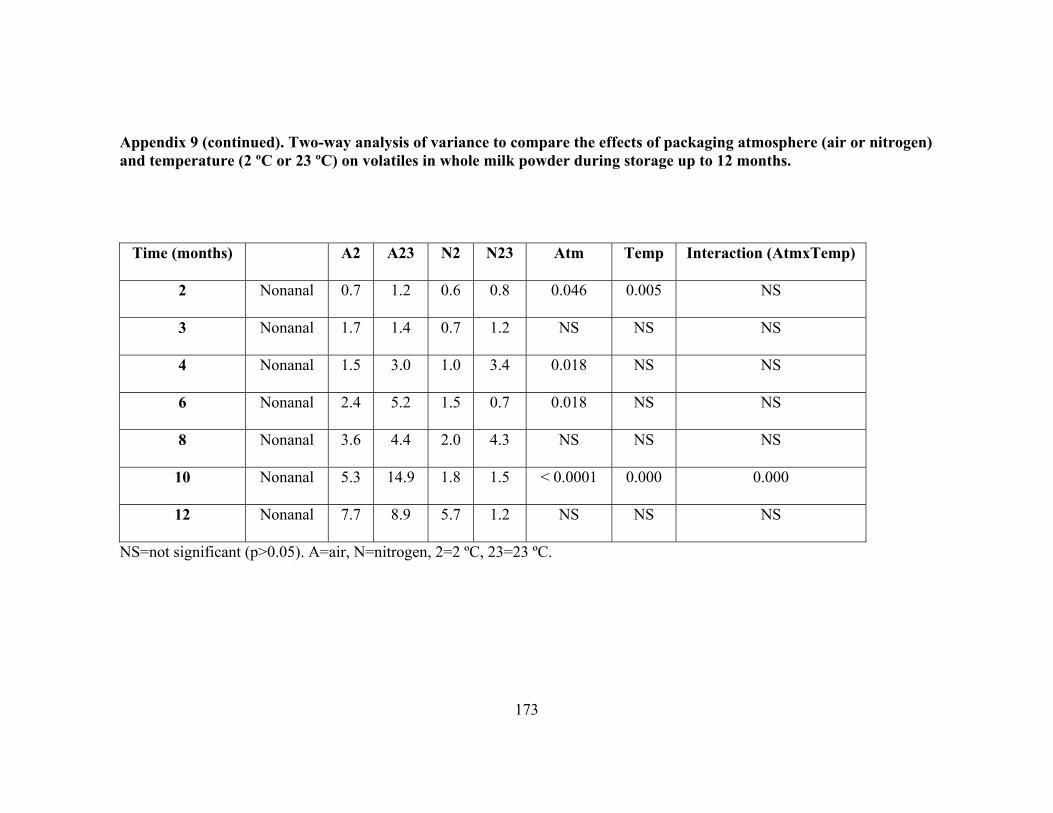
173
Appendix 9 (continued). Two-way analysis of variance to compare the effects of packaging atmosphere (air or nitrogen) and temperature (2 ºC or 23 ºC) on volatiles in whole milk powder during storage up to 12 months.
Time (months) A2 A23 N2 N23 Atm Temp Interaction (AtmxTemp)
2 Nonanal 0.7 1.2 0.6 0.8 0.046 0.005 NS
3 Nonanal 1.7 1.4 0.7 1.2 NS NS NS
4 Nonanal 1.5 3.0 1.0 3.4 0.018 NS NS
6 Nonanal 2.4 5.2 1.5 0.7 0.018 NS NS
8 Nonanal 3.6 4.4 2.0 4.3 NS NS NS
10 Nonanal 5.3 14.9 1.8 1.5 < 0.0001 0.000 0.000
12 Nonanal 7.7 8.9 5.7 1.2 NS NS NS
NS=not significant (p>0.05). A=air, N=nitrogen, 2=2 ºC, 23=23 ºC.
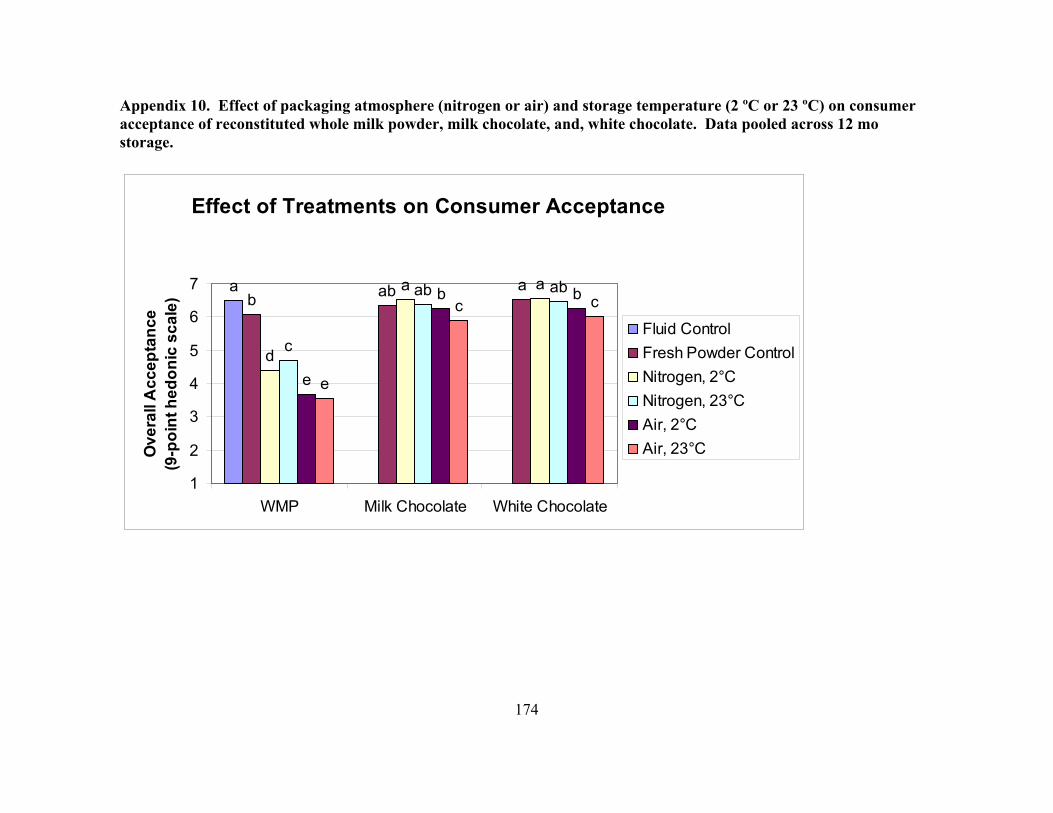
174
Appendix 10. Effect of packaging atmosphere (nitrogen or air) and storage temperature (2 ºC or 23 ºC) on consumer acceptance of reconstituted whole milk powder, milk chocolate, and, white chocolate. Data pooled across 12 mo storage.
Effect of Treatments on Consumer Acceptance
ab
ab a
d
a a
c
ab ab
e
b b
e
c c
1
2
3
4
5
6
7
WMP Milk Chocolate White Chocolate
Ove
rall
Acc
epta
nce
(9-p
oint
hed
onic
sca
le)
Fluid Control
Fresh Powder Control
Nitrogen, 2°C
Nitrogen, 23°C
Air, 2°C
Air, 23°C
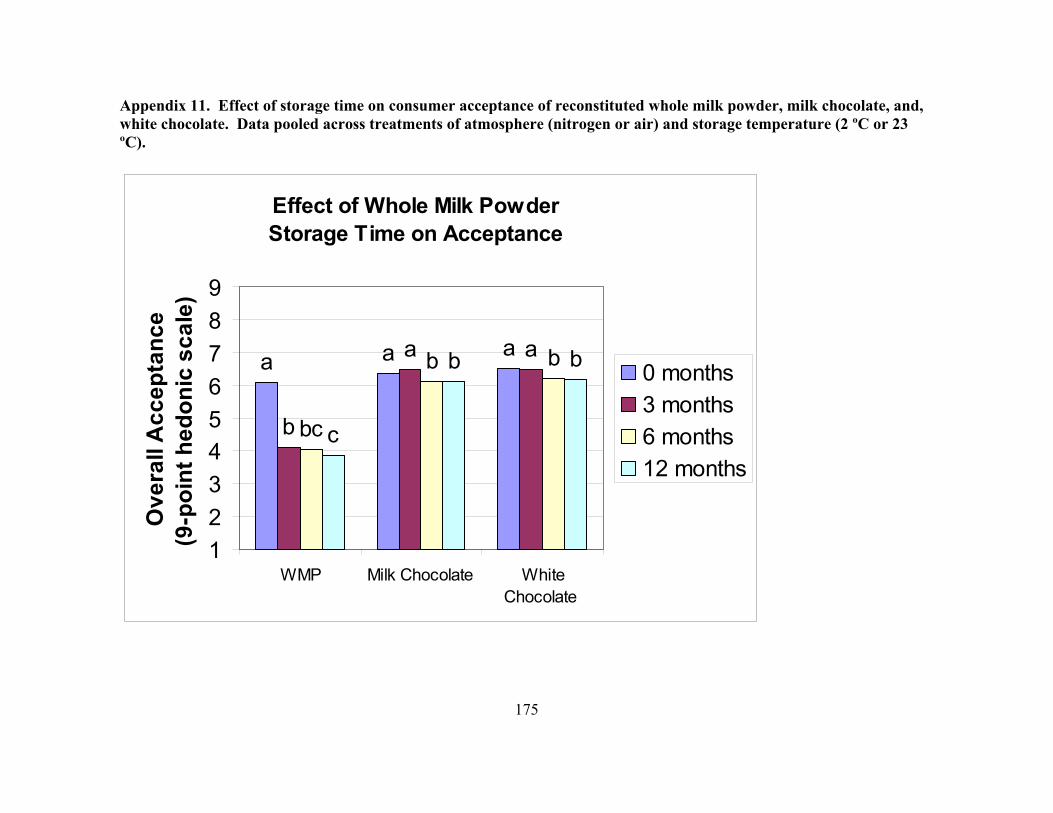
175
Appendix 11. Effect of storage time on consumer acceptance of reconstituted whole milk powder, milk chocolate, and, white chocolate. Data pooled across treatments of atmosphere (nitrogen or air) and storage temperature (2 ºC or 23 ºC).
Effect of Whole Milk Powder Storage Time on Acceptance
a a a
b
a a
bc
b b
c
b b
1
2
3
45
6
7
8
9
WMP Milk Chocolate WhiteChocolate
Ove
rall
Acc
epta
nce
(9-p
oint
hed
onic
sca
le)
0 months3 months6 months12 months
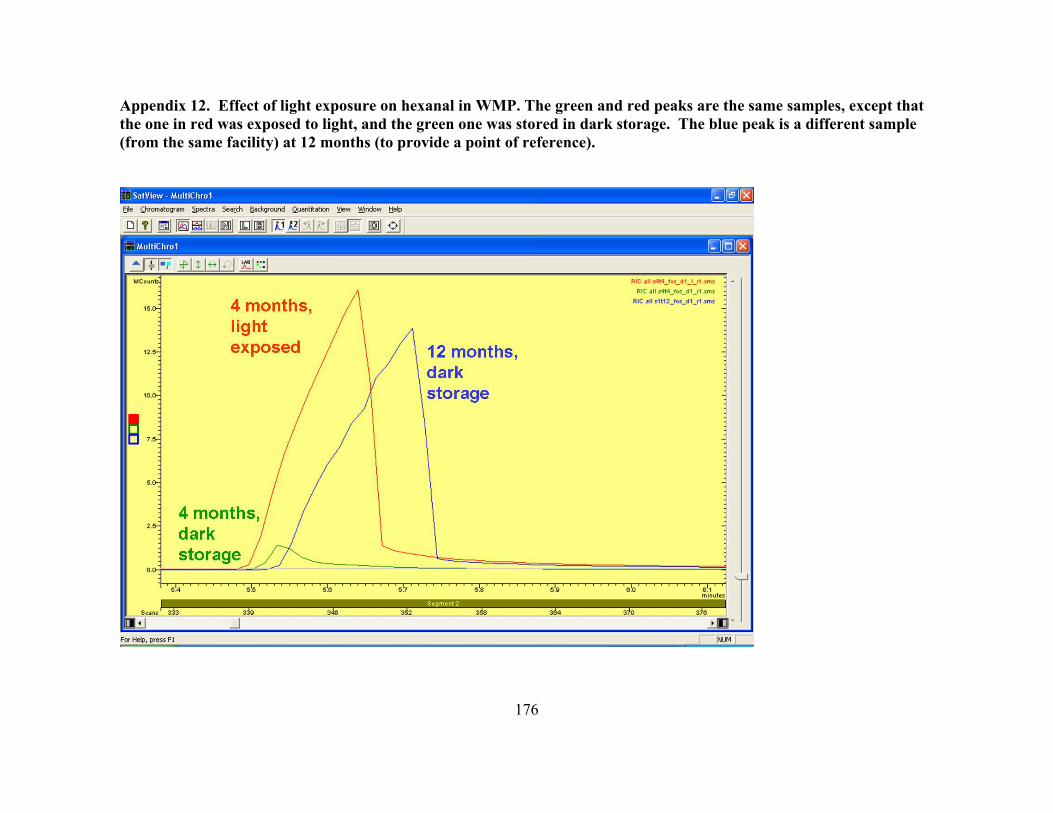
176
Appendix 12. Effect of light exposure on hexanal in WMP. The green and red peaks are the same samples, except that the one in red was exposed to light, and the green one was stored in dark storage. The blue peak is a different sample (from the same facility) at 12 months (to provide a point of reference).
177
REFERENCES
IDF. 1997. Standard 99C: Sensory evaluation of dairy products by scoring reference methodology. Brussels, Belgium: International Dairy Federation.