Embed Size (px)
Citation preview

Abstract
BEUCLER, JANINE LOUISE. Design of a thirst quenching beverage from wheypermeate. (Under the direction of Dr. MaryAnne Drake.)
Whey permeate (WP) is a by-product of whey protein production, and primarily
contains water, lactose, minerals, and minimal fat and protein. The majority of the WP
produced in the United States is disposed of via land-spreading or is used as a component
in animal feed, however, WP could be utilized in the growing beverage industry. The
objectives of this study were to conduct a category survey of thirst quenching beverages
and to design a thirst-quenching beverage utilizing WP. The descriptive sensory
properties (visual, flavor, and texture/mouthfeel) of commercial thirst quenching
beverages were determined using a trained descriptive panel (n=11). WP with and
without hydrolysis of lactose was subsequently incorporated into a basic beverage
formula, substituted for 0%, 25%, 50%, 75% or 100% of water. Consumers (n=110)
evaluated beverages with WP and commercial beverages for overall acceptability, flavor
liking, and thirst quenching ability. Drinks made with lower levels (25% or 50%) of
either hydrolyzed or unhydrolyzed WP were more similar to the commercial beverages in
visual and flavor properties than beverages containing higher percentages of WP. All
drinks made with WP were higher in electrolyte (Na, K, Zn, Mg, P) content compared to
a commercial thirst quenching beverage. Beverage incorporation represents a value-
added utilization for WP.


ii
Biography
Janine Beucler was born on April 15, 1980 in Worcester, Massachusetts to parents
Frederick and Patricia Beucler. Her family also includes her brother Erik and sister
Kathy, as well as Peter Fountain.
Janine graduated from Pfeiffer University in May 2002 with Bachelor of Science
degrees in both Athletic Training and Exercise Physiology. Janine began work on her
Masters of Science at North Carolina State University in Fall of 2002 in the Nutrition
program. She became a certified athletic trainer (ATC) during June, 2003.
iii
Acknowledgements
The author would like to express her gratitude for the support and encouragement
provided by her family, friends, laboratory colleagues, and major advisor.
The author is thankful to Jamie Parker, Mary Whetstine, Alissa Caudle, Nikki
Young, and Kristofer Friedeck for their aid in laboratory endeavors as well as their
friendship throughout this journey. Special thanks to the members of the sports drink
descriptive panel for their time and dedication to my research. Dr. MaryAnne Drake
deserves much gratitude for taking a chance on a nutrition student with no knowledge of
food science what so ever, and for holding her hand and teaching her much.
A particular thanks to the Department of Food Science faculty, staff and students
at NCSU who were friendly and welcoming, and who were always eager to participate in
more consumer panels than can be counted!
Most deserving of credit for the completion of this degree are the author’s family
and friends who have become like family. Their continued love and support was
instrumental in the completion of degree requirements. Lastly, thanks to Peter Fountain
for his love and support through a difficult, trying and rewarding two years.

iv
Table of Contents
List of Tables v List of Figures vii Introduction 1 Literature Review 4 Whey, Whey Production and Milk Permeate 4 History of Whey 7 Whey Types 7 Components of Whey 12 Whey Processing 19 Whey properties and applications 23 Health benefits of whey 28 Benefits of whey proteins in athletes 34 Sensory analysis and whey flavor 39 Functional foods 45 Types of sports and functional beverages 47 The beverage market 48 Beverage flavor 52 Summary 54 References 56 Manuscript Design of a Thirst-Quenching Beverage from Whey Permeate 63 Abstract 64 Introduction 65 Materials and Methods 67 Sample Acquisition 67 Proximate Analysis 67 Hydrolysis of WP 68 Beverage Formulation 69 Descriptive Sensory Analysis 69 Consumer Testing 70 Statistical Analysis 72 Results 72 Physical Measurements 72 Descriptive Sensory Analysis 73 Consumer Acceptance Analysis 74 Demographic Data 74 Consumer Acceptance 76 Discussion 78 Conclusions 83 Figures and Tables 85 References 97 Conclusions 101 Appendix 103
v
List of Tables
Literature Review Table 1. The sequence of events during gel formation of renneted cheese 5 Table 2. Types of whey 9 Table 3. Nutritional composition of selected whey products 11 Table 4. Typical composition of bovine milk and liquid whey 13 Table 5. Essential amino acid profile of key proteins 14 Table 6. PDCAAS values for various proteins 15 Table 7. Biological values for some common protein sources 15 Table 8. Concentration of milk proteins in whey 16 Table 9. Benefits of WPI in sports formulations 28 Table 10. Growth in beverage market from 2000 to 2001 49 Manuscript Table 1. Beverage Formulation 85 Table 2. Preparation of reference materials for descriptive sensory analysis of thirst-quenching beverages 86 Table 3. Mean values of descriptive attributes for commercial and WP beverages 87 Table 4. Correlations between descriptive sensory analysis attributes used to profile thirst-quenching beverages using Bonferoni Correction 88 Table 5. Demographic information regarding consumer perception of the healthfulness of sugars 89 Table 6. Mean values of consumer acceptance of commercial and WP beverages 90

vi
Table 7. Correlations between consumer acceptance of thirst- quenching beverage attributes 91 Table 8. Plain WP flavor screening before and after hydrolysis 92 Table 9. pH values for Commercial and WP beverages 93 Appendix Table 1. Commercial Beverages 113

vii
List of Figures
Literature Review Figure 1. Whey processing flow chart 21 Manuscript Figure 1. Lactose hydrolysis and glucose determination over time 93 Figure 2. Principal component bi-plot of descriptive analysis of thirst-quenching beverages (PC1&2) 94 Figure 3. Principal component bi-plot of descriptive analysis of thirst-quenching beverages (PC3&4) 95 Figure 4. Internal preference map of consumer perception of thirst-quenching beverages 96 Appendix Figure 1. Descriptive Scoring Ballot and References 105 Figure 2. Information provided to participants 109 Figure 3. Consumer Demographic Screener Form 110 Figure 4. Consumer Scoring Ballot 112
1
Introduction
Whey is the yellow-green, watery liquid that separates from the curd during the
cheese making process (Smithers et.al., 1996), and contains nearly half of all solids found
in whole milk (Chandan et al., 1982). These solids include proteins, fat, minerals, and
lactose. During the production of one pound of cheese, approximately nine pounds of
whey are produced (Anonymous, 2002). Certainly with so much whey produced per
pound of cheese, there must be a use for this valuable commodity. However, whey, at
one time, was viewed as nothing more than a waste product. Cheese processors disposed
of whey down drains until tightened environmental regulations made this process of
dumping illegal and expensive (Frank, 2001). Other disposal mechanisms included
discharge of whey into local waterways, into the ocean, into fields or as a component in
animal feed (Smithers et.al., 1996). Today, some whey is still used as animal feed,
primarily the lactose component (Frank, 2001), while some whey is also spread onto the
land in a process called landspreading. As landspreading restrictions tighten in the next
few years, cheesemakers will have to find alternative methods for disposing of or
utilizing whey (Casper et al., 1999). Despite the fact that whey was viewed as a waste
product in the past, the functional value of whey is beginning to be made known.
In 1996, worldwide production of whey was estimated at more than 80 billion
liters of whey each year (Smithers et.al., 1996). Another estimate of the worldwide
production of whey is 2.3 million tons of skim milk powder and 7 million tons of whey
solids (de Wit, 1998). As whey production continues to grow, whey solids must be made
fit for human consumption. Until the late 1900’s, the portion of milk that was of most
value to the economy was the milkfat component. Today, the most valuable component
in milk or whey is the protein (Hardham, 1998). Of this 7 million tons of whey solids,
worldwide production of whey is estimated at about 700,000 tons of true whey proteins

2
that can be used as food ingredients (de Wit, 1998). Whey can be separated into two parts
by ultrafiltration, the protein, fat and colloidal salt part called the retentate, and the
permeate part consisting of lactose, water and minerals (Patel and Mistry, 1997). Much
of the whey can not be used in its liquid form, and is instead spray-dried into whey
powder or further processed by ultrafiltration (Smithers et. al., 1996). Spray dried whey
powder can be made from permeate, retentate, or whole liquid whey. The functional uses
of spray dried whey protein in the food market are growing, especially in the arena of
nutritionally fortified foods and beverages (Frank, 2001; Chandan et al., 1982). Huffman
(1996) suggested that whey proteins may hold the key to innovative product
development, especially in the growing sports nutrition marketplace. One of the most
exciting prospects is the development of a clear, ready-to-drink high protein sports drink.
When concentrating whey proteins, the leftover liquid portion, which consists
primarily of water, lactose and minerals, is called whey permeate. Whey permeate has
limited uses, primarily because the lactose has low sweetness, low solubility and low
digestiblity by many people. However, hydrolysis of the lactose into glucose and
galactose enhances the sweetness of the permeate and any permeate products (Rexroat
and Bradley, 1986a; Rexroat and Bradley, 1986b). This increased sweetness may allow
for whey permeate to also be produced into a sports beverage similar to its whey protein
counterpart.
Sports drinks were first developed over thirty years ago for the purpose of
rehydration (Roberts Jr., 2002a). Gatorade, the first sports drink of its kind, was
developed by the University of Florida, and was named after the Florida Gators.
Gatorade was then made primarily with sugar, thought to be beneficial to athletes as a
source of fast energy. This type of sports drink delivers the wrong message because
sugar in the blood acts as a diuretic, depleting fluids, which can in turn actually impair
rather than improve performance (Allen and deWees, 1997). Gatorade, in 2001, was the
3
most popular sports drink in the US, accounting for more than 85% of all US sports drink
sales (Rodwan Jr., 2001).
Consumer trends are drifting towards still (non-carbonated) drinks, healthy
products that offer an innovative taste (Williams, 2001). Still drinks include isotonic
beverages, electrolyte beverages, bottled water, teas, sports drinks and other functional
beverages, and make up almost two-thirds of the soft drink market. The still drink
market grows at an annual rate of 7%, almost double that of carbonated beverages
(Williams, 2001). The growth in the market of functional beverages is attributed to an
increase in the consumption of sports drinks, energy drinks, nutrient enhanced juices,
teas, fitness waters and dairy-based beverages (Rodwan Jr., 2001). This last example of
dairy-based beverages is the category in which a whey-based or permeate-based drink
can infiltrate the US beverage market.

4
Literature Review
Whey, Whey Production and Milk Permeate
In order to describe whey, one must know where whey comes from. Since the
dawn of man, bovine milk has been consumed in one form or another, including milk and
cheese (de Wit, 1998). Milk, a white liquid produced in the mammary glands of all
mammals, has great nutritional value. Milk contains carbohydrates, proteins, vitamins,
minerals, and fat that are utilized by the body to maintain health. A few of the major
components of milk include lactose and casein and whey proteins which are essential for
cheese and whey production (Lawson, 1994).
Milk contains approximately 3.5% protein, 80% of which is casein and 20% are
whey proteins (Lawson, 1994). Casein is the protein component that results in the
production of cheese, while whey and whey proteins are simply byproducts of the
cheesemaking process (Frank, 2001). Gel formation during cheese production is a result
of protein destabilization, and may be brought about by one of two methods. The first is
via the addition of acid proteases, such as chymosin, following acidification with a starter
culture, and the second method is by direct acidification to a pH value close to the
isoelectric point of casein (Varnum and Sutherland, 1994). During cheesemaking, the pH
of milk (6.6- 6.7) is lowered through the use of lactic acid producing bacteria that ferment
the milk by producing lactic acid and lower the pH to around 5.3. The decrease in the pH
and the action of added acid proteases such as chymosin (rennet) cause the proteins to
coagulate (Anonymous, 2001).
Coagulation with chymosin involves two stages. First, chymosin breaks the bond
between the amino acids phenylalanine 105 and methionine 106 of the � -casein located
at the surface of the casein micelle in milk. This action splits the � -casein into two
portions, the section associated with the surface of the micelle known as para- � -casein,

5
and the released water-soluble part known as glycomacropeptide (GMP).
Glycomacropeptide is water soluble and will float off into the liquid portion and become
part of the whey. Once the � -casein has been cleaved, the casein micelle surface is no
longer hydrophilic, but hydrophobic, causing aggregation and formation of a gel network
(Singh et al., 2003). Aggregation results from intermicellar cross-linking via calcium
binding to serine-phosphate groups, and begins when approximately 86% of the total � -
casein has been hydrolyzed. This reaction is dependent on the presence of an acidic pH
and an increase in temperature (Varnam and Sutherland, 1994). An example of
coagulation with chymosin can be seen in the production of cheeses such as Cheddar
cheese (Singh et al., 2003).
The second method of casein coagulation is a result of either direct addition of
acid or by fermentation by lactic acid bacteria (LAB). Lactic acid production inhibits the
growth of harmful microorganisms while at the same time producing flavors and aromas
such as diacetyl, acetylaldehyde and acetoin (Lamboley et al., 1999). In cheeses such as
cottage cheese, the pH is lowered by direct addition of lactic acid to 4.5-4.8. When the
pH decreases to the pI of the casein, the casein micelles begin aggregating due to a net
charge of zero on the surface of the micelle and form a gel network known as the curd
Table 1: The sequence of events during gel formation in renneted cheese
%RCT 60 Micelles fully dispersed and non-
aggregated 100 Gradual aggregation of para-casein
micelles in aggregates of three or four
200 Aggregates fuse to form strands 300 Continuous three-dimensional
network formed by overlapping and crossing of strands
%RCT = percentage of visual rennet coagulation time. (Varnum & Sutherland, 1994)
6
(Drake, 2002) (Table 1).
The non-solid, or the yellow-green liquid that separates from the curd during
cheese formation is the whey (Anonymous, 2001; Smithers et al., 1996; Chandan et al.,
1982). Due to the acidic nature of whey proteins, they do not coagulate at cheesemaking
pH and are therefore not components of cheese but are instead lost in the waste stream
that is whey (Varnum and Sutherland, 1994). Whey contains almost 50% of all solids
present in whole milk (Chandan et al., 1982). During the production of one pound of
cheese, approximately nine pounds of whey is produced (Anonymous, 2001). Following
ultrafiltration, the liquid whey permeate accounts for approximately 90% of the whey
volume and contains approximatley 85% lactose, 9% ash and 4% non-protein nitrogenous
materials (Chandan et al., 1982).
Like whey permeate, milk permeate can be a by-product of the cheese-making
process which is produced by means of the ultrafiltration of milk. Milk can be
ultrafiltered to increase total solids and protein prior to cheesemaking. Ultrafiltration of
milk results in a protein concentrate or retentate, and a lactose-rich permeate. Milk
permeate consists of 5% total solids, 90% of which is lactose, and contains no caseins or
�-lactoglobulins (Al-Eid et al., 1999).
Switzerland is a major milk permeate producing country (Talabardon et al., 2000).
A deproteinated permeate is produced from the ultrafiltration of milk during the making
of specialty milk products. This permeate requires further processing and contains 5%
lactose, 1% salts and 0.1-0.8% lactic acid. It contains no N-compounds, and therefore is
not comparable with whey permeate which contains approximately 0.8% protein
(Talabardon et al., 2000). Milk permeate also contains minerals (Hardham, 1998) such as
calcium and potassium (Geilman et al., 1992).
For shelf-stable milk, milk with a lower protein content has the tendency to
develop gelation later than milk with a higher protein content. Therefore, milk permeate
7
produced from UF has been added to regular milk in order to reduce the protein content
and delay gelation (Hardham, 1998). Additionaly, milk permeates can be concentrated
and used as value-added fortifying ingredients in other foods including nutritional
beverages and infant formulas (DMI, 2000). Milk permeate also has the potential to be
processed into a beverage similar to sports drinks and can provide high concentrations of
minerals necessary for the maintenance of proper health (Geilman et al., 1992).
History of Whey
Whey, for years, had been viewed as nothing more than a waste product. Whey
was once taken back to the farms for disposal on land, as a component in animal feeds, or
was disposed of down drains and into waterways and oceans. Each year worldwide whey
production is estimated at over 80 billion liters (Smithers et al., 1996). Heightened
environmental awareness in the early 1990’s has pushed for a more economical and
environmentally safe way to dispose of the whey. Today, whey has numerous
applications both for the food industry as well as animal feed. Much of the whey
produced is spray-dried into whey powder (Smithers et al., 1996), whey protein
concentrates, and whey protein isolates (Huffman, 1996). These whey powders are used
as ingredients in numerous food products; one of the most commercially valuable product
lines being protein fortified products (de Wit, 1998; Frank, 2001).
Whey Types
Liquid whey can come in a variety of forms depending upon the source and
processing techniques. Whey can also be processed into a number of valuable products
as well as some that are considered waste products. Some of these whey types include
reduced lactose whey, demineralized whey, acid whey and sweet whey. Reduced-lactose
liquid whey is produced by adding the enzyme �-galactosidase which hydrolyzes the

8
lactose into glucose and galactose, resulting in a low-lactose whey. Although already
containing lower levels of lactose, liquid whey protein concentrate (WPC) - whey which
contains between 34% and 89% protein – is further processed by subsequently
ultrafiltering and spray drying the liquid whey to produce low-lactose WPC. Other
methods to remove or reduce lactose concentrations include filtration, dialysis, or
precipitation processes and usually result in a lactose content of less than 60% (Huffman,
1996). Demineralized whey is produced by drying preprocessed whey in order to remove
a portion of the mineral content. Demineralized whey must not have an ash content of
over 7%. Acid whey has a pH of 5.1 or lower and is produced during the manufacture of
cottage and ricotta cheeses. Acid whey may be used in salad dressings and snack foods.
Sweet whey has a pH of 5.5 or greater and is created during the manufacture of rennet-
coagulated cheeses such as Cheddar or Swiss (Anonymous, 2002). Below is a table
which indicates the types of whey and the defining characteristics of each type. It is
derived from the information and sources that follow the table.

9
Table 2: Types of whey
Type of Whey Defining Characteristic
Liquid Whey Produced during cheesemaking
Whey Powder Dried Whey
WPC
WPC34 34% protein
WPC50 50% protein
WPC80 80% protein
WPI 90% protein or greater
Reduced Lactose Whey Less than 60% lactose
Demineralized Whey Less than 7% ash
Acid Whey pH of 5.1 or less
Sweet Whey pH of 5.5 or higher
Whey Permeate Lactose and ash portion of UF
processed whey
(Chandan et al., 1982; Huffman, 1996; Pasin and Miller, 2000)
Liquid whey contains approximately 93% water and 0.6% protein (Huffman, 1996),
0.05% fat, 0.7% ash, and 4.9% lactose (Smithers et al., 1996). As mentioned previously,
liquid whey is generally spray dried into powder form which in turn eliminates the water
and concentrates the other components. Dried whey powder contains approximately 10%
ash, 1% fat, 76% lactose and 13% protein (Huffman, 1996). However, liquid whey can
be further processed to produce a number of different whey products prior to being spray
dried.
One such product is whey protein concentrate (WPC), produced by filtering out
components other than proteins from pasteurized liquid whey. There are a number of
different protein levels that are all WPC varieties (Anonymous, 2002). Production of
these products includes pasteurization of the whey followed by a clarification processes

10
to remove any cheese fines. Then the whey undergoes an ultrafiltration (UF) process
(Huffman, 1996). UF fractionates whey into a protein concentrate (retentate), and a
lactose product (permeate) (Chandan et al., 1982). The whey is then evaporated to
concentrate the solids before it is spray dried to a powder (Huffman, 1996). WPC having
35% protein is known as WPC35 and also contains 53% lactose, 4% fat and 8% ash. The
composition of WPC35 is comparable to that of non-fat dry milk. WPC50 contains 50-
53% protein, 35% lactose, 5% fat and 7% ash. WPC80 contains 80% protein, 7%
lactose, and fat and around 4-7% ash (Huffman, 1996; Pasin, 2000). Production of
WPC80 is essentially the same as that of WPC35 and 50, however, a diafiltration step is
added. This step follows ultrafiltration, and is used to further concentrate the whey
protein from 60% to 80%. Diafiltration adds water continuously to the retentate stream
from UF to wash out the lactose and minerals (Huffman, 1996).
Another whey product is whey protein isolate (WPI) which is produced in a
manner similar to that of WPC, however the protein content is much higher (Anonymous,
2002). WPI contains 90% or more protein, 1% fat, 1% lactose and 3% ash. WPI is
produced similarly to WPC, however, two additional steps are added. First, the whey
undergoes a microfiltration process that reduces the fat content and secondly, lactose
hydrolysis to remove lactose. Another method for WPI production is the use of an ion
exchange system that pretreats the whey prior to the UF process. In cation exchange, the
most prevalent commercial technology, liquid whey is brought to acid pH causing the
whey proteins to be positively charged. The positively charged whey is pumped into a
tank containing negatively charged resin beads. The whey proteins attach to the resin
beads while all the other components –fat, lactose, and minerals- flow through and are
removed. Once the resin is saturated with protein, the pH of the tank is made alkaline so
the proteins detach from the resin beads and a dilute stream of whey proteins results. The
protein stream is treated via the processes of ultrafiltration, diafiltration and finally spray
11
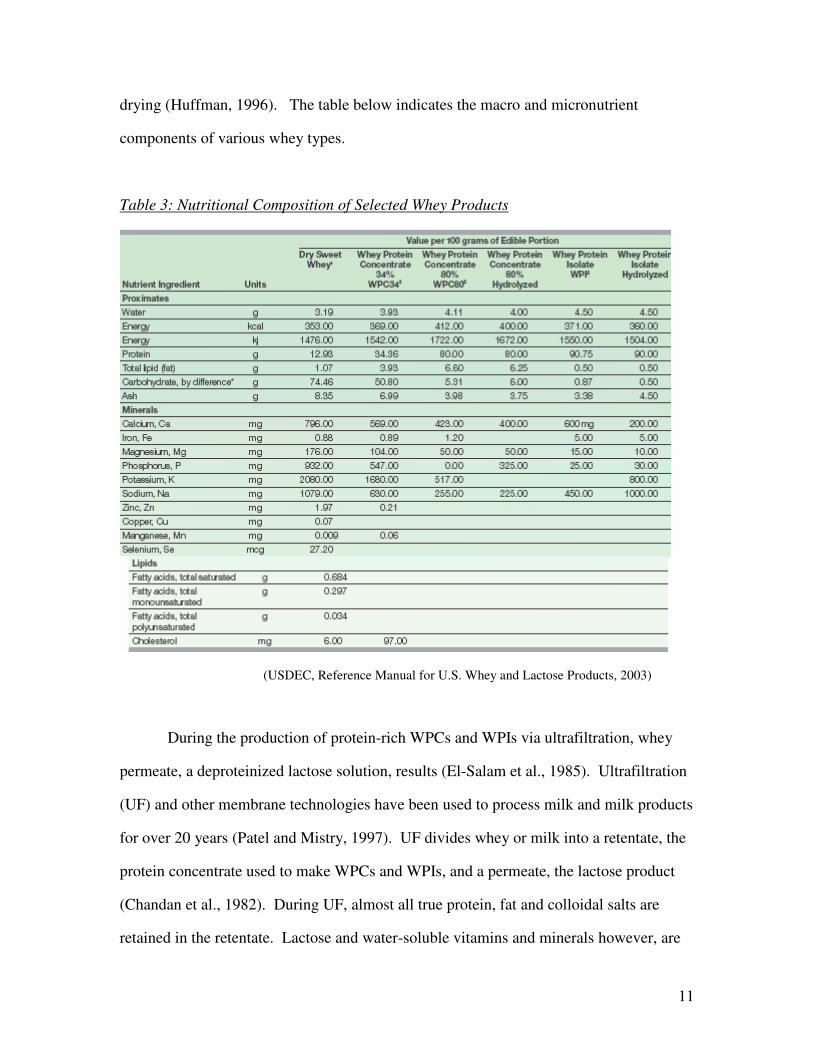
drying (Huffman, 1996). The table below indicates the macro and micronutrient
components of various whey types.
Table 3: Nutritional Composition of Selected Whey Products
(USDEC, Reference Manual for U.S. Whey and Lactose Products, 2003)
During the production of protein-rich WPCs and WPIs via ultrafiltration, whey
permeate, a deproteinized lactose solution, results (El-Salam et al., 1985). Ultrafiltration
(UF) and other membrane technologies have been used to process milk and milk products
for over 20 years (Patel and Mistry, 1997). UF divides whey or milk into a retentate, the
protein concentrate used to make WPCs and WPIs, and a permeate, the lactose product
(Chandan et al., 1982). During UF, almost all true protein, fat and colloidal salts are
retained in the retentate. Lactose and water-soluble vitamins and minerals however, are

12
fractioned between the retentate and the permeate. The extent of this division depends on
the initial composition and concentration of the components (Patel and Mistry, 1997).
Whey permeate consists primarily of lactose in a water solution with various
minerals and soluble nitrogen. (Fitzpatrick et al., 2001; Fitzpatrick and O’Keeffe 2001;
Geilman et al., 1992). Liquid whey permeate is comprised of lactose (4.8%) and
minerals (0.5%) (Macedo et al., 2002). The lactose component of spray dried whey
permeate accounts for 85% of the total solids content. The second largest component in
spray dried whey permeate is minerals, which comprise 6.35-8.6%. The mineral content
of the permeate is comprised of sodium, potassium as well as citrate in concentrations
similar to that of skim milk and also contains calcium, magnesium and inorganic
phospherous (El-Salam et al., 1985). However, the exact mineral content depends on the
temperature at which the permeate was produced (Hardham, 1998). For example,
permeates produced from UF at lower temperatures have soluble calcium and inorganic
phosphates levels which are higher than permeates produced from UF at higher
temperatures (40-50 �C) (Hardham, 1998). Permeates have a relatively high
concentration of salts and NPN (non-protein-nitrogen - protein derived from non-protein
sources), particularly if the permeate is from acid whey. This fact may account for the
fact that the addition of UF permeate from skim milk and sweet whey to milk can
increase the heat stability of milk, while acid whey permeate decreases the stability
(Hardham, 1998).
Components of Whey
Whey contains lactose, numerous and varied proteins, vitamins, minerals, and
fats. Whey proteins have an excellent metabolic efficiency rate, and therefore they have
a high biological value. Also, whey proteins contain the highest concentration of
branched chain amino acids (BCAAs) available from any natural food source (Pasin and
13
Miller, 2000). The two major whey proteins are �-lactoglobulin (�-lg) and α-lactalbumin
(α-la) (Dalgleish et al., 1997) which account for 70-80% of all whey protein (Smithers et
al., 1996). Minor protein constituents include glycomacropeptide (GMP), bovine serum
albumin (BSA), lactoferrin, immunoglobulins, phospholipoproteins, and a number of
bioactive factors and enzymes (Smithers et al., 1996; Frank, 2001).
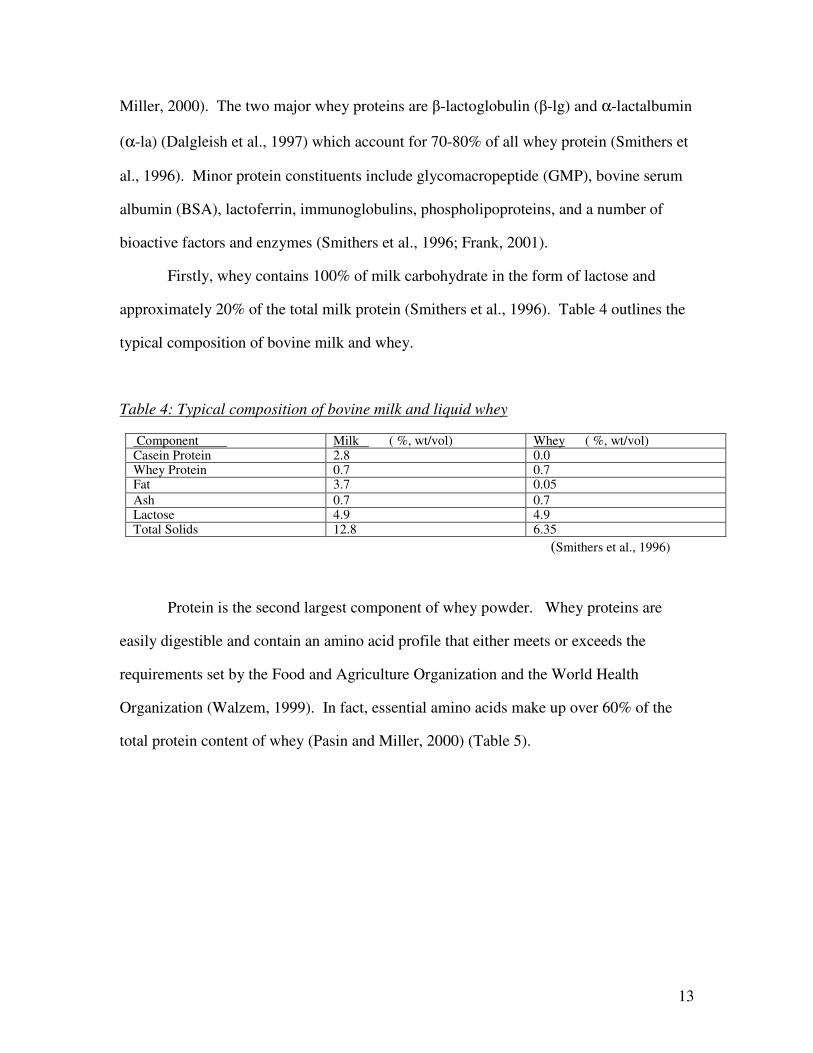
Firstly, whey contains 100% of milk carbohydrate in the form of lactose and
approximately 20% of the total milk protein (Smithers et al., 1996). Table 4 outlines the
typical composition of bovine milk and whey.
Table 4: Typical composition of bovine milk and liquid whey
Component Milk ( %, wt/vol) Whey ( %, wt/vol) Casein Protein 2.8 0.0 Whey Protein 0.7 0.7 Fat 3.7 0.05 Ash 0.7 0.7 Lactose 4.9 4.9 Total Solids 12.8 6.35
(Smithers et al., 1996)
Protein is the second largest component of whey powder. Whey proteins are
easily digestible and contain an amino acid profile that either meets or exceeds the
requirements set by the Food and Agriculture Organization and the World Health
Organization (Walzem, 1999). In fact, essential amino acids make up over 60% of the
total protein content of whey (Pasin and Miller, 2000) (Table 5).

14
Table 5: Essential Amino Acid Profile of Key Proteins (mg/g protein)
Amino Acid WPC 80 Soy Egg WheatLeucine 105 85 86 68 Lysine 93 63 70 27 Phenylalanine + Tyrosine
32 97 93 78
Methionine + Cysteine
21 24 57 39
Isoleucine 63 47 54 33 Valine 58 49 66 43 Threonine 69 38 47 29 Tryptophan 18 11 17 11 Histidine 17 0 22 0
(Pasin and Miller, 2000)
As mentioned previously, whey proteins contain all of the essential amino acids.
One method used to measure protein quality is the Protein Digestibility Corrected Amino
Acid Score (PDCAAS) which is endorsed by the USDA. Criteria for PDCAAS are
approximate nitrogen composition, essential amino acid profile, and true digestibility.
According to this method, an ideal protein that meets all of the essential amino acid
requirements of the human body has a value of 1.0 (Pasin and Miller, 2000). Whey
protein has a maximum score of 1.14 (Pasin and Miller, 2000), while whole egg and milk
casein also have scores of 1.0, soy protein carries a value of 0.99 and wheat gluten a
score of 0.25 as reported by the Whey Protein Institute (Frank, 2001). Other sources give
different but relatively similar numbers. The table below indicates the PDCAAS values
for some key protein sources (Table 6).

15
Table 6: PDCAAS Values for Various Proteins
PDCAAS of Key Proteins Protein Source PDCAAS
Whey Protein 1.14
Casein 1.00
Milk protein isolate 1.00
Soy protein isolate 1.00
Egg white powder 1.00
Ground beef 1.00
Canned lentils 0.52
Peanut meal 0.52
Wheat gluten 0.25 (Pasin and Miller, 2000)
Biological Value (BV) is another measure of protein quality. It also measures
protein bioavailability or absorption capability by the body. Whey protein scores the
highest possible value of 100, while casein scored 80 and wheat gluten 54 (Frank, 2001)
(Table 7). Soy protein, another valued source of nearly all the essential amino acids
which are necessary for human nutritional requirements of growth, maintenance and
physical stress (SPC, 1987), has a BV of 72.8 (FAOUN, 1970).
Table 7: Biological Values for Some Common Protein Sources
Whole egg 93.7
Milk 84.5
Fish 76.0
Beef 74.3
Soybeans 72.8
Rice, polished 64.0
Wheat, whole 64.0
Corn 60.0
Beans, dry 58.0
(FAOUN, 1970)

16
Whey protein can be fractionated by a process known as thermal fractionation
into two major fractions, the �-fraction which is highly concentrated in �-lactalbumin and
depleted in �-lactoglobulin, and the �-fraction which is predominantly �-lactoglobulin (�-
lg) while lacking � -lactalbumin. Combined, the two account for 70-80% total whey
protein (Table 8) (Smithers et al., 1996).
Table 8: Concentration of Milk Proteins
(USDEC, Reference Manual for U.S. Whey and Lactose Products, 2003)
The �-fraction of whey protein isolated from bovine cheese whey has excellent
amino acid and structure homology compared to human milk proteins. Therefore, the �-
fraction is widely used in infant formulas. �-lactalbumin comprises approximately 30%
of the total whey protein in milk (Smithers et al., 1996). � –Lactalbumin is the primary
protein found in breast milk, and is the only whey protein capable of binding calcium
which is in turn delivered to the offspring (Whey Protein Institute, 2001). This is very
important, allowing dairy foods to be essential sources of bioavailable calcium. � -
lactalbumin is the “B” protein in the lactose synthase enzyme complex which catalyzes
the final step in lactose production, and may be a key regulator of milk secretion
(Walzem, 2003). The �-fraction, making up 40-50% of all whey proteins, has heat-set
17
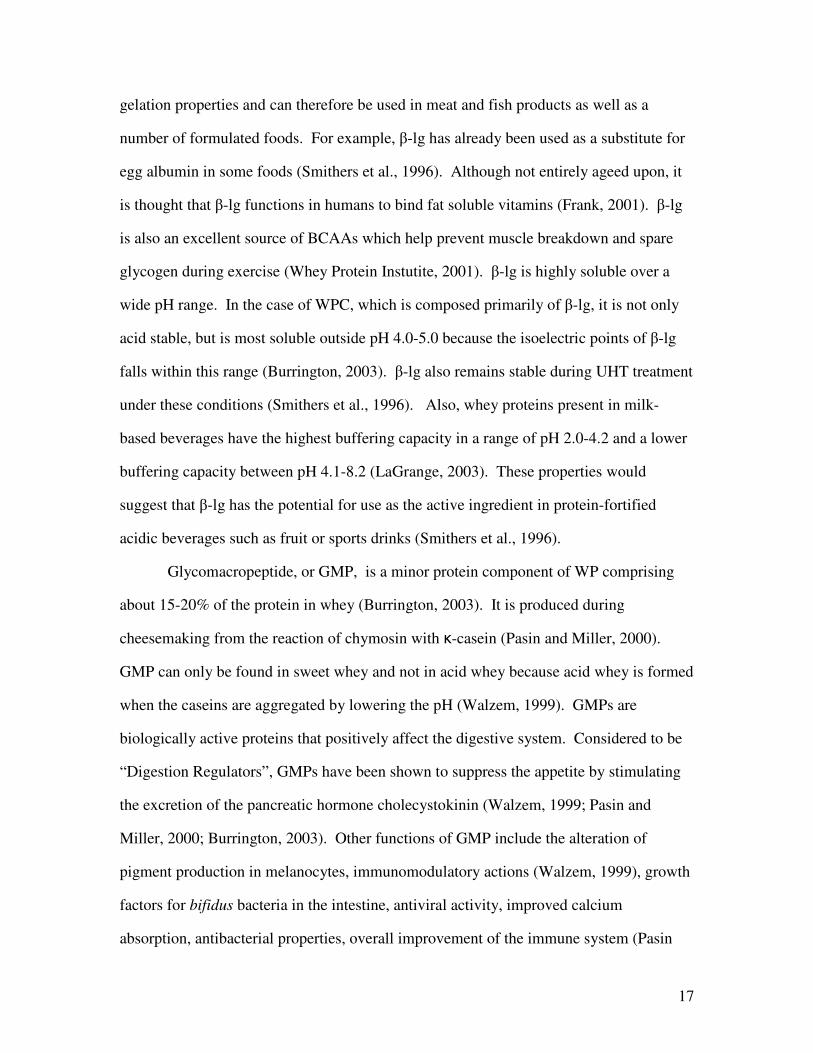
gelation properties and can therefore be used in meat and fish products as well as a
number of formulated foods. For example, �-lg has already been used as a substitute for
egg albumin in some foods (Smithers et al., 1996). Although not entirely ageed upon, it
is thought that �-lg functions in humans to bind fat soluble vitamins (Frank, 2001). �-lg
is also an excellent source of BCAAs which help prevent muscle breakdown and spare
glycogen during exercise (Whey Protein Instutite, 2001). �-lg is highly soluble over a
wide pH range. In the case of WPC, which is composed primarily of �-lg, it is not only
acid stable, but is most soluble outside pH 4.0-5.0 because the isoelectric points of �-lg
falls within this range (Burrington, 2003). �-lg also remains stable during UHT treatment
under these conditions (Smithers et al., 1996). Also, whey proteins present in milk-
based beverages have the highest buffering capacity in a range of pH 2.0-4.2 and a lower
buffering capacity between pH 4.1-8.2 (LaGrange, 2003). These properties would
suggest that �-lg has the potential for use as the active ingredient in protein-fortified
acidic beverages such as fruit or sports drinks (Smithers et al., 1996).
Glycomacropeptide, or GMP, is a minor protein component of WP comprising
about 15-20% of the protein in whey (Burrington, 2003). It is produced during
cheesemaking from the reaction of chymosin with �-casein (Pasin and Miller, 2000).
GMP can only be found in sweet whey and not in acid whey because acid whey is formed
when the caseins are aggregated by lowering the pH (Walzem, 1999). GMPs are
biologically active proteins that positively affect the digestive system. Considered to be
“Digestion Regulators”, GMPs have been shown to suppress the appetite by stimulating
the excretion of the pancreatic hormone cholecystokinin (Walzem, 1999; Pasin and
Miller, 2000; Burrington, 2003). Other functions of GMP include the alteration of
pigment production in melanocytes, immunomodulatory actions (Walzem, 1999), growth
factors for bifidus bacteria in the intestine, antiviral activity, improved calcium
absorption, antibacterial properties, overall improvement of the immune system (Pasin

18
and Miller, 2000), as well as inhibition of plaque formation and dental cavities (Whey
Protein Institute, 2001).
The three proteins discussed, �-lactalbumin, �-lactoglobulin and GMP make up
almost 100% of whey protein. The remaining constituents of whey are lactoferrin,
immunoglobulins, residual lipids, and bovine serum albumin (BSA) (Smithers et al.,
1996). Lactoferrin, a minor protein component, is a cationic protein with a pI of 9 and is
easily extracted by cation-exchange methods because the other proteins of whey have
pI’s in the acidic range. Lactoferrin shows both bacteriostatic and bacteriocidal
properties against a wide variety of microorganisms including those responsible for
gastrointestinal infections, food poisoning, listeriosis and mastitis (Smithers et al., 1996).
Lactoferrin also plays a role in the cellular defense system by regulating macrophage
activity and by stimulating the proliferation of lymphocytes (Pasin and Miller, 2000).
Working in conjunction with lactoferrin are immunoglobulins which function to help
boost the immune system. BSA is the smallest protein component, comprising a mere 5-
10% of total whey protein. BSA functions to bind fatty acids in the production of the
antioxidant glutathione (Frank, 2001; Whey Protein Institute, 2001). Immunoglobulins
comprise 10-15% of whey protein. They provide essential immune system enhancing
benefits to infants as well as adults. Immunoglobulins are also the main protein found in
colostrum (Whey Protein Institute, 2001).
Residual lipids, the final element, are an integral part of whey protein because as
the total whey protein content rises, so does the level of residual lipids (Vaghela and
Kilara, 1996). Typical lipids found in whey consist of sphingolipids and conjugated
linoleic acid (CLA) (National Dairy Council, 2003). It is very difficult to remove all
residual lipids from whey during processing, therefore all whey protein types have a lipid
component (Vaghela and Kilara, 1996). Total saturated fatty acids present in dry sweet
whey is 0.684g/100g whey, while the content of monounsaturated fatty acids is lower
19
(0.297g/100g), and the level of polyunsaturated fatty acids is even lower still
(0.034g/100g). Total cholesterol present in dry sweet whey is 6.0mg/100g. As
mentioned, protein increases will result in a higher lipid content. This can be seen in that
WPC34 contains a cholesterol level of 97mg/100g compared to the much lower value
associated with dry sweet whey (O’Donnell, 2003).
The mineral content of liquid whey is quite high (Table 3), however whey is a
good source of essential minerals. As the pH of milk drops during acid cheese
production, more of the salts dissociate, causing higher concentrations of soluble calcium,
magnesium, zinc and phosphorous in acid whey. Mineral content can be lowered by
electrodialysis or ultrafiltration (Walzem, 2003) or via cation exchange and washing
(Varnum and Sutherland, 1994).
Whey can be made from the milk of other animals such as buffalo, sheep and
goats which have specialty cheeses made from their milk and thus whey is produced from
the cheeses of these animals. Buffalo milk is much higher in calcium, fat and protein
than bovine milk (Patel and Mistry, 1997), while caprine whey has high levels of α-la
and ovine whey is high in �-lg content (Casper et al., 1999). However, bovine milk is by
far the crucial source of whey world-wide (Drake, 2002).
Whey Processing
Processing steps can alter the characteristics of whey products. These steps
include heating, pH, and chemical treatments which can result in the modification of
whey protein structure and functionality. Drying procedures may also cause further
modifications to the whey and of the whey protein characteristics (Hurley et al., 1990).
Prior to drying, liquid whey can be pre-treated using a combination of calcium
chloride and heat, which causes the proteins to gel and fat to be released, followed by
clarification that can result in a greatly reduced ratio of lipids to proteins (Vaghela and
20
Kilara, 1996). Other pre-treatment methods usually include pH adjustment of the whey,
modification of mineral content, thermocalcic aggregation of lipoprotein to remove
residual lipids and/or microfiltration prior to ultrafiltration (UF). The presence of
calcium and residual lipids in whey not only affect whey production functionality and
flavor stability, but also contribute to the fouling of UF membranes and can lead to higher
cleaning and operating costs (Martinez-Hermosilla et al., 2002).
When processing liquid whey, spray drying alone or in addition to ultrafiltration
results in the production of whey powder and WPC respectively, the oldest types of whey
products. Whey powder has a high mineral content, and therefore must be demineralized
before being used in applications such as infant formulas. Demineralized whey powder
also has advantages in general food use. Demineralization can be conducted via a variety
of methods. Cation exchange results in only a partial demineralization of the whey, and
requires further processing procedures such as washing to minimize the mineral content
prior to spray drying (Varnam & Sutherland, 1994). Other methods include
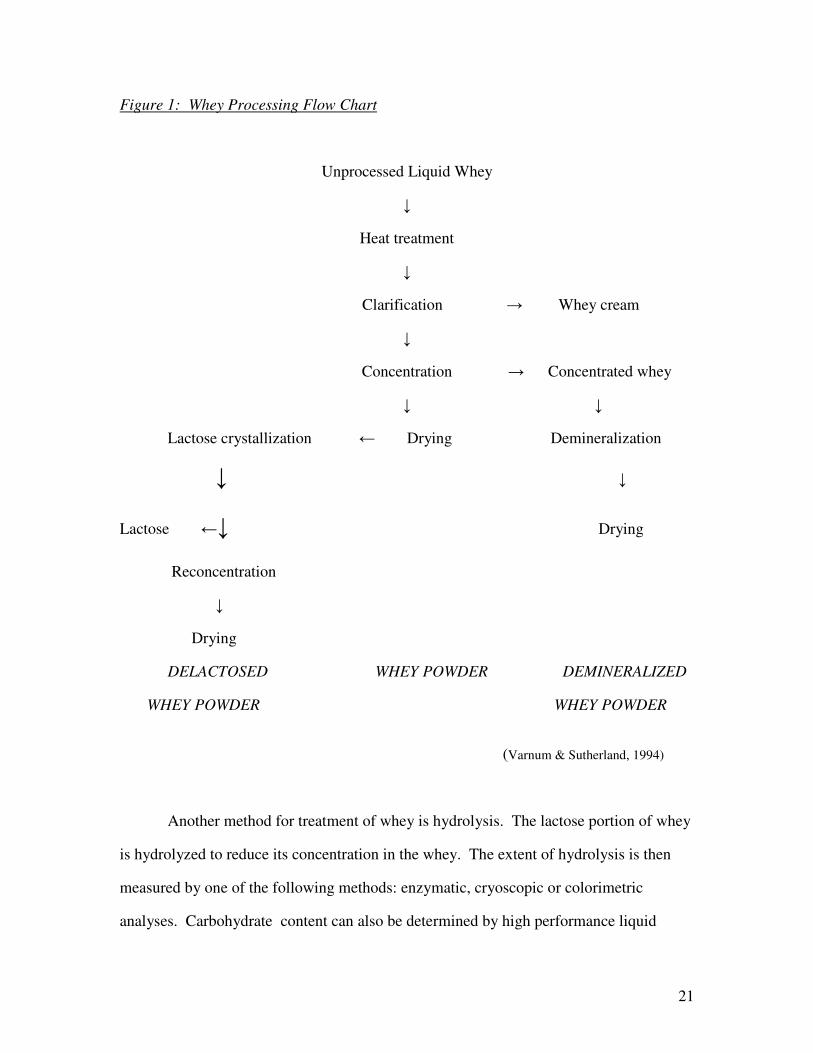
electrodialysis and ultrafiltration (Walzem, 2003). Below is a flow chart indicating the
process by which whey powders are produced (Figure 1).
21
Figure 1: Whey Processing Flow Chart
Unprocessed Liquid Whey
�
Heat treatment
�
Clarification � Whey cream
�
Concentration � Concentrated whey
� �
Lactose crystallization � Drying Demineralization
� �
Lactose �� Drying
Reconcentration
�
Drying
DELACTOSED WHEY POWDER DEMINERALIZED
WHEY POWDER WHEY POWDER
(Varnum & Sutherland, 1994)
Another method for treatment of whey is hydrolysis. The lactose portion of whey
is hydrolyzed to reduce its concentration in the whey. The extent of hydrolysis is then
measured by one of the following methods: enzymatic, cryoscopic or colorimetric
analyses. Carbohydrate content can also be determined by high performance liquid

22
chromatography (HPLC) because of its speed, versatility and specificity (Jeon et al.,
1984).
Heating and pH can greatly reduce the functionality of whey proteins. High
pressure, heat, and enzymatic hydrolysis can effectively alter the structure of proteins,
thereby changing their functionality. The proteins of whey hydrolysates are dependent
upon the type of enzyme used, the degree of hydrolysis, the environmental conditions and
the substrate pretreatment (Pe�a-Ramos and Xiong, 2001). When milk proteins are first
exposed to heat, protein aggregation begins with the initial swelling of the protein
structure. As the heat treatment increases, the whey proteins unfold and aggregate (Parris
et al., 1997). When β-lg and α-la are heated together, complexes are formed. Heat
denatured whey proteins bind to the micellar caseins found in milk predominantly via
disulfide bonds. The main reaction during heat treatment is between the β-lg and �-
caseins. β-lg contains two disulfide bridges and one free sulfhydryl group which are
important in the interactions with �-caseins. �-la contains four disulfide bridges which
may contribute to the reversible changes occuring in the protein upon denaturation when
in the presence of calcium (Dalgleish et al., 1997). Heating whey proteins to
temperatures above 70°C can cause a loss of solubility at lower pH values because some
of the proteins are denatured and therefore aggregated (Huffman, 1996; Ohr, 2001). Low
pH values result in aggregation because the isoelectric point of whey proteins is around
pH 4.5-5.3 (Huffman, 1996). Whey proteins that have not been denatured are highly
soluble over a wide pH range (Huffman, 1996; Ohr, 2001). Roig (1995) showed that
heating whey at 76°C for 1 minute in conjunction with pH modification to 5.6 decreased
protein solubility. He also determined that protein denaturation was greater with
retentate made from whey at pH 5.6.

23
Whey Properties and Applications
Whey is a useful source of protein, carbohydrates, vitamins, minerals and trace
elements and has a low fat content. It is possible to use whey, both sweet and acid, in
mixtures of yoghurt, milk and buttermilk without any detriment to the food quality
(Williams, 2001). Although milkfat was previously the most important economic
component of milk, the increased awareness in the nutritional value of whey proteins has
resulted in the protein becoming the most highly valued component (Hardham, 1998).
Whey proteins are extremely valuable in food production (Williams, 2001).
Whey protein has a number of functional properties that are useful in food
product development. Whey proteins are used as replacements for egg proteins in
confectionery and bakery products, as well as milk replacers in dairy products such as ice
cream (DeWit, 1998). The functional properties of proteins found in whey give it the
following characteristics: solubility over a wide pH range and acid stability (Lawson,
1994), ability to form and stabilize emulsions, water-binding capabilities, gel formation
properties, whipping and foaming, viscosity control, browning (Anonymous, 2002),
adhesion, and flowability (Huffman, 1996; Teunou and Fitzpatrick, 1999; Teunou and
Fitzpatrick, 2000).
Whey proteins are among of the few proteins that are soluble at low pH. This is
important in acidic beverages, salad dressings and cultured products such as yogurts
(Lawson, 1994; Anonymous, 2001). Whey proteins act as emulsifiers by forming
interfacial membranes around oil globules or water droplets in order to prevent creaming,
coalescence, and oiling off (Lawson, 1994; Huffman, 1996). Whey proteins have both
hydrophobic and hydrophilic regions which result in a lowering of the surface tension
and interaction at the emulsion interface (Huffman, 1996; Shepherd et al., 2000). After
adsorption at the fat/water interface, the protein partially unfolds in order to stabilize the

24
globules (Huffman, 1996). Controlled denaturation of the whey proteins can enhance
the emulsification properties (Shepherd et al., 2000). Whey proteins have been used in
emulsifications of sausages, soups, cakes (Anonymous, 2001), infant formulas (Ohr,
2001; Anonymous, 2001), salad dressings (Lawson, 1994; Anonymous, 2001), fruit
based drinks, sports beverages, and nutritional and meal replacement beverages (Ohr,
2001; Lawson, 1994). However, whey proteins have been found to be relatively
ineffective emulsifiers near their isoelectric points (Shepherd et al., 2000). The water-
binding capabilities of whey proteins function to trap water in meats, sausages, cakes and
breads. This property allows the product to retain its moisture and prevents drying and
retrogradation (Anonymous, 2001).
Gelation, a fourth property of whey, allows for the formation and setting of
protein gel matrixes in meats, baked goods and cheeses (Anonymous, 2001). Under
proper heating conditions, whey proteins form irreversible gels by restructuring the
proteins into three dimensional networks (Huffman, 1996; Ohr, 2001; Lawson, 1994).
Gelation involves an unfolding of proteins followed by aggregation, which results in gel
formation (Ohr, 2001). Gelation entraps water within the capillaries of the gel matrix
(Huffman, 1996), thus providing additional water holding capacity (Ohr, 2001). Whey
proteins begin to gel when heated to near 65 ºC (Ohr, 2001; Huffman, 1996). In aqueous
solutions, whey proteins begin to gel at concentrations of 7% protein (Huffman, 1996).
This gelation property is especially important in viscous foods such as beverages, soups,
sausages and custards (Ohr, 2001).
Whippability and foam stabilizing properties allow whey proteins to replace eggs
in cakes and meringues due to the heat set gelation and foaming characteristics of the
proteins (Lawson, 1994). Foaming creates a stable film for desserts and other whipped
toppings (Anonymous, 2002). The degree of stability depends upon the whey protein
type, protein denaturation levels, fat content, protein and carbohydrate concentrations,
25
concentration of calcium and other ions, pH, and the type of whipping method and
processing equipment used (Huffman, 1996).
The addition of whey to certain products helps to thicken them, thereby increasing
the viscosity which is important in the production of a wide variety of foods such as
soups, sauces and beverages. Whey proteins that are unheated are very low in viscosity,
even when used at high concentrations (Lawson, 1994). This low viscosity permits the
use of high protein concentrations, which in turn reduces the need to consume large
quantities in order to get the recommended daily allowance of protein. Heating of whey
proteins causes a slight increase in viscosity and water holding capacity but a decrease in
solubility. When heated, the proteins partially unfold thus exposing the water-binding
sites. This increases the volume occupied by the protein, consequently increasing the
viscosity. This viscosity can effect whey protein applications in certain food stuffs
(Huffman, 1996).
Maillard browning produces brown pigments when proteins and reducing sugars
react upon heating. Whey proteins react with lactose and other reducing sugars in the
Maillard browning reaction during baking or cooking of certain foods and produces
desirable browning in baked goods (Anonymous, 2001). Whey proteins provide good
adhesion properties for improving the homogenous texture of a food product (Huffman,
1996). The proteins also help to adhere bread crumbs or batters to meat or fish, adhering
meat and fish to each other, or fixing glazes to the surface of baked goods (Lawson,
1994).
In addition to protein applications, the characteristics of whey and whey powder
also allow it to be used in a variety of applications because of a number of inherent
properties. For example, problems may arise when whey powders or powders of any
type are exposed to high humidity and temperatures. One of these problems is poor
powder flowability which is important in operations such as storage in silos,
26
transportation, formulation and mixing, compression and packaging (Teunou and
Fitzpatrick, 1999). When a powder is exposed to a compressive force over time, the
powder gains strength and develops flow problems. The degree of flowability depends
on the physical properties of the powder and external conditions such as temperature and
pressure. Flowability is measured using the Standard Shear Test Technique (SSTT).
Whey permeate powder has a low moisture content and a large particle size. There is
limited cohesion between the particles of this powder and therefore it is more free-
flowing than flour or tea powders (Teunou and Fitzpatrick, 2000).
Liquid whey has been used for the production of ethanol, lactic and citric acids,
biomass protein, and food yeast. The addition of polysaccharide-producing lactic acid
bacteria to liquid whey may provide polymers that could be used as food stabilizers
(Gassem et al., 1997). Whey permeates can be made into a concentrated, deionized,
hydrolyzed whey permeate syrup. This syrup has the potential for use as a sweetener in
frozen desserts, candies, jams and jellies, baked goods, fountain syrups, canned fruits,
soft drinks and as a honey substitute (Rexroat and Bradley, 1986a.). These syrups have
been used as a substitute for sucrose in canned peaches and pears and can be used in
concentrations up to 50% (Chandan et al., 1982). Permeate is also used for producing
lactose, alcohol, single-cell protein, yeast, galactose, glucose, cattle feed and various
pharmaceuticals (DMI, 2002). In addition, permeates could be concentrated and used as
value-added fortifying ingredients in other foods such as nutritional beverages and infant
formulas (DMI, 2000). Milk permeate also has the potential to be processed into a
beverage similar to sports drinks that can be used to replace minerals lost during exercise
because the composition of permeate is similar to that of electrolyte beverages. A
permeate-based sports drink can provide high concentrations of minerals such as calcium
and potassium, which may be important in maintaining proper health (Geilman et al.,
1992).
27
A shelf-stable electrolyte beverage was made from milk permeate (Geilman et al.,
1992). Permeate was obtained from the UF of whole milk, and the lactose was
hydrolyzed using a commercial lactase enzyme. Sucrose and fructose were added to
increase sweetness, citric acid was added to lower the pH, and sodium-benzoate was
added as a preservative. Lemon, lemon-lime, and orange flavors, each used separately,
were also incorporated. The product was made shelf-stable via four separate procedures:
1) UHT followed by aseptic filling, 2) heating of filled bottles to 85°C for 30 min., 3)
addition of 0.05% benzoate, and 4) nanopore filtration. Chemical and microbial analysis
were conducted to ensure quality, and sensory analysis was performed via a panel of
three judges who evaluated sweetness, flavoring source and strength, and the effect of
heat treatment on the beverage. Consumer analysis (n=45) was also conducted to
determine intensity of sweetness, saltiness and flavor of the completed beverage using a
nine-point hedonic scale. Statistical analysis revealed that there were no significant
differences between flavors, and that the beverages were considered slightly salty, not
sweet enough and lacking fruit flavor. Geilman et al. (1992) suggested that dilution of
permeate may be required to reduce the mineral content of permeate which was believed
to be responsible for the salty flavors.
During recent decades, the utilization of bovine milk proteins in specialty food
products such as infant formulas, dietetics and health foods has increased (deWit, 1998).
The emphasis is now on whey protein drinks (Williams, 2001). In the current market,
whey protein, the primary whey product, is being used mostly in protein formulations
such as instant shakes and other sports beverages. Whey proteins may hold the key to
innovative product development, especially in the field of sports nutrition. WPI is stable
and does not precipitate when heated even at a low pH. Therefore, it works well in an
acidic system such as a fruit flavored beverage. The lack of fat allows beverages to retain
their clarity which makes it more aesthetically appealing. Also, WPI is flavorless, which
28
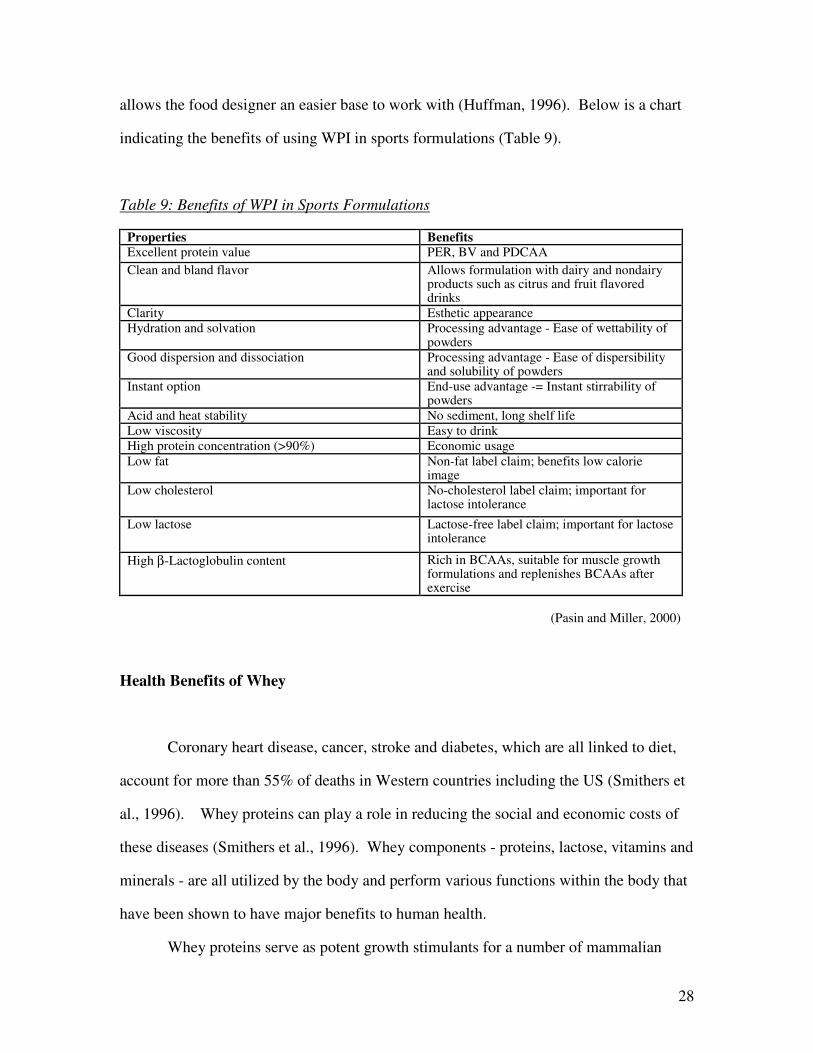
allows the food designer an easier base to work with (Huffman, 1996). Below is a chart
indicating the benefits of using WPI in sports formulations (Table 9).
Table 9: Benefits of WPI in Sports Formulations
Properties Benefits Excellent protein value PER, BV and PDCAA Clean and bland flavor Allows formulation with dairy and nondairy
products such as citrus and fruit flavored drinks
Clarity Esthetic appearance Hydration and solvation Processing advantage - Ease of wettability of
powders Good dispersion and dissociation Processing advantage - Ease of dispersibility
and solubility of powders Instant option End-use advantage -= Instant stirrability of
powders Acid and heat stability No sediment, long shelf life Low viscosity Easy to drink High protein concentration (>90%) Economic usage Low fat Non-fat label claim; benefits low calorie
image Low cholesterol No-cholesterol label claim; important for
lactose intolerance
Low lactose
Lactose-free label claim; important for lactose intolerance
High β-Lactoglobulin content Rich in BCAAs, suitable for muscle growth formulations and replenishes BCAAs after exercise
(Pasin and Miller, 2000)
Health Benefits of Whey
Coronary heart disease, cancer, stroke and diabetes, which are all linked to diet,
account for more than 55% of deaths in Western countries including the US (Smithers et
al., 1996). Whey proteins can play a role in reducing the social and economic costs of
these diseases (Smithers et al., 1996). Whey components - proteins, lactose, vitamins and
minerals - are all utilized by the body and perform various functions within the body that
have been shown to have major benefits to human health.
Whey proteins serve as potent growth stimulants for a number of mammalian
29
cells in culture, and have been shown to have a dramatic impact by promoting DNA and
protein synthesis and by inhibiting degradation of protein (Smithers et al., 1996). These
growth stimulators, which have been isolated from whey proteins, include IGF-I, IGF-II,
platelet-derived growth factor, acidic and basic fibroblast growth factors and
transforming growth factor-�. These growth factors promote the growth and
development of platelets and both acid and basic fibroblasts (Smithers et al., 1996), and
IGF-I has the ability to mimic insulin thereby increasing protein synthesis and in turn
increasing the rate of muscle growth (Burke, 2003). Growth factors from whey serve as
an inexpensive and reliable replacements or supplements for fetal bovine serum. These
growth factors could potentially have a large impact on the biotechnological and
pharmaceutical industries (Smithers et al., 1996).
Whey proteins are also a good source of sulfur-containing amino acids which are
proven to maintain antioxidant levels in the body (Pasin and Miller, 2000). Whey
proteins improve the host's antioxidant defenses as well as lower the oxidant burden
(Walzem, 1999). The ability of the proteins to inhibit harmful changes caused by lipid
oxidation seems to be related to amino acid residues in the proteins. Such amino acids
include tyrosine, methionine, histidine, lysine and tryptophan which are capable of
chelating pro-oxidative metal ions. Antioxidant activity is also affected by the amino
acid composition, sequence and configuration (Pe�a-Ramos and Xiong, 2001).
Whey contains a number of valuable minerals as well. These minerals help to
enhance the functionality of whey proteins. These include monovalent sodium,
potassium and chloride ions, magnesium, citrate and phosphate (Anonymous, 2001).
Whey is an excellent source of bioavailable calcium which functions to reduce the
incidence of stress fractures during exercise and prevents bone loss in both
hypoestrogenic female athletes as well as post-menopausal women (Pasin and Miller,
2000), and can enhance bone growth due to the presence of fibroblast growth factors

30
(Walzem, 1999).
Whey also has valuable antibacterial properties. Immunocompetent cells of
humans have receptors for milk proteins and peptides. Whey proteins contain high levels
of cysteine, which is thought to be a rate-limiting amino acid in glutathione (GSH)
synthesis. GSH is a natural antioxidant found within the body (Burke, 2003). This GSH-
modulating factor of whey is believed to underlie both immuno-enhancing and some
antioxidant actions of whey proteins (Walzem, 1999). GSH is a substrate, not an
enzyme, that removes hydrogen peroxide and is involved in the reduction of lipid hydro-
peroxides (Manore and Thompson, 2000). Lactoferrin has antioxidant, antibacterial,
immune system enhancement, and anti-cancer effects. It may also be an
immunomodulator and is the major non-specific disease resistance factor found in the
mammary gland. Once lactoferrin has given up its iron for absorption, it can bind free
iron in the digestive tract which inhibits the growth of enteropathogenic bacteria and
promotes desirable microflora in the intestinal tract (Walzem, 1999). Lactoferricin, a
peptide cleaved from lactoferrin by pepsin, exhibits in vitro antibacterial effects against
both bacteria and yeast. This is also linked to iron-binding activity. Lactoferricin
exhibits an antimicrobial activity that originates from a direct interaction with the surface
of the bacteria thereby protecting the intestinal tract against pathogens. Whey also
contains lactoperoxidase, an enzyme that breaks down hydrogen peroxide. This
component of whey has neutraceutical properties and is also antibacterial in nature
(Walzem, 1999).
Whey contains neutrophils which play a key role in resistance to infection within
the mammary gland of dairy cattle. Neutrophils adhere to endothelial cells in order to
exit the vascular system at sites of infection. After leaving the vascular system,
neutrophils migrate through tissue to arrive at the site of infection where they ingest
opsonized particles and then generate free radicals of oxygen for the oxidative killing

31
mechanisms of the neutrophil. The bactericidal activity of the neutrophils is dependent
upon the release of lysosome contents into the phagosome due to phagosome-lysosome
fusion. Neutrophils are even capable of killing antibody-coated target cells, and bovine
neutrophils are capable of killing foreign cells in the absence of antibodies (Roth et al.,
2001). Neutrophil release within humans is activated by injury, trauma, burn or
hemorrhage. These activated neutrophils can adhere to the walls of endothelial cells as
well as blood vessel walls, or migrate to tissues located along the chemotaxic gradient
and release cytotoxic mediators such as proteases, hydrolases, and reactive oxygen
species which target invading bacteria and other infectious organisms as well as injured
host tissue. Neutrophils stimulate the immune response and help to prevent infection
(Junger et al., 1998).
Glycomacropeptide (GMP), previously discussed, is a powerful stimulator of
CCK (cholecystokinin) which is an appetite-suppressing hormone that plays many
essential roles relating to gastrointestinal function including the regulation of food intake.
Consuming large amounts of protein leads to increased release of CCK until pancreatic
protease release matches protein intake. CCK stimulates gall bladder contraction and
bowel motility, regulates gastric emptying and stimulates the release of enzymes from the
pancreas (Walzem, 1999). Therefore, the presence of GMP and consequently CCK,
decreases the feeling of hunger and can result in decreased consumption of food and
possibly weight loss. GMP also helps to control the formation of dental plaque and can
therefore lower the incidence of dental caries (Whey Protein Institute, 2001).
Probiotics are live microbial food supplements that beneficially affect the human
host by improving the intestinal microbial balance. The most common probiotics utilized
in dairy products are lactobacilli and bifidobacteria. Health benefits as a result of
consumption of probiotics include increased resistance to infectious diseases, particularly
of the intestine; decreased duration of diarrhea; reduction in blood pressure; reduction in

32
serum cholesterol; reduction in allergy; stimulation of phagocytosis by peripheral blood
leukocytes; modulation of cytokine gene expression; adjuvant effects; regression of
tumors; and reduction in carcinogen or cocarcinogen production (Walzem, 1999). Lactic
acid bacteria (lactobacilli) produce exopolysaccharides (EPS), which have anti-ulcer
effects, help modulate the immune response, and improve the status of intestinal
adhesions (Macedo et al., 2002).
In order for one’s intestinal microflora to remain healthy, there must be an ample
source of food and energy for these probiotic microorganisms. These food sources are
deemed prebiotics and they trigger the multiplication of beneficial bacteria present in the
intestine. By far the most common type of prebiotic is dietary fiber, specificically inulin.
Inulin is an undigestible fiber that arrives in the intestine intact and is a source of food for
probiotics (Ahmed, 1999). Ingestion of oligosaccharides produced from lactose present
in whey also encourage the proliferation of Bifidobacterium bifidum in the intestine.
Bifidobacteria inhibits the growth of harmful pathogenic microorganisms such as
Escherichia coli, Salmonella typhi and Staphylococcus aureus. Oligosaccharides are
indigestible and have physiological effects similar to dietary fiber. Oligosaccharides are
also reported to possess anti-cancer properties as well as the ability to lower blood serum
cholesterol, blood pressure and blood sugar levels (Rustom et al., 1998).
Whey components have been shown to be strong anticarcinogens. Humans who
consume milk are less likely to develop colon and rectal cancer than those who do not
consume milk (Walzem, 1999). Calcium and vitamin D in milk were also identified as
protective against colorectal cancer (Walzem, 1999). Whey proteins contain bioactive
peptides that have been shown to decrease cell proliferation which may be linked to the
reduced incidence of colon cancer (Walzem, 1999). In a study with rats, those fed whey
proteins showed the lowest incidence of colon cancer (30%) compared with those fed
meat proteins (55%) or soy proteins (60%). The rats fed whey proteins displayed a

33
reduction in the total number of tumors and those tumors that did develop were smaller
on average than those fed the other proteins (Smithers et al., 1996).
In a study of cancer patients, among patients with breast, liver or pancreatic
cancer, ingestion of 30 grams of WPC each day for six days resulted in a stabilization of
GSH lymphocyte levels (high GSH levels in the lymphocyte are associated with high
GSH tumor levels) as well as tumor regression. It is believed that WPC reduces GSH
tumor levels, thus making them more vulnerable to chemotherapy (Walzem, 1999). A
study in Taiwan has suggested that WPI can stimulate the production of glutathione in
healthy cells, and inhibits the production of glutathione in cancerous cells (Walzem,
1999). An antioxidant, glutathione produced in normal cells protects them from toxicity
while at the same time reducing the glutathione levels in cancer cells. Cancer cells
reportedly produce high levels of glutathione which protects them from toxic substances
and promotes resistance to anticancer drugs (Frank, 2001). The reduction of the
glutathione levels in the cancerous cells would make them more susceptible to anticancer
drugs (Walzem, 1999). WPC has been used by the medical community to treat HIV
patients. HIV has an antagonistic relationship to GSH. Low cellular GSH levels allow
HIV-containing cells to multiply, while high cellular GSH levels dramatically slow viral
replication. Patients show a reduction in virus activity and increased survival rate and
life expectancy after ingestion of WPC (Walzem, 1999).
Hydrolyzed whey proteins contain high levels of bioactive peptides which may
reduce hypertension and dyslipidemia, both risk factors associated with cardiovascular
disease (Frank, 2001). The absence of calcium, potassium and magnesium from the diet
due to a low intake of dairy products, fruits and vegetables may be a better indicator of
hypertension than high sodium intake. Dietary Approaches to Stop Hypertension
(DASH) found that the blood pressure of individuals who consumed less than the
recommended levels of dairy products decreased when the recommended amounts were

34
introduced into their diets (Walzem, 1999).
Benefits of Whey Proteins in Athletes
Proteins are macromolecules composed of one or more polypeptide chains, each
with a characteristic sequence of amino acids linked by peptide bonds (Ohr, 2001).
Whey proteins have exceptional nutritional value. They are an excellent source of amino
acids and are also easily digestible. In addition, whey proteins contain high levels of the
branched chain amino acids leucine, isoleucine and valine (Huffman, 1996). Egg protein
also contains all essential amino acids including the BCAAs (Canadian Egg Marketing
Agency, 2002), as does soy protein with the exception of methionine and cysteine, the
sulfur containing amino acids (SPC, 1987). Complete proteins such as whey are very
important because they contain all of the amino acids required by humans to help build
and repair tissue, create antibodies, hormones and enzymes, and provide energy
(Anonymous, 2001).
Cysteine, methionine, lysine, leucine and glutamine are key amino acids that play
vital roles in sports performance and health. The amino acids cysteine and methionine
are thought to stabilize DNA during cell division (Pasin and Miller, 2000), while arginine
and lysine amino acids help to stimulate growth hormone release, thus resulting in muscle
growth and increased muscle mass as well as a decrease in percent body fat. Whey
proteins offer natural alternatives to anabolic-androgenous steroids. Glutamine helps to
replenish muscle glycogen after exercise and also prevents decline in immune function
caused by overtraining (Pasin and Miller, 2000).
The ideal sports protein should have a good balance of essential and nonessential
amino acids, an abundant supply of BCAAs, and should be low in fat and cholesterol
(Pasin and Miller, 2000). Any trained athlete can tell you that the branch chain amino
acids (BCAAs) in whey proteins can replenish the body and muscles after a workout.
35
Proteins have always been an integral part of an athlete's diet (Anonymous, 2002).
Proteins are essential for rebuilding muscle and for providing reserve energy.
Insufficient protein intake can jeopardize the ability to repair muscles following exercise-
induced damage, and recovery can be incomplete. Whey protein is one of the best
sources of BCAAs, which are the only amino acids that can be oxidized directly by the
muscle, thereby providing immediate energy (Anonymous, 2002). The structure of the
amino acids leucine, isoleucine, and valine allow them to be easily utilized (Anonymous,
2002).
The main source of energy during exercise is carbohydrates in the form of
glycogen. As the duration of the exercise increases, carbohydrates are replaced by lipids
as the major energy source (Pasin and Miller, 2000). During prolonged exercise, protein
synthesis is decreased and proteins are mobilized into free amino acids which can be used
as a source of energy. The oxidation of amino acids, especially BCAAs can provide 10-
15% of the total energy required during exercise (Pasin and Miller, 2000) and whey
proteins are one of the best known sources of BCAAs (WPI, 2001). Skeletal muscles take
up BCAAs from the blood and convert them into glucose which is in turn used for
energy. Whey proteins that contain a high level of BCAAs (26% and higher) are taken
up directly by the muscle rather than first being metabolized by the liver. Unlike
BCAAs, whole proteins must first be broken down into free amino acids before they can
be absorbed by the muscles and other bodily cells (Pasin and Miller, 2000). During
extensive exercise, BCAAs are oxidized by skeletal muscle and the carbon part is used as
fuel while the nitrogen part is used to make alanine, an amino acid. Alanine is then
transported to the liver where it is transformed via the Glucose-Alanine Cycle into
glucose which is in turn used for energy (Pasin and Miller, 2000). A number of studies
show that leucine turnover increases up to 20% during aerobic exercise (Pasin and Miller,
2000). Additional studies in support of increased consumption of proteins by athletes

36
show that excretion of 3-methyl histidine and excretion of urea nitrogen increase during
exercise while there is a decrease in protein synthesis (Pasin and Miller, 2000).
BCAAs are thought to decrease muscle protein degradation during exercise, thus
allowing athletes to train more intensively for longer periods of time. Glutamine, a
conditionally essential amino acid found in whey helps to prevent fatigue and
overtraining and is a fuel for dividing cells (Pasin and Miller, 2000). Glutamine is
deemed a conditionally essential amino acid because requirements change when synthesis
within the body is limited or when the intake of glutamine precursers is inadequate. In
other words, glutamine can only be synthesized within the body given the proper intake
of amino acids and other essential nutrients. With improper intake, glutamine can not be
synthesized and therefore it must be consumed in the diet (Manore and Thompson, 2000).
Glutamine comprises about 60% of the amino acid pool in skeletal muscle and it is
believed that a shortage in muscle glutamine would result in reduced muscle growth and
increased muscle breakdown. Glutamine is also important in binding ammonia, a
molecule produced by muscles during exhaustive conditions (Pasin and Miller, 2000).
Evidence shows that BCAAs may help to aid in athlete recovery after strenuous
exercise. BCAAs may also function to delay fatigue during prolonged aerobic activity by
delaying central fatigue. The central fatigue hypothesis suggests that increased
concentrations of brain Seratonin 5-HT can impair central nervous system function
during prolonged exercise, thereby impairing performance (Pasin and Miller, 2000;
Manore and Thompson, 2000). Increased levels of Seratonin 5-HT can occur due to an
increase in the levels of the amino acid precurser tryptophan. Free tryptophan is carried
across the blood barrier by BCAAs; thus Seratonin 5-HT levels increase as the ratio of
free tryptophan to BCAAs in the blood plasma increases. By increasing the amount of
BCAAs in the blood, this ratio would be greatly decreased, fatigue would be delayed, and
performance enhanced (Pasin and Miller, 2000). It has also been suggested that

37
carbohydrate supplementation may also decrease the ratio of free tryptophan to BCAAs
and in turn delay fatigue (Manore and Thompson, 2000)
The iron status of athletes is very important, because if the loss of iron exceeds the
intake of iron or the body’s ability to recycle iron, the athlete is at risk for developing
iron-deficiency anemia (Manore and Thompson, 2000). Most sports rely on the aerobic
pathway which requires oxygen to produce ATP. The transportation and diffusibility of
the oxygen molecules are limiting factors in aerobic performance A shortage of iron can
impair aerobic performance. Those who take iron supplements by direct injection in
order to boost oxygenation risk having hemosiderosis, an iron related disease. Iron is
used in cell metabolism as well as oxygen transport, and is the acceptor at the center of a
hemoglobin molecule (Pasin and Miller, 2000).
Lactoferrin is a minor protein component of whey, comprising only 1-2% of all
whey protein. It is a precursor for the iron binding protein transferrin which is
responsible for regulating iron absorption and regulating the bioavailability of iron as
well (Whey Protein Institute, 2001). Lactoferrin in whey and whey beverages also acts as
an iron supplement to boost blood oxygenation without any side effects (Pasin and
Miller, 2000). Transferrin also acts as an antioxidant by binding iron and preventing it
from participating in free radical formation. Free radicals have been identified as the
cause of muscle injuries in athletes, resulting in decreased performance (Pasin and Miller,
2000; Brink, 2000).
Lactoferrin is not only found in cow and human milk, but in all secretions of the
human body including tears, mucous, saliva, hepatic bile, and pancreatic fluids. Since
lactoferrin is an essential factor in immune response, it is especially concentrated in oral
cavities where it will come in contact with pathogens (Brink, 2000). It is also beneficial
in the treatment of septic shock. A study involving mice showed that feeding lactoferrin
to mice exposed to an endotoxin dramatically reduced fatality from the endotoxin while

38
at the same time improving the immune response. A second study using pigs injected
with the endotoxin and fed high levels of lactoferrin found that only 17% of pigs died
compared to 74% of the pigs that died without lactoferrin (Brink, 2000). Two human
studies found that immune response to lactoferrin was specific to the individual, meaning
that the effect of the lactoferrin on the immune response of the individual is dependent
upon their initial immune system status (Brink, 2000).
The US Recommended Daily Allowance (RDA) for protein is 0.8 grams per
kilogram of body weight (Food and Nutrition Board, 1989). This is an adequate intake
for those leading a sedentary lifestyle. However, exercise can double the requirement for
protein due to the fact that protein turnover is elevated post-training. Reports have also
shown that the rate of protein synthesis increases with oral consumption of amino acids
following exercise (Burke et al., 2001). The American Dietetic Association (ADA)
reports that those who are physically active should consume 1.5g of protein per kg of
body weight per day. Intake of such high levels will help to keep the body in nitrogen
balance (Pasin and Miller, 2000). Intakes of up to 2.0g per kg of body weight per day
may be required for those athletes who engage in endurance or power exercises in order
to remain in a positive balance. As athletes train, and their lean body mass increases, the
demand for additional protein is greater and therefore more protein must be consumed
(Pasin and Miller, 2000; Manore and Thompson, 2000).
However, no protein is 100% utilized, and the loss when consuming high quality
protein is approximately 30%, and 60% when lower quality proteins are consumed. As
the ingestion of additional proteins can cause increased metabolic stress to the organs, it
is very important to consume proteins with the best biological value possible. Whey
proteins have a BV of 1.14, higher than any other protein (Pasin and Miller, 2000). Not
only are whey proteins essential and beneficial to human health, they are also important
ingredients in food formulations, from texture enhancement and gelation, to water

39
binding and foaming. Proteins add function, form, and valuable nutrition to numerous
foods.
Sensory Analysis and Whey Flavor
Sensory evaluation is defined as “a scientific discipline used to evoke, measure,
analyze, and interpret reactions to those characteristics of foods and materials as they are
perceived by the senses of sight, smell, taste, touch, and hearing” (IFT, 1981). Sensory
evaluation involves the measurement and evaluation of the sensory characteristics of
foods and other materials, and also involves interpretation of the responses from panelists
(Stone and Sidel, 1985). Sensory analysis as an exact science began in the early 1940's in
Scandanavian countries (Jellinek, 1985).
Sensory analysis of foods and beverages is important because although
sophisticated instruments such as gas chromatographs, mass spectrometers, nuclear
magnetic resonance spectrometers, and IR and UV spectrophotometers are now available,
only through the coordination of instrumental and sensory analysis can optimal
information be obtained (Jellinek, 1985). At the limit of instrumental sensitivity, where
the concentration of a substance is too low to be detected by machine, our biological
detectors (senses) may still perceive an odor or taste. Mechanical instruments are only
capable of analyzing a single component at a time whereas our senses give us a total
impression of aroma, taste, temperature and tactile components (Jellinek, 1985).
There are a wide variety of areas where sensory analysis is applicable. Sensory
analysis may be utilized in the areas of quality control of raw materials and of finished
products, storage tests, analysis of competitive products, development of new products,
investigation of factors influencing the odor and flavor of food, aroma research, market
tests, and hedonic tests (Jellinek, 1985).
Humans tends to perceive the attributes of a food item in the following order:

40
appearance, odor/aroma/fragrance, consistency and texture, and flavor. However, during
the process of perception, most of the attributes will overlap (Meilgaard et al., 1991).
• Appearance
Usually involves the characteristics of color, size and shape, surface
texture, clarity, and carbonation.
• Odor/Aroma/Fragrance
The odor of a product is detected when volatiles enter the nasal passage
and are perceived by the olfactory system. Aroma is the odor of a food
product, and fragrance is the odor of a perfume or cosmetic. Aromatics
are the volatiles perceived by the olfactory system from a food substance
in the mouth. Airborne odorants are sensed by the olfactory epithelium,
located in the roof of the nasal cavity. Odorant molecules are sensed by
the tiny hair-like cillia which cover the epithelium. Optimal contact is
obtained by moderate inhalation through the nose for 1 to 2 seconds. One
must allow betwen 5 and 20 seconds for the cilia to de-adapt before a new
sniff can be attempted.
• Consistency and Texture
Consistency and texture are attributes perceived in the mouth other than
taste and chemical feelings. They include viscosity or rate of flow of
homogeneous liquids, consistency for heterogeneous liquids, and texture
for solids or semisolids.
• Flavor
Flavor is the sum of perceptions resulting from stimulation of the sense
ends (taste buds) that are grouped together at the entrance of the
alimentary and respiratory tracts. Flavor includes aromatics and basic
tastes.
41
• Taste
The basic tastes are sweet, sour, salty, and bitter. Detection of taste
compounds involves stimulation of the taste buds by a dissolved
compound. Because every receptor is immersed in the stimulant for some
seconds, oversaturation and adaptation are risks.
(Meilgaard et al., 1991)
• Chemical Feeling Factors
The sensory mechanisms of the tongue and nasal epithelia, causing
stimulation of the Trigeminal Nerve, that are responsive tochemical
stimulation and irritation. Chemical feeling factors include astringency,
spice heat/burn, fizzy/carbonation, pungency, metalic and umami flavors.
(Lawless and Heymann, 1999)
There are a number of methods for determining the sensory attributes of foods,
but they can be grouped into two basic categories: Analytical tests, such as descriptive
analysis and discrimination tests which are among the most widely used, and Affective
tests such as acceptance testing (Stone and Sidel, 1985). Analytical tests are used for
laboratory evaluation of products in terms of differences or similarities and for
identification and quantification of sensory characteristics. Analytical testing involves
the use of highly trained and experienced panelists. Affective tests are used to evaluate
preference and/or acceptance of products and require a large number of untrained
participants (IFT, 1981).
Descriptive analysis represents the most sophisticated method of sensory analysis.
Descriptive analysis results in a complete sensory description of the test products and
provides a basis for determining the sensory characteristics that are important to
acceptance. It also helps to identify the underlying ingredients and process variables.

42
During descriptive analysis, a flavor profile and a texture profile as well as possibly an
aroma profile are determined (Stone and Sidel, 1985). Descriptive tests identify sensory
characteristics and quantify them (IFT, 1981). These tests may be used prior to
conducting consumer acceptance tests in order to reduce the number of product
alternatives to a limited subset (Stone and Sidel, 1985).
The primary purpose of affective testing is to assess the personal response by
consumers of a product. Typically a test will involve 100 to 500 individuals over a
varied geographical region (Meilgaard et al., 1991). Most affective tests are for
preference or acceptance. Qualitative affective tests may be conducted individually and
anonymously or in a focus group format. The latter of the two methods measures
subjective responses of a sample of consumers to the sensory properties of products by
having those consumers talk about their findings in an interview or small group setting.
Overall, affective tests are used to determine general preference for a product, for certain
aspects of products, or to measure consumer responses to specific sensory attributes of a
product (Meilgaard et al., 1991).
Sensory analysis has also been applied to whey and dried whey ingredients.
Drake et al. (2003) identified and developed a descriptive sensory language to profile the
flavor of dried dairy ingredients, including WPC and WPI. Carunchia Whetstine et al.
(2003) and Karagul-Yuceer et al. (2003) used descriptive sensory analysis in conjunction
with instrumental analysis to characterize the flavor of liquid whey.
Carunchia-Whetstine et al. (2003) found variation both within production plants
and between plants in the flavor profile of liquid Cheddar whey. Differences between
plants were attributed to milk source, handling and processing procedures, and starter
culture, while differences within plants was attributed to starter culture rotation. In
addition, several volatile compounds, representing two classes, were determined to be
important to whey flavor. The first class consisted of aroma-active compounds such as

43
alcohols, aldehydes and ketones that produced a discernable odor and it is believed that
these contribute highly to whey flavor. The second class of compounds were aliphatic
hydrocarbons which do not produce on odor and are believed to contribute less to overall
whey flavor.
Work completed by Karagul-Yuceer et al. (2003) supplemented the previously
described study and detailed the compounds that characterized whey flavor. Karagul-
Yuceer et al. (2003) determined that there were a number of different aroma-active
compounds. Among the most important were 2,3-butanedione (diacetyl), 2-butanol,
hexanal, 2-acetyl-1-pyrroline, methional, (E,E)-2,4-nonadienal, (E,E)-2,4-decadienal, and
various short-chain volatile acids. Primary odors associated with the above compounds
were buttery, sweet, cut grass, popcorn, boiled potato, fatty and frier oil respectively.
Fresh cow's milk has a distinctive and yet subtle and delicate flavor. The
concentration of aroma compounds in milk is very low compared to other dairy products
such as butter or cheese (Bendall, 2001). Whey, like milk, has a fairly bland and delicate
flavor (Laye et al., 1995) which allows it to blend well with most products, thus
eliminating the need to hide unwanted flavors (Anonymous, 2002). The constituents of
whey and dried whey products can have an effect on the flavor. Residual lipids in whey
can be detrimental to the functionality and flavor quality of whey protein products
(Vaghela and Kilara, 1996). Quinones et al. (1998) found that changes in protein content
had no effect on the flavor or aroma descriptors of ultrafiltered milk. For whey permeate,
water-soluble vitamins and milk salts were reported to have a significant role in the flavor
characteristics and the nutritive value of whey powder (El-Salam et al., 1985). Nisin, a
natural antimicrobial produced by lactic acid bacteria had no effect on the flavor
characteristics of whey permeate. Therefore, the concentration of nisin in whey permeate
could possibly be increased in order to gain a longer-shelf life for the product without
influencing sensory attributes (Nyk�nen et al., 1998).

44
Whey flavor and aroma can be measured either by sensory techniques or by
instrumental analysis. Gas chromatography-olfactometry (GC-O) is a unique analytical
technique which associates the resolution power of capillary gas chromatography (GC)
with the selectivity of the human nose (Philippe et al., 1999). GC-O enables a flavor
chemist to determine which volatiles have aroma activity and what they smell like. Most
GC-O experiments are conducted using concentrated samples from liquid-liquid
extractions (Bazemore et al., 1999). In this technique, concentrated volatiles are injected
into a GC and onto the contained column which separates the volatiles according to their
molecular weight and polarity and allows them to be released at different intervals. A
sniffer (trained panelist) is positioned at the sniffer port attached to the GC. As volatiles
elute off the column, they pass through the sniffer port where the trained sniffer detects
the odorants, qualifies the nature of the aroma, and records the post-peak intensity as well
as the retention time of each new aroma. Data collected from GC-O is compared to mass
spectrometry data or retention time index charts to confirm which compounds are
responsible for which aromatics.
There are several GCO techniques which include the following: CHARM,
AEDA, OSME and NIF. CHARM and AEDA are dilution techniques and have been
widely used to determine aroma impact compounds of many foods (Philippe et al., 1999).
OSME is a time intensity GC-O method that measures aroma strength and character and
does not require dilutions (Bazemore et al., 1999). OSME is based in the continuous
recording of the odor intensity that is perceived at the sniffing port (Philippe et al., 1999).
NIF, nasal imact frequency, is a form of GCO that uses a number of sniffers who report
detection of odorants and descriptive information (Bendall, 2001). The NIF method does
not require that the panelists be trained, and therefore the NIF method results are not
affected by the presence of a sniffer who has a specific anosmia. NIF has a high
correlation with repeatability and minimal number of GCO runs. NIF also correlates with
45
other GCO methods for the most potent odorants (Bendall, 2001).
Functional Foods
A functional food is simply a food that is physiologically functional, and one that
offers a distinct health benefit when consumed (Smithers et al., 1996). Such a food must
be derived from natural substances, be intended for consumption as part of the daily diet
and have a targeted physiological function when consumed (Smithers et al., 1996).
While nutritional enhancements from functional foods can complete an adequate diet,
they cannot balance out a one-sided or inadequate diet. It is recommended that
individuals eat foods rich in specific groups of substances rather than nutritionally
enhancing agents. This is the only way in which a functional food would have a positive
effect on an individual's diet. There is also a fine line between a functional food and a
medication, and producers of such foods must be careful not to make false claims on
labels (Kneiding, 2001).
The worldwide market for functional foods and beverages is rapidly growing and
was expected to reach over $50 billion per year by 2000 (Smithers et al., 1996). Market
analysis continues to predict massive growth for functional foods. Many companies are
utilizing new scientific insights from nutrition science to re-launch pre-existing products
newly enhanced with bioactive food components. Leveraging hidden nutrient assets is
another way in which traditional foods are re-invented as functional foods with health
benefits that are supported by science. It is believed that in this last method, generic
health effects of traditional foodstuffs are giving powerful force to the idea that one day
all foods will be functional (Heasman and Mellentin, 2001).
When observed on an international scale, the dairy industry is making many of the
advancements in functional foods. The areas of strength for the dairy industry include
bone health in the prevention of osteoporosis, increases in bone mass, and presence of

46
milk as a natural and bioavailable source of calcium. Also, milk proteins, fractions and
peptides, and probiotics found in dairy products have been well documented for their
health benefits (Heasman and Mellentin, 2001). Among children and adolescents, milk is
prefered for very different reasons. Although females are more concerned with taste than
males, males are more likely to like milk flavor, while females are more likely to like
milk for its nutritional value. Ninety percent of teenage boys and 85% of teen girls were
more likely to drink milk, while 79% of adult males and only 75% of adult females drink
milk (DMI, 2001).
The production of functional beverages began in 1997 by South Beach Beverage
Company (Norwalk, CT) who began adding nutrients to their SoBe beverages. South
Beach emerged as one of the leading companies in the production of functional beverages
with a number of products such as teas, fruit drinks and dairy beverages. South Beach
was the first company to focus on nutrient-enhanced refreshment beverages. In the late
1990's, Snapple began adding neutraceuticals to its products and produced the Snapple
Elements line which include such drinks as Earth, Sun, Fire, Gravity and Altitude among
others. These drinks have been infused with such ingredients as ginseng, betacarotene,
astragalus, yerba mate and kava kava (Rodwan Jr., 2001).
Today there are three main categories of functional beverages: simple fortified,
lifestyle and medical, each offering their own benefits and appealing to their own
population. Simple fortified beverages are those products which are fortified with
vitamins and minerals without any detrimental effects on taste. A large variety of
products are now being enhanced and are claiming additional health benefits. Due to
their ease of production, simple fortified beverages are the most numerous. Lifestyle
beverages are those functional beverages and foods that are used to enhance or support
physically or mentally demanding lifestyles or activities. This includes the isotonic fluid
replacing properties of sports drinks that support exercise and sporting activities and the

47
intoxicating properties of alcoholic energy drinks. Medical beverages are products which
provide a greater degree of functionality. In this realm, the neutraceutical market clashes
and competes with the traditional pharmaceutical market such as OTC (over the counter)
and even prescription medications (Broome, 2001b).
Functional beverages target two types of consumers, those who have recognized
medical conditions, diseases or illnesses such as those with high cholesterol and those
consumers who are already healthy. Europe tends to market functional beverages with
positive health benefits for healthy people. This distinction is termed as the difference
between 'life' and 'death' marketing because it alters how companies talk to consumers.
The dairy industry also prefers to follow the 'life' marketing practices (Heasman and
Mellentin, 2001).
Types of Sports and Functional Beverages
As the beverage market grows, a number of new products are created that are
challenging the older staples. From traditional sports beverages to energy drinks, fitness
waters and herbal teas and juices, the market is rapidly expanding. The first functional
beverage of its type was Gatorade, a sports beverage designed for rehydration purposes
(Roberts Jr., 2002a). There are more that twenty-seven sugars, carbohydrates and
sweeteners used to make sports drinks. These include maltodextrins, glucose polymers,
sucrose, glucose, honey, high fructose corn syrup, and most pure fruit juices (Allen and
deWees, 1997). Sports drinks also contain electrolytes, which are dissolved in water and
other fluids. These include sodium, potassium and chloride, and play important roles in a
number of bodily functions (Ault, 2002).
Energy drinks are a rapidly growing commodity in the US. First introduced in
Europe over a decade ago, energy drinks are now a significant player in the US market.
They have a more functional aspect than their sports drink counterpart, and can boast a

48
number of ingredients that promise to boost mental and physical capacity (Roberts Jr.,
2002a). Red Bull, the leader in the energy drink market, claims to impart "increased
physical endurance, improved reaction speed and concentration, increased mental
alertness, an improved overall feeling of wellbeing, a stimulated metabolism and
increased stamina" to its consumers. Typical energy drinks contain caffeine, and sugar in
amounts comparable to standard corbonated soft drinks (CSD’s). However, on a sour
note, neither refreshment nor good taste comprise a primary part of the energy drink
proposition (Rodwan Jr., 2001).
A recent addition to the market are nutrient enhanced waters. Fitness waters
combine the perceptions of purity and healthful hydration typically associated with
bottled water, with the interest in the various new forms of functional beverages. Most
fitness waters have turned to traditional beverage additives like vitamins. Although the
market is still small, it is rapidly growing. An expected tripling in sales was expected
between 2000 and 2001 alone with a rise from $30 million to over $90 million. Even
some of the sports drink makers such as Gatorade have dipped into this market by
developing their version known as Propel Fitness Water (Rodwan Jr., 2001).
The Beverage Market
Adults and teens alike describe their favorite beverages as "cold, refreshing,
thirst-quenching or satisfying" (DMI, 2001). Which drinks meet this standard? The
trendsetters in the non-alcoholic beverage segment are by far fruit juice drinks including
mineral waters with fruit juice. In Germany, 2000, fruit juice drink sales rose 33% to
over 433.8 million liters. Fruit drinks are marketed as fitness drinks, and consumers like
their 'naturalness', taste and the convenience (Williams, 2001). Sales of mineral-water
based fruit juice drinks and mineral water plus fruit in Germany rose in 2000 by 16.4% to
326.6 million liters (Williams, 2001).
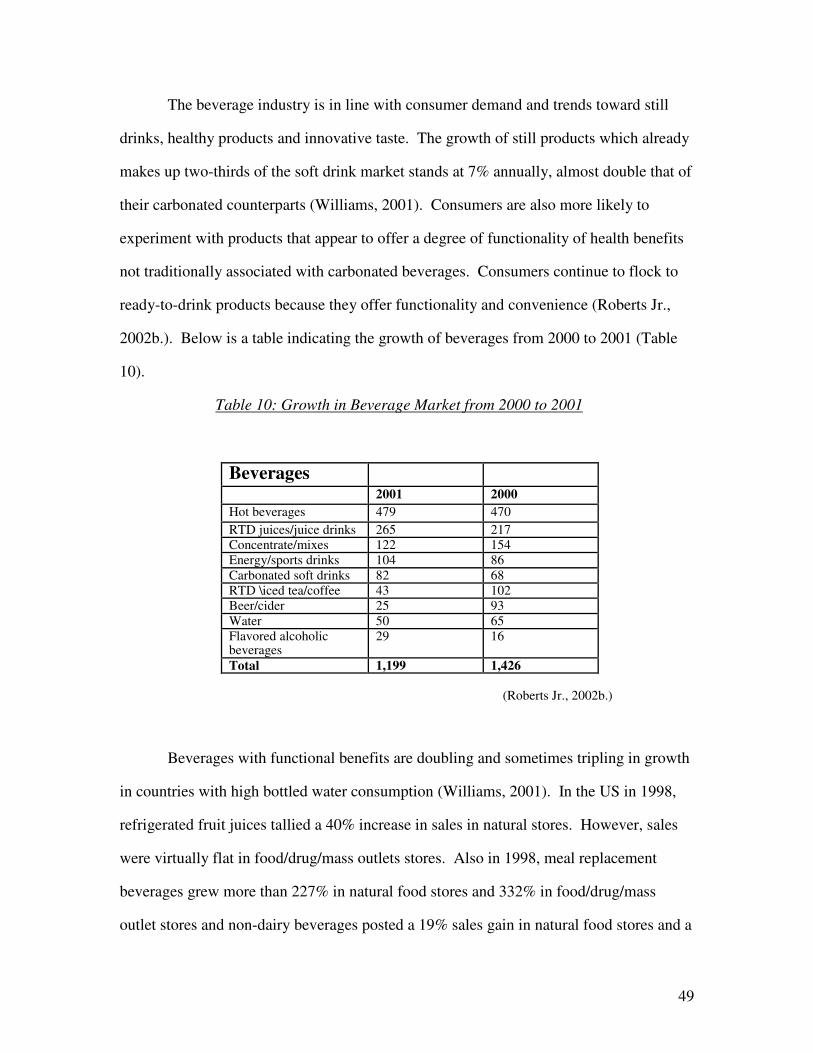
49
The beverage industry is in line with consumer demand and trends toward still
drinks, healthy products and innovative taste. The growth of still products which already
makes up two-thirds of the soft drink market stands at 7% annually, almost double that of
their carbonated counterparts (Williams, 2001). Consumers are also more likely to
experiment with products that appear to offer a degree of functionality of health benefits
not traditionally associated with carbonated beverages. Consumers continue to flock to
ready-to-drink products because they offer functionality and convenience (Roberts Jr.,
2002b.). Below is a table indicating the growth of beverages from 2000 to 2001 (Table
10).
Table 10: Growth in Beverage Market from 2000 to 2001
Beverages
2001 2000 Hot beverages 479 470 RTD juices/juice drinks 265 217 Concentrate/mixes 122 154 Energy/sports drinks 104 86 Carbonated soft drinks 82 68 RTD \iced tea/coffee 43 102 Beer/cider 25 93 Water 50 65 Flavored alcoholic beverages
29 16
Total 1,199 1,426 (Roberts Jr., 2002b.)
Beverages with functional benefits are doubling and sometimes tripling in growth
in countries with high bottled water consumption (Williams, 2001). In the US in 1998,
refrigerated fruit juices tallied a 40% increase in sales in natural stores. However, sales
were virtually flat in food/drug/mass outlets stores. Also in 1998, meal replacement
beverages grew more than 227% in natural food stores and 332% in food/drug/mass
outlet stores and non-dairy beverages posted a 19% sales gain in natural food stores and a
50
55% growth in food/drug/mass outlets (Swientek, 1999). Spence Information Services
(SPINS) reports that a broad affluent consumer base has driven the strong growth in
functional beverages (Swientek, 1999). The key trends that satisfy consumer demand
most effectively are wellness and health, enjoyment and convenience. These offer the
best prospects of success for producers in terms of product innovation (Eckert and Smerz,
2002)
The new generation of functional/neutraceutical beverages includes sports drinks
and energy drinks as well as nutrient enhanced juices, teas and dairy-based beverages
(Rodwan Jr., 2001). Sports beverages were one of the first types of beverages to offer
functionality and be marketed for this aspect. First developed over 35 years ago,
Gatorade is the oldest and also the most well known sports drink. Gatorade originated
from a lemon-lime flavored drink infused with potassium, sodium and sugar (Rodwan Jr,
2001), developed for the Florida Gators (Allen and deWees, 1997), to replenish active
athletes or sports-people with the necessary liquid intake and mineral components needed
to maintain optimal performance (Williams, 2001). Young consumers, especially those
under age 34 and teenagers, are particularly attracted to the sports drink category
(Roberts Jr., 2002a). The lifestyle of the 90’s puts an emphasis on fitness,
competitiveness and mobility (Hollingsworth, 1994). In a study by Roberts Jr. (2002a),
two-thirds of those surveyed enjoy sports drinks in connection with sports activity, while
almost as many regard them as 'anytime' drinks. This suggests that sports drinks have
crossed the line from the benefit-oriented category into the refreshment arena. Since day
one, athletes have been the most significant consumers of sports beverages. They were
originally developed to appeal to athletes and have the stated benefit of increasing
athletic performance (Roberts Jr., 2002a)
Even in 1994, Gatorade was the market leader (Hollinsworth, 1994). By 2000,
Gatorade accounted for more than 85% of all US sports drink sales. Neither Powerade,

51
developed by the Coca Cola Company nor All Sport developed by Pepsi ever presented
much of a challenge to Gatorade's dominance (Rodwan Jr., 2001). Powerade recently
underwent a dramatic reformulation of the seven main flavors and increased their
fortification with B-vitamins. All Sport, owned by Monarch, aims to increase its share of
the market to 10% from 7% in 2001, by reformulating to non-carbonated versions of its
flavors, as well as fortifying the beverages with vitamins B and C (Roberts Jr., 2002a). In
2000, Gatorage accounted for $1.9 billion of the $2.6 billion generated from the sale of
functional beverages (Rodwan Jr., 2001).
Energy drinks are increasingly popular among consumers who are seeking an
energetic pick-me-up (Roberts Jr., 2002b). Currently three groups of consumers are the
primary targets for energy drinks. These include club-goers interested in energy for non-
stop partying, students who want to enhance performance, and athletes - especially those
involved in extreme sports (Roberts Jr., 2002a). In 2001, energy drinks brought in
approximately $130 million, led by Red Bull. Energy drinks comprise a relatively small
but rapidly expanding piece of the US beverage marketplace, representing less than 2%
of the total US beverage sales. According to Beverage Marketing Corporation,
companies generated a total of nearly $2.6 billion from the sales of functional beverages
(Rodwan, Jr., 2001). Increased regulation of energy drinks may lead to new changes in
the energy drink category (Roberts Jr., 2002a).
Another spin off from the functional beverage category is fitness water which
seeks to quench the consumer demand for both bottled water and nutrient enhanced
products (Rodwan Jr., 2001). A number of companies have positioned water on a health
platform, some providing vitamins and minerals and some edging into the arena of
functional beverages. Bottled water products have seen their ranks bolstered by products
adding flavors, ingredients and new packaging (Roberts Jr., 2002b).

52
Beverage Flavor
Dr. John Greenleaf, a scientist with NASA, says that most Americans seem to be
chronically underhydrated (Ault, 2002). Studies he has conducted indicate that people
will drink more water if it has more flavor or has added salt and sugar (Ault, 2002).
Passe et al. (2000) indicated that individuals will be more likely to consume more of a
beverage if it is cool, not cold, and if it is sweet and sour but not salty, bitter or umami.
A product sweetened by carbohydrates and acidified by citric acid will almost certainly
direct the thrust of flavors towards fruity types. The ratio between the acidity and the
sweetness will dictate the fruit type, thus a low sweetness/acidity ratio will most likely
produce citrus or passion fruit elements while higher ratios will result in mango, banana
or other low acid types of fruit (Ashurst, 2001).
Over the years, a number of new and innovative flavors have graced the beverage
market with their presence, yet few have had the lasting impression that the original
flavors have had. Consumers still tend to favor traditional and natural fruit flavors. The
main flavors across all product groups including beverages in order of importance are the
following: lemon, orange, peach, apple, strawberry, grapefruit, raspberry and vanilla. A
number of new and upcoming flavors include caramel, carrot, coriander, honey, lime
blossom, lychee, mandarin, pomegranate, rose, starfruit and tamarind (Broome, 2001a).
Combination flavors, where two flavors are used in conjunction with one another
as in lemon-lime or cranberry-apple account for nearly 50% of all product launches, and
35% of new product launches use natural flavors (Broome, 2001a). While citrus flavors
dominate the soft drink world, there is considerable diversity in the realm of bottled water
flavors. Also, exotic fruit flavors are becoming more popular in both fruit juice drinks
and also in combination with more traditional flavors such as orange in soft drinks. Teas
53
are a growing market whose core consumers are health conscious females between the
ages of 20-40 years. Many of these flavored teas possess neutraceutical benefits.
Popular flavors of such teas include, in order of popularity, mint, camomile, berry, apple,
lemon and orange (Broome, 2001a).
The use of B vitamins can produce meaty or sulphury components to the overall
beverage flavor, especially when the product is aged (Ashurst, 2001). This is regarded as
an off flavor, and can also result if protein sources are used in flavors. When added to
beverages, whey protein hydrosylates usually result in creamy butyric notes which grow
increasingly more noticeable with increasing shelf life (Ashurst, 2001). These flavors
can be blended with others that are creamy like vanilla or butterscotch rather than strong
acidic flavors such as lemon. The addition of minerals to the beverage will almost
always result in a metallic component to the overall flavor (Ashurst, 2001).
The development of beverage flavors across hot, soft and alcoholic drinks is
driven by three key features: sophistication, diversity and natural flavors. Sophistication
brings about a number of changes including consumer demand for more diversity of
flavors, consumer demand for combination flavors, and consumer demand for both
familiar and unfamiliar flavors simultaneously. One of the features of new flavors that
will define its success is how they blend with the most common flavors such as lemon,
orange, lime and strawberry. The growth of natural flavors, which can be seen in a
number of categories from bottled waters to teas, coffees and liquors has been driven
through consumer demand. This demand is caused by a growing understanding of and
resistance to artificial flavors (Broome, 2001a).
The desire for a cool refreshing beverage is intrinsic to the consumer. It is this
need that drives the desire for water on a hot day or after playing a sport to cool and wet
the mouth and to replace fluids (McEwan and Colwill, 1996). There are two main types
of physiological or biological factors that drive this desire; formulation factors or sensory
54
interactions and bodily needs. Sensory interactions are the effects of the intrinsic
properties of the drink on the consumer's perception of the drink's ability to be thirst
quenching, refreshing, etc. (McEwan and Colwill, 1996). According to a study
conducted by McEwan and Colwill (1996), a focus group identified seven sensory
attributes which were important in influencing the thirst quenching properties of drinks.
These attributes were acid, astringent, carbonation, fruity, strength of flavor, sweetness
and thickness. Acid was most associated with thirst-quenching while sweetness and
thickness were least associated (McEwan and Colwill, 1996).
In a study conducted by Zellner and Durlach (2002) in which 86 students at
Shippensburg College were asked the same six questions regarding refreshing foods and
beverages, 90% of respondents indicated that water was the most refreshing
food/beverage. Cold foods/beverages such as ice cream, iced tea, lemonade and milk
were listed subsequently at 54%, 49% and 36% respectively. Gatorade was found to be
refreshing by only 17% of respondents. The sensory attributes most commonly
associated with refreshing/thirst-quenching ability were the following: temperature
related characteristics -92% (‘cold’, ‘cool’, ‘icy’ and ‘hot’), ‘sweet’, ‘smooth’, ‘juicy’,
‘wet’ and ‘fizzy’. Temperature was more important as a refreshing attribute than color.
However, colors that were deemed the most refreshing were clear, red, orange, yellow
and white, while un-refreshing colors were black, brown, green, grey and purple. The
most refreshing flavors were found to be orange, strawberry, cherry, lemon and vanilla,
while chocolate, salty, spicy, beefy and grape were viewed as un-refreshing flavors
(Zellner and Durlach, 2002).
Summary
Whey has become more popular over the recent years as an ingredient in a
number of foods and beverages. The functional properties of whey allow it to be
55
widely used in food products as a replacement ingredient for egg proteins in
confectionery and bakery products, and for milk in dairy products such as ice cream. In
beverages, WPCs and WPI have been widely used because of their high level of
BCAAs which provide innumerable benefits to athletes in training or in recovery.
One of the only whey products that has not been extensively used in the food or
health industry is whey permeate. Although still viewed as a waste product of the UF
process, which separates liquid whey into a protein concentrate and a lactose and
mineral retentate, whey permeate may hold the key to future product innovation. It is
the functional beverage market that provides the greatest opportunity for a whey
permeate-based product to infiltrate the food industry. Such a beverage would be the
first of its kind. The objectives of this study are to conduct a category assessment of
thirst-quenching beverages using descriptive analysis and consumer testing, and to
design a thirst-quenching beverage using milk or whey permeate.

56
References Ahmed, A.J. 1999. Prebiotics, feeding your friendly flora naturally. Total Health. Vol 21(4) p. 52-53. Allen N.D. and A. de Wees. 1997. Sports drinks and the glycemic index. www.anndeweesallen.com/dal_ra05.htm. 1997-2002. Al-Eid, S. M.; A. A. Al-Neshawy; S. S. Al-Shaikh Ahmad. 1999. Influence of substituting water with ultrafiltered milk permeate on dough properties and baking quality of white pan bread. Journal of Cereal Science. Vol. 30. p. 79-82. Anonymous. 2001. Do it with dairy. DMI. Whey. p. 1-3. www.doitwithdairy.com/infolib/ingspecsheet/factwhey.htm Anonymous. 2002. Do it with dairy. “Athletes get the most from their diets: whey protein provides high level of necessary protein and other nutrients”. www.extraordinarydairy.com/standard.asp?ContentPage1d=84. Ashurst, P. 2001. Flavour creation for nutritional beverages. The World of Food Ingredients. Vol. February/March. p54, 56-57. Ault, A. 2002. Panel examining water, sports drinks and health. ABCNEWS. Reuters News Service, 2002. July 15, 2002. Bazemore, R.; K. Goodner, R. Rouseff. 1999. Volatiles from unpasteurized and excessively heated orange juice analyzed with solid phase microextraction and GC-olfactometry. Journal of Food Science. Vol. 64(5). p. 800-803. Bendall, J. G. 2001. Aroma compounds of fresh milk from New Zealand cows fed different diets. Journal of Agriculture and Food Chemistry. Vol. 49. p. 4825-4832. Brink, W. 2000. Lactoferrin: the bioactive peptide that fights disease. Life Extension. October, 2000. Broome, N. 2001a. Beverage flavours. The World of Food Ingredients. Vol. February/March 2001. p. 20, 22-23. Broome, N. 2001b. Nutraceutical beverages Eexpand. The World of Food Ingredients. Vol. February/March 2001. p. 42, 44, 46. Burke, E. 2003. Whey protein: No fat - and may fight cancer. Better Nutrition. November, 2003. p.52.

57
Burke, D.G., P.D. Chilibeck, K.S. Davison, D.G. Candow, J. Farthing, T. Smith-Palmer. 2001. The effect of whey protein supplementation with and without creatine monohydrate combined with resistance training on lean muscle mass and muscle strength. International Journal of Sport Nutrition and Exercise Metabolim. Vol. 11, 349-364. Canadian Egg Marketing Agency. 2002. “Nutrition”. http://www.eggs.ca/nutrition/health/health.htm Carunchia-Whetstine; M., Parker, J.; Drake, M.A. and Larick, D.K. 2003. Determining flavor and flavor variables in commercially produced liquid Cheddar whey. Journal of Dairy Science. Vol. 86(2) p. 439. Casper, J. L.; W. L. Wendorff; D. L. Thomas. 1999. Functional properties of whey proteins concentrates from caprine and ovine specialty cheese wheys. Journal of Dairy Science. Vol. 82. p. 265-271. Chandan, R. C.; M. A. Uebersax; M.J. Saylock. 1982. Utilization of cheese whey permeate in canned beans and plums. Journal of Food Science. Vol. 47. p. 1649-1653. Dalgleish, D. G.; L. van Mourik; M. Corredig. 1997. Heat induced interactions of whey proteins and casein micelles with different concentrations of alpha-Lactalbumin and beta-Lactoglobulin. Journal of Agriculture and Food Chemistry. Vol 45 (12). p. 4806-4813. de Wit, J. N. 1998. Nutritional and functional characteristics of whey proteins in food products. Journal of Dairy Science. Vol. 81. p. 597-608. DMI. “Opportunities for membrane filtration of milk”. 2000. Innovations in Dairy. www.extraordinarydairy.com. DMI. “Conspicuous consumption”. 2001. Dairy Management Incorporated. Extraordinary Dairy Files. DMI. “Whey protein concentrate” 2002. http://www.doitwithdairy.com/ingredients/wheycon/inwheycondef.htm Drake, M. A. 2002. Personal correspondence. North Carolina State University, Raleigh, NC. Drake, M.A.; Karagul-Yuceer, Y.; Cadwallader, K.R.; Civille, G.V. and Tong, P.S. 2003. Determination of the sensory attributes of dried milk powders and dairy ingredients. Journal of Sensory Stud. In Press.
Eckert, S. and A. Smerz. 2002. Tailor made drinks. The World of Food Ingredients. Vol. March, 2002. p.51-53.

58
El-Salam, M. H A.; Safinax El-Shibiny; Mohamed B. Mahfouz. 1985. Chemical composition and nutritive value of spray dried permeate powder. Journal of the Society of Dairy Technology. Vol. 38(2). p. 53-55. Fitzpatrick, J. J., M. Ahrens, S. Smith. 2001. Effect of manganese on Lactobacillus casei fermentation to produce lactic acid from whey permeate. Process Biochemistry. Vol. 36(7), February 2001. p. 671-675. Fitzpatrick, J. J. and U. O’Keeffe. 2001. Influence of whey protein hydrolysate addition to whey permeate batch fermentations for producing lactic acid. Process Biochemistry. Vol. 37(2) October 2001. p. 183-186. Food and Agriculture Organization of the United Nations (FAOUN). 1970. http://www.iowaegg.org/allabouteggs/biological-value.html Food and Nutrition Board, Institute of Medicine. Recommended Daily Allowances, 10th edition. Washington, DC: National Academy press, 1989. Frank, P. 2001. “Finding the Whey”. p. 1-3. www.legacy-meadowfresh.com/Finding_The_Whey.html Excerpt from Food Processing. Gassem, M. A., K. A. Schmidt; J. F. Frank. 1997. Exopolysaccharide production from whey lactose by fermentation with Lactobacillus delbrueckii ssp. bulgaricus. Journal of Food Science. Vol. 62(1). p. 171-173, 207. Geilman, W. G.; D. Schmidt; C. Herfurth-Kennedy; J. Path, J. Cullor. 1992. Production of an electrolyte beverage from milk permeate. Journal of Dairy Science. Vol. 75. p. 2364-2369. Hardham, J. F. 1998. Effect of protein standardization of milk by addition of UF milk permeate on the composition and storage stability of UHT processed milk. The Australian Journal of Dairy Technology. Vol. 53, April 1998. p. 22-27. Heasman, M. and J. Mellentin. 2001. Dairy’s functional edge: leveraging the hidden nutrition assets in traditional foodstuffs. The World of Food Ingredients. Vol. April/May. p 54-56, 57,59. Hinterholzer, A. and P. Schieberle. 1998. Identification of the most odour-active volatiles in fresh, hand-extracted juice of Valencia late oranges by odour dilution techniques. Flavour and Fragrance Journal. Vol. 13. p. 49-55. Hollingsworth, P. 1994. It ain’t hip to sip. Food Technology. Vol. 48 (11). p 26. Huffman, L. M. 1996. Processing whey protein for use as a food ingredient. Food Technology. Vol. 50(Feb). p. 49-52.
59
Hurley, W. L.; B. L. Ventling; B. L. Larson. 1990. Variability in physiochemical properties of dried wheys from commercial sources. Journal of Food Quality. Vol. 13(2). p.119-127. IFT Sensory Division. 1981. Sensory evaluation guide for testing food and beverage products. Food Technology. Vol. Nov. 1981. p.50-59. Jellinek, G. 1985. “Sensory Evaluation of Food: Theory and Practice”. Ellis, Horwood Ltd. 1985. Chichester, England. Jeon, I. J.; S. J. Galitzer; K. J. Hennessy. 1984. Rapid determination of lactose and its hydrolyzates in whey and whey permeate by high performance liquid chromatography. Journal of Dairy Science. Vol. 67. p. 884-887. Junger, W.G., D.B. Hoyt, R.E. Davis, C. Herdon-remelius, S. Namiki, H. Junger, W. Loomis and A. Altman. 1998. Hypertonicity regulates the function of human neutrophils by modulating chemoattractant receptor signaling and activating mitogen-activated protein kinase p38. Journal of Clinical Investigation. Vol. 101(12):2768-2779. Karagul-Yuceer, Y.; Drake, M.A.; Cadwallader, K.R. 2003. Aroma active components of liquid Cheddar whey. Journal of Food Science. 64(4):1215-1219. Kneiding, Joern. 2001. Fresh dairy growing: expert panel reviews top trends. The World of Food Ingredients. Vol. January. p.36-38. LaGrange, V. 2003. Whey proteins in dairy-based drinks: beverage applications for whey and lactose products. USDEC: Reference Manual for U.S. Whey and Lactose Products. p. 118-122. Lamboley, L.; C. Lacroix; J. M. Artignan; C. P. Champagne; J. C. Vuillemard. 1999. Long-term mechanical and biological stability of an immobilized cell reactor for continuous mixed strain mesophilic lactic starter production in whey permeate. Biotechnology Progress. Vol. 15. p. 646-654. Lawless, H.T. and Heymann, H. 1999. Sensory Evaluation of Food: Principles and Practices. Aspen Publishers, Gaithersburg, MD. 1999. p.61-62. Lawson, M. A. 1994. Milk proteins as food ingredients. Food Technology. Vol 48(Oct.). p.101. Laye, I.; D. Karleskind; C.V. Morr. 1995. Food Flavors: Generation, Analysis, and Process Influence. Charalambous, G. (Ed). Elsevier. Amsterdam. p.769-783.

60
Macedo, M.G.; C. Lacroix; C. P. Champagne. 2002. Combined effects of temperature and medium composition on exopolysaccharide production by Lactobacillus rhamnosus RW-9595M in a whey permeate based medium. Biotechnology Progress. Vol. 18(2). p. 167-173. Manore, M. and Thompson, J. 2000. Sport Nutrition for Health and Human Performance. Human Kinetics, Champaign, IL, 2000. p. 106, 111, 115, 121, 277-278, 341. Martinez-Hermosilla, A.; G. J. Hulbert; W. C. Liao. 2000. Effect of cottage cheese whey pretreatment and 2-phase crossflow microfiltration/ultrafiltration on permeate flux and composition. Journal of Food Science. Vol 65(2). p.334-339. Mc Ewan, Jean A. and Janet S. Colwill. 1996. The sensory assessment of the thirst-quenching characteristics of crinks. Food Quality and Preference. Vol. 7(2). p. 101-111. Meilgaard, D.; Morten, G. V. Civille; B. T. Carr. 1991. Sensory Evaluation and Techniques. 2nd Edition. CRC Press, Inc. Boca Raton, FL. Chap. 1,2,9,10. National Dairy Council. 2003. Emerging health benefits of whey. Dairy Council Digest. 74:6 31-36. Nykanen, A.; A. Lapvetelainen; R. Hietanen; H. Kallio. 1998. The effect of lactic acid, nisin whey permeate, sodium chloride and related combinations on aerobic plate count and the sensory characteristics of rainbow trout. Lbensm-Wiss. u.Technol. Vol. 31. p. 286-290. Ohr, L. M. 2001. Proteins pack a one-two punch. Prepared Foods. Vol. August. p. 28-30, 32. Parris, N.; C. M. Hollar; A. Hsieh; K. D. Cockley. 1997. Thermal stability of whey protein concentrate mixtures: aggregate formation. Journal of Dairy Science. Vol. 80. p. 19-28. Pasin, Dr. G.and Dr.S.L. Miller, Ph.D. 2000. U.S. Whey Products and Sports Nutrition. U.S. Dairy Export Council. www.usdec.org/pdffiles/manuals/9SportsNut.pdf. p.1-8. Passe, D.H, M. Horn and R. Murray. 2000. Impact of beverage acceptability on fluid intake during exercise. Appetite. Vol 35. 219-229. Patel, R. S. and V. V. Mistry. 1997. Physiochemical and structural properties of ultrafiltered buffalo milk and milk powder. Journal of Dairy Science. Vol. 80. p. 812-817.

61
Peña-Ramos, E. A. and Y. L. Xiong. 2001. Antioxidative activity of whey protein hydrolysates in a liposomal system. Journal of Dairy Science. Vol. 84. p. 2577-2583. Pollien, P.; L.B. Fay; M.Baumgartner; A. aintreau. 1999. First attempt of odorant quantitation using gas chromatography-olfactometry. Analytical Chemistry. Vol. 71(23) p. 5391-5397. Quinones, H. J.; D.M. Barbano; L. G. Phillips. 1998. Influence of protein standardization by ultrafiltration on the viscosity, color, and sensory properties of 2 and 3.3% milks. Journal of Dairy Science. Vol. 81. p. 884-894. Rexroat, T. M. and R. L. Bradley, Jr. 1986a. Acceptance of frozen desserts made with concentrated, decolorized, deionized hydrolyzed whey permeate. Journal of Dairy Science. Vol 69. p. 1225-1231. Rexroat, T. M. and R. L. Bradley, Jr. 1986b. Stability of concentrated, decolorized, deionized hydrolyzed whey permeate. Journal of Dairy Science. Vol 69. p. 1762-1766. Roberts Jr., W. A. 2002a. Good sports. Prepared Foods. Vol. August. p 23, 26, 28. Roberts Jr., W. A. 2002b. Absolutely FABulous. Prepared Foods. Vol. April. p 19-20, 24, 26, 28. Rodwan, Jr., J. G. 2001. The next new thing: nutrient-enhanced & functional beverages in the U.S. The World of Food Ingredients. Vol. September. p 48,50, 52-53. Roth, J. A.; D. E. Frank; P. Weighner; M. Weighner. 2001. Enhancement of neutrophil function by ultrafiltered bovine whey. Journal of Dairy Science. Vol. 84. p. 824-829. Rustom, I.Y. S.; M. I. Foda; M. H. Lopez-Leiva. 1998. Formation of oligosaccharides from whey UF-permeate by enzymatic hydrolysis - analysis of factors. Food Chemistry. Vol. 62(2). p. 141-147. Shepherd, R.; A. Robertson; D. Ofman. 2000. Dairy glycoconjugate emulsifiers: casein-maltodextrins. Food Hydrocolloids. Vol. 14(4), July 2000. p 281-286. Singh, T., Drake, M.A., and Cadwallader, K.R. 2003. Flavor of cheddar cheese: a chemical and sensory perspective. Compr. Rev. Food Sci. Vol. 2 p.139-162. Smithers, G. W.; F.J. Ballard; A. D. Copeland; K. J. De Silva; D. A. Dionysius; G. L. Francis; C. Godard; P. A. Griece; G. H. McIntosh; I. R. Mitchell; R. J. Pearce; G. O. Regester. 1996. New opportunities from the isolation and utilization of whey proteins. symposium: advances in dairy foods processing and engineering. Journal of Dairy Science. Vol. 79. p 1454-1459.

62
Soy Protein Council (SPC). 1987. “Soy protein products: characteristics, nutritional aspects and utilization”. www.spcouncil.org/contents.htm. Stone, H. and Joel L. Sidel. 1985. Sensory Evaluation Practices. Academic Press, Inc. Orlando, FL. Chap. 1,6,7. Swientek, B. April 1999. Forces of nature. Prepared Foods. Vol. 168 (4). p. 93-94, 96. Talabardon, Mylene.; Jean-Paul Schwitzguebel; Paul Peringer. 2000. Anaerobic thermophilic fermentation for acetic acid production from milk permeate. Journal of Biotechnology. Vol. 76. p 83-92. Teunou, E. and J. J. Fitzpatrick. 1999. Effect of relative humidity and temperature on food powder flowability. Journal of Food Engineering. Vol. 42. p. 109-116. Teunou, E. and J. J. Fitzpatrick. 2000. Effect of storage time and consolidation on food powder flowability. Journal of Food Engineering. Vol. 43.(2), February, 2000. p. 97-101. Vaghela, M. and A. Kilara. 1996. Lipid composition of whey protein concentrates manufactured commercially and in the laboratory. Journal of Dairy Science. Vol. 79. p. 1172-1183. Varnam, A. H. and J. P. Sutherland. 1994. Milk and Milk Products: Technology, Chemistry and Microbiology. Chapman and Hall, 1994. NY, NY. Chap. 1,4,7. Viotto, W.H. and S.M. Roig. 1995. Effect of whey processing on solubility of whey protein concentrate. Journal of Dairy Science. Vol. 78 Supplement 1. P. 141 Walzem, R.D. and Rosemary L. 1999. Health enhancing properties of whey proteins and whey fractions. U.S. Dairy Export Council. www.usdec.org/pdffiles/manuals/7health.pdf. p.1-7. Whey Protein Institute (WPI). 2001. Benefits of whey proteins. www.wheyoflife.org/benefits.html#3 Williams, L. A. Oct./Nov. 2001. Trend setting drinks: The new developments and trends that will be shaping their industry in the years to come. The World of Food Ingredients. p. 45-48, 50, 52. Zellner, D.A. and P. Durlach. 2002. What is refreshing? An investigation of the color and other sensory attributes of refreshing foods and beverages. Appetite. 39, 185-186.

63
Manuscript
Design of a thirst quenching beverage from whey permeate
Janine Beucler¹, MaryAnne Drake¹*, E. Allen Foegeding¹
¹Department of Food Science, North Carolina State University, Box 7624, Raleigh, NC
27695
* Author to Contact
Email: [email protected]
Phone: (919) 513-4598
Fax: (919) 515-7124

64
Abstract
Whey permeate (WP) is a by-product of whey protein production, and primarily
contains water, lactose, and minerals, with minimal fat and protein. The majority of the
WP produced in the United States is disposed of via land-spreading or is used as a
component in animal feed, however, WP could be utilized in the growing beverage
industry. The objectives of this study were to conduct a category survey of thirst
quenching beverages and to design a thirst-quenching beverage utilizing WP. The
descriptive sensory properties (visual, flavor and texture/mouthfeel) of commercial thirst
quenching beverages were determined using a trained descriptive panel (n=11). WP with
and without hydrolysis of lactose was subsequently incorporated into a basic beverage
formula, substituted for 0%, 25%, 50%, 75% or 100% of water. Consumers (n=110)
evaluated beverages with WP and commercial beverages for overall acceptability, flavor
liking, and thirst quenching ability. Drinks made with lower levels (25% and 50%) of
either hydrolyzed or unhydrolyzed WP were more similar to the commercial beverages in
visual and flavor properties than beverages containing higher percentages (75% and
100%) of WP. All drinks made with WP were higher in electrolyte (Na, K, Zn, Mg, P)
content compared to a commercial thirst quenching beverage (p<0.05). Beverage
incorporation represents a value-added utilization for WP.
Key Words: Whey permeate; beverages; thirst-quenching; sensory analysis; consumer
acceptance

65
Introduction
The non-solid, or the yellow-green liquid that separates from the curd during
cheese formation is whey (Anonymous, 2001; Smithers et al., 1996; Chandan et al.,
1982). During the production of one pound of cheese, approximately nine pounds of
whey are produced (Anonymous, 2001). Liquid whey is approximately 93% water and
0.6% protein (Huffman, 1996). Whey contains almost 50% of all solids present in whole
milk (Chandan et al., 1982), of which lactose is the main constituent (Huffman, 1996).
Until the latter part of the 1900's, milkfat was the most important economic component of
milk. Now, the protein is the most highly valued component (Hardham, 1998).
The emergence of whey protein as a functional ingredient and good source of
essential and branched chain amino acids has thrust whey protein into the market
spotlight. In order to remove the unwanted portions and concentrate the protein, liquid
whey is subjected to ultrafiltration and microfiltration processes (Huffman, 1996). Whey
protein concentrate (WPC) contains protein in concentrations less than 90% while whey
protein isolates (WPI) contain a minimum of 90% protein. What is left over after
ultrafiltration and microfiltration of liquid whey in whey protein processing is called
whey permeate (WP). Liquid WP is comprised primarily of lactose (5%), water (93%)
and minerals (0.53%) with minimal fat (0.36%) and protein (0.85%) (Chandan et al.,
1982; USDA, 2004). In its spray dried form, these contents are concentrated to the
following amounts: lactose 65-85%, minerals 8-20%, fat 1.5% maximum, and protein 3-
8% (USDEC, 2000). WP is primarily viewed as a by-product in the food industry.
Today, some WP is used as an ingredient in animal feed, primarily the lactose component

66
(Frank, 2001), and some WP is spread onto land in a process called landspreading.
Increasing demand and production of WPC and WPI have produced a lucrative
alternative to liquid whey disposal. However, WP still poses a problem.
WP has been used in recent years for the production of lactic acid using
fermentation with lactic acid bacteria (Talabardon et al., 2000; Fitzpatrick and O’Keeffe,
2001; Fitzpatrick et al., 2001; Macedo et al., 2002). Limited research has been conducted
regarding the use of hydrolyzed WP in the food industry. Rustom et al. (1998) used the
lactose component of WP to produce oligosaccharides during the enzymatic hydrolysis of
lactose for use as a functional ingredient in food products. β-galactosidase was used for
hydrolysis of the lactose. A second study utilized hydrolyzed WP for the production of
permeate syrups to replace up to 50% of the sucrose syrup in canned peaches and pears
without a reduction in quality (Tweedie and MacBean, 1978). In a similar study,
Chandan et al. (1982) reported that either hydrolyzed or unhydrolyzed WP could be used
in the formation of a brine replacer in canned beans, with beans canned in WP solutions
retaining firmness better than those canned in control solutions. They also found that
hydrolyzed WP could be successfully used as a syrup replacer for canned plums without
significant differences from control samples (Chandan et al., 1982).
Milk permeate (MP) is a lactose rich by-product of the ultrafiltration (UF) of
liquid milk during the production of specialty milk products (Talabardon et al., 2000). Its
composition is similar to WP. Al-Eid et al. (1999) evaluated replacing sucrose in white
pan bread with fermented and unfermented MP. They found that the presence of MP
greatly increased the viscosity of the bread dough and that fermentation of MP also
resulted in greater viscosity than did unfermented MP. Geilman et al. (1992) utilized
hydrolyzed MP to produce an electrolyte beverage. They found that beverages made
with 100% MP were extremely salty and that further testing would be required to produce

67
a consumer-friendly formulation.
Electrolyte beverages fall into the functional beverage category. Functional
beverages offer some type of health benefit, and this category is a rapidly growing sector
of the beverage market. The still drink market, which includes functional beverages,
grows at an annual rate of 7%, double that of its carbonated counterparts (Williams,
2001). This growth can be attributed to a rise in the consumption of a variety of
beverages including sports drinks, fitness waters, and dairy based beverages (Rodwan Jr.,
2001). The objectives of this study were first, to characterize via descriptive analysis, the
sensory properties of commercial thirst quenching beverages. The second objective was
to probe consumer acceptability and perception of commercial thirst quenching
beverages. Thirdly, a beverage was designed from whey permeate to fit into the concept
of thirst-quenching beverages.
Materials and methods
Sample Acquisition
Frozen liquid Mozzarella WP (151.4L) was received by overnight carrier from a
commercial cheese and whey protein manufacturing facility (Tulare, CA). WP was kept
frozen at -20°C until use (within 2 months).
Proximate Analysis
Proximate analysis of WP was conducted using standard methods (Marshall,
1992). Total solids were measured using a Mojonnier Tester (Mojonnier Bros. Co.,
Chicago, IL, USA) (Atherton and Newlander, 1977). The Babcock method was used for
fat analysis in addition to utilization of the CEM Smart Trac Rapid Fat Analysis System
(CEM Corporation, Matthews, NC, USA) (CEM Smart Trac Rapid Fat Analyzer
68
Instruction Manual). Total nitrogen was analyzed via the Kjeldahl method and protein
was calculated by the conversion factor of total nitrogen (mg/L * 6.38/1000 = g/L
protein). pH was measured using an Orion Model 250A Plus pH Meter with a Corning
G-P Combo RJ probe (Fischer Scientific, Pittsburgh, PA). Percent titratable acidity
(%TA) was calculated from the amount of 0.1N NaOH titrated into an 18g sample until a
final pH of 8.3 was reached. Mineral analysis of sodium, potassium, magnesium, zinc
and phosphorous was determined via Inductively Coupled Plasma (ICP) analysis.
Microbial counts (total aerobic plate count and coliforms) were determined by
appropriate dilutions in 0.1% peptone water and followed by pour-plating with Tryptic
Soy Agar or Violet Red Bile Agar (Acumedia Manufacturers, Inc., Baltimore, MD) and
incubation at 35°C for 24 hours. All analyses were conducted in duplicate.
Hydrolysis of WP
Hydrolysis of WP was conducted enzymatically (Maxilact enzyme 1000uL/L),
(DSM Food Specialties Inc., Menomonee, WI). Methods used by Chandan et al. (1982)
were utilized. Prior to hydrolysis, WP was pasteurized by heating to 72°C for 30 seconds
in a stainless steel container followed by cooling on ice to 35°C. Hydrolysis was
conducted at 35°C for 3 hours. WP was subsequently heated to 63°C for 30 minutes for
enzyme inactivation per manufacturer’s instructions. Samples were then immediately
cooled on ice.
The glucose concentration of hydrolyzed and (control) unhydrolyzed WP was
determined colorimetrically using a glucose oxidase kit (Randox Laboratories Ltd., San
Diego, CA, USA). At time points 0, 1.5 and 3 hours of enzyme hydrolysis, 1 mL of WP
was removed and the lactase enzyme was heat inactivated. The sample was centrifuged

69
to separate out the solids and a 1:10 dilution was made. Glucose concentration was then
determined according to manufacturer’s directions. In addition, hydrolyzed and
unhydrolyzed WP was screened by a consensus panel of 7 trained panelists to determine
if sweet taste increased after hydrolysis.
Beverage Formulation
A beverage formulation for a fruit-flavored water was designed based on a
formulation obtained from Century Foods (Century Foods International, Sparta,
Wisconsin, USA) (Table 1). Beverages with and without WP or hydrolyzed WP were
subsequently made from various percentages of deionized water and WP (0, 25/75, 50/50,
75/25, 100%). Additional ingredients were added and mixed, followed by pasteurization
(72°C, 30 sec) and subsequent cooling on ice prior to refrigeration at 5°C.
Descriptive Sensory Analysis
Descriptive analysis was approved by the University Institutional Review Board.
Eleven panelists were selected based on interest, time available, and sensitivity to basic
tastes. Each panelist (3 male, 8 female) had at least 40 hours of previous descriptive
sensory analysis training using basic tastes and the Spectrum technique. Thirteen
additional training sessions, lasting 45 minutes each, were conducted to instruct the
panelists to identify the following attributes: fruit flavor intensity, fruit aroma intensity,
brothy, dairy sour, color intensity, opacity, brightness, sweet, sour, salty, bitter,
astringency, viscosity, and carbonation (Table 2).
Samples (30 mL) of each refrigerated beverage were placed into 2oz. soufflé cups
with lids and three-digit random codes (Sweetheart Cup Co., Owings Mills, MD., USA).
One hour prior to tasting, samples were removed from the refrigerator and allowed to
70
temper to 12°C. Panelists evaluated each sample while seated in partitioned sensory
booths under white lights. Samples for determination of visual attributes were placed in
clear 5oz. cups (Sweetheart Cup Company, Chicago, IL) containing 30mL of each
sample and were placed on a white background. Visual analysis was conducted
separately. Sample order for both the flavor and the visual analyses were randomized
separately and balanced. Samples were presented monadically with ambient temperature
spring water and crackers provided to each panelist to cleanse the palate.
Fifteen commercial thirst quenching beverages (C1-C15) were selected for
descriptive analysis. Beverages included carbonated sodas, sports type beverages, fruit
juices, mineral and vitamin waters, fruit waters, fruit teas, milk-based beverages, and
bottled water. Beverages were purchased at local grocery and convenience stores. Berry
flavor was chosen for this study, as this was a common flavor. Berry-flavored WP
beverages were evaluated including a control (100% water), four beverages containing
hydrolyzed WP in concentrations of 25%, 50%, 75% and 100% (H25, H50, H75, H100),
and four beverages containing unhydrolyzed WP (U25, U50, U75, U100) in the same
percentages. Each of the drinks (24 total) was evaluated in quadruplicate by each
panelist.
Consumer Testing
Consumer testing was approved by the University Institutional Review Board.
An informed consent form listing ingredients and potential ingredients in the commercial
and WP beverages was signed by each participant prior to tasting. Faculty, staff and
students participated in the study. Based on descriptive sensory analysis results,
including examination of individual attribute means and principal component analysis,

71
thirteen beverages (7 commercial, 6 WP beverages) were selected for consumer testing.
Commercial beverages were purchased within a week of the study, and WP beverages
were made within two days of the study and stored at 5°C until the test day. Consumer
evaluations (n=100) were conducted across four different days. A constant control
bottled water was presented each day with three other beverages. The constant control
sample was used to reduce sample testing bias that could be associated with testing across
four days.
Samples (30 mL) were placed in clear 5oz. cups (Sweetheart Cup Company,
Chicago, IL) without lids as panelists arrived and served at 10°C (beverages were kept on
ice until poured). Samples were presented to consumers in balanced random order and
cups were labeled with random three-digit codes. Prior to tasting, consumers were asked
to fill out a questionnaire regarding age, gender, shopping habits, beverage consumption
habits, feelings about the “thirst-quenching” ability of particular drinks or types of drinks,
and attitudes toward different sugars. Samples were presented monadically and ambient
temperature water and crackers were given to each consumer to cleanse the palate.
Consumers were asked to evaluate each sample for overall liking, appearance liking,
overall mouthfeel liking, fruit flavor and sweetness liking, and overall thirst quenching
liking on a 9-point hedonic scale anchored on the left by “dislike extremely” and on the
right by “like extremely”. Fruit flavor and sweetness intensity as well as thirst quenching
ability were also measured on a 9-point hedonic scale anchored on the left by “low” and
on the right by “high”. At the end of the evaluation, consumers were asked to indicate
which sample they considered to be the most thirst-quenching.

72
Statistical Analysis
Statistical analysis was conducted by univariate and multivariate analysis of
variance. Analysis of variance with means separation was conducted to determine
differences between treatments. Linear relationships among descriptive and consumer
attributes were determined using correlation analysis. Principle component analysis was
conducted on descriptive and consumer data separately to assess how all treatments were
grouped. Consumer demographic data was evaluated by frequency distribution with chi
square tests. Statistical analysis was conducted using SAS, version 8.2 (Cary, NC).
Results
Physical Measurements
WP as received contained 2.15±0.23 log cfu/mL on TSA pour plates and 1.19 ±
0.02 log cfu/mL on VRBA pour plates. Pasteurized WP contained <10 cfu/mL on both
TSA and VRBA plates. Fat content of WP was <0.1% (Babcock method), and 0.018 ±
0.01% total fat (CEM Smart Trac Rapid Fat Analyzer). WP contained 260±100.4 mg/L
Calcium, 1340±509.5mg/L Potassium, 59.8±23mg/L Magnesium, 450±195.7mg/L
Sodium, 335±133.3mg/L total phosphates, and 0.175±0.095mg/L Zinc. Average total N
of WP was 424.8±126.0 mg N/L. Average total protein for WP was 2.48±1.09 g/L and
average total solids was 4.2±1.6%. Average pH of unhydrolyzed WP was 6.45±0.08,
while pH of hydrolyzed WP was 6.44±0.07.
Initial glucose content of WP was 0.8±1.0g/L of glucose. Glucose levels in WP
increased up through 3 hours of enzyme hydrolysis (Figure 1). Thereafter, glucose levels

73
remained constant (p>0.05). After three hours of hydrolysis, average glucose content
was 23.4 ±5.1g/L. Plain WP screened by a consensus sensory panel revealed an increase
in sweet taste from unhydrolyzed WP (Time 0) compared to WP evaluated after three
hours of hydrolysis. Unhydrolyzed WP had a sweetness intensity of 1.00±0.66, while
WP after three hours of hydrolysis had a sweetness intensity of 2.58±0.52. Sour and salty
tastes as well as brothy, sweet milky and cardboard flavors were not affected by
hydrolysis. However, astringency did increase from 1.25±0.35 to 2.12±0.17 (Table 8).
Beverages were designed to be similar in all aspects to commercial beverages;
therefore pH was measured across all beverages, commercial and WP. The average pH
of the commercial beverages was 3.69 ±1.27. The pH of the WP beverages rose slightly
as more permeate was added to each beverage. The control formulations made with 0%
WP had an average pH of 3.03±0.08 while the beverage formulations containing 100%
permeate had an average pH of 4.37±0.015. Hydrolysis had no effect on pH (Table 9).
Descriptive Sensory Analysis
Significant differences were observed among commercially purchased beverages
and WP beverages for flavor and visual characteristics (Table 3). All of the sensory
attributes discriminated the beverages. Correlation analysis (Table 4) revealed that fruit
flavor and fruit aroma were highly correlated with one another. Fruit flavor was also
correlated with color intensity and opacity, while opacity and color intensity were also
correlated. Brothy and dairy sour were highly correlated. Finally, sour taste and
astringency were correlated.
Principal component analysis (PCA) described a total of 80.9% of the variability
on four principal components. PC1 described 31.7% of the variability and was

74
characterized by the following attributes based on Eigenvector loadings: fruit flavor, fruit
aroma, color intensity, and opacity; while PC2 described 28.6% of the variability and was
characterized by dairy sour, brothy, bitter taste, sweet taste, and salty taste (Figure 2).
Principal components 3 and 4 described the remaining 20.6% of the variability (Figure 3).
PC3 (11.8%) was characterized by astringency and carbonation, while PC4 (8.8%) was
characterized by viscosity, sour taste and brightness. All seven WP drinks were
characterized by dairy sour and brothy notes. These flavors increased with added WP,
and hydrolysis had no effect (Table 3, Figures 1, 2). These attributes (dairy sour and
brothy) differentiated the WP beverages from the commercial beverages. WP beverages
also had salty taste, but this attribute was not unique to them. Commercial beverage C5
had higher salty taste than WP beverages (Table 3). Wide variability in aroma, flavor,
mouthfeel, and appearance was observed among the commercial beverages.
Consumer Acceptance
Demographic Data
The percentage ratio of male to female participants was 41/59%. Thirty-nine
percent of the participants fell into the 19-25y age demographic, 55% were between the
ages of 26-54 years. The remaining 6% were 55-65y. Eighty-four percent were the
major shopper for their household.
Approximately 45% of consumers reported consuming thirst quenching beverages
at least once a week. The remaining 55% consumed these types of beverages
sporadically. Panelists were asked to rate the three most thirst quenching drinks, 1 being
the most thirst quenching and 3 the least, out of a list of 16 various commercial beverages.
Sixty-four percent of the consumers responded that water was the most thirst quenching

75
beverage. Gatorade™ was a distant second with 18% scoring it as the most thirst
quenching beverage. Other top responses included soda/pop (4%), milk (3%), Powerade
(3%), and fruit juice (3%). Consumers were also asked which flavors (fruit punch, grape,
berry, citrus, no flavor/water) they felt were the most thirst quenching. One hundred
percent of polled consumers replied that no flavor/water was the most thirst quenching,
while 96-99% also responded that the other flavors listed were also thirst quenching.
When asked to report when consumers drink thirst quenching beverages, the most
popular answers were “whenever I am thirsty” (46%) and “after exercise” (34%).
“During exercise” and “before exercise” accounted for only 11% of the responses, while
“with meals” and “with a snack” accounted for the remaining 9%. Consumers reported
that they consumed thirst quenching beverages primarily because they alleviate thirst
(99%), have good flavor (98%), help to rehydrate the individual (99%), and are generally
healthy (100%). Improved performance was slightly less of a motive for consumption
(93.5%). Finally, all factors, price, flavor, health (99%), availability and color (100%)
influenced consumers’ choice of thirst quenching beverages.
Consumers were also asked about their perceptions/feelings about different sugars
by responding to the statement “lactose is a healthy sugar”, where the word lactose was
replaced with glucose, sucrose and fructose in each of four questions. Results were
similar for lactose, glucose and fructose, with 44-50% agreeing with the statement, 36-
38% neither agreeing nor disagreeing, and 5-7.5% disagreeing (Table 5). Consumer
attitudes were more neutral for sucrose (p<0.05). Only 29% of consumers agreed that
sucrose was a healthy sugar, while 45% neither agreed nor disagreed, and 19% disagreed
with the statement that sucrose is a healthy sugar.

76
Consumer Acceptance
Water was by far the most liked beverage (Table 6, “overall liking”). Water was
followed by C9, C5, C3, and C6 as the next most preferred beverages (average
acceptance scores 6.63-6.35). The commercial beverage C12 along with the control
experimental formulation, U25, U50, and H50 were scored in the “neither like nor
dislike” category (range 5.92-5.08). The remaining beverages H75, U100 and C10, all
scored values corresponding to “dislike” (range 3.67-3.26).
Consumers noted differences among the commercial beverages in fruit flavor
intensity, sweet taste intensity, and thirst quenching ability. Commercial beverages also
varied in appearance, mouthfeel, fruit flavor, sweet taste, overall liking, and thirst
quenching liking. In particular, C3, which was an opaque beverage, scored the lowest
appearance liking scores. Beverage C10 was the only carbonated beverage and it scored
the lowest scores for thirst quenching ability. WP beverages were scored by consumers
as high in sweet taste intensity, but these drinks were rated low in sweetness liking.
These results indicated that the drinks were too sweet, an observation that is supported by
written comments by consumers, 19% of whom wrote “too sweet”.
Correlation analysis (Table 7) revealed that overall liking was positively
correlated to mouthfeel liking, sweetness liking, fruit flavor liking and to thirst-quenching
ability and liking. Sweetness intensity was highly correlated only to fruit flavor intensity
and was inversely correlated with thirst-quenching ability and liking. Therefore, drinks
with higher sweet scores were considered to be less thirst quenching. Sweetness liking
was correlated with overall liking, mouthfeel liking, fruit flavor liking, and thirst-
quenching liking and ability. Fruit flavor intensity was highly correlated with sweetness
77
intensity and fruit flavor liking but was inversely related to thirst-quenching ability and
liking. These results suggest that although consumers liked the high intensities of fruit
flavor, they did not perceive these drinks as thirst-quenching. Most importantly, thirst-
quenching ability and liking were highly correlated to overall liking, mouthfeel liking,
and sweetness liking. In general, it was determined that consumers felt that the most
thirst quenching beverages were less sweet and had lower fruit flavor intensities.
Principal component analysis was conducted to determine relationships between
products and attributes. Results confirm those observed by univariate analysis (Figure 3,
Table 6). Seventy-five percent of the variability was explained on the first two
components. PC1 explained 51.9% of the variability and was characterized by overall
liking, appearance liking, mouthfeel liking, sweet liking, fruit flavor liking, thirst
quenching ability, and thirst quenching liking, while PC2 described 22.7% of the
variability and was characterized by the following attributes: sweet intensity and fruit
flavor intensity. Beverage C10 was negatively associated with all attributes. Water was
highly associated with thirst-quenching ability and liking, appearance liking, mouthfeel
liking and overall liking. Commercial beverages C6, C5, and C9 were all associated with
fruit flavor intensity, fruit flavor liking, sweet liking, and to a lesser extent overall liking
and mouthfeel liking. All WP drinks were characterized by sweet intensity, while U25,
U50, and H25 were also characterized by fruit flavor intensity. These drinks were
negatively associated with appearance liking and thirst-quenching ability and liking.
Results indicate that there was an obvious gap between WP beverages containing 50% or
less WP and those containing 75% or more WP (Figure 3). Those beverages containing
lower amounts (25% and 50%) of WP exhibited higher overall liking scores and were
78
ranked closer to commercial beverages than those WP beverages containing 75% or more
WP.
Consumers’ overall choice for the most thirst-quenching beverage was bottled
water (25%). Commercial fruit flavored beverages followed, in the order of C5 (15%),
C6 (11%) and C12 (9%). The control formulation (8%) and C9 (6%) subsequently
followed. U25, U50, and H50 (5% each) were found to be equally preferred.
Commercial beverage C3 (4%), H75 (3%), U100 and C10 (2% each) were the least
preferred by consumers. Since C3 was a milk-containing fruit drink, it is interesting that
the overall thirst-quenching preference for this drink was similar to the permeate-
containing beverages.
Discussion
Proximate analysis results for protein, fat, lactose, calcium, and potassium content
of WP were within ranges published by the United States Dairy Export Council (2002).
However, values for phosphorous, sodium and magnesium were above the published
ranges. These differences may be due to differences in milk source or cheese type. All
values for mineral content were above levels present in typical electrolyte beverages such
as Gatorade™. The high level of sodium could account for the salty taste encountered in
both plain WP and WP beverages. Geilman et al. (1992) also reported high salty taste in
formulated milk permeate (MP) beverages, however they did not investigate dilution of
permeate prior to incorporation into a beverage. Although minimal sensory analysis was
conducted by Geilman et al. (1992), the focus in their study, which utilized no formal
descriptive analysis and limited consumer analysis (n=45), was on heat stable and heat

79
developed flavors following UHT heat treatments. Removal or reduction of sodium or
potassium in WP via anion exchange or nanofiltration may be necessary to reduce salty
tastes. Additionally, the use of alternative flavorings or masking agents could cover
unwanted brothy or dairy sour flavors present in WP beverages.
Johnson et al. (1983) evaluated the relationship between perceived sweetness
intensity, flavor intensity, and color intensity in strawberry-flavored drinks. Johnson et al.
(1983) reported that colored solutions were perceived to have more intense flavors than
their colorless counterparts. Also, darker colored beverages are perceived to have
stronger flavors than lighter colored beverages. These findings were supported by studies
conducted by Bayarri et al. (2001) who determined that color enhanced the perception of
sweet taste in orange-flavored drinks and enhanced the perceived intensity of flavors in
peach-, kiwi-, orange- and berry-flavored drinks. However, the intensity of this effect is
dependent upon the product type and upon the consumers’ expectation (Bayarri et al.,
2001). In our results, as the amount of WP added to beverages increased, the color
intensity scores decreased on average. The fruit flavor intensity scores also dropped as
more WP was added (Table 3). Therefore the same correlation was found in our study as
in the study by Johnson et al. (1983). In addition, Johnson et al. (1983) reported that
increases in color intensity result in a higher level of perceived sweetness in cherry,
strawberry and raspberry flavored drinks. Therefore, we looked at the color intensity
scores from descriptive analysis results and compared them with the perceived sweet
intensities of beverages determined by consumer analysis. The control formulation was
clear and light-blue in color with a color intensity score of 3.08 and a perceived sweet
intensity of 6.61. H75 was more greenish in color, scoring 2.3 in color intensity and had

80
a sweet intensity of 6.94. Unhydrolyzed WP beverage U100 was very green in color with
an average color intensity score of 2.68, and an average perceived sweet intensity of 7.14
(Tables 3, 6). Therefore, the color intensity of our WP beverages was inversely related to
the sweet intensity.
Zellner and Durlach (2002) used a six-part questionnaire to probe consumer
attitudes of thirst-quenching beverages. Their study determined that temperature,
sweetness, and color were major factors influencing thirst quenching ability or
refreshingness of a beverage. Temperature was by far the most important factor. Cold
temperature drinks were viewed as thirst quenching by 92% of those polled. The second
most common response was sweet taste (unspecified sweetness level), which influenced
50% of the consumers. Color was important to 24% of the consumers polled.
Consumers felt that thirst quenching beverages were typically clear, red, orange, yellow
or white. Unlikely refreshing colors included black, brown, green, gray and purple
(Zellner and Durlach, 2002). Twelve percent of consumers in our study wrote that the
blue color of the WP beverages was an odd color for a drink and that they would not
choose this color for a beverage. Zellner and Durlach (2002) reported that citrus and
vanilla flavors were the most refreshing. Orange, strawberry, and lemon flavors are all
citrus flavors and these correspond to the refreshing colors of orange, red, and yellow.
Strawberry, the second most thirst quenching flavor (Zellner and Durlach, 2002), is a
member of the berry flavor family. The choice to use berry flavored drinks was therefore
a wise decision, since most consumers are familiar with berry flavors and also feel that
they are highly refreshing.

81
Sweetness is a determinant of thirst quenching liking and amount of beverage
consumption. The presence of flavor and sweetness in a thirst quenching beverage has
been shown to increase consumption in exercising individuals (Passe et al., 2000). The
addition of flavor and sweet taste to water was preferred over plain water in these same
individuals (Passe et al., 2000). Scientists designing beverages for exercising individuals
should note that the perceived intensity of sweet taste increases during an exercise bout
and may therefore result in a decreased consumption if the perceived sweet taste intensity
is too high. Overall liking also directly influences voluntary intake of a beverage (Passe
et al., 2000). A study by Cohen (1998) found a statistical difference in hedonic liking
scores of carbohydrate-electrolyte drinks (CED) containing 6% and 8% carbohydrate.
The 8% CED drink scored 6.2±2.2, while the 6% CED scored 7.1±1.4 on a 9-point
hedonic scale for overall beverage liking indicating that higher sweetness intensity was
undesirable for thirst-quenching beverages (Cohen, 1998). In the present study, WP
beverages contained varying amounts of carbohydrate depending on the amount of WP
added. As more WP was added to the beverages, and therefore more carbohydrate was
added, hedonic liking scores dropped from 5.92 for the control formulation to 5.71 for
U25, 5.08 and 5.25 for H50 and U50 respectively and finally to 3.67 for both H75 and
U100. Sweet liking scores also dropped from 6.19 to 5.87, 5.25, 5.42, 4.21, and 4.48 for
the following beverages: control, U25, H50, U50, H75, and U100 respectively (Table 6).
Therefore, the addition of more WP and consequently more carbohydrate to the
beverages resulted in decreasing average perceived sweet liking and decreased overall
liking scores in agreement with the results presented by Cohen (1998).

82
A study by McEwan and Colwill (1996) reported that there were seven attributes
which consumers reported as being the most important in influencing the thirst-
quenching characteristics of beverages: acid, astringent, carbonation, fruity, strength of
flavor, sweetness, and thickness. Acid was most associated with thirst-quenching, while
sweetness and thickness were least associated (McEwan and Colwill, 1996) In our study,
sweet liking was correlated with overall liking and to thirst quenching liking, however
sweet intensity was not, confirming observations from these previous studies. Future
studies should investigate whether a substitute sweetener could be utilized or simply a
lower amount of sweetener could be incorporated into the WP beverages to increase
acceptance scores.
Descriptive analysis results of all commercial and WP beverages revealed two
important facts. Firstly, the control formulation was an accurate formulation given its
centralized location among commercial beverages on the principle component plot
(Figure 1, Figure 2). Secondly, the addition of WP to the control formulation resulted in
drinks more unlike commercial beverages. This conclusion is strengthened by the
finding that the greater the amount of WP added to the formulation, the farther the WP
beverages plotted from the commercial beverages on both descriptive and consumer
acceptability PCA plots (Figures 2-4). Therefore, the greater the percentage of WP added
to the beverage, the less like commercial thirst quenching beverages it became. WP
beverages plotted in a grouping distinct from commercial beverages, while the control
formulation plotted closely to the commercial beverages. This suggests that a thirst-
quenching beverage may not be an ideal application for the infiltration of whey permeate
83
into the food market. It was also noted that the more WP added, the less preferred and
accepted they were by consumers.
The primary solid component of liquid or spray dried WP is lactose. Hydrolysis
of lactose produces glucose and galactose which are much sweeter than lactose alone.
Plain hydrolyzed WP was sweeter than unhydrolyzed WP via descriptive analysis. When
incorporated into the beverage formulation with fructose, there were no statistical
differences in sweet taste via descriptive analysis between WP beverages containing
hydrolyzed or unhydrolyzed lactose. Geilman et al. (1992) did not evaluate the effect of
lactose hydrolysis on consumer acceptability, only a hydrolyzed beverage was produced.
However, lactose hydrolysis did not affect acceptability of our WP beverages. Consumer
perceptions of various sugars also indicated that lactose was not perceived in a negative
fashion compared to other sugars such as glucose, sucrose, and fructose. Since lactose
hydrolysis is expensive and time-consuming, results suggest that the hydrolysis step can
be omitted without any negative effect.
Conclusions
Descriptive analysis revealed differences among all commercial and WP
beverages. Only WP beverages exhibited brothy and dairy-sour flavors, and the intensity
of these attributes was directly related to the percentage of WP added. WP beverages
were also characterized by salty taste; however, commercial beverage C5 had higher salty
taste than any of the WP beverages. Consumer acceptability scores for WP beverages
containing 25% and 50% WP were higher than those containing 75% and 100% WP.
Beverages containing 25% or 50% WP were within acceptance scores of commercial

84
beverages. WP in lower concentrations may be successfully incorporated into a beverage
application. However, this may not result in a thirst-quenching beverage, but instead in a
beverage designed to induce health benefits and not necessarily desired for its flavor
attributes. Other applications should be attempted such as incorporation into a drinkable
yogurt. Due to the presence of dairy sour and brothy flavors in both the whey permeate
and in the yogurt, the whey permeate may not have any negative impact on the flavor or
acceptability of the yogurt.

85
Figures and Tables
Table 1: Beverage Formulation Based on a 1 Liter beverage INGREDIENT AMOUNT SOURCE
Water/permeate (986mL = 100%) 0%, 25%, 50%, 75%, 100% (Tulare, CA)
Fructose 70g A.E. Staley Manufacturing Co. (Decatur, IL)
Blue Raspberry Flavor* 0.5mL
Mother Murphy's Laboratories, Inc. (Greensboro, NC)
Blue Raspberry Flavor* 0.5mL
Flachsmann (Brampton, Ontario Canada)
Citric Acid 3g Cargill Foods, Inc. (Eddyville, IA)
Trisodium Phosphate 0.5g Astaris (Webster Groves, MO)
Sodium Benzoate 0.7g Cargill Foods, Inc. (Eddyville, IA)
Vitamin C* 80mg Roche Vitamins Inc. (Belvidere, NJ)
Pantothenic Acid* 5mg Roche Vitamins Inc. (Belvidere, NJ)
Vitamin B6* 0.3mg Roche Vitamins Inc. (Belvidere, NJ)
Niacin* 15mg Roche Vitamins Inc. (Belvidere, NJ)
*These items were added after pasteurization and cooling

86
Table 2: Preparation of reference materials for descriptive sensory analysis of thirst-
quenching beverages
Attribute Definition Reference Fruit Aroma Aromatics associated with
different fruits evaluated orthonasally
Grape Juice = 7 Green Gatorade = 4.5
Fruit Flavor Aromatics associated with different fruits evaluated retronasally
Grape Juice = 7.5 Green Gatorade = 4
Brothy Aromatics associated with boiled meat or vegetable soup stock
Canned potatoes Wylers low sodium beef broth cubes
Dairy Sour Aromatics associated with fermented yogurt
Plain yogurt
Sweeta Taste sensation associated with sugar
10% and 5% sucrose in water
Soura Taste sensation associated with citric acid
0.05% and 0.08% citric acid in water
Saltya Taste sensation associated with NaCl
0.3% and 0.5% NaCl in water
Bittera Taste sensation associated with caffeine
0.05% and 0.08% caffeine in water
Astringencya Shrinking, drawing or puckering of the oral epithelium as a result of exposure to substances such as alum or tannins
Grape Juice = 7 Tea Solution (6 tea bags soaked in 1 quart hot water for 1 hour)
Viscosity Force required to move a spoon back and forth in product
Water = 1 Cream = 3
Carbonation Presence of carbon dioxide bubbles in a beverage
Soda water, seltzer water
Opacity The degree to which a liquid is opaque
Whole Milk = 15 Grape Juice =12 Green Gatorade = 3
Color Intensity The intensity or strength of a color from light to dark
Grape Juice = 13 Juice Tea = 6.5 Green Gatorade = 4
Brightness The chroma or purity of the color, ranging from dull/muddied to pure/bright color
Juice tea = 6 Grape juice = 4 Green Gatorade = 12
a Definitions and references taken from Meilgaard et al., 1999

87
Table 3: Mean values of descriptive attributes for commercial and WP beverages
Drink C1 C2 C3 C4 C5 C6 C7 C8 C9 C10 C11 C12 C13 C14 C15 Control H25 H50 H75 H100 U25 U50 U75 U100 LSD
Fruit Aroma
4.80 3.71 6.84 4.12 4.55 5.47 0.06 3.77 4.65 3.07 5.13 3.38 3.43 3.87 2.98 4.50 3.70 3.14 2.77 2.65 4.34 3.20 2.90 3.40 0.82
Fruit Flavor 3.49 3.19 6.51 4.54 3.19 3.75 0.12 4.86 7.5 1.26 3.56 3.76 3.77 3.93 3.55 3.66 3.38 2.80 2.50 2.36 3.45 2.90 2.58 3.26 0.67
Brothy 0.00 0.00 0.00 0.00 0.00 0.00 0.00 0.00 0.00 0.00 0.00 0.00 0.00 0.00 0.00 0.04 0.43 0.90 1.48 1.36 0.28 0.75 1.00 0.41 0.18
Dairy Sour 0.00 0.00 0.00 0.00 0.00 0.00 0.00 0.00 0.00 0.00 0.00 0.00 0.00 0.00 0.00 0.33 1.00 1.86 2.50 2.40 0.83 1.74 1.80 1.13 0.22
Sweet 9.37 4.94 8.93 6.3 4.37 4.60 0.14 8.78 5.84 0.87 5.07 5.73 6.37 6.42 6.07 6.9 7.4 7.80 7.90 7.60 7.56 7.30 7.60 7.45 0.78
Salty 0.32 0.35 0.14 0.32 2.04 0.34 0.02 0.25 0.18 0.57 0.33 0.23 0.28 0.25 0.16 0.13 0.5 1.15 1.55 1.30 0.35 0.90 1.08 0.58 0.30
Bitter 0.31 0.51 0.06 0.33 0.15 0.34 0.28 0.14 0.40 1.22 0.34 0.76 0.57 0.66 1.02 0.00 0.00 0.00 0.00 0.00 0.00 0.00 0.00 0.00 0.31
Sour 2.27 6.43 2.43 4.25 5.48 5.68 0.03 3.80 6.94 3.02 4.06 4.67 4.98 4.71 4.41 4.77 4.2 4.00 3.90 3.75 4.40 3.99 3.65 3.88 0.80
Viscosity 1.18 1.10 1.58 1.32 1.10 1.00 0.98 1.11 1.33 1.04 1.06 1.15 1.14 1.13 1.02 1.00 1.18 1.30 1.45 1.46 1.13 1.30 1.28 1.23 0.16
Astringency 1.54 3.40 1.53 2.47 2.76 2.88 0.35 2.04 6.58 2.01 1.84 4.14 4.04 4.17 2.04 2.9 2.46 2.30 2.40 2.40 2.50 2.28 2.18 2.46 0.62
Carbonation 9.99 0.06 0.00 6.97 0.00 0.02 0.00 0.02 0.00 9.57 0.00 0.20 0.00 0.00 0.00 0.00 0.00 0.00 0.00 0.00 0.00 0.00 0.00 0.00 0.43
Opacity 2.87 4.13 11.66 3.54 3.34 0.00 0.00 3.25 12.07 0.00 3.43 9.10 5.96 6.5 0.00 2.55 2.7 2.80 3.50 4.20 2.80 2.80 2.90 4.05 0.48
Color Intensity
4.29 3.40 5.56 5.11 4.98 0.00 0.10 4.30 13.03 0.00 4.11 9.76 6.56 6.81 0.00 3.08 2.9 2.40 2.30 2.50 2.80 2.60 2.50 2.68 0.56
Brightness 11.71 8.48 3.99 7.25 12.03 0.00 0.15 11.82 3.98 0.00 8.73 5.07 6.00 5.35 0.00 9.23 8.4 8.30 7.00 6.20 8.48 8.37 7.90 6.46 0.74
1. Attributes were scored on a 15 point numerical scale where 0=absence of attribute and 15=very high intensity of the attribute. 2. LSD = least significant difference p<0.05. 3. C1-C15 represent commercial beverages. Control = experimental beverages formulation made with 100% water. H25-H100 = beverages made with hydrolyzed whey permeate substituted for 25, 50, 75 or 100% of water respectively. U25-U100 = beverages made with unhydrolyzed whey permeate substituted for 25, 50, 75 or 100% of water respectively.

88
Table 4: Correlations between descriptive sensory attributes used to profile thirst-quenching beverages
Fruit Aroma Fruit Flavor Dairy Sour Brothy Sweet Sour Salty Bitter Astringency Viscosity Carbonation Opacity Color Intensity Brightness Fruit Aroma 0.74 -0.35 -0.36 0.44 0.26 -0.17 -0.06 0.19 0.25 0.05 0.45 0.34 0.22 Fruit Flavor -0.33 -0.33 0.50 0.37 -0.32 -0.07 0.53 0.30 -0.15 0.69 0.71 0.13 Dairy Sour 0.98 0.34 -0.02 0.65 -0.59 -0.12 0.19 -0.24 -0.18 -0.29 0.21 Brothy 0.32 -0.03 0.68 -0.53 -0.12 0.22 -0.19 -0.16 -0.26 0.18 Sweet -0.01 0.07 -0.58 0.00 0.54 -0.15 0.42 0.22 0.54 Sour 0.16 0.09 0.79 -0.42 -0.22 -0.04 0.37 0.16 Salty -0.34 -0.05 0.05 -0.09 -0.22 -0.17 0.36 Bitter 0.28 -0.26 0.46 0.02 0.18 -0.47 Astringency -0.14 -0.19 0.38 0.75 0.00 Viscosity -0.10 0.71 0.17 0.05 Carbonation -0.22 -0.10 -0.01 Opacity 0.74 0.04 Color Intensity 0.22 Brightness 0.22
Numbers in bold represent significant correlations (p<.0001)
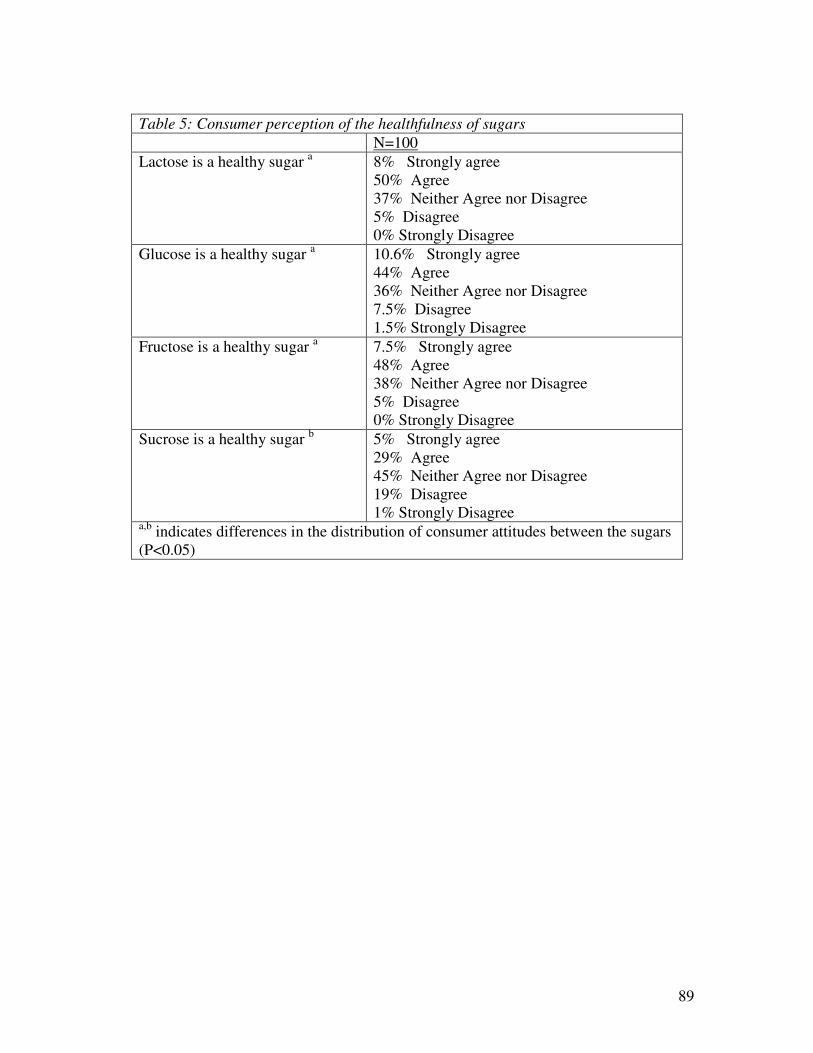
89
Table 5: Consumer perception of the healthfulness of sugars N=100 Lactose is a healthy sugar a 8% Strongly agree
50% Agree 37% Neither Agree nor Disagree 5% Disagree 0% Strongly Disagree
Glucose is a healthy sugar a 10.6% Strongly agree 44% Agree 36% Neither Agree nor Disagree 7.5% Disagree 1.5% Strongly Disagree
Fructose is a healthy sugar a 7.5% Strongly agree 48% Agree 38% Neither Agree nor Disagree 5% Disagree 0% Strongly Disagree
Sucrose is a healthy sugar b 5% Strongly agree 29% Agree 45% Neither Agree nor Disagree 19% Disagree 1% Strongly Disagree
a,b indicates differences in the distribution of consumer attitudes between the sugars (P<0.05)

90

91
Table 6: Mean values of consumer acceptance of commercial and WP beverages
C3 C5 C6 C9 C10 C12 Control U25 U50 H50 H75 U100 Water LSD
Overall Liking 6.39 6.44 6.35 6.63 3.26 5.72 5.92 5.71 5.25 5.08 3.67 3.67 7.48 0.57
Appearance Liking 3.92 6.75 7.40 7.04 6.53 7.06 7.10 7.02 5.61 6.19 5.40 6.25 7.71 0.57
Mouthfeel Liking 6.47 6.96 7.06 6.66 4.37 6.49 6.80 6.35 5.84 6.13 4.86 5.44 7.57 0.56
Fruit Flavor Intensity 6.73 6.35 5.84 8.15 2.60 6.96 6.08 6.54 6.44 6.18 5.68 5.81 1.29 0.48
Fruit Flavor Liking 6.50 6.30 6.23 7.46 2.71 6.21 5.75 5.35 5.55 5.29 4.00 4.50 5.22 0.47
Sweet Intensity 6.95 6.42 6.20 6.34 2.33 5.63 6.61 7.17 7.43 7.23 6.94 7.14 1.51 0.62
Sweet liking 6.47 6.51 6.12 6.64 3.16 6.02 6.19 5.87 5.42 5.25 4.21 4.48 5.90 0.62
Thirst Quenching Ability 5.70 6.44 6.31 5.55 3.82 5.59 6.18 5.70 5.47 5.35 4.06 4.74 8.04 0.59
Thirst Quenching Liking 5.71 6.44 6.22 5.50 3.43 5.52 6.01 5.52 5.29 4.98 3.79 4.29 7.93 0.60
1. Attributes were scored on a 9 point hedonic scale where 0=absence of attribute or dislike extremely and 9=very high intensity of the attribute or like extremely. 2. LSD = least significant difference p<0.05. 3. C3, C5, C6, C9, C10, C12 are commercial beverages. Control is experimental beverages made with no WP. U25, U50, U100 are beverages made with 25, 50 or 100% unhydrolyzed WP and H50 and H75 are beverages made with 50 or 75% hydrolyzed WP respectively.

92
Table 7: Correlations between consumer acceptance of thirst-quenching beverage attributes
Appearance Liking
Mouthfeel Liking
Sweet Intensity
Sweet liking
Fruit Flavor Intensity
Fruit Flavor Liking
Thirst Quenching Ability
Thirst Quenching Liking
Overall Liking 0.32 0.96 -0.09 0.91 0.1 0.80 0.91 0.94
Appearance Liking 0.4 -0.42 0.16 -0.26 0.08 .45 .44
Mouthfeel Liking -0.03 0.89 0.10 0.77 0.94 0.95
Sweet Intensity 0.27 0.87 0.38 -0.25 -0.23
Sweet liking 0.48 0.95 0.73 0.78
Fruit Flavor Intensity 0.64 -0.19 -0.14
Fruit Flavor Liking 0.56 0.61
Thirst Quenching Ability 0.99
Numbers in bold represent significant correlations (p<0.002)

93
Table 8: Sensory attribute of WP before and after hydrolysis
Before Hydrolysis Sweet Sour Salty Brothy Sweet Milky Cardboard Astringency Average 1.00b 0.25a 1.00a 1.00a 1.66a 0.58a 1.25b Standard Deviation 0.66 0.25 0.90 0.66 0.80 0.52 0.35 After Hydrolysis Sweet Sour Salty Brothy Sweet Milky Cardboard Astringency Average 2.58a 0.58a 1.39a 1.04a 2.00a 0.89a 2.12a Standard Deviation 0.38 0.52 0.72 0.85 0.66 0.78 0.17
Numbers in a column followed by different letters are significantly different p<0.05

94
Table 9: pH of Commercial and WP Beverages
Beverage Average pH Standard Deviation
C1 3.21 0.01 C2 2.79 0.01 C3 3.01 0.00 C4 3.32 0.01 C5 2.97 0.02 C6 3.09 0.01 C7 6.69 0.00 C8 2.78 0.01 C9 3.39 0.01 C10 4.15 0.02 C11 3.05 0.01 C12 3.21 0.00 C13 3.35 0.00 C14 3.34 0.00 C15 3.44 0.00 Control 3.03 0.08 H25 3.93 0.02 H50 4.01 0.02 H75 4.15 0.03 H100 4.37 0.01 U25 3.96 0.03 U50 3.93 0.01 U75 4.09 0.05 U100 4.20 0.01

95
Figure 1: Lactose hydrolysis and glucose determination over time
Lactose Hydrolysis and Glucose Determination
-10
0
10
20
30
40
0 1 2 3 4 5 6 7
Time (hours)
g [g
luco
se]/L
3 hours determined to be optimum hydrolysis in minimal time. Estimated 90-100% hydrolysis of lactose (based on liberation of glucose) in 3 hours.

96
Figure 2: Principal component bi-plot of descriptive analysis of thirst-quenching beverages
*C1-C15 are commercial beverages: C1, C4, C10 are carbonated; C6, C15 are flavored fruit waters; C7 is plain bottled water; C2, C11, C14 are vitamin enhanced fruit drinks; C12, C13 are juice teas; C8, C9 are fruit juices; C5 is a leading sports drink; C3 is a milk containing fruit beverage.
**U means unhydrolyzed WP beverage, followed by value which is the percentage of WP added, example U25 ***H means hydrolyzed WP beverage, followed by value which is the percentage of WP added, example H25 ��PC stands for principal component���Percentage following PC in parenthesis explains amount of variability depicted by each principal component on each axis
Fruit Aroma
Brothy Salty
Bitter
C7
C9
C10
C15 U-25 H-25
C5
H-100
Fruit Flavor
Dairy Sour
Sweet Sour
Astringency
Viscosity
Carbonation
Opacity Color Intensity
Brightness C2
C3
C4
C6 C11
C12
C13 C14
H-75 U-75 U-100
C1
Control
H-50
U-50
C8
PC2 (28.6%)
PC1 (31.7%
)

97
Figure 3: Principal component bi-plot of descriptive analysis of thirst-quenching beverages (PC3&4)
*C1-C15 are commercial beverages: C1, C4, C10 are carbonated; C6, C15 are flavored fruit waters; C7 is plain bottled water; C2, C11, C14 are vitamin enhanced fruit drinks; C12, C13 are juice teas; C8, C9 are fruit juices; C5 is a leading sports drink; C3 is a milk containing fruit beverage.
**U means unhydrolyzed WP beverage, followed by value which is the percentage of WP added, example U25 ***H means hydrolyzed WP beverage, followed by value which is the percentage of WP added, example H25 ��PC stands for principal component���Percentage following PC in parenthesis explains amount of variability depicted by each principal component on each axis
Fruit Aroma
Fruit Flavor
Sweet
Sour
Salty
Bitter
Astringency
Viscosity
Carbonation Opacity
Brightness
C1
C8
H-25
H-100
U-25
Dairy Sour Brothy Color Intensity
C2
C3
C4
C5
C6 C7
C9
C10
C11
C15
C12
C13
C14
Control
H-50
H-75
U-50 U-75
U-100
PC3 (11.8%
)
PC4 (8.8%)

98
Figure 4: Internal preference map of consumer perception of thirst-quenching beverages (PC1&2)
*C3, C5, C6, C8, C10,and C12 are commercial beverages: C10 is carbonated; C6 is a flavored fruit water; C12 is a juice tea; C9 is a fruit juice; C5 is a leading sports drink; C3 is a milk containing fruit beverage. **U means unhydrolyzed WP beverage, followed by value which is the percentage of WP added, example U25 ***H means hydrolyzed WP beverage, followed by value which is the percentage of WP added, example H25 ��PC stands for principal component���Percentage following PC in parenthesis explains amount of variability depicted by each principal component on each axis
C10
C3
H75
U50
U100
Water
Overall Liking
Appearance Liking
Mouthfeel Liking
Sweet Intensity
Sweet Liking
Fruit Flavor Intensity
Fruit Flavor Liking
Thirst Quenching Ability
Thirst Quenching Liking
C9
C12 C5
C6
Control
H50 U25
PC2 22.7%
PC1 (51.9%
)

99
References
Al-Eid, S. M.; A. A. Al-Neshawy; S. S. Al-Shaikh Ahmad. 1999. Influence of substituting water with ultrafiltered milk permeate on dough properties and baking quality of white pan bread. Journal of Cereal Science. Vol. 30. p. 79-82. Anonymous. 2001. Do it with dairy. DMI. Whey. p. 1-3. www.doitwithdairy.com/infolib/ingspecsheet/factwhey.htm Atherton, HV and Newlander, JA. 1977. Chemistry and Testing of Dairy Products. Westport, CT: AVI Publ. Co. p71-116. Bayarri, S., C. Calvo, E. Costello and L. Duran. 2001. Influence of color on perception of sweetness and fruit flavor of fruit drinks. Food Science Technology International. 2001; 7(5):399-404. Casper, J. L.; W. L. Wendorff; D. L. Thomas. 1999. Functional properties of whey proteins concentrates from caprine and ovine specialty cheese wheys. Journal of Dairy Science. Vol. 82. p. 265-271. Chandan, R. C.; M. A. Uebersax; M.J. Saylock. 1982. Utilization of cheese whey permeate in canned beans and plums. Journal of Food Science. Vol. 47. p. 1649-1653. Cohen, J. 1988. Statistical power analysis for the behavioral sciences. Hillsdale, NJ: Lawrence Erlbaum Associates.
Drake, M.A.; Karagul-Yuceer, Y.; Cadwallader, K.R.; Civille, G.V. and Tong, P.S. 2003. Determination of the sensory attributes of dried milk powders and dairy ingredients. Journal of Sensory Stud. Vol. 18:3 199.
Fitzpatrick, J. J., M. Ahrens, S. Smith. 2001. Effect of manganese on Lactobacillus casei fermentation to produce lactic acid from whey permeate. Process Biochemistry. Vol. 36(7) p. 671-675. Fitzpatrick, J. J. and U. O’Keeffe. 2001. Influence of whey protein hydrolysate addition to whey permeate batch fermentations for producing lactic acid. Process Biochemistry. Vol. 37(2) p. 183-186. Frank, Paula. 2001. “Finding the Whey”. p. 1-3. www.legacy-meadowfresh.com/Finding_The_Whey.html Excerpt from Food Procesing.
100
Gassem, M. A., K. A. Schmidt; J. F. Frank. 1997. Exopolysaccharide production from whey lactose by fermentation with Lactobacillus delbrueckii ssp. bulgaricus. Journal of Food Science. Vol. 62(1). p. 171-173, 207. Geilman, W. G.; D. Schmidt; C. Herfurth-Kennedy; J. Path, J. Cullor. 1992. Production of an electrolyte beverage from milk permeate. Journal of Dairy Science. Vol. 75. p. 2364-2369. Hardham, J. F. 1998. Effect of protein standardization of milk by addition of UF milk permeate on the composition and storage stability of UHT processed milk. The Australian Journal of Dairy Technology. Vol. 53, p. 22-27. Huffman, L. M. 1996. Processing whey protein for use as a food ingredient. Food Technology. Vol. 50 p. 49-52. Johnson, L.J., E. Dzendolet, F.M. Clydesdale. 1983. Psychophysical relationship between sweetness and redness in strawberry-flavored drinks. Journal of Food Protection. Vol. 46, p.21-25. Macedo, M. G.; C. Lacroix; C. P. Champagne. 2002. Combined effects of temperature and medium composition on exopolysaccharide production by Lactobacillus rhamnosus RW-9595M in a whey permeate based medium. Biotechnology Progress. Vol. 18(2). p. 167-173. Marshall, R.T. 1992. Standard Methods for the Examination of Dairy Products. 16th edition. American Public Health Association. Washington, DC. Chapter 15 p. 433-516. Meilegaard M., Civille GV., Carr, BT. 1999. Descriptive analysis techniques. In: Meilegaard M, Civille GV, Carr BT, editors. Sensory Evaluation Techniques. 3rd Ed. Boca Raton, FL : CRC Press. p 173-83. McEwan, J.A. and J.S. Colwill. 1996. The sensory assessment of the thirst-quenching characteristics of drinks. Food Quality and Preference. Vol. 7(2) p. 101-111. Passe, D.H., M. Horn, R. Murray. 2000. Impact of beverage acceptability on fluid intake during exercise. Appetite. Vol. 35 p. 219-229. Rodwan, Jr., J. G. 2001. The next new thing: nutrient-enhanced & functional beverages in the U.S. The World of Food Ingredients. Vol. 11 p. 48,50, 52-53. Rustom, I. Y. S.; M. I. Foda; M. H. Lopez-Leiva. 1998. Formation of oligosaccharides from whey UF-permeate by enzymatic hydrolysis - analysis of factors. Food Chemistry. Vol. 62(2). p. 141-147. Smithers, G. W.; F. J. Ballard; A. D. Copeland; K. J. De Silva; D. A. Dionysius; G. L. Francis; C. Godard; P. A. Griece; G. H. McIntosh; I. R. Mitchell; R. J. Pearce; G. O.

101
Regester. 1996. New oportunities from the isolation and utilization of whey proteins. symposium: advances in dairy foods processing and engineering. Journal of Dairy Science. Vol. 79. p 1454-1459. Talabardon, M.; J. Schwitzguebel; P. Peringer. 2000. Anaerobic thermophilic fermentation for acetic acid production from milk permeate. Journal of Biotechnology. Vol. 76. p 83-92. Tweedie, L.S. and MacBean, R.D. 1978. The effect of partial replacement of sucrose by hydrolyzed whey lactose on the quality of canned peaches and pears. Food technology. Australia. 12(4): 128. USDA. 2004. www.nal.usda.gov/fnic/foodcomp/cgi-bin/list_nut_edit.pl USDEC. 2000. Reference Manual for U.S. Whey and Lactose Products. U.S. Dairy Export Council, Arlington, VA. Williams, L. A. Oct./Nov. 2001. Trend setting drinks: The new developments and trends that will be shaping their industry in the years to come. The World of Food Ingredients. p. 45-48, 50, 52. Zellner, D.A. and Durlach, P. 2002. What is refreshing? An investigation of the color and other sensory attributes of refreshing foods and beverages. Appetite. 39, 185-186.

102
Conclusions
Descriptive analysis revealed differences among all commercial and WP
beverages. Only WP beverages exhibited brothy and dairy-sour flavors, and the intensity
of these attributes was directly related to the percentage of WP added. WP beverages
were also characterized by salty taste; however, commercial beverage C5 had higher salty
taste than any of the WP beverages. No sensory or physical differences were seen
between hydrolyzed and unhydrolyzed WP beverages.
Consumer acceptance of representative commercial and WP beverages also
revealed differences in acceptability between commercial and WP beverages. As the
addition of WP increased, beverages became less like commercial thirst quenching
beverages in flavor profile, appearance and mouthfeel. Consumer acceptability scores for
WP beverages containing 25% and 50% WP were higher than those containing 75% and
100% WP. Beverages containing 25 or 50% WP were within acceptance scores of
commercial beverages. The WP beverage attributes or sweet taste and fruit flavor
intensity were considered by consumers to be too high and too low, respectively.
Alterations to the formulation should be made to optimize consumer acceptability,
although even with a slightly imperfect formulation, consumers still deemed the WP
beverages containing lower levels of WP to be thirst-quenching and drinkable.
As seen with descriptive analysis and consumer acceptance testing, no differences
were seen between hydrolyzed and unhydrolyzed WP drinks. In light of this finding, the
hydrolysis step may be omitted without any detrimental effects in flavor profile or
consumer acceptability scores. Also, consumer perception of lactose does not appear to
be negative and therefore may not have an adverse effect on consumption of a lactose-

103
containing thirst-quenching beverage. In summary, WP in lower concentrations can be
incorporated into a thirst-quenching beverage, however a drinkable yogurt application
may mask more of the dairy-sour and brothy flavors and therefore be more acceptable
and successful.

104
Appendix
Milk permeate (MP) was also evaluated as a potential ingredient in the thirst
quenching beverage formulation. MP was received from a commercial milk processing
plant in frozen form via overnight express (California Dairies Inc., Los Banos, CA).
Samples were aliquotted in 200mL amounts into glass jars with lids and frozen at -20°C.
Methods for proximate analysis were identical to those followed for WP. MP samples
were diluted to 9% solids prior to additional sensory or instrumental analyses.
Hydrolysis methods, beverage formulation and incorporation methods were the same as
those for WP.
The total solids of MP was higher than WP, averaging 47.15 +/-11.07%.
Therefore all MP samples used were diluted to 9% total solids (the aim was a 5-10%
solids permeate). After dilution, all other analyses were conducted. The pH of MP was
5.48 +/-0.33, while the %TA for MP was 1.18+/-0.28%. Fat content determined by CEM
Smart Trac was 0.325 +/-0.28% and by Babcock method was 0.322 +/-0.22%. Average
nitrogen content of MP was 398.25 +/-174.769 mg N/L and the calculated protein content
was 2.65 +/- 0.078 g/L protein. Mineral analysis results were as follows: Calcium 284
+/-46mg/L, Potassium 2697.5 +/-578mg/L, Magnesium 89.85 +/- 13.7mg/L, Sodium 810
+/-150mg/L, total phosphates 930 +/-176mg/L, and Zinc 0.2 +/-0.2mg/L. Raw MP
contained 2.23 log10 +/- 2.21cfu/mL on TSA pour plates, and <10cfu/mL on VRBA pour
plates. After pasteurization, MP contained <10 cfu/mL on TSA and VRBA pour plates.
Four batches of MP were received on separate dates from the commercial source.
Hydrolysis of the first batch received was successfully completed, providing a steady

105
increase in glucose concentration from time 0 to 3 hours of 0.275 +/-0.38g/L to 46.88 +/-
29.9g/L of glucose. Hydrolysis of batches 2-4 was unsuccessful. Initial glucose content
was 0.75 +/-1.55g/L and final glucose content after 3 hours of hydrolysis was 1.94 +/-
1.95g/L glucose. A cause for this lack of hydrolysis could not be determined. MP
batches were varied and unpredictable.
An attempt was made to incorporate MP into the control beverage formulation
despite the lack of consistent hydrolysis results. The beverage was salty, cloudy, and had
high dairy sour and brothy flavors. In addition, the color was overwhelmingly green and
unappealing. MP should not be counted out as a possible ingredient in thirst-quenching
beverages. However, in its liquid form, WP was more consistent in physical properties.

106
Figure 1: Descriptive Scoring Ballot Sensory evaluation of Sports drinks
Warm-up Solutions and References
(please use them – they do make a difference in your performance!) Grape Koolaid Sweet 10, sour 2 Welchs’ grape juice Sweet 6, sour 7 Constant sweet (moderate intensity) with: Constant sour (moderate intensity) with: Alone – sweet = 7 Alone – sour = 7 Low sour = sour 2, sweet 6 Low sweet = sour 6, sweet 1.5 Moderate sour = sour 7, sweet 6 Moderate Sweet = Sour 3, sweet 5 High sour = sour 8, sweet 5 High sweet = sour 2, sweet 9 Tasting order__________________ Name___________________
Aroma, Flavor and Taste Aroma - evaluate the intensity of the fruit aroma in the headspace of the sample cup Fruit aroma |____|____|____|____|____|____|____|____|____|____|____|____|____|____|___| 0 1 2 3 4 5 6 7 8 9 10 11 12 13 14 15 none high References blue gatorade = 4.5 grape juice = 4.5 Flavor and taste– evaluate the flavor and taste in the mouth Fruit flavor intensity |____|____|____|____|____|____|____|____|____|____|____|____|____|____|___| 0 1 2 3 4 5 6 7 8 9 10 11 12 13 14 15 none high References Grape juice = 7.5 Blue gatorade = 3
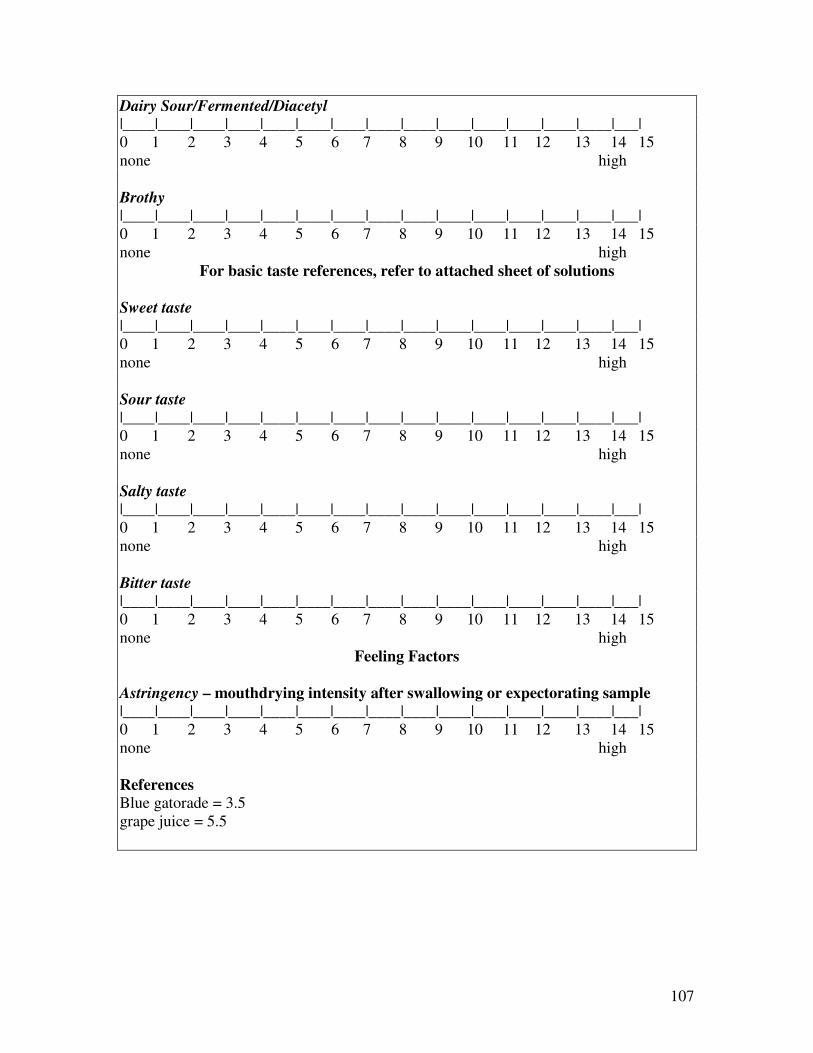
107
Dairy Sour/Fermented/Diacetyl |____|____|____|____|____|____|____|____|____|____|____|____|____|____|___| 0 1 2 3 4 5 6 7 8 9 10 11 12 13 14 15 none high Brothy |____|____|____|____|____|____|____|____|____|____|____|____|____|____|___| 0 1 2 3 4 5 6 7 8 9 10 11 12 13 14 15 none high
For basic taste references, refer to attached sheet of solutions
Sweet taste |____|____|____|____|____|____|____|____|____|____|____|____|____|____|___| 0 1 2 3 4 5 6 7 8 9 10 11 12 13 14 15 none high Sour taste |____|____|____|____|____|____|____|____|____|____|____|____|____|____|___| 0 1 2 3 4 5 6 7 8 9 10 11 12 13 14 15 none high Salty taste |____|____|____|____|____|____|____|____|____|____|____|____|____|____|___| 0 1 2 3 4 5 6 7 8 9 10 11 12 13 14 15 none high Bitter taste |____|____|____|____|____|____|____|____|____|____|____|____|____|____|___| 0 1 2 3 4 5 6 7 8 9 10 11 12 13 14 15 none high
Feeling Factors
Astringency – mouthdrying intensity after swallowing or expectorating sample |____|____|____|____|____|____|____|____|____|____|____|____|____|____|___| 0 1 2 3 4 5 6 7 8 9 10 11 12 13 14 15 none high References Blue gatorade = 3.5 grape juice = 5.5

108
Carbonation |____|____|____|____|____|____|____|____|____|____|____|____|____|____|___| 0 1 2 3 4 5 6 7 8 9 10 11 12 13 14 15 none high Texture/mouthfeel Viscosity – the force required to slurp the sample off of a spoon |____|____|____|____|____|____|____|____|____|____|____|____|____|____|___| 0 1 2 3 4 5 6 7 8 9 10 11 12 13 14 15 none high References Water = 1.0 Cream = 3.0 Note: obviously in our panel, we will only be using a very small portion of the scale!

109
Color/appearance terms
Opacity – The degree to which the liquid is opaque. Very opaque (whole milk) = 15. Not opaque(water) =0 Intensity is scored using the same 15 point intensity scale. References Whole milk = 15 Fat free milk = 12 Grape juice = 12 Juice Tea (Brambleberry) = 6 Green Gatorade = 3 Color intensity – The intensity or strength of the color from light to dark. No color = 0, Dark intense color – 15 References Juice Tea = 6.5 Grape juice = 13 Green Gatorade = 4 Brightness – The chroma or purity of the color, ranging from dull, muddied to pure, bright color. Fire engine red is a brighter color than burgundy red. Clear (water) = 0 Dull, muddied color = low brightness Bright pure color = high brightness References Juice Tea = 6 Grape juice = 4 Green Gatorade = 12 Tasting order__________________ Name___________________
Color/appearance terms Opacity |____|____|____|____|____|____|____|____|____|____|____|____|____|____|___| 0 1 2 3 4 5 6 7 8 9 10 11 12 13 14 15 not very opaque opaque Color intensity |____|____|____|____|____|____|____|____|____|____|____|____|____|____|___| 0 1 2 3 4 5 6 7 8 9 10 11 12 13 14 15 No dark intense Color color Brightness |____|____|____|____|____|____|____|____|____|____|____|____|____|____|___| 0 1 2 3 4 5 6 7 8 9 10 11 12 13 14 15 Dull, muddy bright, pure Color color Note: water = 0

110
Figure 2: Information provided to participants
Informed Consent to taste Thirst-Quenching Beverages I agree to participate in the sensory evaluation of thirst-quenching beverages. I understand that participation is voluntary and that I may withdraw my participation at any time. I also understand that the information provided is confidential and that results will not be associated with my name. Drinks MAY contain any of the following ingredients. If you are allergic to any of the ingredients listed below please notify the administrator and do not taste the samples. Thank you. Sucrose Lactose Fructose Galactose Acesulfame-K (Ace-K) Sucralose Milk protein Citric Acid Salt Natural and artificial flavorings ___________________________ ____________________________ __________ (Print your name) (sign your name) (date)

111
Figure 3: Consumer Demographic Screener Form
Thirst-Quenching Beverage Consumer Questionnaire Please answer all of the questions to the best of your knowledge: 1. Sex: Male_______ Female_______ 2. Age: _____18 years or younger
_____19-25 _____26-35 _____36-45 _____46-55 _____55-65 _____65 years or older 3. I am a U.S. citizen. Yes_____ No_____ 4. Are you the major shopper for your household? Yes _______ No_______ 5. Do you have any allergies to milk, milk products, or lactose? Yes______ No ______ 6. Please indicate how you feel about the following statement: Lactose is a healthy sugar. _____Strongly Agree _____Agree _____Neither Agree nor Disagree (don’t know) _____Disagree _____Strongly Disagree 7. Please indicate how you feel about the following statement: Glucose is a healthy sugar. _____Strongly Agree _____Agree _____Neither Agree nor Disagree (don’t know) _____Disagree _____Strongly Disagree 8. Please indicate how you feel about the following statement: Fructose is a healthy sugar. _____Strongly Agree _____Agree _____Neither Agree nor Disagree (don’t know) _____Disagree _____Strongly Disagree 9. Please indicate how you feel about the following statement: Sucrose is a healthy sugar. _____Strongly Agree _____Agree _____Neither Agree nor Disagree (don’t know) _____Disagree _____Strongly Disagree
PLEASE COMPLETE QUESTIONNAIRE ON REVERSE
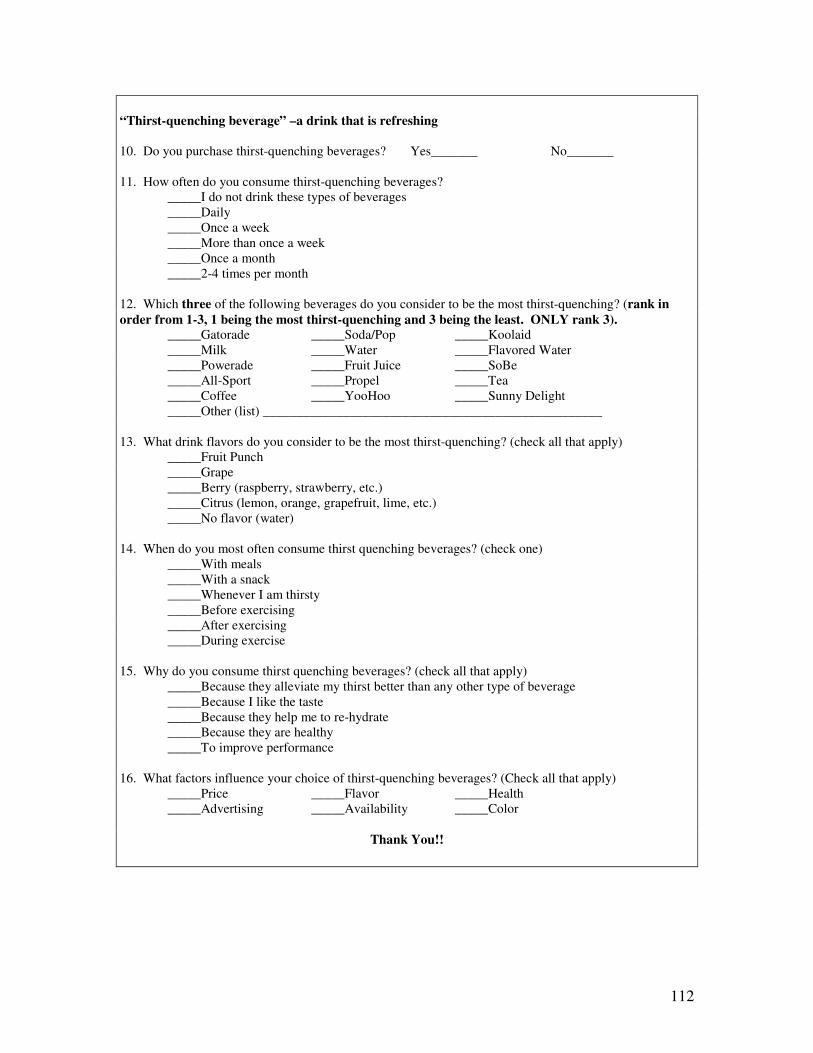
112
“Thirst-quenching beverage” –a drink that is refreshing 10. Do you purchase thirst-quenching beverages? Yes_______ No_______ 11. How often do you consume thirst-quenching beverages? _____I do not drink these types of beverages _____Daily _____Once a week _____More than once a week _____Once a month _____2-4 times per month 12. Which three of the following beverages do you consider to be the most thirst-quenching? (rank in order from 1-3, 1 being the most thirst-quenching and 3 being the least. ONLY rank 3). _____Gatorade _____Soda/Pop _____Koolaid _____Milk _____Water _____Flavored Water _____Powerade _____Fruit Juice _____SoBe _____All-Sport _____Propel _____Tea _____Coffee _____YooHoo _____Sunny Delight _____Other (list) ___________________________________________________ 13. What drink flavors do you consider to be the most thirst-quenching? (check all that apply) _____Fruit Punch _____Grape _____Berry (raspberry, strawberry, etc.) _____Citrus (lemon, orange, grapefruit, lime, etc.) _____No flavor (water) 14. When do you most often consume thirst quenching beverages? (check one) _____With meals _____With a snack _____Whenever I am thirsty _____Before exercising _____After exercising _____During exercise 15. Why do you consume thirst quenching beverages? (check all that apply) _____Because they alleviate my thirst better than any other type of beverage _____Because I like the taste _____Because they help me to re-hydrate _____Because they are healthy _____To improve performance 16. What factors influence your choice of thirst-quenching beverages? (Check all that apply) _____Price _____Flavor _____Health _____Advertising _____Availability _____Color
Thank You!!

113
Figure 4: Consumer Scoring Ballot
Thirst-Quenching Beverage Consumer Ballot Please taste each beverage sample with the number indicated and in the order presented. After you have tasted the product, please circle your response for the questions below. PLEASE ANSWER ALL QUESTIONS. Sample _____ Overall Liking 1 2 3 4 5 6 7 8 9 Dislike Neither Like Like Extremely nor dislike Extremely Overall Appearance Liking 1 2 3 4 5 6 7 8 9 Dislike Neither like Like Extremely nor dislike Extremely Sweetness Intensity 1 2 3 4 5 6 7 8 9 Not Sweet Very Sweet Fruit Flavor Intensity 1 2 3 4 5 6 7 8 9 Low Moderate High Overall Thirst Quenching Ability 1 2 3 4 5 6 7 8 9 Low Moderate High Likes: ______________________________ ______________________________ Dislikes: _______________________________ _______________________________
Overall Mouthfeel Liking 1 2 3 4 5 6 7 8 9 Dislike Neither like Like Extremely nor dislike Extremely Sweetness Liking 1 2 3 4 5 6 7 8 9 Dislike Neither like Like Extremely nor dislike Extremely Fruit Flavor Liking 1 2 3 4 5 6 7 8 9 Dislike Neither like Like Extremely nor dislike Extremely Overall Thirst Quenching Liking 1 2 3 4 5 6 7 8 9 Dislike Neither like Like Extremely nor dislike Extremely Which of these Beverages do you consider to be the most thirst quenching? (check one) _____679 ______121 _____523 ______317

114
Table 1: Commercial Beverages used in the Study
Commercial Beverage Code Blue Pepsi C1 Pulse Kiwi Strawberry C2 Mistic Purple Reign C3 Knudensen’s Boysenberry Spritzer
C4
Berry Gatorade All Stars C5 Berry Relaxing Fruit2O C6 Nature’s Bottled Water C7 Berry Koolaid C8 Welch’s Grape Juice C9 Kroger Raspberry Seltzer C10 Glaceau Vitamin Water Dragonfruit
C11
Tazo Brambleberry Juice Tea C12 Tazo Tazoberry Juice Tea C13 LeNature’s Vitamin Dazzler C14 Berry Propel C15