Embed Size (px)
Citation preview
Absolute Multiplexed Quantitative Analysis ofProtein Expression during Muscle DevelopmentUsing QconCAT*Jenny Rivers‡, Deborah M. Simpson‡, Duncan H. L. Robertson‡, Simon J. Gaskell§,and Robert J. Beynon‡¶
Stable isotope-labeled proteotypic peptides are used assurrogate standards for absolute quantification of pro-teins in proteomics. However, a stable isotope-labeledpeptide has to be synthesized, at relatively high cost, foreach protein to be quantified. To multiplex protein quan-tification, we developed a method in which gene designde novo is used to create and express artificial proteins(QconCATs) comprising a concatenation of proteotypicpeptides. This permits absolute quantification of multipleproteins in a single experiment. This complete study wasconstructed to define the nature, sources of error, andstatistical behavior of a QconCAT analysis. The QconCATprotein was designed to contain one tryptic peptide from20 proteins present in the soluble fraction of chickenskeletal muscle. Optimized DNA sequences encodingthese peptides were concatenated and inserted into avector for high level expression in Escherichia coli. Theprotein was expressed in a minimal medium containingamino acids selectively labeled with stable isotopes, cre-ating an equimolar series of uniformly labeled proteotypicpeptides. The labeled QconCAT protein, purified by affin-ity chromatography and quantified, was added to a ho-mogenized muscle preparation in a known amount priorto proteolytic digestion with trypsin. As anticipated, theQconCAT was completely digested at a rate far higherthan the analyte proteins, confirming the applicability ofsuch artificial proteins for multiplexed quantification. Thenature of the technical variance was assessed and com-pared with the biological variance in a complete study.Alternative ionization and mass spectrometric ap-proaches were investigated, particularly LC-ESI-TOF MSand MALDI-TOF MS, for analysis of proteins and trypticpeptides. QconCATs offer a new and efficient approach toprecise and simultaneous absolute quantification of mul-tiple proteins, subproteomes, or even entire proteomes.Molecular & Cellular Proteomics 6:1416–1427, 2007.
As the field of proteomics matures as a discipline, there isan increasing realization of the importance of absolute as wellas relative quantification, and considerable effort is beingdirected toward experimental strategies to achieve this goal.Most commonly, relative protein quantification by mass spec-trometry has been based on differential stable isotope label-ing implemented by metabolic incorporation (1, 2) or throughderivatization strategies such as ICAT (3). The mass-codedabundance tagging method (4) avoids the use of stable iso-topes but requires assumptions concerning mass spectro-metric response factors. To achieve relative quantification ofproteins without isotope labeling or chemical modificationsteps, quantitative comparisons have been made of equiva-lent sets of mass spectrometric data by considering peptidedetectability in repetitively acquired spectra or by comparingintegrated extracted ion chromatograms following liquid chro-matography-mass spectrometry analyses (5).
In principle, any of the approaches adopted for relativequantification may also be used for absolute quantification ifreference standards are available for all analytes in knownamounts. When unknowns and reference standards are co-analyzed, such approaches exploit the well established pre-cept in analytical chemistry of internal standardization inwhich a known amount of a stable isotope-labeled (or other-wise differentiated) standard is added to the analyte such thatthe response ratio between analyte and the heavier internalstandard can then be used to quantify the unknown. However,for quantification of individual proteins in a proteomics study,the true internal standard would be the corresponding proteinexpressed in pure and stable isotope-labeled form and quan-tified. This would be challenging on many fronts, including theexpression of a native protein in a heterologous system toeffect labeling, purification of the protein, and subsequentmass spectrometric analysis of the complex isotopic profile ofthe analyte and standard protein. Rather than adopt a protein-based approach, absolute quantification using proteotypicpeptides as surrogates for the protein of interest has emergedusing stable isotope-labeled peptide internal standards as“signature” or “proteotypic” peptides that are chemically syn-thesized and incorporate stable isotopes (6–9). Each proteinto be quantified requires at least one stable isotope-labeledpeptide that must be independently synthesized at relatively
From the ‡Proteomics and Functional Genomics Group, Faculty ofVeterinary Science, University of Liverpool, Liverpool L69 7ZJ, UnitedKingdom and §Michael Barber Centre for Mass Spectrometry, Schoolof Chemistry and Manchester Interdisciplinary Biocentre, Universityof Manchester, Manchester M1 7DN, United Kingdom
Received, December 4, 2006, and in revised form, May 16, 2007Published, MCP Papers in Press, May 17, 2007, DOI 10.1074/
mcp.M600456-MCP200
Research
© 2007 by The American Society for Biochemistry and Molecular Biology, Inc.1416 Molecular & Cellular Proteomics 6.8This paper is available on line at http://www.mcponline.org
at LIVE
RP
OO
L UN
IV on S
eptember 26, 2008
ww
w.m
cponline.orgD
ownloaded from
high cost. Moreover each peptide must be separately purifiedand quantified (10). There is clearly a need for approachesthat make this process more streamlined especially if multipleproteins are to be quantified.
We have recently introduced an efficient alternative to thechemical synthesis of multiple stable isotope-labeled pep-tides (11). In brief, artificial genes are designed de novo todirect the synthesis of novel proteins that are assemblies ofsignature Qpeptides derived from a number of discrete pro-teins. Usually these Qpeptides are arginine or lysine termi-nated at the C terminus as they represent and will be internalstandards for tryptic peptides derived from digestion of theanalyte proteins. Appropriately flanked with added featuresincluding an initiator codon, a purification tag, and protectivesacrificial regions, the gene is transformed into and expressedin a heterologous system, usually bacterial. The expressionstrain is grown in a chemically defined medium, uniformlyisotopically labeled (for example, using 15NH4Cl as the solenitrogen source) or containing specific stable isotope-labeledamino acids at a high isotope enrichment such that the arti-ficial protein becomes fully labeled. The artificial protein(termed a “QconCAT” for “quantification concatamers”) ispurified by virtue of the affinity tag and quantified using asuitable procedure (12). The QconCAT is mixed with a com-plex mixture of analyte proteins, and subsequent proteolysisreleases both the stable isotope-labeled standard and thecognate peptide from the analyte. The known quantity ofstandard added can then be used for absolute quantificationof the analyte. Because quantification of the QconCAT proteinwill define in absolute terms the quantity of each of the sur-rogate peptides, the QconCAT strategy provides an efficientmeans to multiplex absolute quantification. Tryptic peptidesare typically 10–15 amino acids long; thus proteotypic Qpep-tides from 50 proteins could be encoded in a protein com-prising 500–750 amino acids. The Qpeptides are present, bydesign, in stoichiometrically known amounts (usually equimo-lar) so that each analyte peptide (and therefore protein) issimultaneously quantified.
Qpeptides are concatenated in the QconCAT protein out oftheir normal primary sequence context, and it is formallycorrect to point out that this different context could influencethe quantification data (13). However, this can only occur ifeither the QconCAT or the analyte proteins are incompletelydigested such that the yield of each peptide is incomplete. Itis generally accepted that for most general proteases, such astrypsin, the Km for proteins and peptides is relatively high, andproteolytic reactions operating at substrate concentrationsbelow this value exhibit pseudo-first order kinetics (14–16).Thus, if the rate of digestion of either the QconCAT or analytewas so low that six or seven reaction half-times could notelapse during the proteolytic reaction, there might be discor-dance between the yield of the standard and analyte peptide.However, the main determinant of the rate of proteolysis ofnative proteins is higher order structure, not primary se-
quence context. Tightly folded proteins, particularly thosewith a high proportion of � sheet, are intrinsically resistant toproteolysis (17, 18). There is no reason, a priori, to expect thatQconCATs would adopt such tightly folded structures. Indeedtheir propensity to form insoluble inclusion bodies and theirrecovery by dissolution in strong chaotropes both mitigateagainst structural impediments to proteolysis. By contrast,unless care is taken in the prior denaturation of analyte pro-teins, their higher order structure would almost certainly influ-ence proteolysis and could impact absolute quantification.We stress, however, that the incomplete analyte digestion isas much an issue for quantification using synthetic peptidesas those using QconCATs. We address the issue of QconCATand analyte proteolysis here and show that it is a factor that isreadily controlled.
Deployment of a QconCAT experiment has many aspectsthat must be optimized. We demonstrate the use of a Qcon-CAT for absolute quantification of a group of proteins thatdemonstrate dramatic changes in expression during develop-ment of skeletal muscle in the chicken posthatching. Weassessed the scope of the method and the magnitude andsources of variance that the method contains. We confirmedthe value of guanidination (19) as a strategy to enhance pep-tide ion yields in MALDI-TOF MS and showed that effectivequantification is attainable and equivalent in both MALDI-TOFand ESI-TOF analyses.
EXPERIMENTAL PROCEDURES
Materials and Reagents—Trypsin (sequence grade) was obtainedfrom Roche Diagnostics. All other chemicals and solvents (HPLCgrade) were purchased from Sigma-Aldrich and VWR InternationalLaboratory Supplies (Leicestershire, UK).
Proteomics Analysis of Chicken Skeletal Muscle Soluble Fraction—Chickens (Institut de Selection Animale (ISA) Brown layer and Ross308 broiler) were grown to 30 days posthatch, and animals wereculled at 1, 3, 5, 10, 20, and 30 days at which time pectoralis musclewas collected (the above procedures were performed at the RoslinInstitute, Edinburgh, UK). To isolate the soluble fraction of chickenskeletal muscle, 100 mg of breast tissue was homogenized in 0.9 mlof 20 mM sodium phosphate buffer, pH 7.0, containing proteaseinhibitors (Complete protease inhibitors, Roche Applied Science). Thehomogenized sample was centrifuged at 15,000 � g for 45 min at4 °C. The supernatant fraction, containing soluble protein, was thenremoved. This was repeated, homogenizing the insoluble fraction inthe same volume of sodium phosphate, and the pooled supernatantfractions were used for all analyses. The total protein concentration ofeach preparation was measured using a Coomassie Plus ProteinAssay (Pierce).
For 1D1 SDS-PAGE analysis, 10 �g of soluble protein samples(volume, 5–10 �l) from birds of different strains and ages were eachmixed with an equal volume of reducing sample buffer (1 ml of 0.5 M
Tris buffer, pH 6.8, 1 ml of glycerol, 0.02 g of SDS, 0.01g of brom-phenol blue, 0.154 g of DTT) and resolved by 12.5% (w/v) SDS-PAGEprior to staining with Coomassie Blue (Bio-Safe, Bio-Rad). Gels were
1 The abbreviations used are: 1D, one-dimensional; GAPDH, glyc-eraldehyde-3-phosphate dehydrogenase; AK, adenylate kinase; CV,coefficient of variance.
Use of QconCAT for Absolute Quantification
Molecular & Cellular Proteomics 6.8 1417
at LIVE
RP
OO
L UN
IV on S
eptember 26, 2008
ww
w.m
cponline.orgD
ownloaded from
destained with 10% (v/v) acetic acid, 10% (v/v) methanol.Preparation and Purification of QconCAT—The artificial QconCAT
gene (11) was expressed in Escherichia coli with a full complement ofunlabeled amino acids or in the presence of [13C6]lysine (100 mg/liter)and [13C6]arginine (100 mg/liter) as the sole source of these two aminoacids. Expression was induced with isopropyl �-D-thiogalactopyran-oside, and the cells were harvested by centrifugation at 1400 � g at4 °C for 15 min. Inclusion bodies containing QconCAT (as proven bydigestion with trypsin and MALDI-TOF MS analysis; data not shown)were recovered by breaking cells using BugBuster Protein ExtractionReagent (Novagen, Nottingham, UK). Inclusion bodies were resus-pended in 20 mM phosphate buffer, 6 M guanidinium chloride, 0.5 M
NaCl, 20 mM imidazole, pH 7.4. From this solution, [13C6]lysine/arginine-labeled and unlabeled QconCAT proteins were purified sep-arately by affinity chromatography using a nickel-based resin (HisTrapHP kit, Amersham Biosciences). Following sample loading, HisTrapcolumns were washed with 20 mM phosphate buffer, pH 7.4, prior toelution of the sample with the same buffer containing a higher con-centration of imidazole (20 mM phosphate, 0.5 M NaCl, 500 mM
imidazole, 6 M guanidinium chloride, pH 7.4) during which phasefractions (1 ml) were collected. The purified QconCAT was desaltedby three rounds of dialysis against 100 volumes of 10 mM ammoniumbicarbonate, pH 8.5, for 2 h using fresh buffer each time.
Proteomics Analysis of QconCAT for Quantification of ChickenSkeletal Muscle Proteins—The QconCAT protein was diluted to 5 �M
in 50 mM ammonium bicarbonate and digested with trypsin (20:1substrate:protease) at 37 °C for 24 h after which the digest wasincubated with additional trypsin (20:1 substrate:protease) to ensurecomplete digestion. Peptides were analyzed by MALDI-TOF MS(M@LDI, Waters, Manchester, UK). For this, 1 �l of digested materialwas mixed with an equal volume of �-cyanohydroxycinnamic acid in50% (v/v) acetonitrile, 0.1% (v/v) trifluoroacetic acid. This was allowedto dry, and peptides were acquired over the mass range 900–3000m/z. For each combined spectrum, 20–30 spectra were acquired(laser energy typically 30%) with 10 shots per spectrum and a laserfiring rate of 5 Hz. Data were processed using MassLynx software tosubtract background noise using polynomial order 10 with 40% of thedata points below this polynomial and a tolerance of 0.01. Spectraldata were also smoothed by performing two mean smooth operationswith a window of three channels.
Co-digestion of QconCAT and Chicken Skeletal Muscle SolubleProteins for Quantification—QconCAT protein was added in a 1:10(QconCAT:chicken skeletal muscle protein) ratio to chicken skeletalmuscle soluble fraction samples taken from both broiler and layerstrains at six time points during growth. For each time point, four birdswere analyzed. The mixture was diluted 10-fold with 50 mM ammo-nium bicarbonate, and 10% (v/v) acetonitrile was added prior toaddition of trypsin (20:1 substrate:protease). The reaction mixturewas incubated at 37 °C for 24 h, after which the digest was incubatedwith additional trypsin (20:1 substrate:protease) to ensure completedigestion. 1 �l was analyzed by MALDI-TOF MS.
Monitored Proteolysis of QconCAT and Analyte Proteins—ForQconCAT digestion, 150 �g of protein was digested with trypsin at aratio of trypsin:protein of 1:20 and 1:100 and stopped at selected timepoints after addition of enzyme by removing 15 �l (containing 3 �g ofprotein) and adding to an equal volume of 10% (v/v) formic acid. Foranalyte protein digestion, 50 �g of protein was digested with trypsinat a ratio of trypsin:protein of 1:20 and stopped at 0 min, 30 min, and24 h after addition of enzyme by removing 25 �l (containing 6 �g ofprotein) and adding an equal volume of 10% (v/v) formic acid. Thefractions were subsequently stored at �20 °C until the end of the timecourse. For gel electrophoresis, fractions were dried down in a vac-uum centrifuge and reconstituted in 10 �l of reducing sample bufferprior to separation by 12.5% (w/v) 1D SDS-PAGE at 200 V for 45 min.
Analyte proteins were also digested in a solution containing 10% ACN(v/v) and with addition of enzyme following a 1-h incubation of theprotein at 60 °C. To quantify proteolysis of analyte proteins, digestionof chicken skeletal muscle soluble proteins in solution with trypsin (asdescribed above) was stopped at various time points during 24-hincubation at 37 °C by removing 20 �l (containing 5 �g of protein) andadding an equal volume of 10% (v/v) formic acid containing 0.5 �g ofpredigested QconCAT peptides. Each fraction was analyzed byMALDI-TOF MS. This experiment was repeated using protein dena-tured by incubation at 60 °C for 1 h prior to trypsin addition forcomparison.
Guanidination—To enhance the signal intensity of lysine-termi-nated peptides in MALDI-TOF MS, lysine residues were converted tothe more basic homoarginine by guanidination (20). This reaction wascarried out by drying down the peptide mixture and reconstituting it in10 �l of 7 M ammonia solution to which was added 5 �l of 0.5 M
O-methylisourea (in double distilled H2O). This was mixed thoroughlyand incubated overnight at room temperature prior to drying downand desalting using C18 ZipTips (Millipore, Watford, UK).
LC-MS—Peptide mixtures were analyzed by LC-ESI-Q-TOF MSusing an EASY-nLC (Proxeon, Odense, Denmark) nanoflow systemcoupled to a Q-Tof micro (Waters). Nanoflow HPLC at 200 nl/min wasused to resolve peptides (in 0.1% (v/v) formic acid) over a 50-minacetonitrile gradient (0–100%). Peptides were acquired over the massrange 400–2000 m/z with the capillary voltage set at 1900 V, collisionenergy set at 10 V, and sample cone set at 55 V for the entire 50-mingradient. The same reversed phase separation method was used tocollect fractions (200 nl) directly onto a MALDI-TOF target for analysisby LC-MALDI-TOF MS.
Assessing Analytical and Biological Variance in Quantification—Tenidentical aliquots of a chicken skeletal muscle soluble protein prep-aration, to each of which was added a known amount of[13C6]arginine/[13C6]lysine-labeled QconCAT, were digested in solu-tion with trypsin and analyzed to investigate analytical variance. Thiswas compared with biological variance (four animals at each timepoint) achieved through quantification by MALDI-TOF MS (with andwithout guanidination), LC-ESI-Q-TOF MS, and LC-MALDI-TOF MS.
Comparison of QconCAT Method with Absolute Quantification Us-ing a Stable Isotope-labeled Synthetic Peptide—Quantification by theQconCAT method was also compared with that achieved using astable isotope-labeled synthetic peptide to quantify a single analyteprotein also represented in the QconCAT. The peptide of sequenceLVSWYDNEFGYSNR and mass 1748.77 Da representing the abun-dant protein GAPDH was synthesized by Sigma-Genosys (Dorset,UK) and was labeled at the arginine residue with both 13C6 and 15N4
giving a 10-Da mass offset from the analyte peptide. For quantifica-tion, the synthetic peptide was added to broiler chicken skeletalmuscle samples corresponding to six time points during growth withfour replicate animals at each time point. Quantification data wereobtained from analysis by MALDI-TOF MS using the relative intensi-ties of the analyte and standard peaks as with QconCAT analysis.
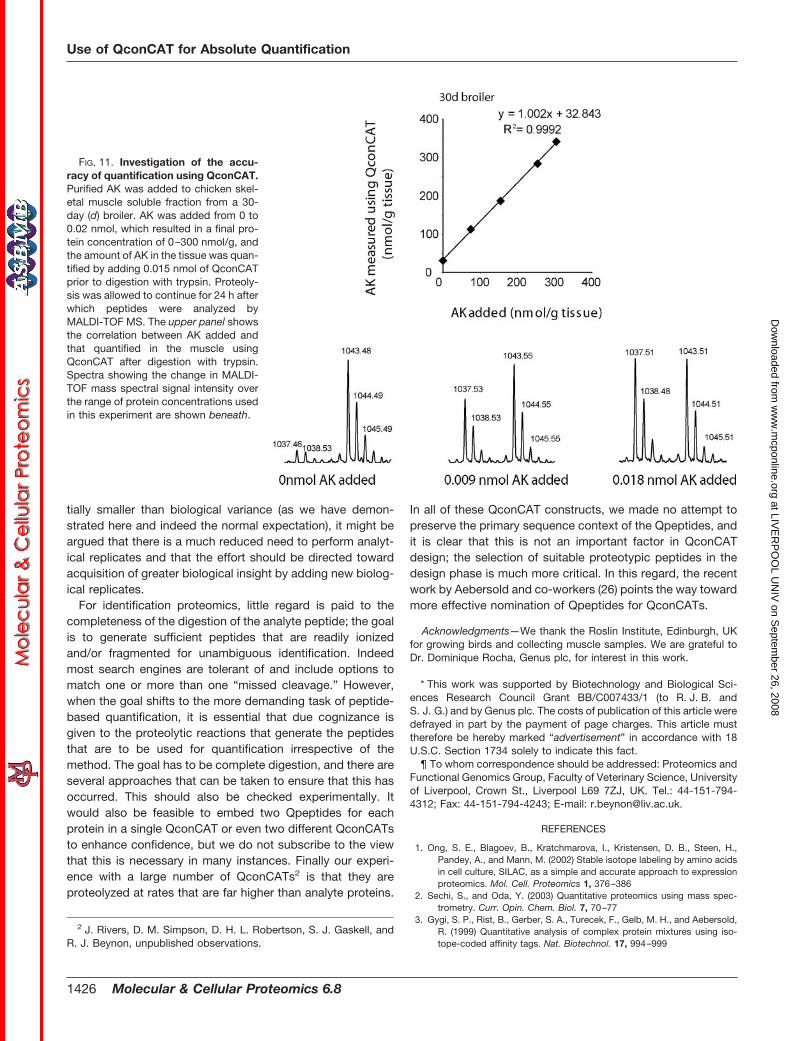
Investigation of the Accuracy of Quantification Using QconCAT—Purified adenylate kinase (AK; Sigma) was added to chicken skeletalmuscle soluble fraction from a 30-day broiler. AK was added from 0to 0.02 nmol resulting in a final protein concentration of 0–300nmol/g, and the amount of AK in the tissue was quantified by adding0.015 nmol of QconCAT prior to digestion with trypsin. Proteolysiswas allowed to continue for 24 h after which peptides were analyzedby MALDI-TOF MS.
RESULTS
The QconCAT was designed to include surrogate peptidesfor 20 chicken skeletal muscle proteins. As chicken skeletalmuscle matures posthatch, the protein distribution in the tis-
Use of QconCAT for Absolute Quantification
1418 Molecular & Cellular Proteomics 6.8
at LIVE
RP
OO
L UN
IV on S
eptember 26, 2008
ww
w.m
cponline.orgD
ownloaded from
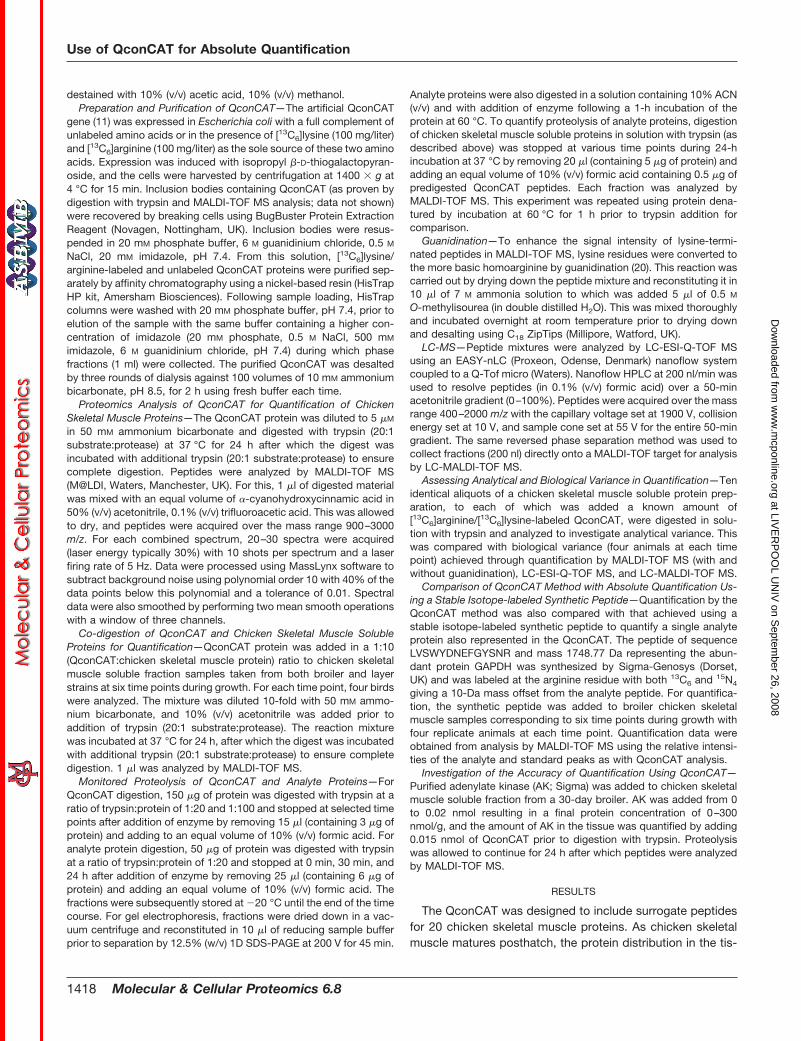
sue changes dramatically from a large number of proteins thatare expressed in similar amounts at hatch to a relatively fewhigh abundance proteins after 30 days of growth (Fig. 1). Fromprevious identification studies (21), the most abundant pro-teins present in the soluble fraction of chicken skeletal muscleat this stage are predominantly the glycolytic enzymes. Otherproteins, notably actin, have disappeared from the soluble
fraction of muscle by 10 days of growth, presumably reflect-ing repartitioning and assembly of the myofibrillar apparatus.Finally serum proteins are detectable in muscle preparationsat hatch but rapidly disappear during development. We as-cribe this change to the increased exclusion of interstitial fluidas the muscle develops (22). To measure the absolute con-centrations of specific proteins at various time points, weselected a group of 20 to be quantified using a single Qcon-CAT. For each of the proteins, we chose a proteotypic peptidethat gave a strong signal in previous MALDI-TOF MS analysesof tryptic digests. The peptides were used to guide construc-tion of the DNA sequence of the QconCAT, which was syn-thesized, inserted into a pET21a vector, and expressed inE. coli. Full details of the design and expression are givenelsewhere (12).
For QconCAT expression, a typical bacterial culture of 200ml was induced at an A600 of 0.6–0.8, which generated 5–10mg of QconCAT after cell breakage, recovery of inclusionbodies, and affinity chromatography of guanidinium chloride-solubilized protein on 1-ml nickel-nitrilotriacetic acid columns.After induction, the QconCAT protein was visible as a majorband in 1D SDS-PAGE of a broken cell preparation (resultsnot shown). After purification, the protein was homogeneouson 1D SDS-PAGE and was used without further purification(results not shown).
QconCAT protein was added in a 1:10 (QconCAT:chickenskeletal muscle protein) ratio to chicken skeletal muscle sol-uble fraction samples taken from both broiler and layer strainsat six time points during growth. For each time point, fourbirds were analyzed. This ratio was selected pragmaticallybased on the abundance of the major proteins in chickenskeletal muscle soluble fraction. The influence of dynamic
FIG. 1. 1D SDS-PAGE analysis of the soluble fraction of chickenskeletal muscle. Two different birds were compared at 1 and 30 days(d) after hatch for each strain. Soluble proteins (10 �g; volume, 5–10�l) were mixed in an equal volume with reducing SDS sample buffer,boiled for 5 min, and loaded onto a 12.5% (w/v) large format acryl-amide gel prior to staining with Coomassie Blue (Bio-Safe, Bio-Rad).Gels were destained with 10% (v/v) acetic acid, 10% (v/v) methanol.Major proteins were identified by MALDI-TOF peptide massfingerprinting.
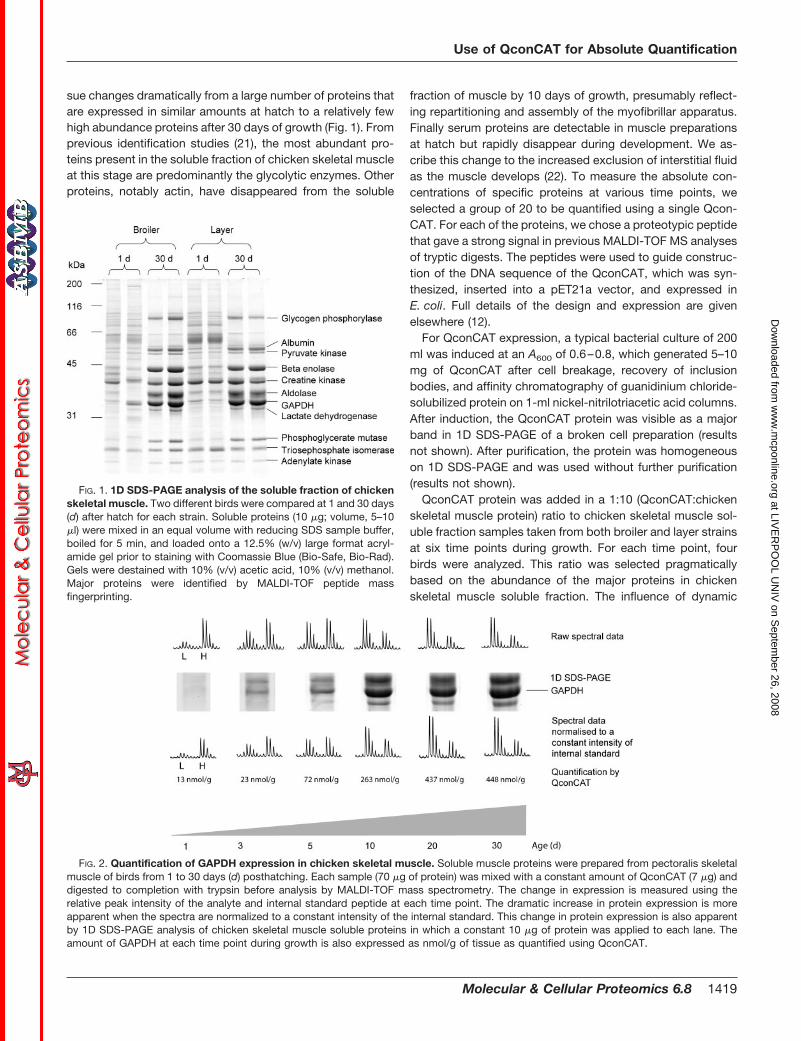
FIG. 2. Quantification of GAPDH expression in chicken skeletal muscle. Soluble muscle proteins were prepared from pectoralis skeletalmuscle of birds from 1 to 30 days (d) posthatching. Each sample (70 �g of protein) was mixed with a constant amount of QconCAT (7 �g) anddigested to completion with trypsin before analysis by MALDI-TOF mass spectrometry. The change in expression is measured using therelative peak intensity of the analyte and internal standard peptide at each time point. The dramatic increase in protein expression is moreapparent when the spectra are normalized to a constant intensity of the internal standard. This change in protein expression is also apparentby 1D SDS-PAGE analysis of chicken skeletal muscle soluble proteins in which a constant 10 �g of protein was applied to each lane. Theamount of GAPDH at each time point during growth is also expressed as nmol/g of tissue as quantified using QconCAT.
Use of QconCAT for Absolute Quantification
Molecular & Cellular Proteomics 6.8 1419
at LIVE
RP
OO
L UN
IV on S
eptember 26, 2008
ww
w.m
cponline.orgD
ownloaded from
range on absolute quantification of proteins in complex bio-logical systems is discussed below. After co-digestion ofchicken skeletal muscle soluble fraction and [13C6]arginine/lysine-labeled QconCAT, MALDI-TOF MS analysis of peptidesproduced highly complex mass spectra. However, 10 of 20proteotypic peptides could be identified in the compositespectrum without further sample processing and were there-fore used for quantification. For these 10 proteins, for exam-ple glyceraldehyde-3-phosphate dehydrogenase (Fig. 2), thechange in protein expression can be measured during growthfrom 1 to 30 days posthatch by converting relative signalintensities of analyte and internal standard peptide ions intoabsolute quantities of analyte protein expressed as nmol/g ofnet weight breast muscle tissue.
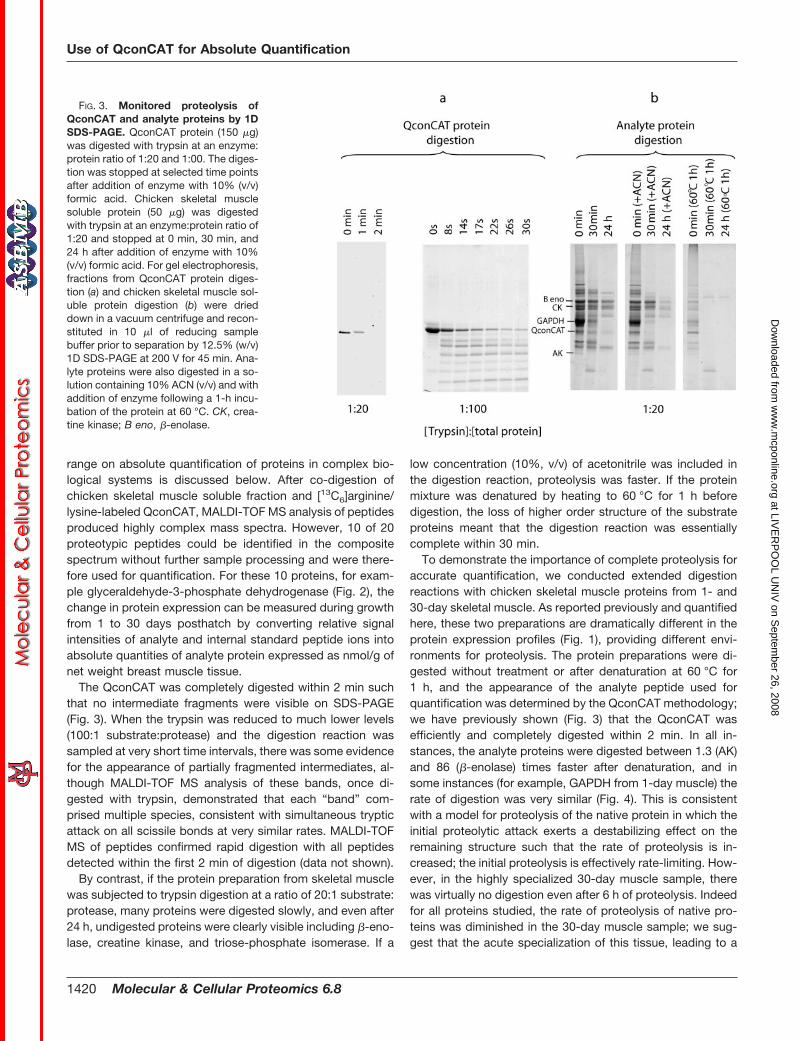
The QconCAT was completely digested within 2 min suchthat no intermediate fragments were visible on SDS-PAGE(Fig. 3). When the trypsin was reduced to much lower levels(100:1 substrate:protease) and the digestion reaction wassampled at very short time intervals, there was some evidencefor the appearance of partially fragmented intermediates, al-though MALDI-TOF MS analysis of these bands, once di-gested with trypsin, demonstrated that each “band” com-prised multiple species, consistent with simultaneous trypticattack on all scissile bonds at very similar rates. MALDI-TOFMS of peptides confirmed rapid digestion with all peptidesdetected within the first 2 min of digestion (data not shown).
By contrast, if the protein preparation from skeletal musclewas subjected to trypsin digestion at a ratio of 20:1 substrate:protease, many proteins were digested slowly, and even after24 h, undigested proteins were clearly visible including �-eno-lase, creatine kinase, and triose-phosphate isomerase. If a
low concentration (10%, v/v) of acetonitrile was included inthe digestion reaction, proteolysis was faster. If the proteinmixture was denatured by heating to 60 °C for 1 h beforedigestion, the loss of higher order structure of the substrateproteins meant that the digestion reaction was essentiallycomplete within 30 min.
To demonstrate the importance of complete proteolysis foraccurate quantification, we conducted extended digestionreactions with chicken skeletal muscle proteins from 1- and30-day skeletal muscle. As reported previously and quantifiedhere, these two preparations are dramatically different in theprotein expression profiles (Fig. 1), providing different envi-ronments for proteolysis. The protein preparations were di-gested without treatment or after denaturation at 60 °C for1 h, and the appearance of the analyte peptide used forquantification was determined by the QconCAT methodology;we have previously shown (Fig. 3) that the QconCAT wasefficiently and completely digested within 2 min. In all in-stances, the analyte proteins were digested between 1.3 (AK)and 86 (�-enolase) times faster after denaturation, and insome instances (for example, GAPDH from 1-day muscle) therate of digestion was very similar (Fig. 4). This is consistentwith a model for proteolysis of the native protein in which theinitial proteolytic attack exerts a destabilizing effect on theremaining structure such that the rate of proteolysis is in-creased; the initial proteolysis is effectively rate-limiting. How-ever, in the highly specialized 30-day muscle sample, therewas virtually no digestion even after 6 h of proteolysis. Indeedfor all proteins studied, the rate of proteolysis of native pro-teins was diminished in the 30-day muscle sample; we sug-gest that the acute specialization of this tissue, leading to a
FIG. 3. Monitored proteolysis ofQconCAT and analyte proteins by 1DSDS-PAGE. QconCAT protein (150 �g)was digested with trypsin at an enzyme:protein ratio of 1:20 and 1:00. The diges-tion was stopped at selected time pointsafter addition of enzyme with 10% (v/v)formic acid. Chicken skeletal musclesoluble protein (50 �g) was digestedwith trypsin at an enzyme:protein ratio of1:20 and stopped at 0 min, 30 min, and24 h after addition of enzyme with 10%(v/v) formic acid. For gel electrophoresis,fractions from QconCAT protein diges-tion (a) and chicken skeletal muscle sol-uble protein digestion (b) were drieddown in a vacuum centrifuge and recon-stituted in 10 �l of reducing samplebuffer prior to separation by 12.5% (w/v)1D SDS-PAGE at 200 V for 45 min. Ana-lyte proteins were also digested in a so-lution containing 10% ACN (v/v) and withaddition of enzyme following a 1-h incu-bation of the protein at 60 °C. CK, crea-tine kinase; B eno, �-enolase.
Use of QconCAT for Absolute Quantification
1420 Molecular & Cellular Proteomics 6.8
at LIVE
RP
OO
L UN
IV on S
eptember 26, 2008
ww
w.m
cponline.orgD
ownloaded from
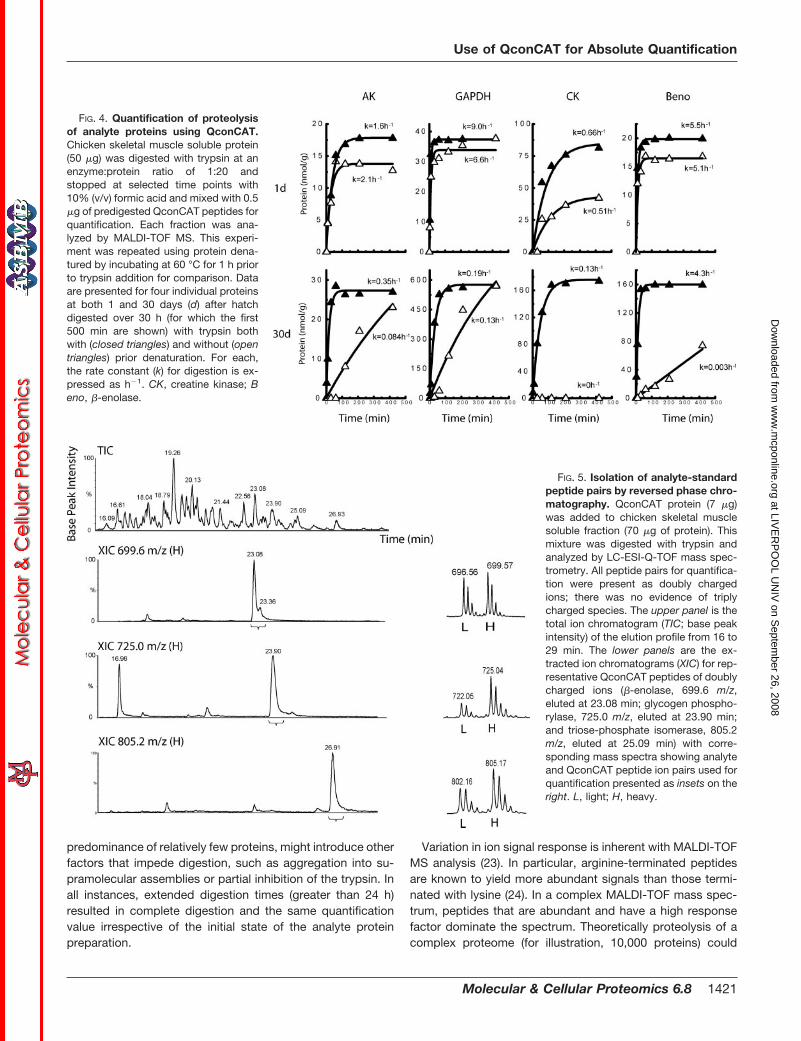
predominance of relatively few proteins, might introduce otherfactors that impede digestion, such as aggregation into su-pramolecular assemblies or partial inhibition of the trypsin. Inall instances, extended digestion times (greater than 24 h)resulted in complete digestion and the same quantificationvalue irrespective of the initial state of the analyte proteinpreparation.
Variation in ion signal response is inherent with MALDI-TOFMS analysis (23). In particular, arginine-terminated peptidesare known to yield more abundant signals than those termi-nated with lysine (24). In a complex MALDI-TOF mass spec-trum, peptides that are abundant and have a high responsefactor dominate the spectrum. Theoretically proteolysis of acomplex proteome (for illustration, 10,000 proteins) could
FIG. 4. Quantification of proteolysisof analyte proteins using QconCAT.Chicken skeletal muscle soluble protein(50 �g) was digested with trypsin at anenzyme:protein ratio of 1:20 andstopped at selected time points with10% (v/v) formic acid and mixed with 0.5�g of predigested QconCAT peptides forquantification. Each fraction was ana-lyzed by MALDI-TOF MS. This experi-ment was repeated using protein dena-tured by incubating at 60 °C for 1 h priorto trypsin addition for comparison. Dataare presented for four individual proteinsat both 1 and 30 days (d) after hatchdigested over 30 h (for which the first500 min are shown) with trypsin bothwith (closed triangles) and without (opentriangles) prior denaturation. For each,the rate constant (k) for digestion is ex-pressed as h�1. CK, creatine kinase; Beno, �-enolase.
FIG. 5. Isolation of analyte-standardpeptide pairs by reversed phase chro-matography. QconCAT protein (7 �g)was added to chicken skeletal musclesoluble fraction (70 �g of protein). Thismixture was digested with trypsin andanalyzed by LC-ESI-Q-TOF mass spec-trometry. All peptide pairs for quantifica-tion were present as doubly chargedions; there was no evidence of triplycharged species. The upper panel is thetotal ion chromatogram (TIC; base peakintensity) of the elution profile from 16 to29 min. The lower panels are the ex-tracted ion chromatograms (XIC) for rep-resentative QconCAT peptides of doublycharged ions (�-enolase, 699.6 m/z,eluted at 23.08 min; glycogen phospho-rylase, 725.0 m/z, eluted at 23.90 min;and triose-phosphate isomerase, 805.2m/z, eluted at 25.09 min) with corre-sponding mass spectra showing analyteand QconCAT peptide ion pairs used forquantification presented as insets on theright. L, light; H, heavy.
Use of QconCAT for Absolute Quantification
Molecular & Cellular Proteomics 6.8 1421
at LIVE
RP
OO
L UN
IV on S
eptember 26, 2008
ww
w.m
cponline.orgD
ownloaded from
generate 105–106 peptides (at �50 tryptic peptides per pro-tein), the dynamic range of which will be such that only themost abundant peptides and those that ionize particularly wellwill be identified. To achieve increased signal intensity fromlysine-terminated peptides, guanidination has been used toconvert lysine into the more basic homoarginine by reactionwith O-methylisourea (20). Guanidination of a tryptic digestwas effective at increasing the signal intensity of lysine-termi-nated peptides in the QconCAT and the analyte sample toallow quantification of two more analyte proteins by MALDI-TOF MS. To improve resolution of peptides for quantification,samples were also analyzed by LC-ESI-Q-TOF MS (Fig. 5).The alternative ionization mode coupled with the benefit ofseparation of peptides by reversed phase chromatographyallowed quantification of a further six proteins previously notidentified by MALDI-TOF MS and confirmed quantificationdata for many of those that had previously been analyzed.Extracted ion chromatograms for unlabeled (analyte) and la-beled (QconCAT) peptides were used to locate the ions, andthe chromatographic boundaries of the coincident pair ofpeptides were used to delineate the combined mass spectrafrom which peptides were quantified by mass spectrometricintensities of the doubly charged ions; there was no evidenceof multiply charged ions, for example [M � 3H]3� correspond-
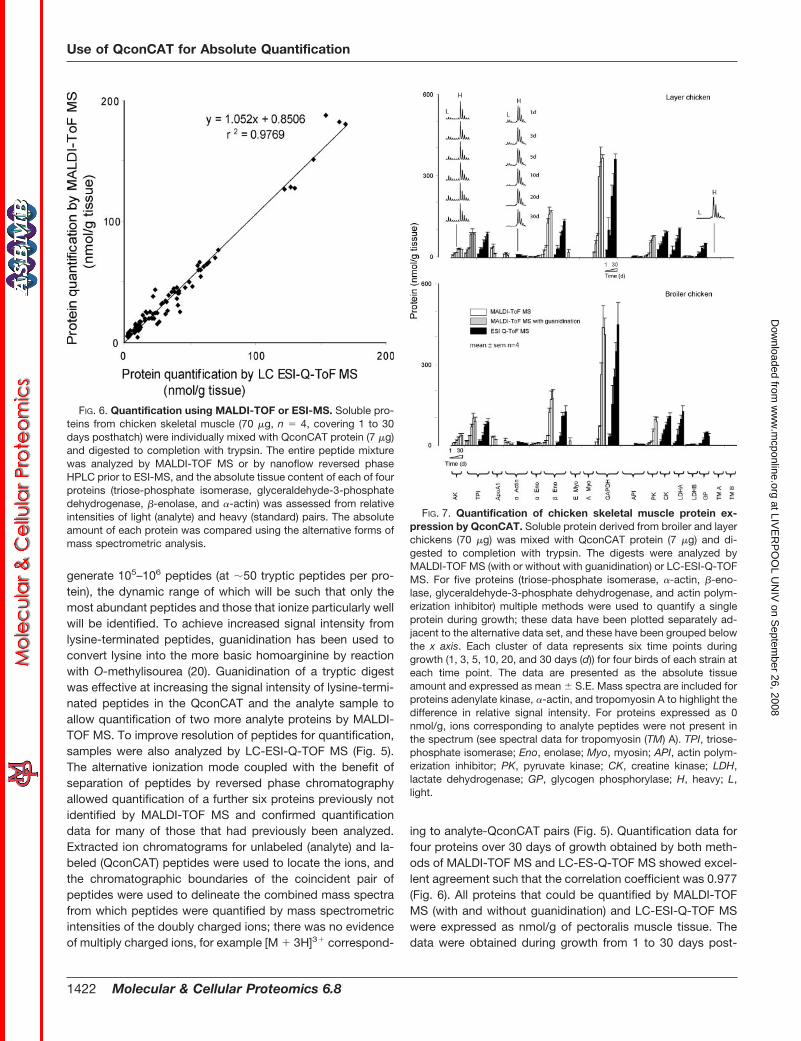
ing to analyte-QconCAT pairs (Fig. 5). Quantification data forfour proteins over 30 days of growth obtained by both meth-ods of MALDI-TOF MS and LC-ES-Q-TOF MS showed excel-lent agreement such that the correlation coefficient was 0.977(Fig. 6). All proteins that could be quantified by MALDI-TOFMS (with and without guanidination) and LC-ESI-Q-TOF MSwere expressed as nmol/g of pectoralis muscle tissue. Thedata were obtained during growth from 1 to 30 days post-
FIG. 6. Quantification using MALDI-TOF or ESI-MS. Soluble pro-teins from chicken skeletal muscle (70 �g, n � 4, covering 1 to 30days posthatch) were individually mixed with QconCAT protein (7 �g)and digested to completion with trypsin. The entire peptide mixturewas analyzed by MALDI-TOF MS or by nanoflow reversed phaseHPLC prior to ESI-MS, and the absolute tissue content of each of fourproteins (triose-phosphate isomerase, glyceraldehyde-3-phosphatedehydrogenase, �-enolase, and �-actin) was assessed from relativeintensities of light (analyte) and heavy (standard) pairs. The absoluteamount of each protein was compared using the alternative forms ofmass spectrometric analysis.
FIG. 7. Quantification of chicken skeletal muscle protein ex-pression by QconCAT. Soluble protein derived from broiler and layerchickens (70 �g) was mixed with QconCAT protein (7 �g) and di-gested to completion with trypsin. The digests were analyzed byMALDI-TOF MS (with or without with guanidination) or LC-ESI-Q-TOFMS. For five proteins (triose-phosphate isomerase, �-actin, �-eno-lase, glyceraldehyde-3-phosphate dehydrogenase, and actin polym-erization inhibitor) multiple methods were used to quantify a singleprotein during growth; these data have been plotted separately ad-jacent to the alternative data set, and these have been grouped belowthe x axis. Each cluster of data represents six time points duringgrowth (1, 3, 5, 10, 20, and 30 days (d)) for four birds of each strain ateach time point. The data are presented as the absolute tissueamount and expressed as mean � S.E. Mass spectra are included forproteins adenylate kinase, �-actin, and tropomyosin A to highlight thedifference in relative signal intensity. For proteins expressed as 0nmol/g, ions corresponding to analyte peptides were not present inthe spectrum (see spectral data for tropomyosin (TM) A). TPI, triose-phosphate isomerase; Eno, enolase; Myo, myosin; API, actin polym-erization inhibitor; PK, pyruvate kinase; CK, creatine kinase; LDH,lactate dehydrogenase; GP, glycogen phosphorylase; H, heavy; L,light.
Use of QconCAT for Absolute Quantification
1422 Molecular & Cellular Proteomics 6.8
at LIVE
RP
OO
L UN
IV on S
eptember 26, 2008
ww
w.m
cponline.orgD
ownloaded from
hatch for four birds at each time point for chickens of the layerand broiler strains (Fig. 7). Some proteins demonstrated mas-sive pool expansion, whereas others declined to a similardegree, covering a measurable dynamic range across all pro-teins of 10–550 nmol/g for a single protein (GAPDH) and aslow as 2 � 1 nmol/g (�-enolase; 1-day broiler). Thus, in asingle experiment we were able to assess protein concentra-tions over a 300-fold range.
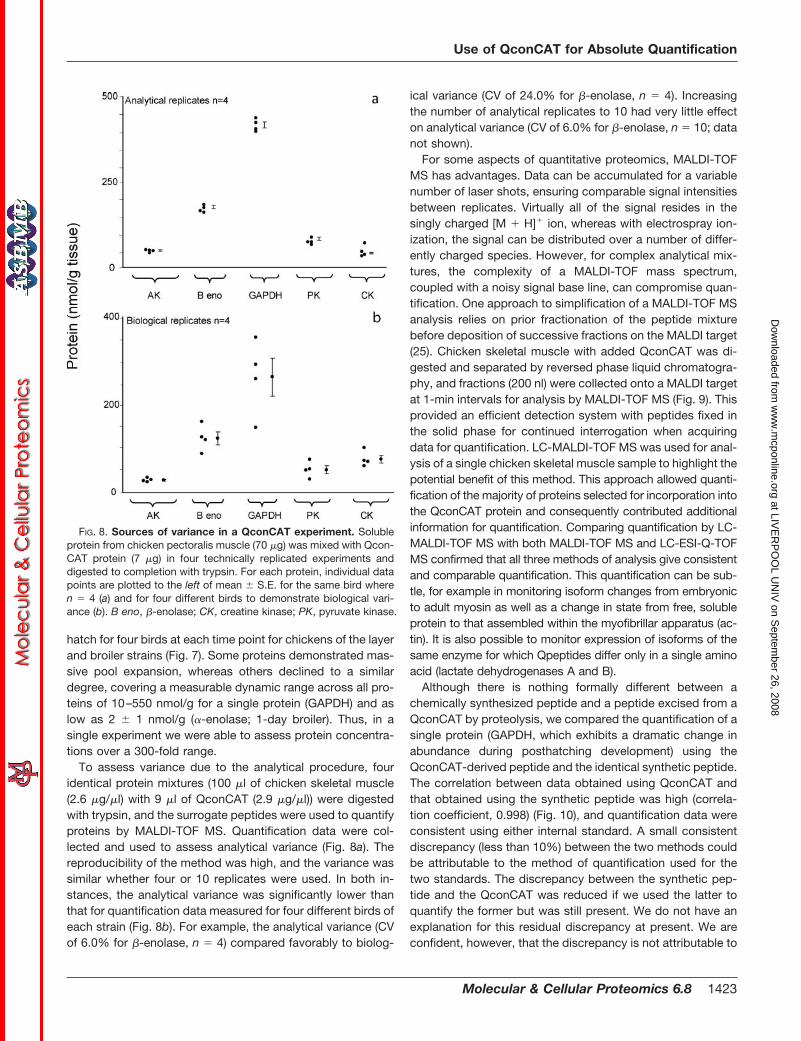
To assess variance due to the analytical procedure, fouridentical protein mixtures (100 �l of chicken skeletal muscle(2.6 �g/�l) with 9 �l of QconCAT (2.9 �g/�l)) were digestedwith trypsin, and the surrogate peptides were used to quantifyproteins by MALDI-TOF MS. Quantification data were col-lected and used to assess analytical variance (Fig. 8a). Thereproducibility of the method was high, and the variance wassimilar whether four or 10 replicates were used. In both in-stances, the analytical variance was significantly lower thanthat for quantification data measured for four different birds ofeach strain (Fig. 8b). For example, the analytical variance (CVof 6.0% for �-enolase, n � 4) compared favorably to biolog-
ical variance (CV of 24.0% for �-enolase, n � 4). Increasingthe number of analytical replicates to 10 had very little effecton analytical variance (CV of 6.0% for �-enolase, n � 10; datanot shown).
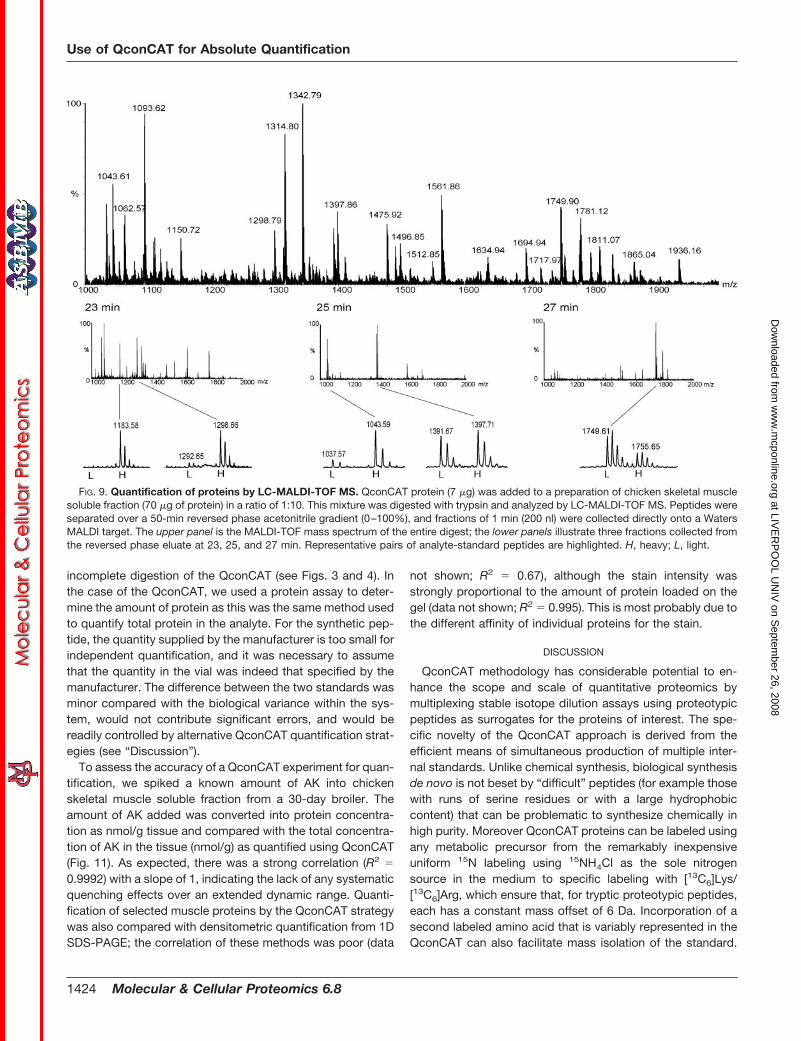
For some aspects of quantitative proteomics, MALDI-TOFMS has advantages. Data can be accumulated for a variablenumber of laser shots, ensuring comparable signal intensitiesbetween replicates. Virtually all of the signal resides in thesingly charged [M � H]� ion, whereas with electrospray ion-ization, the signal can be distributed over a number of differ-ently charged species. However, for complex analytical mix-tures, the complexity of a MALDI-TOF mass spectrum,coupled with a noisy signal base line, can compromise quan-tification. One approach to simplification of a MALDI-TOF MSanalysis relies on prior fractionation of the peptide mixturebefore deposition of successive fractions on the MALDI target(25). Chicken skeletal muscle with added QconCAT was di-gested and separated by reversed phase liquid chromatogra-phy, and fractions (200 nl) were collected onto a MALDI targetat 1-min intervals for analysis by MALDI-TOF MS (Fig. 9). Thisprovided an efficient detection system with peptides fixed inthe solid phase for continued interrogation when acquiringdata for quantification. LC-MALDI-TOF MS was used for anal-ysis of a single chicken skeletal muscle sample to highlight thepotential benefit of this method. This approach allowed quanti-fication of the majority of proteins selected for incorporation intothe QconCAT protein and consequently contributed additionalinformation for quantification. Comparing quantification by LC-MALDI-TOF MS with both MALDI-TOF MS and LC-ESI-Q-TOFMS confirmed that all three methods of analysis give consistentand comparable quantification. This quantification can be sub-tle, for example in monitoring isoform changes from embryonicto adult myosin as well as a change in state from free, solubleprotein to that assembled within the myofibrillar apparatus (ac-tin). It is also possible to monitor expression of isoforms of thesame enzyme for which Qpeptides differ only in a single aminoacid (lactate dehydrogenases A and B).
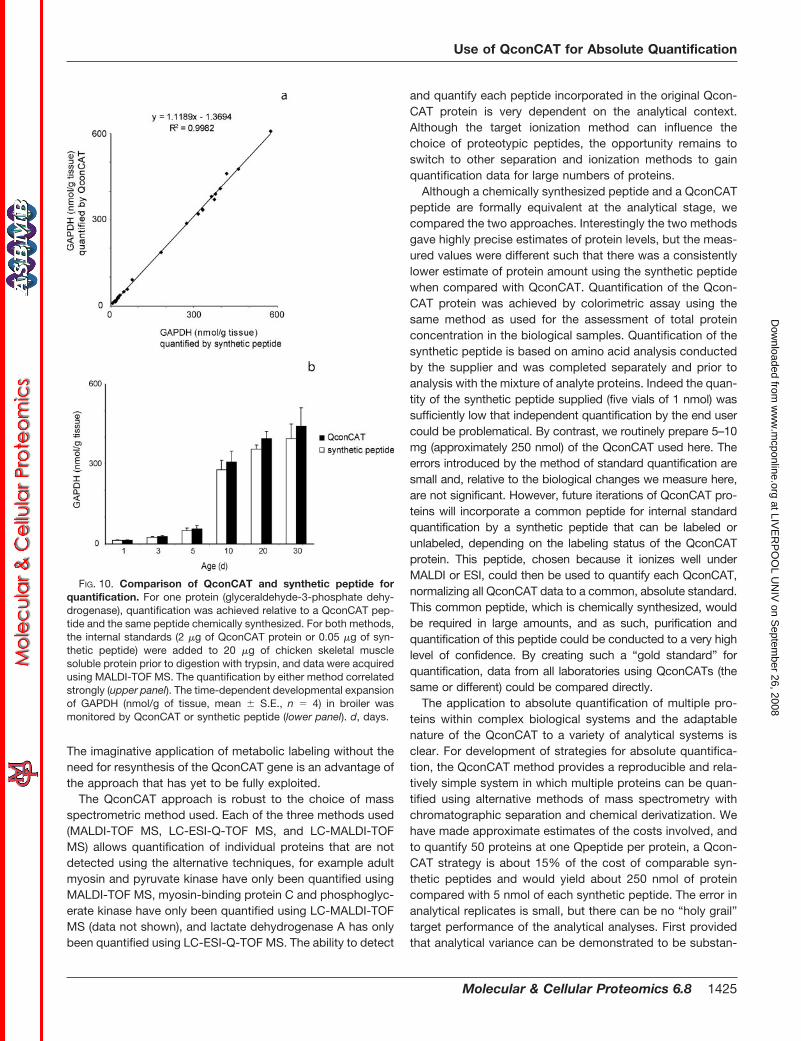
Although there is nothing formally different between achemically synthesized peptide and a peptide excised from aQconCAT by proteolysis, we compared the quantification of asingle protein (GAPDH, which exhibits a dramatic change inabundance during posthatching development) using theQconCAT-derived peptide and the identical synthetic peptide.The correlation between data obtained using QconCAT andthat obtained using the synthetic peptide was high (correla-tion coefficient, 0.998) (Fig. 10), and quantification data wereconsistent using either internal standard. A small consistentdiscrepancy (less than 10%) between the two methods couldbe attributable to the method of quantification used for thetwo standards. The discrepancy between the synthetic pep-tide and the QconCAT was reduced if we used the latter toquantify the former but was still present. We do not have anexplanation for this residual discrepancy at present. We areconfident, however, that the discrepancy is not attributable to
FIG. 8. Sources of variance in a QconCAT experiment. Solubleprotein from chicken pectoralis muscle (70 �g) was mixed with Qcon-CAT protein (7 �g) in four technically replicated experiments anddigested to completion with trypsin. For each protein, individual datapoints are plotted to the left of mean � S.E. for the same bird wheren � 4 (a) and for four different birds to demonstrate biological vari-ance (b). B eno, �-enolase; CK, creatine kinase; PK, pyruvate kinase.
Use of QconCAT for Absolute Quantification
Molecular & Cellular Proteomics 6.8 1423
at LIVE
RP
OO
L UN
IV on S
eptember 26, 2008
ww
w.m
cponline.orgD
ownloaded from
incomplete digestion of the QconCAT (see Figs. 3 and 4). Inthe case of the QconCAT, we used a protein assay to deter-mine the amount of protein as this was the same method usedto quantify total protein in the analyte. For the synthetic pep-tide, the quantity supplied by the manufacturer is too small forindependent quantification, and it was necessary to assumethat the quantity in the vial was indeed that specified by themanufacturer. The difference between the two standards wasminor compared with the biological variance within the sys-tem, would not contribute significant errors, and would bereadily controlled by alternative QconCAT quantification strat-egies (see “Discussion”).
To assess the accuracy of a QconCAT experiment for quan-tification, we spiked a known amount of AK into chickenskeletal muscle soluble fraction from a 30-day broiler. Theamount of AK added was converted into protein concentra-tion as nmol/g tissue and compared with the total concentra-tion of AK in the tissue (nmol/g) as quantified using QconCAT(Fig. 11). As expected, there was a strong correlation (R2 �
0.9992) with a slope of 1, indicating the lack of any systematicquenching effects over an extended dynamic range. Quanti-fication of selected muscle proteins by the QconCAT strategywas also compared with densitometric quantification from 1DSDS-PAGE; the correlation of these methods was poor (data
not shown; R2 � 0.67), although the stain intensity wasstrongly proportional to the amount of protein loaded on thegel (data not shown; R2 � 0.995). This is most probably due tothe different affinity of individual proteins for the stain.
DISCUSSION
QconCAT methodology has considerable potential to en-hance the scope and scale of quantitative proteomics bymultiplexing stable isotope dilution assays using proteotypicpeptides as surrogates for the proteins of interest. The spe-cific novelty of the QconCAT approach is derived from theefficient means of simultaneous production of multiple inter-nal standards. Unlike chemical synthesis, biological synthesisde novo is not beset by “difficult” peptides (for example thosewith runs of serine residues or with a large hydrophobiccontent) that can be problematic to synthesize chemically inhigh purity. Moreover QconCAT proteins can be labeled usingany metabolic precursor from the remarkably inexpensiveuniform 15N labeling using 15NH4Cl as the sole nitrogensource in the medium to specific labeling with [13C6]Lys/[13C6]Arg, which ensure that, for tryptic proteotypic peptides,each has a constant mass offset of 6 Da. Incorporation of asecond labeled amino acid that is variably represented in theQconCAT can also facilitate mass isolation of the standard.
FIG. 9. Quantification of proteins by LC-MALDI-TOF MS. QconCAT protein (7 �g) was added to a preparation of chicken skeletal musclesoluble fraction (70 �g of protein) in a ratio of 1:10. This mixture was digested with trypsin and analyzed by LC-MALDI-TOF MS. Peptides wereseparated over a 50-min reversed phase acetonitrile gradient (0–100%), and fractions of 1 min (200 nl) were collected directly onto a WatersMALDI target. The upper panel is the MALDI-TOF mass spectrum of the entire digest; the lower panels illustrate three fractions collected fromthe reversed phase eluate at 23, 25, and 27 min. Representative pairs of analyte-standard peptides are highlighted. H, heavy; L, light.
Use of QconCAT for Absolute Quantification
1424 Molecular & Cellular Proteomics 6.8
at LIVE
RP
OO
L UN
IV on S
eptember 26, 2008
ww
w.m
cponline.orgD
ownloaded from
The imaginative application of metabolic labeling without theneed for resynthesis of the QconCAT gene is an advantage ofthe approach that has yet to be fully exploited.
The QconCAT approach is robust to the choice of massspectrometric method used. Each of the three methods used(MALDI-TOF MS, LC-ESI-Q-TOF MS, and LC-MALDI-TOFMS) allows quantification of individual proteins that are notdetected using the alternative techniques, for example adultmyosin and pyruvate kinase have only been quantified usingMALDI-TOF MS, myosin-binding protein C and phosphoglyc-erate kinase have only been quantified using LC-MALDI-TOFMS (data not shown), and lactate dehydrogenase A has onlybeen quantified using LC-ESI-Q-TOF MS. The ability to detect
and quantify each peptide incorporated in the original Qcon-CAT protein is very dependent on the analytical context.Although the target ionization method can influence thechoice of proteotypic peptides, the opportunity remains toswitch to other separation and ionization methods to gainquantification data for large numbers of proteins.
Although a chemically synthesized peptide and a QconCATpeptide are formally equivalent at the analytical stage, wecompared the two approaches. Interestingly the two methodsgave highly precise estimates of protein levels, but the meas-ured values were different such that there was a consistentlylower estimate of protein amount using the synthetic peptidewhen compared with QconCAT. Quantification of the Qcon-CAT protein was achieved by colorimetric assay using thesame method as used for the assessment of total proteinconcentration in the biological samples. Quantification of thesynthetic peptide is based on amino acid analysis conductedby the supplier and was completed separately and prior toanalysis with the mixture of analyte proteins. Indeed the quan-tity of the synthetic peptide supplied (five vials of 1 nmol) wassufficiently low that independent quantification by the end usercould be problematical. By contrast, we routinely prepare 5–10mg (approximately 250 nmol) of the QconCAT used here. Theerrors introduced by the method of standard quantification aresmall and, relative to the biological changes we measure here,are not significant. However, future iterations of QconCAT pro-teins will incorporate a common peptide for internal standardquantification by a synthetic peptide that can be labeled orunlabeled, depending on the labeling status of the QconCATprotein. This peptide, chosen because it ionizes well underMALDI or ESI, could then be used to quantify each QconCAT,normalizing all QconCAT data to a common, absolute standard.This common peptide, which is chemically synthesized, wouldbe required in large amounts, and as such, purification andquantification of this peptide could be conducted to a very highlevel of confidence. By creating such a “gold standard” forquantification, data from all laboratories using QconCATs (thesame or different) could be compared directly.
The application to absolute quantification of multiple pro-teins within complex biological systems and the adaptablenature of the QconCAT to a variety of analytical systems isclear. For development of strategies for absolute quantifica-tion, the QconCAT method provides a reproducible and rela-tively simple system in which multiple proteins can be quan-tified using alternative methods of mass spectrometry withchromatographic separation and chemical derivatization. Wehave made approximate estimates of the costs involved, andto quantify 50 proteins at one Qpeptide per protein, a Qcon-CAT strategy is about 15% of the cost of comparable syn-thetic peptides and would yield about 250 nmol of proteincompared with 5 nmol of each synthetic peptide. The error inanalytical replicates is small, but there can be no “holy grail”target performance of the analytical analyses. First providedthat analytical variance can be demonstrated to be substan-
FIG. 10. Comparison of QconCAT and synthetic peptide forquantification. For one protein (glyceraldehyde-3-phosphate dehy-drogenase), quantification was achieved relative to a QconCAT pep-tide and the same peptide chemically synthesized. For both methods,the internal standards (2 �g of QconCAT protein or 0.05 �g of syn-thetic peptide) were added to 20 �g of chicken skeletal musclesoluble protein prior to digestion with trypsin, and data were acquiredusing MALDI-TOF MS. The quantification by either method correlatedstrongly (upper panel). The time-dependent developmental expansionof GAPDH (nmol/g of tissue, mean � S.E., n � 4) in broiler wasmonitored by QconCAT or synthetic peptide (lower panel). d, days.
Use of QconCAT for Absolute Quantification
Molecular & Cellular Proteomics 6.8 1425
at LIVE
RP
OO
L UN
IV on S
eptember 26, 2008
ww
w.m
cponline.orgD
ownloaded from
tially smaller than biological variance (as we have demon-strated here and indeed the normal expectation), it might beargued that there is a much reduced need to perform analyt-ical replicates and that the effort should be directed towardacquisition of greater biological insight by adding new biolog-ical replicates.
For identification proteomics, little regard is paid to thecompleteness of the digestion of the analyte peptide; the goalis to generate sufficient peptides that are readily ionizedand/or fragmented for unambiguous identification. Indeedmost search engines are tolerant of and include options tomatch one or more than one “missed cleavage.” However,when the goal shifts to the more demanding task of peptide-based quantification, it is essential that due cognizance isgiven to the proteolytic reactions that generate the peptidesthat are to be used for quantification irrespective of themethod. The goal has to be complete digestion, and there areseveral approaches that can be taken to ensure that this hasoccurred. This should also be checked experimentally. Itwould also be feasible to embed two Qpeptides for eachprotein in a single QconCAT or even two different QconCATsto enhance confidence, but we do not subscribe to the viewthat this is necessary in many instances. Finally our experi-ence with a large number of QconCATs2 is that they areproteolyzed at rates that are far higher than analyte proteins.
In all of these QconCAT constructs, we made no attempt topreserve the primary sequence context of the Qpeptides, andit is clear that this is not an important factor in QconCATdesign; the selection of suitable proteotypic peptides in thedesign phase is much more critical. In this regard, the recentwork by Aebersold and co-workers (26) points the way towardmore effective nomination of Qpeptides for QconCATs.
Acknowledgments—We thank the Roslin Institute, Edinburgh, UKfor growing birds and collecting muscle samples. We are grateful toDr. Dominique Rocha, Genus plc, for interest in this work.
* This work was supported by Biotechnology and Biological Sci-ences Research Council Grant BB/C007433/1 (to R. J. B. andS. J. G.) and by Genus plc. The costs of publication of this article weredefrayed in part by the payment of page charges. This article musttherefore be hereby marked “advertisement” in accordance with 18U.S.C. Section 1734 solely to indicate this fact.
¶ To whom correspondence should be addressed: Proteomics andFunctional Genomics Group, Faculty of Veterinary Science, Universityof Liverpool, Crown St., Liverpool L69 7ZJ, UK. Tel.: 44-151-794-4312; Fax: 44-151-794-4243; E-mail: [email protected].
REFERENCES
1. Ong, S. E., Blagoev, B., Kratchmarova, I., Kristensen, D. B., Steen, H.,Pandey, A., and Mann, M. (2002) Stable isotope labeling by amino acidsin cell culture, SILAC, as a simple and accurate approach to expressionproteomics. Mol. Cell. Proteomics 1, 376–386
2. Sechi, S., and Oda, Y. (2003) Quantitative proteomics using mass spec-trometry. Curr. Opin. Chem. Biol. 7, 70–77
3. Gygi, S. P., Rist, B., Gerber, S. A., Turecek, F., Gelb, M. H., and Aebersold,R. (1999) Quantitative analysis of complex protein mixtures using iso-tope-coded affinity tags. Nat. Biotechnol. 17, 994–999
2 J. Rivers, D. M. Simpson, D. H. L. Robertson, S. J. Gaskell, andR. J. Beynon, unpublished observations.
FIG. 11. Investigation of the accu-racy of quantification using QconCAT.Purified AK was added to chicken skel-etal muscle soluble fraction from a 30-day (d) broiler. AK was added from 0 to0.02 nmol, which resulted in a final pro-tein concentration of 0–300 nmol/g, andthe amount of AK in the tissue was quan-tified by adding 0.015 nmol of QconCATprior to digestion with trypsin. Proteoly-sis was allowed to continue for 24 h afterwhich peptides were analyzed byMALDI-TOF MS. The upper panel showsthe correlation between AK added andthat quantified in the muscle usingQconCAT after digestion with trypsin.Spectra showing the change in MALDI-TOF mass spectral signal intensity overthe range of protein concentrations usedin this experiment are shown beneath.
Use of QconCAT for Absolute Quantification
1426 Molecular & Cellular Proteomics 6.8
at LIVE
RP
OO
L UN
IV on S
eptember 26, 2008
ww
w.m
cponline.orgD
ownloaded from
4. Cagney, G., and Emili, A. (2002) De novo peptide sequencing and quanti-tative profiling of complex protein mixtures using mass-coded abun-dance tagging. Nat. Biotechnol. 20, 163–170
5. Higgs, R. E., Knierman, M. D., Gelfanova, V., Butler, J. P., and Hale, J. E.(2005) Comprehensive label-free method for the relative quantification ofproteins from biological samples. J. Proteome Res. 4, 1442–1450
6. Gerber, S. A., Rush, J., Stemman, O., Kirschner, M. W., and Gygi, S. P.(2003) Absolute quantification of proteins and phosphoproteins from celllysates by tandem MS. Proc. Natl. Acad. Sci. U. S. A. 100, 6940–6945
7. Kuhn, E., Wu, J., Karl, J., Liao, H., Zolg, W., and Guild, B. (2004) Quantifi-cation of C-reactive protein in the serum of patients with rheumatoidarthritis using multiple reaction monitoring mass spectrometry and 13C-labeled peptide standards. Proteomics 4, 1175–1186
8. Ishihama, Y., Sato, T., Tabata, T., Miyamoto, N., Sagane, K., Nagasu, T.,and Oda, Y. (2005) Quantitative mouse brain proteomics using culture-derived isotope tags as internal standards. Nat. Biotechnol. 23, 617–621
9. Kirkpatrick, D. S., Gerber, S. A., and Gygi, S. P. (2005) The absolutequantification strategy: a general procedure for the quantification ofproteins and post-translational modifications. Methods (Duluth) 35,265–273
10. Pan, S., Zhang, H., Rush, J., Eng, J., Zhang, N., Patterson, D., Comb, M. J.,and Aebersold, R. (2005) High throughput proteome screening for bi-omarker detection. Mol. Cell. Proteomics 4, 182–190
11. Beynon, R. J., Doherty, M. K., Pratt, J. M., and Gaskell, S. J. (2005)Multiplexed absolute quantification in proteomics using artificial QCATproteins of concatenated signature peptides. Nat. Methods 2, 587–589
12. Pratt, J. M., Simpson, D. M., Doherty, M. K., J., R., Gaskell, S. J., andBeynon, R. J. (2006) Multiplexed absolute quantification for proteomicsusing concatenated signature peptides encoded by QconCAT genes.Nat. Protocols 1, 1029–1043
13. Kito, K., Ota, K., Fujita, T., and Ito, T. (2007) A synthetic protein approachtoward accurate mass spectrometric quantification of component stoi-chiometry of multiprotein complexes. J. Proteome Res. 6, 792–800
14. Hubbard, S. J., and Beynon, R. J. (2001) Proteolysis of native proteins as astructural probe, in Proteolytic Enzymes. A Practical Approach (Beynon,R. J., and Bond, J. S., eds) pp. 233–264, Oxford University Press, Oxford
15. Hubbard, S. J. (1998) The structural aspects of limited proteolysis of nativeproteins. Biochim. Biophys. Acta 1382, 191–206
16. Zappacosta, F., Pessi, A., Bianchi, E., Venturini, S., Sollazzo, M., Tramon-tano, A., Marino, G., and Pucci, P. (1996) Probing the tertiary structure of
proteins by limited proteolysis and mass spectrometry: the case ofMinibody. Protein Sci. 5, 802–813
17. Hubbard, S. J., Beynon, R. J., and Thornton, J. M. (1998) Assessment ofconformational parameters as predictors of limited proteolytic sites innative protein structures. Protein Eng. 11, 349–359
18. Wu, C., Robertson, D. H., Hubbard, S. J., Gaskell, S. J., and Beynon, R. J.(1999) Proteolysis of native proteins. Trapping of a reaction intermediate.J. Biol. Chem. 274, 1108–1115
19. Brancia, F. L., Oliver, S. G., and Gaskell, S. J. (2000) Improved matrix-assisted laser desorption/ionization mass spectrometric analysis of tryp-tic hydrolysates of proteins following guanidination of lysine-containingpeptides. Rapid Commun. Mass Spectrom. 14, 2070–2073
20. Hale, J. E., Butler, J. P., Knierman, M. D., and Becker, G. W. (2000)Increased sensitivity of tryptic peptide detection by MALDI-TOF massspectrometry is achieved by conversion of lysine to homoarginine. Anal.Biochem. 287, 110–117
21. Doherty, M. K., McLean, L., Hayter, J. R., Pratt, J. M., Robertson, D. H.,El-Shafei, A., Gaskell, S. J., and Beynon, R. J. (2004) The proteome ofchicken skeletal muscle: changes in soluble protein expression duringgrowth in a layer strain. Proteomics 4, 2082–2093
22. McLean, L., Doherty, M. K., Deeming, D. C., and Beynon, R. J. (2004) Aproteome analysis of the subcutaneous gel in avian hatchlings. Mol. Cell.Proteomics 3, 250–256
23. Baumgart, S., Lindner, Y., Kuhne, R., Oberemm, A., Wenschuh, H., andKrause, E. (2004) The contributions of specific amino acid side chains tosignal intensities of peptides in matrix-assisted laser desorption/ioniza-tion mass spectrometry. Rapid Commun. Mass Spectrom. 18, 863–868
24. Krause, E., Wenschuh, H., and Jungblut, P. R. (1999) The dominance ofarginine-containing peptides in MALDI-derived tryptic mass fingerprintsof proteins. Anal. Chem. 71, 4160–4165
25. Mirgorodskaya, E., Braeuer, C., Fucini, P., Lehrach, H., and Gobom, J.(2005) Nanoflow liquid chromatography coupled to matrix-assisted laserdesorption/ionization mass spectrometry: sample preparation, dataanalysis, and application to the analysis of complex peptide mixtures.Proteomics 5, 399–408
26. Mallick, P., Schirle, M., Chen, S. S., Flory, M. R., Lee, H., Martin, D., Ranish,J., Raught, B., Schmitt, R., Werner, T., Kuster, B., and Aebersold, R.(2007) Computational prediction of proteotypic peptides for quantitativeproteomics. Nat. Biotechnol. 25, 125–131
Use of QconCAT for Absolute Quantification
Molecular & Cellular Proteomics 6.8 1427
at LIVE
RP
OO
L UN
IV on S
eptember 26, 2008
ww
w.m
cponline.orgD
ownloaded from


![A Review on Quantitative Multiplexed Proteomics...A Review on Quantitative Multiplexed Proteomics Nishant Pappireddi, [a, b] ... Protein Identification and Quantification in Mass Spectrometry-Based](https://img.pdfslide.us/doc/110x75/5e7f3f3acedae249de4f489a/a-review-on-quantitative-multiplexed-proteomics-a-review-on-quantitative-multiplexed.jpg)