Embed Size (px)
Citation preview

ABS Investor Presentation
February 2020
2019 (01-14-20) Version 1.0 6:00pm
All-Electric Mustang Mach-E
2
CONTACT INFORMATION
Ryan HershbergerGlobal Funding(313) 248-1144
Kelly DaltonLease and Floorplan ABS
(313) [email protected]
Brian MerxRetail ABS
(313) 390-7710 [email protected]
Karen RocoffInvestor Relations
(313) [email protected]
www.shareholder.ford.comwww.fordcredit.com/investor-center
Agenda
Corporate Overview 3
Ford Credit 14
U.S. Retail/Lease Origination and Servicing Strategy 24
U.S. Retail Securitization 28
U.S. FordREV Securitization 37
U.S. Lease Securitization 49
U.S. Floorplan Securitization 62
U.S. Floorplan Risk Management 71
Appendix 77

All-Electric Mustang Mach-E
Corporate Overview
4
5
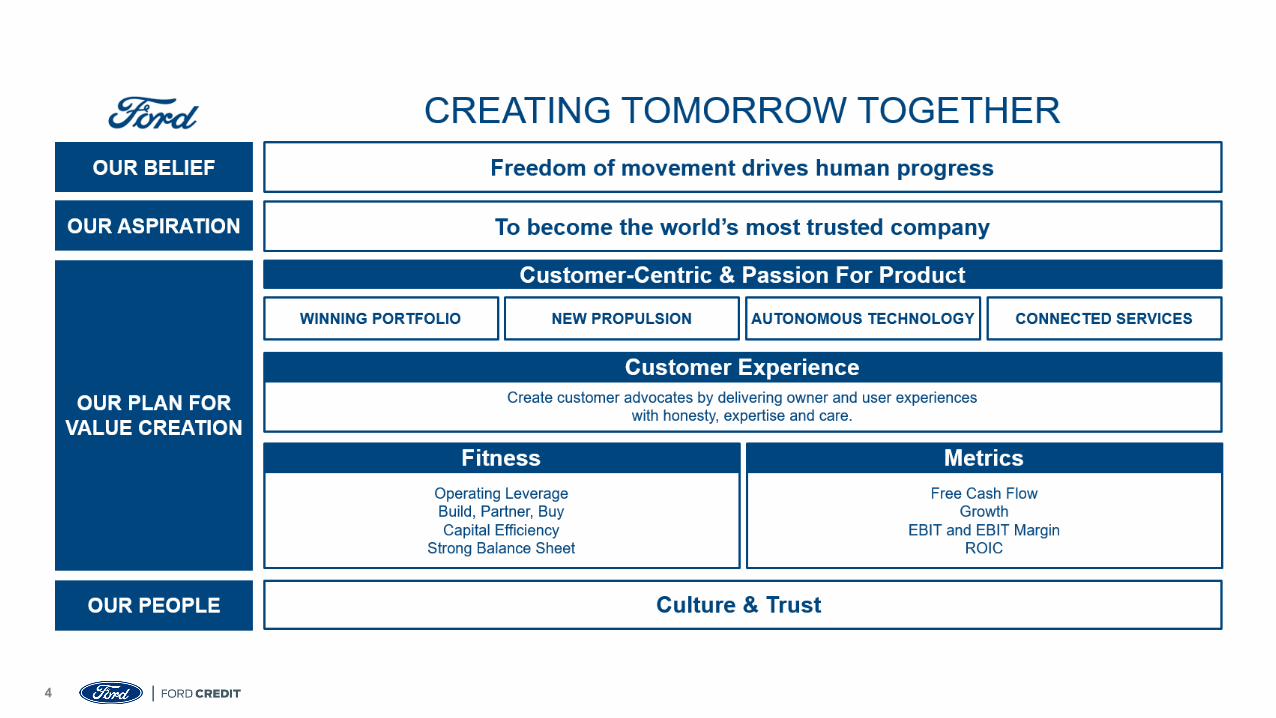
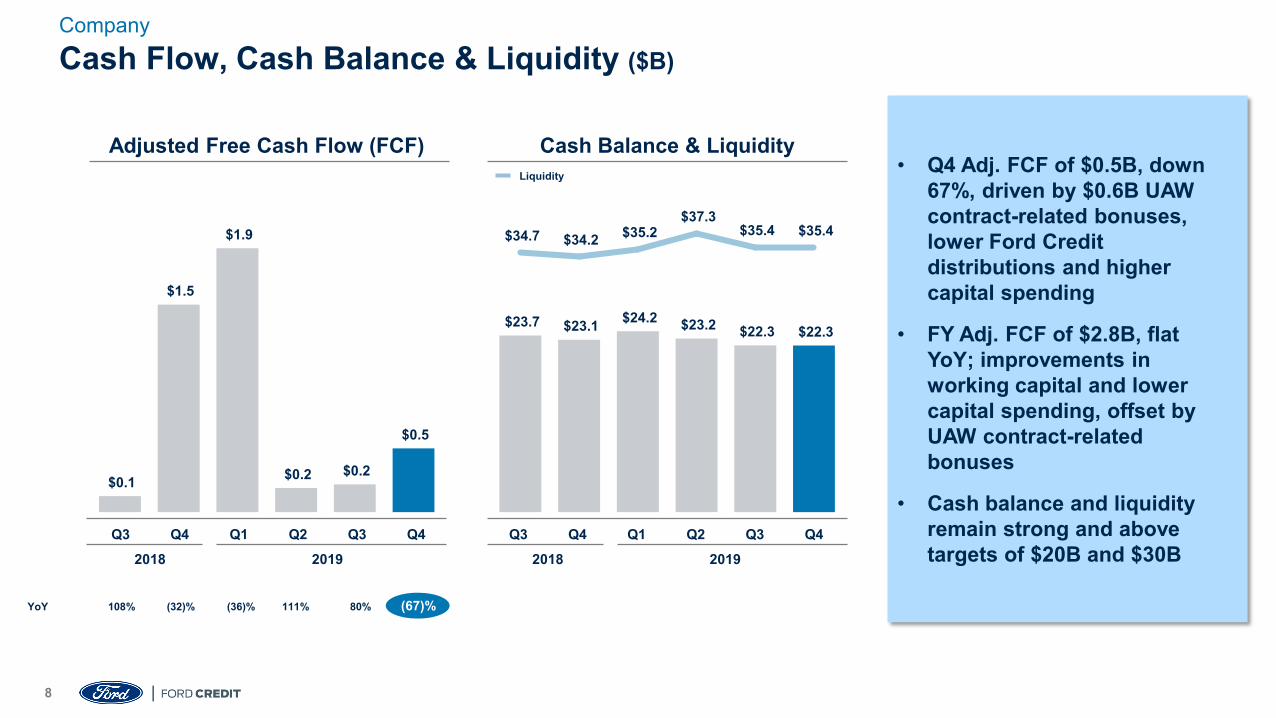
Cash Balance $22B; Liquidity $35B
Financial Results
Adjusted EPS Adjusted EBIT Margin
Adjusted EBIT
Down 67%$0.5B
Q4
$6.4BFY
Down 9%
Adjusted Free Cash Flow
Down 67%$0.5B
Q4
$2.8BFY
Flat
Down 5%$40B
Q4
$156BFY
Down 3%
Revenue
Down 227 bps1.2%
Q4
4.1%FY
Down 27 bpsDown $0.18 $0.12
Q4
$1.19FY
Down $0.11
Company
6
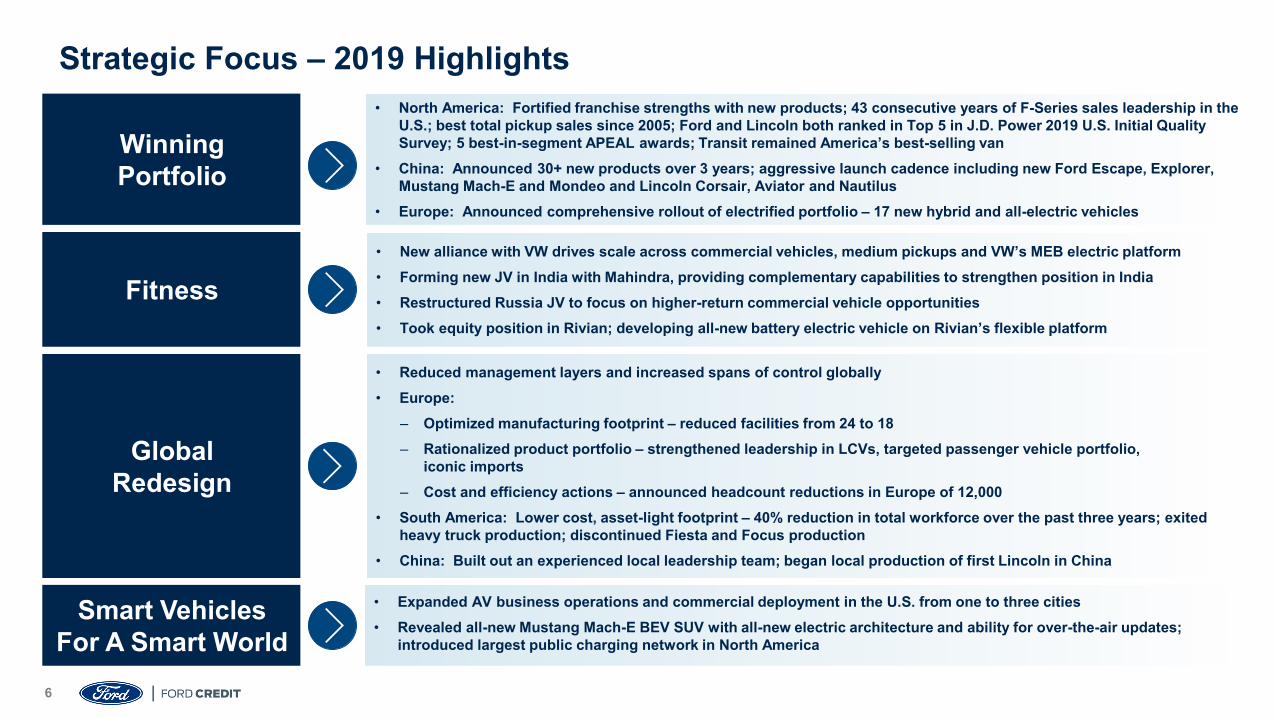
Strategic Focus – 2019 Highlights
• Reduced management layers and increased spans of control globally• Europe:
– Optimized manufacturing footprint – reduced facilities from 24 to 18– Rationalized product portfolio – strengthened leadership in LCVs, targeted passenger vehicle portfolio,
iconic imports– Cost and efficiency actions – announced headcount reductions in Europe of 12,000
• South America: Lower cost, asset-light footprint – 40% reduction in total workforce over the past three years; exited heavy truck production; discontinued Fiesta and Focus production
• China: Built out an experienced local leadership team; began local production of first Lincoln in China
Global Redesign
• Expanded AV business operations and commercial deployment in the U.S. from one to three cities• Revealed all-new Mustang Mach-E BEV SUV with all-new electric architecture and ability for over-the-air updates;
introduced largest public charging network in North America
Smart Vehicles For A Smart World
• New alliance with VW drives scale across commercial vehicles, medium pickups and VW’s MEB electric platform• Forming new JV in India with Mahindra, providing complementary capabilities to strengthen position in India• Restructured Russia JV to focus on higher-return commercial vehicle opportunities• Took equity position in Rivian; developing all-new battery electric vehicle on Rivian’s flexible platform
Fitness
• North America: Fortified franchise strengths with new products; 43 consecutive years of F-Series sales leadership in the U.S.; best total pickup sales since 2005; Ford and Lincoln both ranked in Top 5 in J.D. Power 2019 U.S. Initial Quality Survey; 5 best-in-segment APEAL awards; Transit remained America’s best-selling van
• China: Announced 30+ new products over 3 years; aggressive launch cadence including new Ford Escape, Explorer, Mustang Mach-E and Mondeo and Lincoln Corsair, Aviator and Nautilus
• Europe: Announced comprehensive rollout of electrified portfolio – 17 new hybrid and all-electric vehicles
Winning Portfolio

7
Portfolio Transformation Underway With SignificantNew Introductions From Late 2018 Through Early 2021
Winning Portfolio
Super Duty
North America South America ChinaEurope Asia Pacific Ops Middle East & Africa Hybrid / Electric OfferingNot Yet In Showrooms
Small, RuggedOff-Road Utility
Puma
F-150
Bronco
Ranger
Explorer
AviatorEscape / Kuga
Transit 2T
CorsairTerritoryMustangMach-E
8
Cash Flow, Cash Balance & Liquidity ($B)
• Q4 Adj. FCF of $0.5B, down 67%, driven by $0.6B UAW contract-related bonuses, lower Ford Credit distributions and higher capital spending
• FY Adj. FCF of $2.8B, flat YoY; improvements in working capital and lower capital spending, offset by UAW contract-related bonuses
• Cash balance and liquidity remain strong and above targets of $20B and $30B
YoY 108% (32)% (36)% 111% 80% (67)%
Adjusted Free Cash Flow (FCF)
$0.1
$1.5
$1.9
$0.2 $0.2
$0.5
Cash Balance & Liquidity
$23.7 $23.1 $24.2 $23.2 $22.3 $22.3
$34.7 $34.2 $35.2 $37.3
$35.4 $35.4
Liquidity
Q3 Q4 Q1 Q2 Q3 Q42018 2019
Q3 Q4 Q1 Q2 Q3 Q42018 2019
Company
9
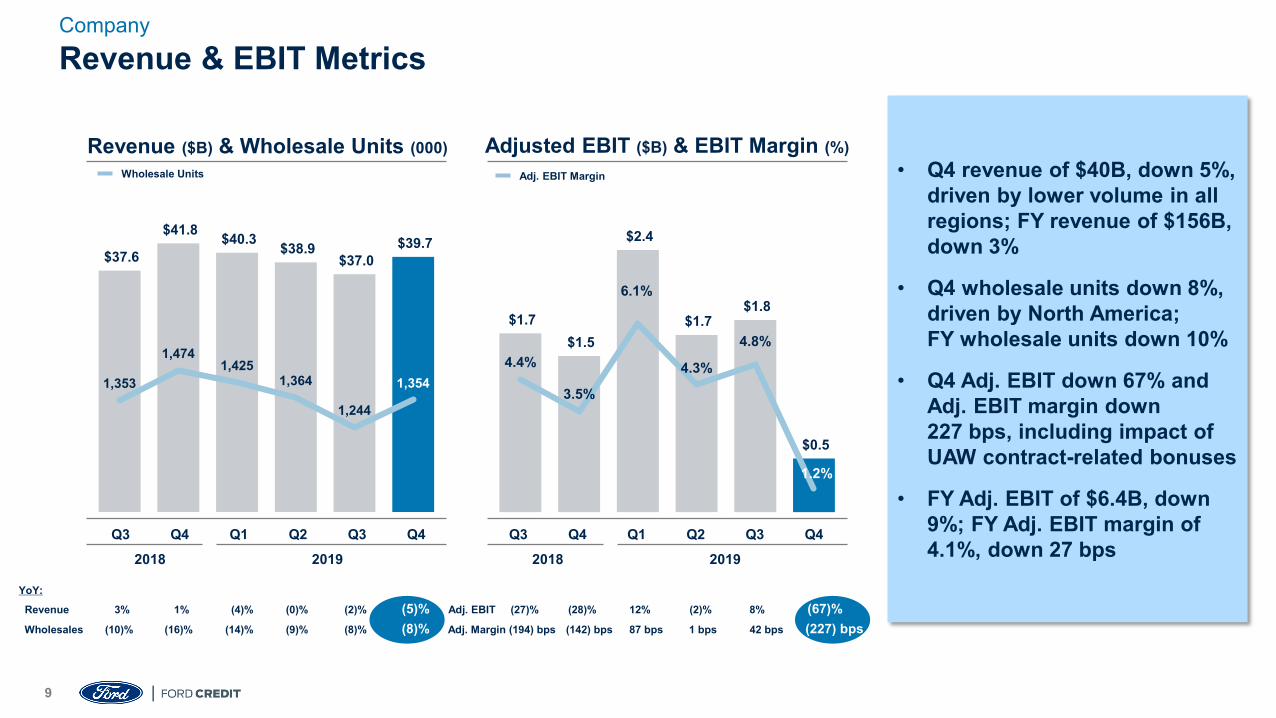
Revenue & EBIT Metrics
• Q4 revenue of $40B, down 5%, driven by lower volume in all regions; FY revenue of $156B, down 3%
• Q4 wholesale units down 8%, driven by North America; FY wholesale units down 10%
• Q4 Adj. EBIT down 67% and Adj. EBIT margin down 227 bps, including impact of UAW contract-related bonuses
• FY Adj. EBIT of $6.4B, down 9%; FY Adj. EBIT margin of 4.1%, down 27 bps
YoY:
Revenue 3% 1% (4)% (0)% (2)% (5)% Adj. EBIT (27)% (28)% 12% (2)% 8% (67)%Wholesales (10)% (16)% (14)% (9)% (8)% (8)% Adj. Margin (194) bps (142) bps 87 bps 1 bps 42 bps (227) bps
Adjusted EBIT ($B) & EBIT Margin (%)
$1.7 $1.5
$2.4
$1.7 $1.8
$0.5
4.4%
3.5%
6.1%
4.3%
4.8%
1.2%
Revenue ($B) & Wholesale Units (000)
$37.6
$41.8 $40.3 $38.9 $37.0
$39.7
1,353
1,4741,425
1,364
1,244
1,354
Wholesale Units Adj. EBIT Margin
Q3 Q4 Q1 Q2 Q3 Q42018 2019
Q3 Q4 Q1 Q2 Q3 Q42018 2019
Company
10
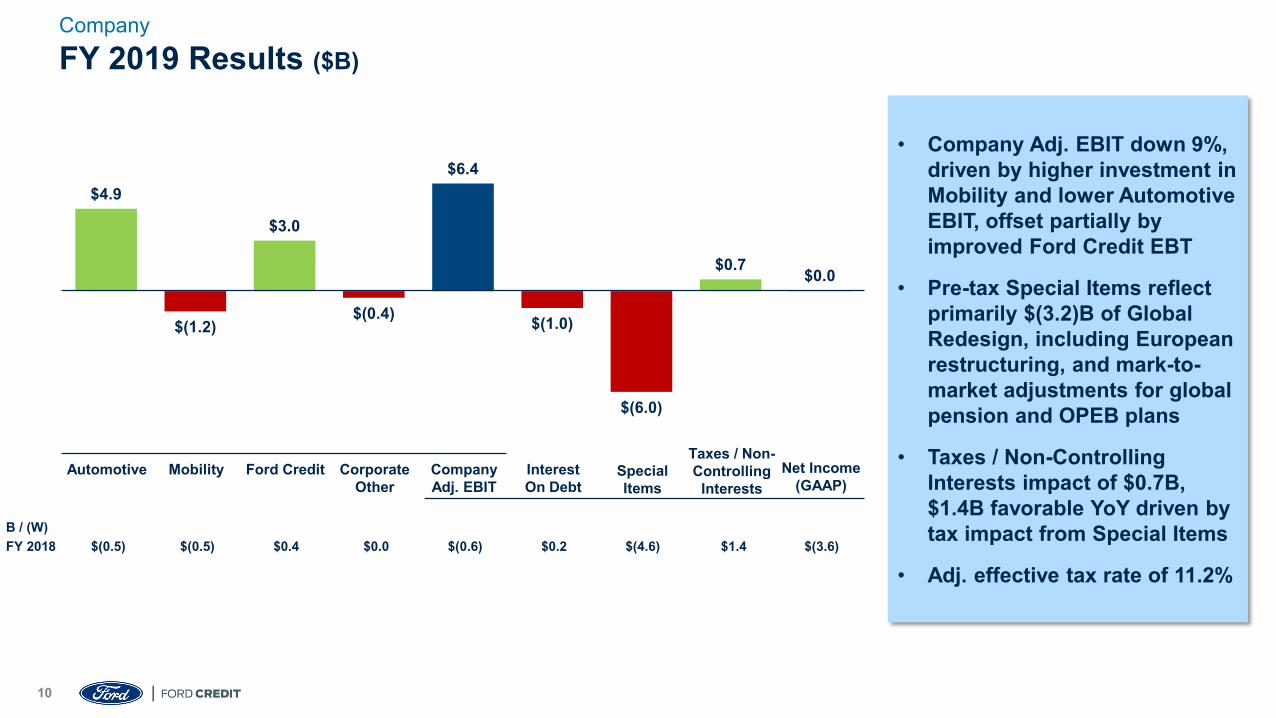
FY 2019 Results ($B)
B / (W) FY 2018 $(0.5) $(0.5) $0.4 $0.0 $(0.6) $0.2 $(4.6) $1.4 $(3.6)
$4.9
$(1.2)
$3.0
$(0.4)
$6.4
$(1.0)
$(6.0)
$0.7 $0.0
• Company Adj. EBIT down 9%, driven by higher investment in Mobility and lower Automotive EBIT, offset partially by improved Ford Credit EBT
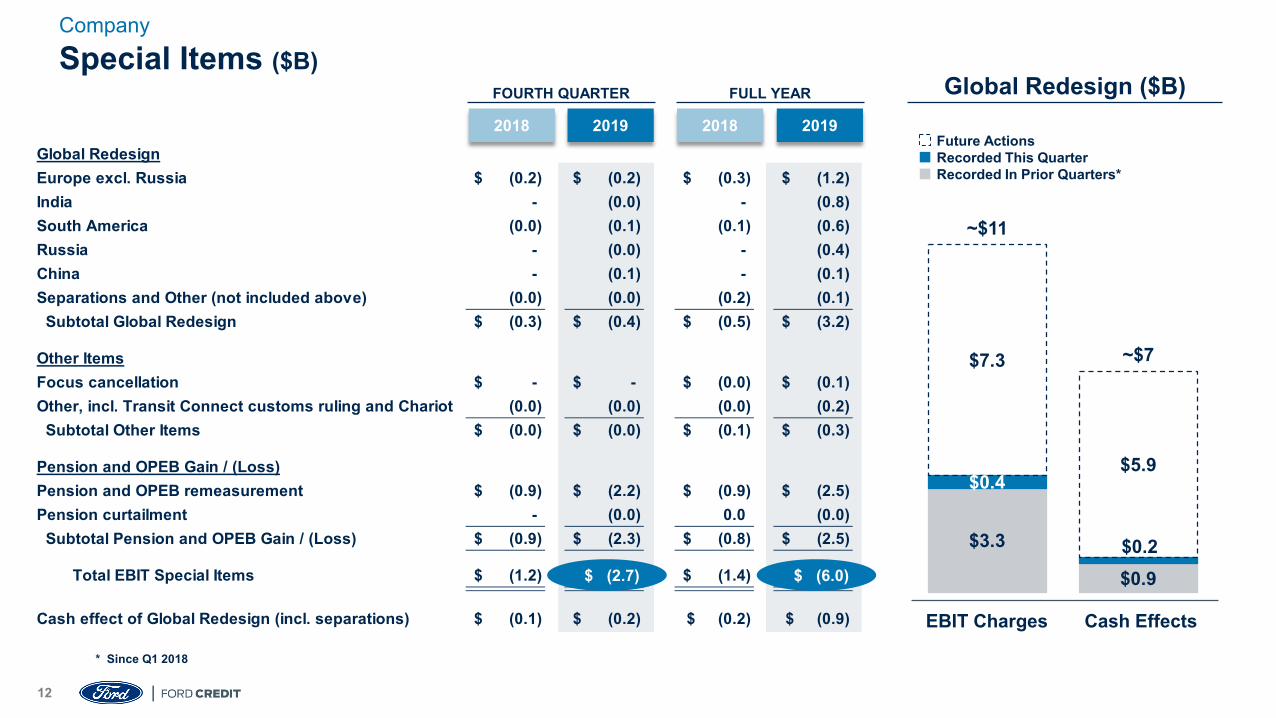
• Pre-tax Special Items reflect primarily $(3.2)B of Global Redesign, including European restructuring, and mark-to-market adjustments for global pension and OPEB plans
• Taxes / Non-Controlling Interests impact of $0.7B, $1.4B favorable YoY driven by tax impact from Special Items
• Adj. effective tax rate of 11.2%
Automotive Net Income (GAAP)
Ford CreditMobility Corporate Other
Company Adj. EBIT
Interest On Debt
SpecialItems
Taxes / Non-Controlling
Interests
Company
11
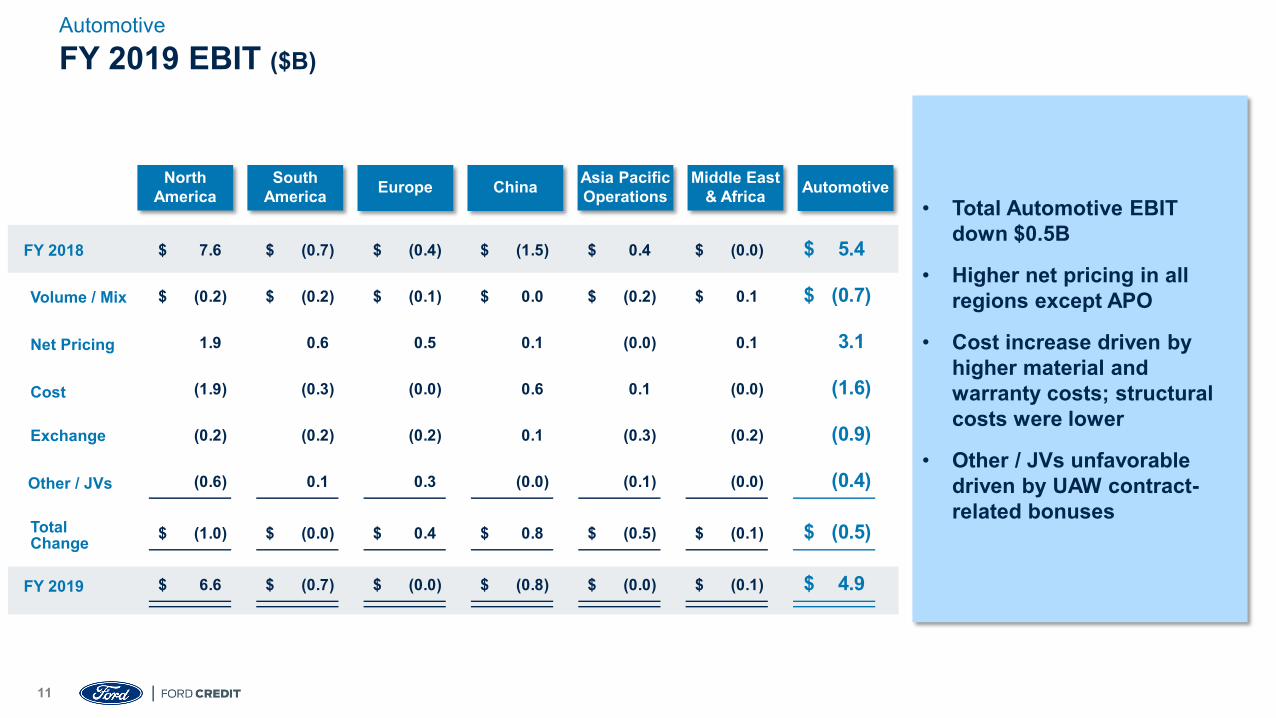
• Total Automotive EBIT down $0.5B
• Higher net pricing in all regions except APO
• Cost increase driven by higher material and warranty costs; structural costs were lower
• Other / JVs unfavorable driven by UAW contract-related bonuses
FY 2019 EBIT ($B)
Automotive China Middle East& Africa
Volume / Mix
Net Pricing
Other / JVs
Cost
FY 2018
Exchange
TotalChange
NorthAmerica Europe Asia Pacific
OperationsSouth
America
FY 2019
7.6$ (0.7)$ (0.4)$ (1.5)$ 0.4$ (0.0)$ 5.4$
(0.2)$ (0.2)$ (0.1)$ 0.0$ (0.2)$ 0.1$ (0.7)$
1.9 0.6 0.5 0.1 (0.0) 0.1 3.1
(1.9) (0.3) (0.0) 0.6 0.1 (0.0) (1.6)
(0.2) (0.2) (0.2) 0.1 (0.3) (0.2) (0.9)
(0.6) 0.1 0.3 (0.0) (0.1) (0.0) (0.4)
(1.0)$ (0.0)$ 0.4$ 0.8$ (0.5)$ (0.1)$ (0.5)$
6.6$ (0.7)$ (0.0)$ (0.8)$ (0.0)$ (0.1)$ 4.9$
Automotive
12
Global RedesignEurope excl. Russia (0.2)$ (0.2)$ (0.3)$ (1.2)$ India - (0.0) - (0.8) South America (0.0) (0.1) (0.1) (0.6) Russia - (0.0) - (0.4) China - (0.1) - (0.1) Separations and Other (not included above) (0.0) (0.0) (0.2) (0.1)
Subtotal Global Redesign (0.3)$ (0.4)$ (0.5)$ (3.2)$
Other ItemsFocus cancellation -$ -$ (0.0)$ (0.1)$ Other, incl. Transit Connect customs ruling and Chariot (0.0) (0.0) (0.0) (0.2) Subtotal Other Items (0.0)$ (0.0)$ (0.1)$ (0.3)$
Pension and OPEB Gain / (Loss)Pension and OPEB remeasurement (0.9)$ (2.2)$ (0.9)$ (2.5)$ Pension curtailment - (0.0) 0.0 (0.0) Subtotal Pension and OPEB Gain / (Loss) (0.9)$ (2.3)$ (0.8)$ (2.5)$
Total EBIT Special Items (1.2)$ (2.7)$ (1.4)$ (6.0)$
Cash effect of Global Redesign (incl. separations) (0.1)$ (0.2)$ (0.2)$ (0.9)$
$3.3
$0.9
$0.4
$0.2
$7.3
$5.9
~$11
~$7
Special Items ($B)
EBIT Charges Cash Effects
Future ActionsRecorded This QuarterRecorded In Prior Quarters*
Global Redesign ($B)20192018
FOURTH QUARTER
20192018
FULL YEAR
$ (2.7)
* Since Q1 2018
$ (6.0)
Company
13
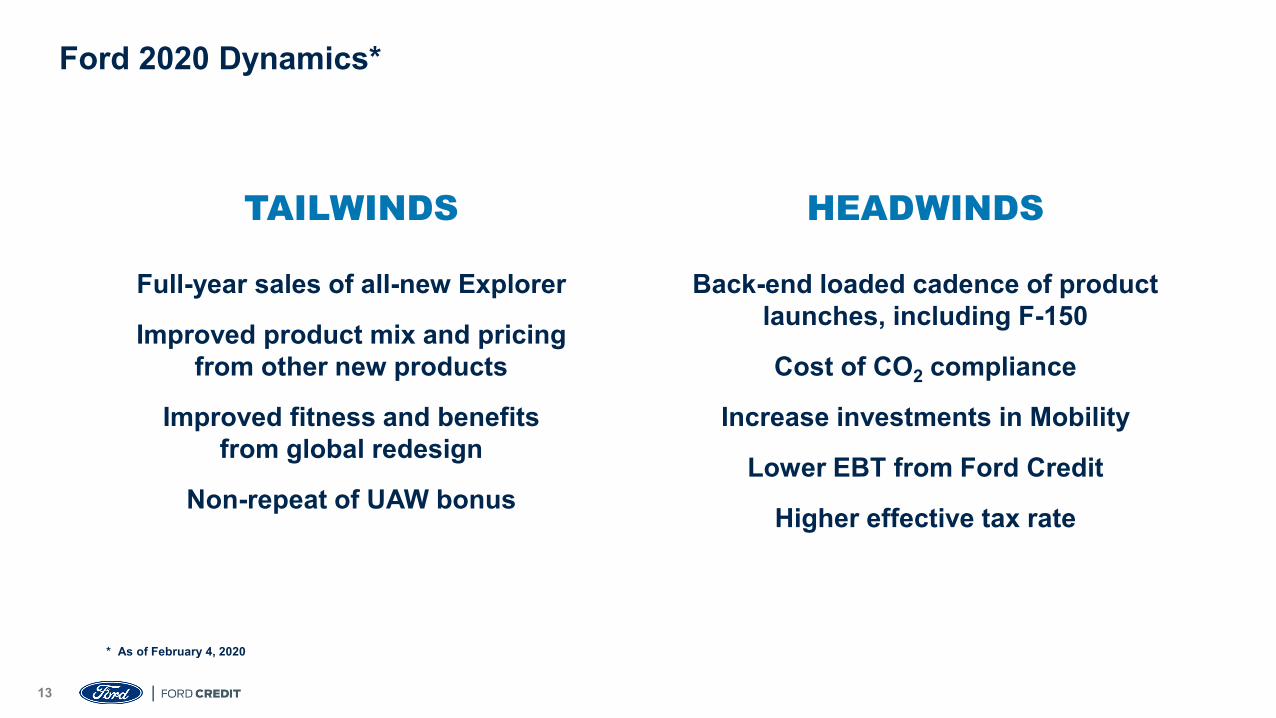
Ford 2020 Dynamics*
Full-year sales of all-new Explorer
Improved product mix and pricing from other new products
Improved fitness and benefits from global redesign
Non-repeat of UAW bonus
Back-end loaded cadence of product launches, including F-150
Cost of CO2 compliance
Increase investments in Mobility
Lower EBT from Ford Credit
Higher effective tax rate
TAILWINDS HEADWINDS
* As of February 4, 2020

All-Electric Mustang Mach-E
Ford Credit
15
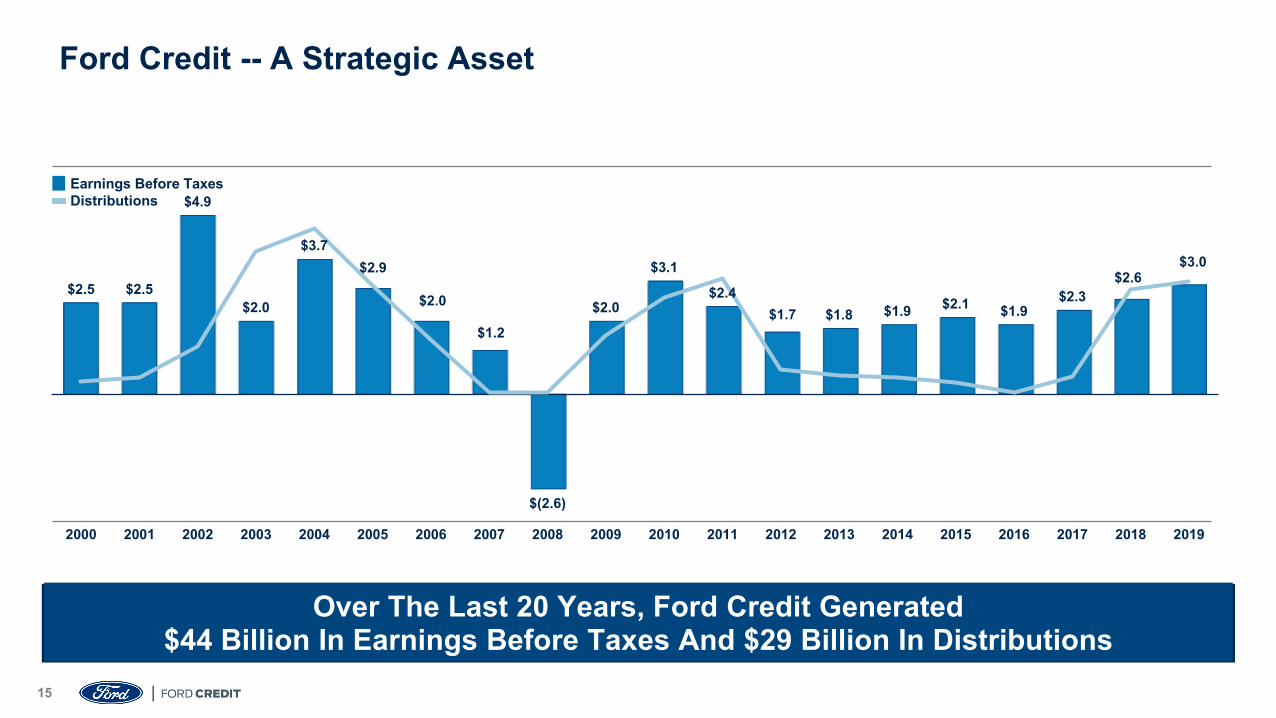
Over The Last 20 Years, Ford Credit Generated $44 Billion In Earnings Before Taxes And $29 Billion In Distributions
Ford Credit -- A Strategic Asset
$2.5 $2.5
$4.9
$2.0
$3.7 $2.9
$2.0
$1.2
$(2.6)
$2.0
$3.1
$2.4 $1.7 $1.8 $1.9 $2.1 $1.9
$2.3 $2.6
$3.0
2000 2001 2002 2003 2004 2005 2006 2007 2008 2009 2010 2011 2012 2013 2014 2015 2016 2017 2018 2019
Earnings Before TaxesDistributions
16
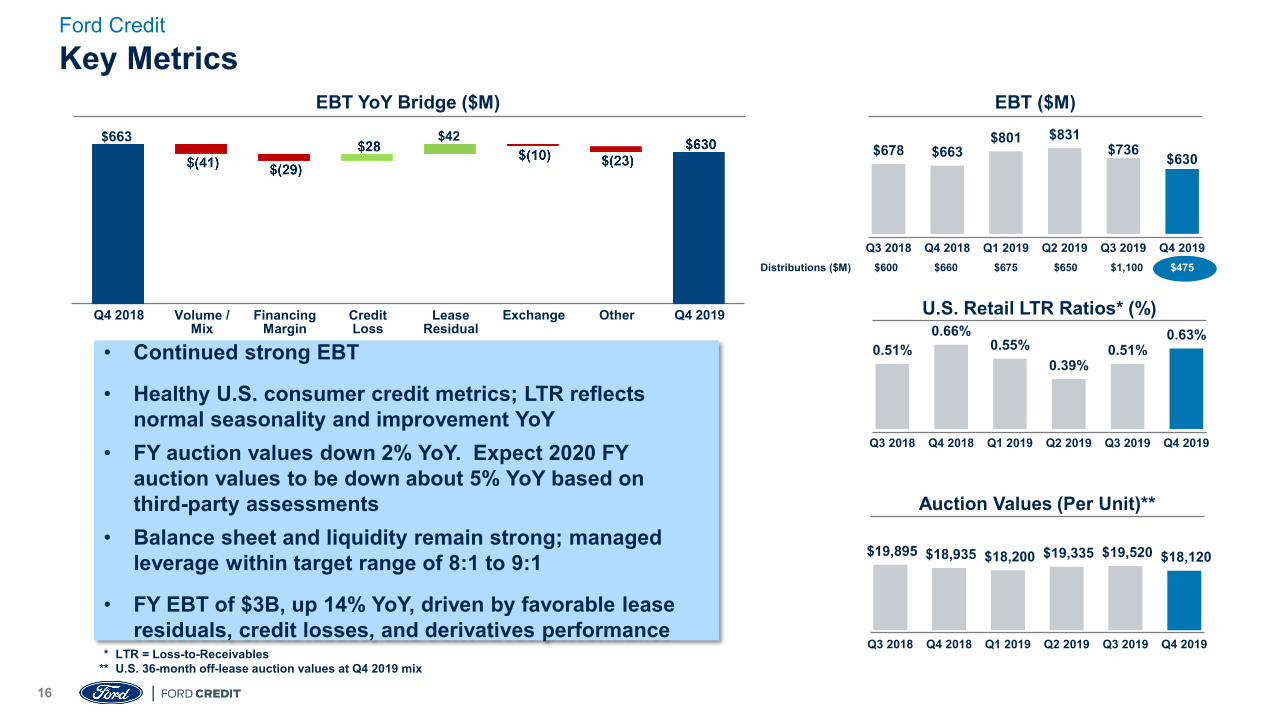
Distributions ($M) $600 $660 $675 $650 $1,100 $475
0.51%0.66%
0.55%0.39%
0.51%0.63%
Q3 2018 Q4 2018 Q1 2019 Q2 2019 Q3 2019 Q4 2019
U.S. Retail LTR Ratios* (%)
$19,895 $18,935 $18,200 $19,335 $19,520 $18,120
Q3 2018 Q4 2018 Q1 2019 Q2 2019 Q3 2019 Q4 2019
Auction Values (Per Unit)**
EBT YoY Bridge ($M)
$678 $663 $801 $831
$736 $630
Q3 2018 Q4 2018 Q1 2019 Q2 2019 Q3 2019 Q4 2019
EBT ($M)
• Continued strong EBT
• Healthy U.S. consumer credit metrics; LTR reflects normal seasonality and improvement YoY
• FY auction values down 2% YoY. Expect 2020 FY auction values to be down about 5% YoY based on third-party assessments
• Balance sheet and liquidity remain strong; managed leverage within target range of 8:1 to 9:1
• FY EBT of $3B, up 14% YoY, driven by favorable lease residuals, credit losses, and derivatives performance
Volume /Mix
FinancingMargin
LeaseResidual
Credit Loss
Q4 2019Q4 2018 Exchange Other
* LTR = Loss-to-Receivables** U.S. 36-month off-lease auction values at Q4 2019 mix
$663 $42
Key MetricsFord Credit
17
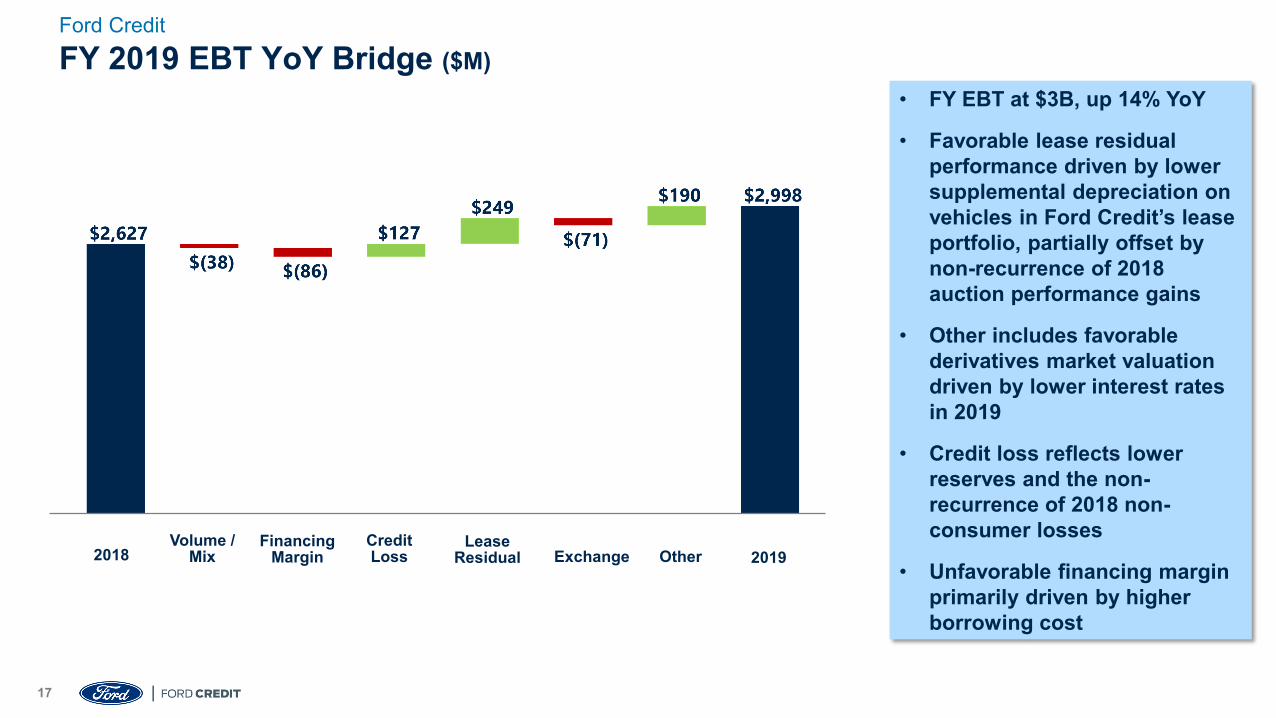
FY 2019 EBT YoY Bridge ($M)Ford Credit
• FY EBT at $3B, up 14% YoY
• Favorable lease residual performance driven by lower supplemental depreciation on vehicles in Ford Credit’s lease portfolio, partially offset by non-recurrence of 2018 auction performance gains
• Other includes favorable derivatives market valuation driven by lower interest rates in 2019
• Credit loss reflects lower reserves and the non-recurrence of 2018 non-consumer losses
• Unfavorable financing margin primarily driven by higher borrowing cost
2018Volume /
MixFinancing
MarginCredit Loss
LeaseResidual Exchange Other 2019
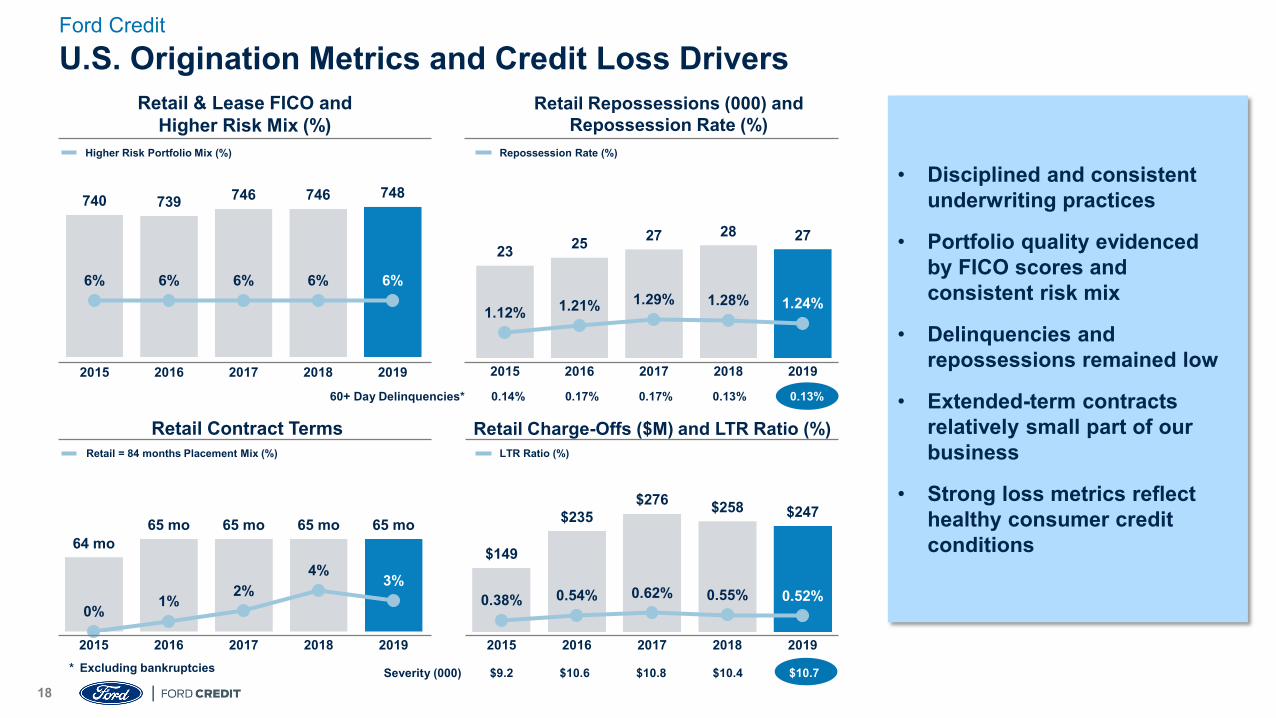
18Severity (000) $9.2 $10.6 $10.8 $10.4 $10.7* Excluding bankruptcies
U.S. Origination Metrics and Credit Loss Drivers
64 mo65 mo 65 mo 65 mo 65 mo
0% 1% 2%4% 3%
2015 2016 2017 2018 2019
740 739 746 746 748
6% 6% 6% 6% 6%
2015 2016 2017 2018 2019
Retail & Lease FICO andHigher Risk Mix (%)
Retail Contract Terms
$149
$235$276 $258 $247
0.38% 0.54% 0.62% 0.55% 0.52%
2015 2016 2017 2018 2019
Retail Charge-Offs ($M) and LTR Ratio (%)
23 25 27 28 27
1.12% 1.21% 1.29% 1.28% 1.24%
2015 2016 2017 2018 2019
Retail Repossessions (000) andRepossession Rate (%)
60+ Day Delinquencies* 0.14% 0.17% 0.17% 0.13% 0.13%
Higher Risk Portfolio Mix (%) Repossession Rate (%)
Retail = 84 months Placement Mix (%) LTR Ratio (%)
Ford Credit
• Disciplined and consistent underwriting practices
• Portfolio quality evidenced by FICO scores and consistent risk mix
• Delinquencies and repossessions remained low
• Extended-term contracts relatively small part of our business
• Strong loss metrics reflect healthy consumer credit conditions
19
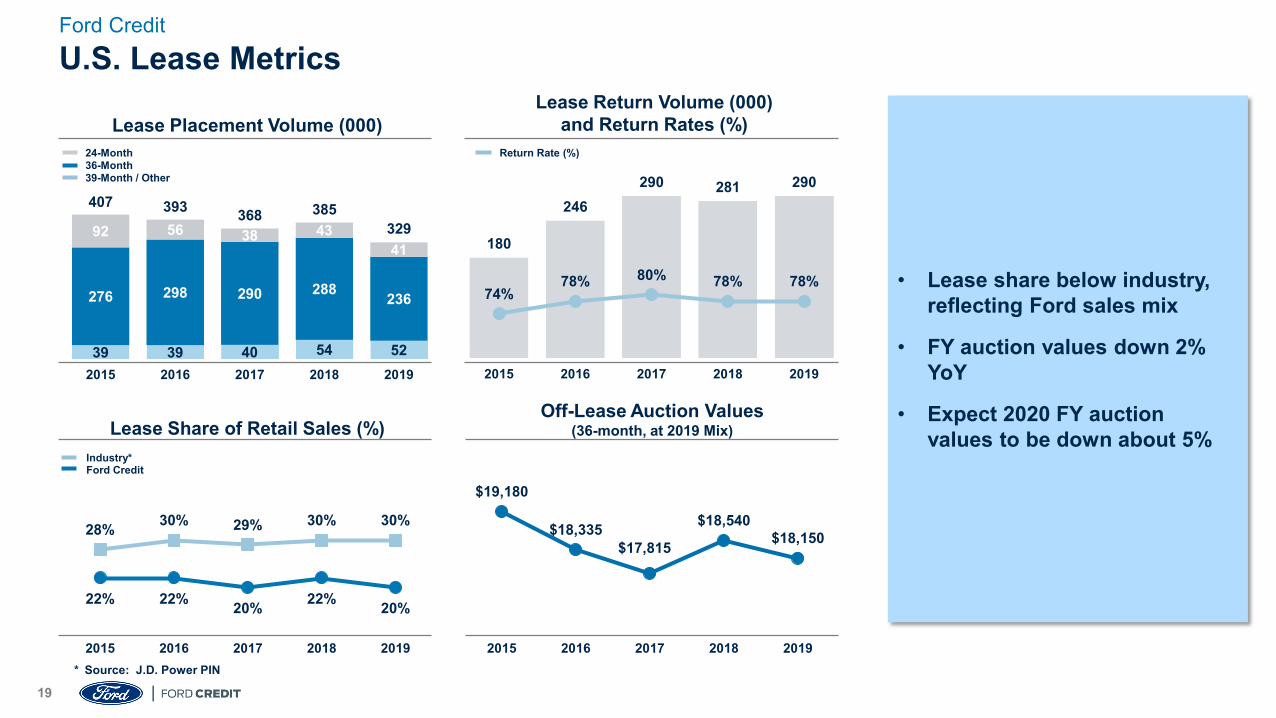
39 39 40 54 52
276 298 290 288 236
92 56 38 4341
407 393 368 385329
2015 2016 2017 2018 2019
* Source: J.D. Power PIN
U.S. Lease Metrics
Lease Placement Volume (000)
Lease Share of Retail Sales (%)Off-Lease Auction Values
(36-month, at 2019 Mix)
Lease Return Volume (000) and Return Rates (%)
Return Rate (%)
28% 30% 29% 30% 30%
22% 22% 20% 22% 20%
2015 2016 2017 2018 2019
24-Month36-Month39-Month / Other
Industry*Ford Credit
$19,180
$18,335$17,815
$18,540$18,150
2015 2016 2017 2018 2019
180
246290 281 290
74%78% 80% 78% 78%
2015 2016 2017 2018 2019
Ford Credit
• Lease share below industry, reflecting Ford sales mix
• FY auction values down 2% YoY
• Expect 2020 FY auction values to be down about 5%
20
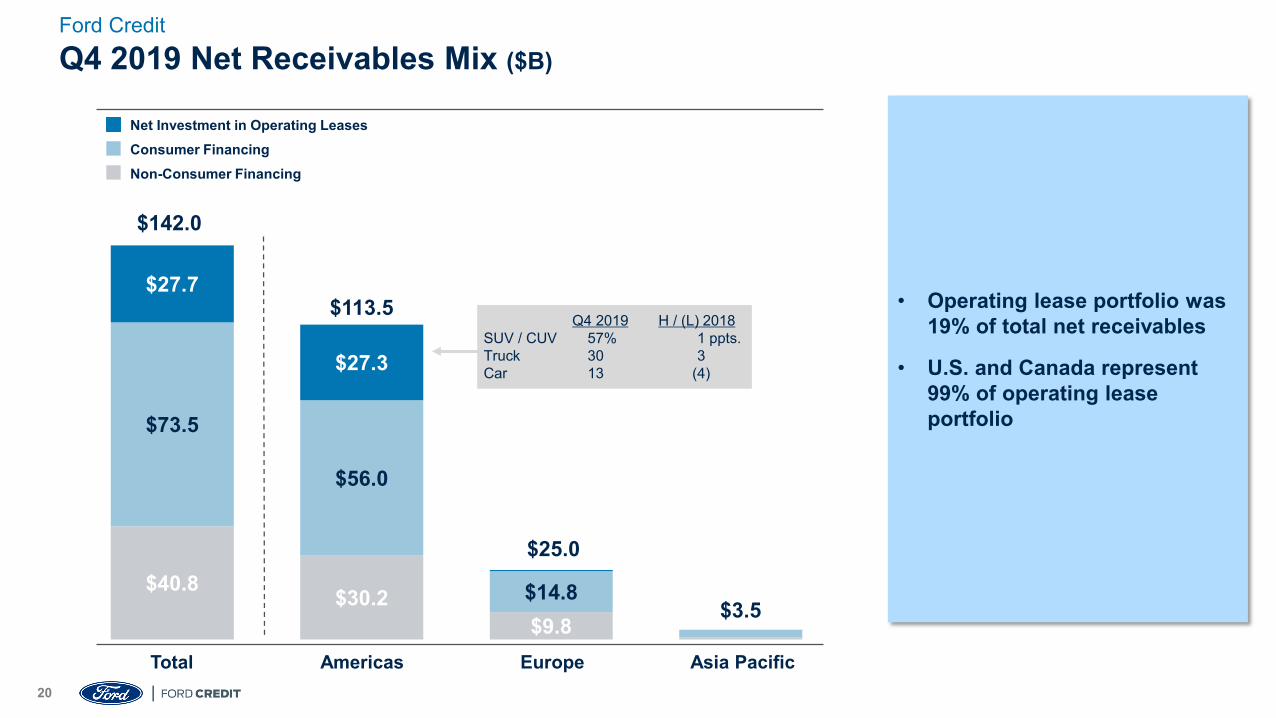
Q4 2019 Net Receivables Mix ($B)
$40.8 $30.2$9.8
$73.5
$56.0
$14.8
$27.7
$27.3
Total Asia PacificAmericas
Net Investment in Operating LeasesConsumer FinancingNon-Consumer Financing
Europe
$11.5
$142.0
$113.5
$25.0
$3.5
Q4 2019 H / (L) 2018SUV / CUV 57% 1 ppts.Truck 30 3Car 13 (4)
Ford Credit
• Operating lease portfolio was 19% of total net receivables
• U.S. and Canada represent 99% of operating lease portfolio
21
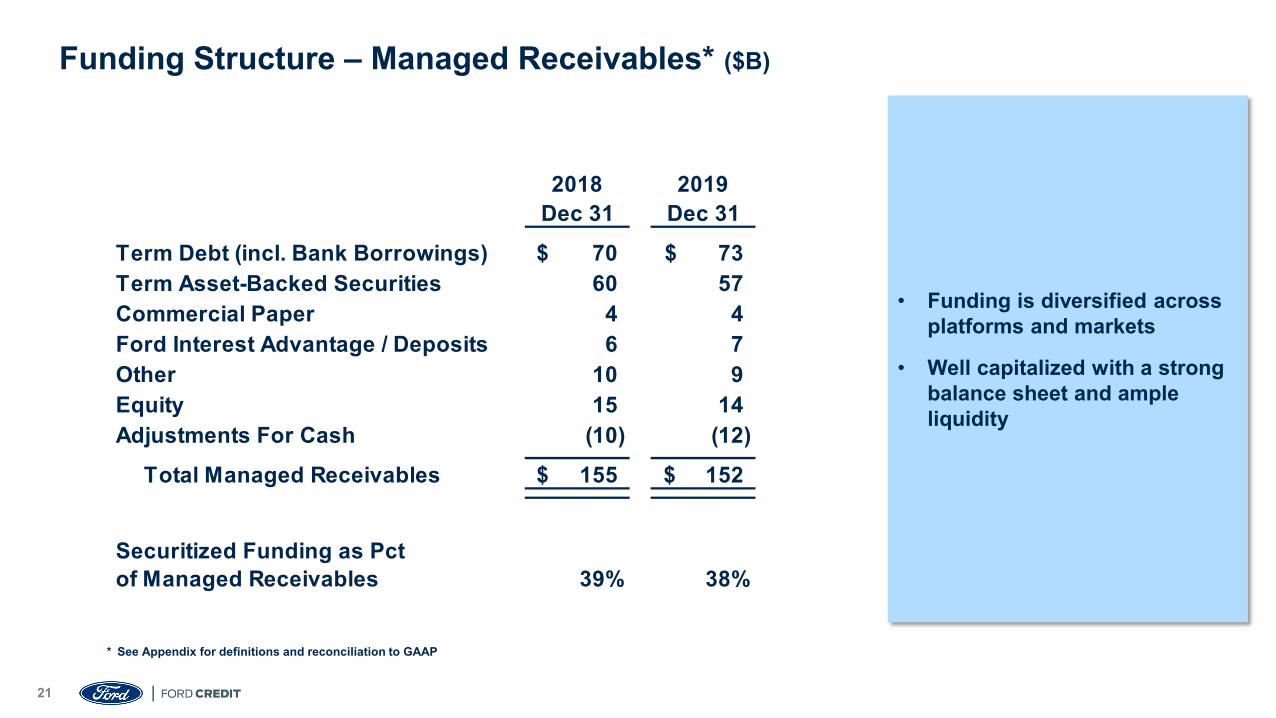
Funding Structure – Managed Receivables* ($B)
2018 2019Dec 31 Dec 31
Term Debt (incl. Bank Borrowings) 70$ 73$ Term Asset-Backed Securities 60 57 Commercial Paper 4 4 Ford Interest Advantage / Deposits 6 7 Other 10 9 Equity 15 14 Adjustments For Cash (10) (12)
Total Managed Receivables 155$ 152$
Securitized Funding as Pct of Managed Receivables 39% 38%
* See Appendix for definitions and reconciliation to GAAP
• Funding is diversified across platforms and markets
• Well capitalized with a strong balance sheet and ample liquidity
22
* Numbers may not sum due to rounding; see Appendix for definitions** As of February 4, 2020 *** Includes Rule 144A offerings
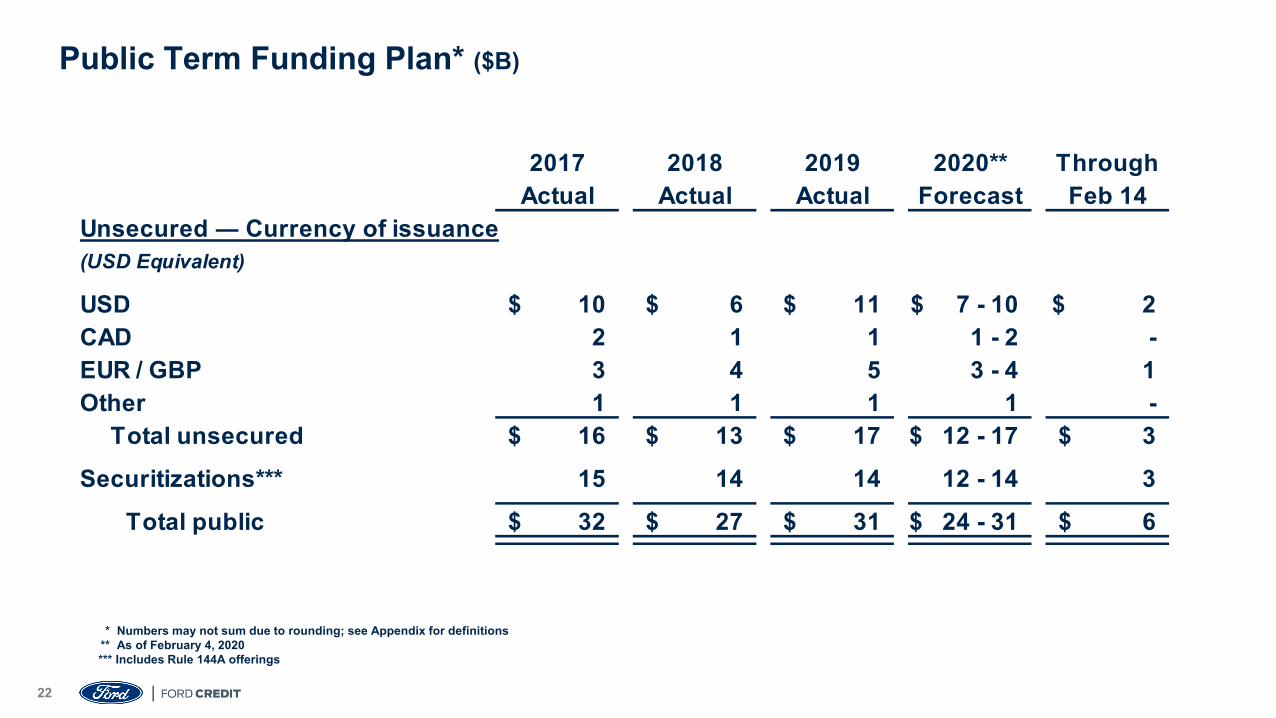
Public Term Funding Plan* ($B)
2017 2018 2019 2020** ThroughActual Actual Actual Forecast Feb 14
Unsecured ― Currency of issuance(USD Equivalent)
USD 10$ 6$ 11$ $ 7 - 10 $ 2CAD 2 1 1 1 - 2 - EUR / GBP 3 4 5 3 - 4 1 Other 1 1 1 1 -
Total unsecured 16$ 13$ 17$ $ 12 - 17 3$ Securitizations*** 15 14 14 12 - 14 3
Total public 32$ 27$ 31$ $ 24 - 31 6$
23
Cautionary Note On Forward-Looking StatementsStatements included or incorporated by reference herein may constitute “forward-looking statements” within the meaning of the Private Securities Litigation Reform Act of 1995. Forward-looking statements are based on expectations, forecasts, and assumptions by our management and involve a number of risks, uncertainties, and other factors that could cause actual results to differ materially from those stated, including, without limitation:• Ford’s long-term competitiveness depends on the successful execution of global redesign and fitness actions;• Ford’s vehicles could be affected by defects that result in delays in new model launches, recall campaigns, or increased warranty costs;• Ford may not realize the anticipated benefits of existing or pending strategic alliances, joint ventures, acquisitions, divestitures, or new business strategies;• Operational systems, security systems, and vehicles could be affected by cyber incidents;• Ford’s production, as well as Ford’s suppliers’ production, could be disrupted by labor issues, natural or man-made disasters, financial distress, production difficulties, or other factors;• Ford’s ability to maintain a competitive cost structure could be affected by labor or other constraints;• Ford’s ability to attract and retain talented, diverse, and highly skilled employees is critical to its success and competitiveness;• Ford’s new and existing products and mobility services are subject to market acceptance;• Ford’s results are dependent on sales of larger, more profitable vehicles, particularly in the United States;• With a global footprint, Ford’s results could be adversely affected by economic, geopolitical, protectionist trade policies, or other events, including tariffs and Brexit;• Industry sales volume in any of our key markets can be volatile and could decline if there is a financial crisis, recession, or significant geopolitical event;• Ford may face increased price competition or a reduction in demand for its products resulting from industry excess capacity, currency fluctuations, competitive actions, or other factors;• Fluctuations in commodity prices, foreign currency exchange rates, interest rates, and market value of our investments can have a significant effect on results;• Ford and Ford Credit’s access to debt, securitization, or derivative markets around the world at competitive rates or in sufficient amounts could be affected by credit rating downgrades, market volatility, market
disruption, regulatory requirements, or other factors;• Ford’s receipt of government incentives could be subject to reduction, termination, or clawback;• Ford Credit could experience higher-than-expected credit losses, lower-than-anticipated residual values, or higher-than-expected return volumes for leased vehicles;• Economic and demographic experience for pension and other postretirement benefit plans (e.g., discount rates or investment returns) could be worse than Ford has assumed;• Pension and other postretirement liabilities could adversely affect Ford’s liquidity and financial condition;• Ford could experience unusual or significant litigation, governmental investigations, or adverse publicity arising out of alleged defects in products, perceived environmental impacts, or otherwise;• Ford may need to substantially modify its product plans to comply with safety, emissions, fuel economy, autonomous vehicle, and other regulations that may change in the future;• Ford and Ford Credit could be affected by the continued development of more stringent privacy, data use, and data protection laws and regulations as well as consumer expectations for the safeguarding of personal
information; and• Ford Credit could be subject to new or increased credit regulations, consumer protection regulations, or other regulations.We cannot be certain that any expectation, forecast, or assumption made in preparing forward-looking statements will prove accurate, or that any projection will be realized. It is to be expected that there may be differences between projected and actual results. Our forward-looking statements speak only as of the date of their initial issuance, and we do not undertake any obligation to update or revise publicly any forward-looking statement, whether as a result of new information, future events, or otherwise. For additional discussion, see “Item 1A. Risk Factors” in our Annual Report on Form 10-K for the year ended December 31, 2019, as updated by subsequent Quarterly Reports on Form 10-Q and Current Reports on Form 8-K.

All-Electric Mustang Mach-E
U.S. Retail/Lease Origination and Servicing Strategy
25
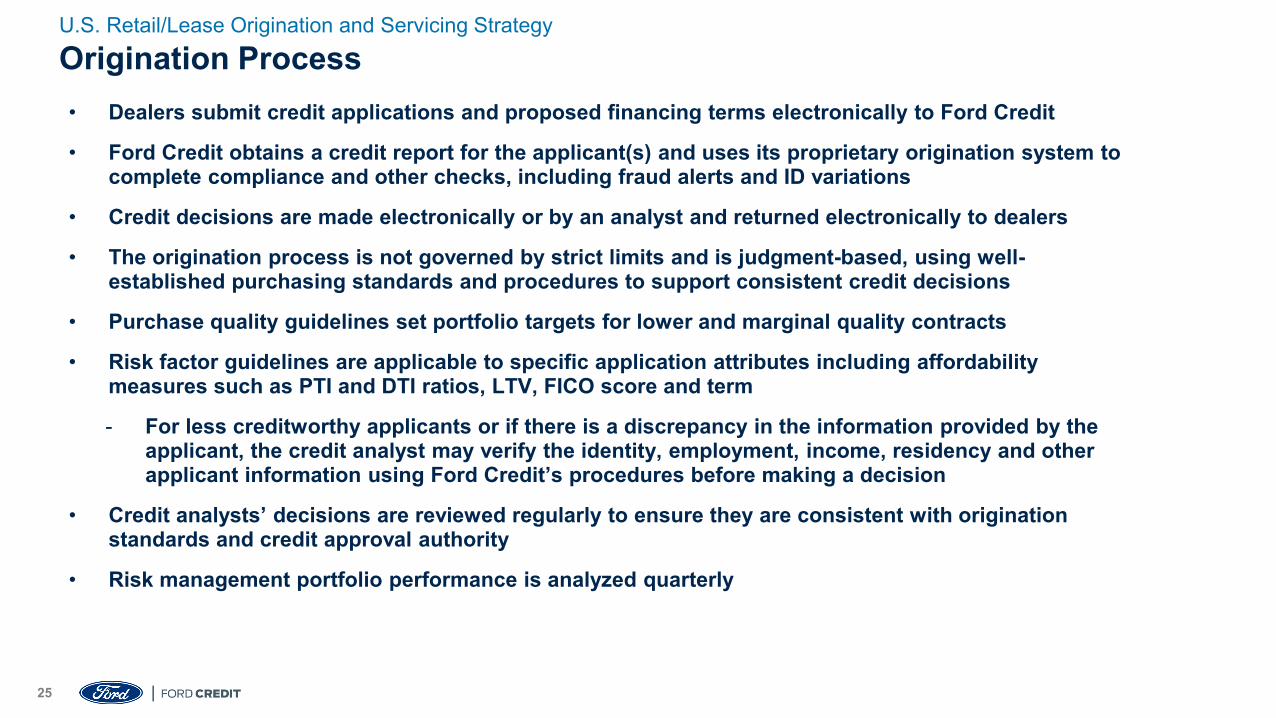
• Dealers submit credit applications and proposed financing terms electronically to Ford Credit
• Ford Credit obtains a credit report for the applicant(s) and uses its proprietary origination system to complete compliance and other checks, including fraud alerts and ID variations
• Credit decisions are made electronically or by an analyst and returned electronically to dealers
• The origination process is not governed by strict limits and is judgment-based, using well-established purchasing standards and procedures to support consistent credit decisions
• Purchase quality guidelines set portfolio targets for lower and marginal quality contracts
• Risk factor guidelines are applicable to specific application attributes including affordability measures such as PTI and DTI ratios, LTV, FICO score and term
- For less creditworthy applicants or if there is a discrepancy in the information provided by the applicant, the credit analyst may verify the identity, employment, income, residency and other applicant information using Ford Credit’s procedures before making a decision
• Credit analysts’ decisions are reviewed regularly to ensure they are consistent with origination standards and credit approval authority
• Risk management portfolio performance is analyzed quarterly
Origination ProcessU.S. Retail/Lease Origination and Servicing Strategy
26
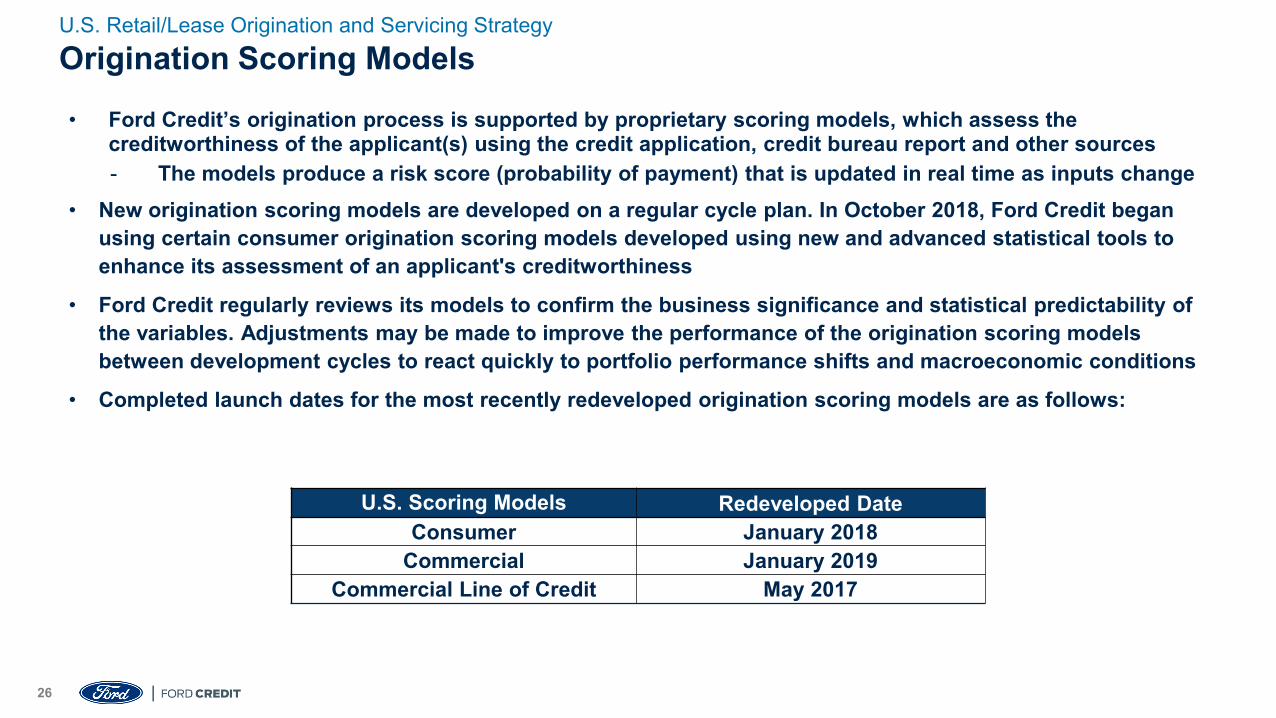
• Ford Credit’s origination process is supported by proprietary scoring models, which assess the creditworthiness of the applicant(s) using the credit application, credit bureau report and other sources- The models produce a risk score (probability of payment) that is updated in real time as inputs change
• New origination scoring models are developed on a regular cycle plan. In October 2018, Ford Credit began using certain consumer origination scoring models developed using new and advanced statistical tools to enhance its assessment of an applicant's creditworthiness
• Ford Credit regularly reviews its models to confirm the business significance and statistical predictability of the variables. Adjustments may be made to improve the performance of the origination scoring models between development cycles to react quickly to portfolio performance shifts and macroeconomic conditions
• Completed launch dates for the most recently redeveloped origination scoring models are as follows:
Origination Scoring ModelsU.S. Retail/Lease Origination and Servicing Strategy
U.S. Scoring Models Redeveloped DateConsumer January 2018
Commercial January 2019Commercial Line of Credit May 2017
27
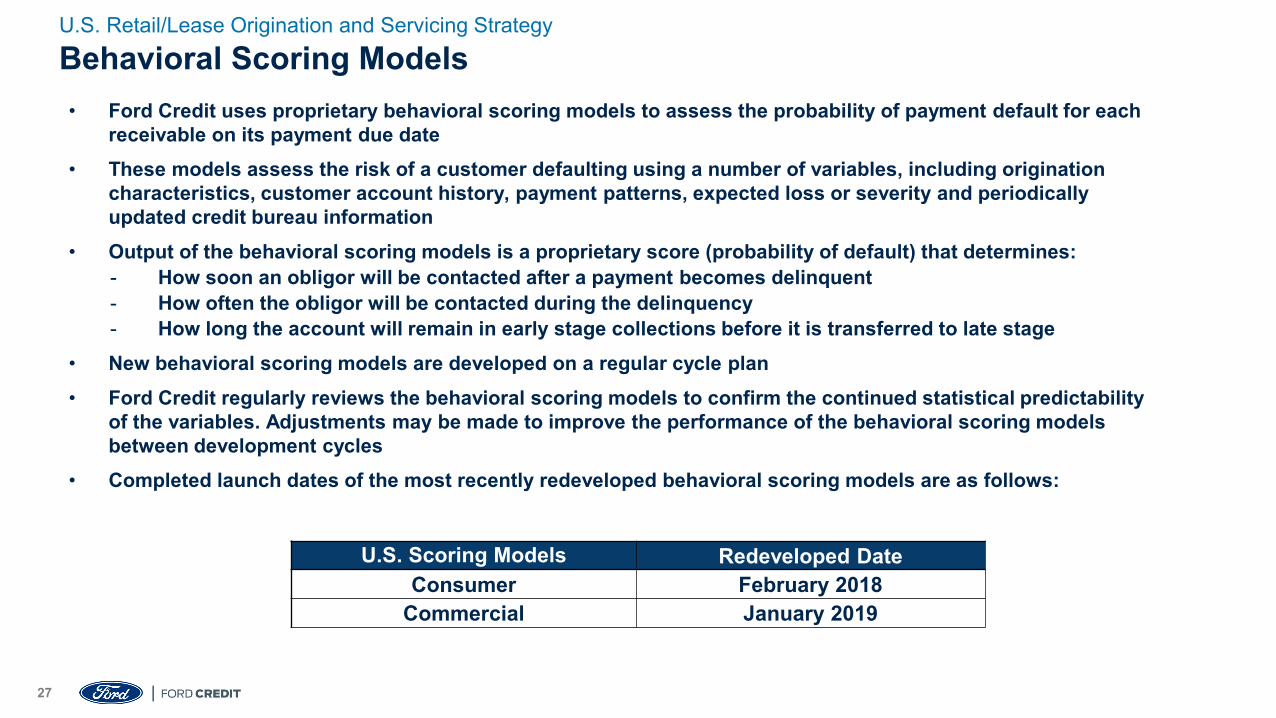
Behavioral Scoring ModelsU.S. Retail/Lease Origination and Servicing Strategy
U.S. Scoring Models Redeveloped DateConsumer February 2018
Commercial January 2019
• Ford Credit uses proprietary behavioral scoring models to assess the probability of payment default for each receivable on its payment due date
• These models assess the risk of a customer defaulting using a number of variables, including origination characteristics, customer account history, payment patterns, expected loss or severity and periodically updated credit bureau information
• Output of the behavioral scoring models is a proprietary score (probability of default) that determines:- How soon an obligor will be contacted after a payment becomes delinquent- How often the obligor will be contacted during the delinquency - How long the account will remain in early stage collections before it is transferred to late stage
• New behavioral scoring models are developed on a regular cycle plan• Ford Credit regularly reviews the behavioral scoring models to confirm the continued statistical predictability
of the variables. Adjustments may be made to improve the performance of the behavioral scoring models between development cycles
• Completed launch dates of the most recently redeveloped behavioral scoring models are as follows:

All-Electric Mustang Mach-E
U.S. Retail SecuritizationSeptember 2019February 2020
SECRET29
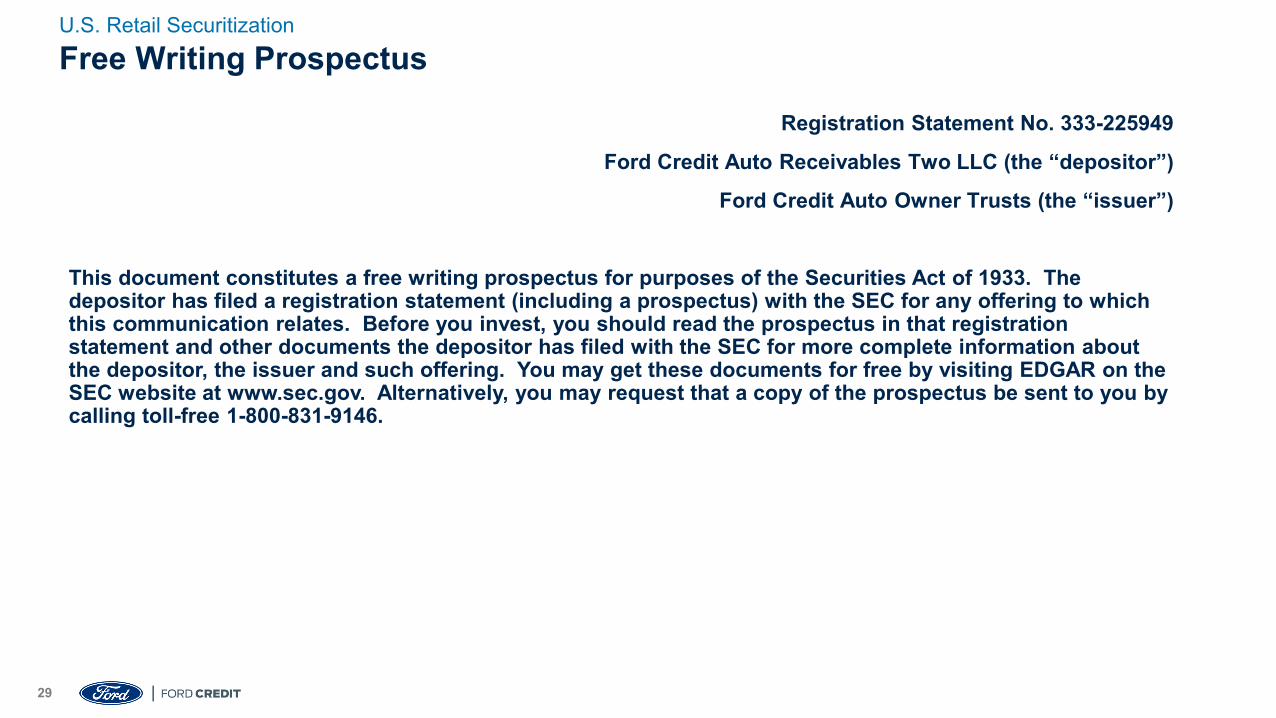
Registration Statement No. 333-225949
Ford Credit Auto Receivables Two LLC (the “depositor”)
Ford Credit Auto Owner Trusts (the “issuer”)
This document constitutes a free writing prospectus for purposes of the Securities Act of 1933. The depositor has filed a registration statement (including a prospectus) with the SEC for any offering to which this communication relates. Before you invest, you should read the prospectus in that registration statement and other documents the depositor has filed with the SEC for more complete information about the depositor, the issuer and such offering. You may get these documents for free by visiting EDGAR on the SEC website at www.sec.gov. Alternatively, you may request that a copy of the prospectus be sent to you by calling toll-free 1-800-831-9146.
U.S. Retail Securitization
Free Writing Prospectus
SECRET30
• Ford Credit has been originating retail installment sales contracts since 1959 and securitizing its retail contracts since 1988
• Ford Credit has had an active publicly-registered securitization program for retail contracts since 1989 and has issued asset-backed securities in more than 80 transactions under this program
• Ford Credit offers retail asset-backed securities through various channels:- Publicly-registered transactions- Rule 144A transactions- Other private transactions
• Collateral composition has trended in line with the industry and Ford Credit’s strategy – we securitize what we originate
• Structural elements have remained consistent – similar structure in place for over 15 years
OverviewU.S. Retail Securitization
31
65%56% 55% 58%
51%
2015 2016 2017 2018 2019
899
719 705 729588
2015 2016 2017 2018 2019
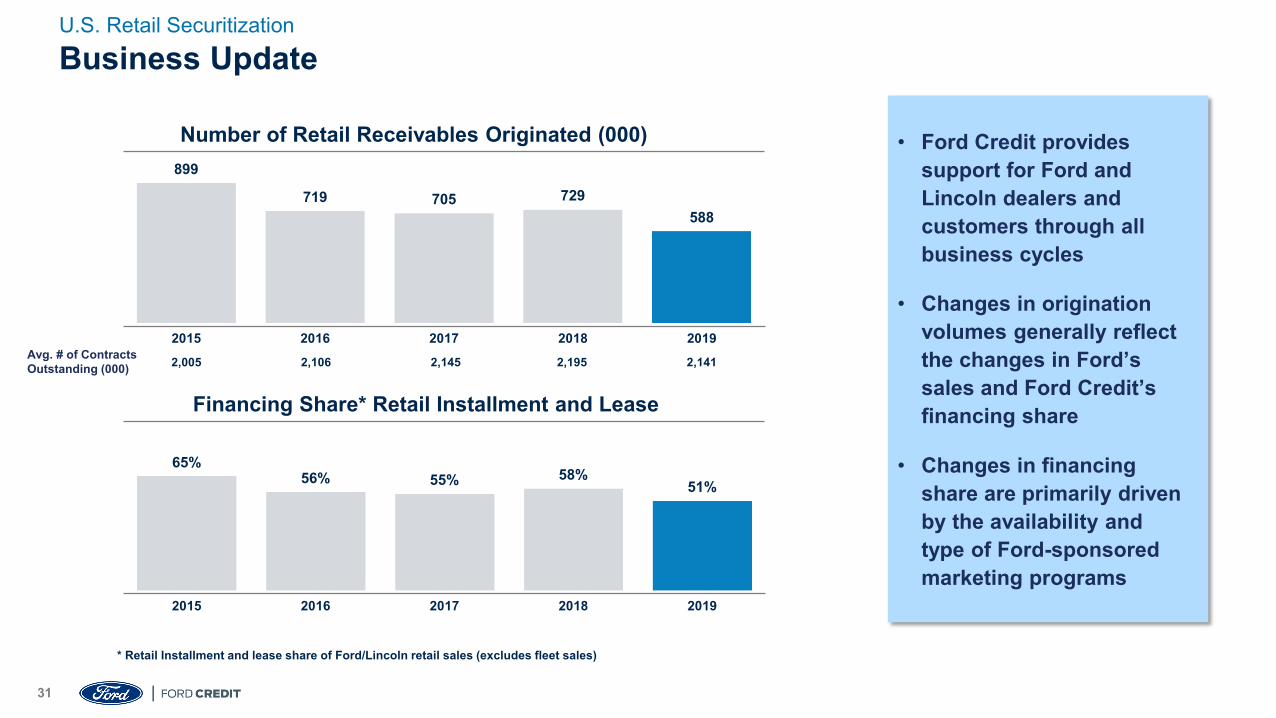
Number of Retail Receivables Originated (000)
Financing Share* Retail Installment and Lease
* Retail Installment and lease share of Ford/Lincoln retail sales (excludes fleet sales)
Avg. # of Contracts Outstanding (000) 2,005 2,106 2,145 2,195 2,141
Business UpdateU.S. Retail Securitization
• Ford Credit provides support for Ford and Lincoln dealers and customers through all business cycles
• Changes in origination volumes generally reflect the changes in Ford’s sales and Ford Credit’s financing share
• Changes in financing share are primarily driven by the availability and type of Ford-sponsored marketing programs
SECRET32
736 734 741 741 742
2015 2016 2017 2018 2019
1.12% 1.21% 1.29% 1.28% 1.24%
2015 2016 2017 2018 2019
0.38%0.54% 0.61% 0.54% 0.52%
2015 2016 2017 2018 2019
$4,445
$6,245 $6,640 $6,100 $6,131
2015 2016 2017 2018 2019
Weighted Average FICO® at Origination*Repossessions as a % of the Average
Number of Contracts Outstanding
Net Losses as a % of the Average Portfolio OutstandingAverage Net Loss on Charged-Off Contracts
* Based on year of origination
Portfolio Credit MetricsU.S. Retail Securitization
SECRET33
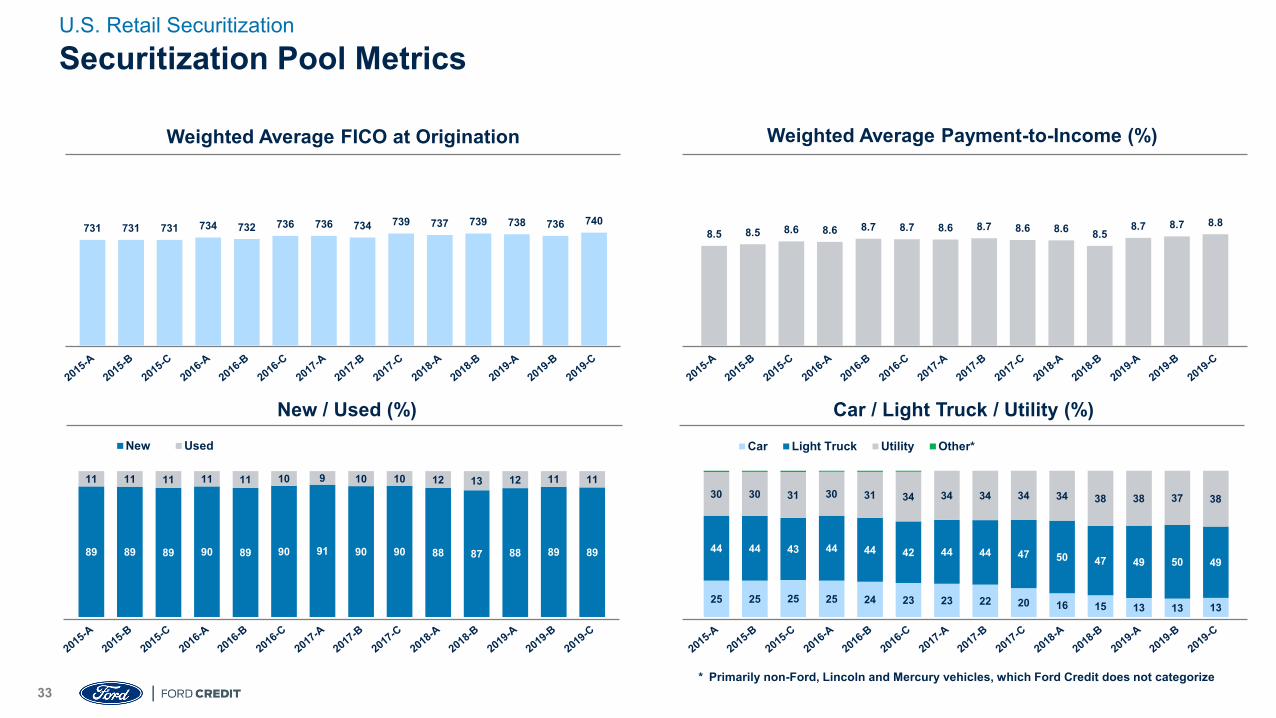
8.5 8.5 8.6 8.6 8.7 8.7 8.6 8.7 8.6 8.6 8.58.7 8.7 8.8
25 25 25 25 24 23 23 22 20 16 15 13 13 13
44 44 43 44 44 42 44 44 47 50 47 49 50 49
30 30 31 30 31 34 34 34 34 34 38 38 37 38
Car Light Truck Utility Other*
Weighted Average FICO at Origination
New / Used (%) Car / Light Truck / Utility (%)
Weighted Average Payment-to-Income (%)
* Primarily non-Ford, Lincoln and Mercury vehicles, which Ford Credit does not categorize
Securitization Pool MetricsU.S. Retail Securitization
89 89 89 90 89 90 91 90 90 88 87 88 89 89
11 11 11 11 11 10 9 10 10 12 13 12 11 11
New Used
731 731 731 734 732 736 736 734 739 737 739 738 736 740
SECRET34
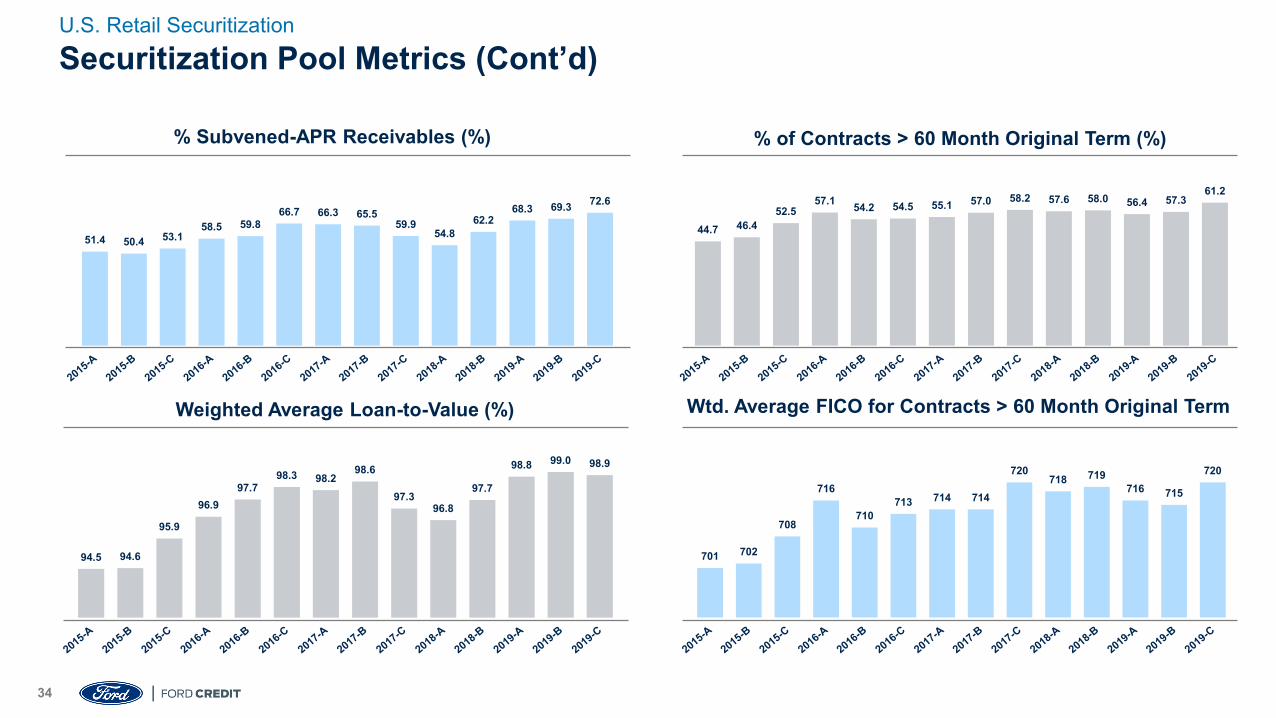
% Subvened-APR Receivables (%) % of Contracts > 60 Month Original Term (%)
Weighted Average Loan-to-Value (%) Wtd. Average FICO for Contracts > 60 Month Original Term
Securitization Pool Metrics (Cont’d)U.S. Retail Securitization
51.4 50.4 53.158.5 59.8
66.7 66.3 65.559.9
54.862.2
68.3 69.3 72.6
44.7 46.452.5
57.1 54.2 54.5 55.1 57.0 58.2 57.6 58.0 56.4 57.361.2
94.5 94.6
95.9
96.997.7
98.3 98.298.6
97.396.8
97.7
98.8 99.0 98.9
701 702
708
716
710713 714 714
720718 719
716 715
720
SECRET35
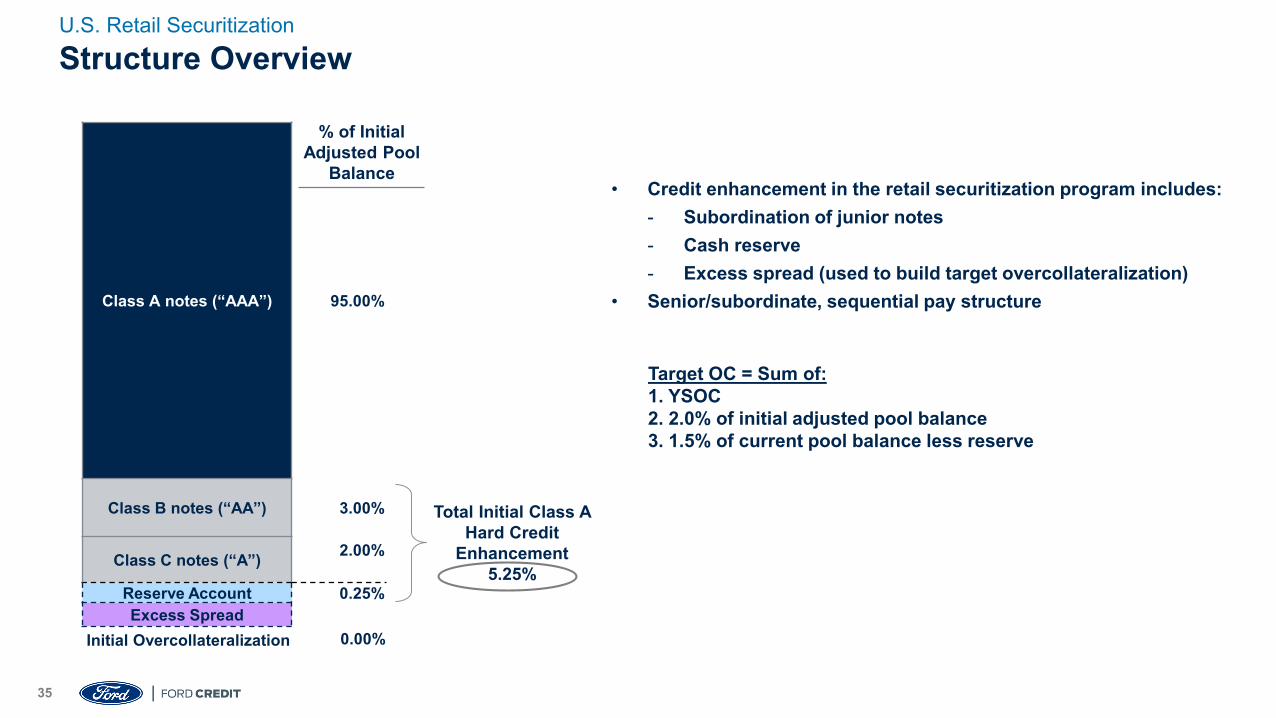
Class A notes (“AAA”) 95.00%
Class B notes (“AA”) 3.00%
Class C notes (“A”) 2.00%
Reserve Account 0.25% Excess Spread
Structure OverviewU.S. Retail Securitization
Initial Overcollateralization
% of Initial Adjusted Pool
Balance• Credit enhancement in the retail securitization program includes:
- Subordination of junior notes- Cash reserve- Excess spread (used to build target overcollateralization)
• Senior/subordinate, sequential pay structure
Target OC = Sum of: 1. YSOC2. 2.0% of initial adjusted pool balance 3. 1.5% of current pool balance less reserve
Total Initial Class A Hard Credit
Enhancement5.25%
0.00%
SECRET36
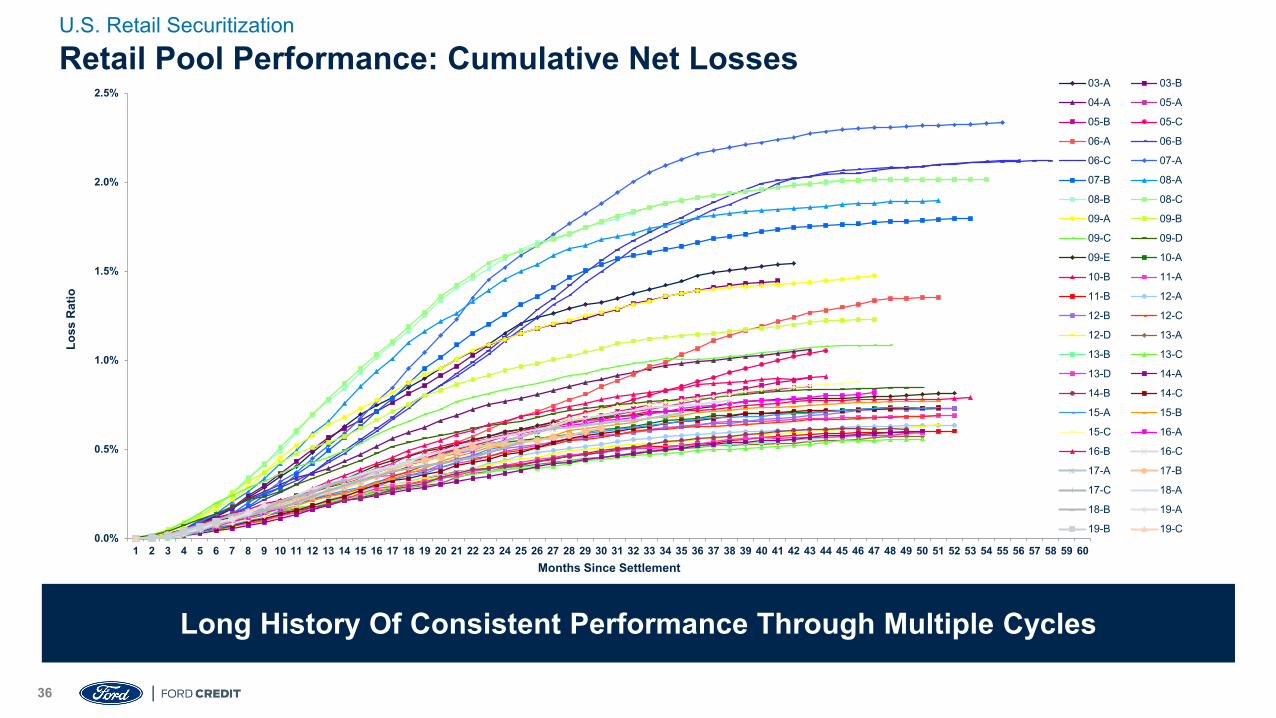
Long History Of Consistent Performance Through Multiple Cycles
Retail Pool Performance: Cumulative Net LossesU.S. Retail Securitization
0.0%
0.5%
1.0%
1.5%
2.0%
2.5%
1 2 3 4 5 6 7 8 9 10 11 12 13 14 15 16 17 18 19 20 21 22 23 24 25 26 27 28 29 30 31 32 33 34 35 36 37 38 39 40 41 42 43 44 45 46 47 48 49 50 51 52 53 54 55 56 57 58 59 60
Loss
Rat
io
Months Since Settlement
03-A 03-B
04-A 05-A
05-B 05-C
06-A 06-B
06-C 07-A
07-B 08-A
08-B 08-C
09-A 09-B
09-C 09-D
09-E 10-A
10-B 11-A
11-B 12-A
12-B 12-C
12-D 13-A
13-B 13-C
13-D 14-A
14-B 14-C
15-A 15-B
15-C 16-A
16-B 16-C
17-A 17-B
17-C 18-A
18-B 19-A
19-B 19-C
All-Electric Mustang Mach-E
U.S. Revolving Extended Variable-Utilization Securitization (FordREV)
38
OverviewFordREV
• Since May 2014, Ford Credit has offered 12 Revolving Extended Variable Utilization (FordREV) transactions
- Presently about $12.2B in outstanding notes- Features a 5-year revolving period (2018-REV1 has a 7-year tenor) and subsequent soft-bullet maturity- 2020-REV1 is the most recent issuance, with Class A notes of $1.5B and a 5-year revolving period- Three FordREV transactions have already been redeemed at the Expected Final Payment Date
• FordREV notes consist of a AAA-rated senior tranche and two subordinated classes of notes
• FordREV notes are backed by U.S. retail auto receivables originated by Ford Credit – comparable to the company’s U.S. publicly-registered retail securitization program
- During the revolving period, monthly collections are deposited in an accumulation account and are available to purchase additional receivables
- FordREV notes may be backed by a combination of receivables and cash- Pool concentration limits safeguard the quality of the collateral backing the notes
• The notes are expected to redeemed in full at the end of the revolving period
- Step-up or make-whole amounts may otherwise be payable
39
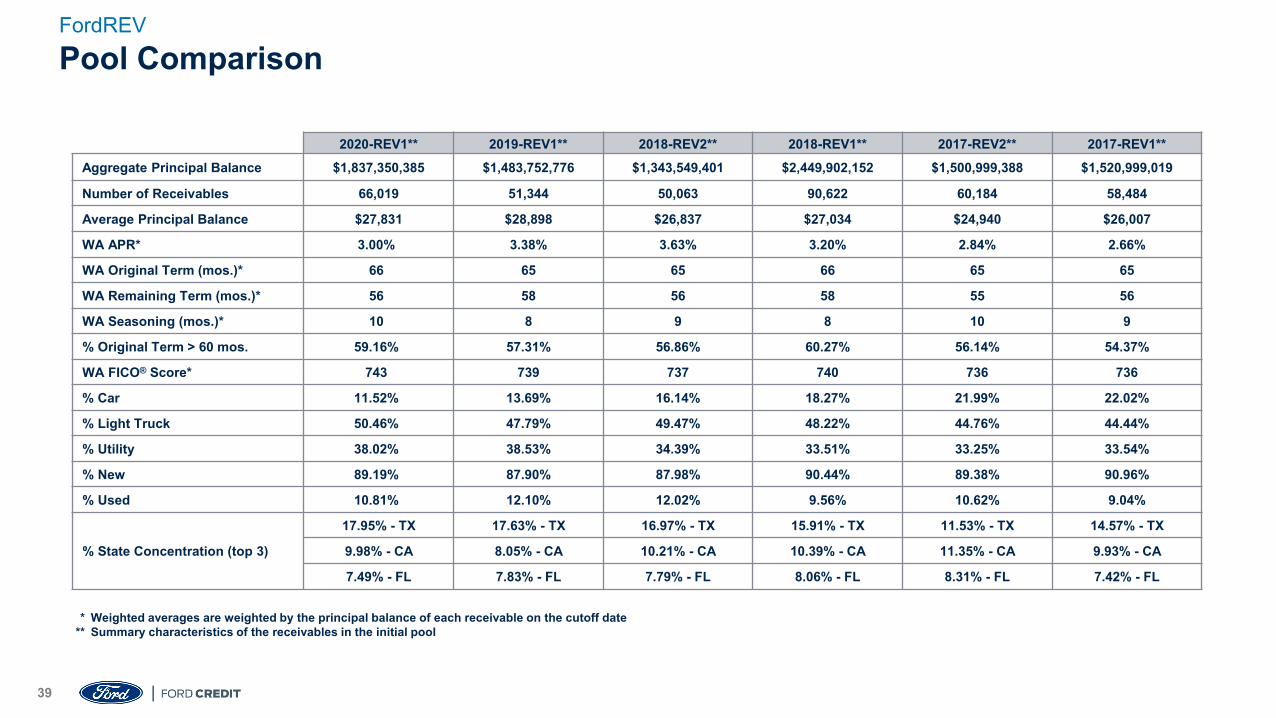
Pool ComparisonFordREV
2020-REV1** 2019-REV1** 2018-REV2** 2018-REV1** 2017-REV2** 2017-REV1**Aggregate Principal Balance $1,837,350,385 $1,483,752,776 $1,343,549,401 $2,449,902,152 $1,500,999,388 $1,520,999,019
Number of Receivables 66,019 51,344 50,063 90,622 60,184 58,484
Average Principal Balance $27,831 $28,898 $26,837 $27,034 $24,940 $26,007
WA APR* 3.00% 3.38% 3.63% 3.20% 2.84% 2.66%
WA Original Term (mos.)* 66 65 65 66 65 65
WA Remaining Term (mos.)* 56 58 56 58 55 56
WA Seasoning (mos.)* 10 8 9 8 10 9
% Original Term > 60 mos. 59.16% 57.31% 56.86% 60.27% 56.14% 54.37%
WA FICO® Score* 743 739 737 740 736 736
% Car 11.52% 13.69% 16.14% 18.27% 21.99% 22.02%
% Light Truck 50.46% 47.79% 49.47% 48.22% 44.76% 44.44%
% Utility 38.02% 38.53% 34.39% 33.51% 33.25% 33.54%
% New 89.19% 87.90% 87.98% 90.44% 89.38% 90.96%
% Used 10.81% 12.10% 12.02% 9.56% 10.62% 9.04%
% State Concentration (top 3)
17.95% - TX 17.63% - TX 16.97% - TX 15.91% - TX 11.53% - TX 14.57% - TX
9.98% - CA 8.05% - CA 10.21% - CA 10.39% - CA 11.35% - CA 9.93% - CA
7.49% - FL 7.83% - FL 7.79% - FL 8.06% - FL 8.31% - FL 7.42% - FL
* Weighted averages are weighted by the principal balance of each receivable on the cutoff date** Summary characteristics of the receivables in the initial pool
40
50%55%60%65%70%75%80%85%90%
0 3 6 9 12 15 18 21 24 27 30 33 36 39 42 45 48 51 54 57 60Months Since Settlement
2014-REV1 2014-REV2 2015-REV1 2015-REV2 2016-REV1 2016-REV22017-REV1 2017-REV2 2018-REV1 2018-REV2 2019-REV1
0%10%20%30%40%50%60%70%80%
0 3 6 9 12 15 18 21 24 27 30 33 36 39 42 45 48 51 54 57 60Months Since Settlement
75%77%79%81%83%85%87%89%91%93%
0 3 6 9 12 15 18 21 24 27 30 33 36 39 42 45 48 51 54 57 60Months Since Settlement
Key Collateral AttributesFordREV
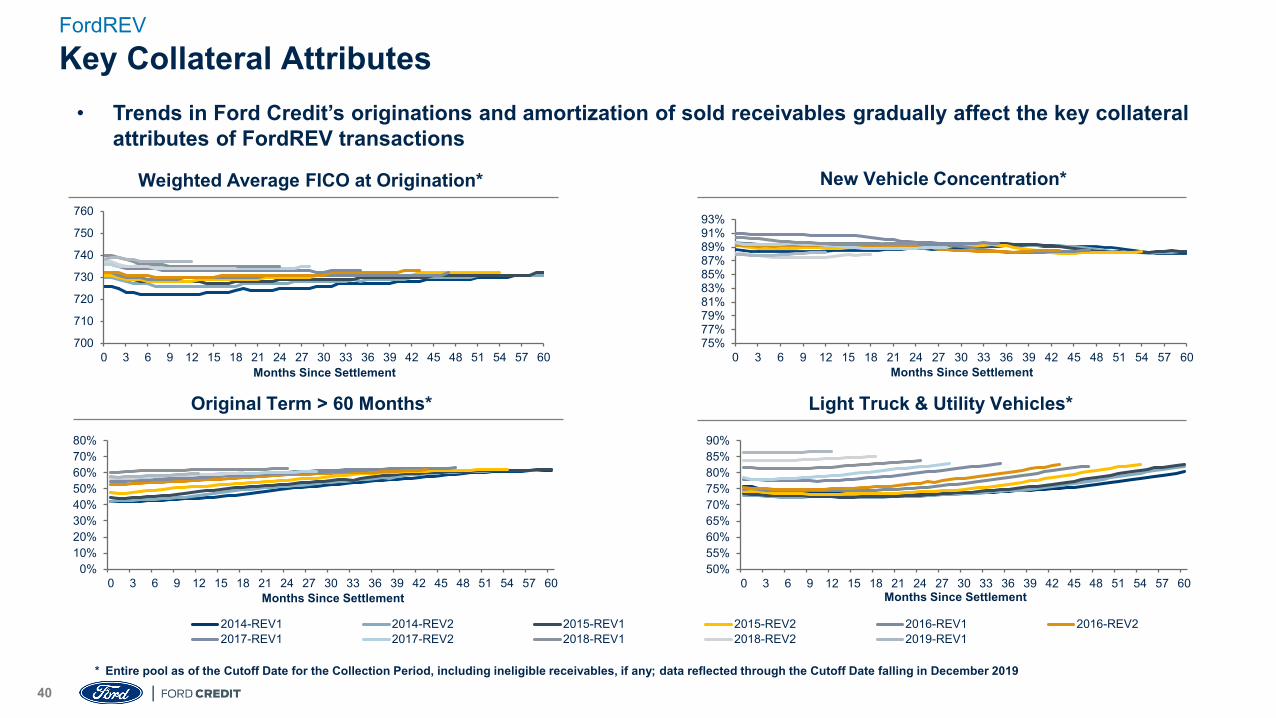
• Trends in Ford Credit’s originations and amortization of sold receivables gradually affect the key collateral attributes of FordREV transactions
Weighted Average FICO at Origination* New Vehicle Concentration*
Original Term > 60 Months* Light Truck & Utility Vehicles*
700
710
720
730
740
750
760
0 3 6 9 12 15 18 21 24 27 30 33 36 39 42 45 48 51 54 57 60Months Since Settlement
* Entire pool as of the Cutoff Date for the Collection Period, including ineligible receivables, if any; data reflected through the Cutoff Date falling in December 2019
41
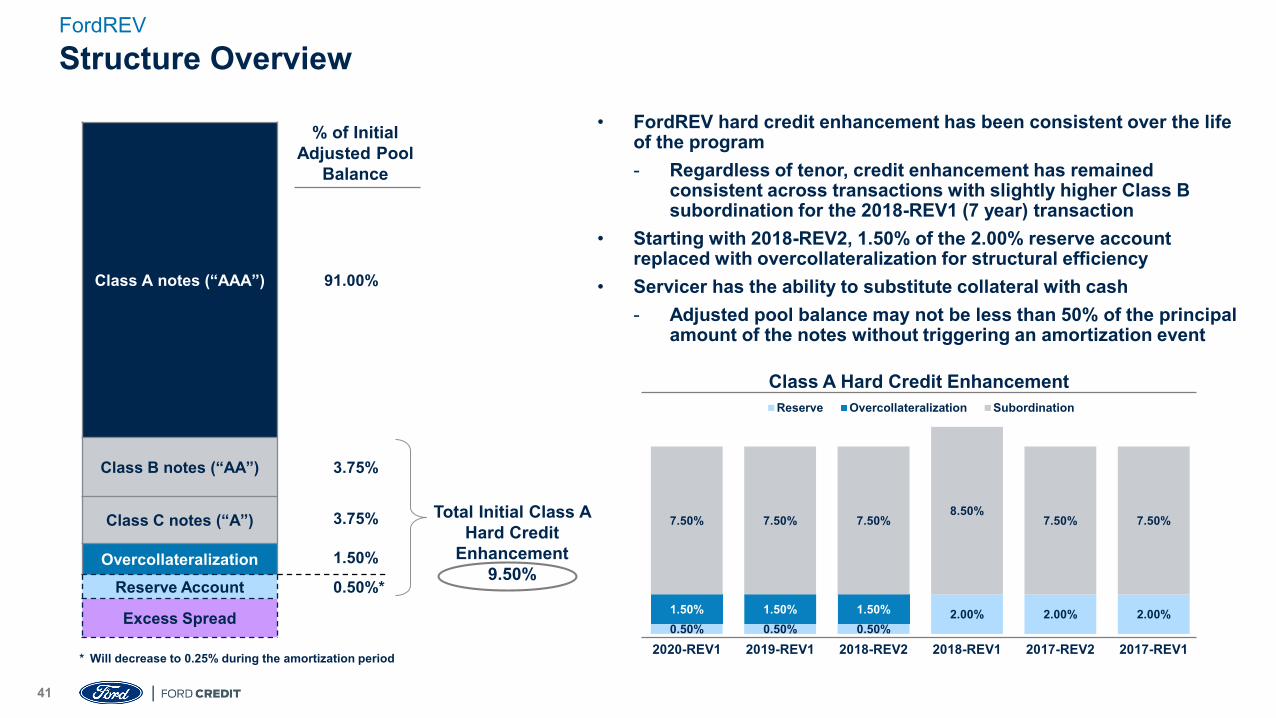
Structure OverviewFordREV
Class A notes (“AAA”) 91.00%*
Class B notes (“AA”) 3.75%*
Class C notes (“A”) 3.75%*
1.50%*OvercollateralizationReserve Account 0.50%*
Excess Spread
% of Initial Adjusted Pool
Balance
* Will decrease to 0.25% during the amortization period
Total Initial Class A Hard Credit
Enhancement9.50%
• FordREV hard credit enhancement has been consistent over the life of the program- Regardless of tenor, credit enhancement has remained
consistent across transactions with slightly higher Class B subordination for the 2018-REV1 (7 year) transaction
• Starting with 2018-REV2, 1.50% of the 2.00% reserve account replaced with overcollateralization for structural efficiency
• Servicer has the ability to substitute collateral with cash- Adjusted pool balance may not be less than 50% of the principal
amount of the notes without triggering an amortization event
0.50% 0.50% 0.50%2.00% 2.00% 2.00%1.50% 1.50% 1.50%
7.50% 7.50% 7.50%8.50%
7.50% 7.50%
2020-REV1 2019-REV1 2018-REV2 2018-REV1 2017-REV2 2017-REV1
Reserve Overcollateralization Subordination
Class A Hard Credit Enhancement
42
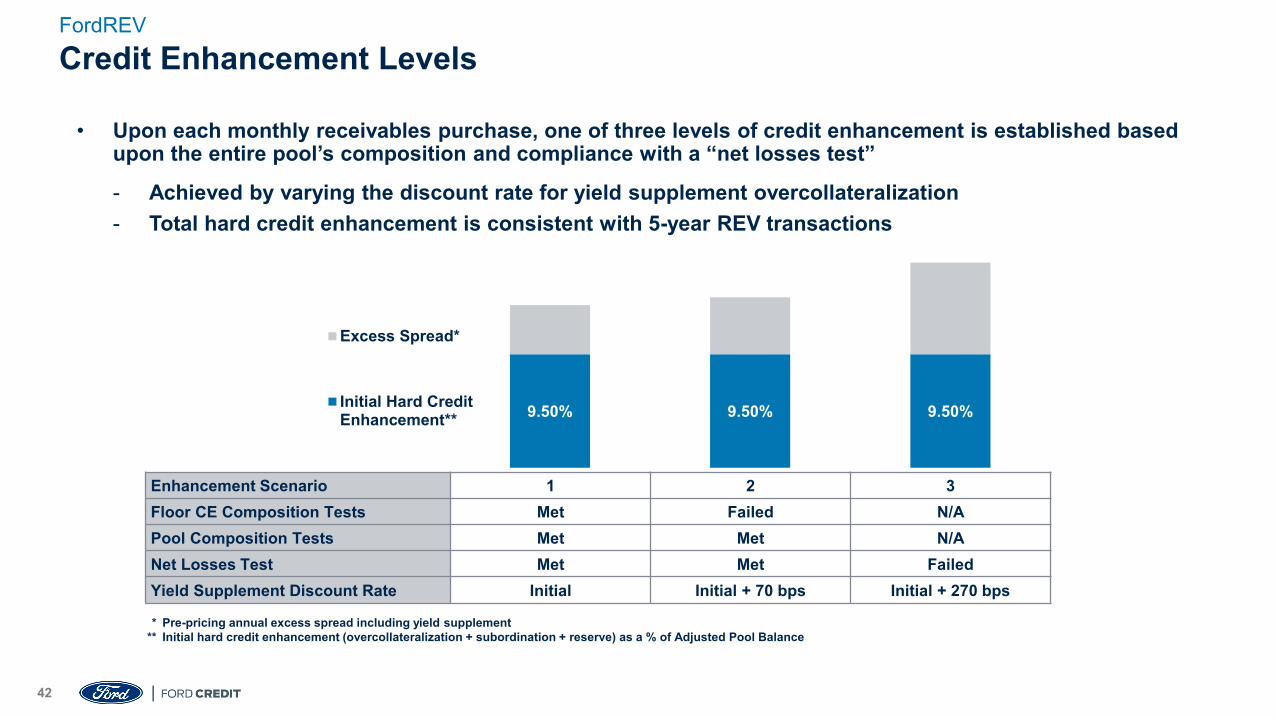
Credit Enhancement LevelsFordREV
9.50% 9.50% 9.50%
Excess Spread*
Initial Hard CreditEnhancement**
Enhancement Scenario 1 2 3Floor CE Composition Tests Met Failed N/APool Composition Tests Met Met N/ANet Losses Test Met Met FailedYield Supplement Discount Rate Initial Initial + 70 bps Initial + 270 bps
* Pre-pricing annual excess spread including yield supplement** Initial hard credit enhancement (overcollateralization + subordination + reserve) as a % of Adjusted Pool Balance
• Upon each monthly receivables purchase, one of three levels of credit enhancement is established based upon the entire pool’s composition and compliance with a “net losses test”
- Achieved by varying the discount rate for yield supplement overcollateralization- Total hard credit enhancement is consistent with 5-year REV transactions
43
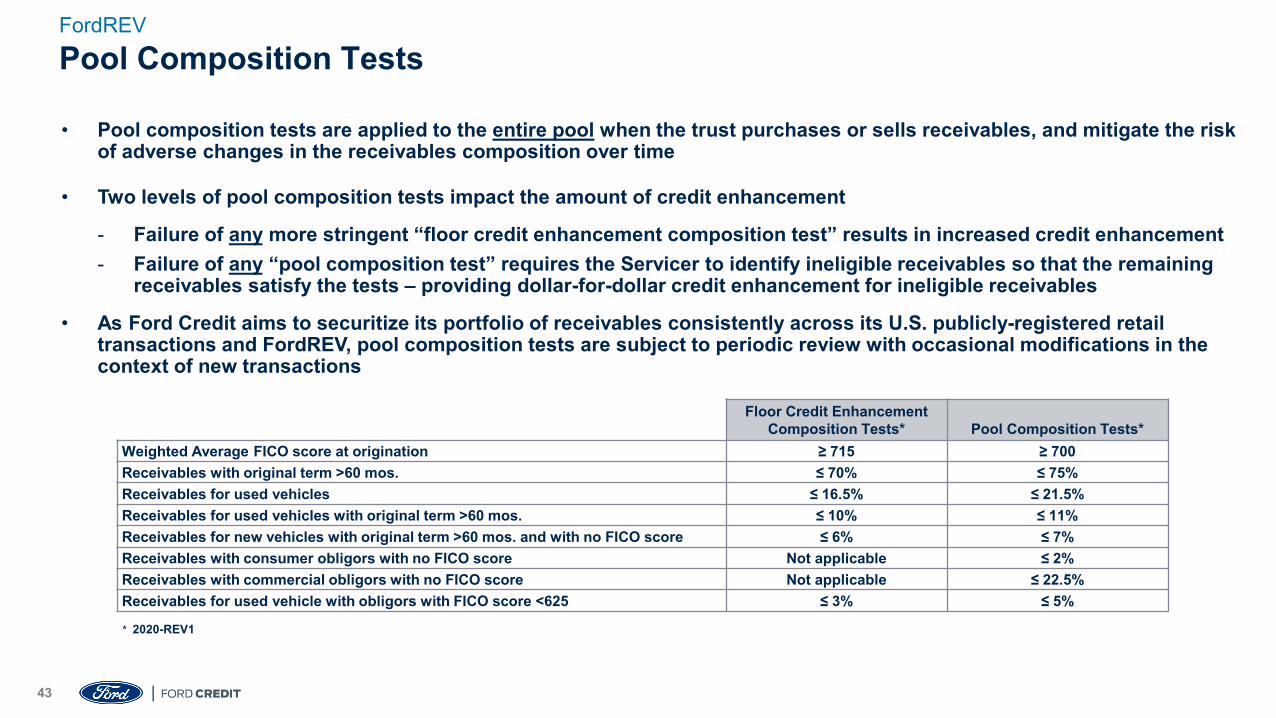
Pool Composition TestsFordREV
• Pool composition tests are applied to the entire pool when the trust purchases or sells receivables, and mitigate the risk of adverse changes in the receivables composition over time
• Two levels of pool composition tests impact the amount of credit enhancement
- Failure of any more stringent “floor credit enhancement composition test” results in increased credit enhancement - Failure of any “pool composition test” requires the Servicer to identify ineligible receivables so that the remaining
receivables satisfy the tests – providing dollar-for-dollar credit enhancement for ineligible receivables
• As Ford Credit aims to securitize its portfolio of receivables consistently across its U.S. publicly-registered retail transactions and FordREV, pool composition tests are subject to periodic review with occasional modifications in the context of new transactions
Floor Credit Enhancement Composition Tests* Pool Composition Tests*
Weighted Average FICO score at origination ≥ 715 ≥ 700Receivables with original term >60 mos. ≤ 70% ≤ 75%Receivables for used vehicles ≤ 16.5% ≤ 21.5%Receivables for used vehicles with original term >60 mos. ≤ 10% ≤ 11%Receivables for new vehicles with original term >60 mos. and with no FICO score ≤ 6% ≤ 7%Receivables with consumer obligors with no FICO score Not applicable ≤ 2%Receivables with commercial obligors with no FICO score Not applicable ≤ 22.5%Receivables for used vehicle with obligors with FICO score <625 ≤ 3% ≤ 5%
* 2020-REV1
44
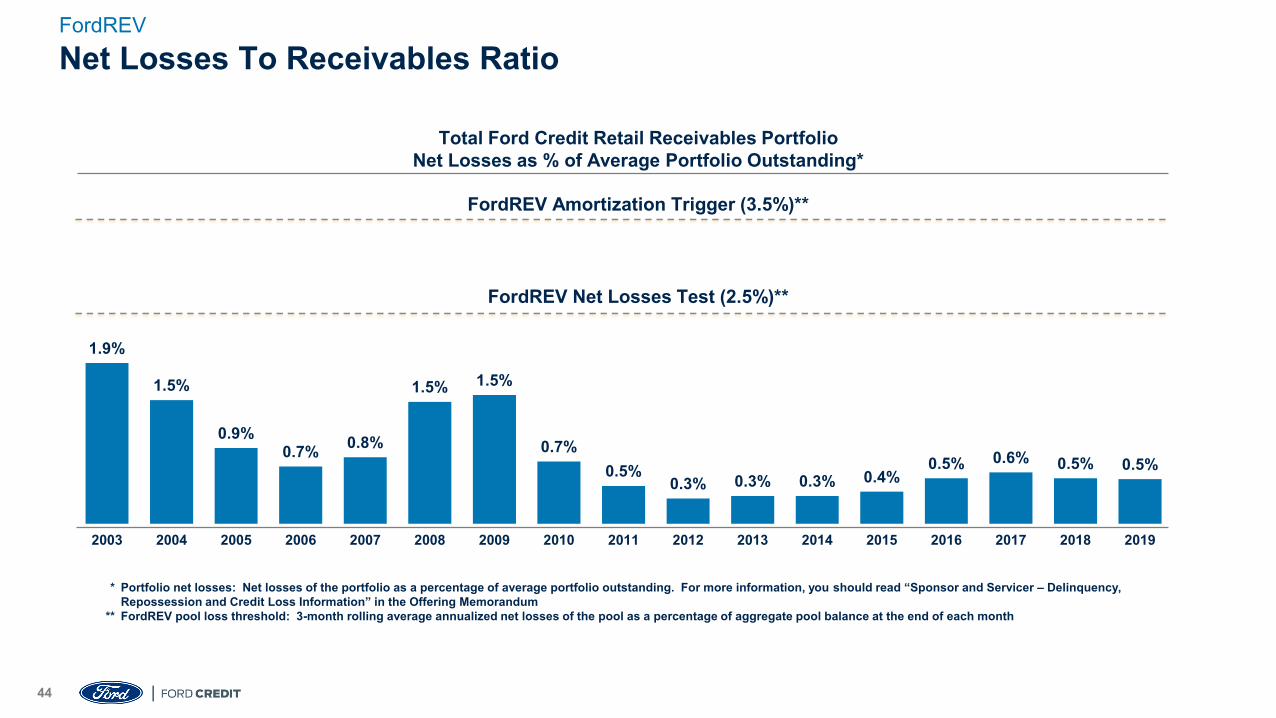
Net Losses To Receivables RatioFordREV
Total Ford Credit Retail Receivables PortfolioNet Losses as % of Average Portfolio Outstanding*
FordREV Amortization Trigger (3.5%)**
FordREV Net Losses Test (2.5%)**
1.9%
1.5%
0.9%0.7% 0.8%
1.5% 1.5%
0.7%0.5%
0.3% 0.3% 0.3% 0.4%0.5% 0.6% 0.5% 0.5%
2003 2004 2005 2006 2007 2008 2009 2010 2011 2012 2013 2014 2015 2016 2017 2018 2019
* Portfolio net losses: Net losses of the portfolio as a percentage of average portfolio outstanding. For more information, you should read “Sponsor and Servicer – Delinquency, Repossession and Credit Loss Information” in the Offering Memorandum
** FordREV pool loss threshold: 3-month rolling average annualized net losses of the pool as a percentage of aggregate pool balance at the end of each month
45
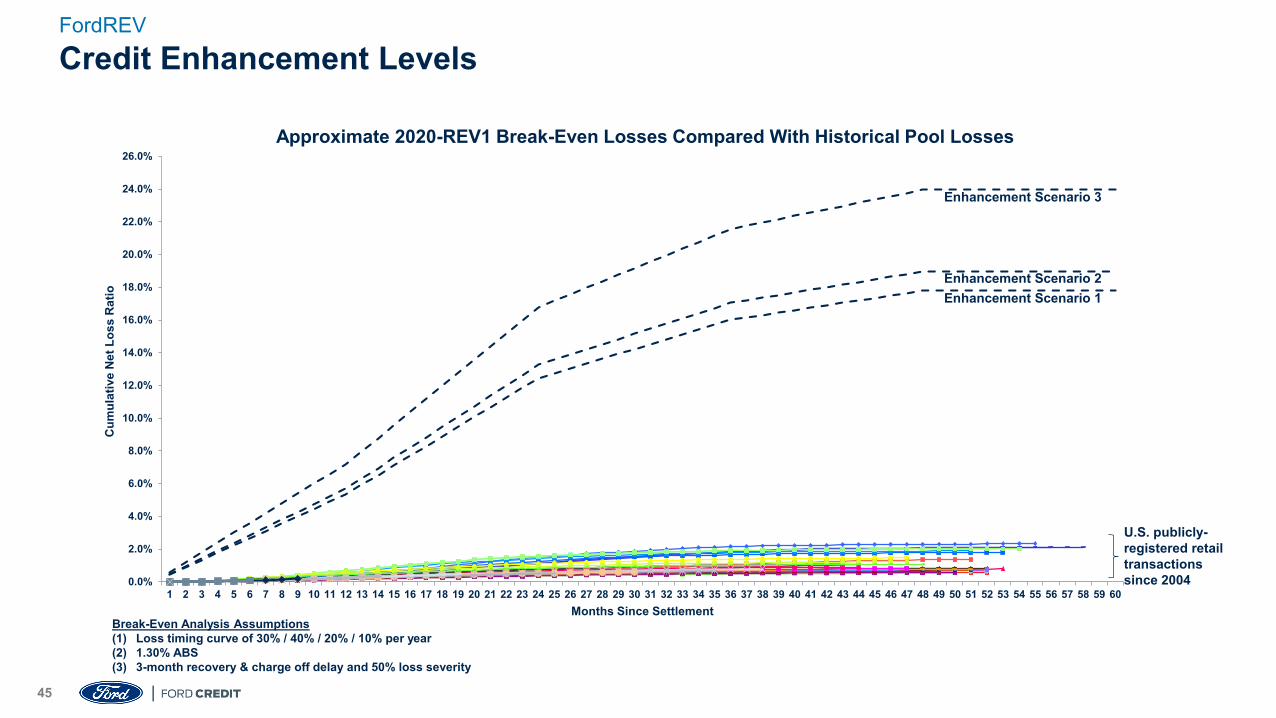
Credit Enhancement LevelsFordREV
Approximate 2020-REV1 Break-Even Losses Compared With Historical Pool Losses
0.0%
2.0%
4.0%
6.0%
8.0%
10.0%
12.0%
14.0%
16.0%
18.0%
20.0%
22.0%
24.0%
26.0%
1 2 3 4 5 6 7 8 9 10 11 12 13 14 15 16 17 18 19 20 21 22 23 24 25 26 27 28 29 30 31 32 33 34 35 36 37 38 39 40 41 42 43 44 45 46 47 48 49 50 51 52 53 54 55 56 57 58 59 60
Cum
ulat
ive
Net
Los
s R
atio
Months Since Settlement
U.S. publicly-registered retail transactions since 2004
Break-Even Analysis Assumptions(1) Loss timing curve of 30% / 40% / 20% / 10% per year(2) 1.30% ABS(3) 3-month recovery & charge off delay and 50% loss severity
Enhancement Scenario 3
Enhancement Scenario 2Enhancement Scenario 1
46
Amortization EventsFordREV
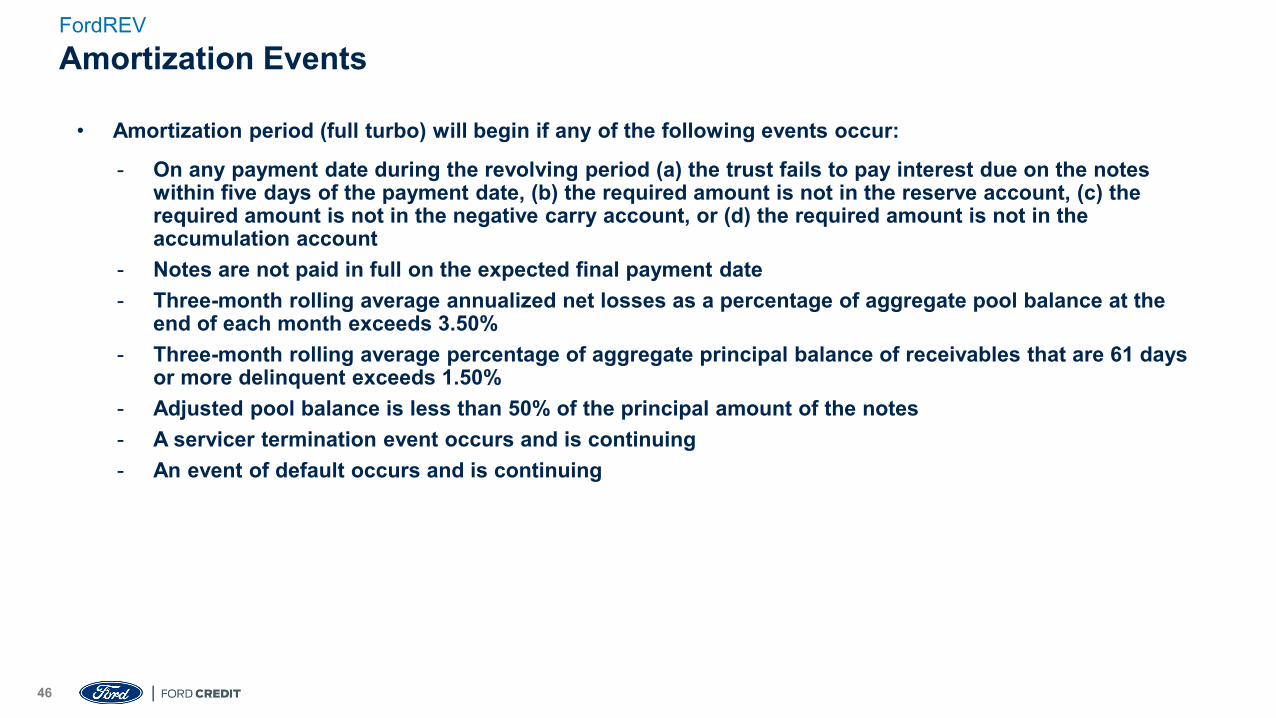
• Amortization period (full turbo) will begin if any of the following events occur:
- On any payment date during the revolving period (a) the trust fails to pay interest due on the notes within five days of the payment date, (b) the required amount is not in the reserve account, (c) the required amount is not in the negative carry account, or (d) the required amount is not in the accumulation account
- Notes are not paid in full on the expected final payment date- Three-month rolling average annualized net losses as a percentage of aggregate pool balance at the
end of each month exceeds 3.50%- Three-month rolling average percentage of aggregate principal balance of receivables that are 61 days
or more delinquent exceeds 1.50%- Adjusted pool balance is less than 50% of the principal amount of the notes- A servicer termination event occurs and is continuing- An event of default occurs and is continuing
47
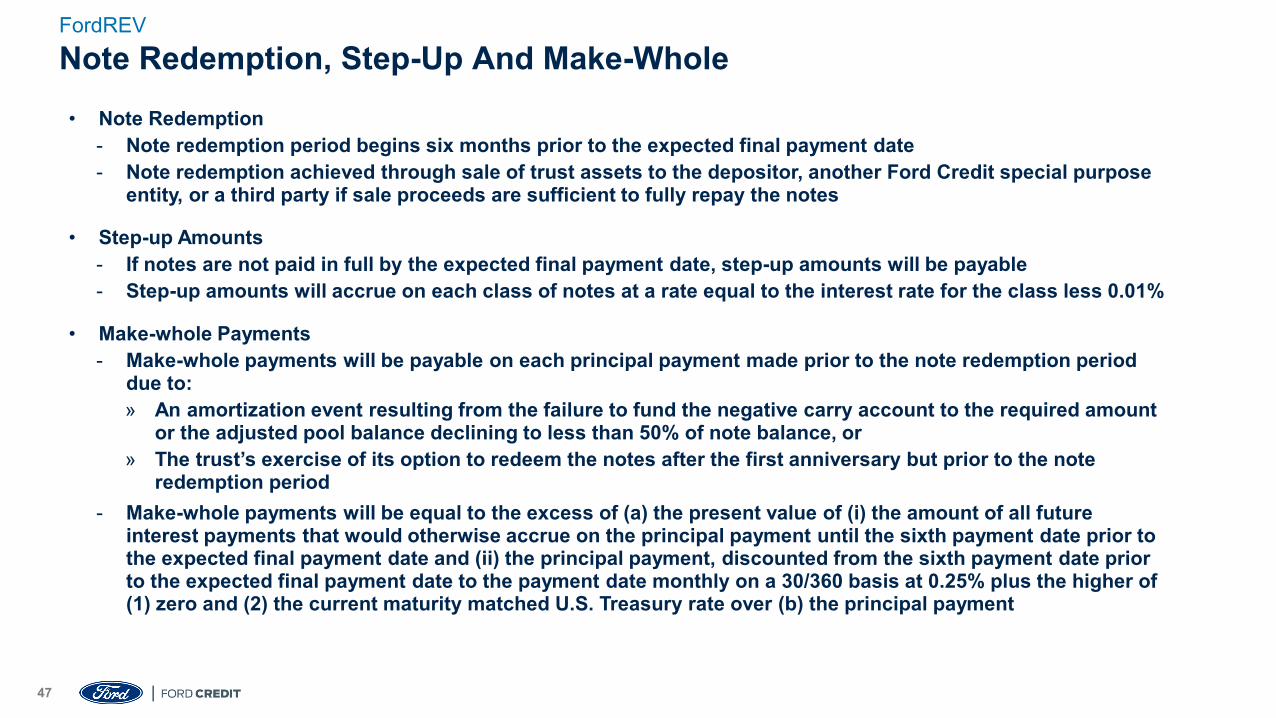
• Note Redemption- Note redemption period begins six months prior to the expected final payment date- Note redemption achieved through sale of trust assets to the depositor, another Ford Credit special purpose
entity, or a third party if sale proceeds are sufficient to fully repay the notes
• Step-up Amounts- If notes are not paid in full by the expected final payment date, step-up amounts will be payable- Step-up amounts will accrue on each class of notes at a rate equal to the interest rate for the class less 0.01%
• Make-whole Payments- Make-whole payments will be payable on each principal payment made prior to the note redemption period
due to:» An amortization event resulting from the failure to fund the negative carry account to the required amount
or the adjusted pool balance declining to less than 50% of note balance, or» The trust’s exercise of its option to redeem the notes after the first anniversary but prior to the note
redemption period - Make-whole payments will be equal to the excess of (a) the present value of (i) the amount of all future
interest payments that would otherwise accrue on the principal payment until the sixth payment date prior to the expected final payment date and (ii) the principal payment, discounted from the sixth payment date prior to the expected final payment date to the payment date monthly on a 30/360 basis at 0.25% plus the higher of (1) zero and (2) the current maturity matched U.S. Treasury rate over (b) the principal payment
Note Redemption, Step-Up And Make-WholeFordREV
48
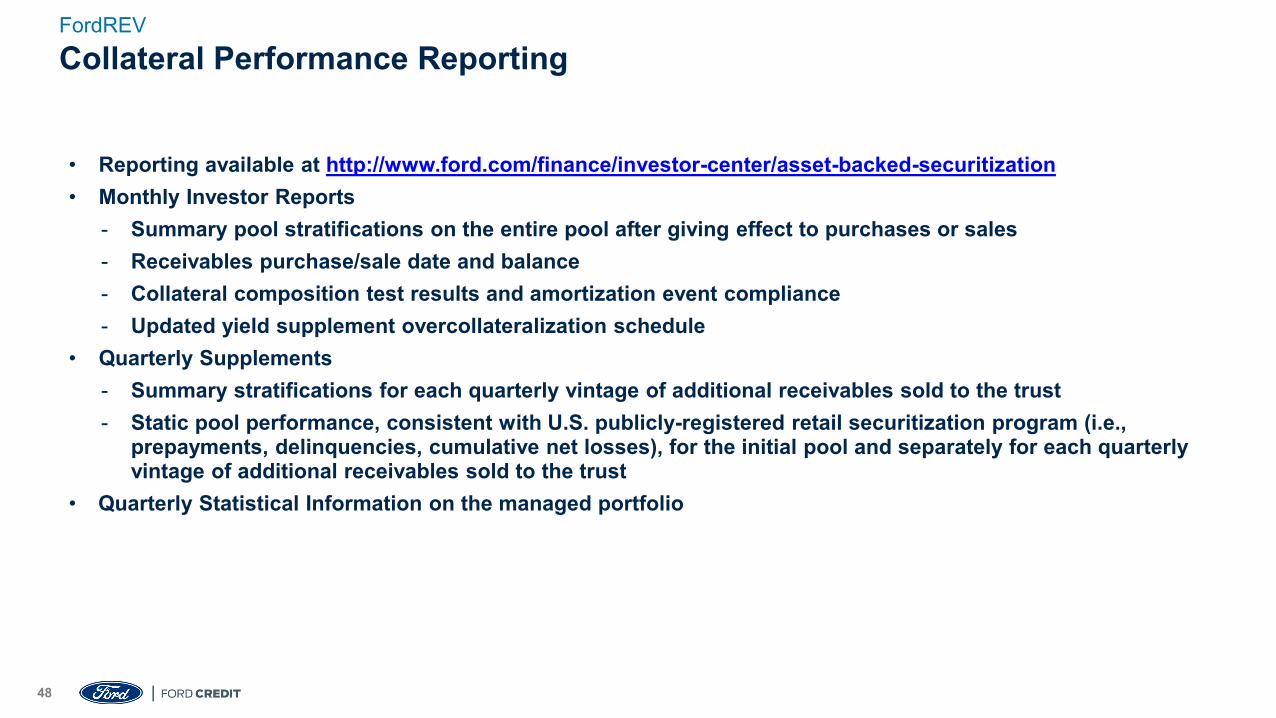
• Reporting available at http://www.ford.com/finance/investor-center/asset-backed-securitization• Monthly Investor Reports
- Summary pool stratifications on the entire pool after giving effect to purchases or sales- Receivables purchase/sale date and balance- Collateral composition test results and amortization event compliance- Updated yield supplement overcollateralization schedule
• Quarterly Supplements- Summary stratifications for each quarterly vintage of additional receivables sold to the trust- Static pool performance, consistent with U.S. publicly-registered retail securitization program (i.e.,
prepayments, delinquencies, cumulative net losses), for the initial pool and separately for each quarterly vintage of additional receivables sold to the trust
• Quarterly Statistical Information on the managed portfolio
Collateral Performance ReportingFordREV

All-Electric Mustang Mach-E
U.S. Lease SecuritizationFebruary 2020
SECRET50
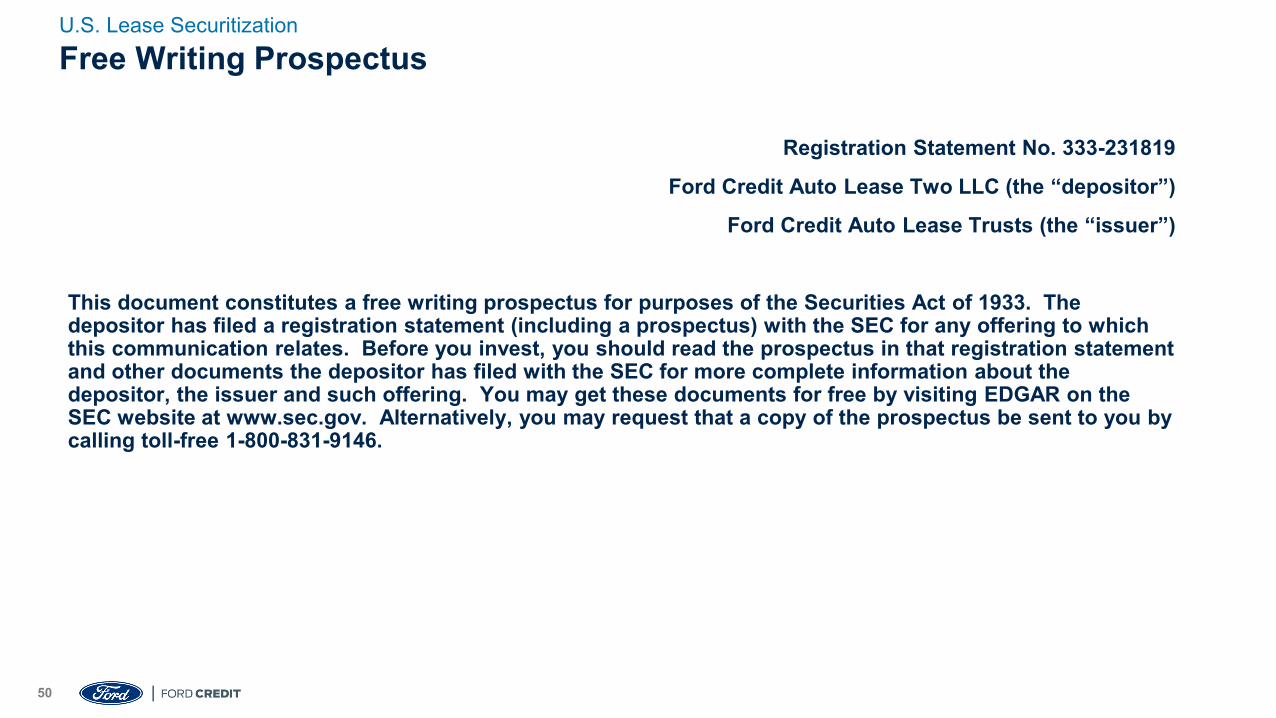
Registration Statement No. 333-231819
Ford Credit Auto Lease Two LLC (the “depositor”)
Ford Credit Auto Lease Trusts (the “issuer”)
This document constitutes a free writing prospectus for purposes of the Securities Act of 1933. The depositor has filed a registration statement (including a prospectus) with the SEC for any offering to which this communication relates. Before you invest, you should read the prospectus in that registration statement and other documents the depositor has filed with the SEC for more complete information about the depositor, the issuer and such offering. You may get these documents for free by visiting EDGAR on the SEC website at www.sec.gov. Alternatively, you may request that a copy of the prospectus be sent to you by calling toll-free 1-800-831-9146.
Free Writing ProspectusU.S. Lease Securitization
SECRET51
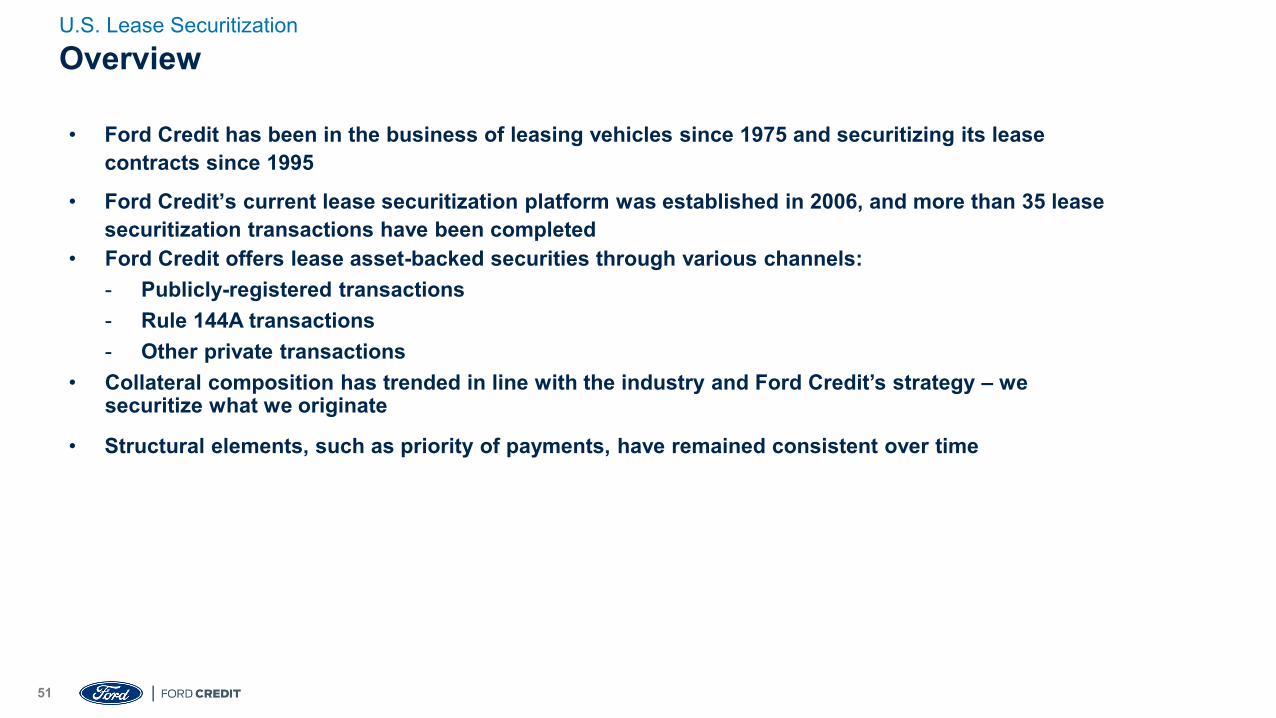
• Ford Credit has been in the business of leasing vehicles since 1975 and securitizing its lease contracts since 1995
• Ford Credit’s current lease securitization platform was established in 2006, and more than 35 lease securitization transactions have been completed
• Ford Credit offers lease asset-backed securities through various channels:- Publicly-registered transactions- Rule 144A transactions- Other private transactions
• Collateral composition has trended in line with the industry and Ford Credit’s strategy – we securitize what we originate
• Structural elements, such as priority of payments, have remained consistent over time
OverviewU.S. Lease Securitization
52
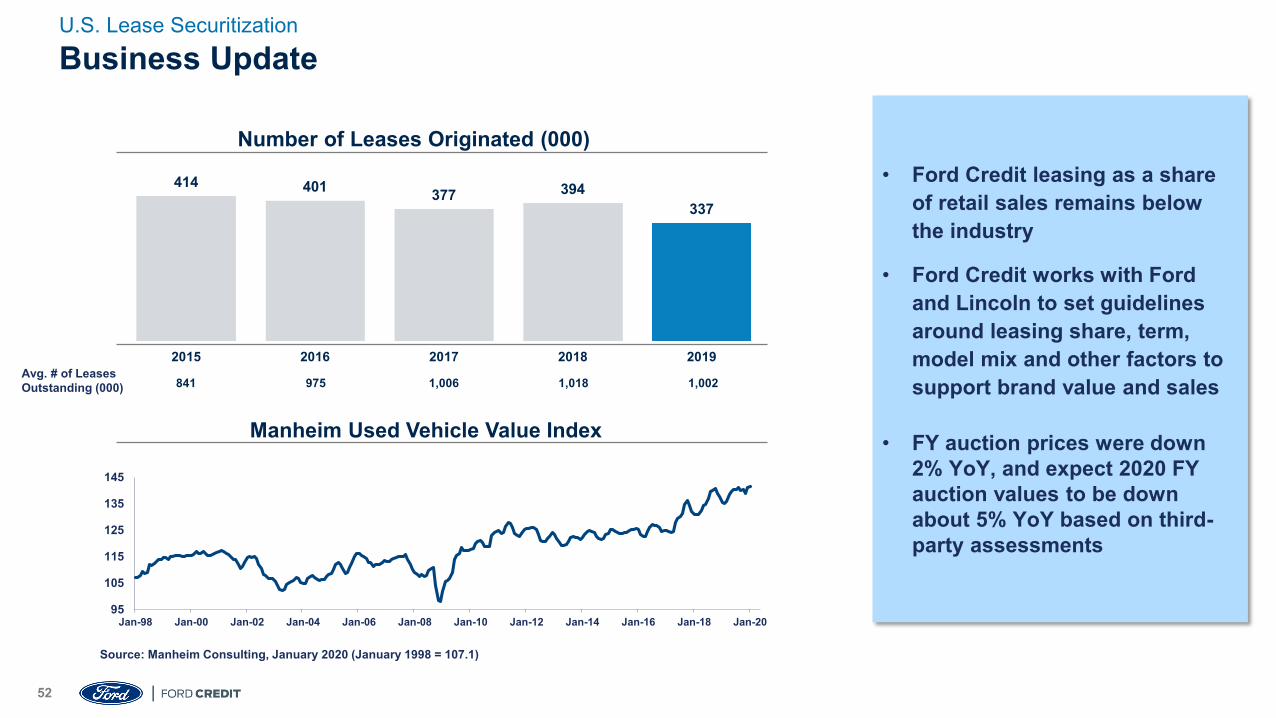
414 401 377 394337
2015 2016 2017 2018 2019
Number of Leases Originated (000)
Manheim Used Vehicle Value Index
Avg. # of LeasesOutstanding (000) 841 975 1,006 1,018 1,002
Business UpdateU.S. Lease Securitization
95
105
115
125
135
145
Jan-98 Jan-00 Jan-02 Jan-04 Jan-06 Jan-08 Jan-10 Jan-12 Jan-14 Jan-16 Jan-18 Jan-20
Source: Manheim Consulting, January 2020 (January 1998 = 107.1)
• Ford Credit leasing as a share of retail sales remains below the industry
• Ford Credit works with Ford and Lincoln to set guidelines around leasing share, term, model mix and other factors to support brand value and sales
• FY auction prices were down 2% YoY, and expect 2020 FY auction values to be down about 5% YoY based on third-party assessments
SECRET53
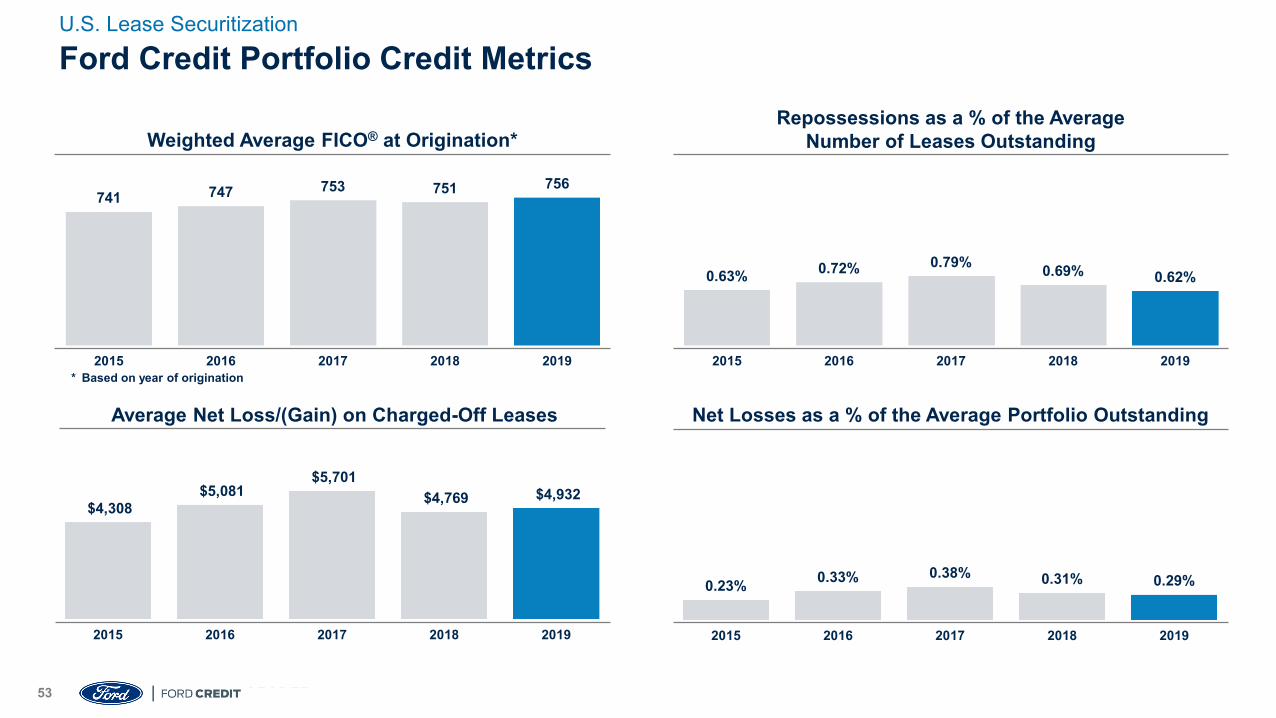
$4,308 $5,081
$5,701 $4,769 $4,932
2015 2016 2017 2018 2019
741 747 753 751 756
2015 2016 2017 2018 2019
Weighted Average FICO® at Origination*Repossessions as a % of the Average
Number of Leases Outstanding
Net Losses as a % of the Average Portfolio OutstandingAverage Net Loss/(Gain) on Charged-Off Leases
Ford Credit Portfolio Credit MetricsU.S. Lease Securitization
0.63% 0.72% 0.79% 0.69% 0.62%
2015 2016 2017 2018 2019
0.23% 0.33% 0.38% 0.31% 0.29%
2015 2016 2017 2018 2019
* Based on year of origination
SECRET54
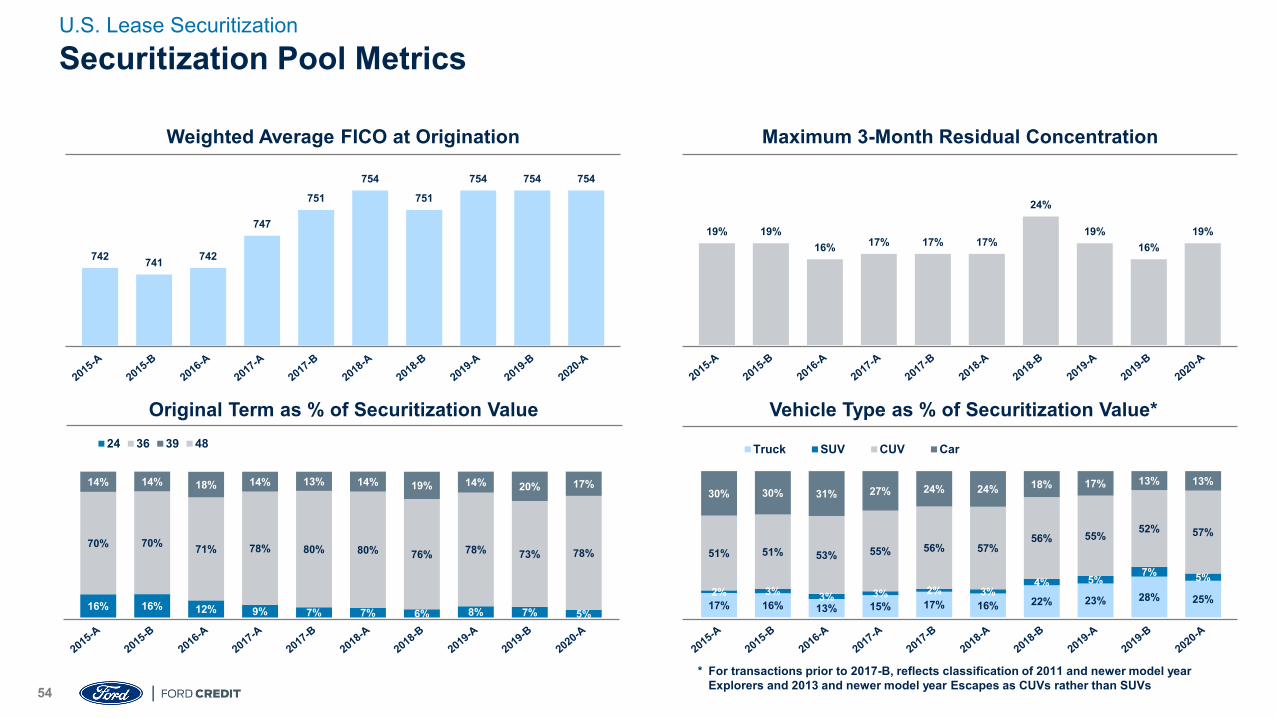
17% 16% 13% 15% 17% 16% 22% 23% 28% 25%2% 3% 3% 3% 2% 3%4% 5%
7% 5%
51% 51% 53% 55% 56% 57%56% 55% 52% 57%
30% 30% 31% 27% 24% 24% 18% 17% 13% 13%
Truck SUV CUV Car
Weighted Average FICO at Origination
Original Term as % of Securitization Value Vehicle Type as % of Securitization Value*
Maximum 3-Month Residual Concentration
Securitization Pool MetricsU.S. Lease Securitization
19% 19%16% 17% 17% 17%
24%
19%16%
19%
16% 16% 12% 9% 7% 7% 6% 8% 7% 5%
70% 70% 71% 78% 80% 80% 76% 78% 73% 78%
14% 14% 18% 14% 13% 14% 19% 14% 20% 17%
24 36 39 48
742 741 742
747
751
754
751
754 754 754
* For transactions prior to 2017-B, reflects classification of 2011 and newer model year Explorers and 2013 and newer model year Escapes as CUVs rather than SUVs
SECRET55
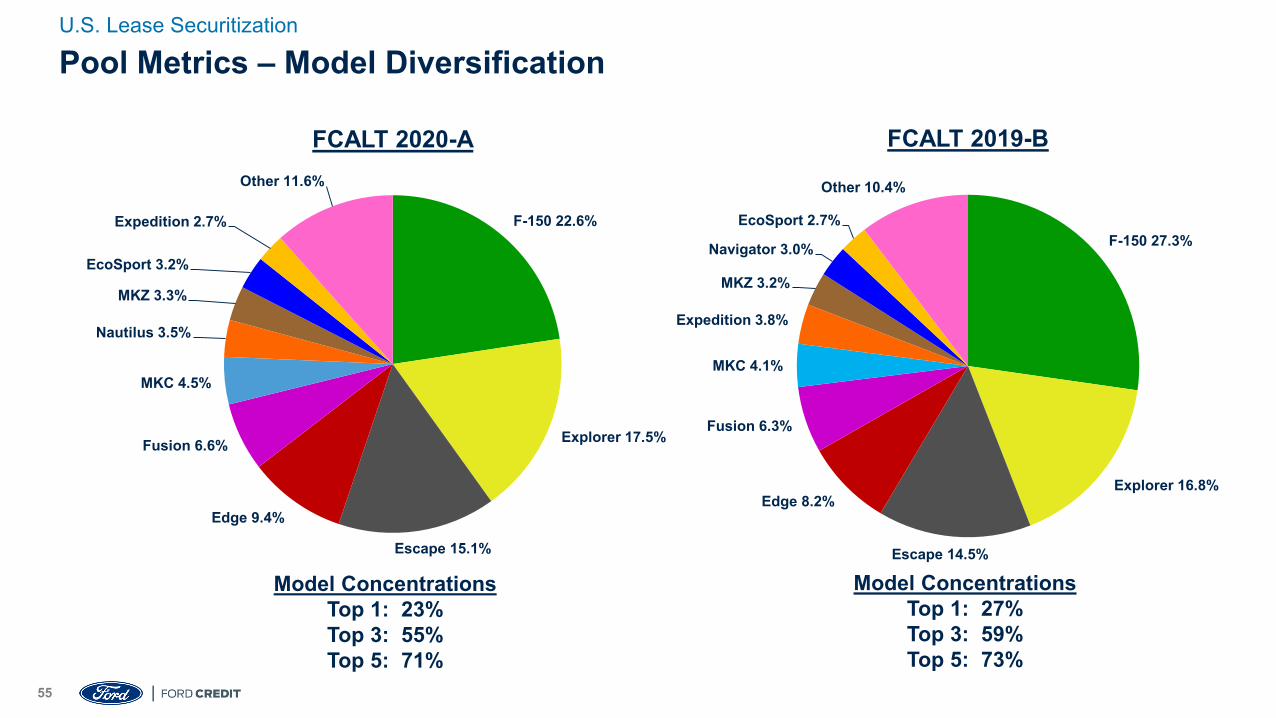
F-150 22.6%
Explorer 17.5%
Escape 15.1%
Edge 9.4%
Fusion 6.6%
MKC 4.5%
Nautilus 3.5%
MKZ 3.3%
EcoSport 3.2%
Expedition 2.7%
Other 11.6%
FCALT 2020-A
Model ConcentrationsTop 1: 23%Top 3: 55%Top 5: 71%
F-150 27.3%
Explorer 16.8%
Escape 14.5%
Edge 8.2%
Fusion 6.3%
MKC 4.1%
Expedition 3.8%
MKZ 3.2%
Navigator 3.0%
EcoSport 2.7%
Other 10.4%
FCALT 2019-B
Model ConcentrationsTop 1: 27%Top 3: 59%Top 5: 73%
Pool Metrics – Model DiversificationU.S. Lease Securitization
SECRET56
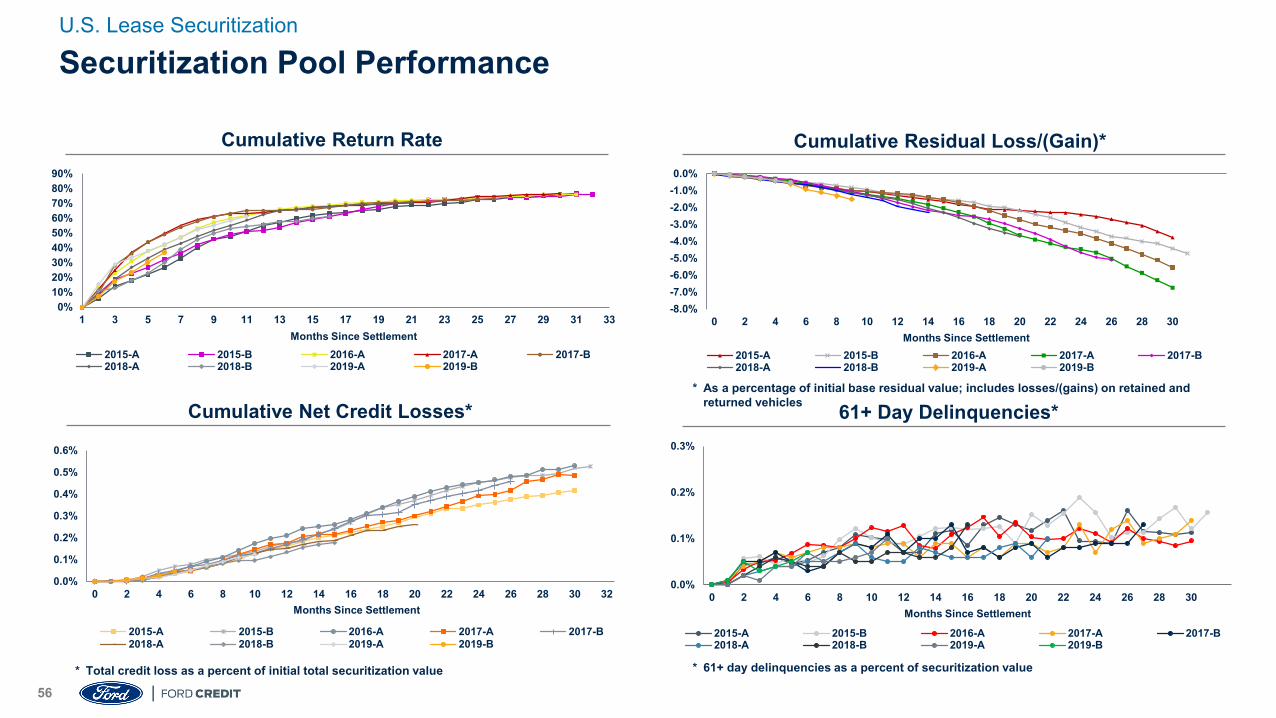
Cumulative Return Rate
0%10%20%30%40%50%60%70%80%90%
1 3 5 7 9 11 13 15 17 19 21 23 25 27 29 31 33Months Since Settlement
2015-A 2015-B 2016-A 2017-A 2017-B2018-A 2018-B 2019-A 2019-B
Cumulative Residual Loss/(Gain)*
61+ Day Delinquencies*Cumulative Net Credit Losses*
0.0%
0.1%
0.2%
0.3%
0.4%
0.5%
0.6%
0 2 4 6 8 10 12 14 16 18 20 22 24 26 28 30 32Months Since Settlement
2015-A 2015-B 2016-A 2017-A 2017-B2018-A 2018-B 2019-A 2019-B
* As a percentage of initial base residual value; includes losses/(gains) on retained and returned vehicles
* Total credit loss as a percent of initial total securitization value
-8.0%-7.0%-6.0%-5.0%-4.0%-3.0%-2.0%-1.0%0.0%
0 2 4 6 8 10 12 14 16 18 20 22 24 26 28 30Months Since Settlement
2015-A 2015-B 2016-A 2017-A 2017-B2018-A 2018-B 2019-A 2019-B
* 61+ day delinquencies as a percent of securitization value
Securitization Pool PerformanceU.S. Lease Securitization
0.0%
0.1%
0.2%
0.3%
0 2 4 6 8 10 12 14 16 18 20 22 24 26 28 30Months Since Settlement
2015-A 2015-B 2016-A 2017-A 2017-B2018-A 2018-B 2019-A 2019-B
57
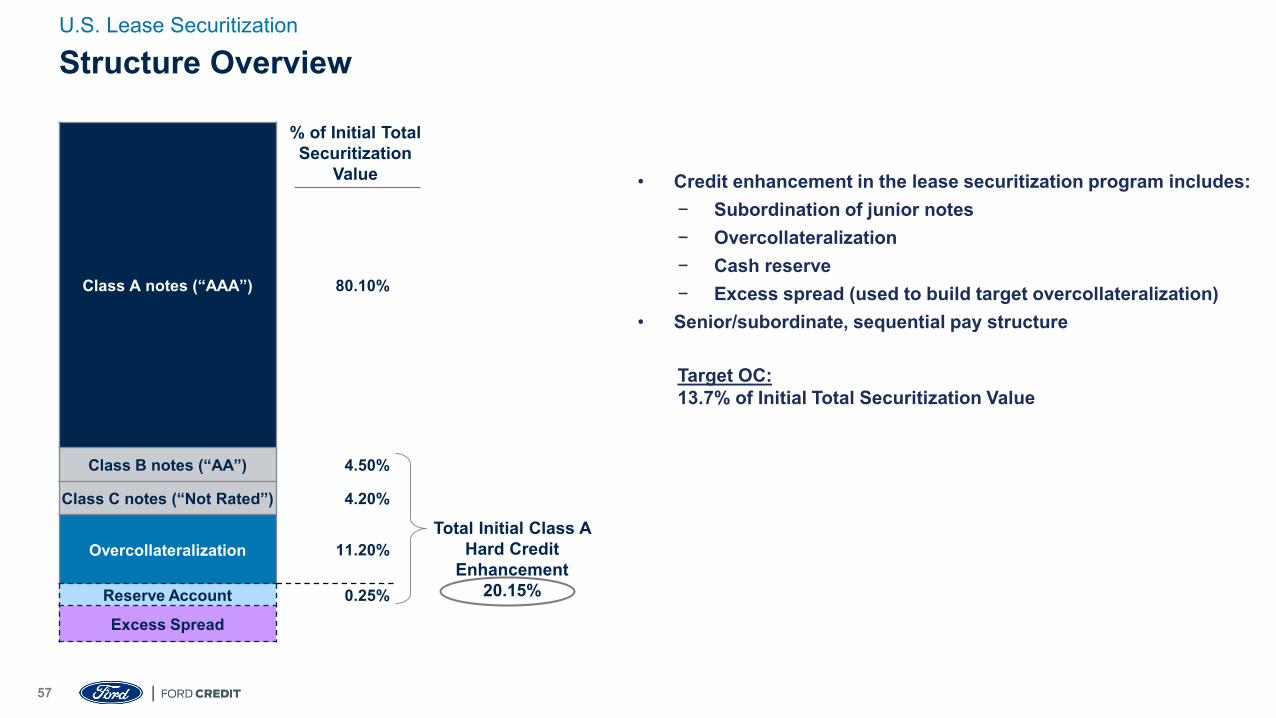
Structure OverviewU.S. Lease Securitization
• Credit enhancement in the lease securitization program includes:− Subordination of junior notes− Overcollateralization − Cash reserve− Excess spread (used to build target overcollateralization)
• Senior/subordinate, sequential pay structure
Target OC: 13.7% of Initial Total Securitization Value
Class A notes (“AAA”) 80.10%*
Class B notes (“AA”) 4.50%*
Class C notes (“Not Rated”) 4.20%*
Overcollateralization 11.20%*
Reserve Account 0.25%*
Excess Spread
% of Initial Total Securitization
Value
Total Initial Class A Hard Credit
Enhancement20.15%
SECRET58
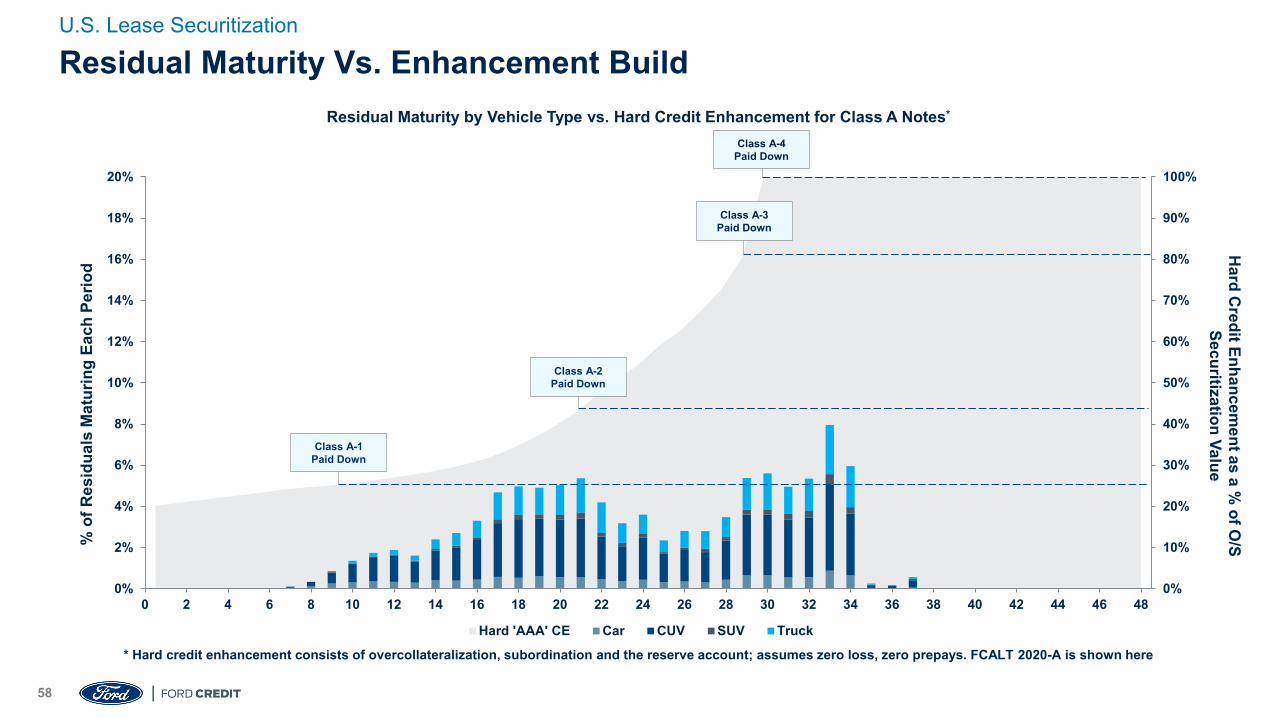
0%
10%
20%
30%
40%
50%
60%
70%
80%
90%
100%
0%
2%
4%
6%
8%
10%
12%
14%
16%
18%
20%
0 2 4 6 8 10 12 14 16 18 20 22 24 26 28 30 32 34 36 38 40 42 44 46 48
Hard 'AAA' CE Car CUV SUV Truck
* Hard credit enhancement consists of overcollateralization, subordination and the reserve account; assumes zero loss, zero prepays. FCALT 2020-A is shown here
Residual Maturity by Vehicle Type vs. Hard Credit Enhancement for Class A Notes*
% o
f Res
idua
ls M
atur
ing
Each
Per
iod
Class A-2Paid Down
Class A-1Paid Down
Hard C
redit Enhancement as a %
of O/S
SecuritizationValue
Class A-4Paid Down
Class A-3Paid Down
Residual Maturity Vs. Enhancement BuildU.S. Lease Securitization
59
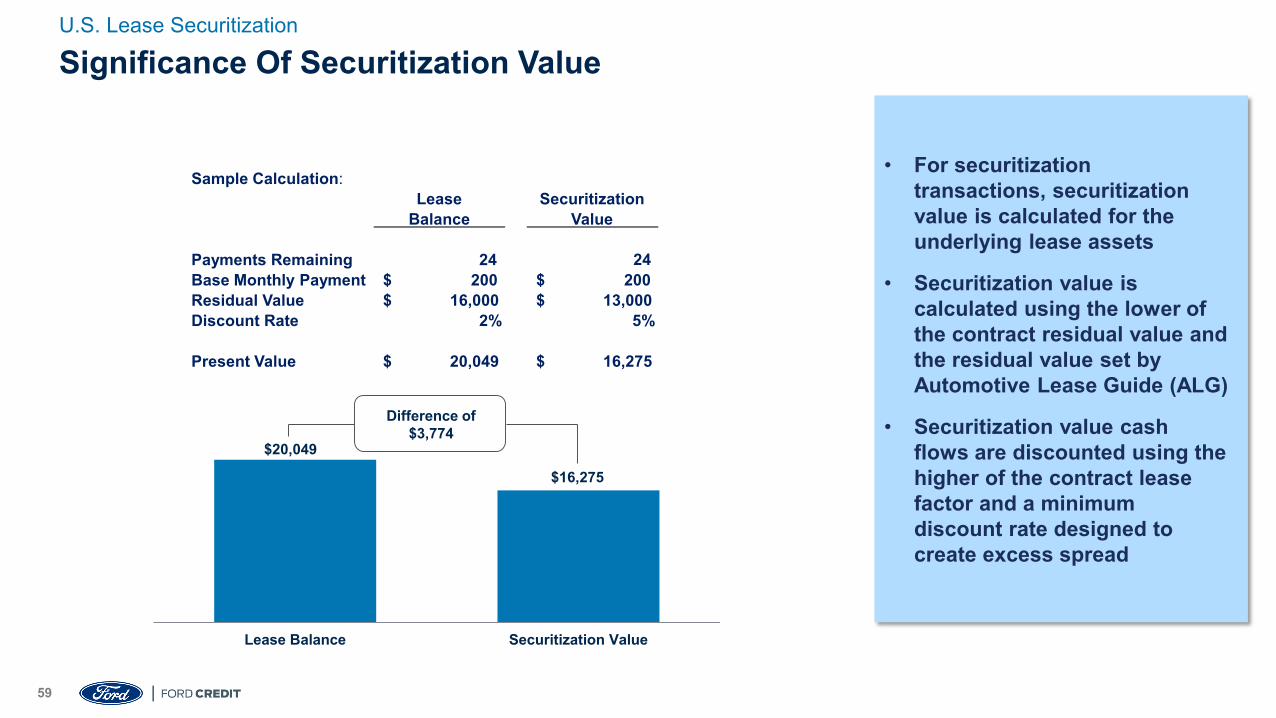
Sample Calculation:Lease
BalanceSecuritization
Value
Payments Remaining 24 24Base Monthly Payment 200$ 200$Residual Value 16,000$ 13,000$Discount Rate 2% 5%
Present Value 20,049$ 16,275$
$20,049
$16,275
Lease Balance Securitization Value
Difference of $3,774
Significance Of Securitization ValueU.S. Lease Securitization
• For securitization transactions, securitization value is calculated for the underlying lease assets
• Securitization value is calculated using the lower of the contract residual value and the residual value set by Automotive Lease Guide (ALG)
• Securitization value cash flows are discounted using the higher of the contract lease factor and a minimum discount rate designed to create excess spread
SECRET60
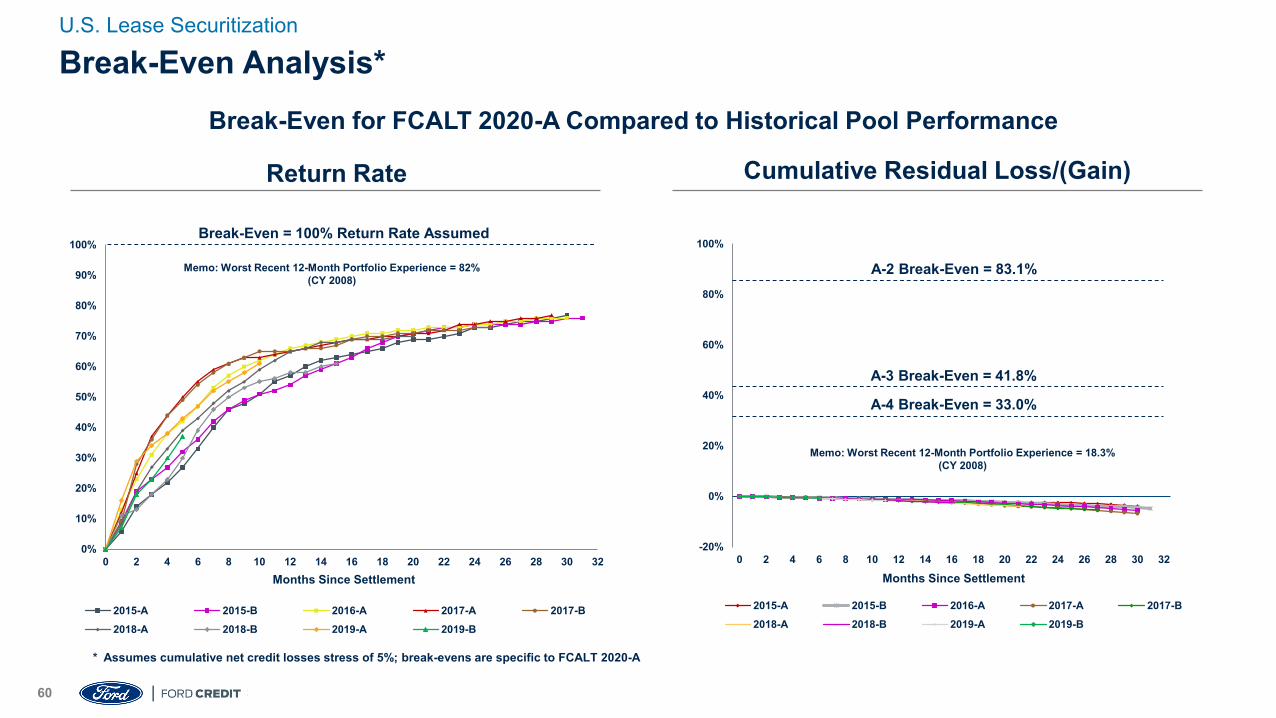
Break-Even for FCALT 2020-A Compared to Historical Pool Performance
Return Rate
0%
10%
20%
30%
40%
50%
60%
70%
80%
90%
100%
0 2 4 6 8 10 12 14 16 18 20 22 24 26 28 30 32
2015-A 2015-B 2016-A 2017-A 2017-B2018-A 2018-B 2019-A 2019-B
Cumulative Residual Loss/(Gain)
-20%
0%
20%
40%
60%
80%
100%
0 2 4 6 8 10 12 14 16 18 20 22 24 26 28 30 32
2015-A 2015-B 2016-A 2017-A 2017-B2018-A 2018-B 2019-A 2019-B
* Assumes cumulative net credit losses stress of 5%; break-evens are specific to FCALT 2020-A
A-2 Break-Even = 83.1%
A-3 Break-Even = 41.8%
A-4 Break-Even = 33.0%
Memo: Worst Recent 12-Month Portfolio Experience = 18.3% (CY 2008)
Memo: Worst Recent 12-Month Portfolio Experience = 82%(CY 2008)
Break-Even = 100% Return Rate Assumed
Months Since Settlement Months Since Settlement
Break-Even Analysis*U.S. Lease Securitization
SECRET61
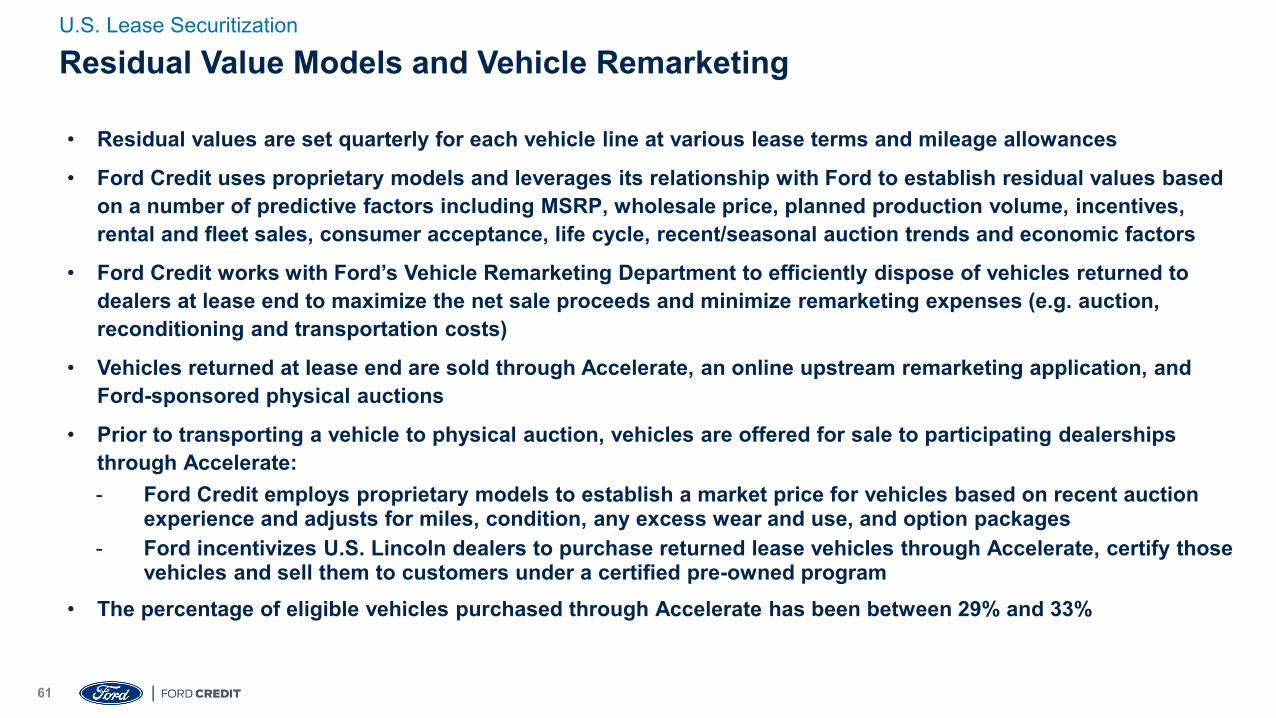
• Residual values are set quarterly for each vehicle line at various lease terms and mileage allowances
• Ford Credit uses proprietary models and leverages its relationship with Ford to establish residual values based on a number of predictive factors including MSRP, wholesale price, planned production volume, incentives, rental and fleet sales, consumer acceptance, life cycle, recent/seasonal auction trends and economic factors
• Ford Credit works with Ford’s Vehicle Remarketing Department to efficiently dispose of vehicles returned to dealers at lease end to maximize the net sale proceeds and minimize remarketing expenses (e.g. auction, reconditioning and transportation costs)
• Vehicles returned at lease end are sold through Accelerate, an online upstream remarketing application, and Ford-sponsored physical auctions
• Prior to transporting a vehicle to physical auction, vehicles are offered for sale to participating dealerships through Accelerate:- Ford Credit employs proprietary models to establish a market price for vehicles based on recent auction
experience and adjusts for miles, condition, any excess wear and use, and option packages- Ford incentivizes U.S. Lincoln dealers to purchase returned lease vehicles through Accelerate, certify those
vehicles and sell them to customers under a certified pre-owned program• The percentage of eligible vehicles purchased through Accelerate has been between 29% and 33%
Residual Value Models and Vehicle RemarketingU.S. Lease Securitization

All-Electric Mustang Mach-E
U.S. Floorplan SecuritizationFebruary 2020
SECRET63
Registration Statement Nos. 333-227766, 333-227766-01 and 333-227766-02
Ford Credit Floorplan Corporation and Ford Credit Floorplan LLC (the "depositors")
Ford Credit Floorplan Master Owner Trust A (the "issuer")
This document constitutes a free writing prospectus for purposes of the Securities Act of 1933. The depositors have filed a registration statement (including a prospectus) with the SEC for any offering to which this communication relates. Before you invest, you should read the prospectus in that registration statement and other documents the depositors have filed with the SEC for more complete information about the depositors, the issuer and such offering. You may get these documents for free by visiting EDGAR on the SEC Website at www.sec.gov. Alternatively, you may request that a copy of the prospectus be sent to you by calling toll-free 1-800-831-9146.
Free Writing ProspectusU.S. Floorplan Securitization
SECRET64
• Ford Credit has been financing dealer vehicle inventory since 1959 and securitizing floorplan receivables since 1991
• Ford’s goal is to maintain a profitable network of Ford and Lincoln dealerships that deliver an innovative and engaging sales and service experience for customers. At year-end 2019, Ford and Lincoln had approximately 3,000 dealers
• Over the past five years, Ford Credit financed 75% to 77% of Ford and Lincoln dealer new vehicle inventory• Floorplan receivables are secured primarily by the financed vehicles, and payment is required when the
vehicle is sold• Ford Credit’s floorplan portfolio has historically experienced very low losses, primarily driven by strong
risk management practices and servicing:
- Continuous dealer monitoring of financial health, payment performance, vehicle collateral status and risk-based on-site inventory audits
- Use of proprietary risk rating assessment and behavioral scoring models
- Intensifying risk management actions as dealer risk increases
- Leveraging access to dealer information through Ford relationship
Portfolio OverviewU.S. Floorplan Securitization
SECRET65
• Ford Credit’s current floorplan securitization trust was established in 2001 as a master trust (similar to a revolving credit card securitization trust) and has issued more than 55 series
• Ford Credit offers floorplan asset-backed securities through various channels:
- Publicly-registered transactions
- Rule 144A transactions
- Other private transactions
Trust OverviewU.S. Floorplan Securitization
SECRET66
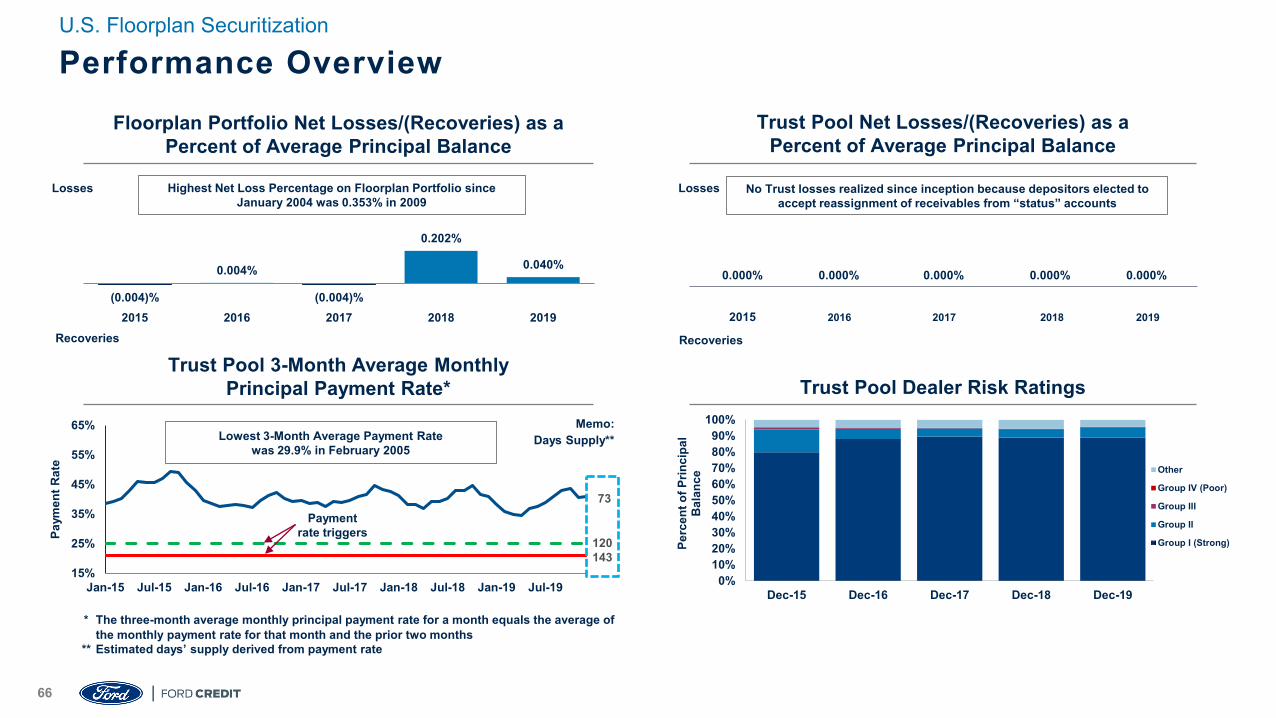
Floorplan Portfolio Net Losses/(Recoveries) as a Percent of Average Principal Balance
Trust Pool Net Losses/(Recoveries) as a Percent of Average Principal Balance
0.000% 0.000% 0.000% 0.000% 0.000%
2015 2016 2017 2018 2019
Losses
Recoveries
No Trust losses realized since inception because depositors elected to accept reassignment of receivables from “status” accounts
Trust Pool 3-Month Average MonthlyPrincipal Payment Rate* Trust Pool Dealer Risk Ratings
0%10%20%30%40%50%60%70%80%90%
100%
Dec-15 Dec-16 Dec-17 Dec-18 Dec-19
Perc
ent o
f Prin
cipa
l B
alan
ce
Other
Group IV (Poor)
Group III
Group II
Group I (Strong)
(0.004)%
0.004%
(0.004)%
0.202%
0.040%
2015 2016 2017 2018 2019
Losses Highest Net Loss Percentage on Floorplan Portfolio sinceJanuary 2004 was 0.353% in 2009
Recoveries
* The three-month average monthly principal payment rate for a month equals the average of the monthly payment rate for that month and the prior two months
** Estimated days’ supply derived from payment rate
Performance OverviewU.S. Floorplan Securitization
15%
25%
35%
45%
55%
65%
Jan-15 Jul-15 Jan-16 Jul-16 Jan-17 Jul-17 Jan-18 Jul-18 Jan-19 Jul-19
Paym
ent R
ate
Payment rate triggers
73
120143
Memo:Days Supply**Lowest 3-Month Average Payment Rate
was 29.9% in February 2005
2015 2016 2017 2018 2019
SECRET67
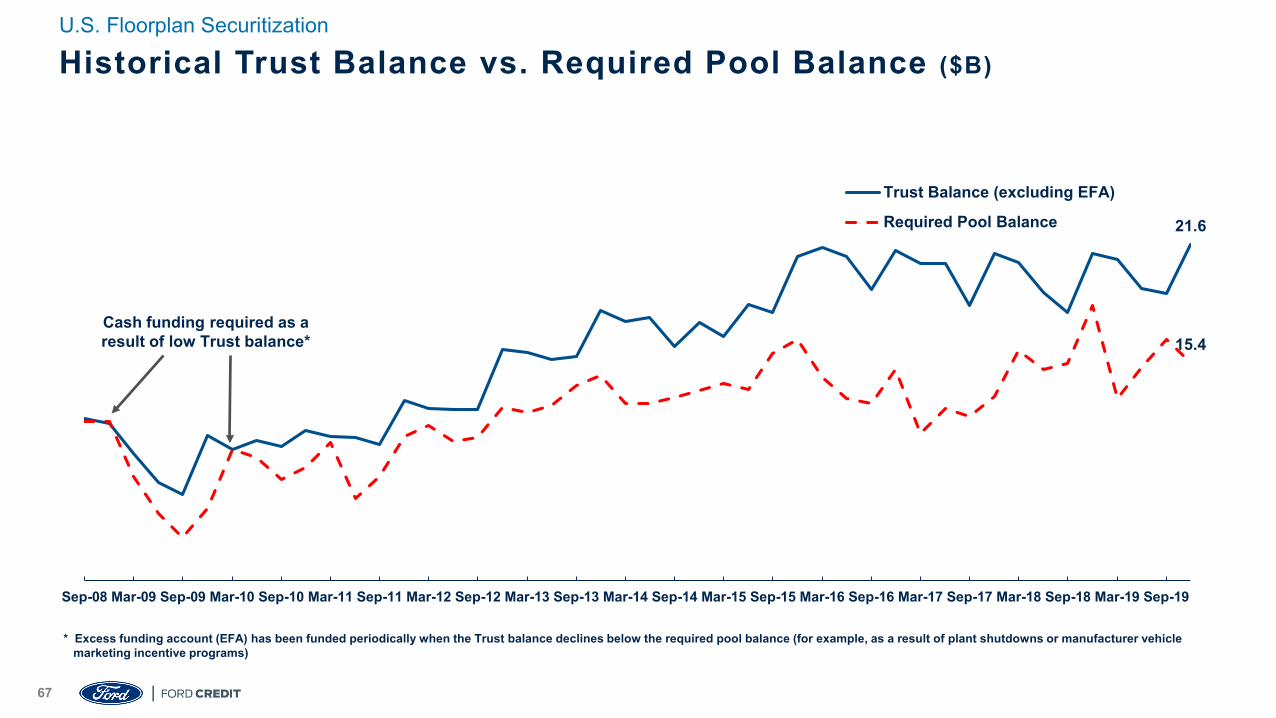
21.6
15.4
Sep-08 Mar-09 Sep-09 Mar-10 Sep-10 Mar-11 Sep-11 Mar-12 Sep-12 Mar-13 Sep-13 Mar-14 Sep-14 Mar-15 Sep-15 Mar-16 Sep-16 Mar-17 Sep-17 Mar-18 Sep-18 Mar-19 Sep-19
Trust Balance (excluding EFA)
Required Pool Balance
Cash funding required as a result of low Trust balance*
* Excess funding account (EFA) has been funded periodically when the Trust balance declines below the required pool balance (for example, as a result of plant shutdowns or manufacturer vehicle marketing incentive programs)
Historical Trust Balance vs. Required Pool Balance ($B)U.S. Floorplan Securitization
68
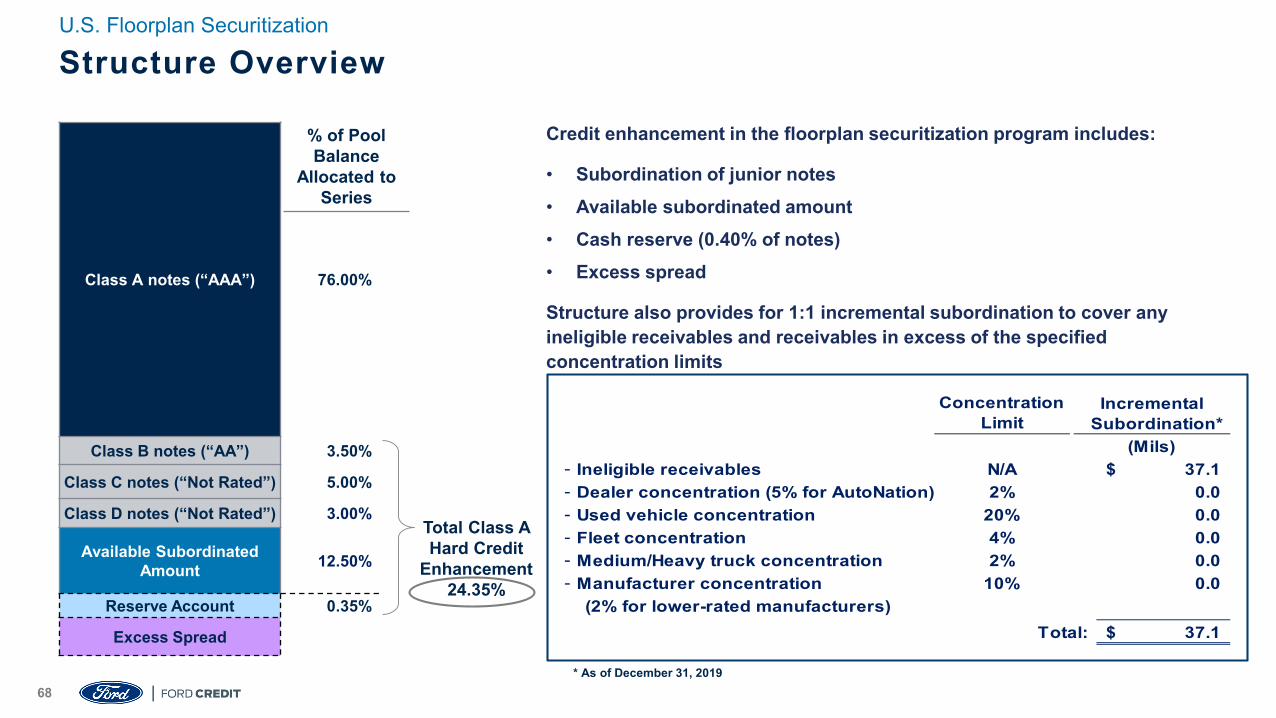
Class B Notes ("AA")Class C Notes (“Not Rated")
Class D Notes (“Not Rated")
Available Subordinated Amount
Credit enhancement in the floorplan securitization program includes:
• Subordination of junior notes• Available subordinated amount• Cash reserve (0.40% of notes)• Excess spread
Structure also provides for 1:1 incremental subordination to cover any ineligible receivables and receivables in excess of the specified concentration limits
* As of December 31, 2019
Concentration Limit
- Ineligible receivables N/A 37.1$ - Dealer concentration (5% for AutoNation) 2% 0.0- Used vehicle concentration 20% 0.0- Fleet concentration 4% 0.0- Medium/Heavy truck concentration 2% 0.0- Manufacturer concentration 10% 0.0
(2% for lower-rated manufacturers)Total: 37.1$
(Mils)
Incremental Subordination*
Structure OverviewU.S. Floorplan Securitization
Total Class A Hard Credit
Enhancement24.35%
% of Pool Balance
Allocated to Series
Class A notes (“AAA”) 76.00%*
Class B notes (“AA”) 3.50%*
Class C notes (“Not Rated”) 5.00%*
Class D notes (“Not Rated”) 3.00%*
Available Subordinated Amount 12.50%*
Reserve Account 0.35%*
Excess Spread
SECRET69
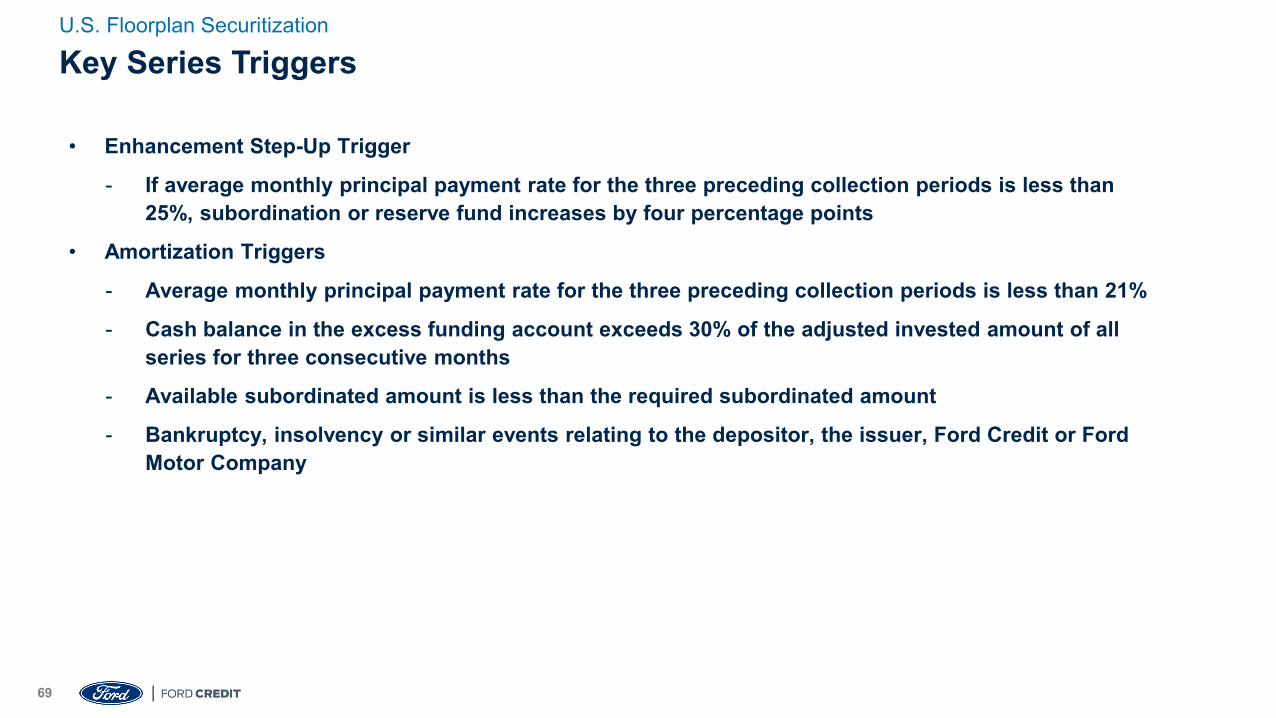
• Enhancement Step-Up Trigger
- If average monthly principal payment rate for the three preceding collection periods is less than 25%, subordination or reserve fund increases by four percentage points
• Amortization Triggers
- Average monthly principal payment rate for the three preceding collection periods is less than 21%
- Cash balance in the excess funding account exceeds 30% of the adjusted invested amount of all series for three consecutive months
- Available subordinated amount is less than the required subordinated amount
- Bankruptcy, insolvency or similar events relating to the depositor, the issuer, Ford Credit or Ford Motor Company
Key Series Triggers U.S. Floorplan Securitization
SECRET70
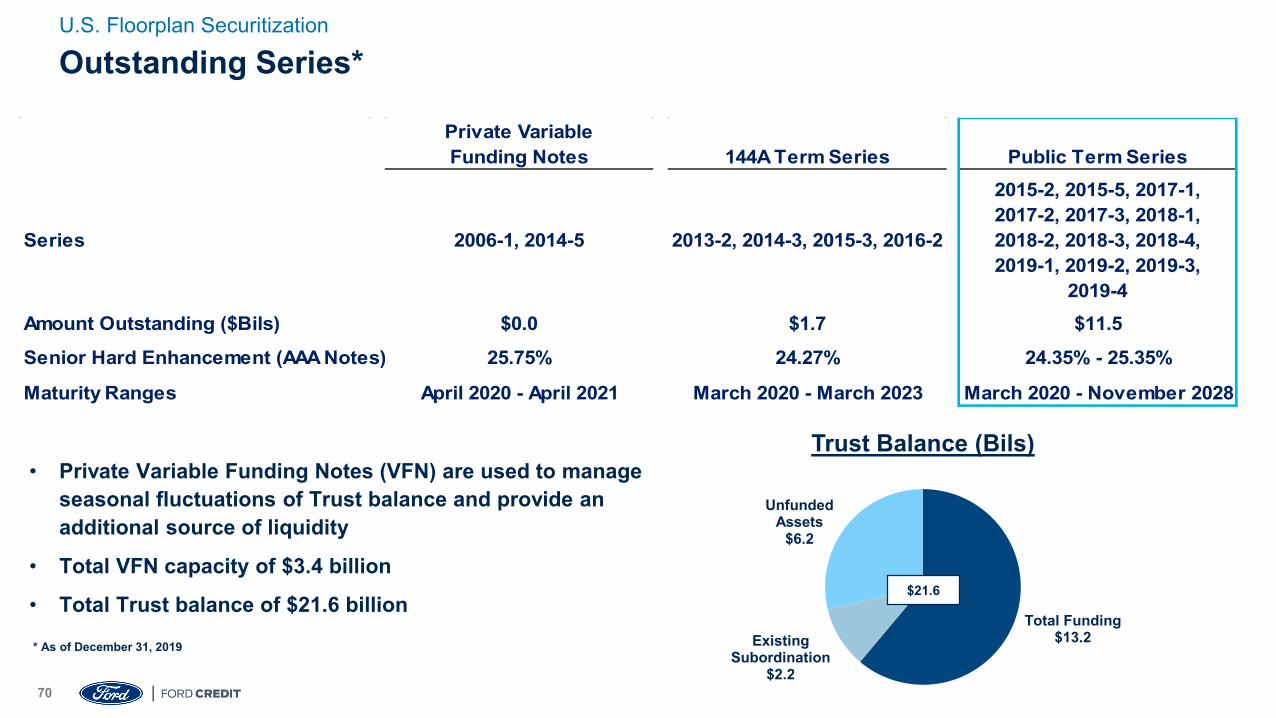
Total Funding$13.2 Existing
Subordination$2.2
Unfunded Assets
$6.2
Trust Balance (Bils)• Private Variable Funding Notes (VFN) are used to manage
seasonal fluctuations of Trust balance and provide an additional source of liquidity
• Total VFN capacity of $3.4 billion
• Total Trust balance of $21.6 billion
* As of December 31, 2019
Private Variable Funding Notes 144A Term Series Public Term Series
Series 2006-1, 2014-5 2013-2, 2014-3, 2015-3, 2016-2
2015-2, 2015-5, 2017-1, 2017-2, 2017-3, 2018-1, 2018-2, 2018-3, 2018-4, 2019-1, 2019-2, 2019-3,
2019-4Amount Outstanding ($Bils) $0.0 $1.7 $11.5
Senior Hard Enhancement (AAA Notes) 25.75% 24.27% 24.35% - 25.35%
Maturity Ranges April 2020 - April 2021 March 2020 - March 2023 March 2020 - November 2028
$21.6
Outstanding Series*U.S. Floorplan Securitization

All-Electric Mustang Mach-E
U.S. Floorplan Risk Management
SECRET72
• A dealership seeking to finance its vehicle inventory with Ford Credit must submit a request for financing along with its financial and other information
• Ford Credit performs a thorough review of the dealer or dealer group including:- Business, legal and operations structure, including number of manufacturer franchises- Credit information- Financial statements or tax returns- Types of vehicles in the dealer’s inventory and specialty services provided by the dealer for certain
vehicles or customers, such as fleet• Ford Credit evaluates the dealer’s financial resources and the amount and types of financing requested• The financing extended to a dealer is tailored to suit the business and operational needs of the dealer and
depends on the financial strength and nature of the dealer’s business• The financed vehicles are the primary collateral for dealer floorplan loans; however, for many dealers, Ford
Credit also obtains personal guarantees and secondary collateral in the form of additional dealer assets, including dealer-adjusted net worth and real estate equity
• Due to the ongoing nature of floorplan financing arrangements, Ford Credit periodically performs a credit review of each dealer, at least annually, following the similar process utilized to evaluate new dealer account originations
Underwriting and Credit Review ProcessU.S. Floorplan Risk Management
SECRET73
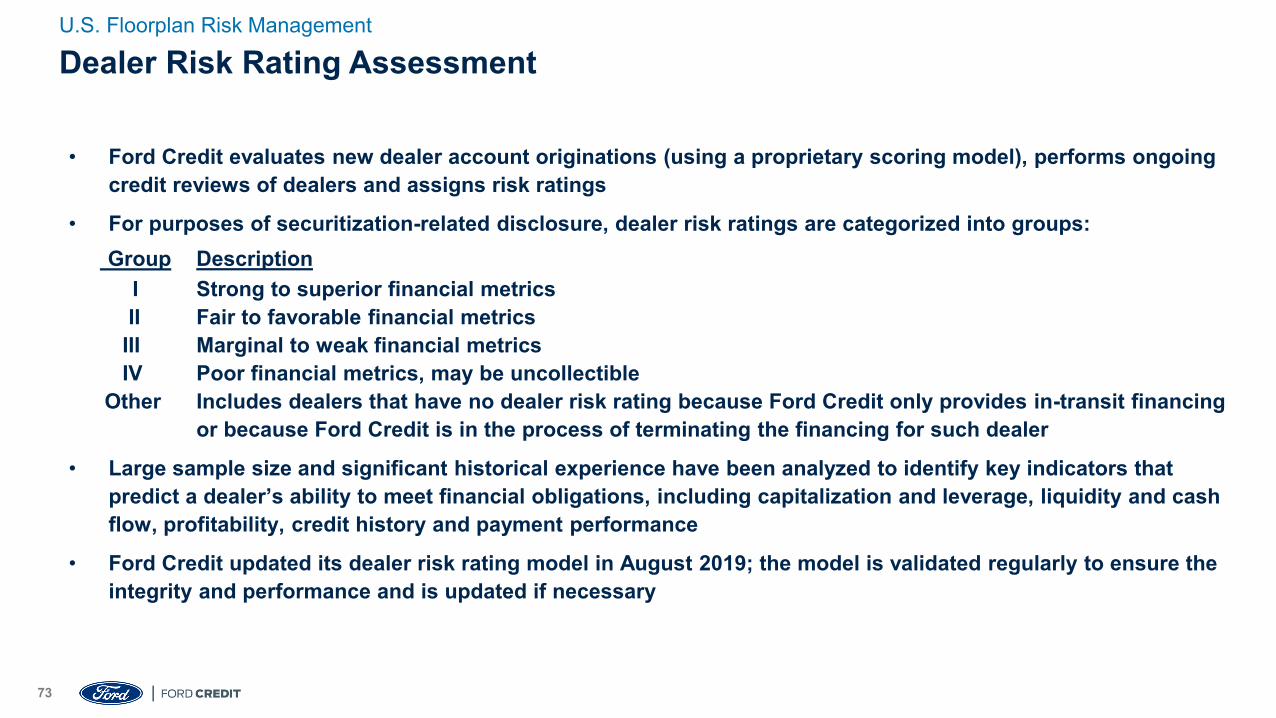
• Ford Credit evaluates new dealer account originations (using a proprietary scoring model), performs ongoing credit reviews of dealers and assigns risk ratings
• For purposes of securitization-related disclosure, dealer risk ratings are categorized into groups:Group Description
I Strong to superior financial metricsII Fair to favorable financial metrics
III Marginal to weak financial metricsIV Poor financial metrics, may be uncollectible
Other Includes dealers that have no dealer risk rating because Ford Credit only provides in-transit financing or because Ford Credit is in the process of terminating the financing for such dealer
• Large sample size and significant historical experience have been analyzed to identify key indicators that predict a dealer’s ability to meet financial obligations, including capitalization and leverage, liquidity and cash flow, profitability, credit history and payment performance
• Ford Credit updated its dealer risk rating model in August 2019; the model is validated regularly to ensure the integrity and performance and is updated if necessary
Dealer Risk Rating AssessmentU.S. Floorplan Risk Management
74
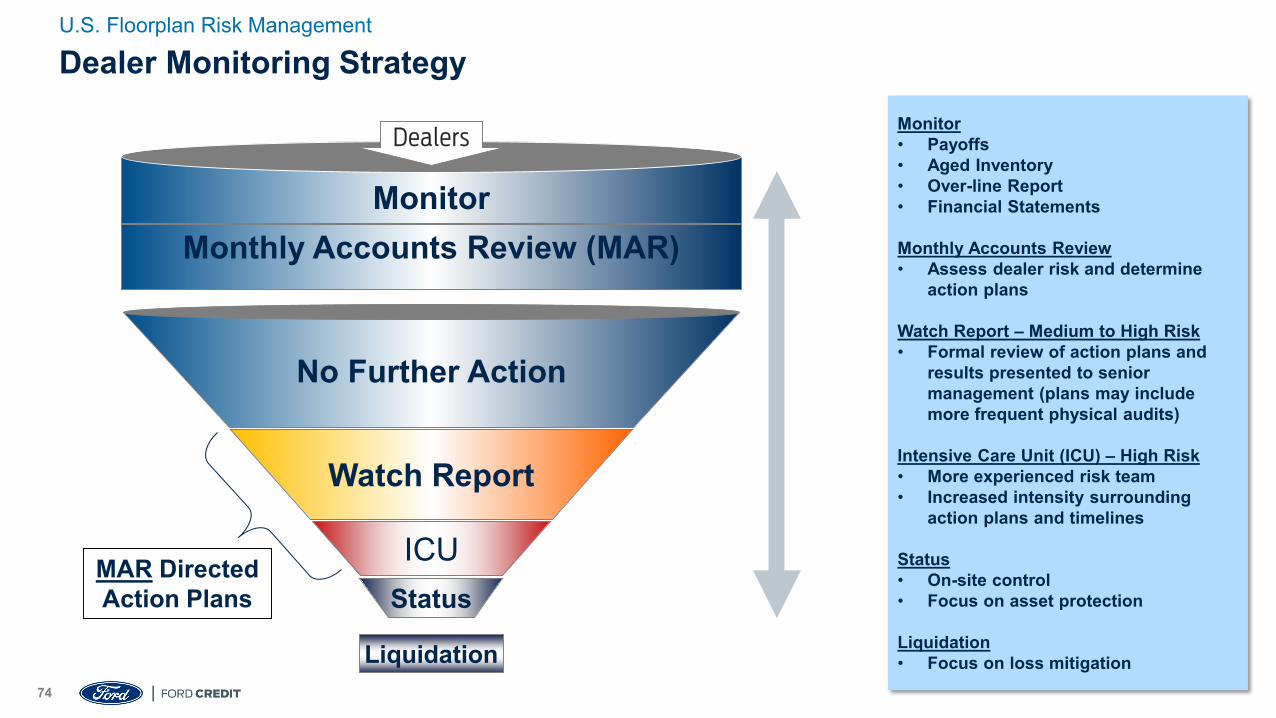
Monitor
Dealers
Watch Report
MAR Directed Action Plans
No Further Action
Monthly Accounts Review (MAR)
ICUStatus
Liquidation
Dealer Monitoring StrategyU.S. Floorplan Risk Management
Monitor• Payoffs• Aged Inventory• Over-line Report• Financial Statements
Monthly Accounts Review• Assess dealer risk and determine
action plans
Watch Report – Medium to High Risk• Formal review of action plans and
results presented to senior management (plans may include more frequent physical audits)
Intensive Care Unit (ICU) – High Risk• More experienced risk team• Increased intensity surrounding
action plans and timelines
Status• On-site control• Focus on asset protection
Liquidation• Focus on loss mitigation
SECRET75
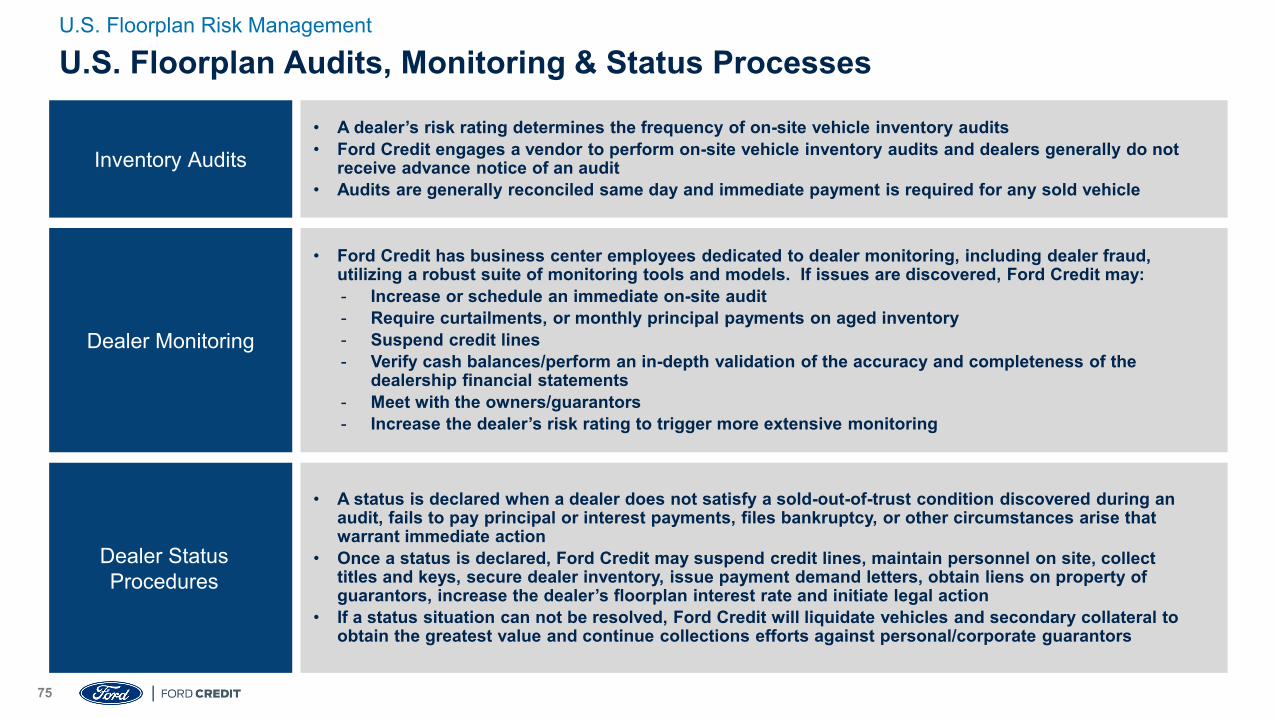
Inventory Audits• A dealer’s risk rating determines the frequency of on-site vehicle inventory audits• Ford Credit engages a vendor to perform on-site vehicle inventory audits and dealers generally do not
receive advance notice of an audit• Audits are generally reconciled same day and immediate payment is required for any sold vehicle
Dealer Monitoring
• Ford Credit has business center employees dedicated to dealer monitoring, including dealer fraud, utilizing a robust suite of monitoring tools and models. If issues are discovered, Ford Credit may:- Increase or schedule an immediate on-site audit- Require curtailments, or monthly principal payments on aged inventory- Suspend credit lines- Verify cash balances/perform an in-depth validation of the accuracy and completeness of the
dealership financial statements- Meet with the owners/guarantors- Increase the dealer’s risk rating to trigger more extensive monitoring
Dealer Status Procedures
• A status is declared when a dealer does not satisfy a sold-out-of-trust condition discovered during an audit, fails to pay principal or interest payments, files bankruptcy, or other circumstances arise that warrant immediate action
• Once a status is declared, Ford Credit may suspend credit lines, maintain personnel on site, collect titles and keys, secure dealer inventory, issue payment demand letters, obtain liens on property of guarantors, increase the dealer’s floorplan interest rate and initiate legal action
• If a status situation can not be resolved, Ford Credit will liquidate vehicles and secondary collateral to obtain the greatest value and continue collections efforts against personal/corporate guarantors
U.S. Floorplan Audits, Monitoring & Status ProcessesU.S. Floorplan Risk Management
76
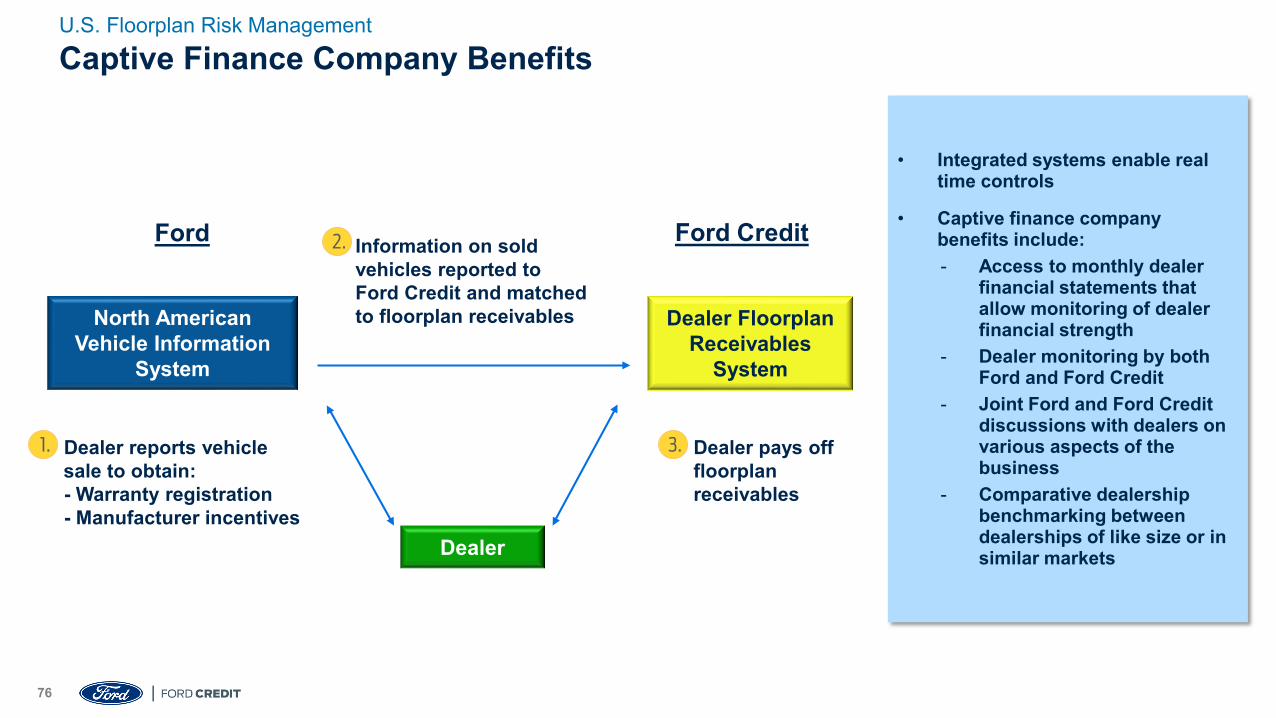
Captive Finance Company BenefitsU.S. Floorplan Risk Management
• Integrated systems enable real time controls
• Captive finance company benefits include:- Access to monthly dealer
financial statements that allow monitoring of dealer financial strength
- Dealer monitoring by both Ford and Ford Credit
- Joint Ford and Ford Credit discussions with dealers on various aspects of the business
- Comparative dealership benchmarking between dealerships of like size or in similar markets
1.
Dealer Floorplan Receivables
System
North American Vehicle Information
System
Ford CreditFord
Dealer
Information on sold vehicles reported to Ford Credit and matched to floorplan receivables
Dealer pays off floorplan receivables
Dealer reports vehicle sale to obtain:- Warranty registration- Manufacturer incentives
2.
3.

All-Electric Mustang Mach-E
Appendix
78
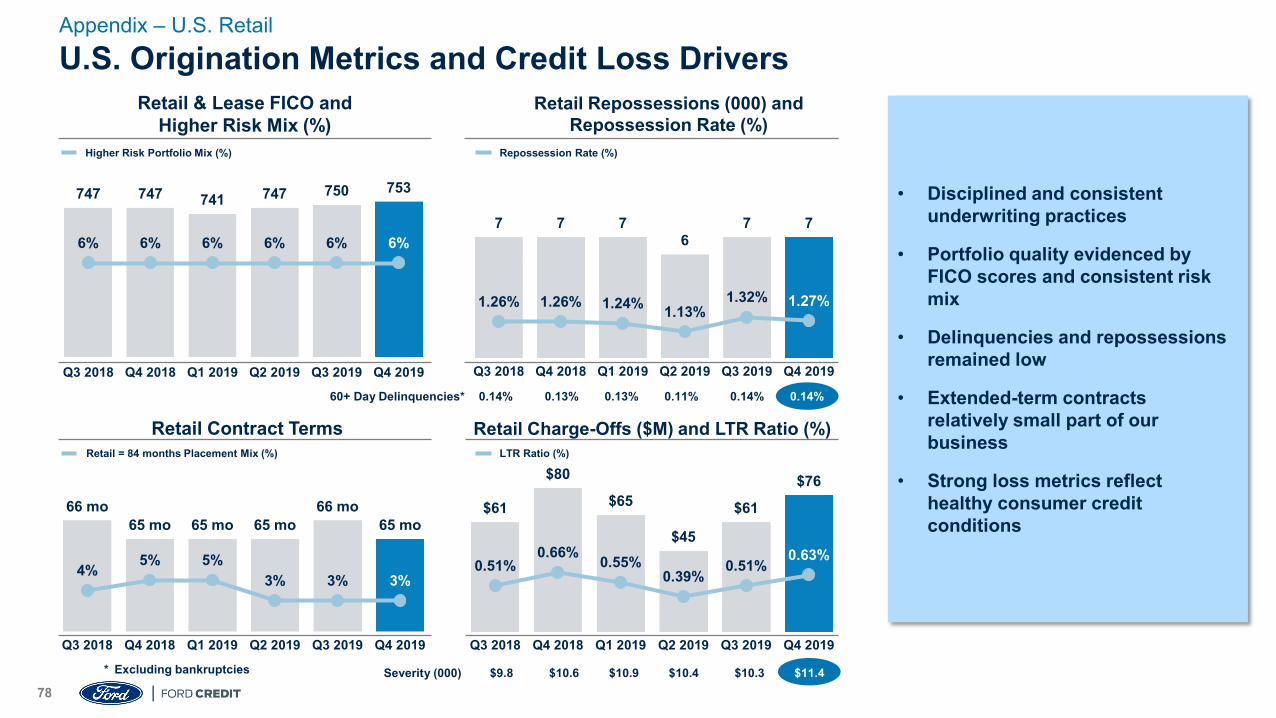
* Excluding bankruptcies Severity (000) $9.8 $10.6 $10.9 $10.4 $10.3 $11.4
U.S. Origination Metrics and Credit Loss Drivers
66 mo65 mo 65 mo 65 mo
66 mo65 mo
4% 5% 5%3% 3% 3%
Q3 2018 Q4 2018 Q1 2019 Q2 2019 Q3 2019 Q4 2019
747 747 741 747 750 753
6% 6% 6% 6% 6% 6%
Q3 2018 Q4 2018 Q1 2019 Q2 2019 Q3 2019 Q4 2019
Retail & Lease FICO andHigher Risk Mix (%)
Retail Contract Terms
$61
$80
$65
$45
$61
$76
0.51%0.66% 0.55%
0.39%0.51%
0.63%
Q3 2018 Q4 2018 Q1 2019 Q2 2019 Q3 2019 Q4 2019
Retail Charge-Offs ($M) and LTR Ratio (%)
7 7 76
7 7
1.26% 1.26% 1.24% 1.13%1.32% 1.27%
Q3 2018 Q4 2018 Q1 2019 Q2 2019 Q3 2019 Q4 2019
Retail Repossessions (000) andRepossession Rate (%)
60+ Day Delinquencies* 0.14% 0.13% 0.13% 0.11% 0.14% 0.14%
Higher Risk Portfolio Mix (%) Repossession Rate (%)
Retail = 84 months Placement Mix (%) LTR Ratio (%)
Appendix – U.S. Retail
• Disciplined and consistent underwriting practices
• Portfolio quality evidenced by FICO scores and consistent risk mix
• Delinquencies and repossessions remained low
• Extended-term contracts relatively small part of our business
• Strong loss metrics reflect healthy consumer credit conditions
79
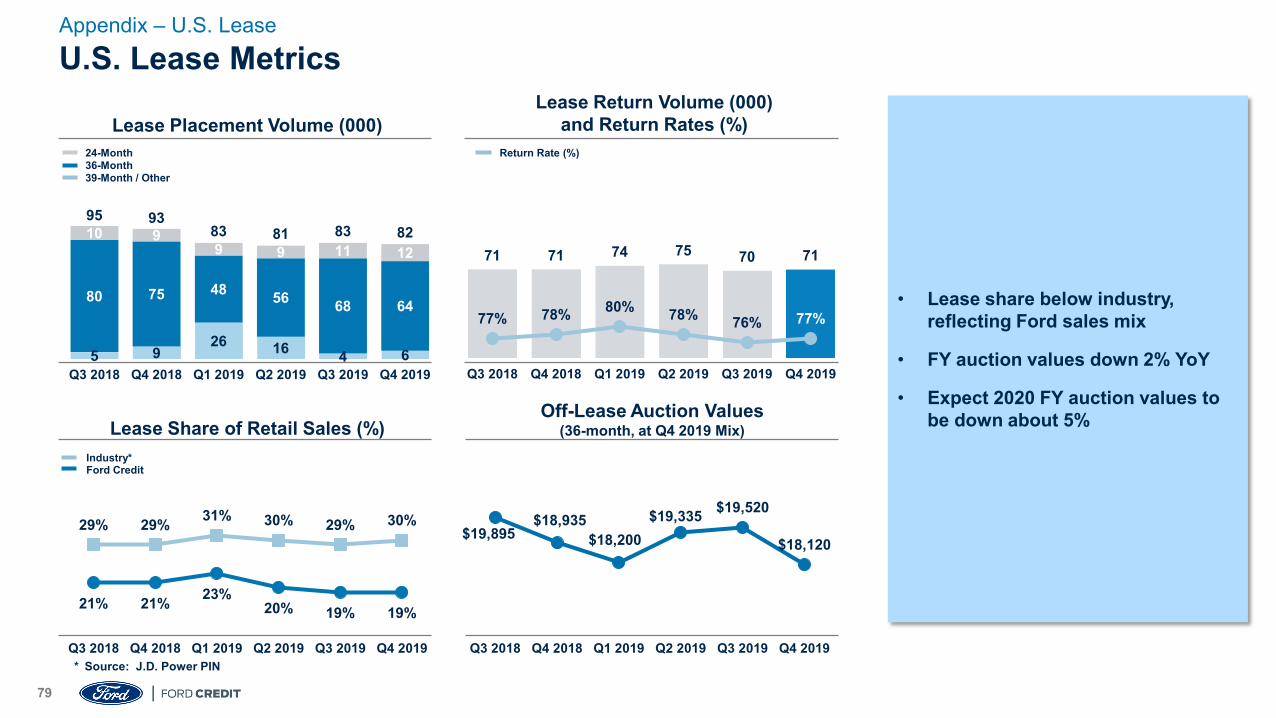
* Source: J.D. Power PIN
U.S. Lease Metrics
Lease Placement Volume (000)
Lease Share of Retail Sales (%)Off-Lease Auction Values
(36-month, at Q4 2019 Mix)
Lease Return Volume (000) and Return Rates (%)
Return Rate (%)
29% 29% 31% 30% 29% 30%
21% 21% 23%20% 19% 19%
Q3 2018 Q4 2018 Q1 2019 Q2 2019 Q3 2019 Q4 2019
5 926 16 4 6
80 75 48 56 68 64
10 99 9 11 12
95 9383 81 83 82
Q3 2018 Q4 2018 Q1 2019 Q2 2019 Q3 2019 Q4 2019
24-Month36-Month39-Month / Other
Industry*Ford Credit
$19,895$18,935
$18,200$19,335 $19,520
$18,120
Q3 2018 Q4 2018 Q1 2019 Q2 2019 Q3 2019 Q4 2019
71 71 74 75 70 71
77% 78% 80% 78% 76% 77%
Q3 2018 Q4 2018 Q1 2019 Q2 2019 Q3 2019 Q4 2019
Appendix – U.S. Lease
• Lease share below industry, reflecting Ford sales mix
• FY auction values down 2% YoY
• Expect 2020 FY auction values to be down about 5%
SECRET80
Ford CreditPortfolio
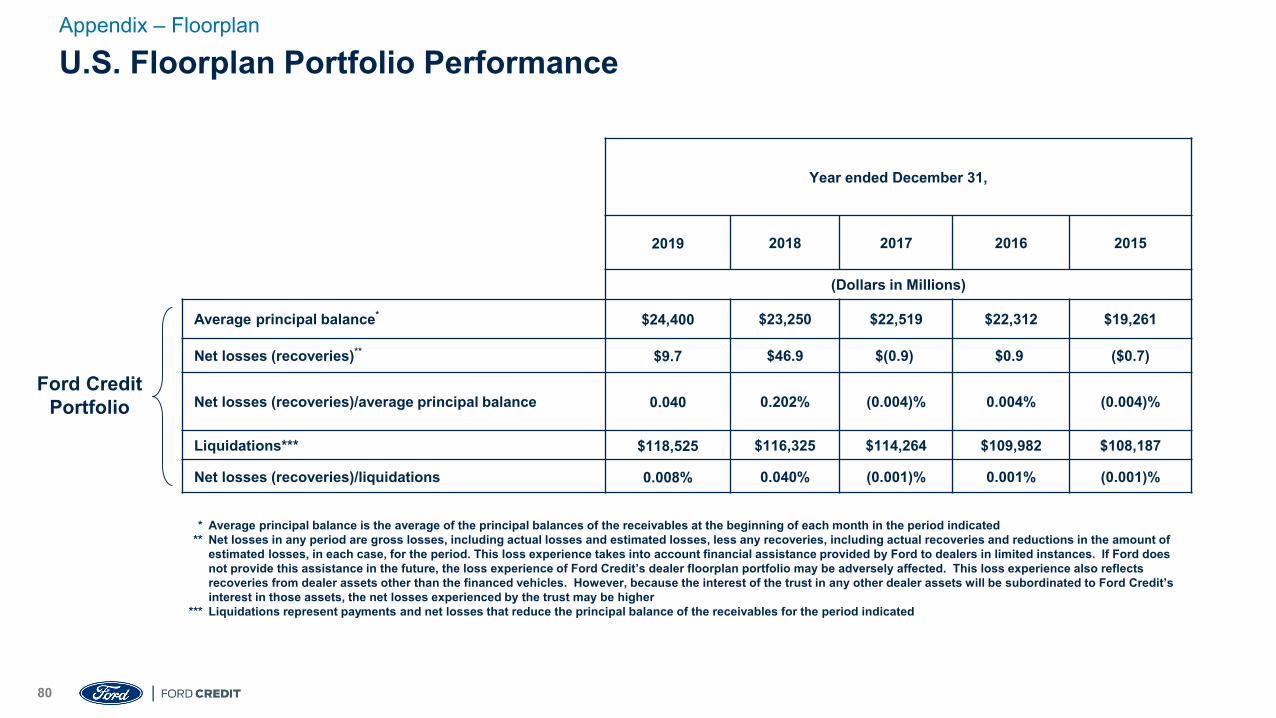
U.S. Floorplan Portfolio PerformanceAppendix – Floorplan
* Average principal balance is the average of the principal balances of the receivables at the beginning of each month in the period indicated** Net losses in any period are gross losses, including actual losses and estimated losses, less any recoveries, including actual recoveries and reductions in the amount of
estimated losses, in each case, for the period. This loss experience takes into account financial assistance provided by Ford to dealers in limited instances. If Ford does not provide this assistance in the future, the loss experience of Ford Credit’s dealer floorplan portfolio may be adversely affected. This loss experience also reflects recoveries from dealer assets other than the financed vehicles. However, because the interest of the trust in any other dealer assets will be subordinated to Ford Credit’s interest in those assets, the net losses experienced by the trust may be higher
*** Liquidations represent payments and net losses that reduce the principal balance of the receivables for the period indicated
Year ended December 31,
2019 2018 2017 2016 2015
(Dollars in Millions)
Average principal balance* $24,400 $23,250 $22,519 $22,312 $19,261
Net losses (recoveries)** $9.7 $46.9 $(0.9) $0.9 ($0.7)
Net losses (recoveries)/average principal balance 0.040 0.202% (0.004)% 0.004% (0.004)%
Liquidations*** $118,525 $116,325 $114,264 $109,982 $108,187
Net losses (recoveries)/liquidations 0.008% 0.040% (0.001)% 0.001% (0.001)%
SECRET81
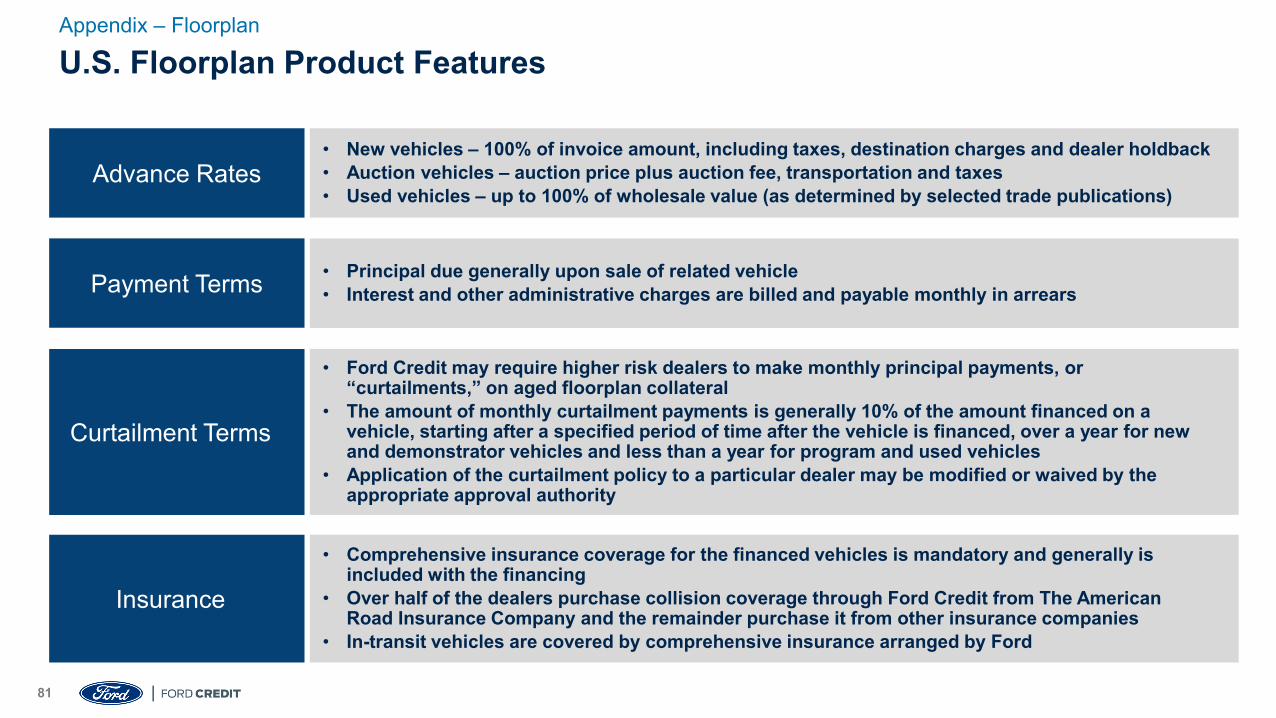
Advance Rates• New vehicles – 100% of invoice amount, including taxes, destination charges and dealer holdback• Auction vehicles – auction price plus auction fee, transportation and taxes• Used vehicles – up to 100% of wholesale value (as determined by selected trade publications)
Payment Terms • Principal due generally upon sale of related vehicle• Interest and other administrative charges are billed and payable monthly in arrears
Curtailment Terms
• Ford Credit may require higher risk dealers to make monthly principal payments, or “curtailments,” on aged floorplan collateral
• The amount of monthly curtailment payments is generally 10% of the amount financed on a vehicle, starting after a specified period of time after the vehicle is financed, over a year for new and demonstrator vehicles and less than a year for program and used vehicles
• Application of the curtailment policy to a particular dealer may be modified or waived by the appropriate approval authority
Insurance
• Comprehensive insurance coverage for the financed vehicles is mandatory and generally is included with the financing
• Over half of the dealers purchase collision coverage through Ford Credit from The American Road Insurance Company and the remainder purchase it from other insurance companies
• In-transit vehicles are covered by comprehensive insurance arranged by Ford
U.S. Floorplan Product FeaturesAppendix – Floorplan
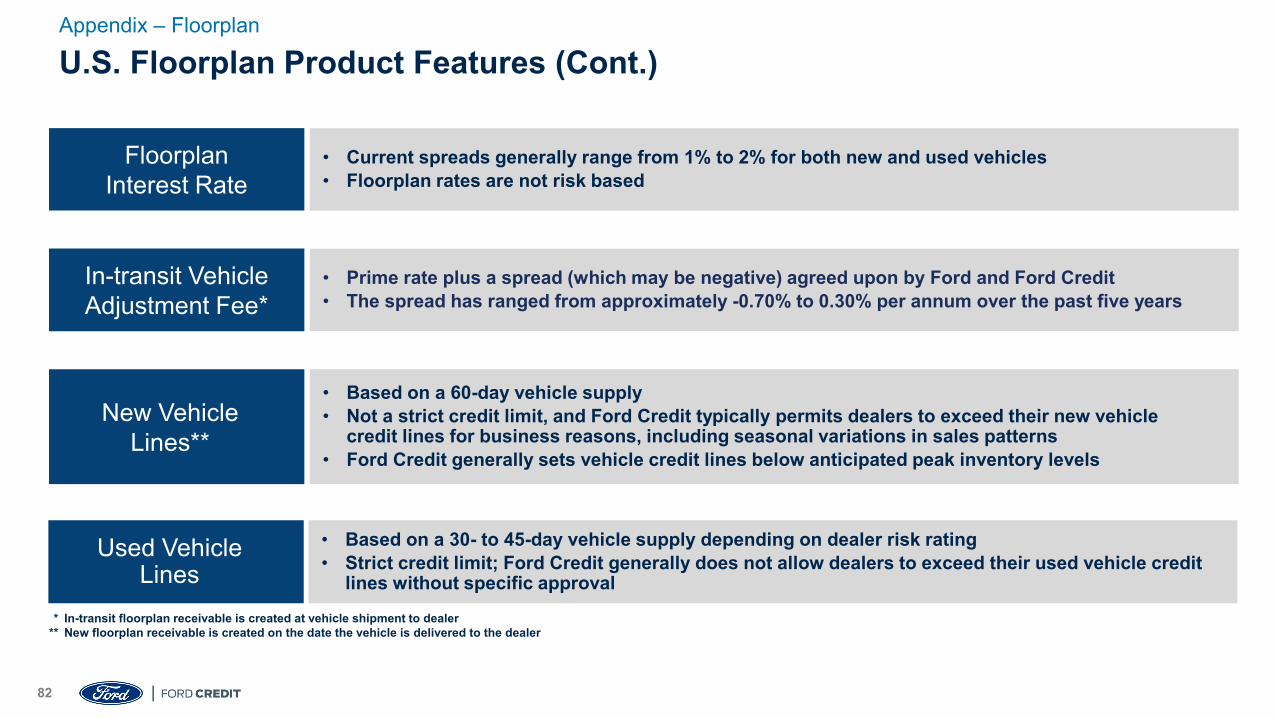
SECRET82
Floorplan Interest Rate
• Current spreads generally range from 1% to 2% for both new and used vehicles• Floorplan rates are not risk based
In-transit Vehicle Adjustment Fee*
• Prime rate plus a spread (which may be negative) agreed upon by Ford and Ford Credit• The spread has ranged from approximately -0.70% to 0.30% per annum over the past five years
New Vehicle Lines**
• Based on a 60-day vehicle supply• Not a strict credit limit, and Ford Credit typically permits dealers to exceed their new vehicle
credit lines for business reasons, including seasonal variations in sales patterns• Ford Credit generally sets vehicle credit lines below anticipated peak inventory levels
Used Vehicle Lines
• Based on a 30- to 45-day vehicle supply depending on dealer risk rating• Strict credit limit; Ford Credit generally does not allow dealers to exceed their used vehicle credit
lines without specific approval* In-transit floorplan receivable is created at vehicle shipment to dealer
** New floorplan receivable is created on the date the vehicle is delivered to the dealer
U.S. Floorplan Product Features (Cont.)Appendix – Floorplan
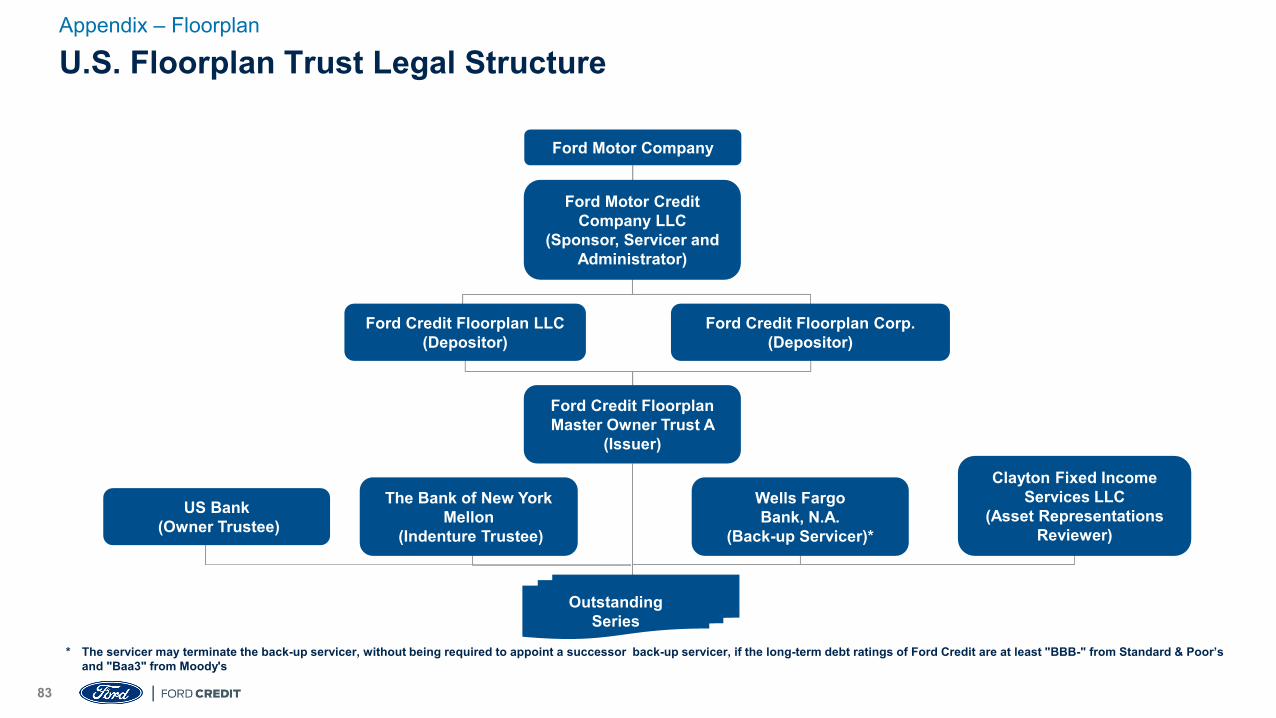
83
Ford Motor Company
* The servicer may terminate the back-up servicer, without being required to appoint a successor back-up servicer, if the long-term debt ratings of Ford Credit are at least "BBB-" from Standard & Poor’s and "Baa3" from Moody's
Ford Credit Floorplan Corp.(Depositor)
Ford Credit Floorplan LLC(Depositor)
Ford Credit Floorplan Master Owner Trust A
(Issuer)
Clayton Fixed Income Services LLC
(Asset Representations Reviewer)
Ford Motor Credit Company LLC
(Sponsor, Servicer and Administrator)
OutstandingSeries
US Bank(Owner Trustee)
The Bank of New York Mellon
(Indenture Trustee)
Wells FargoBank, N.A.
(Back-up Servicer)*
U.S. Floorplan Trust Legal StructureAppendix – Floorplan
84
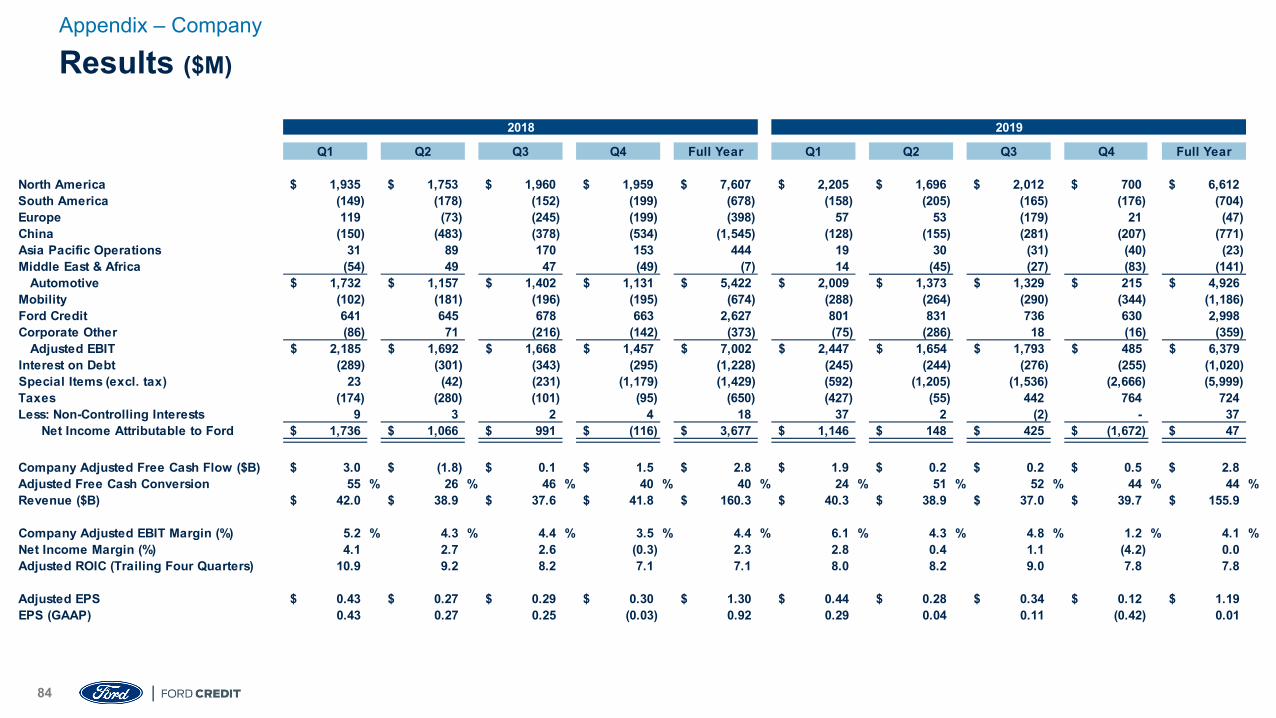
Results ($M)Appendix – Company
2018 2019
Q1 Q2 Q3 Q4 Full Year Q1 Q2 Q3 Q4 Full Year
North America 1,935$ 1,753$ 1,960$ 1,959$ 7,607$ 2,205$ 1,696$ 2,012$ 700$ 6,612$ South America (149) (178) (152) (199) (678) (158) (205) (165) (176) (704) Europe 119 (73) (245) (199) (398) 57 53 (179) 21 (47) China (150) (483) (378) (534) (1,545) (128) (155) (281) (207) (771) Asia Pacific Operations 31 89 170 153 444 19 30 (31) (40) (23) Middle East & Africa (54) 49 47 (49) (7) 14 (45) (27) (83) (141)
Automotive 1,732$ 1,157$ 1,402$ 1,131$ 5,422$ 2,009$ 1,373$ 1,329$ 215$ 4,926$ Mobility (102) (181) (196) (195) (674) (288) (264) (290) (344) (1,186) Ford Credit 641 645 678 663 2,627 801 831 736 630 2,998 Corporate Other (86) 71 (216) (142) (373) (75) (286) 18 (16) (359)
Adjusted EBIT 2,185$ 1,692$ 1,668$ 1,457$ 7,002$ 2,447$ 1,654$ 1,793$ 485$ 6,379$ Interest on Debt (289) (301) (343) (295) (1,228) (245) (244) (276) (255) (1,020) Special Items (excl. tax) 23 (42) (231) (1,179) (1,429) (592) (1,205) (1,536) (2,666) (5,999) Taxes (174) (280) (101) (95) (650) (427) (55) 442 764 724 Less: Non-Controlling Interests 9 3 2 4 18 37 2 (2) - 37
Net Income Attributable to Ford 1,736$ 1,066$ 991$ (116)$ 3,677$ 1,146$ 148$ 425$ (1,672)$ 47$
Company Adjusted Free Cash Flow ($B) 3.0$ (1.8)$ 0.1$ 1.5$ 2.8$ 1.9$ 0.2$ 0.2$ 0.5$ 2.8$ Adjusted Free Cash Conversion 55 % 26 % 46 % 40 % 40 % 24 % 51 % 52 % 44 % 44 %Revenue ($B) 42.0$ 38.9$ 37.6$ 41.8$ 160.3$ 40.3$ 38.9$ 37.0$ 39.7$ 155.9$
Company Adjusted EBIT Margin (%) 5.2 % 4.3 % 4.4 % 3.5 % 4.4 % 6.1 % 4.3 % 4.8 % 1.2 % 4.1 %Net Income Margin (%) 4.1 2.7 2.6 (0.3) 2.3 2.8 0.4 1.1 (4.2) 0.0 Adjusted ROIC (Trailing Four Quarters) 10.9 9.2 8.2 7.1 7.1 8.0 8.2 9.0 7.8 7.8
Adjusted EPS 0.43$ 0.27$ 0.29$ 0.30$ 1.30$ 0.44$ 0.28$ 0.34$ 0.12$ 1.19$ EPS (GAAP) 0.43 0.27 0.25 (0.03) 0.92 0.29 0.04 0.11 (0.42) 0.01
85
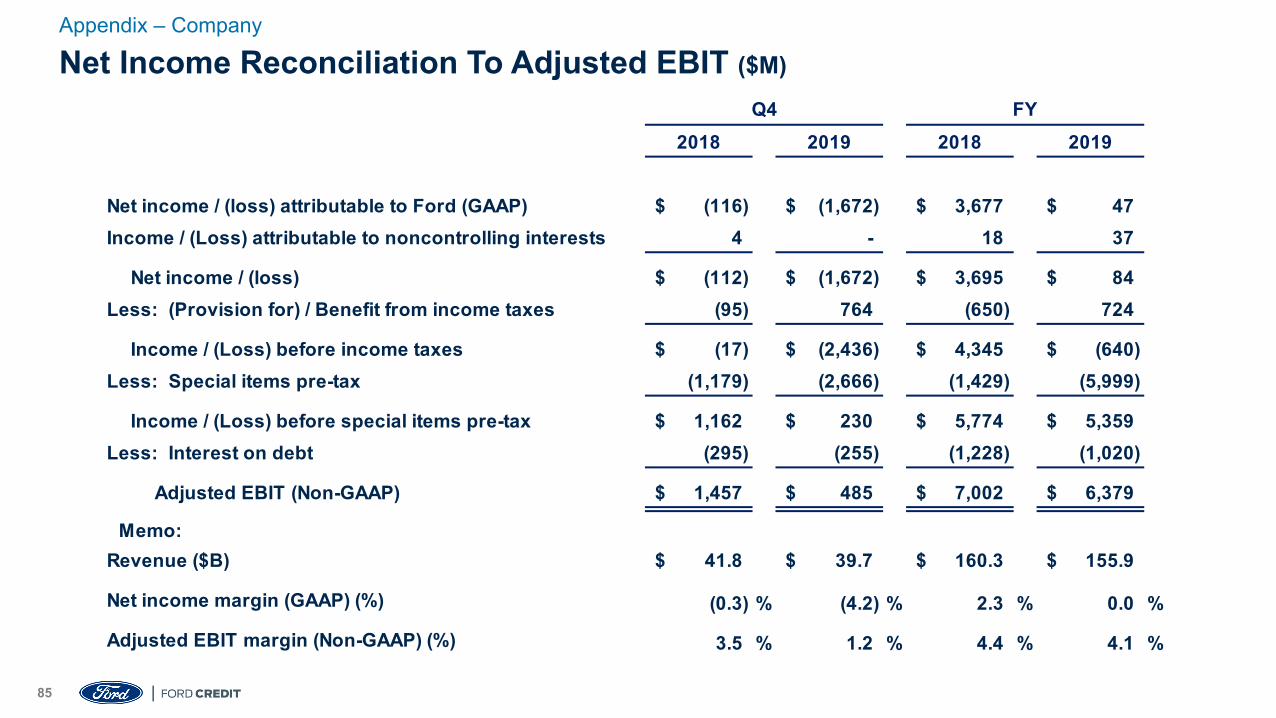
Net Income Reconciliation To Adjusted EBIT ($M)Appendix – Company
2018 2019 2018 2019
Net income / (loss) attributable to Ford (GAAP) (116)$ (1,672)$ 3,677$ 47$ Income / (Loss) attributable to noncontrolling interests 4 - 18 37
Net income / (loss) (112)$ (1,672)$ 3,695$ 84$ Less: (Provision for) / Benefit from income taxes (95) 764 (650) 724
Income / (Loss) before income taxes (17)$ (2,436)$ 4,345$ (640)$ Less: Special items pre-tax (1,179) (2,666) (1,429) (5,999)
Income / (Loss) before special items pre-tax 1,162$ 230$ 5,774$ 5,359$ Less: Interest on debt (295) (255) (1,228) (1,020)
Adjusted EBIT (Non-GAAP) 1,457$ 485$ 7,002$ 6,379$
Memo:Revenue ($B) 41.8$ 39.7$ 160.3$ 155.9$
Net income margin (GAAP) (%) (0.3) % (4.2) % 2.3 % 0.0 %
Adjusted EBIT margin (Non-GAAP) (%) 3.5 % 1.2 % 4.4 % 4.1 %
Q4 FY
86A1086
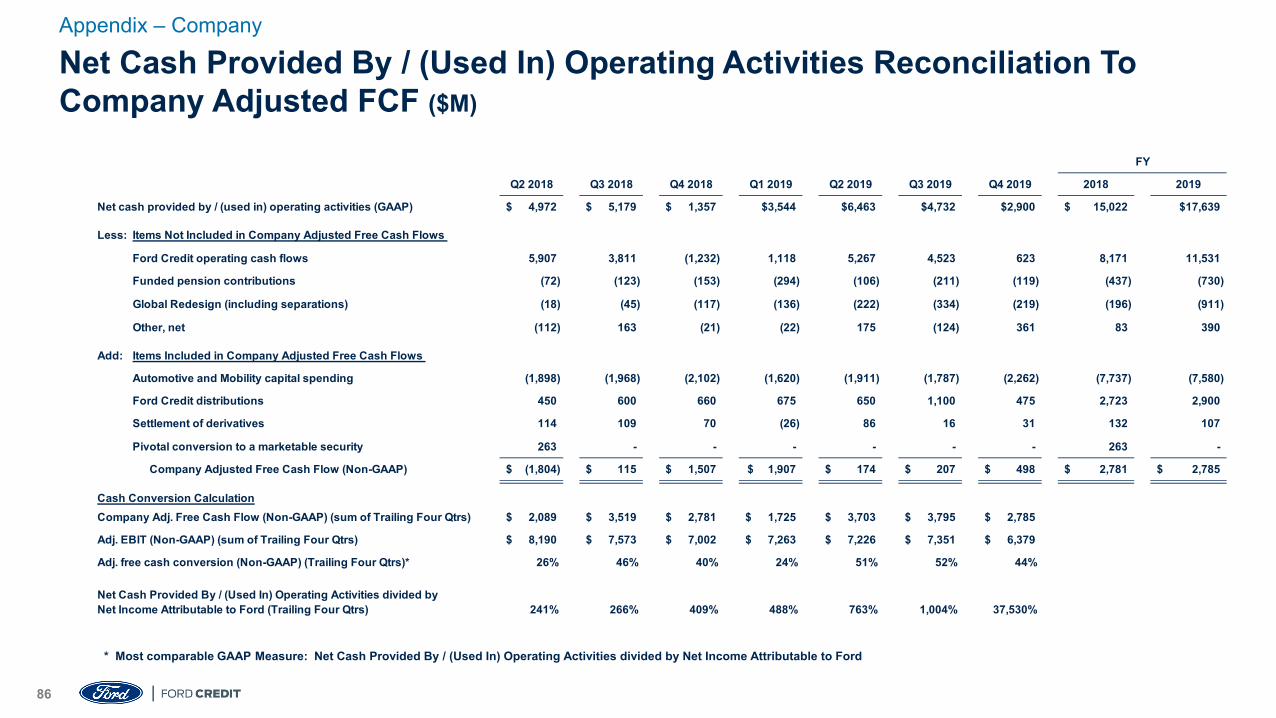
Net Cash Provided By / (Used In) Operating Activities Reconciliation To Company Adjusted FCF ($M)
Appendix – Company
Q2 2018 Q3 2018 Q4 2018 Q1 2019 Q2 2019 Q3 2019 Q4 2019 2018 2019
Net cash provided by / (used in) operating activities (GAAP) 4,972$ 5,179$ 1,357$ $3,544 $6,463 $4,732 $2,900 15,022$ $17,639
Less: Items Not Included in Company Adjusted Free Cash Flows
Ford Credit operating cash flows 5,907 3,811 (1,232) 1,118 5,267 4,523 623 8,171 11,531
Funded pension contributions (72) (123) (153) (294) (106) (211) (119) (437) (730)
Global Redesign (including separations) (18) (45) (117) (136) (222) (334) (219) (196) (911)
Other, net (112) 163 (21) (22) 175 (124) 361 83 390
Add: Items Included in Company Adjusted Free Cash Flows
Automotive and Mobility capital spending (1,898) (1,968) (2,102) (1,620) (1,911) (1,787) (2,262) (7,737) (7,580)
Ford Credit distributions 450 600 660 675 650 1,100 475 2,723 2,900
Settlement of derivatives 114 109 70 (26) 86 16 31 132 107
Pivotal conversion to a marketable security 263 - - - - - - 263 -
Company Adjusted Free Cash Flow (Non-GAAP) (1,804)$ 115$ 1,507$ 1,907$ 174$ 207$ 498$ 2,781$ 2,785$
Cash Conversion CalculationCompany Adj. Free Cash Flow (Non-GAAP) (sum of Trailing Four Qtrs) 2,089$ 3,519$ 2,781$ 1,725$ 3,703$ 3,795$ 2,785$
Adj. EBIT (Non-GAAP) (sum of Trailing Four Qtrs) 8,190$ 7,573$ 7,002$ 7,263$ 7,226$ 7,351$ 6,379$
Adj. free cash conversion (Non-GAAP) (Trailing Four Qtrs)* 26% 46% 40% 24% 51% 52% 44%
241% 266% 409% 488% 763% 1,004% 37,530%
FY
Net Cash Provided By / (Used In) Operating Activities divided byNet Income Attributable to Ford (Trailing Four Qtrs)
* Most comparable GAAP Measure: Net Cash Provided By / (Used In) Operating Activities divided by Net Income Attributable to Ford
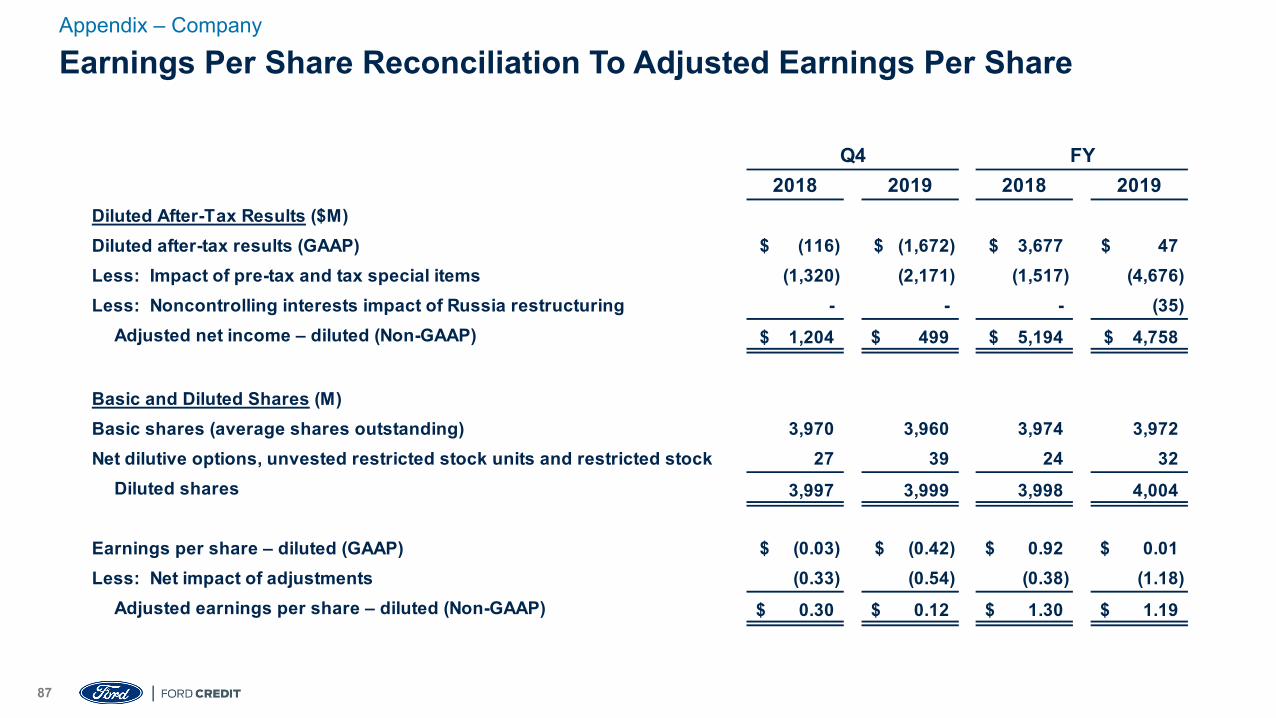
87
Earnings Per Share Reconciliation To Adjusted Earnings Per ShareAppendix – Company
2018 2019 2018 2019Diluted After-Tax Results ($M)Diluted after-tax results (GAAP) (116)$ (1,672)$ 3,677$ 47$ Less: Impact of pre-tax and tax special items (1,320) (2,171) (1,517) (4,676) Less: Noncontrolling interests impact of Russia restructuring - - - (35)
Adjusted net income – diluted (Non-GAAP) 1,204$ 499$ 5,194$ 4,758$
Basic and Diluted Shares (M)Basic shares (average shares outstanding) 3,970 3,960 3,974 3,972 Net dilutive options, unvested restricted stock units and restricted stock 27 39 24 32
Diluted shares 3,997 3,999 3,998 4,004
Earnings per share – diluted (GAAP) (0.03)$ (0.42)$ 0.92$ 0.01$ Less: Net impact of adjustments (0.33) (0.54) (0.38) (1.18)
Adjusted earnings per share – diluted (Non-GAAP) 0.30$ 0.12$ 1.30$ 1.19$
Q4 FY
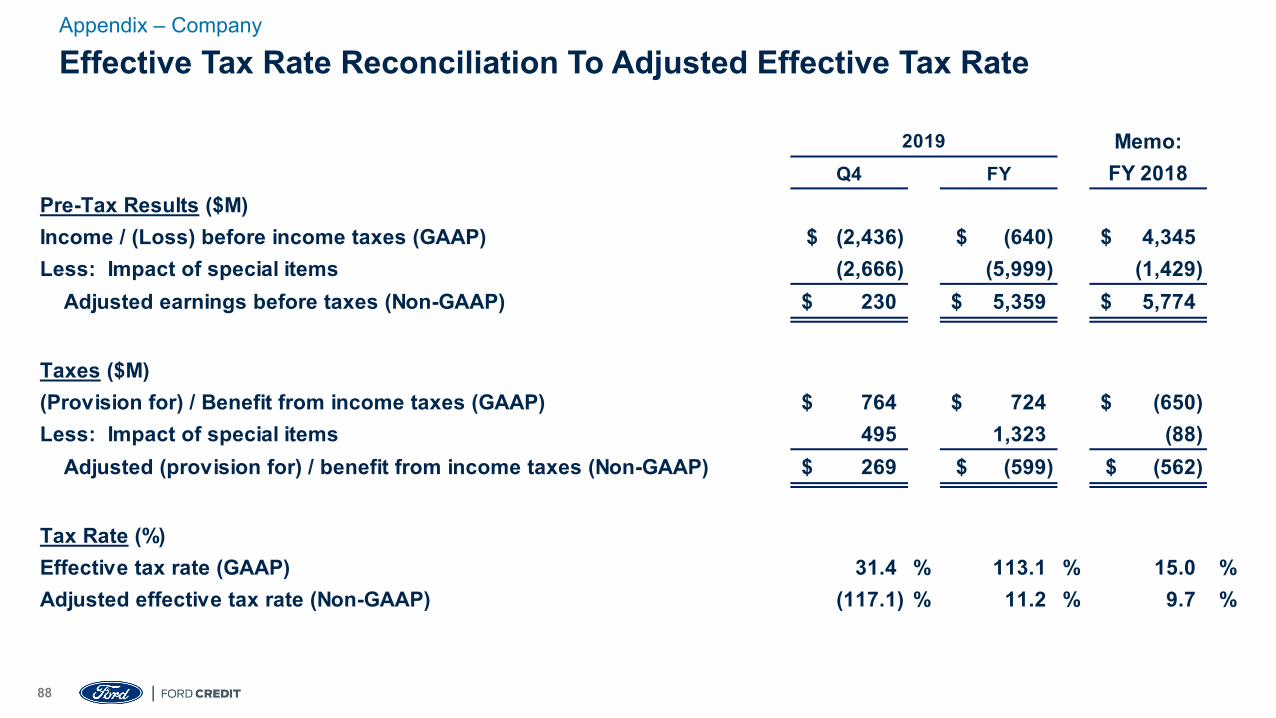
88
Effective Tax Rate Reconciliation To Adjusted Effective Tax RateAppendix – Company
Memo:Q4 FY FY 2018
Pre-Tax Results ($M)Income / (Loss) before income taxes (GAAP) (2,436)$ (640)$ 4,345$ Less: Impact of special items (2,666) (5,999) (1,429)
Adjusted earnings before taxes (Non-GAAP) 230$ 5,359$ 5,774$
Taxes ($M)(Provision for) / Benefit from income taxes (GAAP) 764$ 724$ (650)$ Less: Impact of special items 495 1,323 (88)
Adjusted (provision for) / benefit from income taxes (Non-GAAP) 269$ (599)$ (562)$
Tax Rate (%)Effective tax rate (GAAP) 31.4 % 113.1 % 15.0 %Adjusted effective tax rate (Non-GAAP) (117.1) % 11.2 % 9.7 %
2019
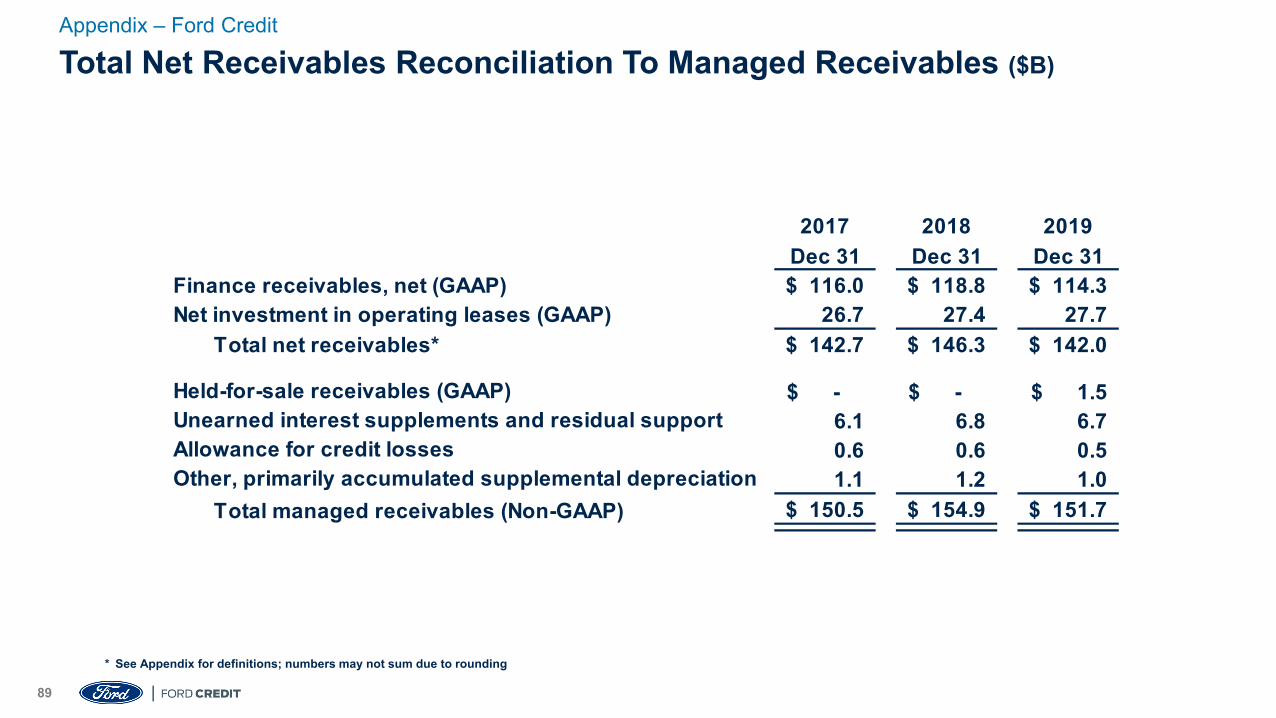
89
Total Net Receivables Reconciliation To Managed Receivables ($B)Appendix – Ford Credit
2017 2018 2019Dec 31 Dec 31 Dec 31
Finance receivables, net (GAAP) 116.0$ 118.8$ 114.3$ Net investment in operating leases (GAAP) 26.7 27.4 27.7
Total net receivables* 142.7$ 146.3$ 142.0$
Held-for-sale receivables (GAAP) -$ -$ 1.5$ Unearned interest supplements and residual support 6.1 6.8 6.7 Allowance for credit losses 0.6 0.6 0.5 Other, primarily accumulated supplemental depreciation 1.1 1.2 1.0
Total managed receivables (Non-GAAP) 150.5$ 154.9$ 151.7$
* See Appendix for definitions; numbers may not sum due to rounding
90
Non-GAAP Financial Measures That Supplement GAAP MeasuresAppendix – Company
We use both GAAP and non-GAAP financial measures for operational and financial decision making, and to assess Company and segment business performance. The non-GAAP measures listed below are intended to be considered by users as supplemental information to their equivalent GAAP measures, to aid investors in better understanding our financial results. We believe that these non-GAAP measures provide useful perspective on underlying business results and trends, and a means to assess our period-over-period results. These non-GAAP measures should not be considered as a substitute for, or superior to, measures of financial performance prepared in accordance with GAAP. These non-GAAP measures may not be the same as similarly titled measures used by other companies due to possible differences in method and in items or events being adjusted.
• Company Adjusted EBIT (Most Comparable GAAP Measure: Net income attributable to Ford) – Earnings before interest and taxes (EBIT) excludes interest on debt (excl. Ford Credit Debt), taxes and pre-tax special items. This non-GAAP measure is useful to management and investors because it allows users to evaluate our operating results aligned with industry reporting. Pre-tax special items consist of (i) pension and OPEB remeasurement gains and losses, (ii) significant personnel expenses, dealer-related costs, and facility-related charges stemming from efforts to match production capacity and cost structure to market demand and changing model mix, and (iii) other items that we do not necessarily consider to be indicative of earnings from ongoing operating activities. When we provide guidance for adjusted EBIT, we do not provide guidance on a net income basis because the GAAP measure will include potentially significant special items that have not yet occurred and are difficult to predict with reasonable certainty prior to year-end, including pension and OPEB remeasurement gains and losses.
• Company Adjusted EBIT Margin (Most Comparable GAAP Measure: Company Net Income Margin) – Company Adjusted EBIT margin is Company Adjusted EBIT divided by Company revenue. This non-GAAP measure is useful to management and investors because it allows users to evaluate our operating results aligned with industry reporting.
• Adjusted Earnings Per Share (Most Comparable GAAP Measure: Earnings Per Share) – Measure of Company’s diluted net earnings per share adjusted for impact of pre-tax special items (described above), tax special items and restructuring impacts in noncontrolling interests. The measure provides investors with useful information to evaluate performance of our business excluding items not indicative of the underlying run rate of our business. When we provide guidance for adjusted earnings per share, we do not provide guidance on an earnings per share basis because the GAAP measure will include potentially significant special items that have not yet occurred and are difficult to predict with reasonable certainty prior to year-end, including pension and OPEB remeasurement gains and losses.
• Adjusted Effective Tax Rate (Most Comparable GAAP Measure: Effective Tax Rate) – Measure of Company’s tax rate excluding pre-tax special items (described above) and tax special items. The measure provides an ongoing effective rate which investors find useful for historical comparisons and for forecasting. When we provide guidance for adjusted effective tax rate, we do not provide guidance on an effective tax rate basis because the GAAP measure will include potentially significant special items that have not yet occurred and are difficult to predict with reasonable certainty prior to year-end, including pension and OPEB remeasurement gains and losses.
91
Non-GAAP Financial Measures That Supplement GAAP Measures
• Company Adjusted Free Cash Flow (FCF) (Most Comparable GAAP Measure: Net Cash Provided By / (Used In) Operating Activities) – Measure of Company’s operating cash flow excluding Ford Credit’s operating cash flows. The measure contains elements management considers operating activities, including Automotive and Mobility capital spending, Ford Credit distributions to its parent, and settlement of derivatives. The measure excludes cash outflows for funded pension contributions, global redesign (including separations), and other items that are considered operating cash flows under GAAP. This measure is useful to management and investors because it is consistent with management’s assessment of the Company’s operating cash flow performance. When we provide guidance for Company Adjusted FCF, we do not provide guidance for net cash provided by/(used in) operating activities because the GAAP measure will include items that are difficult to quantify or predict with reasonable certainty, including cash flows related to the Company's exposures to foreign currency exchange rates and certain commodity prices (separate from any related hedges), Ford Credit's operating cash flows, and cash flows related to special items, including separation payments, each of which individually or in the aggregate could have a significant impact to our net cash provided by/(used in) our operating activities.
• Adjusted Free Cash Flow Conversion (Most Comparable GAAP Measure: Net Cash Provided By / (Used In) Operating Activities divided by Net Income Attributable to Ford) –Company Adjusted Free Cash Flow Conversion is Company Adjusted FCF divided by Company Adjusted EBIT. This non-GAAP measure is useful to management and investors because it allows users to evaluate how much of Ford's Adjusted EBIT is converted into cash flow.
• Adjusted ROIC – Calculated as the sum of adjusted net operating profit after cash tax from the last four quarters, divided by the average invested capital over the last four quarters. This calculation provides management and investors with useful information to evaluate the Company’s after-cash tax operating return on its invested capital for the period presented. Adjusted net operating profit after cash tax measures operating results less special items, interest on debt (excl. Ford Credit Debt), and certain pension/OPEB costs. Average invested capital is the sum of average balance sheet equity, debt (excl. Ford Credit Debt), and net pension/OPEB liability.
• Ford Credit Managed Receivables – (Most Comparable GAAP Measure: Net Finance Receivables plus Net Investment in Operating Leases) – Measure of Ford Credit’s Total net receivables and Held-for-sale receivables, excluding unearned interest supplements and residual support, allowance for credit losses, and other (primarily accumulated supplemental depreciation). The measure is useful to management and investors as it closely approximates the customer’s outstanding balance on the receivables, which is the basis for earning revenue.
• Ford Credit Managed Leverage (Most Comparable GAAP Measure: Financial Statement Leverage) – Ford Credit’s debt-to-equity ratio adjusted (i) to exclude cash, cash equivalents, and marketable securities (other than amounts related to insurance activities), and (ii) for derivative accounting. The measure is useful to investors because it reflects the way Ford Credit manages its business. Cash, cash equivalents, and marketable securities are deducted because they generally correspond to excess debt beyond the amount required to support operations and on-balance sheet securitization transactions. Derivative accounting adjustments are made to asset, debt, and equity positions to reflect the impact of interest rate instruments used with Ford Credit’s term-debt issuances and securitization transactions. Ford Credit generally repays its debt obligations as they mature, so the interim effects of changes in market interest rates are excluded in the calculation of managed leverage.
Appendix – Company
92
Definitions And Calculations
Automotive Records• References to Automotive records for EBIT margin and business units are since at least 2009Wholesale Units and Revenue• Wholesale unit volumes include all Ford and Lincoln badged units (whether produced by Ford or by an unconsolidated affiliate) that are sold to dealerships, units
manufactured by Ford that are sold to other manufacturers, units distributed by Ford for other manufacturers, and local brand units produced by our China joint venture, Jiangling Motors Corporation, Ltd. (“JMC”), that are sold to dealerships. Vehicles sold to daily rental car companies that are subject to a guaranteed repurchase option (i.e., rental repurchase), as well as other sales of finished vehicles for which the recognition of revenue is deferred (e.g., consignments), also are included in wholesale unit volumes. Revenue from certain vehicles in wholesale unit volumes (specifically, Ford badged vehicles produced and distributed by our unconsolidated affiliates, as well as JMC brand vehicles) are not included in our revenue
Industry Volume and Market Share• Industry volume and market share are based, in part, on estimated vehicle registrations; includes medium and heavy duty trucks SAAR• SAAR means seasonally adjusted annual rateCompany Cash• Company cash includes cash, cash equivalents, marketable securities and restricted cash; excludes Ford Credit’s cash, cash equivalents, marketable securities and
restricted cashMarket Factors• Volume and Mix – primarily measures EBIT variance from changes in wholesale volumes (at prior-year average contribution margin per unit) driven by changes in industry
volume, market share, and dealer stocks, as well as the EBIT variance resulting from changes in product mix, including mix among vehicle lines and mix of trim levels and options within a vehicle line
• Net Pricing – primarily measures EBIT variance driven by changes in wholesale prices to dealers and marketing incentive programs such as rebate programs, low-rate financing offers, special lease offers and stock accrual adjustments on dealer inventory
• Market Factors exclude the impact of unconsolidated affiliate wholesalesEarnings Before Taxes (EBT)• Reflects Income before income taxes
Appendix – Company
93
Ford Credit Definitions And Calculations
A593
Appendix – Ford Credit
Adjustments (as shown on the Liquidity Sources chart)
• Include certain adjustments for asset-backed capacity in excess of eligible receivables and cash related to the Ford Credit Revolving Extended Variable-utilization program (“FordREV”), which can be accessed through future sales of receivables
Cash (as shown on the Funding Structure, Liquidity Sources and Leverage charts)
• Cash and cash equivalents and Marketable securities reported on Ford Credit’s balance sheet, excluding amounts related to insurance activities
Debt (as shown on the Leverage chart)
• Debt on Ford Credit’s balance sheet. Includes debt issued in securitizations and payable only out of collections on the underlying securitized assets and related enhancements. Ford Credit holds the right to receive the excess cash flows not needed to pay the debt issued by, and other obligations of, the securitization entities that are parties to those securitization transactions
Committed Asset-Backed Security (“ABS”) Facilities (as shown on the Liquidity Sources chart)
• Committed ABS facilities are subject to availability of sufficient assets, ability to obtain derivatives to manage interest rate risk, and exclude FCE Bank plc (“FCE”) access to the Bank of England’s Discount Window Facility
Earnings Before Taxes (EBT)
• Reflects Income before income taxes as reported on Ford Credit’s income statement
Securitization cash (as shown on the Liquidity Sources chart)
• Securitization cash is cash held for the benefit of the securitization investors (for example, a reserve fund)
Securitizations (as shown on the Public Term Funding Plan chart)
• Public securitization transactions, Rule 144A offerings sponsored by Ford Credit, and widely distributed offerings by Ford Credit Canada
Term Asset-Backed Securities (as shown on the Funding Structure chart)
• Obligations issued in securitization transactions that are payable only out of collections on the underlying securitized assets and related enhancements
Total net receivables (as shown on the Total Net Receivables Reconciliation To Managed Receivables chart)
• Includes finance receivables (retail financing and wholesale) sold for legal purposes and net investment in operating leases included in securitization transactions that do not satisfy the requirements for accounting sale treatment. These receivables and operating leases are reported on Ford Credit’s balance sheet and are available only for payment of the debt issued by, and other obligations of, the securitization entities that are parties to those securitization transactions; they are not available to pay the other obligations of Ford Credit or the claims of Ford Credit’s other creditors
Unallocated other (as shown on the EBT By Segment chart)
• Items excluded in assessing segment performance because they are managed at the corporate level, including market valuation adjustments to derivatives and exchange-rate fluctuations on foreign currency-denominated transactions