Embed Size (px)
Citation preview

Effects of Saline-Sodic Water on Soil Chemical and Physical Properties
Kim Hershberger

My StudyMy Study
Assess the effects of modestly saline-sodic water on soil chemical and physical properties of selected soil materials.
Overall Goal-Determine the suitability of irrigating with modestly saline-sodic waters, while still maintaining the sustainability of the soil.
Two laboratory experiments which subjected soils of varying clay content to diverse wetting/drying regimes using two water qualities.

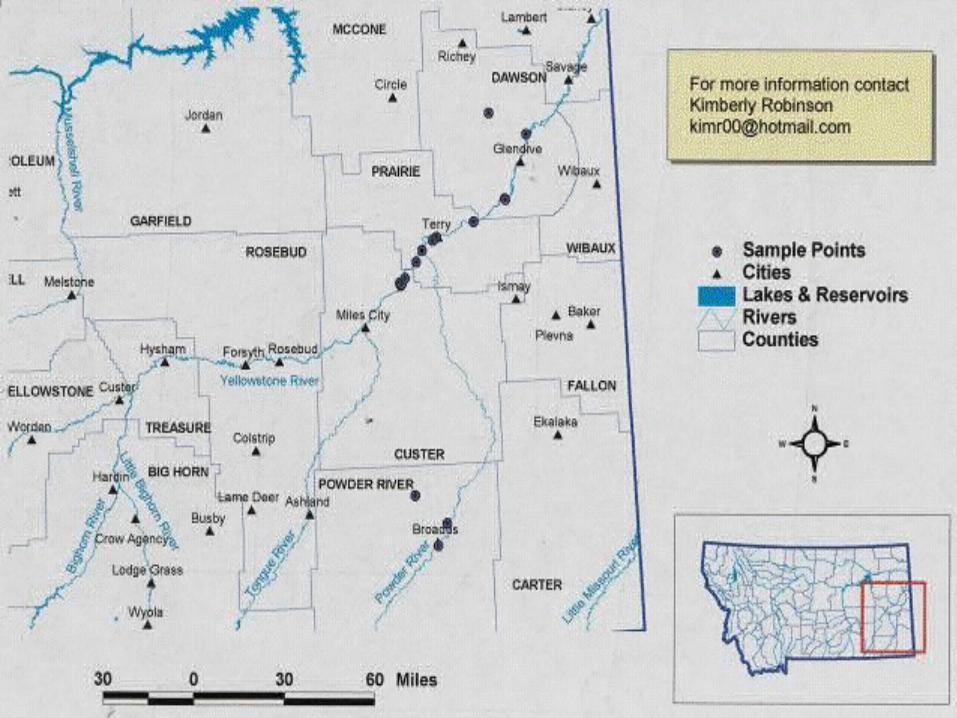
Irrigable Acreages within the Buffalo Irrigable Acreages within the Buffalo Rapids Irrigation DistrictRapids Irrigation District
Soil Series
Taxonomy Texture Acres
Cherry Fine-silty, mixed, frigid Typic Ustochrepts sicl 6052.4
Marias Fine, smectitic, frigid Chronic Haphsturts sic 3527.1
Spinekop Fine-loamy, mixed, superactive, frigid Aridic Haplustepts
sicl 3045.3
Trembles Coarse-loamy, mixed, calcareous, frigid Typic Ustifluvents
fsl/l 2640.8
Havre Fine-loamy, mixed calcareous frigid Ustic Torifluvents
sil/sicl 2157.8
Busby Coarse-loamy, mixed Borollic Camborthids fsl 2002.1

TEXTURAL CLASSES
1- Clay % 0-11% - Loamy Sand, Sandy Loam, Loam
2- Clay % 12-22% - Sandy Loam, Loam, Silt Loam
3- Clay % 23-33% - Loam, Clay Loam, Silty Clay Loam
4- Clay % 34+ - Silty Clay Loam, Silty Clay, Clay
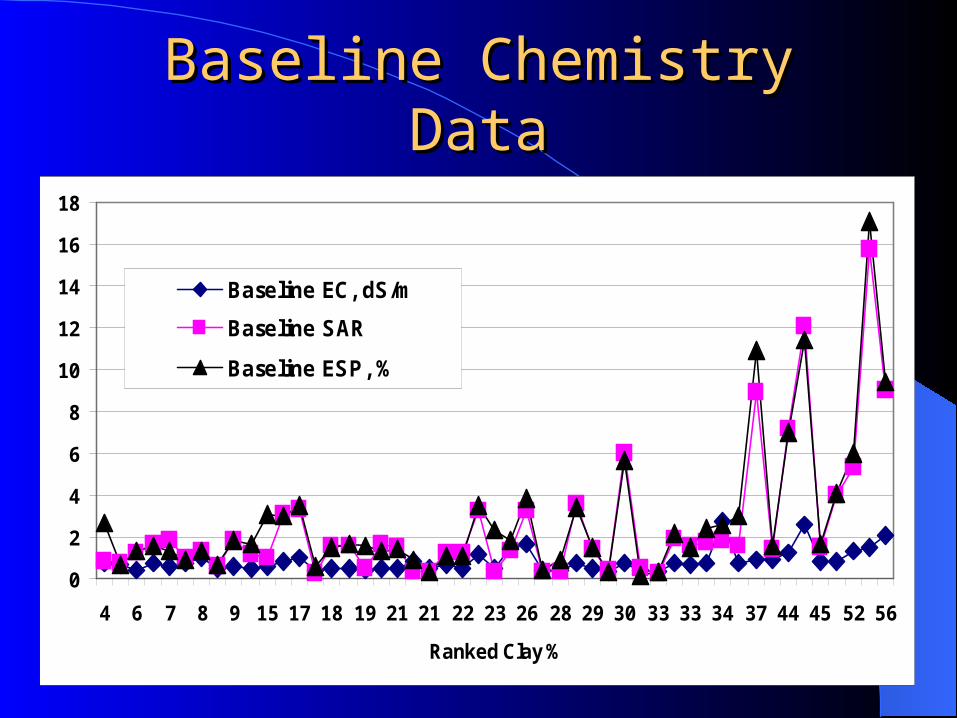
Baseline Chemistry DataBaseline Chemistry Data
0
2
4
6
8
10
12
14
16
18
4 6 7 8 9 15 17 18 19 21 21 22 23 26 28 29 30 33 33 34 37 44 45 52 56
Ranked Clay %
Baseline EC, dS/m
Baseline SAR
Baseline ESP, %

Water Quality TargetsWater Quality Targets
POWDER RIVER
EC = 1.56 dS/m
SAR = 4.54
pH = 8.03
CBM (PRODUCT WATER)
EC = 3.12 dS/m
SAR = 13.09
pH = 8.22

Wetting RegimesWetting Regimes
1X Wet/Dry with P.R.1X Wet/Dry with CBM5X Wet/Dry with P.R.5X Wet/Dry with CBM5X Wet/Dry with P.R. followed by leaching
with 1 pore volume distilled water5X Wet/Dry with CBM followed by leaching
with 1 pore volume of distilled water
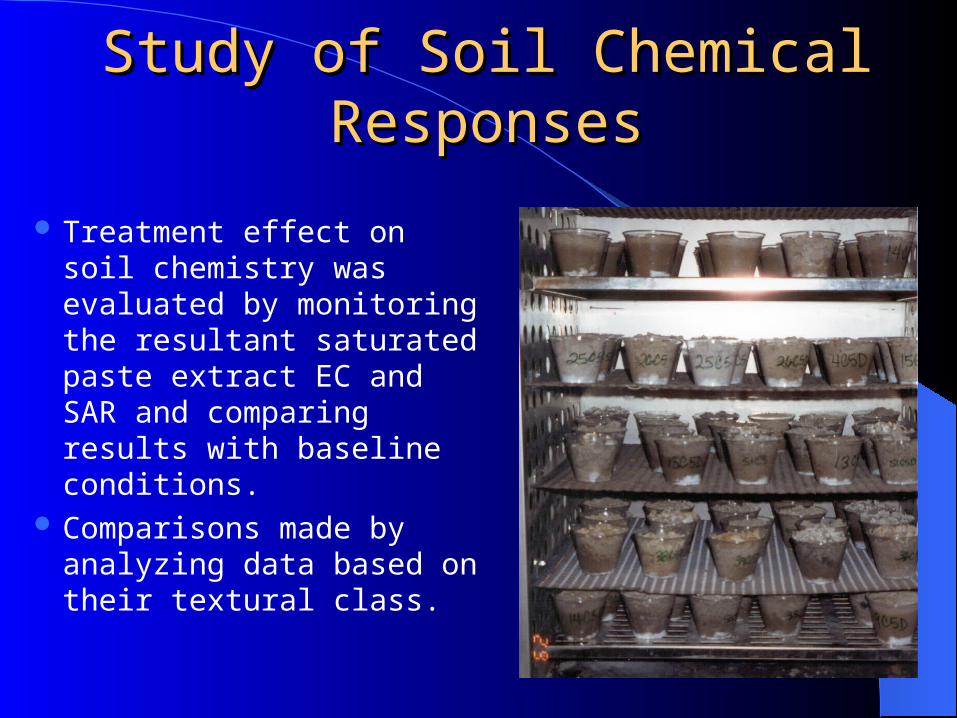
Study of Soil Chemical Study of Soil Chemical ResponsesResponses
Treatment effect on soil chemistry was evaluated by monitoring the resultant saturated paste extract EC and SAR and comparing results with baseline conditions.
Comparisons made by analyzing data based on their textural class.

MethodsMethods
Soil materials were saturated according to the water quality x wetting regime treatment combinations.
1X treatments-following wetting soils were oven dried.
5X treatments-intermediate drying cycles for 24 hours at 95 deg F; following fifth wetting soils were oven dried.

For 5X+d, after fifth drying to 95 deg. F, soils were placed on wire mesh racks where ~1 pore volume of D.I. water was poured on the surface of each sample. Leachate water was allowed to drain for 24 hrs. Following drainage period, soils were oven dried.
n Mean
EC (dS/m) +
Mean
SAR+
Textural Class
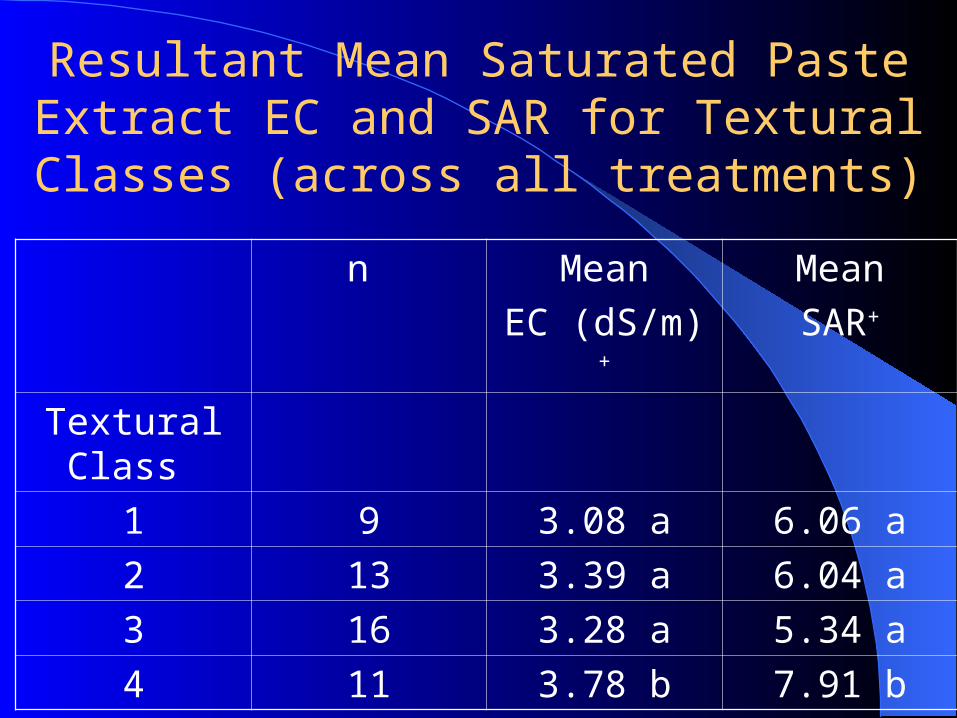
1 9 3.08 a 6.06 a
2 13 3.39 a 6.04 a
3 16 3.28 a 5.34 a
4 11 3.78 b 7.91 b
Resultant Mean Saturated Paste Extract EC and SAR for Textural Classes (across all treatments)

Water Quality Treatment
Mean EC (dS/m)
Mean SAR
Base 49 0.82 a 2.56 a
1X P.R. 49 1.51 b 5.94 b
1X CBM 49 2.46 c 3.92 b
5X P.R. 49 3.21 d 4.94 b
5X P+d 49 3.02 e 4.86 b
5X CBM 49 6.93 f 11.31 c
5X C+d 49 5.73 g 10.85 c
Resultant Mean Saturated Paste EC and SAR for Treatment Combinations (across all textures)

0
0.5
1
1.5
2
2.5
3
3.5
4EC
(dS/
m) (
satu
rate
d pa
ste
extr
act)
Baseline
1X Wet/Dry-P.R.
1X Wet/Dry-CBM
1 2 3 4
Textural Class

0
1
2
3
4
5
6
7
8
9
10
EC (d
S/m
) (sa
tura
ted
past
e ex
trac
t)Baseline
5X Wet/Dry-P.R.
5X Wet/Dry-CBM
1 2 3 4
Textural Class
0
2
4
6
8
10
12EC
(dS/
m) (
satu
rate
d pa
ste
extra
ct)
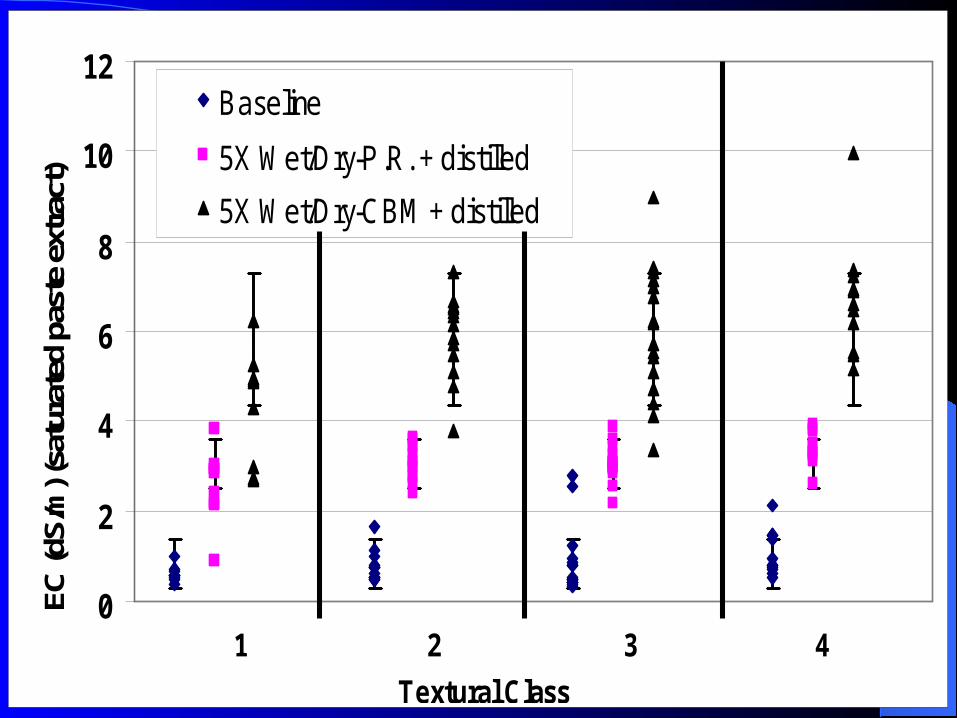
Baseline
5X Wet/Dry-P.R. + distilled
5X Wet/Dry-CBM + distilled
1 2 3 4
Textural Class

0
2
4
6
8
10
12
14
16
18
20SA
R (s
atur
ated
pas
te e
xtra
ct)
Baseline
1X Wet/Dry-P.R.
1X Wet/Dry-CBM
1 2 3 4
Textural Class
0
5
10
15
20
25SA
R (s
atur
ated
pas
te e
xtra
ct)
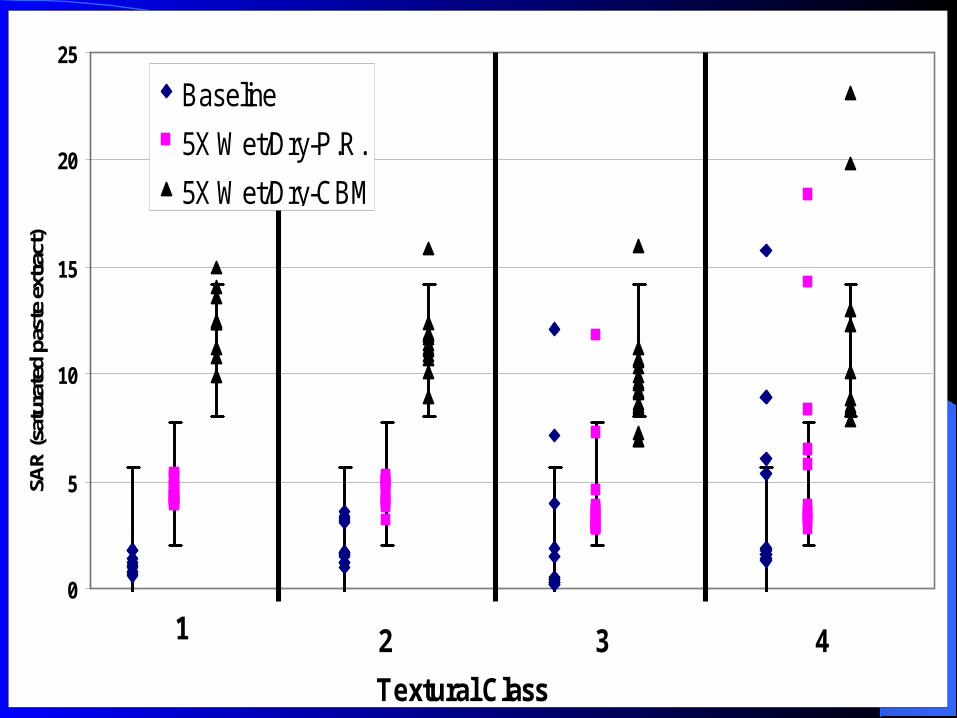
Baseline
5X Wet/Dry-P.R.
5X Wet/Dry-CBM
1 2 3 4
Textural Class

0
5
10
15
20
25
30SA
R (s
atur
ated
pas
te e
xtra
ct)
Baseline
5X Wet/Dry-P.R. + distilled
5X Wet/Dry-CBM + distilled
1 2 3 4
Textural Class
0
5
10
15
20
25
30
35
0 5 10 15 20 25 30
SAR (soil solution)
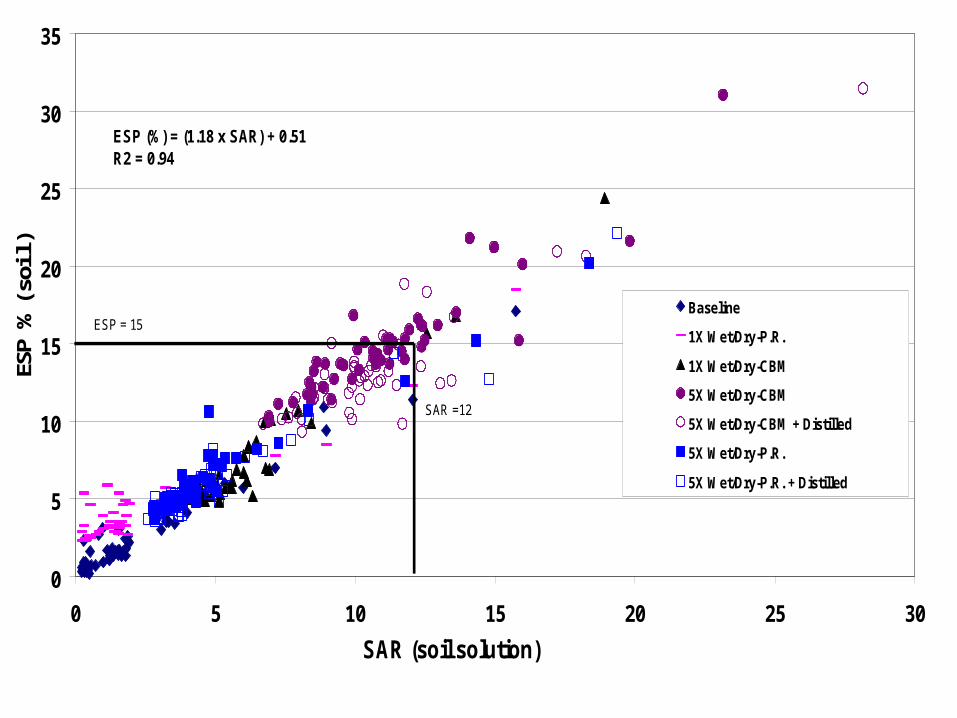
ESP
% (s
oil)
Baseline
1X Wet/Dry-P.R.
1X Wet/Dry-CBM
5X Wet/Dry-CBM
5X Wet/Dry-CBM + Distilled
5X Wet/Dry-P.R.
5X Wet/Dry-P.R. + Distilled
ESP (%) = (1.18 x SAR) + 0.51R2 = 0.94
ESP = 15
SAR =12

0
5
10
15
20
25
30
0 2 4 6 8 10 12
EC (dS/m)
SA
R (
soil)
Baseline
1X Wet/Dry-P.R.
1X Wet/Dry-CBM
5X Wet/Dry-CBM
5X Wet/Dry-CBM + Distilled
5X Wet/Dry-P.R.
5X Wet/Dry-P.R. + Distilled
SAR = 1.46 (EC) + 1.29R2 = .54
No Reduction in Infiltration
Slight to Moderate Reduction in Infiltration
Severe Reduction in Infiltration
SAR = 12
EC = 3
Ayers and Westcot (1976)

Soil Chemistry ConclusionsSoil Chemistry Conclusions
1.Repeated irrigation with saline-sodic water will result in a general increase in the soil salinity and sodicity.
2.Repeated irrigation or dispersal of CBM product water to irrigable land is likely to result in elevated soil salinity levels substantially higher than published thresholds for some irrigated crops.

3. Soil solution salinity will equilibrate at an EC value approximately 2-3 times the EC of the applied water; soil solution SAR appears to equilibrate at a level comparable to the SAR of the applied water as long as leaching occurs.
4. Application of salt-free water following elevation of soil solution salinity and SAR through repeated wetting effectively reduced soil solution salinity while having little or no effect on sodicity.
5. The lowering impact of rainfall on EC and SAR is more predominant when salt concentrations are high, and in coarser-textured soils.
6. The greatest increases in EC and SAR upon wetting with either CBM or P.R. water were in coarser-textured soils.
7.In few instances of this study were soil solution salinity x sodicity combinations measured which exceed these thresholds following single wetting events. In essentially all instances where saline-sodic water was repeatably applied, the resulting soil solution salinity and sodicity were significantly elevated to levels in close proximity to the previously published EC x SAR standards.
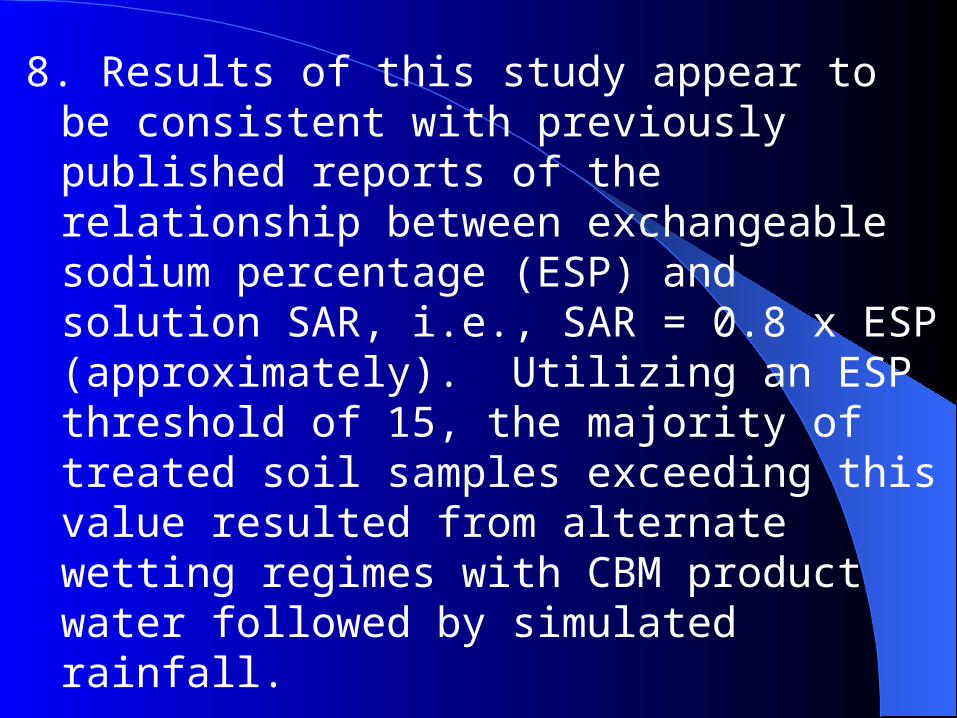
8. Results of this study appear to be consistent with previously published reports of the relationship between exchangeable sodium percentage (ESP) and solution SAR, i.e., SAR = 0.8 x ESP (approximately). Utilizing an ESP threshold of 15, the majority of treated soil samples exceeding this value resulted from alternate wetting regimes with CBM product water followed by simulated rainfall.
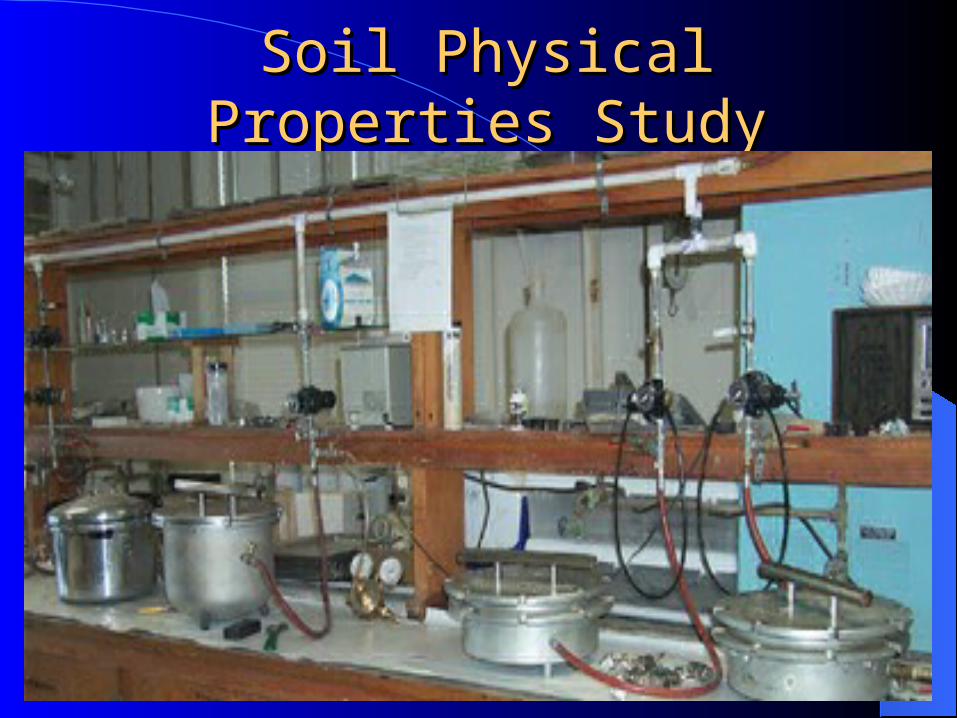
Soil Physical Properties StudySoil Physical Properties Study

MethodsMethods Soil water retention was measured at 1/10 - 15 -bars of applied pressure. Water content was measured after soils had undergone treatment
combinations (same as the soil chemistry study treatments. For 1X treatments, soils were saturated for 24 hrs before pressure was
applied. For 5X treatments, soils were placed on wire racks for wet/dry cycles and
transferred to pressure plates for the final wetting period.
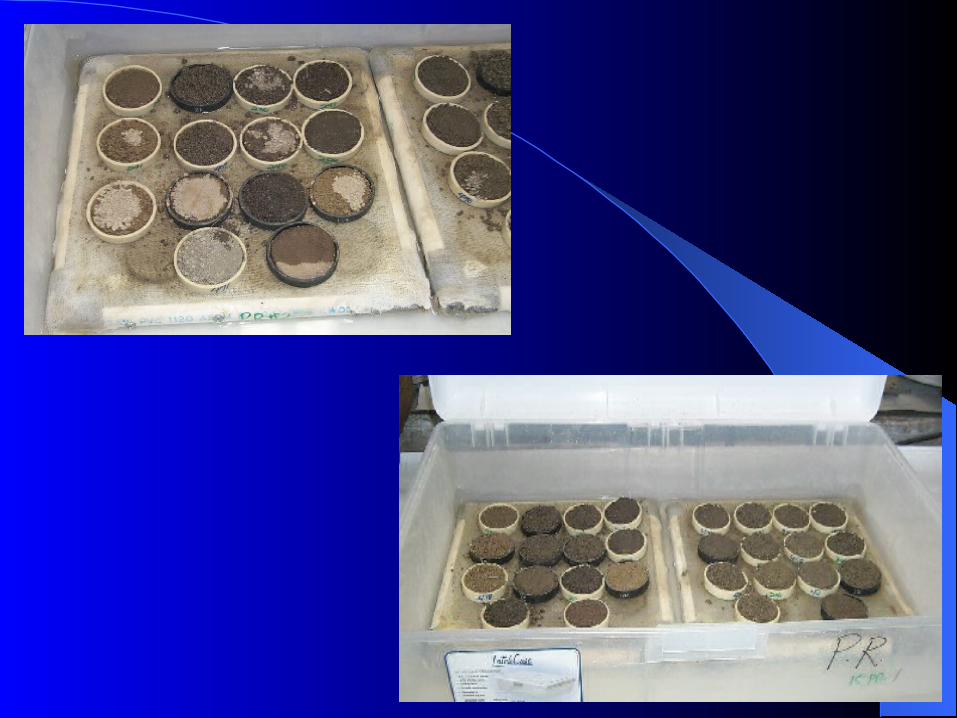

Methods cont.Methods cont.
5X+d-Same procedure as the 5X– Final wetting on the
plate consisted of DI application
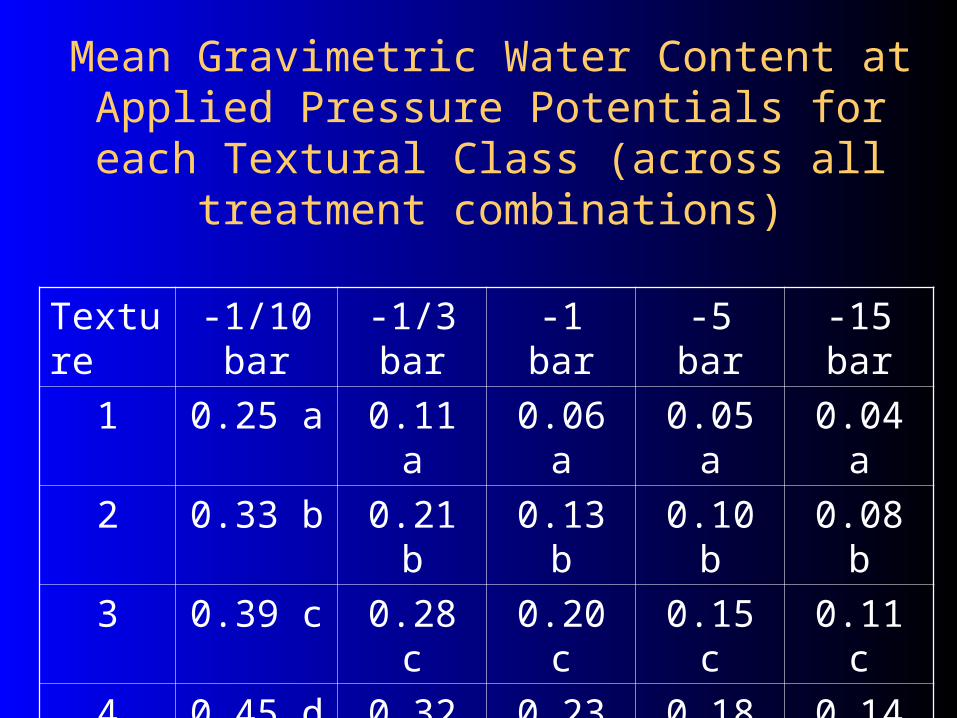
Texture -1/10 bar -1/3 bar -1 bar -5 bar -15 bar
1 0.25 a 0.11 a 0.06 a 0.05 a 0.04 a
2 0.33 b 0.21 b 0.13 b 0.10 b 0.08 b
3 0.39 c 0.28 c 0.20 c 0.15 c 0.11 c
4 0.45 d 0.32 d 0.23 d 0.18 d 0.14 d
Mean Gravimetric Water Content at Applied Pressure Potentials for each Textural Class (across
all treatment combinations)

WQ Treatment -1/10 bar
-1/3 bar
-1 bar -5 bar -15 bar
1X P.R. 0.37 a 0.23 a 0.16 a 0.12 a 0.09 a
1X CBM 0.37 a 0.22 a 0.16 a 0.12 a 0.09 a
5X P.R. 0.35 b 0.23 a 0.14 b 0.12 a 0.09 a
5X P+d 0.35 b 0.23 a 0.16 a 0.12 a 0.09 a
5X CBM 0.35 b 0.23 a 0.15 c 0.12 a 0.09 a
5X C+d 0.35 b 0.23 a 0.16 a 0.12 a 0.09 a
Mean Gravimetric Water Content at Applied Pressure Potentials for each Treatment
Combination (across all textures)

-0.2
-0.15
-0.1
-0.05
0
0.05
0.1
0.15
0.2Di
ffere
nce
in P
w fr
om B
asel
ine
(1X
P.R.
)g
H20/
g dr
y so
il1X Wet/Dry-CBM
5X Wet/Dry-PR
5X Wet/Dry-P.R. + distilled
5X Wet/Dry-CBM
5X Wet/Dry-CBM + distilled
1/10 (-bar)
1 2 3 4
Textural Class

-0.2
-0.15
-0.1
-0.05
0
0.05
0.1
0.15
0.2D
iffer
ence
in P
w fr
om B
asel
ine
(1X
P.R
.)g
H20
/g d
ry s
oil
1X Wet/Dry-CBM
5X Wet/Dry-P.R.
5X Wet/Dry-P.R. + distilled
5X Wet/Dry-CBM
5X Wet/Dry-CBM + distilled
1/3 (-bar)
1 2 3 4
Textural Class

-0.20
-0.15
-0.10
-0.05
0.00
0.05
0.10
0.15
0.20D
iffer
ence
in P
w fr
om B
asel
ine
(1X
P.R
.)g
H20
/ g d
ry s
oil
1X Wet/Dry-CBM
5X Wet/Dry-P.R.
5X Wet/Dry-P.R. + distilled
5X Wet/Dry-CBM
5X Wet/Dry-CBM + distilled
1 (-bar)
1 2 3 4
Textural Class

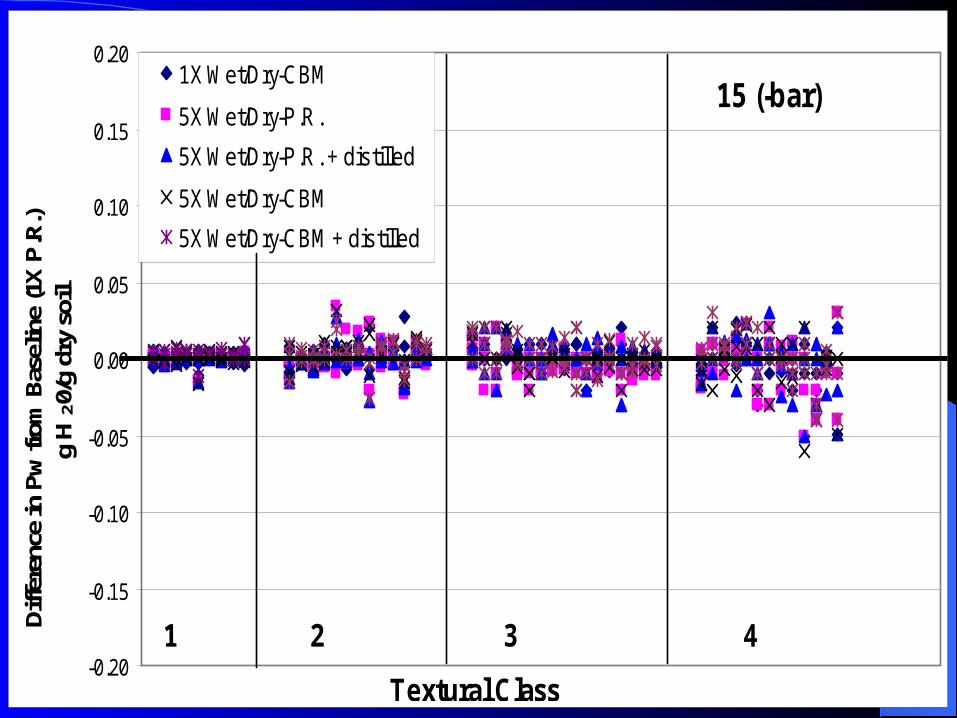
-0.20
-0.15
-0.10
-0.05
0.00
0.05
0.10
0.15
0.20D
iffer
ence
in P
w fr
om B
asel
ine
(1X
P.R
.) g
H20
/g d
ry s
oil
1X Wet/Dry-CBM
5X Wet/Dry-P.R.
5X Wet/Dry-P.R. + distilled
5X Wet/Dry-CBM
5X Wet/Dry-CBM + distilled
5 (-bar)
1 2 3 4
Textural Class
-0.20
-0.15
-0.10
-0.05
0.00
0.05
0.10
0.15
0.20Di
ffere
nce
in P
w fr
om B
asel
ine
(1X
P.R.
)g
H20/
g dr
y so
il1X Wet/Dry-CBM
5X Wet/Dry-P.R.
5X Wet/Dry-P.R. + distilled
5X Wet/Dry-CBM
5X Wet/Dry-CBM + distilled
15 (-bar)
1 2 3 4
Textural Class

0
0.05
0.1
0.15
0.2
0.25
0.3
0.35
0.4
0 2 4 6 8 10 12 14
Matric Potential (h) (-bars)
Wate
r C
on
ten
t (
g H
20/g
dry
so
il)
1X Wet/Dry-P.R.
1X Wet/Dry-CBM
5X Wet/Dry-P.R.
5X Wet/Dry-P.R. + distilled
5X Wet/Dry-CBM
5X Wet/Dry-CBM + distilled
Textural Class #1
Textural Class #2
0
0.1
0.2
0.3
0.4
0.5
0.6
0 2 4 6 8 10 12 14
Matric Potential (h) (- bars)
Wate
r C
on
ten
t (g
H 20/g
dry
so
il)
1X Wet/Dry-P.R.
1X Wet/Dry-CBM
5X Wet/Dry-P.R.
5X Wet/Dry-P.R. + distilled
5X Wet/Dry-CBM
5X Wet/Dry-CBM + distilled
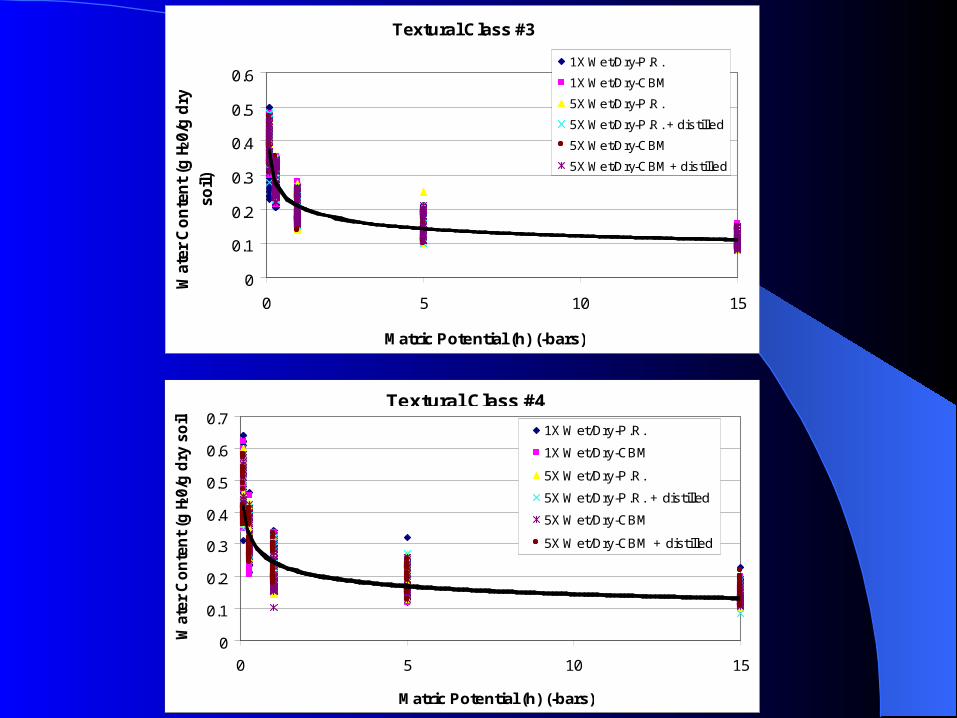
0
0.1
0.2
0.3
0.4
0.5
0.6
0.7
0 5 10 15
Matric Potential (h) (-bars)
Wate
r C
on
ten
t (g
H20/g
dry
so
il)
1X Wet/Dry-P.R.
1X Wet/Dry-CBM
5X Wet/Dry-P.R.
5X Wet/Dry-P.R. + distilled
5X Wet/Dry-CBM
5X Wet/Dry-CBM + distilled
Textural Class #4
Textural Class #3
0
0.1
0.2
0.3
0.4
0.5
0.6
0 5 10 15
Matric Potential (h) (-bars)
Wat
er C
on
ten
t (g
H20/
g d
ry
soil)
1X Wet/Dry-P.R.
1X Wet/Dry-CBM
5X Wet/Dry-P.R.
5X Wet/Dry-P.R. + distilled
5X Wet/Dry-CBM
5X Wet/Dry-CBM + distilled

Soil Physical Properties Soil Physical Properties ConclusionsConclusions
1. Water content associated with matric potential differed significantly due to predominant soil texture at all matric potentials investigated in this study.
2. Significant differences in water holding capacity of coarser-textured soils occur due to water quality treatment more often at greater matric potentials. In finer-textured soils differences in water holding capacity due to water quality treatment are more likely to occur at lower potentials.

3. Significant changes in water holding capacity due to water quality treatment are only on the order of 0.02-0.04 g H20/g dry soil. The change
reflected a decrease in water holding capacity in textural classes 1 & 2 and an increase in water holding capacity in textural class 3.
4. Reductions in water retention in coarser-textured soils are attributable to the loss of large pore spaces.

5. The addition of saline-sodic water had the greatest effect on soil physical properties when the soil is near saturation. Changes in water holding capacity are likely to have non-discernible impact on irrigation suitability.
6. Successive wetting/drying cycles can cause aggregate coalescence and the loss of interaggregate porosity; this appeared to occur more often in the coarser-textured soils.

7. Although statistically significant differences were detected among water quality treatments, differences were not large enough to have a significant ecological impact.
8. CBM product water applied at these levels did not have a consistent significant impact on soil physical properties, i.e., water-holding capacity.

AcknowledgementsAcknowledgements
Committee: Dr. Jim Bauder (chair), Dr. Douglas Dollhopf, Dr. Jon Wraith
Funding: Prairie County Conservation District, Buffalo Rapids Irrigation District, Department of Energy
Bernard Schaff, Susan Winking, and Bauder Students
ACKNOWLEDGEMENTS