Embed Size (px)
Citation preview
About the coverRaven is depicted as the bringer of health to youth in the form of the medicine wheel�s philosophy. Thefour aspects of physical, mental, emotional and spiritual encompass what needs to be looked at in termsof being a healthy person. In the stories, Raven brought the first peoples what they needed to survive,and now brings what is needed to be healthy. Raven and the medicine wheel come together to teach thepeople that health is not confined to the physical, but relates to all aspects of life.
Ginger GosnellNisga�a/Kwakiulth
© McCreary Centre Society, 2005ISBN 1-895438-73-X
3552 Hastings Street EastVancouver, B.C. V5K 2A7Tel: 604-291-1996Fax: 604-291-7308Email: [email protected]
The McCreary Centre Society is a non-government, non-profit organizationcommitted to improving the health of B.C.youth through research, education andcommunity-based projects. Founded in 1977,the Society sponsors and promotes a widerange of activities and research to addressunmet health needs of young people.
Areas of interest include:
� Health promotion� Health risk behaviours� Youth participation and leadership skills
development
Raven�s Children II:Aboriginal Youth Health in B.C.
2 � Raven�s Children II: Aboriginal Youth Health in B.C.
Project TeamKim van der WoerdConsultantKim is a member of the Namgis First Nation. She is inher final year of the Ph.D. program in the Department ofPsychology at Simon Fraser University. Kim was a Re-search Assistant on the Raven�s Children I project in1999-2000 and is a past member of McCreary�s Boardof Directors.
Brittany DixonResearcherBrittany is a member of the Sechelt Nation. She is afourth year student in the Department of Psychology atSimon Fraser University.
Trica McDiarmidResearcherTrica is a member of the Tr�ondek Hwech�in First Na-tion. She is a fourth year student in the Department ofPsychology at the University College of the Fraser Valley.
Aileen MurphyManaging Director
Minda ChittendenResearch Associate
Alison LiebelCommunications Coordinator
Lisa MayCommunications Consultant, May Communications
Rita GreenSurvey Consultant, Statistics Canada
Karen DeVriesCooperative Education Student , Directorate of Aborigi-nal Health, Division of Population Health and Wellness,Ministry of Health.Karen conducted the analysis on risk and protectivefactors for suicide attempts, with assistance from Eliza-beth Saewyc, McCreary Centre Society.
Advisory CommitteeJames AndrewAboriginal Programs, Faculty of MedicineUniversity of British Columbia
Lucy BarneyChee MamukBC Centre for Disease ControlKnowledgeable Aboriginal Youth Advocates (KAYA)
Kim BrooksBC ACADREUniversity of British Columbia
Nathan CardinalCentre for Native Policy and Research
Julie DawsonServices to Aboriginal Children and Families BranchMinistry for Children and Family Development
Ginger GosnellN8V Action Youth Society
John GreenYouth Services and Safe Care BranchMinistry of Children and Family Development
Kristin KozubackRedWAY BCKAYA (Knowledgeable Aboriginal Youth Advocates)
Jenna LafranceInstitute for Aboriginal HealthUniversity of British Columbia
Cheryl MatthewCentre for Native Policy and Research
Richard VedanFirst Nations House of LearningUniversity of British Columbia
Laura WardYouth Advisory Council AlumniMcCreary Centre Society
Suggested Citation:van der Woerd, K. A., Dixon, B. L., McDiarmid, T.,Chittenden, M., Murphy, A. & The McCreary Centre Soci-ety (2005). Raven�s Children II: Aboriginal Youth Healthin BC. Vancouver, BC. The McCreary Centre Society.
Raven�s Children II: Aboriginal Youth Health in BC waswritten by Lisa May and designed by Alison Liebel. Thecover design was created by Ginger Gosnell for Raven�sChildren I in 2000.
AcknowledgementsThere are many people we would like to acknowl-edge and thank. Most importantly, we would liketo thank all the Aboriginal youth who participatedin the Adolescent Health Survey.
Thank you to the Aboriginal youth who participatedin the discussion group. We were honoured thatyou so willingly shared your personal experiences,along with insights about the research results. Weare also grateful to Willy Blackwater of the Broad-way Youth Resource Centre for supporting theyouths� involvement.
Thank you to the youth whose photos appear inthis report; they have helped put a human faceon Aboriginal youth health. We appreciate JohnCrosby�s contribution in taking photos.
Many thanks to the members of the advisory com-mittee. Your feedback helped to shape themessages about Aboriginal youth health in thisreport.
Funding for the Raven�s Children II project wasprovided by the BC Ministry of Children and Fam-ily Development.
The views expressed herein do not necessarily representthe official policy of the Province of British Columbia.
The McCreary Centre Society � 3
Introducing Raven�s Children II .......................................................................... 4Aboriginal Youth Feedback .................................................................................. 6Aboriginal Youth Health in B.C. .......................................................................... 8Key Findings ........................................................................................................... 9Aboriginal Youth in B.C. ..................................................................................... 10About the Survey .................................................................................................. 12Family Connections ............................................................................................. 14Education ............................................................................................................... 17Community Involvement .................................................................................... 20Smoking ................................................................................................................. 23Physical Health ...................................................................................................... 25Emotional Health ................................................................................................. 28Sexual Behaviour .................................................................................................. 33Safety and Violence .............................................................................................. 35Injuries .................................................................................................................... 39Substance Use ....................................................................................................... 41Aboriginal Youth Living On and Off Reserve ............................................... 44Out of School Aboriginal Youth ....................................................................... 46Appendix 1 - Geography Matters ...................................................................... 48Appendix 2 - Participating School Districts .................................................... 52McCreary Centre Society Publications ............................................................. 53
Table of Contents
4 � Raven�s Children II: Aboriginal Youth Health in B.C.
Introducing Raven�s Children II
How this report came aboutThe McCreary Centre Society (MCS) is a non-profitorganization committed to improving the health ofB.C. youth through research, information and com-munity-based participation projects.
In 1992, MCS conducted the first Adolescent HealthSurvey (AHS) with close to 16,000 youth in schoolsthroughout B.C. Of these youth, almost 700 stu-dents identified themselves as Aboriginal. MCSapproached members of the Aboriginal communityto determine if there was an interest in producing areport on these Aboriginal youth in school. At thetime, it appeared as though developing this reportwas not a priority. As a result, MCS chose not torelease any of the data on Aboriginal youth.
However, the 1992 AHS data on Aboriginal youthwas analyzed by an Ojibway doctoral student, RuthTurner. Dr. Turner�s dissertation was entitled Riskand protective factors for propensity for suicide among BritishColumbia First Nations adolescents, using the AdolescentHealth Survey.
In 1998, MCS conducted the second AHS with ap-proximately 26,000 students, of which 1,710 youthidentified themselves as Aboriginal. MCS ap-proached Aboriginal community members, andfound there was an interest in producing a reporton these youth. MCS took the following steps toensure the process of developing this report wasculturally sensitive:
� An advisory committee was formed with Abo-riginal people from a variety of Aboriginalorganizations and agencies.
� MCS hired me, a member of the Namgis FirstNation, as the Research Assistant to conductthe data analysis for the report.
� Consistent with MCS philosophy, the empha-sis did not focus on youth �deficits,� but insteadhighlighted the positive.
� The advisory committee reviewed the resultsand provided feedback.
� Results were also reviewed by Aboriginal youthto see how the information resonated withthem.
� The report, Raven�s Children, was presented tothe Aboriginal community at the VancouverFriendship Centre, prior to being released tothe general public.
The McCreary Centre Society � 5
� MCS was committed to sharing the results withAboriginal communities by developing Next Stepworkshops to present the report and discusscommunity priorities.
Two Aboriginal youth leaders, Ginger Gosnell andSienna MacMillan, facilitated Next Step youth work-shops in communities across B.C. to present dataon Aboriginal youth health and gather feedback onpriority health needs for youth. (Their reports areincluded in our reference list on page 53.)
MCS was interested in disseminating the results tothe academic community as well, and Dr. Turnerand I presented this data at conferences for the Ca-nadian Psychology Association, Society forCommunity Research and Action, the National Abo-riginal Health Organization, Child and Youth HealthThird World Congress and Exposition, the Inter-national Association of Forensic Mental Health, theEuropean Association of Psychology and Law, So-ciety for Adolescent Medicine, and the AmericanPsychology Law Society.
In 2003, MCS conducted the third AHS with over30,500 youth, and 2,478 students identifiedthemselves as Aboriginal. This report, Raven�sChildren II, combines the data from responses ofmore than 4,800 Aboriginal students who took partin province-wide youth health surveys in 1992, 1998and 2003. The same steps have been taken indeveloping this report as the first one. While MCSis not an �Aboriginal� organization, they do havevaluable and unique information on our Aboriginalyouth. We encourage you to read this report andconsider how these results fit with your communityor organization.
All my relations,
Kim van der WoerdNamgis First NationPh.D. Candidate, Department of Psychology,Simon Fraser University
We encourage you to read this report and consider how the results fitwith your community or organization
�We are native peopleand are here to live life on earthjust like everyone else; we bleed justlike others. So don�t judge us forwho we are, but look at us asequal or the same.�22-year-old male,Carrier First Nation
6 � Raven�s Children II: Aboriginal Youth Health in B.C.
Aboriginal Youth Feedback
Aboriginal youth no longer want to hear about being at risk or in trouble.They need positive role models to encourage them.
I helped organize a discussion group that gave Abo-riginal youth an opportunity to hear about the Raven�sChildren II results, and talk about the important is-sues in their communities and lives. Ten Aboriginalyouth between the ages of 14 and 24 engaged inthe discussion. Some of the issues we discussed in-cluded school and education, physical health,volunteering, recreational activities, sexual behav-iour, and tobacco, alcohol and drugs. The youthshared their thoughts about these issues and whetherthe preliminary results of the Raven�s Children II re-port reflected their life experiences.
you sure this is for Aboriginal youth?� �Where didyou get this information from?� They seemed sur-prised that Aboriginal students in B.C. are doingquite well, and in many cases do not differ muchfrom the rest of the youth population. They alsoseemed encouraged and inspired to hear positivestatistics about Aboriginal youth.
As a conclusion to the discussion group, youth par-ticipants wrote personal comments in response tothe question �What do you want to tell people aboutAboriginal youth?� Their answers were heartfelt andinspiring. Some youth mentioned the importance
What resonated with me was the negative percep-tion the Aboriginal youth in this discussion grouphave of Aboriginal youth in B.C. today. We used atrivia game to engage the youth in responding tothe research results. In most cases, the youth chosethe most negative response category and when toldthe correct answer, they seemed to question the sur-vey�s accuracy. They would ask questions like, �Are
of their culture, ceremonies and languages. Othersmentioned a concern for their futures, and their de-sire to have more Aboriginal youth involved inactivities such as the discussion group. One youthin particular mentioned that people need to havemore faith and support for Aboriginal youth, whichwill lead to their success. You will read their com-ments throughout this report.
The McCreary Centre Society � 7
EducationThe youth participating in this group believed gradeeight is a difficult time, because Aboriginal youthget picked on. In grade nine or 10, friends are moreestablished and youth have more support or backup. Some youth mentioned that most Aboriginalyouth don�t go on to post secondary education be-cause so many have personal issues that preventthem from graduating from high school. To helpAboriginal youth with their problems, the discus-sion group participants suggested there needs to bemore support for Aboriginal youth in school, andmore Aboriginal teachers and youth leaders. Theyouth participants felt that Aboriginal teachers un-derstand where they are coming from, and wouldprefer to hear about their history from an Aborigi-nal person rather than a non-Aboriginal person.However, one youth commented that there are manyplaces Aboriginal youth can go for support, but mostdon�t use or seek out these resources.
The youth believed a lot of Aboriginal youth areinvolved in volunteer activities, which may be re-lated to schools requiring volunteering as part ofthe curriculum.
Physical healthThe youth discussed the media�s influence on girls,especially relating to weight issues. They were verysurprised to find out that Aboriginal students ratedtheir health highly, because their perception is thatmost Aboriginal youth have poor eating habits,partly because of the high price of fruits and veg-etables and other healthy foods.
I think we can start a new cycle forAboriginal youth through mentorshipand encouragement.
Sexual healthThe Aboriginal youth were surprised by an increasein condom use and a decrease in sexual activity, be-cause they believe there is still a problem with teenpregnancy in their communities. They attribute theincrease in condom use to the availability of con-doms now for youth.
Substance useLearning that the percentage of Aboriginal youthwho have tried smoking has decreased was attrib-uted to the rising prices of cigarettes. The decreasein driving after using alcohol or drugs among Abo-riginal youth was attributed to the media tellingstories of youth dying in car accidents, after drink-ing and driving, or being hit by a drunk driver.
Adult supportLearning that most Aboriginal students have an adultin their family they would feel okay talking to abouta serious problem surprised some youth and didn�tsurprise others. Some felt this is because Aboriginalpeople usually have large families. Other youth weresurprised because this statistic did not reflect theirsituation or their peers�.
Identifying issuesAfter the discussion, we asked the group of youthto identify what they believe are the most impor-tant issues facing Aboriginal youth. Some issues thegroup viewed as very important were school andeducation, leadership, depression, racism, familytroubles, the long term effects of the residential
school system, and the need for healing. One youthcommented that in several of her university coursesa negative approach was taken by professors whendiscussing Aboriginal youth.
To me, their comments speak to the need to de-emphasize the deficit approach in researchingAboriginal youth. I felt it was inspiring for this groupof youth to learn about the positive statistics wehave found. They no longer want to hear aboutbeing at risk or in trouble. They need positive rolemodels to encourage them and show that they toocan become a positive example for other Aborigi-nal youth. I think we can start a new cycle forAboriginal youth through mentorship and encour-agement. If one youth encourages another tosucceed, and that cycle continues, anything is possi-ble. Aboriginal youth are moving forward in theirlives, and are prepared to support one another. Andeach and every one of them wants to be their ownsuccess story.
Brittany DixonSechelt Nation
8 � Raven�s Children II: Aboriginal Youth Health in B.C.
Aboriginal Youth Health inBritish Columbia
Why Raven�s Children II was producedMany publications and media reports point out that Aboriginal Canadians areless healthy than other Canadians. And it is true that too many Aboriginalyouth are homeless and in B.C.�s custody centres, and these youth have muchhigher rates of drug and alcohol use, suicide attempts, histories of abuse, andother health problems.
But Raven�s Children II shows that Aboriginal youth attending school in B.C. aresimilar in many ways to non-Aboriginal youth. These youth are tired of hearingdire statistics about themselves, and want to see more positive news reflectingtheir progress into adulthood.
And this report has some good news and promising trends to announce. Basedon the largest youth health survey ever conducted in the province, Raven�s Chil-dren II shows most Aboriginal youth feel connected to their families and school,most report good or excellent health, and smoking has dramatically declinedamong Aboriginal students.
However, the report does not minimize real issues, and identifies areas withroom for improvement, such as the continuing concern over higher suiciderates among Aboriginal youth, where programs and services could be targetedto improve their health and well being.
The data in this report was obtained from the responses of more than 4,800Aboriginal students who took part in province-wide youth health surveys in1992, 1998 and 2003. The survey was conducted by The McCreary CentreSociety, a non-profit B.C. organization with extensive experience in youth is-sues. McCreary produced this report in collaboration with an Aboriginal YouthHealth Project Advisory Committee.
Promoting healthy youth developmentCurrent research suggests building on the strengths of youth and their com-munities is more effective than focusing on youth as problems. To supportyoung people in making a healthy transition through adolescence, preventionand intervention strategies must occur early and provide opportunities for posi-tive growth.
Intervene earlyEarly adolescence, from the onset of puberty into the early teen years, is acritical period of transition. This phase of development is characterized byrapid physical and emotional changes, and by changes in social relationships.Experimentation with adult lifestyles may begin in early adolescence, especiallyfor young people growing up in adverse conditions. The beginning of adoles-cence offers a window of opportunity for prevention and early intervention,rather than waiting until the middle or late teen years when problems havealready developed and patterns of behaviour have become more firmly en-trenched.
Provide opportunities for healthy youth developmentAll adolescents need opportunities to develop skills and competencies, haverelationships with caring and supportive adults, and build a sense of optimismfor the future. Healthy youth development approaches go beyond focusing onrisks and problems, to nurturing strengths, skills and positive relationships.
The McCreary Centre Society � 9
Key FindingsMost Aboriginal students feel strongly connectedto their families and school
Most Aboriginal students are healthy� Most Aboriginal students rate their health as
good or excellent.� Most Aboriginal students feel strongly con-
nected to their families and school.� Over three-quarters have an adult they could
talk to if they were having a serious problem.� Nearly two-thirds want to continue their edu-
cation beyond high school.� Almost three-quarters regularly participate in
organized extracurricular activities.� Most youth volunteer in their schools or com-
munities.
Positive trends � Smoking has dramatically decreased among
Aboriginal students.� Fewer Aboriginal youth are drinking alcohol.� Drinking and driving among Aboriginal stu-
dents has decreased since 1998.� Sexual and physical abuse of Aboriginal youth
has declined over the past decade.� Aboriginal students are waiting longer to have
sex.
� Condom use has increased among sexually ac-tive Aboriginal students.
� Violence has not increased among Aboriginalyouth.
Room for improvement� More Aboriginal boys are overweight compared
to a decade ago.� Too many Aboriginal youth think about or at-
tempt suicide and rates have not improved inthe past decade.
� Too many Aboriginal students, especially girls,continue to experience sexual and physicalabuse.
� Internet safety is a concern, especially amonggirls.
� Fewer youth reported feeling safe at school in2003 than in 1998.
� One in five Aboriginal students experiencedracial discrimination.
� Marijuana use among Aboriginal students hasincreased.
� Among youth who drink alcohol, binge drink-ing has not decreased over the past decade.
10 � Raven�s Children II: Aboriginal Youth Health in B.C.
Aboriginal Youth In B.C.
About 4.5% of B.C.�s population identified them-selves as Aboriginal in the 2001 census, and 73%did not live on a reserve. A somewhat larger pro-portion of B.C. youth are Aboriginal: 8.4% of allpublic school students in the 2003/04 school year,according to the B.C. Ministry of Education. Abouthalf of B.C.�s Aboriginal population is under theage of 25.
Over the years, statistics have consistently showntroubling suicide rates among Aboriginal youth. TheBC Children�s Commission 1999 Annual Reportnoted the suicide rate for Aboriginal males aged 10to 19 is over eight times higher than for non-Aboriginals; for Aboriginal females, the rate is 20times higher. While the overall suicide rate amongAboriginal youth has not improved in the pastdecade, other research shows that:
Suicide rates are lower for First Nations bandsthat have made progress toward self-govern-ment and land claims, have cultural facilities,and have control over local services such ashealth care, education, police and fire. Themore �protective factors� in a community, thelower its suicide rate. Aboriginal individualsand communities are healthier when they areempowered and have a sense of control overtheir lives and their destinies.
Provincial Health Officer�s Annual Report 2001: The Healthand Well-being of Aboriginal People in British Columbia
Aboriginal youth in school are coping well with the transition throughadolescence
The results of the 2003 Adolescent Health Surveyalso show a need for more effective ways to preventsuicide attempts and physical and sexual abuseamong Aboriginal youth, and to decrease risky be-haviours such as smoking, marijuana and alcoholuse, and early sex.
The McCreary Centre Society � 11
�Native Indiansare no different than others; we like the same things most people havean interest in. I have given myself goals and have succeeded, such asgraduating from high school and landing a good job in sales. So wheneveryone says we are good for nothing, you can tell them to look me up!�21-year-old Aboriginal male
However, the survey shows marked improvementsin many of these areas, and suggests Aboriginalyouth who are in school are coping well with thetransition through adolescence. Most Aboriginalstudents report good or excellent health, and arephysically active. Smoking is on the decline. FewerAboriginal students are sexually active, and of thosewho are, more are waiting longer to have sex. MostAboriginal students have strong connections to theirfamilies and schools, and two-thirds want to com-plete post secondary education.
Still, we need to do more to promote health amongAboriginal youth, ensure they feel safe at school andin the community, have optimistic aspirations forthe future, and have the skills, resilience and confi-dence to achieve these goals.
The McCreary Centre Society and the AboriginalYouth Health Project Advisory Committee hopethat Aboriginal communities can use the survey re-sults to build on their strengths and resources,enhance capacity, and design health promotion strat-egies for youth.
12 � Raven�s Children II: Aboriginal Youth Health in B.C.
About the Survey
Raven�s Children II is based on answers from 4,800 Aboriginal students whoanswered the AHS surveys
What is the Adolescent Health Survey?The Adolescent Health Survey (AHS) is the largeststudy of the physical and emotional health of B.C.youth, and of factors that influence health duringadolescence and throughout life.
The McCreary Centre Society, a non-government,non-profit research organization, conducted the firstAdolescent Health Survey in 1992, with close to16,000 students in grades seven to 12, in most re-gions of B.C. Nearly 26,000 students participatedin the 1998 survey, and more than 30,500 studentscompleted the 2003 AHS. In total, over 70,000 stu-dents completed surveys over a decade, providinginformation about trends among B.C.�s youth.
The fourth provincial Adolescent Health Survey isplanned for 2008.
What does the survey ask?The 2003 survey asked students 140 questions abouthealth problems, practices that promote good health,and risky behaviours, such as drug and tobacco use,unprotected sexual activity, or drinking and driving.Students filled out the questionnaire in school class-rooms during one class period. Participation wasvoluntary and anonymous. No one could tell howany individual student answered the questions. Eachschool district arranged for parental or guardianconsent to allow students to participate.
Responses were analyzed using current statisticaltechniques. Government agencies, health profes-sionals, schools and community organizations usethe survey information in planning programs, poli-cies and services for youth. And survey results havebeen published in a number of provincial, regionaland special interest reports and fact sheets (see page53 for a list).
The McCreary Centre Society � 13
Who is the Raven�s Children II reportabout?Raven�s Children II is based on answers from approxi-mately 4,800 students who identified themselves asAboriginal in the AHS surveys in 1992, 1998 and2003. The survey was not designed specifically forAboriginal students, and the questionnaire did notinclude language or content unique to Aboriginalculture, or any other particular cultural group.
Overall, students chosen to participate in the sur-vey were selected to be representative of all B.C.youth in grades seven to 12. Public schools in bothurban and rural areas participated in the survey. Thefinal study results are based on the responses ofstudents actually in school on the day the surveywas given.
Aboriginal students continue to leave school at ayounger age than other students in B.C. For thisreason, the Aboriginal students who participated inthe Adolescent Health Survey may be different insome ways from Aboriginal youth in the same agegroup who are no longer in school.
Additional surveys of Aboriginal youth�includingthose who have left school�are needed to create amore complete profile of all Aboriginal young peo-ple. McCreary conducted a survey of youth incustody in 2004, and plans to survey street youth in2006. Because these two groups include a large pro-portion of Aboriginal youth, data from the newsurveys will provide valuable information aboutAboriginal youth who did not participate in theschool-based survey.
Defining AboriginalA question in the Adolescent Health Survey asksstudents to identify their ethnic identity, using a listof choices. In 2003, 2,478 students checked a boxon the questionnaire identifying themselves as be-ing �Aboriginal/First Nations,� or a box marked�other,� and wrote a specific Aboriginal group. Thesurvey allowed more than one response for ethnicidentity; students could check more than one cat-egory if they identified themselves as having mixedancestry. The questionnaire did not ask for infor-mation about whether students were status,non-status or Metis.
In 1998, 1,699 students identified themselves as�Aboriginal/First Nations,� and 672 studentsmarked the category �North American Indian,� inthe 1992 survey. (The wording of the ethnicity ques-tion was different on each AHS.)
In 1992, about 4% of students who responded tothe AHS were Aboriginal. In both 1998 and 2003,Aboriginal students represented 8% of the overallsample. (According to the B.C. Ministry of Educa-tion, 8.4% of all public school students inkindergarden to grade 12 were of Aboriginal originin the 2003/04 school year.)
Forty-six percent of the Aboriginal students whofilled out the 2003 survey were male; 54% were fe-male. Aboriginal students participating in the surveywere not evenly distributed across grades and ages,unlike non-Aboriginal students. Instead, the pro-
portion of Aboriginal students decreases as age orgrade increases; 21% of Aboriginal students werein grade seven, 18% in grade eight, 18% in gradenine, 15% in grade 10, 14% in grade 11, and 14% ingrade 12.
14 � Raven�s Children II: Aboriginal Youth Health in B.C.
Family ConnectionsSample question on family backgroundHow much have you learned about Aboriginal culture and heritage from your family, school or community?
Family backgroundMore than half (53%) of Aboriginal youth in schoolwho responded to the Adolescent Health SurveyIII said their heritage was solely Aboriginal, while47% said they were of combined Aboriginal andother heritage. Almost all Aboriginal students (97%)were born in Canada, and 94% have lived in Canadaall their lives.
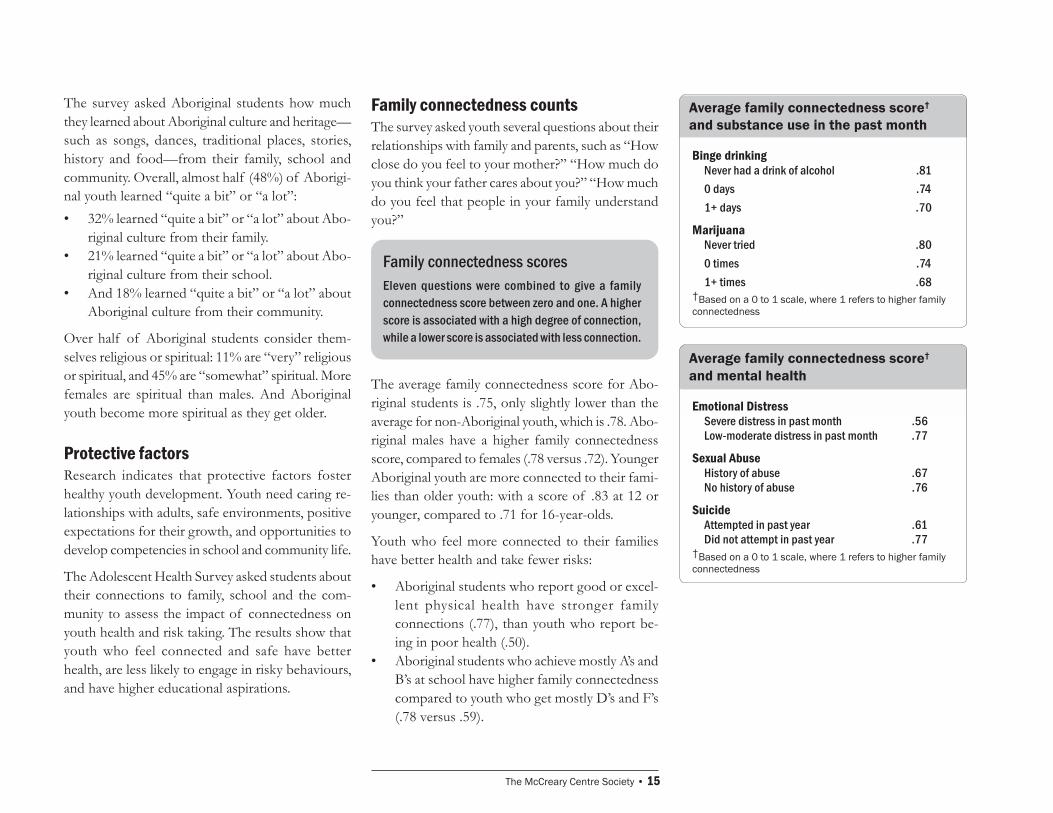
More than half of Aboriginal youth in school (53%)live with two parents most of the time, and 35%
live with one parent. Overall, 17% reported livingwith both parents, but at different times.
Seventeen percent of Aboriginal youth said theycurrently live on a reserve, while 28% have lived ona reserve at some point in their life. (Page 44 com-pares health data for youth living on and off reserve.)
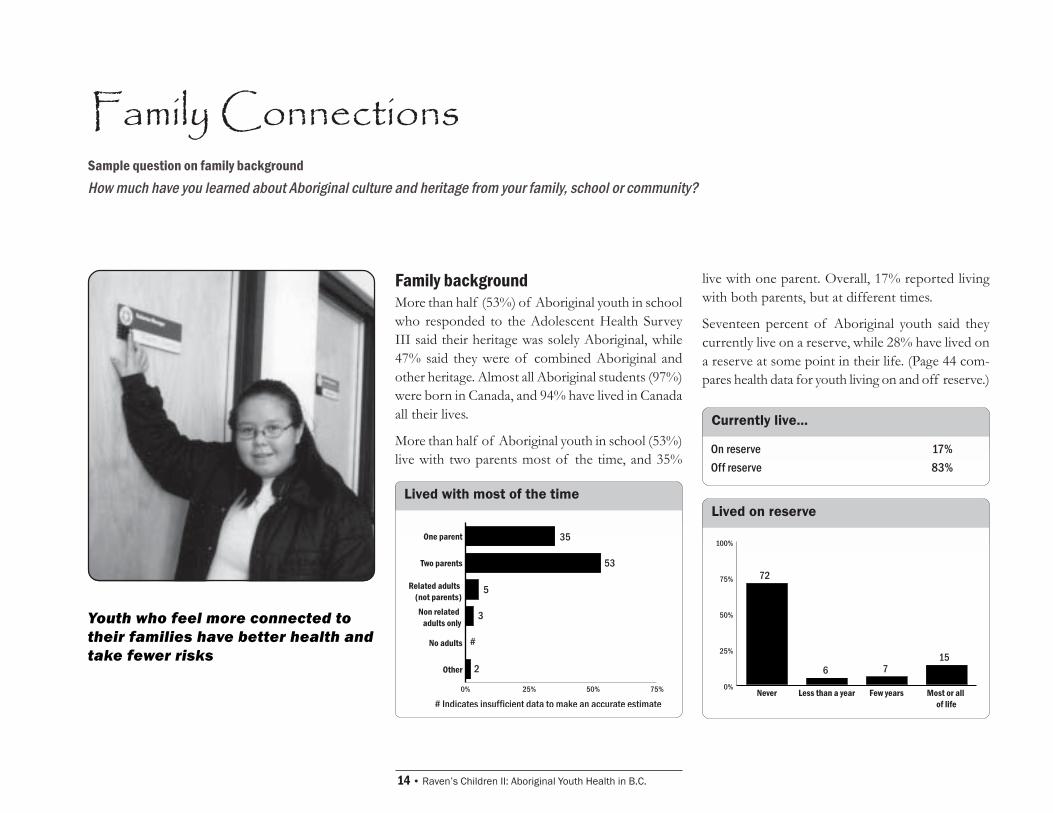
Youth who feel more connected totheir families have better health andtake fewer risks
Lived on reserve
0%
25%
50%
75%
100%
72
6 715
Most or all of life
Few yearsLess than a yearNever
Lived with most of the time
Currently live...
On reserve 17%Off reserve 83%
0% 25% 50% 75%
Other
No adults
Non related adults only
Related adults (not parents)
Two parents
One parent 35
53
5
3
2
#
# Indicates insufficient data to make an accurate estimate
The McCreary Centre Society � 15
Family connectedness countsThe survey asked youth several questions about theirrelationships with family and parents, such as �Howclose do you feel to your mother?� �How much doyou think your father cares about you?� �How muchdo you feel that people in your family understandyou?�
The survey asked Aboriginal students how muchthey learned about Aboriginal culture and heritage�such as songs, dances, traditional places, stories,history and food�from their family, school andcommunity. Overall, almost half (48%) of Aborigi-nal youth learned �quite a bit� or �a lot�:� 32% learned �quite a bit� or �a lot� about Abo-
riginal culture from their family.� 21% learned �quite a bit� or �a lot� about Abo-
riginal culture from their school.� And 18% learned �quite a bit� or �a lot� about
Aboriginal culture from their community.
Over half of Aboriginal students consider them-selves religious or spiritual: 11% are �very� religiousor spiritual, and 45% are �somewhat� spiritual. Morefemales are spiritual than males. And Aboriginalyouth become more spiritual as they get older.
Protective factorsResearch indicates that protective factors fosterhealthy youth development. Youth need caring re-lationships with adults, safe environments, positiveexpectations for their growth, and opportunities todevelop competencies in school and community life.
The Adolescent Health Survey asked students abouttheir connections to family, school and the com-munity to assess the impact of connectedness onyouth health and risk taking. The results show thatyouth who feel connected and safe have betterhealth, are less likely to engage in risky behaviours,and have higher educational aspirations.
Average family connectedness score�
and substance use in the past month
Binge drinkingNever had a drink of alcohol .810 days .741+ days .70
MarijuanaNever tried .800 times .741+ times .68
�Based on a 0 to 1 scale, where 1 refers to higher familyconnectedness
Average family connectedness score�
and mental health
Emotional DistressSevere distress in past month .56Low-moderate distress in past month .77
Sexual AbuseHistory of abuse .67No history of abuse .76
SuicideAttempted in past year .61Did not attempt in past year .77
�Based on a 0 to 1 scale, where 1 refers to higher familyconnectedness
Family connectedness scoresEleven questions were combined to give a familyconnectedness score between zero and one. A higherscore is associated with a high degree of connection,while a lower score is associated with less connection.
The average family connectedness score for Abo-riginal students is .75, only slightly lower than theaverage for non-Aboriginal youth, which is .78. Abo-riginal males have a higher family connectednessscore, compared to females (.78 versus .72). YoungerAboriginal youth are more connected to their fami-lies than older youth: with a score of .83 at 12 oryounger, compared to .71 for 16-year-olds.
Youth who feel more connected to their familieshave better health and take fewer risks:
� Aboriginal students who report good or excel-lent physical health have stronger familyconnections (.77), than youth who report be-ing in poor health (.50).
� Aboriginal students who achieve mostly A�s andB�s at school have higher family connectednesscompared to youth who get mostly D�s and F�s(.78 versus .59).
16 � Raven�s Children II: Aboriginal Youth Health in B.C.
� Substance use is associated with lower familyconnectedness. For example, current smokershave lower family connectedness (.67), com-pared to non-smokers (.78).
� Likewise, binge drinkers and marijuana usershave lower family connectedness scores.
� Aboriginal youth who�ve had sexual intercoursealso had a lower connectedness score (.70), thanthose who did not have sex (.78).
Three-quarters of Aboriginal youth (75%) said oneof their parents was at home when they woke up inthe morning on all five school days; 41% said oneof their parents was there when they came homefrom school on all five school days; and 21% neverhad a parent at home when they got home fromschool on all five school days.
More than half of Aboriginal students (55%) saidone of their parents was in the room while they atetheir evening meal on all five school days, while 12%never had a parent in the room when they ate din-ner. The majority (80%) of Aboriginal youth saidone of their parents was home when they went tobed on all five school days.
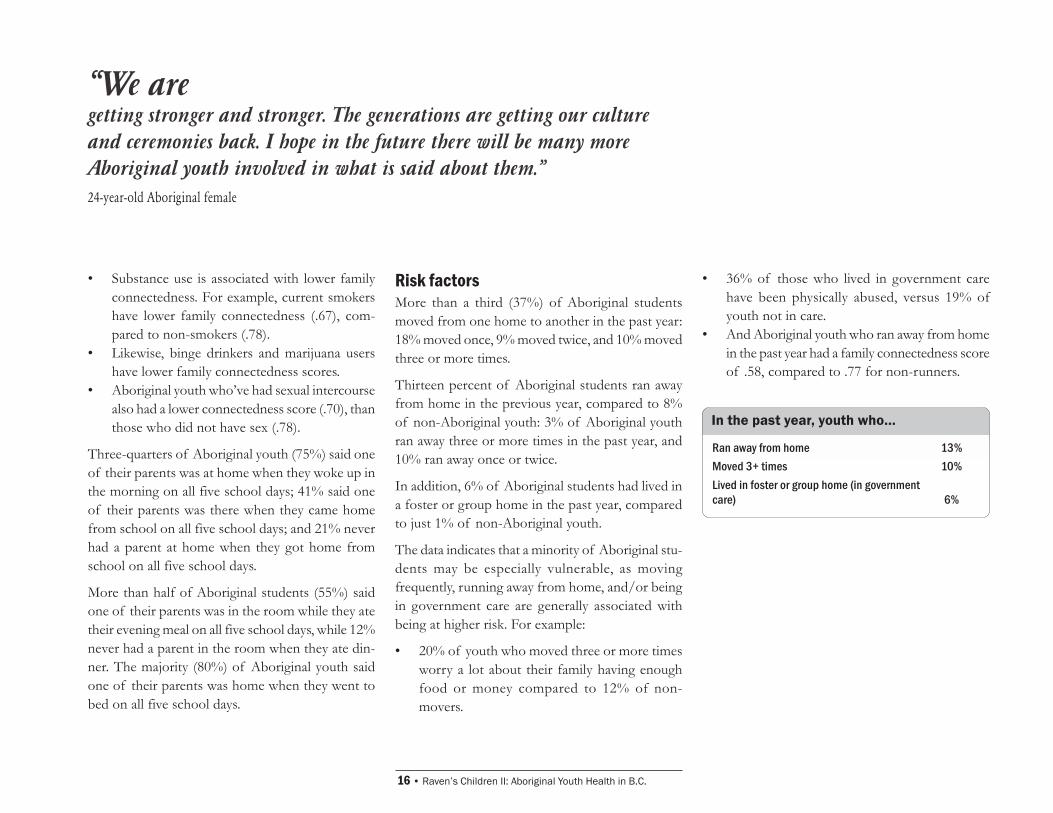
Risk factorsMore than a third (37%) of Aboriginal studentsmoved from one home to another in the past year:18% moved once, 9% moved twice, and 10% movedthree or more times.
Thirteen percent of Aboriginal students ran awayfrom home in the previous year, compared to 8%of non-Aboriginal youth: 3% of Aboriginal youthran away three or more times in the past year, and10% ran away once or twice.
In addition, 6% of Aboriginal students had lived ina foster or group home in the past year, comparedto just 1% of non-Aboriginal youth.
The data indicates that a minority of Aboriginal stu-dents may be especially vulnerable, as movingfrequently, running away from home, and/or beingin government care are generally associated withbeing at higher risk. For example:
� 20% of youth who moved three or more timesworry a lot about their family having enoughfood or money compared to 12% of non-movers.
Ran away from home 13%Moved 3+ times 10%Lived in foster or group home (in governmentcare) 6%
In the past year, youth who�
�We aregetting stronger and stronger. The generations are getting our cultureand ceremonies back. I hope in the future there will be many moreAboriginal youth involved in what is said about them.�24-year-old Aboriginal female
� 36% of those who lived in government carehave been physically abused, versus 19% ofyouth not in care.
� And Aboriginal youth who ran away from homein the past year had a family connectedness scoreof .58, compared to .77 for non-runners.
The McCreary Centre Society � 17
Education
Two-thirds of Aboriginal studentsexpect to graduate from a post-secondary institution
Sample question on educationWhen do you expect to finish your education?
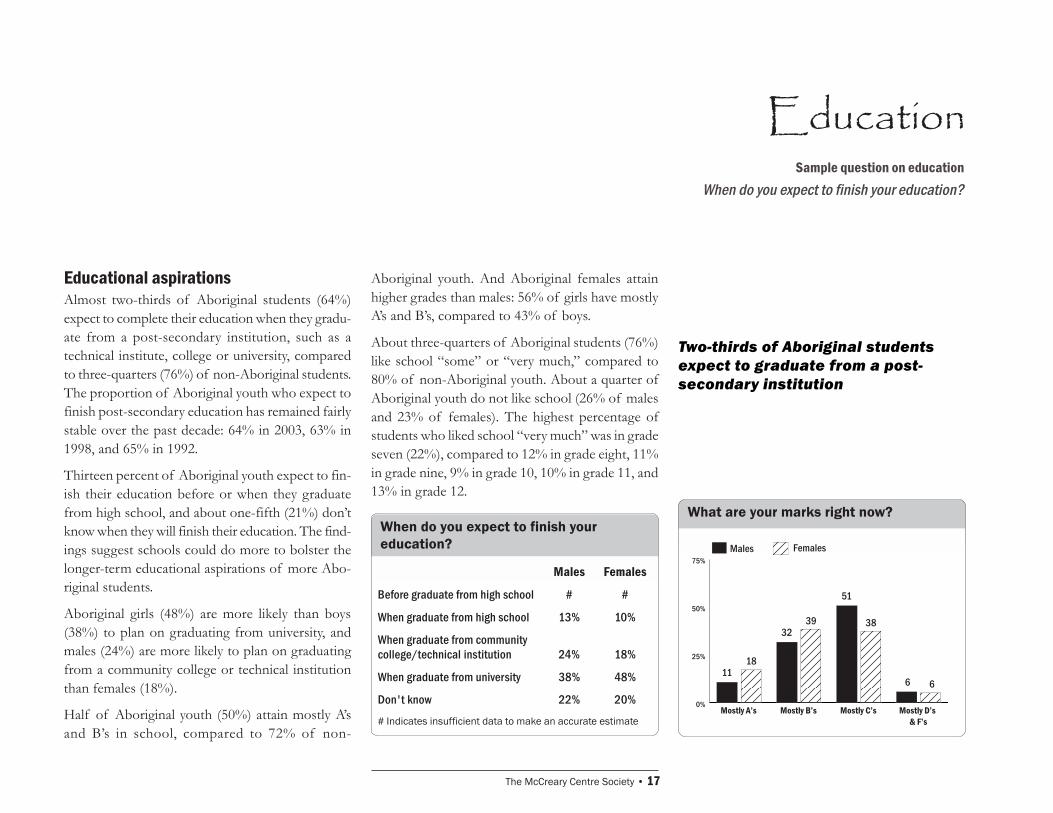
Educational aspirationsAlmost two-thirds of Aboriginal students (64%)expect to complete their education when they gradu-ate from a post-secondary institution, such as atechnical institute, college or university, comparedto three-quarters (76%) of non-Aboriginal students.The proportion of Aboriginal youth who expect tofinish post-secondary education has remained fairlystable over the past decade: 64% in 2003, 63% in1998, and 65% in 1992.
Thirteen percent of Aboriginal youth expect to fin-ish their education before or when they graduatefrom high school, and about one-fifth (21%) don�tknow when they will finish their education. The find-ings suggest schools could do more to bolster thelonger-term educational aspirations of more Abo-riginal students.
Aboriginal girls (48%) are more likely than boys(38%) to plan on graduating from university, andmales (24%) are more likely to plan on graduatingfrom a community college or technical institutionthan females (18%).
Half of Aboriginal youth (50%) attain mostly A�sand B�s in school, compared to 72% of non-
Aboriginal youth. And Aboriginal females attainhigher grades than males: 56% of girls have mostlyA�s and B�s, compared to 43% of boys.
About three-quarters of Aboriginal students (76%)like school �some� or �very much,� compared to80% of non-Aboriginal youth. About a quarter ofAboriginal youth do not like school (26% of malesand 23% of females). The highest percentage ofstudents who liked school �very much� was in gradeseven (22%), compared to 12% in grade eight, 11%in grade nine, 9% in grade 10, 10% in grade 11, and13% in grade 12.
What are your marks right now?When do you expect to finish youreducation?
Males Females
Before graduate from high school # #
When graduate from high school 13% 10%
When graduate from communitycollege/technical institution 24% 18%
When graduate from university 38% 48%
Don't know 22% 20%
# Indicates insufficient data to make an accurate estimate
0%
25%
50%
75%
18
39 38
611
32
51
6
FemalesMales
Mostly D�s & F�s
Mostly C�sMostly B�sMostly A�s
18 � Raven�s Children II: Aboriginal Youth Health in B.C.
School connectednessThe survey asked youth about their feelings towardsschool and their relationships with teachers andpeers; for example, �How much do you feel yourteachers care about you?� �Since school started thisyear, how often have you had trouble getting alongwith other students?�
Average school connectedness score�
Average school connectedness score�
among youth who �
Grade 7 Grade 8 Grade 9 Grade 10 Grade 11 Grade 12.67 .60 .60 .61 .64 .67
�Based on a 0 to 1 scale where 1 refers to higher schoolconnectedness
RacismExperienced racism in past year .58Did not experience racism in past year .65
Emotional DistressSevere distress in past month .49Low-moderate distress in past month .65
Marijuana useUsed marijuana 3+ times in past month .57Never used marijuana .67
�Based on a 0 to 1 scale, where 1 refers to higher schoolconnectedness
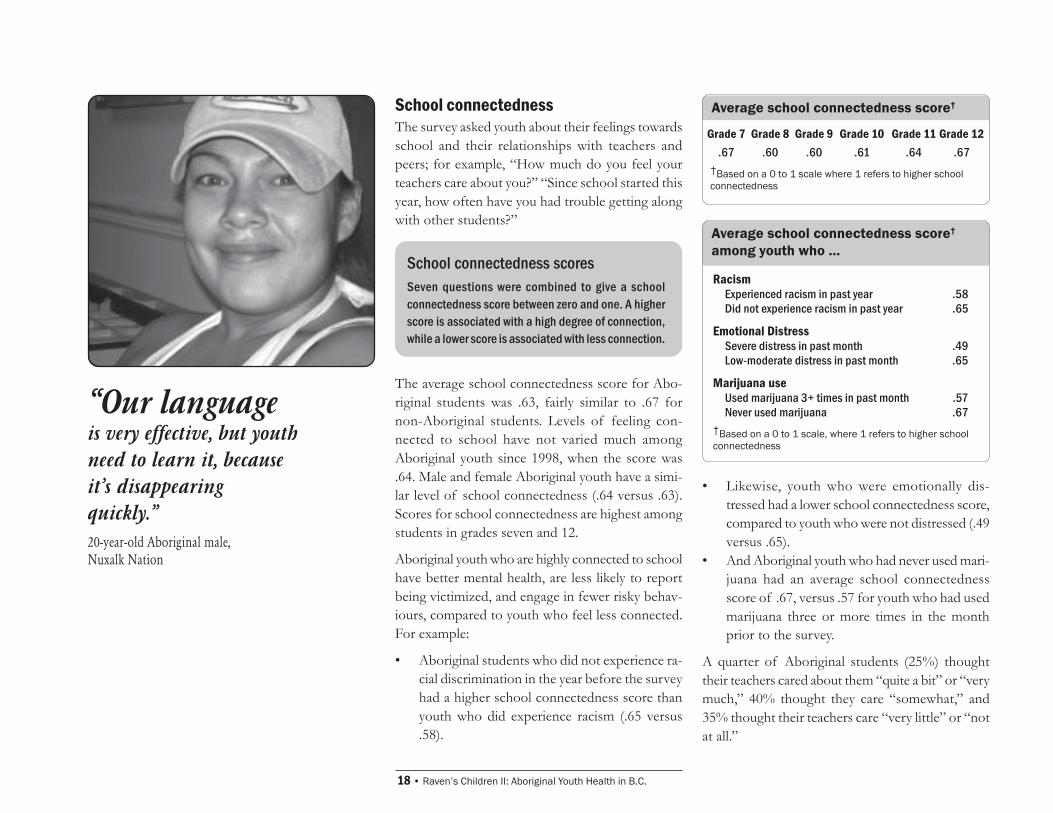
�Our languageis very effective, but youthneed to learn it, becauseit�s disappearingquickly.�20-year-old Aboriginal male,Nuxalk Nation
School connectedness scoresSeven questions were combined to give a schoolconnectedness score between zero and one. A higherscore is associated with a high degree of connection,while a lower score is associated with less connection.
� Likewise, youth who were emotionally dis-tressed had a lower school connectedness score,compared to youth who were not distressed (.49versus .65).
� And Aboriginal youth who had never used mari-juana had an average school connectednessscore of .67, versus .57 for youth who had usedmarijuana three or more times in the monthprior to the survey.
A quarter of Aboriginal students (25%) thoughttheir teachers cared about them �quite a bit� or �verymuch,� 40% thought they care �somewhat,� and35% thought their teachers care �very little� or �notat all.�
The average school connectedness score for Abo-riginal students was .63, fairly similar to .67 fornon-Aboriginal students. Levels of feeling con-nected to school have not varied much amongAboriginal youth since 1998, when the score was.64. Male and female Aboriginal youth have a simi-lar level of school connectedness (.64 versus .63).Scores for school connectedness are highest amongstudents in grades seven and 12.
Aboriginal youth who are highly connected to schoolhave better mental health, are less likely to reportbeing victimized, and engage in fewer risky behav-iours, compared to youth who feel less connected.For example:
� Aboriginal students who did not experience ra-cial discrimination in the year before the surveyhad a higher school connectedness score thanyouth who did experience racism (.65 versus.58).
The McCreary Centre Society � 19
�All Aboriginal youthare not what you think. They need to be listened to and given a chanceto speak their minds. Aboriginal youth need healing within theirfamilies and themselves, and a place to go within schools to get extrahelp with schoolwork and support. Doing volunteer work and being apart of the school made me feel good about myself. More volunteeractivities are needed within schools.�19-year-old female,Heiltsuk Nation
As well, 28% of Aboriginal youth never had trou-ble getting along with other students at school, while11% had trouble getting along with other studentsalmost everyday or everyday.
Skipping schoolFifty-nine percent of Aboriginal youth neverskipped or cut classes in the month before the sur-vey, 26% skipped once or twice, 12% skipped threeto 10 times, and 3% skipped 11 times or more. Therewas no difference between males and females withskipping school.
Skipping school increases by grade: from 4% ofAboriginal youth in grade seven who skipped threetimes or more in the previous month, to 16% ingrade eight, 13% in grade nine, 14% in grade 10,22% in grade 11, and 32% in grade 12.
As the frequency of skipping school increases, per-formance at school declines. Among Aboriginalyouth who did not skip school, 60% attained mostlyA�s and B�s, compared to 28% of youth who skippedthree times or more. School connectedness also de-clines, from .66 among students who never skippedschool, to .54 among those who skipped three timesor more.
Why school countsThe AHS confirms that B.C. must find better ways to encourage Aboriginal students to finish high school, andcontinue with post secondary education.
Staying in school is important, because of the connection between education and success in later life. Studentswho finish high school, especially those who go on to college or university, nearly always have a better chance for amore secure, healthier future. Dropping out of school can lead to unemployment or low-paying jobs, poor housingand limited opportunities�factors that help determine physical and emotional health.
Yet Aboriginal youth are less likely than other adolescents to finish high school, or to go on to higher levels oftraining or education. According to the BC Ministry of Education, in 2002/03, just 46% of Aboriginal studentscompleted grade 12 within six years of grade eight, compared to 82% of non-Aboriginal students.
Among Aboriginal students who do complete grade 12, not enough write the provincial exams. For example, 5% ofAboriginal students wrote and passed the Mathematics 12 provincial exam, versus 27% of non-Aboriginal stu-dents, and 31% of Aboriginal students wrote English 12, compared to 65% of non-Aboriginal students. Withoutpassing the provincial exams, Aboriginal students have greater difficulty getting into post-secondary educationand training.
However, there are some encouraging trends. The number of Aboriginal students receiving a Dogwood Diploma (anadult grade 12 graduation diploma) continues to increase. The six-year Dogwood completion rate for Aboriginalsincreased about 9%, from 37% to 46%, between 1998/99 and 2002/03, almost twice the increase for non-Aboriginals (76% to 81%).
20 � Raven�s Children II: Aboriginal Youth Health in B.C.
Community InvolvementSample question on community involvementIn the past 12 months, did you help others without pay?
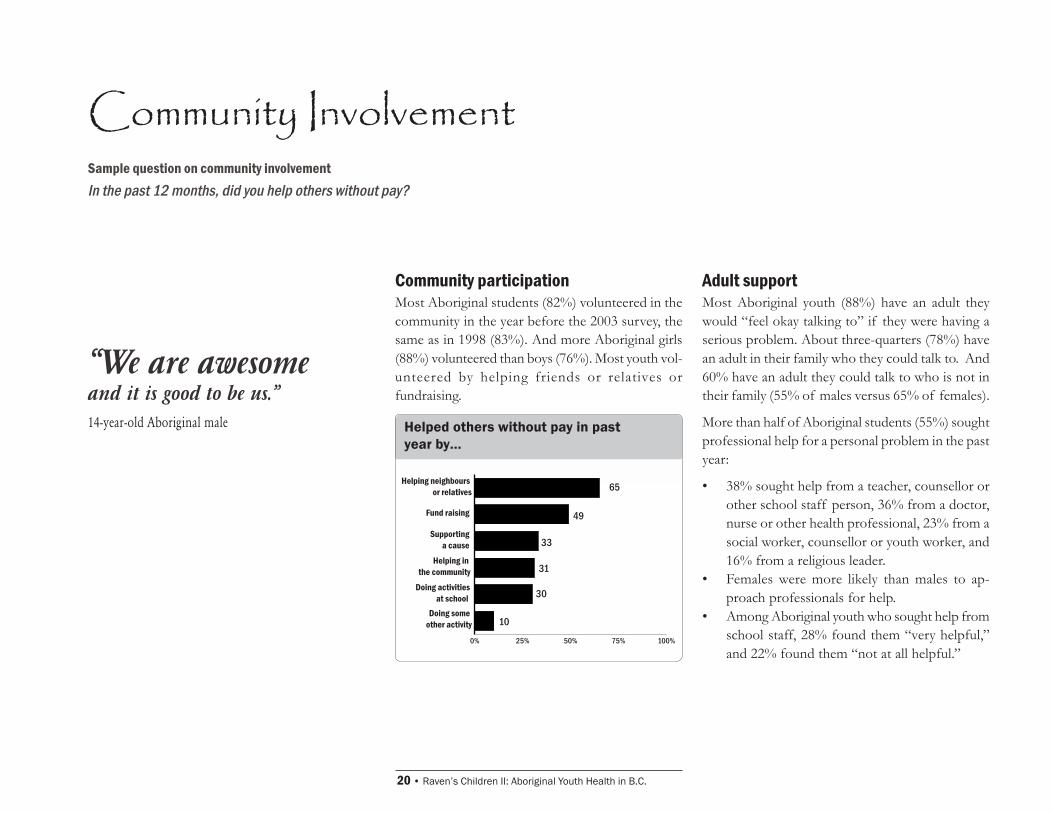
Community participationMost Aboriginal students (82%) volunteered in thecommunity in the year before the 2003 survey, thesame as in 1998 (83%). And more Aboriginal girls(88%) volunteered than boys (76%). Most youth vol-unteered by helping friends or relatives orfundraising.
Helped others without pay in pastyear by�
Adult supportMost Aboriginal youth (88%) have an adult theywould �feel okay talking to� if they were having aserious problem. About three-quarters (78%) havean adult in their family who they could talk to. And60% have an adult they could talk to who is not intheir family (55% of males versus 65% of females).
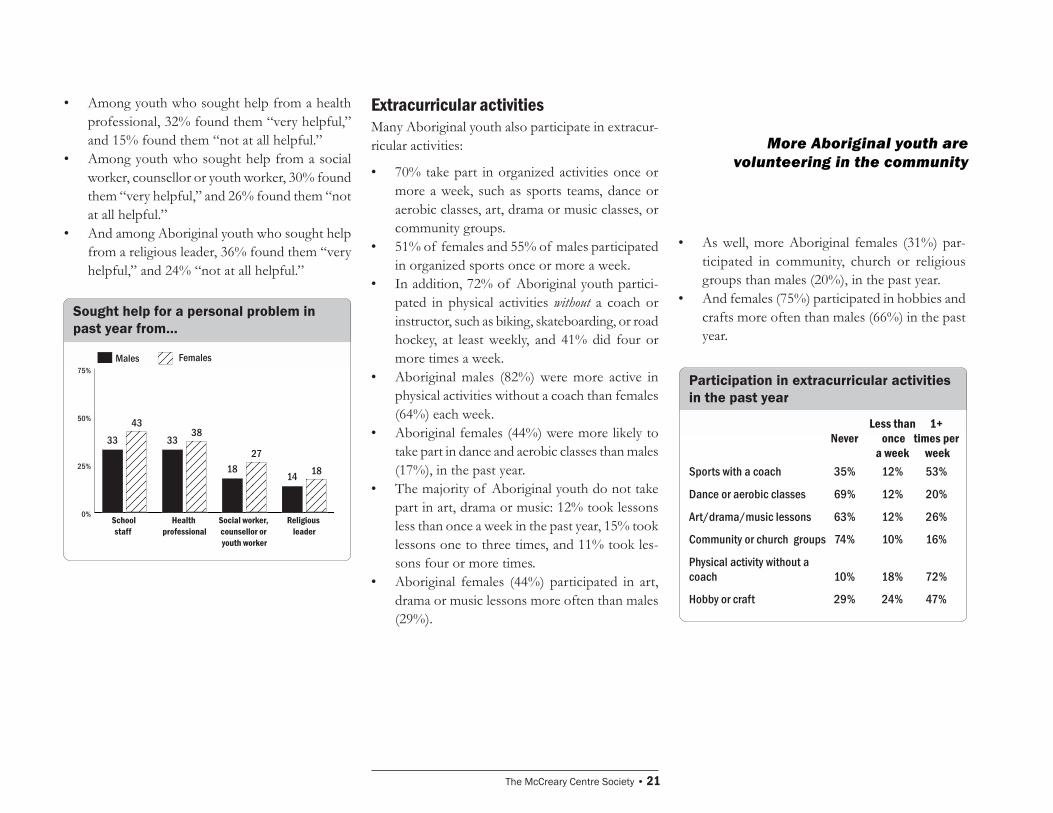
More than half of Aboriginal students (55%) soughtprofessional help for a personal problem in the pastyear:
� 38% sought help from a teacher, counsellor orother school staff person, 36% from a doctor,nurse or other health professional, 23% from asocial worker, counsellor or youth worker, and16% from a religious leader.
� Females were more likely than males to ap-proach professionals for help.
� Among Aboriginal youth who sought help fromschool staff, 28% found them �very helpful,�and 22% found them �not at all helpful.�
�We are awesomeand it is good to be us.�14-year-old Aboriginal male
0% 25% 50% 75% 100%
Doing some other activity
Doing activities at school
Helping in the community
Supporting a cause
Fund raising
Helping neighbours or relatives 65
49
33
31
10
30
The McCreary Centre Society � 21
More Aboriginal youth arevolunteering in the community
Sought help for a personal problem inpast year from�
� Among youth who sought help from a healthprofessional, 32% found them �very helpful,�and 15% found them �not at all helpful.�
� Among youth who sought help from a socialworker, counsellor or youth worker, 30% foundthem �very helpful,� and 26% found them �notat all helpful.�
� And among Aboriginal youth who sought helpfrom a religious leader, 36% found them �veryhelpful,� and 24% �not at all helpful.�
Participation in extracurricular activitiesin the past year
� As well, more Aboriginal females (31%) par-ticipated in community, church or religiousgroups than males (20%), in the past year.
� And females (75%) participated in hobbies andcrafts more often than males (66%) in the pastyear.
Less than 1+Never once times per
a week weekSports with a coach 35% 12% 53%
Dance or aerobic classes 69% 12% 20%
Art/drama/music lessons 63% 12% 26%
Community or church groups 74% 10% 16%
Physical activity without acoach 10% 18% 72%
Hobby or craft 29% 24% 47%
Extracurricular activitiesMany Aboriginal youth also participate in extracur-ricular activities:
� 70% take part in organized activities once ormore a week, such as sports teams, dance oraerobic classes, art, drama or music classes, orcommunity groups.
� 51% of females and 55% of males participatedin organized sports once or more a week.
� In addition, 72% of Aboriginal youth partici-pated in physical activities without a coach orinstructor, such as biking, skateboarding, or roadhockey, at least weekly, and 41% did four ormore times a week.
� Aboriginal males (82%) were more active inphysical activities without a coach than females(64%) each week.
� Aboriginal females (44%) were more likely totake part in dance and aerobic classes than males(17%), in the past year.
� The majority of Aboriginal youth do not takepart in art, drama or music: 12% took lessonsless than once a week in the past year, 15% tooklessons one to three times, and 11% took les-sons four or more times.
� Aboriginal females (44%) participated in art,drama or music lessons more often than males(29%).
0%
25%
50%
75%
4338
2718
33 33
1814
FemalesMales
Religious leader
Social worker, counsellor or youth worker
Health professional
School staff
22 � Raven�s Children II: Aboriginal Youth Health in B.C.
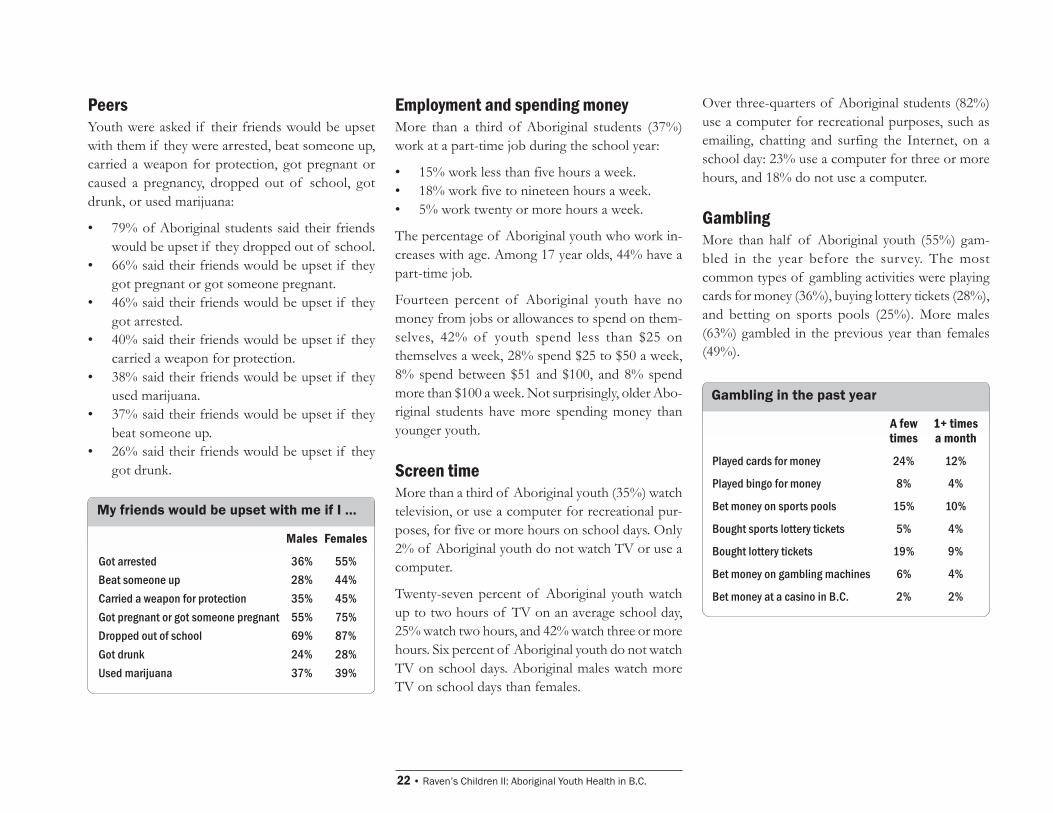
PeersYouth were asked if their friends would be upsetwith them if they were arrested, beat someone up,carried a weapon for protection, got pregnant orcaused a pregnancy, dropped out of school, gotdrunk, or used marijuana:
� 79% of Aboriginal students said their friendswould be upset if they dropped out of school.
� 66% said their friends would be upset if theygot pregnant or got someone pregnant.
� 46% said their friends would be upset if theygot arrested.
� 40% said their friends would be upset if theycarried a weapon for protection.
� 38% said their friends would be upset if theyused marijuana.
� 37% said their friends would be upset if theybeat someone up.
� 26% said their friends would be upset if theygot drunk.
My friends would be upset with me if I �
Males Females
Got arrested 36% 55%Beat someone up 28% 44%Carried a weapon for protection 35% 45%Got pregnant or got someone pregnant 55% 75%Dropped out of school 69% 87%Got drunk 24% 28%Used marijuana 37% 39%
Over three-quarters of Aboriginal students (82%)use a computer for recreational purposes, such asemailing, chatting and surfing the Internet, on aschool day: 23% use a computer for three or morehours, and 18% do not use a computer.
GamblingMore than half of Aboriginal youth (55%) gam-bled in the year before the survey. The mostcommon types of gambling activities were playingcards for money (36%), buying lottery tickets (28%),and betting on sports pools (25%). More males(63%) gambled in the previous year than females(49%).
Gambling in the past year
Employment and spending moneyMore than a third of Aboriginal students (37%)work at a part-time job during the school year:
� 15% work less than five hours a week.� 18% work five to nineteen hours a week.� 5% work twenty or more hours a week.
The percentage of Aboriginal youth who work in-creases with age. Among 17 year olds, 44% have apart-time job.
Fourteen percent of Aboriginal youth have nomoney from jobs or allowances to spend on them-selves, 42% of youth spend less than $25 onthemselves a week, 28% spend $25 to $50 a week,8% spend between $51 and $100, and 8% spendmore than $100 a week. Not surprisingly, older Abo-riginal students have more spending money thanyounger youth.
Screen timeMore than a third of Aboriginal youth (35%) watchtelevision, or use a computer for recreational pur-poses, for five or more hours on school days. Only2% of Aboriginal youth do not watch TV or use acomputer.
Twenty-seven percent of Aboriginal youth watchup to two hours of TV on an average school day,25% watch two hours, and 42% watch three or morehours. Six percent of Aboriginal youth do not watchTV on school days. Aboriginal males watch moreTV on school days than females.
A few 1+ timestimes a month
Played cards for money 24% 12%
Played bingo for money 8% 4%
Bet money on sports pools 15% 10%
Bought sports lottery tickets 5% 4%
Bought lottery tickets 19% 9%
Bet money on gambling machines 6% 4%
Bet money at a casino in B.C. 2% 2%
The McCreary Centre Society � 23
SmokingSample question on tobacco use
During the past 30 days, on how many days did you smoke cigarettes?
Smoking has declined dramaticallyamong Aboriginal youth
Smoking definitionsNon-smoker � has never smoked a cigarette
Experimental smoker � has smoked fewer than100 cigarettes
Current smoker � has smoked 100 or morecigarettes, and smoked in the past month
Former smoker � used to smoke, but has quit
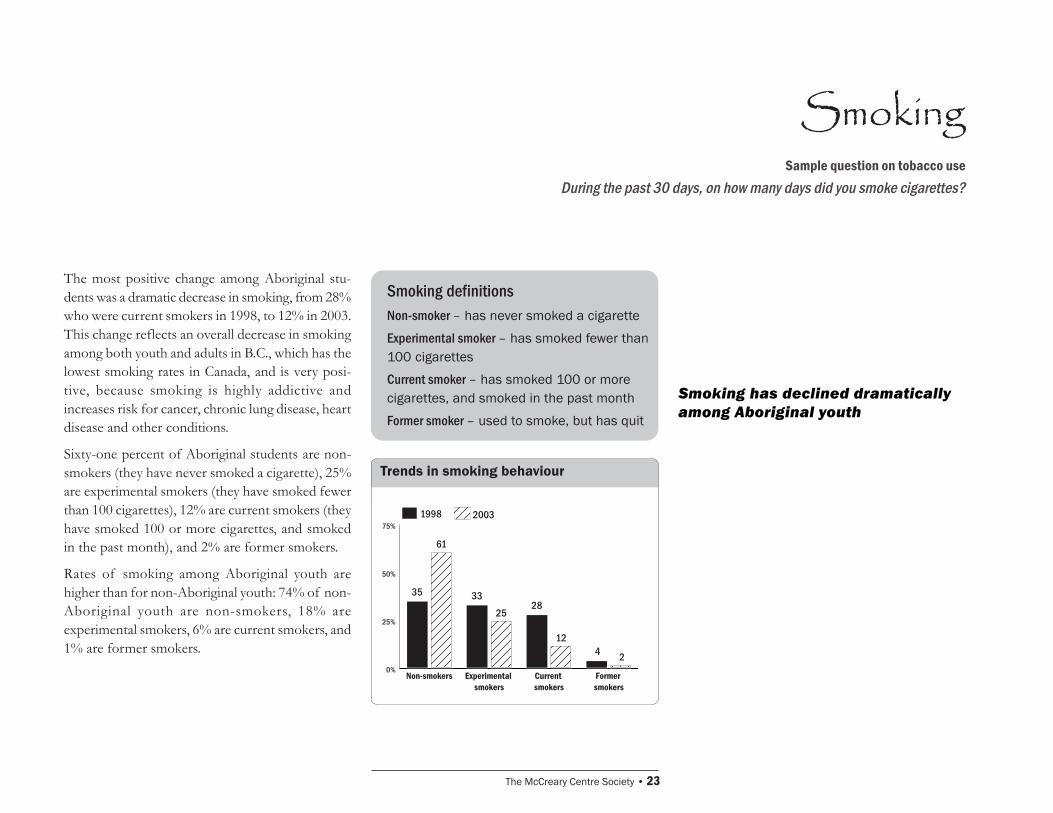
The most positive change among Aboriginal stu-dents was a dramatic decrease in smoking, from 28%who were current smokers in 1998, to 12% in 2003.This change reflects an overall decrease in smokingamong both youth and adults in B.C., which has thelowest smoking rates in Canada, and is very posi-tive, because smoking is highly addictive andincreases risk for cancer, chronic lung disease, heartdisease and other conditions.
Sixty-one percent of Aboriginal students are non-smokers (they have never smoked a cigarette), 25%are experimental smokers (they have smoked fewerthan 100 cigarettes), 12% are current smokers (theyhave smoked 100 or more cigarettes, and smokedin the past month), and 2% are former smokers.
Rates of smoking among Aboriginal youth arehigher than for non-Aboriginal youth: 74% of non-Aboriginal youth are non-smokers, 18% areexperimental smokers, 6% are current smokers, and1% are former smokers.
Trends in smoking behaviour
0%
25%
50%
75%
61
25
12
2
35 3328
4
20031998
Former smokers
Current smokers
Experimental smokers
Non-smokers
24 � Raven�s Children II: Aboriginal Youth Health in B.C.
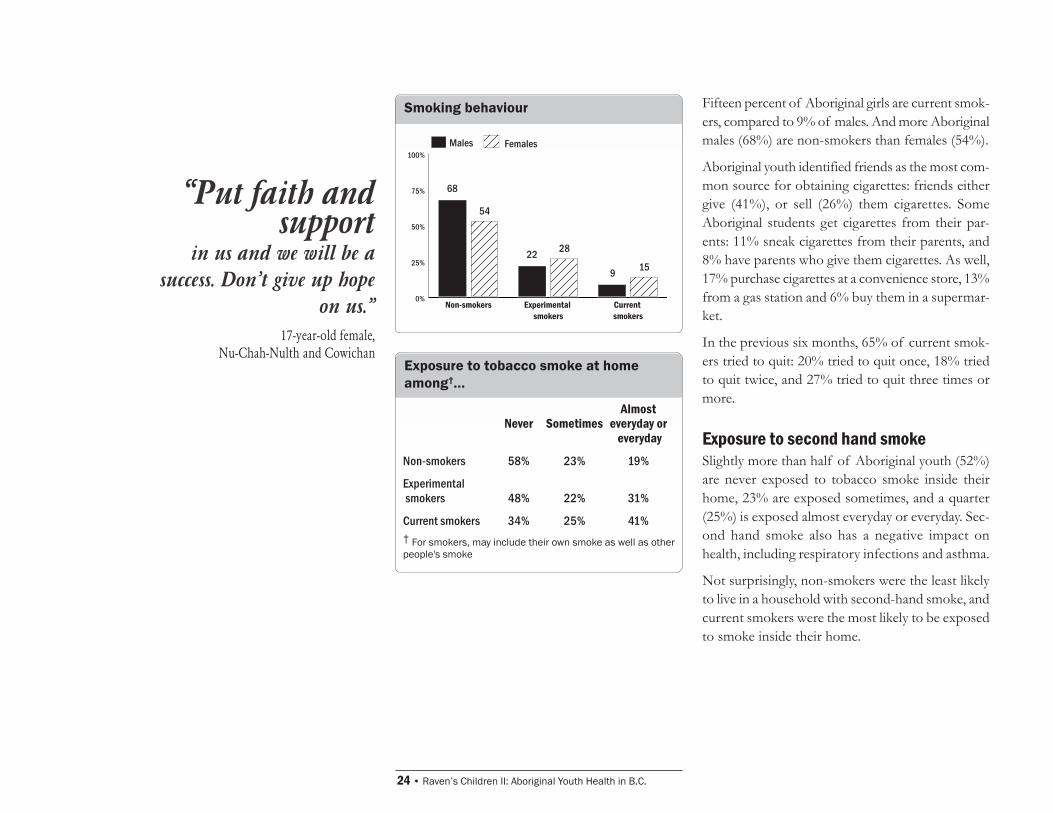
Smoking behaviour Fifteen percent of Aboriginal girls are current smok-ers, compared to 9% of males. And more Aboriginalmales (68%) are non-smokers than females (54%).
Aboriginal youth identified friends as the most com-mon source for obtaining cigarettes: friends eithergive (41%), or sell (26%) them cigarettes. SomeAboriginal students get cigarettes from their par-ents: 11% sneak cigarettes from their parents, and8% have parents who give them cigarettes. As well,17% purchase cigarettes at a convenience store, 13%from a gas station and 6% buy them in a supermar-ket.
In the previous six months, 65% of current smok-ers tried to quit: 20% tried to quit once, 18% triedto quit twice, and 27% tried to quit three times ormore.
Exposure to second hand smokeSlightly more than half of Aboriginal youth (52%)are never exposed to tobacco smoke inside theirhome, 23% are exposed sometimes, and a quarter(25%) is exposed almost everyday or everyday. Sec-ond hand smoke also has a negative impact onhealth, including respiratory infections and asthma.
Not surprisingly, non-smokers were the least likelyto live in a household with second-hand smoke, andcurrent smokers were the most likely to be exposedto smoke inside their home.
Exposure to tobacco smoke at homeamong��
AlmostNever Sometimes everyday or
everyday
Non-smokers 58% 23% 19%
Experimental smokers 48% 22% 31%
Current smokers 34% 25% 41%� For smokers, may include their own smoke as well as otherpeople's smoke
�Put faith andsupport
in us and we will be asuccess. Don�t give up hope
on us.�17-year-old female,
Nu-Chah-Nulth and Cowichan
0%
25%
50%
75%
100%
54
28
15
68
22
9
FemalesMales
Current smokers
Experimental smokers
Non-smokers
The McCreary Centre Society � 25
Physical HealthSample question on physical health
In general, how would you describe your health?
Most Aboriginal students continue torate their health as good orexcellent
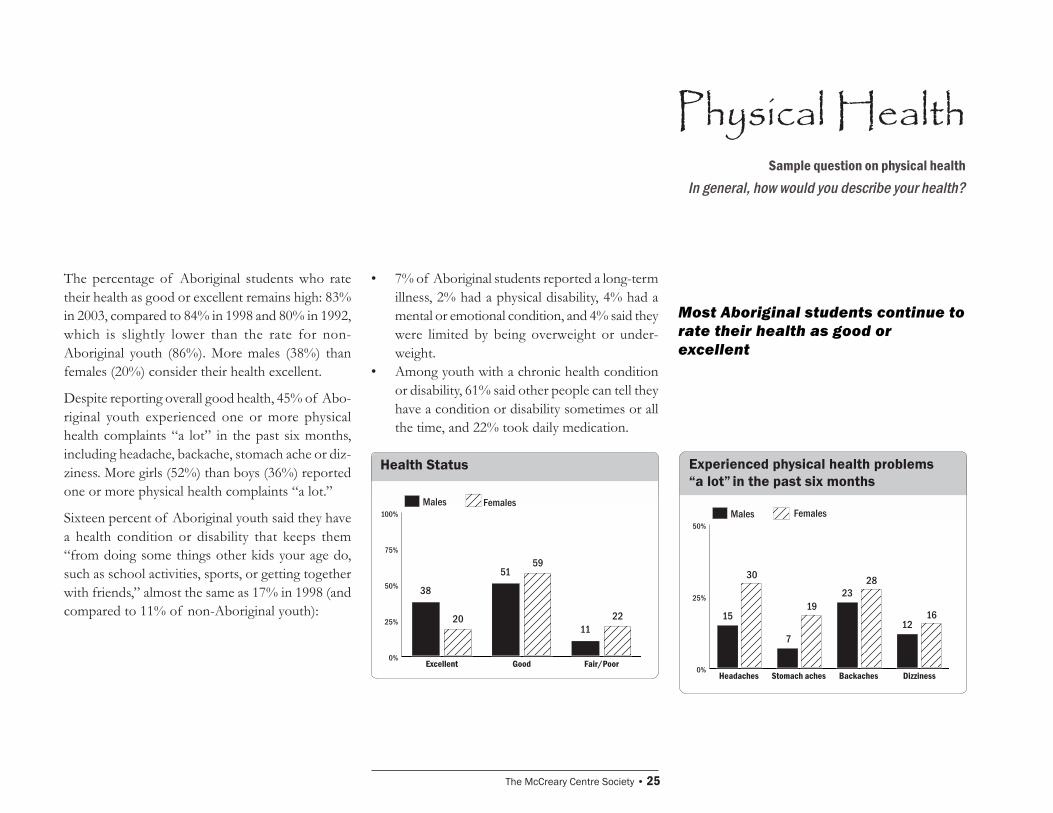
The percentage of Aboriginal students who ratetheir health as good or excellent remains high: 83%in 2003, compared to 84% in 1998 and 80% in 1992,which is slightly lower than the rate for non-Aboriginal youth (86%). More males (38%) thanfemales (20%) consider their health excellent.
Despite reporting overall good health, 45% of Abo-riginal youth experienced one or more physicalhealth complaints �a lot� in the past six months,including headache, backache, stomach ache or diz-ziness. More girls (52%) than boys (36%) reportedone or more physical health complaints �a lot.�
Sixteen percent of Aboriginal youth said they havea health condition or disability that keeps them�from doing some things other kids your age do,such as school activities, sports, or getting togetherwith friends,� almost the same as 17% in 1998 (andcompared to 11% of non-Aboriginal youth):
� 7% of Aboriginal students reported a long-termillness, 2% had a physical disability, 4% had amental or emotional condition, and 4% said theywere limited by being overweight or under-weight.
� Among youth with a chronic health conditionor disability, 61% said other people can tell theyhave a condition or disability sometimes or allthe time, and 22% took daily medication.
Health Status Experienced physical health problems�a lot� in the past six months
0%
25%
50%
75%
100%
20
59
22
38
51
11
FemalesMales
Fair/PoorGoodExcellent0%
25%
50%
30
19
28
1615
7
23
12
FemalesMales
DizzinessBackaches Stomach aches Headaches
26 � Raven�s Children II: Aboriginal Youth Health in B.C.
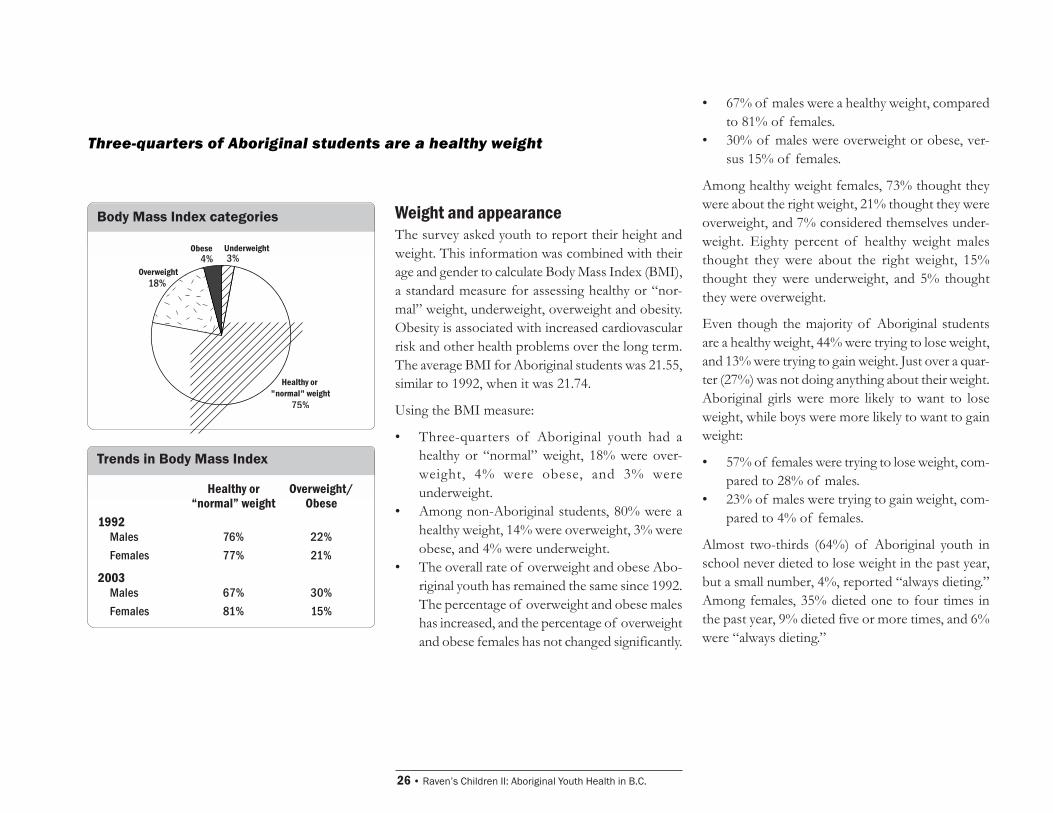
Weight and appearanceThe survey asked youth to report their height andweight. This information was combined with theirage and gender to calculate Body Mass Index (BMI),a standard measure for assessing healthy or �nor-mal� weight, underweight, overweight and obesity.Obesity is associated with increased cardiovascularrisk and other health problems over the long term.The average BMI for Aboriginal students was 21.55,similar to 1992, when it was 21.74.
Using the BMI measure:
� Three-quarters of Aboriginal youth had ahealthy or �normal� weight, 18% were over-weight, 4% were obese, and 3% wereunderweight.
� Among non-Aboriginal students, 80% were ahealthy weight, 14% were overweight, 3% wereobese, and 4% were underweight.
� The overall rate of overweight and obese Abo-riginal youth has remained the same since 1992.The percentage of overweight and obese maleshas increased, and the percentage of overweightand obese females has not changed significantly.
� 67% of males were a healthy weight, comparedto 81% of females.
� 30% of males were overweight or obese, ver-sus 15% of females.
Among healthy weight females, 73% thought theywere about the right weight, 21% thought they wereoverweight, and 7% considered themselves under-weight. Eighty percent of healthy weight malesthought they were about the right weight, 15%thought they were underweight, and 5% thoughtthey were overweight.
Even though the majority of Aboriginal studentsare a healthy weight, 44% were trying to lose weight,and 13% were trying to gain weight. Just over a quar-ter (27%) was not doing anything about their weight.Aboriginal girls were more likely to want to loseweight, while boys were more likely to want to gainweight:
� 57% of females were trying to lose weight, com-pared to 28% of males.
� 23% of males were trying to gain weight, com-pared to 4% of females.
Almost two-thirds (64%) of Aboriginal youth inschool never dieted to lose weight in the past year,but a small number, 4%, reported �always dieting.�Among females, 35% dieted one to four times inthe past year, 9% dieted five or more times, and 6%were �always dieting.�
Three-quarters of Aboriginal students are a healthy weight
Body Mass Index categories
Obese
Overweight
Healthy or "normal" weight
Underweight3%4%
18%
75%
Healthy or Overweight/�normal� weight Obese
1992Males 76% 22%Females 77% 21%
2003Males 67% 30%Females 81% 15%
Trends in Body Mass Index
The McCreary Centre Society � 27
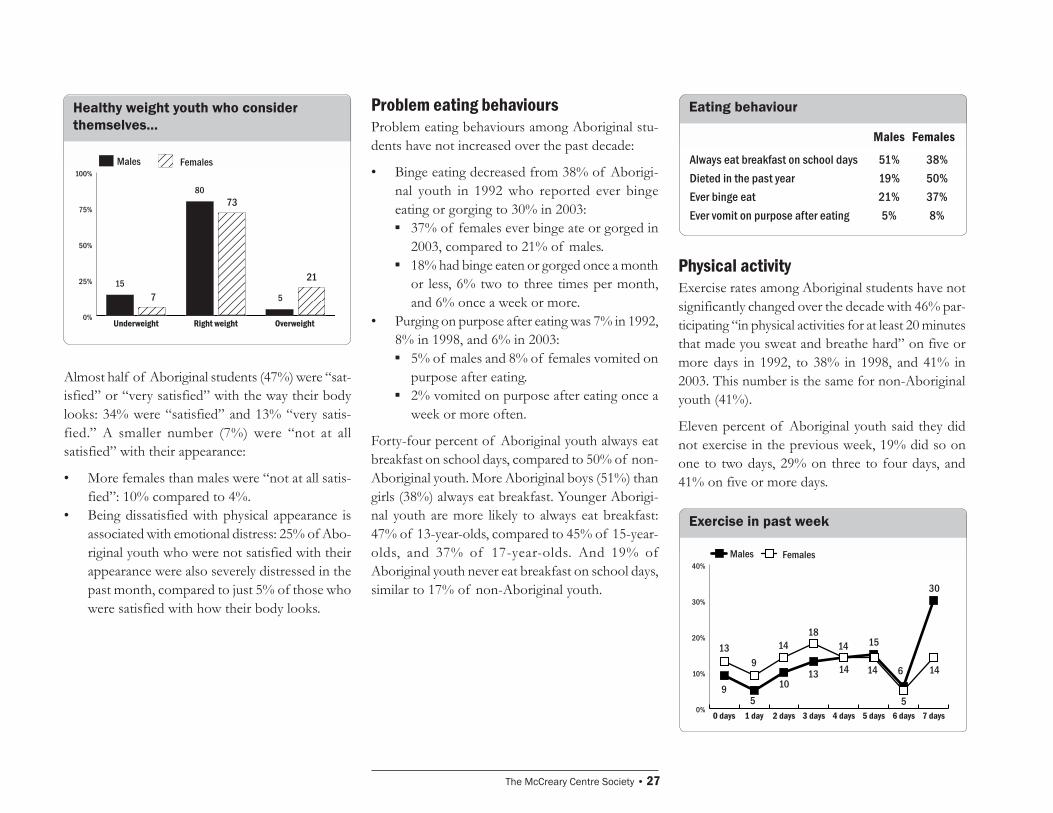
Almost half of Aboriginal students (47%) were �sat-isfied� or �very satisfied� with the way their bodylooks: 34% were �satisfied� and 13% �very satis-fied.� A smaller number (7%) were �not at allsatisfied� with their appearance:
� More females than males were �not at all satis-fied�: 10% compared to 4%.
� Being dissatisfied with physical appearance isassociated with emotional distress: 25% of Abo-riginal youth who were not satisfied with theirappearance were also severely distressed in thepast month, compared to just 5% of those whowere satisfied with how their body looks.
Males Females
Always eat breakfast on school days 51% 38%Dieted in the past year 19% 50%Ever binge eat 21% 37%Ever vomit on purpose after eating 5% 8%
Eating behaviourHealthy weight youth who considerthemselves...
0%
25%
50%
75%
100%
7
73
2115
80
5
FemalesMales
Overweight Right weightUnderweight
Problem eating behavioursProblem eating behaviours among Aboriginal stu-dents have not increased over the past decade:
� Binge eating decreased from 38% of Aborigi-nal youth in 1992 who reported ever bingeeating or gorging to 30% in 2003:! 37% of females ever binge ate or gorged in
2003, compared to 21% of males.! 18% had binge eaten or gorged once a month
or less, 6% two to three times per month,and 6% once a week or more.
� Purging on purpose after eating was 7% in 1992,8% in 1998, and 6% in 2003:! 5% of males and 8% of females vomited on
purpose after eating.! 2% vomited on purpose after eating once a
week or more often.
Forty-four percent of Aboriginal youth always eatbreakfast on school days, compared to 50% of non-Aboriginal youth. More Aboriginal boys (51%) thangirls (38%) always eat breakfast. Younger Aborigi-nal youth are more likely to always eat breakfast:47% of 13-year-olds, compared to 45% of 15-year-olds, and 37% of 17-year-olds. And 19% ofAboriginal youth never eat breakfast on school days,similar to 17% of non-Aboriginal youth.
Physical activityExercise rates among Aboriginal students have notsignificantly changed over the decade with 46% par-ticipating �in physical activities for at least 20 minutesthat made you sweat and breathe hard� on five ormore days in 1992, to 38% in 1998, and 41% in2003. This number is the same for non-Aboriginalyouth (41%).
Eleven percent of Aboriginal youth said they didnot exercise in the previous week, 19% did so onone to two days, 29% on three to four days, and41% on five or more days.
Exercise in past week
0%
10%
20%
30%
40%FemalesMales
7 days6 days5 days4 days3 days2 days1 day0 days
13
9
9
5
14
10
18
13
14
14
15
14 6
5
30
14
28 � Raven�s Children II: Aboriginal Youth Health in B.C.
Emotional Health
Youth who face discrimination experience more emotional distress thanthose who don�t
Physical and sexual abuse of Aboriginal studentshas steadily declined during the past decade, a verypositive development that bodes well for the ongo-ing emotional health of Aboriginal youth. However,the rate of abuse is still higher for Aboriginal thannon-Aboriginal youth, and abuse is linked to riskybehaviours among young people.
Too many Aboriginal youth continue to experienceracial discrimination, resulting in greater emotionaldistress among these students. And suicide rates haveremained consistent. The percentage of youth whoconsider or attempt suicide as a response to dis-tressing circumstances has not declined.
Sample question on emotional healthDuring the past 30 days, have you felt so sad, discouraged, hopeless or had so many problems thatyou wondered if anything was worthwhile?
The survey asks youth if they think they will live tobe 25 years old. This question is a marker for highrisk when youth answer no. The good news is al-most all Aboriginal youth (95%) believe they willlive to be at least this old. However, a small numberfeel they have no hope for the future: 5% of Abo-riginal youth do not expect to live to 25, and needspecial attention to help them build resilience andoptimism.
Emotional distress has increasedFive survey questions ask youth about their emo-tional health, and a response of �all the time� totwo or more questions is seen as an indicator ofserious emotional distress.
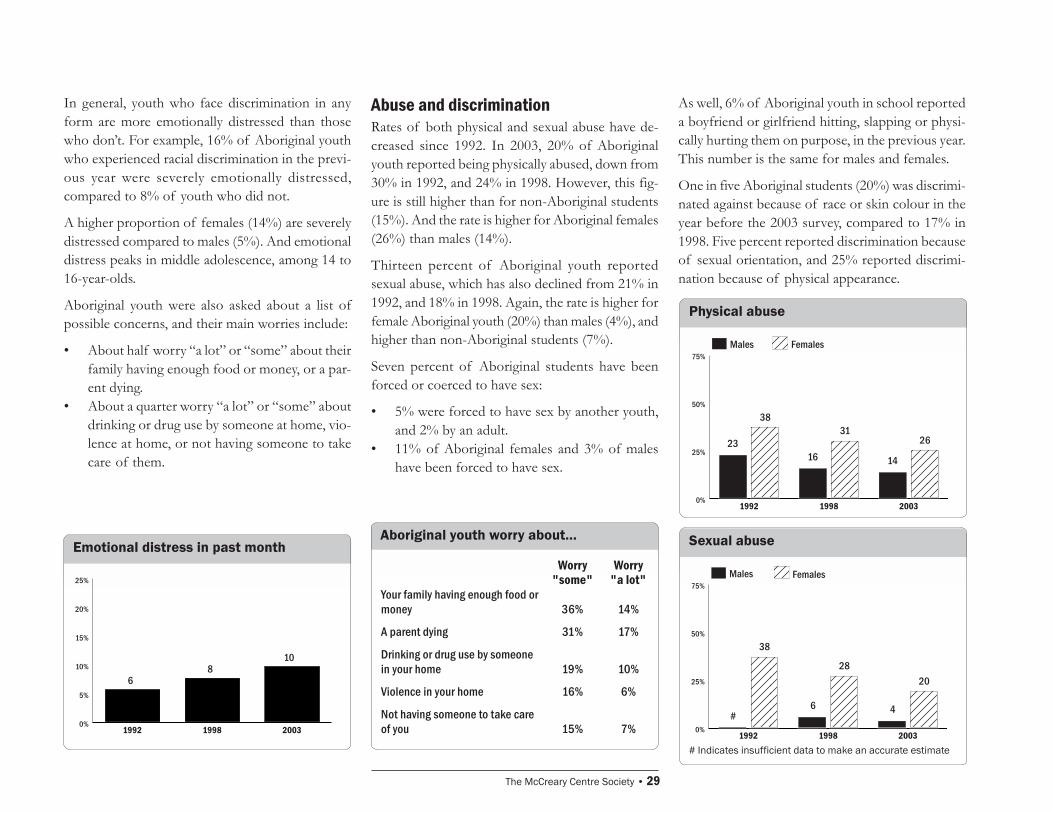
Unfortunately, emotional distress among Aborigi-nal students has increased over the past decade. Tenpercent of Aboriginal youth were severely distressedin the month before the 2003 survey, compared to6% in 1992. Emotional distress also increasedslightly among non-Aboriginal youth, from 6% in1992 to 8% in 2003.
Consequently, more protective factors that enhanceyoung people�s resilience and build community ca-pacity are needed to ensure Aboriginal youth havethe skills to cope with the challenges and stress ofadolescence and the transition to adulthood.
The McCreary Centre Society � 29
In general, youth who face discrimination in anyform are more emotionally distressed than thosewho don�t. For example, 16% of Aboriginal youthwho experienced racial discrimination in the previ-ous year were severely emotionally distressed,compared to 8% of youth who did not.
A higher proportion of females (14%) are severelydistressed compared to males (5%). And emotionaldistress peaks in middle adolescence, among 14 to16-year-olds.
Aboriginal youth were also asked about a list ofpossible concerns, and their main worries include:
� About half worry �a lot� or �some� about theirfamily having enough food or money, or a par-ent dying.
� About a quarter worry �a lot� or �some� aboutdrinking or drug use by someone at home, vio-lence at home, or not having someone to takecare of them.
Emotional distress in past month
0%
5%
10%
15%
20%
25%
6 8
10
200319981992
Aboriginal youth worry about�
Abuse and discriminationRates of both physical and sexual abuse have de-creased since 1992. In 2003, 20% of Aboriginalyouth reported being physically abused, down from30% in 1992, and 24% in 1998. However, this fig-ure is still higher than for non-Aboriginal students(15%). And the rate is higher for Aboriginal females(26%) than males (14%).
Thirteen percent of Aboriginal youth reportedsexual abuse, which has also declined from 21% in1992, and 18% in 1998. Again, the rate is higher forfemale Aboriginal youth (20%) than males (4%), andhigher than non-Aboriginal students (7%).
Seven percent of Aboriginal students have beenforced or coerced to have sex:
� 5% were forced to have sex by another youth,and 2% by an adult.
� 11% of Aboriginal females and 3% of maleshave been forced to have sex.
Physical abuse
Sexual abuse
As well, 6% of Aboriginal youth in school reporteda boyfriend or girlfriend hitting, slapping or physi-cally hurting them on purpose, in the previous year.This number is the same for males and females.
One in five Aboriginal students (20%) was discrimi-nated against because of race or skin colour in theyear before the 2003 survey, compared to 17% in1998. Five percent reported discrimination becauseof sexual orientation, and 25% reported discrimi-nation because of physical appearance.
Worry Worry"some" "a lot"
Your family having enough food ormoney 36% 14%
A parent dying 31% 17%
Drinking or drug use by someonein your home 19% 10%
Violence in your home 16% 6%
Not having someone to take careof you 15% 7%
0%
25%
50%
75%
3831
262316 14
FemalesMales
200319981992
0%
25%
50%
75%
38
2820
# 6 4
FemalesMales
200319981992# Indicates insufficient data to make an accurate estimate
30 � Raven�s Children II: Aboriginal Youth Health in B.C.
�Aboriginal youth express much concern about their past,present and future, about how they have and will live or �survive.� Ithink some negativity dominates, and hurt should never be forgotten,but with help to move on, even through history, Aboriginal youth mayfeel better about how they and their descendants will end up.�17-year-old female,Gwi�itchin and Inuvaliut
Suicide trends
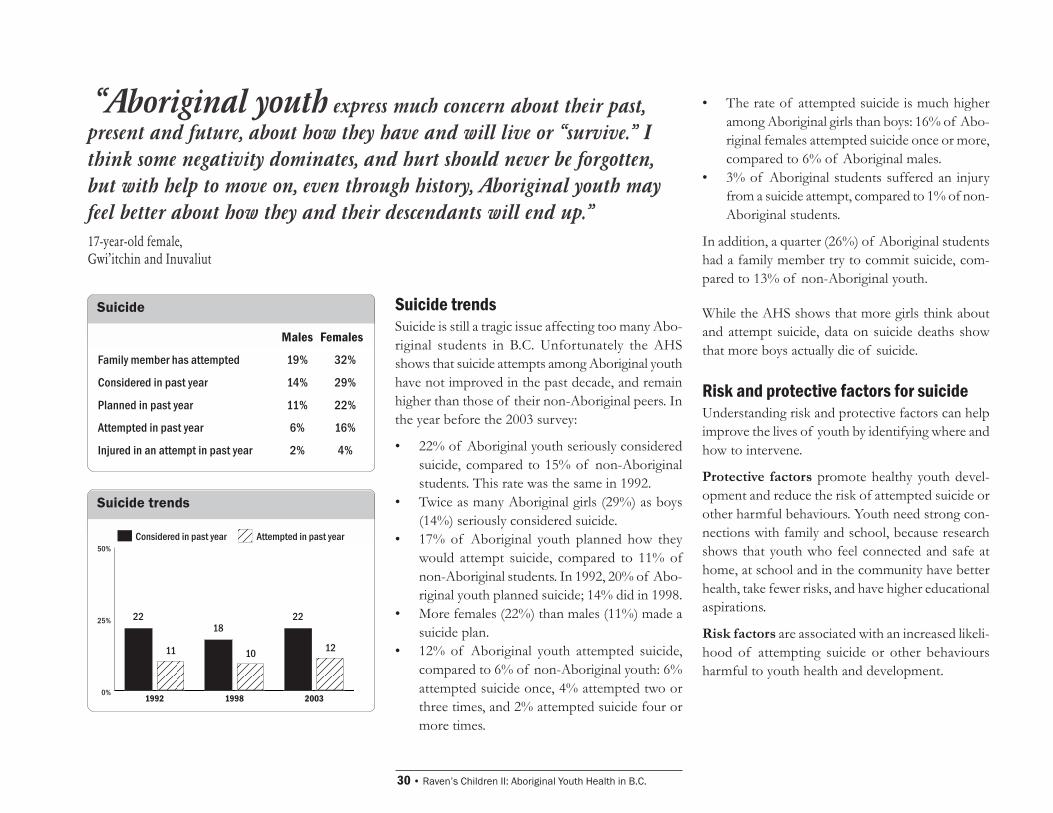
Males Females
Family member has attempted 19% 32%
Considered in past year 14% 29%
Planned in past year 11% 22%
Attempted in past year 6% 16%
Injured in an attempt in past year 2% 4%
Suicide Suicide trendsSuicide is still a tragic issue affecting too many Abo-riginal students in B.C. Unfortunately the AHSshows that suicide attempts among Aboriginal youthhave not improved in the past decade, and remainhigher than those of their non-Aboriginal peers. Inthe year before the 2003 survey:
� 22% of Aboriginal youth seriously consideredsuicide, compared to 15% of non-Aboriginalstudents. This rate was the same in 1992.
� Twice as many Aboriginal girls (29%) as boys(14%) seriously considered suicide.
� 17% of Aboriginal youth planned how theywould attempt suicide, compared to 11% ofnon-Aboriginal students. In 1992, 20% of Abo-riginal youth planned suicide; 14% did in 1998.
� More females (22%) than males (11%) made asuicide plan.
� 12% of Aboriginal youth attempted suicide,compared to 6% of non-Aboriginal youth: 6%attempted suicide once, 4% attempted two orthree times, and 2% attempted suicide four ormore times.
� The rate of attempted suicide is much higheramong Aboriginal girls than boys: 16% of Abo-riginal females attempted suicide once or more,compared to 6% of Aboriginal males.
� 3% of Aboriginal students suffered an injuryfrom a suicide attempt, compared to 1% of non-Aboriginal students.
In addition, a quarter (26%) of Aboriginal studentshad a family member try to commit suicide, com-pared to 13% of non-Aboriginal youth.
While the AHS shows that more girls think aboutand attempt suicide, data on suicide deaths showthat more boys actually die of suicide.
Risk and protective factors for suicideUnderstanding risk and protective factors can helpimprove the lives of youth by identifying where andhow to intervene.
Protective factors promote healthy youth devel-opment and reduce the risk of attempted suicide orother harmful behaviours. Youth need strong con-nections with family and school, because researchshows that youth who feel connected and safe athome, at school and in the community have betterhealth, take fewer risks, and have higher educationalaspirations.
Risk factors are associated with an increased likeli-hood of attempting suicide or other behavioursharmful to youth health and development.
0%
25%
50%
11 10 12
2218
22
Attempted in past yearConsidered in past year
200319981992
The McCreary Centre Society � 31
What risks increase the likelihood of Aboriginal boysattempting suicide?�
� SubsSubsSubsSubsSubstance use that causestance use that causestance use that causestance use that causestance use that causesprprprprproblemsoblemsoblemsoblemsoblems: Boys whosesubstance use has causedproblems at home, school or inthe community are 3.2 timesmore likely to attempt suicidethan boys without theseproblems.
� EvEvEvEvEver liver liver liver liver lived on resered on resered on resered on resered on reservvvvveeeee: Boyswho have lived on a reserveare 2.6 times more likely toattempt suicide than boys whohave not lived on reserve.
� FFFFFamily member has attamily member has attamily member has attamily member has attamily member has attemememememppppptttttedededededsuicidesuicidesuicidesuicidesuicide: Boys with a familymember who has attemptedsuicide are 2.5 times morelikely to attempt suicide thanboys who do not.
� RacismRacismRacismRacismRacism: Boys who haveexperienced racialdiscrimination are 1.8 timesmore likely to attempt suicidethan boys who have notexperienced racism.
� Binge drinkingBinge drinkingBinge drinkingBinge drinkingBinge drinking: Boys who bingedrink 3+ times a month are1.3 times more likely toattempt suicide than boys whodon�t.
What risks increase the likelihood of Aboriginal girlsattempting suicide?�
times more likely to attemptsuicide than girls who havenot been abused.
� Daily marijuana useDaily marijuana useDaily marijuana useDaily marijuana useDaily marijuana use: Girls whouse marijuana daily are 3.0times more likely to attemptsuicide than girls who do not.
� PhPhPhPhPhysical abuseysical abuseysical abuseysical abuseysical abuse: Girls whohave been physically abusedare 2.9 times more likely toattempt suicide than girls whohave not been abused.
� Binge drinkingBinge drinkingBinge drinkingBinge drinkingBinge drinking: Girls whobinge drink 3+ times in amonth are 2.5 times morelikely to attempt suicide thangirls who do not.
� RacismRacismRacismRacismRacism: Girls who haveexperienced racialdiscrimination are 2.1 timesmore likely to attempt suicidethan girls who have notexperienced racism.
� EvEvEvEvEver liver liver liver liver lived on resered on resered on resered on resered on reservvvvveeeee: Girlswho have lived on a reserveare 2.0 times more likely toattempt suicide than girls whohave not lived on reserve.
� SeSeSeSeSexual abusexual abusexual abusexual abusexual abuse: Boys who havebeen sexually abused are 9.9times more likely to attemptsuicide than boys who havenot been abused.
� Being victimizedBeing victimizedBeing victimizedBeing victimizedBeing victimized: Boys whohave experienceddiscrimination, beenharassed, purposely excludedand assaulted by peers atschool are 7.5 times morelikely to attempt suicide thanboys who have not beenvictimized.
� EmoEmoEmoEmoEmotional distional distional distional distional distresstresstresstresstress: Boys whoare emotionally distressed are7.1 times more likely toattempt suicide than boyswho are not distressed.
� PhPhPhPhPhysical abuseysical abuseysical abuseysical abuseysical abuse: Boys whohave been physically abusedare 5.0 times more likely toattempt suicide than boyswho have not been abused.
� FFFFFeeling unsafeeling unsafeeling unsafeeling unsafeeling unsafe at sce at sce at sce at sce at schoolhoolhoolhoolhool:Boys who feel unsafe atschool are 4.1 times morelikely to attempt suicide thanboys who feel safe.
� Being victimizedBeing victimizedBeing victimizedBeing victimizedBeing victimized: Girls whohave experienceddiscrimination, beenharassed, purposely excludedand assaulted by peers atschool are 7.5 times morelikely to attempt suicide thangirls who have not beenvictimized.
� EmoEmoEmoEmoEmotional distional distional distional distional distresstresstresstresstress: Girls whoare emotionally distressed are6.3 times more likely toattempt suicide than girls whoare not distressed.
� FFFFFeeling unsafeeling unsafeeling unsafeeling unsafeeling unsafe at sce at sce at sce at sce at schoolhoolhoolhoolhool: Girlswho feel unsafe at school are4.1 times more likely toattempt suicide than girls whofeel safe.
� SubsSubsSubsSubsSubstance use that causestance use that causestance use that causestance use that causestance use that causesprprprprproblemsoblemsoblemsoblemsoblems: Girls whosesubstance use has causedproblems at home, school orin the community are 3.3times more likely to attemptsuicide than girls withoutthese problems.
� SeSeSeSeSexual abuse:xual abuse:xual abuse:xual abuse:xual abuse: Girls who havebeen sexually abused are 3.0
�Each risk factor was individually compared to whether or not a youth had attempted suicide �Each risk factor was individually compared to whether or not a youth had attempted suicide
32 � Raven�s Children II: Aboriginal Youth Health in B.C.
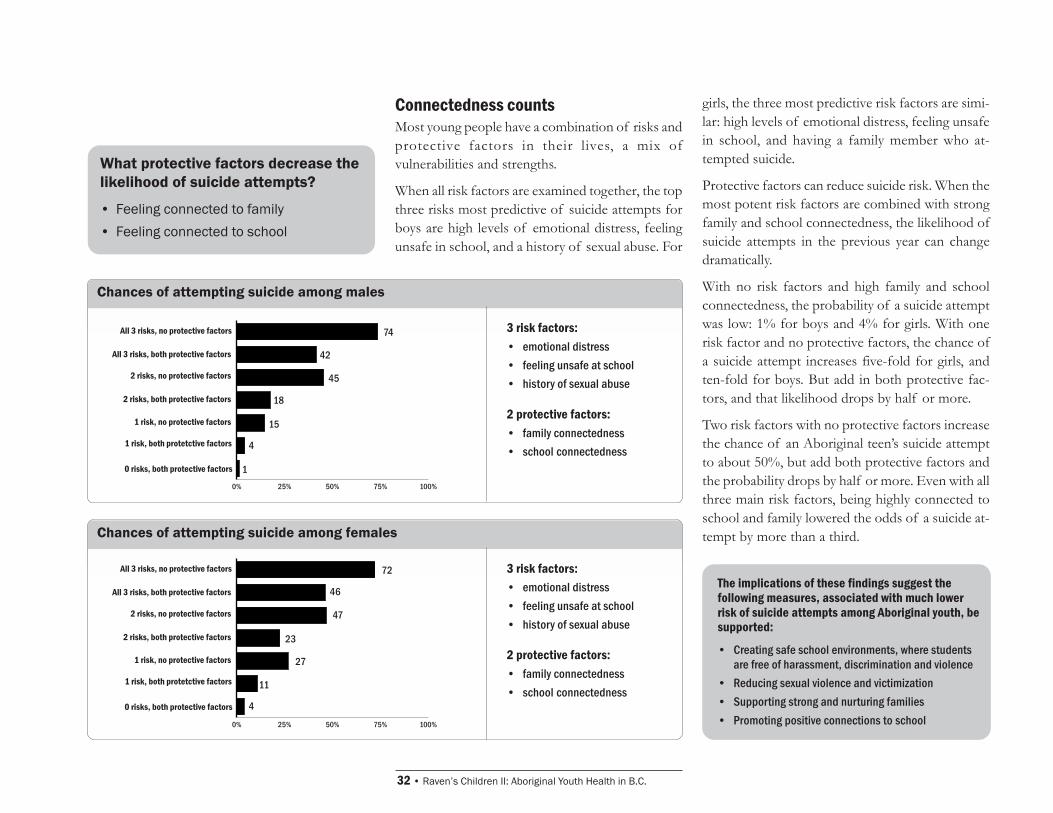
Chances of attempting suicide among males
3 risk factors:� emotional distress� feeling unsafe at school� history of sexual abuse
2 protective factors:� family connectedness� school connectedness
Chances of attempting suicide among females
3 risk factors:� emotional distress� feeling unsafe at school� history of sexual abuse
2 protective factors:� family connectedness� school connectedness
The implications of these findings suggest thefollowing measures, associated with much lowerrisk of suicide attempts among Aboriginal youth, besupported:
� Creating safe school environments, where studentsare free of harassment, discrimination and violence
� Reducing sexual violence and victimization� Supporting strong and nurturing families� Promoting positive connections to school
Connectedness countsMost young people have a combination of risks andprotective factors in their lives, a mix ofvulnerabilities and strengths.
When all risk factors are examined together, the topthree risks most predictive of suicide attempts forboys are high levels of emotional distress, feelingunsafe in school, and a history of sexual abuse. For
girls, the three most predictive risk factors are simi-lar: high levels of emotional distress, feeling unsafein school, and having a family member who at-tempted suicide.
Protective factors can reduce suicide risk. When themost potent risk factors are combined with strongfamily and school connectedness, the likelihood ofsuicide attempts in the previous year can changedramatically.
With no risk factors and high family and schoolconnectedness, the probability of a suicide attemptwas low: 1% for boys and 4% for girls. With onerisk factor and no protective factors, the chance ofa suicide attempt increases five-fold for girls, andten-fold for boys. But add in both protective fac-tors, and that likelihood drops by half or more.
Two risk factors with no protective factors increasethe chance of an Aboriginal teen�s suicide attemptto about 50%, but add both protective factors andthe probability drops by half or more. Even with allthree main risk factors, being highly connected toschool and family lowered the odds of a suicide at-tempt by more than a third.
What protective factors decrease thelikelihood of suicide attempts?
� Feeling connected to family
� Feeling connected to school
0% 25% 50% 75% 100%
0 risks, both protective factors
1 risk, both protetctive factors
1 risk, no protective factors
2 risks, both protective factors
2 risks, no protective factors
All 3 risks, both protective factors
All 3 risks, no protective factors 74
42
45
18
4
15
1
0% 25% 50% 75% 100%
0 risks, both protective factors
1 risk, both protetctive factors
1 risk, no protective factors
2 risks, both protective factors
2 risks, no protective factors
All 3 risks, both protective factors
All 3 risks, no protective factors 72
46
47
23
11
27
4
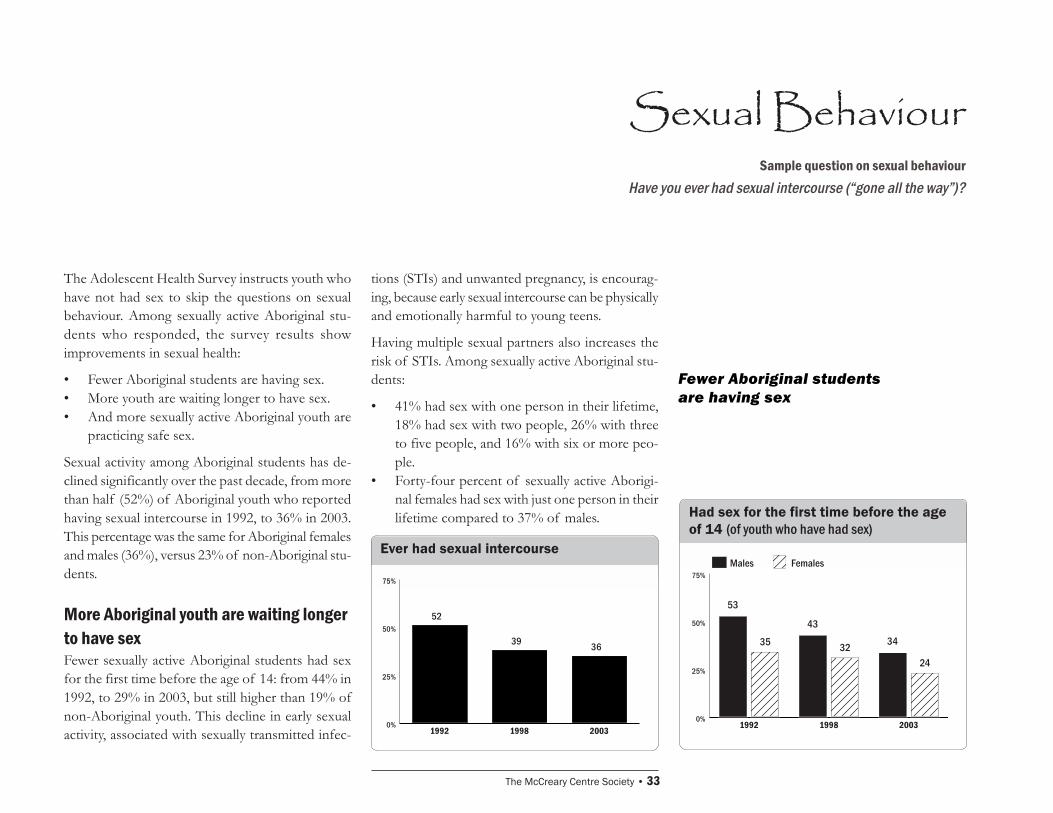
The McCreary Centre Society � 33
Sexual BehaviourSample question on sexual behaviour
Have you ever had sexual intercourse (�gone all the way�)?
The Adolescent Health Survey instructs youth whohave not had sex to skip the questions on sexualbehaviour. Among sexually active Aboriginal stu-dents who responded, the survey results showimprovements in sexual health:
� Fewer Aboriginal students are having sex.� More youth are waiting longer to have sex.� And more sexually active Aboriginal youth are
practicing safe sex.
Sexual activity among Aboriginal students has de-clined significantly over the past decade, from morethan half (52%) of Aboriginal youth who reportedhaving sexual intercourse in 1992, to 36% in 2003.This percentage was the same for Aboriginal femalesand males (36%), versus 23% of non-Aboriginal stu-dents.
More Aboriginal youth are waiting longerto have sexFewer sexually active Aboriginal students had sexfor the first time before the age of 14: from 44% in1992, to 29% in 2003, but still higher than 19% ofnon-Aboriginal youth. This decline in early sexualactivity, associated with sexually transmitted infec-
tions (STIs) and unwanted pregnancy, is encourag-ing, because early sexual intercourse can be physicallyand emotionally harmful to young teens.
Having multiple sexual partners also increases therisk of STIs. Among sexually active Aboriginal stu-dents:
� 41% had sex with one person in their lifetime,18% had sex with two people, 26% with threeto five people, and 16% with six or more peo-ple.
� Forty-four percent of sexually active Aborigi-nal females had sex with just one person in theirlifetime compared to 37% of males.
Ever had sexual intercourse
Had sex for the first time before the ageof 14 (of youth who have had sex)
0%
25%
50%
75%
52
39 36
200319981992
Fewer Aboriginal studentsare having sex
0%
25%
50%
75%
35 3224
53
4334
FemalesMales
200319981992
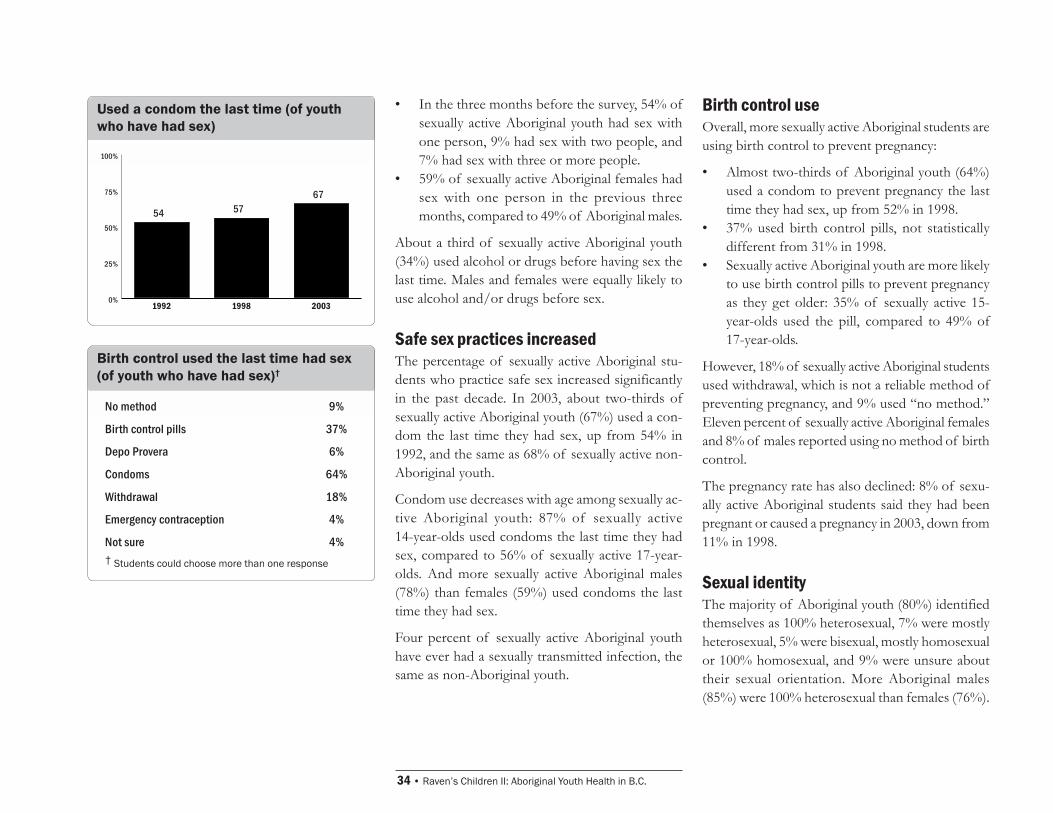
34 � Raven�s Children II: Aboriginal Youth Health in B.C.
� In the three months before the survey, 54% ofsexually active Aboriginal youth had sex withone person, 9% had sex with two people, and7% had sex with three or more people.
� 59% of sexually active Aboriginal females hadsex with one person in the previous threemonths, compared to 49% of Aboriginal males.
About a third of sexually active Aboriginal youth(34%) used alcohol or drugs before having sex thelast time. Males and females were equally likely touse alcohol and/or drugs before sex.
Safe sex practices increasedThe percentage of sexually active Aboriginal stu-dents who practice safe sex increased significantlyin the past decade. In 2003, about two-thirds ofsexually active Aboriginal youth (67%) used a con-dom the last time they had sex, up from 54% in1992, and the same as 68% of sexually active non-Aboriginal youth.
Condom use decreases with age among sexually ac-tive Aboriginal youth: 87% of sexually active14-year-olds used condoms the last time they hadsex, compared to 56% of sexually active 17-year-olds. And more sexually active Aboriginal males(78%) than females (59%) used condoms the lasttime they had sex.
Four percent of sexually active Aboriginal youthhave ever had a sexually transmitted infection, thesame as non-Aboriginal youth.
Used a condom the last time (of youthwho have had sex)
0%
25%
50%
75%
100%
54 5767
200319981992
Birth control useOverall, more sexually active Aboriginal students areusing birth control to prevent pregnancy:
� Almost two-thirds of Aboriginal youth (64%)used a condom to prevent pregnancy the lasttime they had sex, up from 52% in 1998.
� 37% used birth control pills, not statisticallydifferent from 31% in 1998.
� Sexually active Aboriginal youth are more likelyto use birth control pills to prevent pregnancyas they get older: 35% of sexually active 15-year-olds used the pill, compared to 49% of17-year-olds.
However, 18% of sexually active Aboriginal studentsused withdrawal, which is not a reliable method ofpreventing pregnancy, and 9% used �no method.�Eleven percent of sexually active Aboriginal femalesand 8% of males reported using no method of birthcontrol.
The pregnancy rate has also declined: 8% of sexu-ally active Aboriginal students said they had beenpregnant or caused a pregnancy in 2003, down from11% in 1998.
Sexual identityThe majority of Aboriginal youth (80%) identifiedthemselves as 100% heterosexual, 7% were mostlyheterosexual, 5% were bisexual, mostly homosexualor 100% homosexual, and 9% were unsure abouttheir sexual orientation. More Aboriginal males(85%) were 100% heterosexual than females (76%).
Birth control used the last time had sex(of youth who have had sex)�
No method 9%
Birth control pills 37%
Depo Provera 6%
Condoms 64%
Withdrawal 18%
Emergency contraception 4%
Not sure 4%� Students could choose more than one response
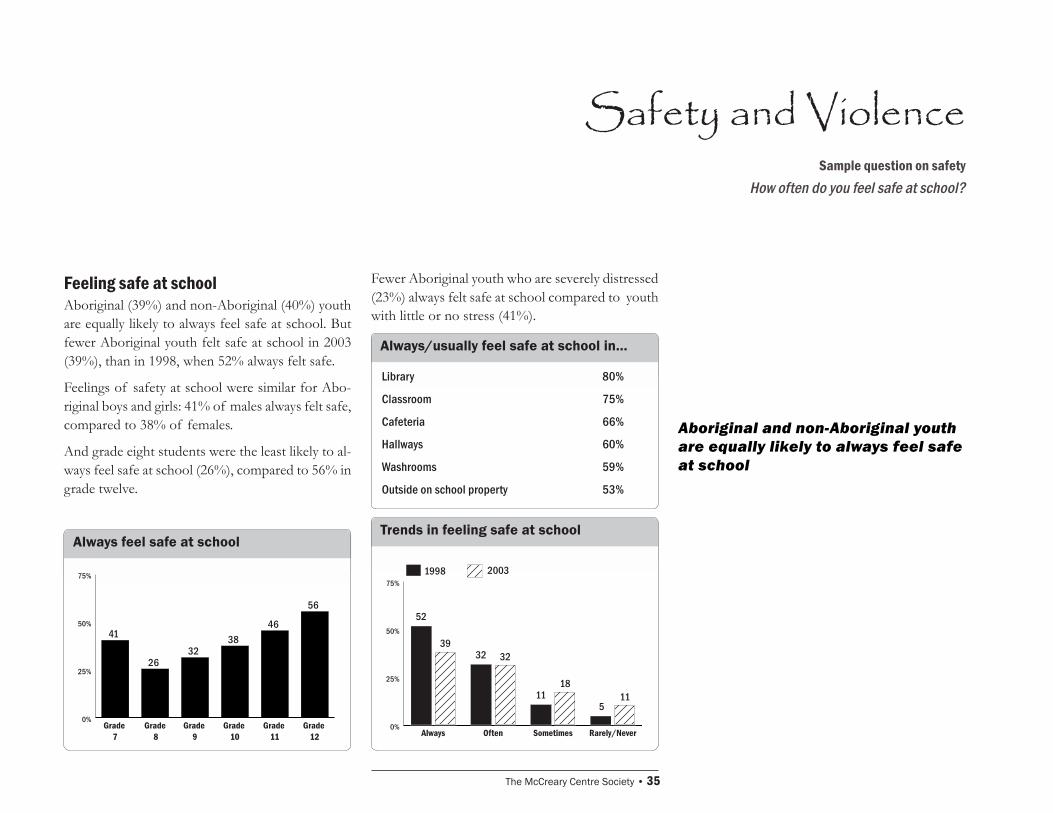
The McCreary Centre Society � 35
Safety and ViolenceSample question on safety
How often do you feel safe at school?
Feeling safe at schoolAboriginal (39%) and non-Aboriginal (40%) youthare equally likely to always feel safe at school. Butfewer Aboriginal youth felt safe at school in 2003(39%), than in 1998, when 52% always felt safe.
Feelings of safety at school were similar for Abo-riginal boys and girls: 41% of males always felt safe,compared to 38% of females.
And grade eight students were the least likely to al-ways feel safe at school (26%), compared to 56% ingrade twelve.
Fewer Aboriginal youth who are severely distressed(23%) always felt safe at school compared to youthwith little or no stress (41%).
Always feel safe at school
Always/usually feel safe at school in�
Library 80%
Classroom 75%
Cafeteria 66%
Hallways 60%
Washrooms 59%
Outside on school property 53%
Trends in feeling safe at school
0%
25%
50%
75%
41
2632
3846
56
Grade 12
Grade 11
Grade 10
Grade 9
Grade 8
Grade 7
0%
25%
50%
75%
3932
1811
52
32
11 5
20031998
Rarely/NeverSometimesOftenAlways
Aboriginal and non-Aboriginal youthare equally likely to always feel safeat school
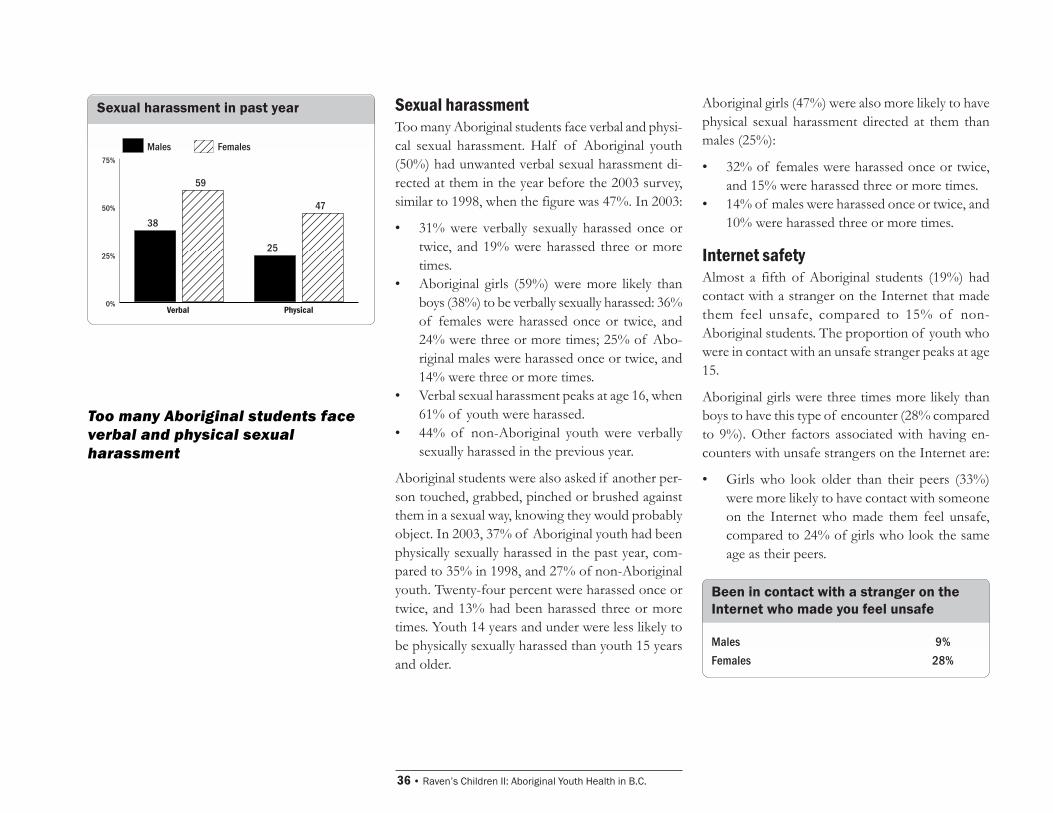
36 � Raven�s Children II: Aboriginal Youth Health in B.C.
Sexual harassmentToo many Aboriginal students face verbal and physi-cal sexual harassment. Half of Aboriginal youth(50%) had unwanted verbal sexual harassment di-rected at them in the year before the 2003 survey,similar to 1998, when the figure was 47%. In 2003:
� 31% were verbally sexually harassed once ortwice, and 19% were harassed three or moretimes.
� Aboriginal girls (59%) were more likely thanboys (38%) to be verbally sexually harassed: 36%of females were harassed once or twice, and24% were three or more times; 25% of Abo-riginal males were harassed once or twice, and14% were three or more times.
� Verbal sexual harassment peaks at age 16, when61% of youth were harassed.
� 44% of non-Aboriginal youth were verballysexually harassed in the previous year.
Aboriginal students were also asked if another per-son touched, grabbed, pinched or brushed againstthem in a sexual way, knowing they would probablyobject. In 2003, 37% of Aboriginal youth had beenphysically sexually harassed in the past year, com-pared to 35% in 1998, and 27% of non-Aboriginalyouth. Twenty-four percent were harassed once ortwice, and 13% had been harassed three or moretimes. Youth 14 years and under were less likely tobe physically sexually harassed than youth 15 yearsand older.
Been in contact with a stranger on theInternet who made you feel unsafe
Males 9%Females 28%
Aboriginal girls (47%) were also more likely to havephysical sexual harassment directed at them thanmales (25%):
� 32% of females were harassed once or twice,and 15% were harassed three or more times.
� 14% of males were harassed once or twice, and10% were harassed three or more times.
Internet safetyAlmost a fifth of Aboriginal students (19%) hadcontact with a stranger on the Internet that madethem feel unsafe, compared to 15% of non-Aboriginal students. The proportion of youth whowere in contact with an unsafe stranger peaks at age15.
Aboriginal girls were three times more likely thanboys to have this type of encounter (28% comparedto 9%). Other factors associated with having en-counters with unsafe strangers on the Internet are:
� Girls who look older than their peers (33%)were more likely to have contact with someoneon the Internet who made them feel unsafe,compared to 24% of girls who look the sameage as their peers.
Too many Aboriginal students faceverbal and physical sexualharassment
Sexual harassment in past year
0%
25%
50%
75%
59
47
38
25
FemalesMales
PhysicalVerbal
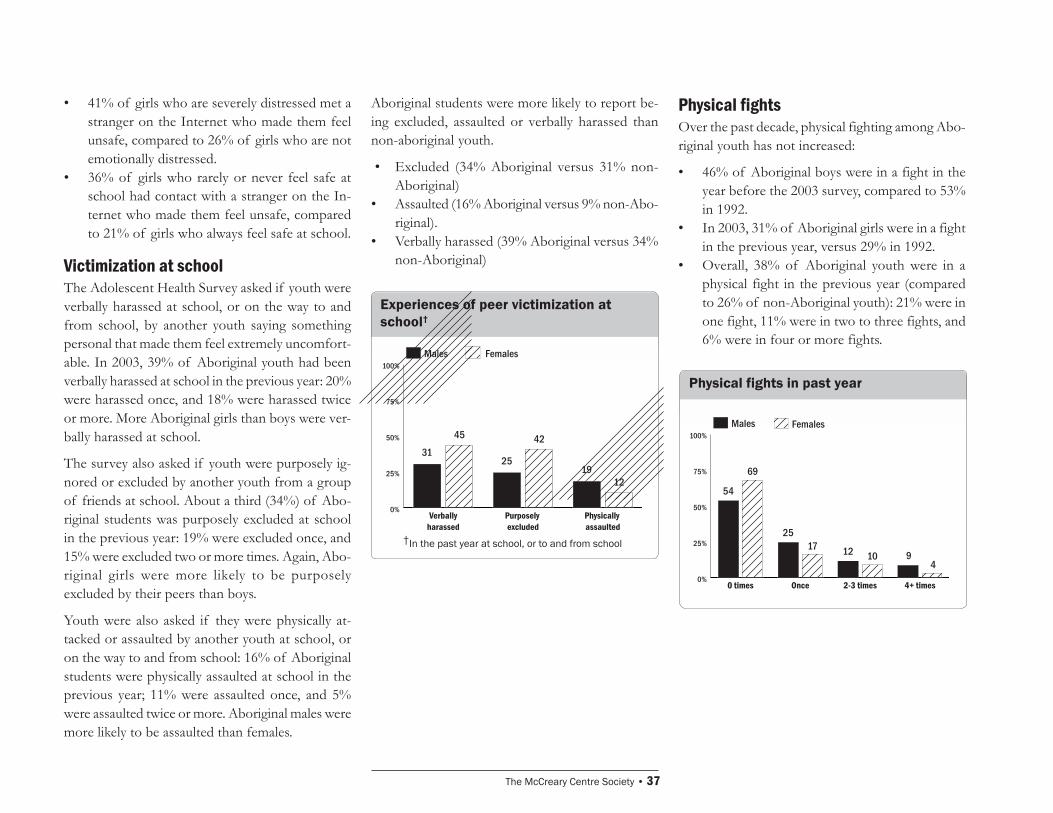
The McCreary Centre Society � 37
� 41% of girls who are severely distressed met astranger on the Internet who made them feelunsafe, compared to 26% of girls who are notemotionally distressed.
� 36% of girls who rarely or never feel safe atschool had contact with a stranger on the In-ternet who made them feel unsafe, comparedto 21% of girls who always feel safe at school.
Victimization at schoolThe Adolescent Health Survey asked if youth wereverbally harassed at school, or on the way to andfrom school, by another youth saying somethingpersonal that made them feel extremely uncomfort-able. In 2003, 39% of Aboriginal youth had beenverbally harassed at school in the previous year: 20%were harassed once, and 18% were harassed twiceor more. More Aboriginal girls than boys were ver-bally harassed at school.
The survey also asked if youth were purposely ig-nored or excluded by another youth from a groupof friends at school. About a third (34%) of Abo-riginal students was purposely excluded at schoolin the previous year: 19% were excluded once, and15% were excluded two or more times. Again, Abo-riginal girls were more likely to be purposelyexcluded by their peers than boys.
Youth were also asked if they were physically at-tacked or assaulted by another youth at school, oron the way to and from school: 16% of Aboriginalstudents were physically assaulted at school in theprevious year; 11% were assaulted once, and 5%were assaulted twice or more. Aboriginal males weremore likely to be assaulted than females.
Aboriginal students were more likely to report be-ing excluded, assaulted or verbally harassed thannon-aboriginal youth.
� Excluded (34% Aboriginal versus 31% non-Aboriginal)
� Assaulted (16% Aboriginal versus 9% non-Abo-riginal).
� Verbally harassed (39% Aboriginal versus 34%non-Aboriginal)
Experiences of peer victimization atschool�
0%
25%
50%
75%
100%
45 42
12
3125
19
FemalesMales
Physically assaulted
Purposely excluded
Verballyharassed
�In the past year at school, or to and from school
Physical fightsOver the past decade, physical fighting among Abo-riginal youth has not increased:
� 46% of Aboriginal boys were in a fight in theyear before the 2003 survey, compared to 53%in 1992.
� In 2003, 31% of Aboriginal girls were in a fightin the previous year, versus 29% in 1992.
� Overall, 38% of Aboriginal youth were in aphysical fight in the previous year (comparedto 26% of non-Aboriginal youth): 21% were inone fight, 11% were in two to three fights, and6% were in four or more fights.
Physical fights in past year
0%
25%
50%
75%
100%
69
1710
4
54
25
12 9
FemalesMales
4+ times2-3 timesOnce0 times
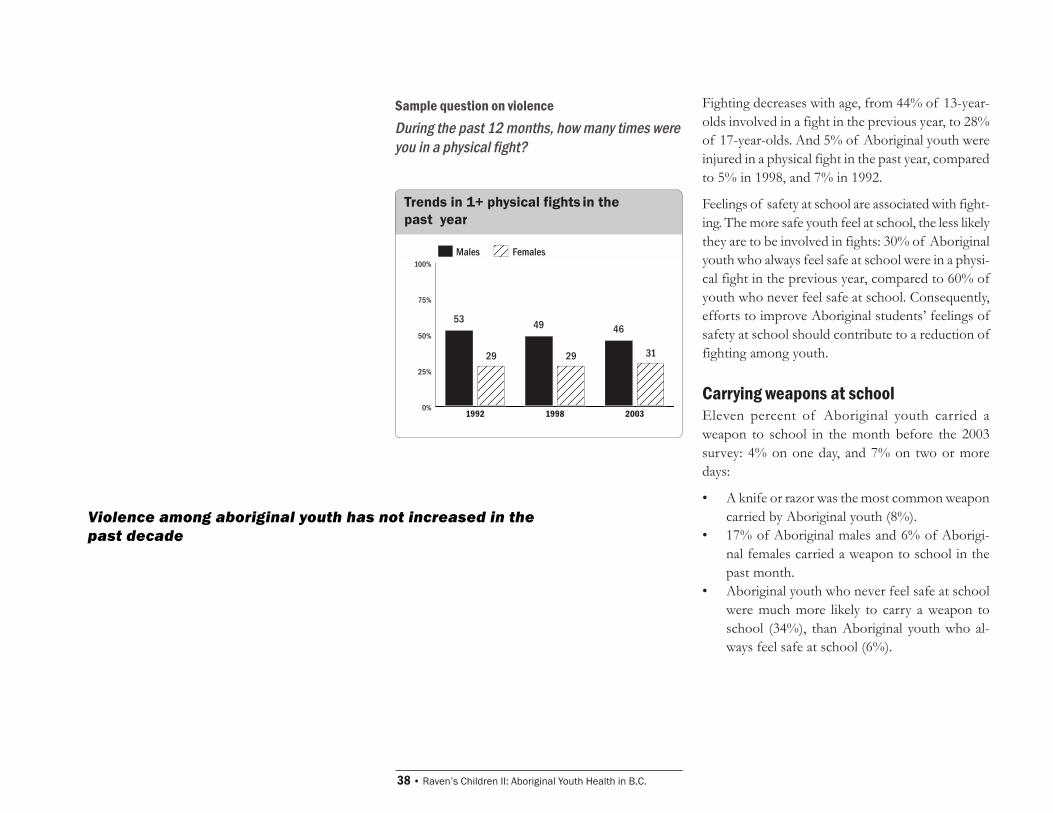
38 � Raven�s Children II: Aboriginal Youth Health in B.C.
Sample question on violenceDuring the past 12 months, how many times wereyou in a physical fight?
Trends in 1+ physical fights in thepast year
0%
25%
50%
75%
100%
29 29 31
53 49 46
FemalesMales
200319981992
Fighting decreases with age, from 44% of 13-year-olds involved in a fight in the previous year, to 28%of 17-year-olds. And 5% of Aboriginal youth wereinjured in a physical fight in the past year, comparedto 5% in 1998, and 7% in 1992.
Feelings of safety at school are associated with fight-ing. The more safe youth feel at school, the less likelythey are to be involved in fights: 30% of Aboriginalyouth who always feel safe at school were in a physi-cal fight in the previous year, compared to 60% ofyouth who never feel safe at school. Consequently,efforts to improve Aboriginal students� feelings ofsafety at school should contribute to a reduction offighting among youth.
Carrying weapons at schoolEleven percent of Aboriginal youth carried aweapon to school in the month before the 2003survey: 4% on one day, and 7% on two or moredays:
� A knife or razor was the most common weaponcarried by Aboriginal youth (8%).
� 17% of Aboriginal males and 6% of Aborigi-nal females carried a weapon to school in thepast month.
� Aboriginal youth who never feel safe at schoolwere much more likely to carry a weapon toschool (34%), than Aboriginal youth who al-ways feel safe at school (6%).
Violence among aboriginal youth has not increased in thepast decade
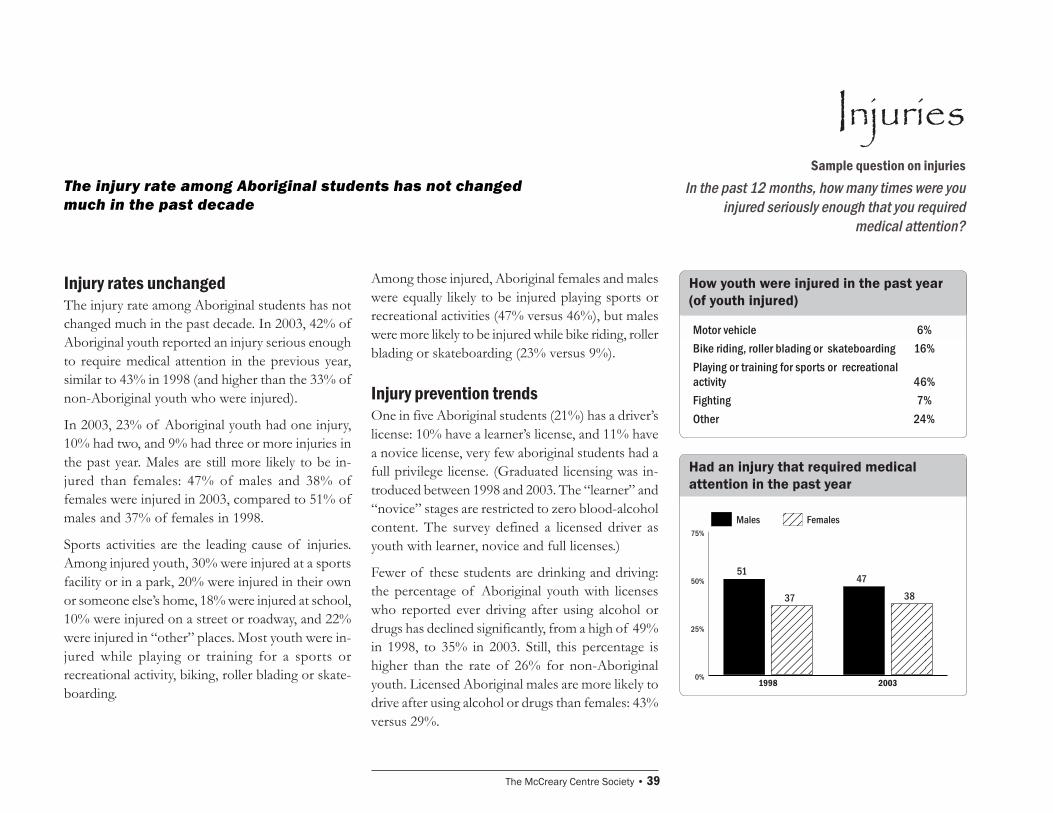
The McCreary Centre Society � 39
InjuriesSample question on injuries
In the past 12 months, how many times were youinjured seriously enough that you required
medical attention?
The injury rate among Aboriginal students has not changedmuch in the past decade
Injury rates unchangedThe injury rate among Aboriginal students has notchanged much in the past decade. In 2003, 42% ofAboriginal youth reported an injury serious enoughto require medical attention in the previous year,similar to 43% in 1998 (and higher than the 33% ofnon-Aboriginal youth who were injured).
In 2003, 23% of Aboriginal youth had one injury,10% had two, and 9% had three or more injuries inthe past year. Males are still more likely to be in-jured than females: 47% of males and 38% offemales were injured in 2003, compared to 51% ofmales and 37% of females in 1998.
Sports activities are the leading cause of injuries.Among injured youth, 30% were injured at a sportsfacility or in a park, 20% were injured in their ownor someone else�s home, 18% were injured at school,10% were injured on a street or roadway, and 22%were injured in �other� places. Most youth were in-jured while playing or training for a sports orrecreational activity, biking, roller blading or skate-boarding.
Among those injured, Aboriginal females and maleswere equally likely to be injured playing sports orrecreational activities (47% versus 46%), but maleswere more likely to be injured while bike riding, rollerblading or skateboarding (23% versus 9%).
Injury prevention trendsOne in five Aboriginal students (21%) has a driver�slicense: 10% have a learner�s license, and 11% havea novice license, very few aboriginal students had afull privilege license. (Graduated licensing was in-troduced between 1998 and 2003. The �learner� and�novice� stages are restricted to zero blood-alcoholcontent. The survey defined a licensed driver asyouth with learner, novice and full licenses.)
Fewer of these students are drinking and driving:the percentage of Aboriginal youth with licenseswho reported ever driving after using alcohol ordrugs has declined significantly, from a high of 49%in 1998, to 35% in 2003. Still, this percentage ishigher than the rate of 26% for non-Aboriginalyouth. Licensed Aboriginal males are more likely todrive after using alcohol or drugs than females: 43%versus 29%.
Had an injury that required medicalattention in the past year
How youth were injured in the past year(of youth injured)
Motor vehicle 6%Bike riding, roller blading or skateboarding 16%Playing or training for sports or recreationalactivity 46%Fighting 7%Other 24%
0%
25%
50%
75%
37 38
5147
FemalesMales
20031998
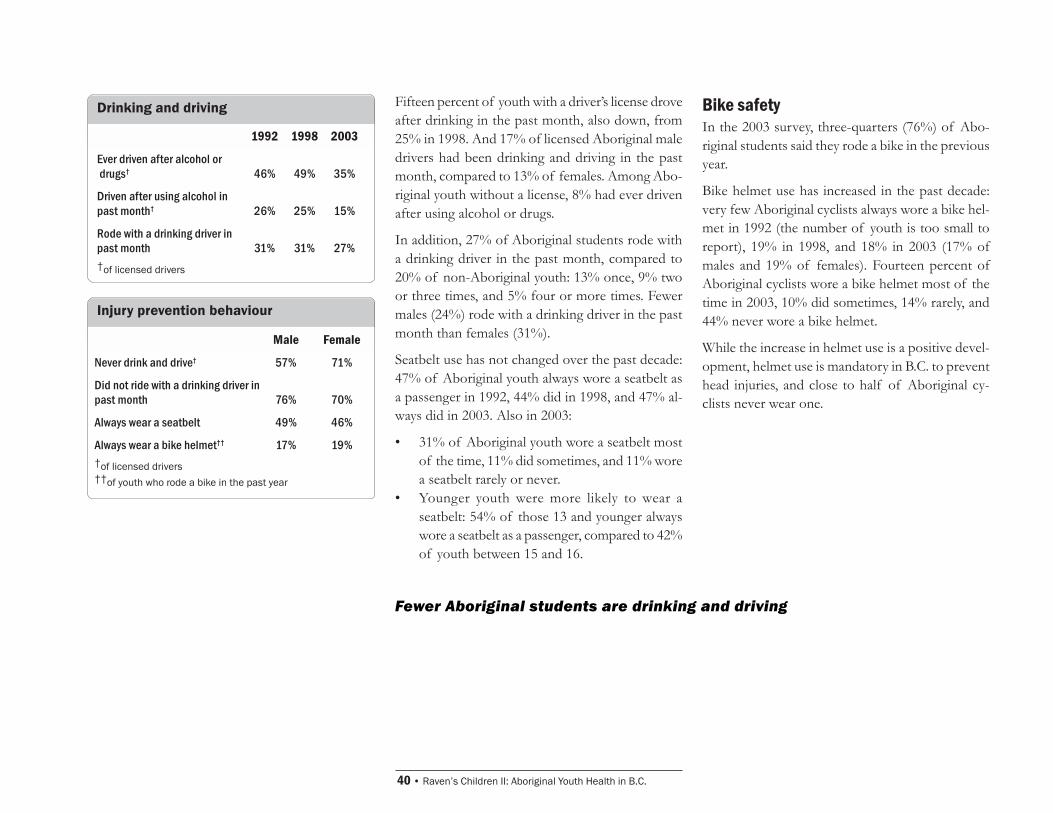
40 � Raven�s Children II: Aboriginal Youth Health in B.C.
Fewer Aboriginal students are drinking and driving
Drinking and driving Fifteen percent of youth with a driver�s license droveafter drinking in the past month, also down, from25% in 1998. And 17% of licensed Aboriginal maledrivers had been drinking and driving in the pastmonth, compared to 13% of females. Among Abo-riginal youth without a license, 8% had ever drivenafter using alcohol or drugs.
In addition, 27% of Aboriginal students rode witha drinking driver in the past month, compared to20% of non-Aboriginal youth: 13% once, 9% twoor three times, and 5% four or more times. Fewermales (24%) rode with a drinking driver in the pastmonth than females (31%).
Seatbelt use has not changed over the past decade:47% of Aboriginal youth always wore a seatbelt asa passenger in 1992, 44% did in 1998, and 47% al-ways did in 2003. Also in 2003:
� 31% of Aboriginal youth wore a seatbelt mostof the time, 11% did sometimes, and 11% worea seatbelt rarely or never.
� Younger youth were more likely to wear aseatbelt: 54% of those 13 and younger alwayswore a seatbelt as a passenger, compared to 42%of youth between 15 and 16.
Injury prevention behaviour
Male Female
Never drink and drive� 57% 71%
Did not ride with a drinking driver inpast month 76% 70%
Always wear a seatbelt 49% 46%
Always wear a bike helmet�� 17% 19%�of licensed drivers��of youth who rode a bike in the past year
1992 1998 2003
Ever driven after alcohol or drugs� 46% 49% 35%
Driven after using alcohol inpast month� 26% 25% 15%
Rode with a drinking driver inpast month 31% 31% 27%�of licensed drivers
Bike safetyIn the 2003 survey, three-quarters (76%) of Abo-riginal students said they rode a bike in the previousyear.
Bike helmet use has increased in the past decade:very few Aboriginal cyclists always wore a bike hel-met in 1992 (the number of youth is too small toreport), 19% in 1998, and 18% in 2003 (17% ofmales and 19% of females). Fourteen percent ofAboriginal cyclists wore a bike helmet most of thetime in 2003, 10% did sometimes, 14% rarely, and44% never wore a bike helmet.
While the increase in helmet use is a positive devel-opment, helmet use is mandatory in B.C. to preventhead injuries, and close to half of Aboriginal cy-clists never wear one.
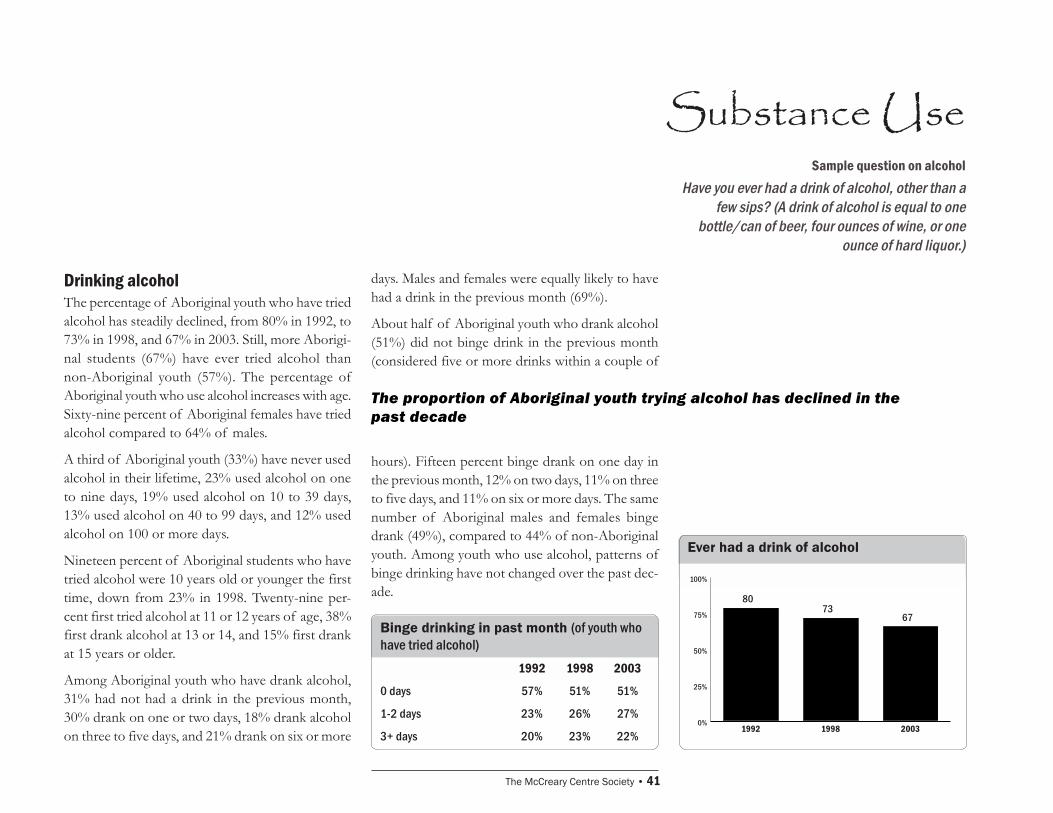
The McCreary Centre Society � 41
Substance UseSample question on alcohol
Have you ever had a drink of alcohol, other than afew sips? (A drink of alcohol is equal to one
bottle/can of beer, four ounces of wine, or oneounce of hard liquor.)
The proportion of Aboriginal youth trying alcohol has declined in thepast decade
Drinking alcoholThe percentage of Aboriginal youth who have triedalcohol has steadily declined, from 80% in 1992, to73% in 1998, and 67% in 2003. Still, more Aborigi-nal students (67%) have ever tried alcohol thannon-Aboriginal youth (57%). The percentage ofAboriginal youth who use alcohol increases with age.Sixty-nine percent of Aboriginal females have triedalcohol compared to 64% of males.
A third of Aboriginal youth (33%) have never usedalcohol in their lifetime, 23% used alcohol on oneto nine days, 19% used alcohol on 10 to 39 days,13% used alcohol on 40 to 99 days, and 12% usedalcohol on 100 or more days.
Nineteen percent of Aboriginal students who havetried alcohol were 10 years old or younger the firsttime, down from 23% in 1998. Twenty-nine per-cent first tried alcohol at 11 or 12 years of age, 38%first drank alcohol at 13 or 14, and 15% first drankat 15 years or older.
Among Aboriginal youth who have drank alcohol,31% had not had a drink in the previous month,30% drank on one or two days, 18% drank alcoholon three to five days, and 21% drank on six or more
days. Males and females were equally likely to havehad a drink in the previous month (69%).
About half of Aboriginal youth who drank alcohol(51%) did not binge drink in the previous month(considered five or more drinks within a couple of
Ever had a drink of alcohol
Binge drinking in past month (of youth whohave tried alcohol)
0%
25%
50%
75%
100%
8073
67
200319981992
hours). Fifteen percent binge drank on one day inthe previous month, 12% on two days, 11% on threeto five days, and 11% on six or more days. The samenumber of Aboriginal males and females bingedrank (49%), compared to 44% of non-Aboriginalyouth. Among youth who use alcohol, patterns ofbinge drinking have not changed over the past dec-ade.
1992 1998 2003
0 days 57% 51% 51%
1-2 days 23% 26% 27%
3+ days 20% 23% 22%
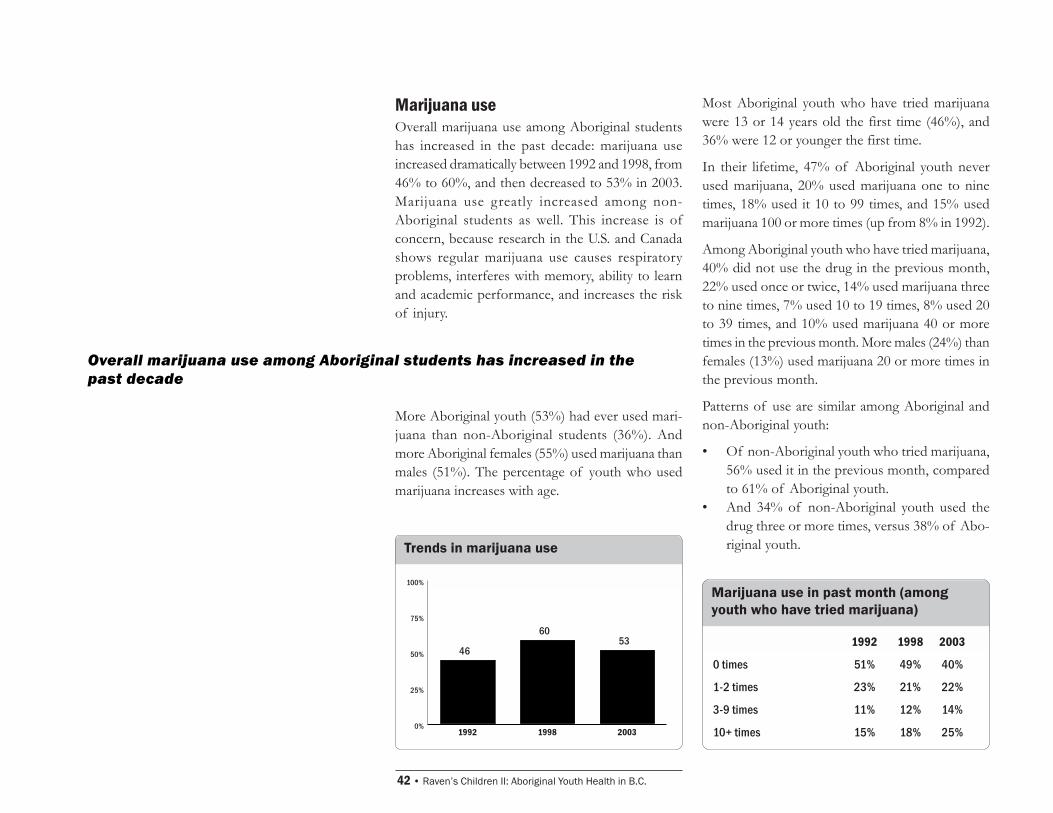
42 � Raven�s Children II: Aboriginal Youth Health in B.C.
Marijuana useOverall marijuana use among Aboriginal studentshas increased in the past decade: marijuana useincreased dramatically between 1992 and 1998, from46% to 60%, and then decreased to 53% in 2003.Marijuana use greatly increased among non-Aboriginal students as well. This increase is ofconcern, because research in the U.S. and Canadashows regular marijuana use causes respiratoryproblems, interferes with memory, ability to learnand academic performance, and increases the riskof injury.
Most Aboriginal youth who have tried marijuanawere 13 or 14 years old the first time (46%), and36% were 12 or younger the first time.
In their lifetime, 47% of Aboriginal youth neverused marijuana, 20% used marijuana one to ninetimes, 18% used it 10 to 99 times, and 15% usedmarijuana 100 or more times (up from 8% in 1992).
Among Aboriginal youth who have tried marijuana,40% did not use the drug in the previous month,22% used once or twice, 14% used marijuana threeto nine times, 7% used 10 to 19 times, 8% used 20to 39 times, and 10% used marijuana 40 or moretimes in the previous month. More males (24%) thanfemales (13%) used marijuana 20 or more times inthe previous month.
Patterns of use are similar among Aboriginal andnon-Aboriginal youth:
� Of non-Aboriginal youth who tried marijuana,56% used it in the previous month, comparedto 61% of Aboriginal youth.
� And 34% of non-Aboriginal youth used thedrug three or more times, versus 38% of Abo-riginal youth.
Overall marijuana use among Aboriginal students has increased in thepast decade
Trends in marijuana use
Marijuana use in past month (amongyouth who have tried marijuana)
0%
25%
50%
75%
100%
46
6053
200319981992
More Aboriginal youth (53%) had ever used mari-juana than non-Aboriginal students (36%). Andmore Aboriginal females (55%) used marijuana thanmales (51%). The percentage of youth who usedmarijuana increases with age.
1992 1998 2003
0 times 51% 49% 40%
1-2 times 23% 21% 22%
3-9 times 11% 12% 14%
10+ times 15% 18% 25%
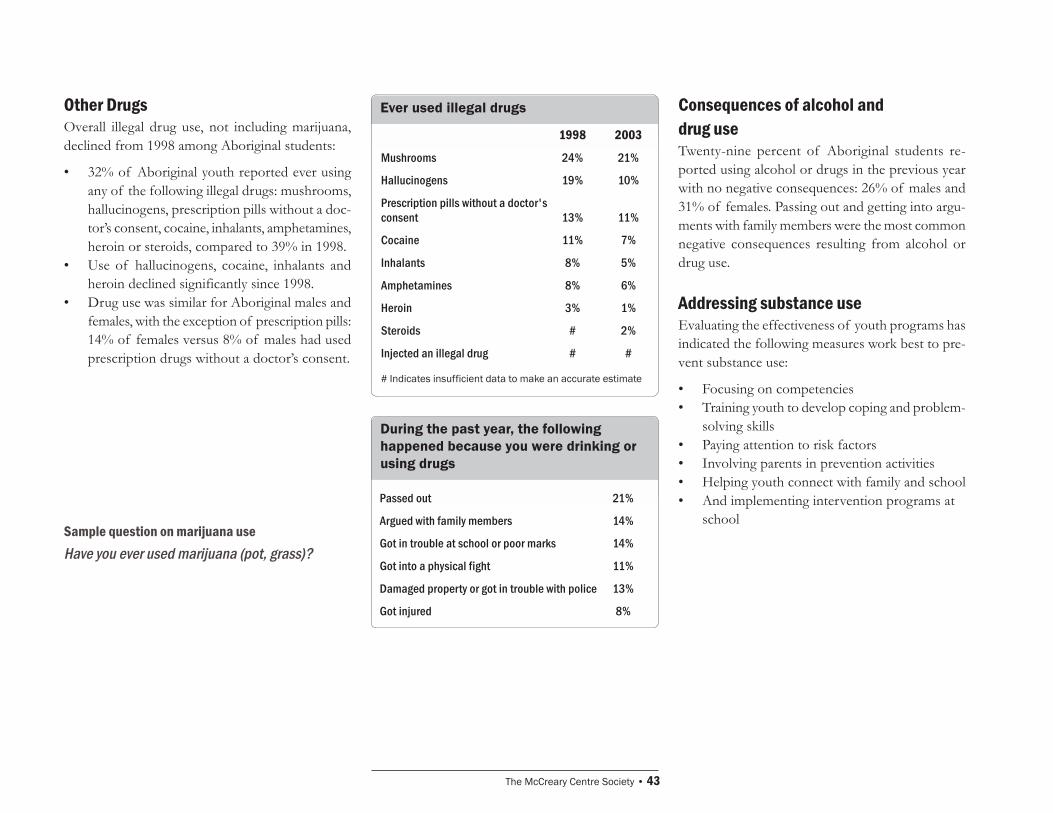
The McCreary Centre Society � 43
Ever used illegal drugsOther DrugsOverall illegal drug use, not including marijuana,declined from 1998 among Aboriginal students:
� 32% of Aboriginal youth reported ever usingany of the following illegal drugs: mushrooms,hallucinogens, prescription pills without a doc-tor�s consent, cocaine, inhalants, amphetamines,heroin or steroids, compared to 39% in 1998.
� Use of hallucinogens, cocaine, inhalants andheroin declined significantly since 1998.
� Drug use was similar for Aboriginal males andfemales, with the exception of prescription pills:14% of females versus 8% of males had usedprescription drugs without a doctor�s consent.
During the past year, the followinghappened because you were drinking orusing drugs
Consequences of alcohol anddrug useTwenty-nine percent of Aboriginal students re-ported using alcohol or drugs in the previous yearwith no negative consequences: 26% of males and31% of females. Passing out and getting into argu-ments with family members were the most commonnegative consequences resulting from alcohol ordrug use.
Addressing substance useEvaluating the effectiveness of youth programs hasindicated the following measures work best to pre-vent substance use:
� Focusing on competencies� Training youth to develop coping and problem-
solving skills� Paying attention to risk factors� Involving parents in prevention activities� Helping youth connect with family and school� And implementing intervention programs at
school
1998 2003
Mushrooms 24% 21%
Hallucinogens 19% 10%
Prescription pills without a doctor'sconsent 13% 11%
Cocaine 11% 7%
Inhalants 8% 5%
Amphetamines 8% 6%
Heroin 3% 1%
Steroids # 2%
Injected an illegal drug # #
# Indicates insufficient data to make an accurate estimate
Passed out 21%
Argued with family members 14%
Got in trouble at school or poor marks 14%
Got into a physical fight 11%
Damaged property or got in trouble with police 13%
Got injured 8%
Sample question on marijuana useHave you ever used marijuana (pot, grass)?
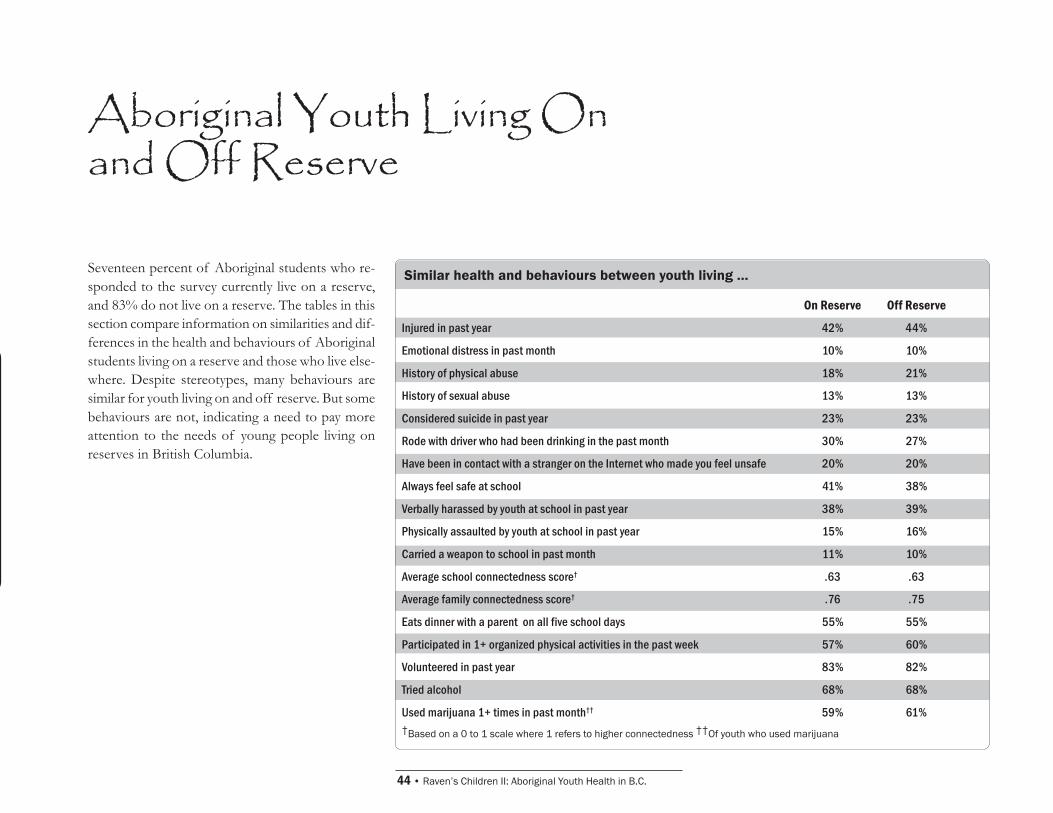
44 � Raven�s Children II: Aboriginal Youth Health in B.C.
Aboriginal Youth Living Onand Off Reserve
Seventeen percent of Aboriginal students who re-sponded to the survey currently live on a reserve,and 83% do not live on a reserve. The tables in thissection compare information on similarities and dif-ferences in the health and behaviours of Aboriginalstudents living on a reserve and those who live else-where. Despite stereotypes, many behaviours aresimilar for youth living on and off reserve. But somebehaviours are not, indicating a need to pay moreattention to the needs of young people living onreserves in British Columbia.
Similar health and behaviours between youth living �
On Reserve Off Reserve
Injured in past year 42% 44%
Emotional distress in past month 10% 10%
History of physical abuse 18% 21%
History of sexual abuse 13% 13%
Considered suicide in past year 23% 23%
Rode with driver who had been drinking in the past month 30% 27%
Have been in contact with a stranger on the Internet who made you feel unsafe 20% 20%
Always feel safe at school 41% 38%
Verbally harassed by youth at school in past year 38% 39%
Physically assaulted by youth at school in past year 15% 16%
Carried a weapon to school in past month 11% 10%
Average school connectedness score� .63 .63
Average family connectedness score� .76 .75
Eats dinner with a parent on all five school days 55% 55%
Participated in 1+ organized physical activities in the past week 57% 60%
Volunteered in past year 83% 82%
Tried alcohol 68% 68%
Used marijuana 1+ times in past month�� 59% 61%�Based on a 0 to 1 scale where 1 refers to higher connectedness ��Of youth who used marijuana
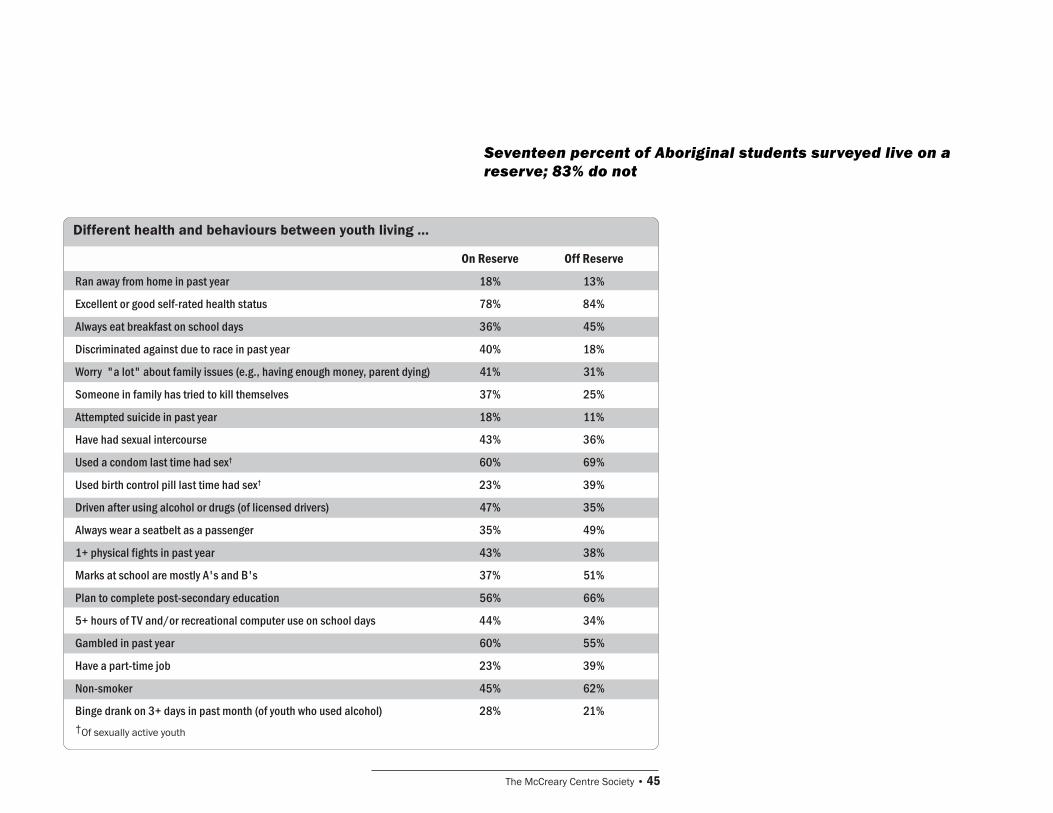
The McCreary Centre Society � 45
Different health and behaviours between youth living �
On Reserve Off Reserve
Ran away from home in past year 18% 13%
Excellent or good self-rated health status 78% 84%
Always eat breakfast on school days 36% 45%
Discriminated against due to race in past year 40% 18%
Worry "a lot" about family issues (e.g., having enough money, parent dying) 41% 31%
Someone in family has tried to kill themselves 37% 25%
Attempted suicide in past year 18% 11%
Have had sexual intercourse 43% 36%
Used a condom last time had sex� 60% 69%
Used birth control pill last time had sex� 23% 39%
Driven after using alcohol or drugs (of licensed drivers) 47% 35%
Always wear a seatbelt as a passenger 35% 49%
1+ physical fights in past year 43% 38%
Marks at school are mostly A's and B's 37% 51%
Plan to complete post-secondary education 56% 66%
5+ hours of TV and/or recreational computer use on school days 44% 34%
Gambled in past year 60% 55%
Have a part-time job 23% 39%
Non-smoker 45% 62%
Binge drank on 3+ days in past month (of youth who used alcohol) 28% 21%�Of sexually active youth
Seventeen percent of Aboriginal students surveyed live on areserve; 83% do not
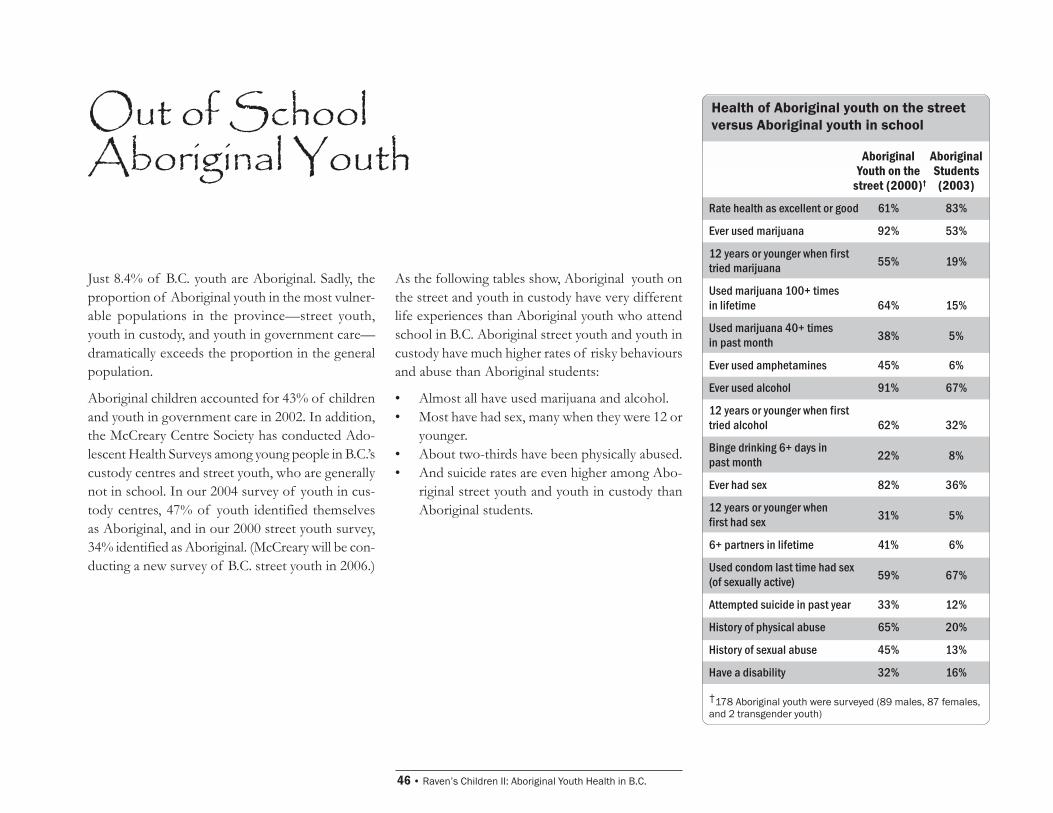
46 � Raven�s Children II: Aboriginal Youth Health in B.C.
Out of SchoolAboriginal Youth
Just 8.4% of B.C. youth are Aboriginal. Sadly, theproportion of Aboriginal youth in the most vulner-able populations in the province�street youth,youth in custody, and youth in government care�dramatically exceeds the proportion in the generalpopulation.
Aboriginal children accounted for 43% of childrenand youth in government care in 2002. In addition,the McCreary Centre Society has conducted Ado-lescent Health Surveys among young people in B.C.�scustody centres and street youth, who are generallynot in school. In our 2004 survey of youth in cus-tody centres, 47% of youth identified themselvesas Aboriginal, and in our 2000 street youth survey,34% identified as Aboriginal. (McCreary will be con-ducting a new survey of B.C. street youth in 2006.)
Health of Aboriginal youth on the streetversus Aboriginal youth in school
As the following tables show, Aboriginal youth onthe street and youth in custody have very differentlife experiences than Aboriginal youth who attendschool in B.C. Aboriginal street youth and youth incustody have much higher rates of risky behavioursand abuse than Aboriginal students:
� Almost all have used marijuana and alcohol.� Most have had sex, many when they were 12 or
younger.� About two-thirds have been physically abused.� And suicide rates are even higher among Abo-
riginal street youth and youth in custody thanAboriginal students.
Aboriginal AboriginalYouth on the Students
street (2000)� (2003)
Rate health as excellent or good 61% 83%
Ever used marijuana 92% 53%
12 years or younger when firsttried marijuana 55% 19%
Used marijuana 100+ timesin lifetime 64% 15%
Used marijuana 40+ timesin past month 38% 5%
Ever used amphetamines 45% 6%
Ever used alcohol 91% 67%
12 years or younger when firsttried alcohol 62% 32%
Binge drinking 6+ days inpast month 22% 8%
Ever had sex 82% 36%
12 years or younger whenfirst had sex 31% 5%
6+ partners in lifetime 41% 6%
Used condom last time had sex(of sexually active) 59% 67%
Attempted suicide in past year 33% 12%
History of physical abuse 65% 20%
History of sexual abuse 45% 13%
Have a disability 32% 16%
�178 Aboriginal youth were surveyed (89 males, 87 females,and 2 transgender youth)
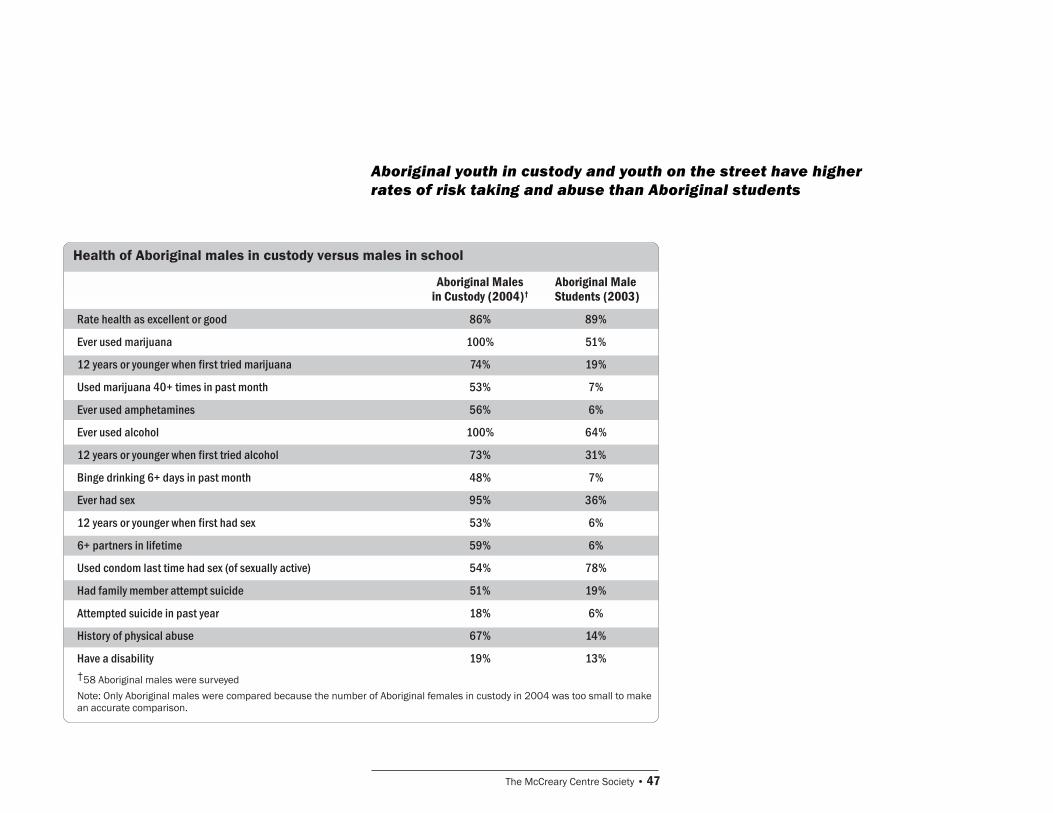
The McCreary Centre Society � 47
Aboriginal youth in custody and youth on the street have higherrates of risk taking and abuse than Aboriginal students
Health of Aboriginal males in custody versus males in school
Aboriginal Males Aboriginal Malein Custody (2004)� Students (2003)
Rate health as excellent or good 86% 89%
Ever used marijuana 100% 51%
12 years or younger when first tried marijuana 74% 19%
Used marijuana 40+ times in past month 53% 7%
Ever used amphetamines 56% 6%
Ever used alcohol 100% 64%
12 years or younger when first tried alcohol 73% 31%
Binge drinking 6+ days in past month 48% 7%
Ever had sex 95% 36%
12 years or younger when first had sex 53% 6%
6+ partners in lifetime 59% 6%
Used condom last time had sex (of sexually active) 54% 78%
Had family member attempt suicide 51% 19%
Attempted suicide in past year 18% 6%
History of physical abuse 67% 14%
Have a disability 19% 13%�58 Aboriginal males were surveyed
Note: Only Aboriginal males were compared because the number of Aboriginal females in custody in 2004 was too small to makean accurate comparison.
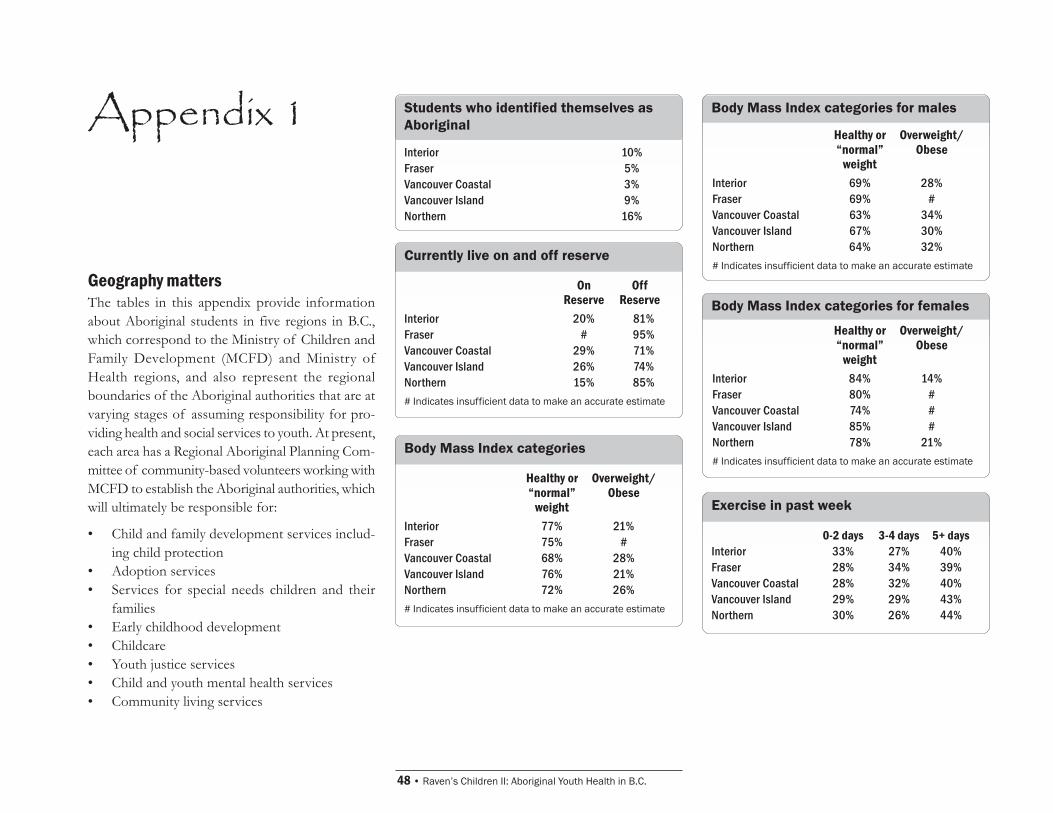
48 � Raven�s Children II: Aboriginal Youth Health in B.C.
Appendix 1
Geography mattersThe tables in this appendix provide informationabout Aboriginal students in five regions in B.C.,which correspond to the Ministry of Children andFamily Development (MCFD) and Ministry ofHealth regions, and also represent the regionalboundaries of the Aboriginal authorities that are atvarying stages of assuming responsibility for pro-viding health and social services to youth. At present,each area has a Regional Aboriginal Planning Com-mittee of community-based volunteers working withMCFD to establish the Aboriginal authorities, whichwill ultimately be responsible for:
� Child and family development services includ-ing child protection
� Adoption services� Services for special needs children and their
families� Early childhood development� Childcare� Youth justice services� Child and youth mental health services� Community living services
Students who identified themselves asAboriginal
Currently live on and off reserve
Interior 10%Fraser 5%Vancouver Coastal 3%Vancouver Island 9%Northern 16%
On OffReserve Reserve
Interior 20% 81%Fraser # 95%Vancouver Coastal 29% 71%Vancouver Island 26% 74%Northern 15% 85%# Indicates insufficient data to make an accurate estimate
Body Mass Index categories
Healthy or Overweight/�normal� Obese
weightInterior 77% 21%Fraser 75% #Vancouver Coastal 68% 28%Vancouver Island 76% 21%Northern 72% 26%# Indicates insufficient data to make an accurate estimate
Exercise in past week
0-2 days 3-4 days 5+ daysInterior 33% 27% 40%Fraser 28% 34% 39%Vancouver Coastal 28% 32% 40%Vancouver Island 29% 29% 43%Northern 30% 26% 44%
Body Mass Index categories for males
Healthy or Overweight/�normal� Obese
weightInterior 69% 28%Fraser 69% #Vancouver Coastal 63% 34%Vancouver Island 67% 30%Northern 64% 32%# Indicates insufficient data to make an accurate estimate
Body Mass Index categories for females
Healthy or Overweight/�normal� Obese
weightInterior 84% 14%Fraser 80% #Vancouver Coastal 74% #Vancouver Island 85% #Northern 78% 21%# Indicates insufficient data to make an accurate estimate
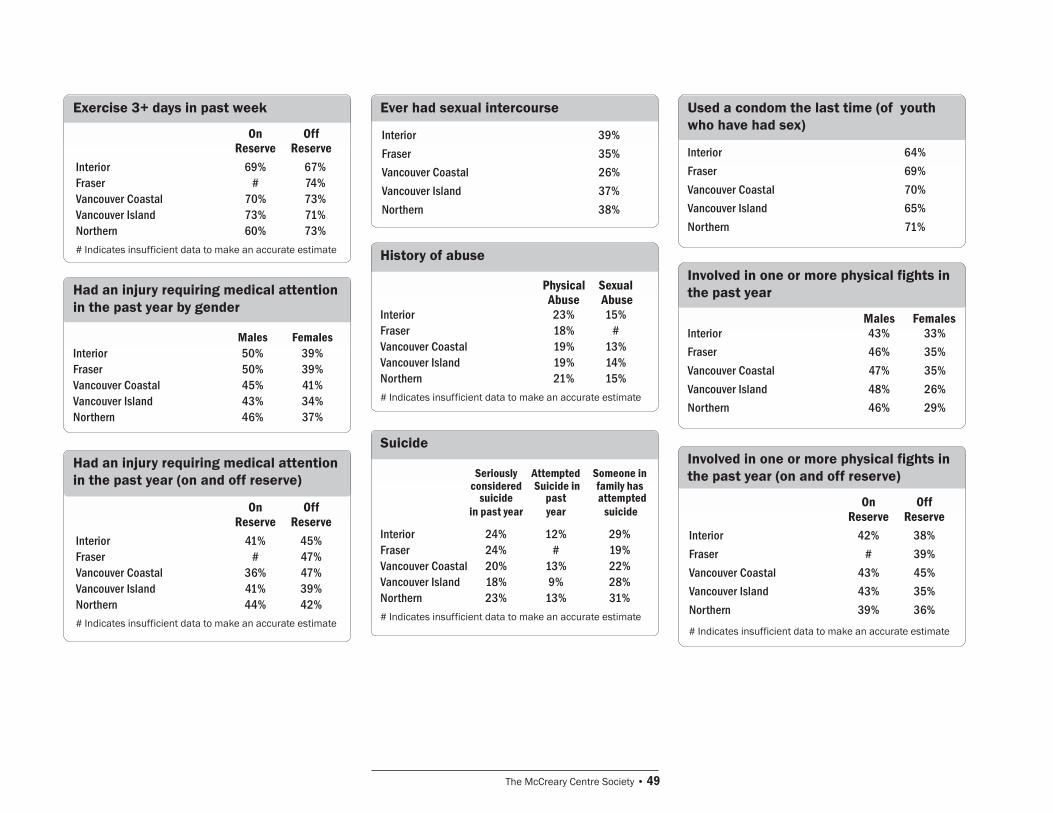
The McCreary Centre Society � 49
Exercise 3+ days in past week
Had an injury requiring medical attentionin the past year by gender
Males FemalesInterior 50% 39%Fraser 50% 39%Vancouver Coastal 45% 41%Vancouver Island 43% 34%Northern 46% 37%
Had an injury requiring medical attentionin the past year (on and off reserve)
On OffReserve Reserve
Interior 41% 45%Fraser # 47%Vancouver Coastal 36% 47%Vancouver Island 41% 39%Northern 44% 42%# Indicates insufficient data to make an accurate estimate
Ever had sexual intercourse
History of abuse
Interior 39%Fraser 35%Vancouver Coastal 26%Vancouver Island 37%Northern 38%
Physical SexualAbuse Abuse
Interior 23% 15%Fraser 18% #Vancouver Coastal 19% 13%Vancouver Island 19% 14%Northern 21% 15%# Indicates insufficient data to make an accurate estimate
Suicide
Seriously Attempted Someone inconsidered Suicide in family has
suicide past attemptedin past year year suicide
Interior 24% 12% 29%Fraser 24% # 19%Vancouver Coastal 20% 13% 22%Vancouver Island 18% 9% 28%Northern 23% 13% 31%# Indicates insufficient data to make an accurate estimate
Used a condom the last time (of youthwho have had sex)
Involved in one or more physical fights inthe past year
Interior 64%Fraser 69%Vancouver Coastal 70%Vancouver Island 65%Northern 71%
Males FemalesInterior 43% 33%Fraser 46% 35%Vancouver Coastal 47% 35%Vancouver Island 48% 26%Northern 46% 29%
Involved in one or more physical fights inthe past year (on and off reserve)
On OffReserve Reserve
Interior 42% 38%Fraser # 39%Vancouver Coastal 43% 45%Vancouver Island 43% 35%Northern 39% 36%
# Indicates insufficient data to make an accurate estimate
On OffReserve Reserve
Interior 69% 67%Fraser # 74%Vancouver Coastal 70% 73%Vancouver Island 73% 71%Northern 60% 73%# Indicates insufficient data to make an accurate estimate
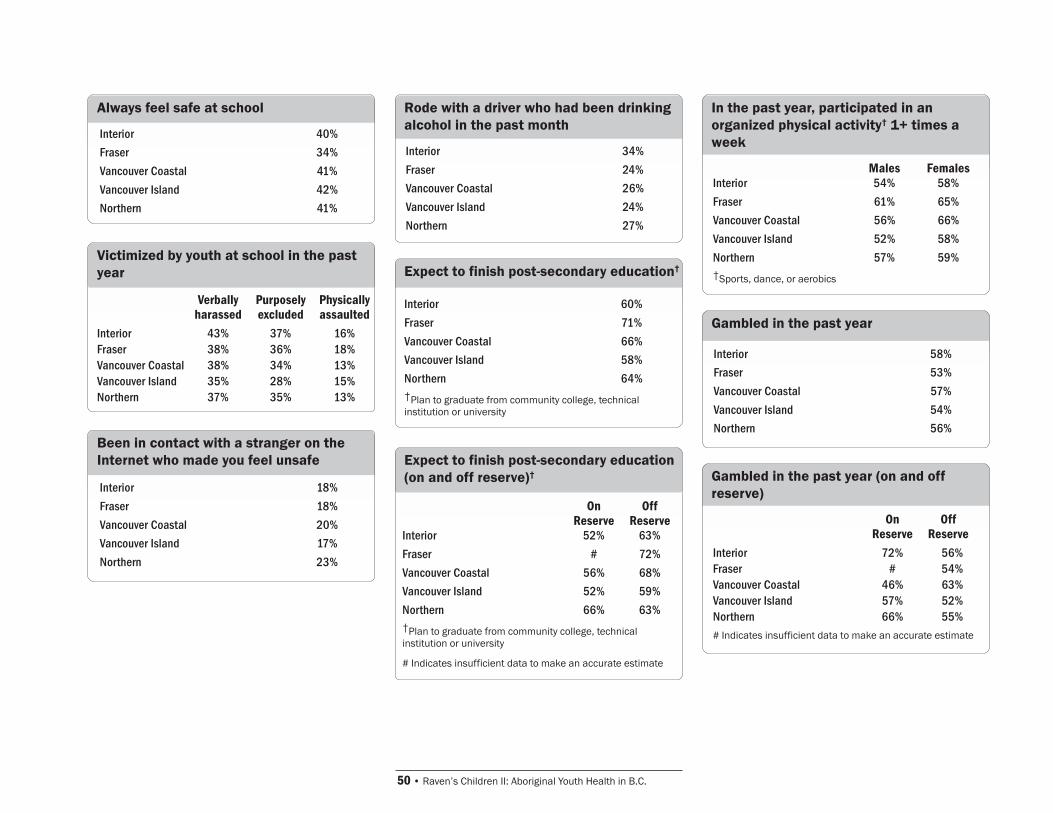
50 � Raven�s Children II: Aboriginal Youth Health in B.C.
Always feel safe at school
Victimized by youth at school in the pastyear
Verbally Purposely Physicallyharassed excluded assaulted
Interior 43% 37% 16%Fraser 38% 36% 18%Vancouver Coastal 38% 34% 13%Vancouver Island 35% 28% 15%Northern 37% 35% 13%
Been in contact with a stranger on theInternet who made you feel unsafe
Interior 18%Fraser 18%Vancouver Coastal 20%Vancouver Island 17%Northern 23%
Rode with a driver who had been drinkingalcohol in the past month
Expect to finish post-secondary education�
Interior 34%Fraser 24%Vancouver Coastal 26%Vancouver Island 24%Northern 27%
Expect to finish post-secondary education(on and off reserve)�
In the past year, participated in anorganized physical activity� 1+ times aweek
Gambled in the past year
Males FemalesInterior 54% 58%Fraser 61% 65%Vancouver Coastal 56% 66%Vancouver Island 52% 58%Northern 57% 59%�Sports, dance, or aerobics
On OffReserve Reserve
Interior 52% 63%Fraser # 72%Vancouver Coastal 56% 68%Vancouver Island 52% 59%Northern 66% 63%�Plan to graduate from community college, technicalinstitution or university
# Indicates insufficient data to make an accurate estimate
Gambled in the past year (on and offreserve)
On OffReserve Reserve
Interior 72% 56%Fraser # 54%Vancouver Coastal 46% 63%Vancouver Island 57% 52%Northern 66% 55%# Indicates insufficient data to make an accurate estimate
Interior 40%Fraser 34%Vancouver Coastal 41%Vancouver Island 42%Northern 41%
Interior 60%Fraser 71%Vancouver Coastal 66%Vancouver Island 58%Northern 64%�Plan to graduate from community college, technicalinstitution or university
Interior 58%Fraser 53%Vancouver Coastal 57%Vancouver Island 54%Northern 56%
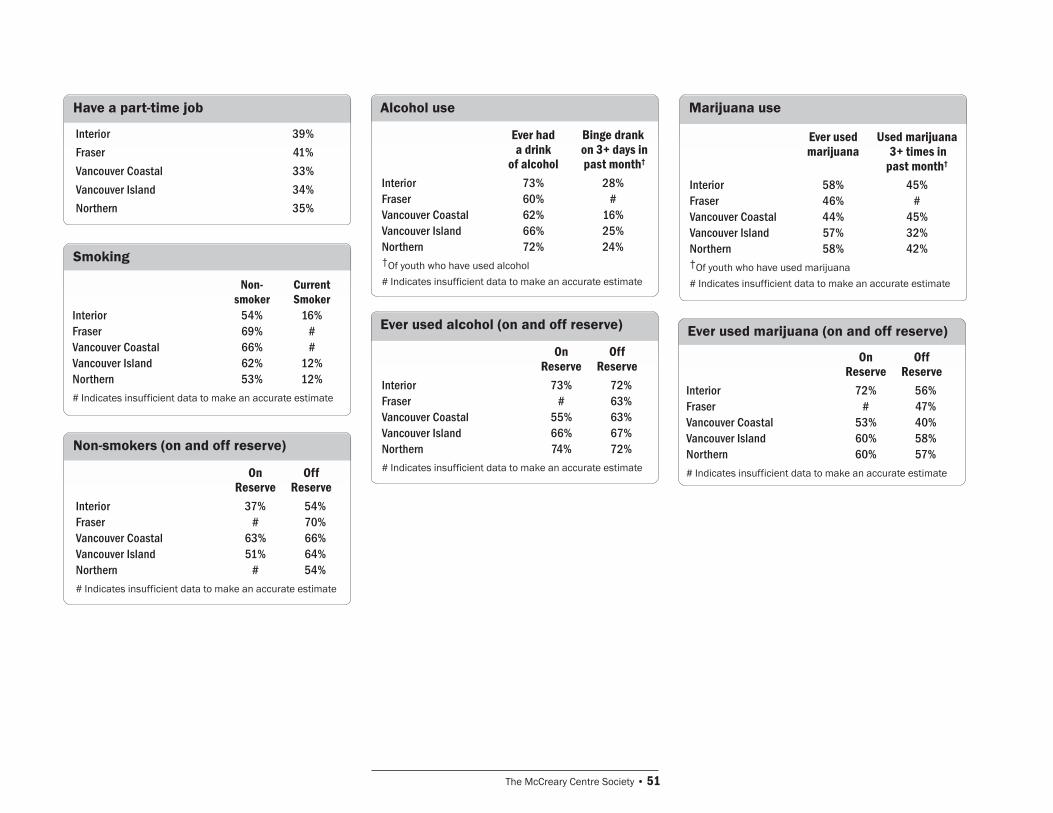
The McCreary Centre Society � 51
Have a part-time job
Smoking
Non- Currentsmoker Smoker
Interior 54% 16%Fraser 69% #Vancouver Coastal 66% #Vancouver Island 62% 12%Northern 53% 12%# Indicates insufficient data to make an accurate estimate
Non-smokers (on and off reserve)
On OffReserve Reserve
Interior 37% 54%Fraser # 70%Vancouver Coastal 63% 66%Vancouver Island 51% 64%Northern # 54%# Indicates insufficient data to make an accurate estimate
Alcohol use
Ever used alcohol (on and off reserve)
Ever had Binge dranka drink on 3+ days in
of alcohol past month�
Interior 73% 28%Fraser 60% #Vancouver Coastal 62% 16%Vancouver Island 66% 25%Northern 72% 24%�Of youth who have used alcohol
# Indicates insufficient data to make an accurate estimate
Marijuana use
Ever used marijuana (on and off reserve)
Interior 39%Fraser 41%Vancouver Coastal 33%Vancouver Island 34%Northern 35%
On OffReserve Reserve
Interior 73% 72%Fraser # 63%Vancouver Coastal 55% 63%Vancouver Island 66% 67%Northern 74% 72%# Indicates insufficient data to make an accurate estimate
Ever used Used marijuanamarijuana 3+ times in
past month�
Interior 58% 45%Fraser 46% #Vancouver Coastal 44% 45%Vancouver Island 57% 32%Northern 58% 42%�Of youth who have used marijuana
# Indicates insufficient data to make an accurate estimate
On OffReserve Reserve
Interior 72% 56%Fraser # 47%Vancouver Coastal 53% 40%Vancouver Island 60% 58%Northern 60% 57%# Indicates insufficient data to make an accurate estimate

52 � Raven�s Children II: Aboriginal Youth Health in B.C.
Appendix 2
Participating school districtsIn addition, there are important differences among communities and regions inthe province, for Aboriginal and non-Aboriginal youth. Questionnaires werecompleted by a sample of students from each of the province�s five regions:Interior, Fraser, Vancouver Coastal, Vancouver Island and Northern. Class-rooms in each school district were randomly selected to represent grade levels,rather than characteristics of individual students. Some school districts chosenot to participate in the survey, and these regions are not fully represented inthe report as a result.
InteriorParticipating school districts:Southeast Kootenay (SD #5)Rocky Mountain (SD #6)Kootenay Lake (SD #8)Arrow Lakes (SD #10)Revelstoke (SD #19)Kootenay-Columbia (SD #20)Vernon (SD #22)Central Okanagan (SD #23)Cariboo-Chilcotin (SD #27)Boundary (SD #51)Okanagan Similkameen (SD #53)Nicola-Similkameen (SD #58)Okanagan Skaha (SD #67)Kamloops/Thompson (SD #73)Gold Trail (SD #74)N. Okanagan-Shuswap (SD #83)
NorthernParticipating school districts:Quesnel (SD #28)Prince Rupert (SD #52)Bulkley Valley (SD #54)Prince George (SD #57)Coast Mountains (SD #82)Nechako Lakes (SD #91)
Non-participating school districts:Haida Gwaii/Queen Charlotte (SD #50)Peace River South (SD #59)Peace River North (SD #60)Fort Nelson (SD #81)Stikine (SD #87)Nisga�a (SD #92)
Vancouver CoastalParticipating school districts:Richmond (SD #38)Vancouver (SD #39)North Vancouver (SD #44)West Vancouver (SD #45)Sunshine Coast (SD #46)Powell River (SD #47)Howe Sound (SD #48)
Non-participating school districts:Central Coast (SD #49)
Vancouver IslandParticipating school districts:Greater Victoria (SD #61)Sooke (SD #62)Saanich (SD #63)Gulf Islands (SD #64)Nanaimo-Ladysmith (SD #68)Qualicum (SD #69)Alberni (SD #70)Campbell River (SD #72)Cowichan Valley (SD #79)Vancouver Island West (SD #84)
Non-participating school districts:Comox Valley (SD #71)Vancouver Island North (SD #85)
FraserParticipating school districts:Langley (SD #35)New Westminster (SD #40)Burnaby (SD #41)Maple Ridge (SD #42)Mission (SD #75)
Non-participating school districts:Chilliwack (SD #33)Abbotsford (SD #34)Surrey (SD #36)Delta (SD #37)Coquitlam (SD #43)Fraser-Cascade (SD #78)
The McCreary Centre Society � 53
McCreary Centre Society Publications
Reports for AHS IIIBritish Columbia Youth Health Trends: ARetrospective, 1992-2003 (2005)
Healthy Youth Development: Highlightsfrom the 2003 Adolescent Health Survey III(2004)
Adolescent Health Survey III RegionalReports for: Northwest; Northern Interior;Thompson Cariboo Shuswap; Okanagan;Coast Garibaldi/North Shore; KootenayBoundary; East Kootenay; North VancouverIsland; Central Vancouver Island; SouthVancouver Island; Vancouver; Richmond;Fraser; and Fraser North.
Reports for AHS IIHealthy Connections: Listening to BC Youth(1999)
Adolescent Health Survey II: RegionalReports for: Kootenays Region; OkanaganRegion; Thompson/Cariboo Region; UpperFraser Valley Region; South Fraser Region;Simon Fraser/Burnaby Region; CoastGaribaldi/North Shore Region; Central/Upper Island Region; North Region;Vancouver/Richmond Region; CapitalRegion; East Kootenay Region; KootenayBoundary Region; North Okanagan Region;Okanagan Similkameen Region; ThompsonRegion; Cariboo Region; Coast GaribaldiRegion; Central Vancouver Island Region;Upper Island/Central Coast Region; North
West Region; Peace Liard Region
Reports for AHS IAdolescent Health Survey: Province ofBritish Columbia (1993)
Adolescent Health Survey: Regional Reportsfor: Greater Vancouver Region; Fraser ValleyRegion; Interior Region; Kootenay Region;Northeast Region; Northwest Region; UpperIsland Region; and Capital Region (1993)
Special group surveys and topicreportsTime Out II: A Profile of BC Youth inCustody (2005)
Healthy Youth Development: TheOpportunity of Early Adolescence (2003)
Accenting the Positive: A developmentalframework for reducing risk and promotingpositive outcomes among BC youth (2002)
Violated Boundaries: A health profile ofadolescents who have been abused (2002)
Violence in adolescence: injury, suicide, andcriminal violence in the lives of BC youth(2002)
Between the Cracks: homeless youth inVancouver (2002)
Homeless youth: an annotated bibliography(2002)
Time Out: A profile of BC youth in custody(2001)
The Girls� Report: The Health of Girls inBC (2001)
No Place to Call Home: A Profile of StreetYouth in British Columbia (2001)
Making Choices: Sex, Ethnicity, and BCYouth (2000)
Raven�s Children: Aboriginal Youth Healthin BC (2000)
Lighting Up: Tobacco use among BC youth(2000)
Silk Road to Health: A Journey toUnderstanding Chinese Youth in BC (2000)
Mirror Images: Weight Issues Among BCYouth (2000)
Being Out-Lesbian, Gay, Bisexual &Transgender Youth in BC: An AdolescentHealth Survey (1999)
Our Kids Too-Sexually Exploited Youth inBritish Columbia: An Adolescent HealthSurvey (1999)
Adolescent Health Survey: AIDS-RelatedRisk Behaviour in BC Youth - AMulticultural Perspective (1997)
Adolescent Health Survey: Youth & AIDS inBritish Columbia (1994)
Adolescent Health Survey: Chronic Illness &Disability Among Youth in BC (1994)
Adolescent Health Survey: Street Youth inVancouver (1994)
Next StepThe Next Steps: A Workshop Toolkit toEngage Youth in Community Action. Aproject of the Adolescent Health Survey III(2005)
The Aboriginal Next Step: Results fromCommunity Youth Health Workshops (2001)
Our Communities � Our Health: YoungPeople Discuss Solutions To Their HealthIssues. The Next Step Report (2001)
Adolescent Health Survey: Next Step -Community Health Action By Youth.Results from 1994 Youth Health Seminars inBritish Columbia (1995)