Embed Size (px)
Citation preview

Abnormal Activation of Temporoparietal Language Areas DuringPhonetic Analysis in Children With Dyslexia
Joshua I. Breier, Panagiotis G. Simos, Jack M. Fletcher, Eduardo M. Castillo, Wenbo Zhang, andAndrew C. Papanicolaou
The University of Texas Health Science Center at Houston
Event-related magnetic fields were recorded using magnetoencephalography in children with(n � 12) and without (n � 11) dyslexia while they discriminated between pairs of syllablesfrom a voice onset time series (/ga/–/ka/). Nonimpaired readers exhibited left-hemispherepredominance of activity after the resolution of the N1m, whereas children with dyslexiaexperienced a sharp peak of relative activation in right temporoparietal areas between 300 and700 ms post–stimulus onset. Increased relative activation in right temporoparietal areas wascorrelated with reduced performance on phonological processing measures. Results areconsistent with the notion that deficits in appreciating the sound structure of both written andspoken language are associated with abnormal neurophysiological activity in temporoparietallanguage areas in children with dyslexia.
Dyslexia, a developmental disorder that affects up to 17%of the school-age population depending on the sample andhow it is defined (Lyon, 1995; B. A. Shaywitz & Shaywitz,1994), is characterized by difficulty in single-word decod-ing that is not the result of general developmental disabilityor sensory impairment (B. A. Shaywitz, Fletcher, & Shay-witz, 1995). Children with dyslexia also exhibit deficits inperception of speech at the phoneme level (Adlard & Hazan,1998; Brady, Shankweiler, & Mann, 1983; Breier, Gray, etal., 2001; de Gelder & Vroomen, 1998; Godfrey, Syrdal-Lasky, Millay, & Knox, 1981; Manis et al., 1997; McBride-Chang, 1995, 1996; Mody, Studdert-Kennedy, & Brady,1997; Reed, 1989). According to one view, these perceptualdeficits are closely related to a difficulty in developing anawareness of the phonological structure of speech that istypically observed in children with dyslexia. In turn, well-developed phonological awareness skills are a prerequisiteto acquiring normal reading skills (McBride-Chang, 1995,1996; Reed, 1989).
Recent evidence from functional brain imaging studiesindicate that both children and adults with dyslexia consis-
tently exhibit decreased activation of temporoparietal lan-guage areas in the left hemisphere during word recognitionand phonological decoding (Paulesu et al., 2001; Pugh et al.,2000; Rumsey et al., 1992; B. A. Shaywitz et al., 2002; S. E.Shaywitz et al., 1998; Simos, Breier, Fletcher, Bergman, &Papanicolaou, 2000; Simos, Breier, Fletcher, Foorman, etal., 2000). This region largely overlaps with Wernicke’sarea, encompassing three major sites within the posteriorportion of the superior temporal gyrus and often extendinginto the supramarginal gyrus: an area anterior to Heschl’sgyrus, the supratemporal plane that extends posterior toHeschl’s gyrus, and cortex on the dorsal bank of the supe-rior temporal sulcus (Binder et al., 2000; Jancke, Wusten-berg, Scheich, & Heinze, 2002; Wise et al., 2001). Theseareas are known to be engaged in tasks that require analysisof the sound structure of both written (Breier, Simos,Zouridakis, & Papanicolaou, 1999; Moore & Price, 1999;Rumsey et al., 1997; B. A. Shaywitz et al., 2002; Simos,Breier, Fletcher, Foorman, et al., 2000; Simos, Breier, et al.,2001) and spoken (Booth et al., 2002; Burton, Small, &Blumstein, 2000; Celsis et al., 1999; Demonet et al., 1992;Hickok, 2001; Kober et al., 2001; Newman & Twieg, 2001;Poldrack et al., 2001; Wong et al., 2002) language. Al-though anterior and posterior regions of the left hemisphereare observed to be engaged during the phonological analysisof both speech and print (Breier, Simos, Zouridakis, &Papanicolaou, 1999; Burton et al., 2000; Zeffiro & Eden,2000), it is believed that this region supports neurophysio-logical processes that are crucial for the integration oforthographic and phonological word representations duringreading (Booth et al., 2001; Gernsbacher & Kaschak, 2002;Moore & Price, 1999; Nakada, Fujii, Yoneoka, & Kwee,2001; Simos et al., 2002; Simos, Breier, Wheless, et al.,2000). To the extent that engagement of a given corticalarea in a particular cognitive function can be indexed by thedegree of neurophysiological activity observed in that area,measures of temporoparietal activation during speech per-ception could potentially shed light on the relationship
Joshua I. Breier, Panagiotis G. Simos, Eduardo M. Castillo,Wenbo Zhang, and Andrew C. Papanicolaou, Department of Neu-rosurgery, Division of Clinical Neurosciences, The University ofTexas Health Science Center at Houston: Jack M. Fletcher, De-partment of Pediatrics, The University of Texas Health ScienceCenter at Houston.
This work was partially supported by National Institutes ofHealth (NIH) Grant RO1 HD35938 to Joshua I. Breier and byNational Science Foundation Grant REC-9979968, NIH GrantNS37941-01, and National Institute of Child Health and HumanDevelopment Grant DA10715 to Andrew C. Papanicolaou.
Correspondence concerning this article should be addressed toJoshua I. Breier, Department of Neurosurgery, Division of ClinicalNeurosciences, The University of Texas Health Science Center atHouston, The Institute for Rehabilitation and Research, 1333Moursund Street, Suite H114, Houston, Texas 77030. E-mail:[email protected]
Neuropsychology Copyright 2003 by the American Psychological Association, Inc.2003, Vol. 17, No. 4, 610–621 0894-4105/03/$12.00 DOI: 10.1037/0894-4105.17.4.610
610

between reading disability and deficits in phonological pro-cessing and speech perception.
Functional brain imaging studies have provided mixedresults regarding the involvement of auditory associationareas, located near the temporoparietal junction of the lefthemisphere, in speech perception. Simos, Breier, Fletcher,Bergman, and Papanicolaou (2000), using magnetoencepha-lography (MEG), found no evidence for decreased activa-tion of left temporoparietal areas during a simple wordrecognition task. In a functional magnetic resonance imag-ing (fMRI) study, Corina et al. (2001) reported reducedhemodynamic signal in the supratemporal plane in the con-text of a task that placed more explicit demands on phono-logical processing (rhyme matching with pseudowords).Studies using positron emission tomography provide simi-larly diverse results. Rumsey et al. (1992) found reducedactivity in left temporoparietal areas in adults with dyslexiaduring an auditory word rhyming task. Flowers, Wood, andNaylor (1991) found a similar reduction during a task inwhich participants monitored a stream of concrete nouns forwords that were four letters in length. In contrast, Hagmanet al. (1992) found a reduction in activity in basal temporalareas bilaterally during a phoneme detection task, and Mc-Crory, Frith, Brunswick, and Price (2000) found a decreasein right superior temporal activation during real andpseudoword repetition tasks. Differences in imaging modal-ities, data reduction and analysis procedures, stimulus char-acteristics, task requirements, and participant selection cri-teria and demographics likely all contribute to the diversityof findings across studies.
In the current study, we used MEG to determine thefunctional state of temporoparietal language areas of the lefthemisphere during a simple speech perception task in chil-dren with and without dyslexia. MEG is a completely non-invasive method of functional brain imaging that provides adirect measure of neuronal activity by detecting regionallyelevated levels of intracellular electrical currents in largeneuronal aggregates (Lewine, 1990; Papanicolaou, 1998;Papanicolaou & Tarkka, 1996). We have previously estab-lished the spatiotemporal patterns of brain activation spe-cific to spoken word recognition (Breier, Simos, Zouridakis,& Papanicolaou, 1998; Breier, Simos, Zouridakis, & Papa-nicolaou, 1999; Papanicolaou et al., 1999, 2001; Simos,Breier, Zouridakis, & Papanicolaou, 1998a, 1998b) andhave verified their stability or reproducibility over time(Breier, Simos, Zouridakis, & Papanicolaou, 1999; Breier,Simos, Zouridakis, & Papanicolaou, 2000). Moreover, in aseries of investigations (Papanicolaou et al., 1999; Simos,Papanicolaou, et al., 1999), the validity and topographicalspecificity of these maps have been established by compar-ing them with the results of direct cortical stimulationmapping (Papanicolaou et al., 1999; Simos, Castillo, et al.,2001; Simos, Papanicolaou, et al., 1999) and with the resultsof the intracarotid amytal (Wada) procedure in more than 80consecutive patients (Breier, Simos, et al., 2001; Breier,Simos, Zouridakis, Wheless, et al., 1999; Maestu et al.,2002; Szymanski et al., 2001). In the current study weapplied these methods to study the spatiotemporal profile ofneurophysiological activity in temporoparietal language ar-
eas during the discrimination of pairs of tokens from a voiceonset time (VOT) series (/ga/–/ka/) in children with andwithout dyslexia. Adult readers without impairment exhibita large increase in the degree of activation in left as com-pared with right auditory association areas after the resolu-tion of the N1m during the same task (Papanicolaou et al.,2003). We predicted significantly reduced relative activa-tion of left-hemisphere auditory association areas in chil-dren with dyslexia, a profile similar to that found duringtasks that involve phonological decoding of print.
Method
Participants
Twenty-three children, ranging in age from 8.4 to 12.6 years(M � 10.8, SD � 1.4), served as participants. The WechslerAbbreviated Scale of Intelligence (WASI; Wechsler, 1999) wasadministered to estimate intellectual abilities. In order to eliminatechildren with below average intelligence, a Full Scale IQ above 79was required for participation in the study. All children had normalhearing in both ears, as assessed with pure-tone threshold audio-metric screening at 250, 500, 1000, 2000, 4000, and 8000 Hz at 20dB HL (American Speech–Language–Hearing Association Audio-logic Assessment Panel, 1997), a normal tympanogram (used toassess middle ear function), English as the primary language, andno history of neurological disorder. All children were right-handdominant as indicated by a score of �.4 or greater on the Edin-burgh Handedness Inventory (Oldfield, 1971). The protocol usedin this study received full approval from the Institutional ReviewBoard of the University of Texas Health Science Center at Hous-ton. Potential participants were identified through contacts main-tained by the authors with parents, advocacy groups, and profes-sionals who work with the local school districts and private agen-cies. Parents initiated contact with the authors, and children weretested after parents had given informed consent and children hadgiven informed assent.
Children were identified as having dyslexia based on severalachievement measures, including (a) the Basic Reading Cluster ofthe Woodcock Reading Mastery Tests—Revised (Woodcock,1998), which consists of the Word Attack (decoding ofpseudowords) and Word Identification (decoding of real words)subtests; (b) the Spelling subtest of the Wechsler IndividualAchievement Test (Wechsler, 1992); and (c) the Test of WordReading Efficiency (Torgesen & Wagner, 1999) which measuresspeed of word reading and decoding. Standard scores on thesethree measures were averaged to form a composite. Children wereplaced into the RD group on the basis of a composite score at orbelow 90, with at least two of the three tests being at or below thiscutoff (Breier, Gray, et al., 2001). This criterion is similar to thatused in other studies (Fletcher et al., 1994; Foorman, Francis,Fletcher, & Lynn, 1996; Joanisse, Manis, Keating, & Seidenberg,2000; Manis et al., 1997; Post, Swank, Hiscock, & Fowler, 1999;B. A. Shaywitz & Shaywitz, 1994; Stanovich & Siegel, 1994).Using these methods, we identified 12 children as having dyslexiaand 11 as having no impairment (NI). In addition to the abovetests, all children were administered the Phoneme Elision, Memoryfor Digits, and Rapid Letter Naming subtests of the Comprehen-sive Test of Phonological Processing (CTOPP; Wagner, Torgesen,& Rashotte, 1999) as measures of phonological processing skills.The Hollingshead two-factor index of social position (Hollings-head, 1975) was used to assess socioeconomic status (SES). Chil-dren were also screened for specific language impairment (SLI)using the Concepts and Directions and Recalling Sentences
611ABNORMAL TEMPOROPARIETAL ACTIVATION IN DYSLEXIA

subtests of the Clinical Evaluation of Language Functions —3(Semel, Wiig, & Secord, 1995) as well as the Vocabulary subtestof the WASI. Children with a scaled score below 7 on all threetests were identified as having SLI and excluded from the study(Joanisse et al., 2000).
Demographic data and group means on IQ measures are pre-sented in Table 1. Group means on achievement and phonologicalprocessing measures are presented in Table 2. Group comparisonsfor continuous variables were performed using two-sample t testswith a Welch–Satterthwaite correction for nonhomogeneity ofvariance. Fisher’s exact test was used to test for differences indistributions between groups for categorical variables. There wereno significant differences between the NI and dyslexic groups inage, SES, or ethnicity. The percentage of females was higher in theNI group ( p � .05). Two children in the dyslexic group had ahistory of diagnosis with attention-deficit/hyperactivity disorder—predominantly inattentive type. These children did not take theirusual daily dosage of psychostimulant medication (methylpheni-date) until after MEG imaging had been performed. Both groupshad mean Full Scale IQ scores within the average range; however,children with dyslexia had significantly lower Full Scale ( p � .01)and Verbal IQ ( p � .001) scores. These findings are not surprisingas lowering of language functions is commonly found in childrenwith dyslexia (B. A. Shaywitz, Fletcher, & Shaywitz, 1995). Thegroups did not differ on Performance IQ. As expected, childrenwith dyslexia performed significantly below those without dys-lexia on academic achievement tests used for group placement aswell as the phonological processing measures.
Stimuli
Seven consonant–vowel tokens that formed a velar voicingseries with VOT values ranging from 0 to 60 ms in 10-ms stepsserved as stimuli. The syllables were prepared using the cascadebranch of the Klatt88 software synthesizer. Variation of VOT wasachieved by broadening the bandwidth of F1 and exciting F2 andF3 with a noise source during the period between stimulus onsetand voicing source onset. The fundamental frequency (F0) wasconstant at 120 Hz for all syllables. The nominal formant frequen-cies at stimulus onset were 300 Hz, 1840 Hz, and 1960 Hz andchanged linearly across a 55-ms transition period to 768 Hz, 1333Hz, and 2522 Hz. The transitions were followed by a 200-mssteady state segment resulting in a total stimulus length of 255 ms.In addition, the relative balance of low-frequency energy in thevoicing source was enhanced by setting the spectral tilt parameterof the Klatt synthesizer to 10 along the entire length of the syllable.Finally, the voiced portions of the stimuli were low-pass filtered at3200 Hz.
Stimuli were presented binaurally in pairs with an onset-to-onsetinterval of 2 s between pair members. The first stimulus in everypair was an endpoint stimulus (either a /ga/ with a 0-ms VOT or a/ka/ with a �60-ms VOT), with an equal number of trials for eachstimulus. In one half of the trials the second stimulus was a tokenfrom the series at least four steps away in VOT (e.g., 40-, 50-, or60-ms VOT when the first stimulus was a /ga/ and 0-, 10-, or20-ms VOT when the first stimulus was a /ka/), randomly chosen.On the other half of the trials the first stimulus was repeated. Matchand mismatch trials were randomly interspersed. Children werefamiliarized with the task using five pairs of endpoint stimuli in theMEG unit under the same conditions as the test. During both
Table 1Demographic and IQ Data by Group
MeasureNo impairment
(n � 11)Dyslexia(n � 12)
Age (in years)M 11.2 10.4SD 1.2 1.4
SexFemale 6 1Male 5 11
Socioeconomic status(Hollingshead Social Class)
I 2 1II 4 3III 3 8IV 2 0
RaceWhite 7 11Black 2 1Hispanic 2 0
Attention-deficit/hyperactivitydisorder 0 2
WASI Full Scale IQ(standard score)
M 109.3 101.2SD 7.6 9.5
WASI Verbal IQ (standard score)M 113.2 98.2SD 8.3 7.5
WASI Performance IQ(standard score)
M 104.5 104.3SD 11.1 14.2
Note. WASI � Wechsler Abbreviated Scale of Intelligence.
Table 2Academic Achievement and Phonological Processing TestData by Group
MeasureNo impairment
(n � 11)Dyslexia(n � 12)
WRMT–R Basic Reading ClusterM 105.3 86.7SD 9.0 5.4
WRMT–R Word IdentificationM 105.7 86.2SD 9.5 5.4
WRMT–R Word AttackM 103.8 89.8SD 8.0 7.0
Test of Word Reading EfficiencyM 99.6 62.3SD 11.4 12.1
Wechsler Individual AchievementTest—Spelling
M 105.5 81.3SD 11.0 6.9
CTOPP–phoneme elisionM 108.9 89.3SD 6.3 15.1
CTOPP–immediate memoryfor digits
M 97.1 80.3SD 19.0 13.3
CTOPP–rapid letter namingM 106.8 80.0SD 6.6 18.8
Note. WRMT–R � Woodcock Reading Mastery Tests—Re-vised; CTOPP � Comprehensive Test of Phonological Processing.
612 BREIER ET AL.
training and the MEG recordings, children were asked to decide ifthe two tokens in each pair were the same or different, respondingby raising their right (or left) index finger if the tokens were thesame. The responding hand was counterbalanced across partici-pants. The interval between stimulus pairs was varied randomlyacross trials between 3 and 4 s. Stimulus delivery was accom-plished via two 5-m-long plastic tubes terminating in ear inserts,and sound intensity was 80 dB SPL at the participant’s outer ear.Event-related magnetic fields (ERFs) were recorded to the firststimulus of each pair to ensure that the observed neurophysiolog-ical activity reflected processes involved in the analysis of thespeech stimuli rather than the cognitive and motor processesinvolved in the participant’s response. There was no significantdifference in accuracy ( p � .4) between the RD (M � 77%, SD �5%) and NI (M � 77%, SD � 6%) groups.
MEG Procedures
MEG recordings were conducted with a whole-head, 148-chan-nel Magnes WH 2500 neuromagnetometer array (4-D Neuroim-aging, San Diego, CA) housed in a magnetically shielded chamber.The magnetic flux measurements were filtered with a bandpassfilter between 0.1 and 20 Hz and digitized at 250 Hz. Intrinsicnoise in each channel was less than 10 fT/�Hz. The amount ofmagnetic noise produced by remote sources was further reducedby submitting the MEG data to an adaptive noise reduction pro-cedure that is part of the signal analysis software. This procedureuses the magnetic flux recordings obtained online from nine “ref-erence sensors” (three magnetometers, three first-order axial gra-diometers, and three second-order axial gradiometers) located at adistance of approximately 30 cm above the array of 148 magne-tometers. The distance between these reference sensors and theintracranial generators of magnetic flux ensures that they recordonly “extraneous” flux (i.e., flux that is not due to neuronalcurrents). Following each recording session, the magnetic fluxvalues recorded at each time point within each epoch are, inessence, subtracted from the corresponding magnetic values mea-sured by each of the 148 magnetometers. A minimum of 60single-trial ERF segments were averaged separately for each sen-sor after excluding those containing eye movement (as indicatedby a peak-to-peak amplitude in the electrooculogram in excessof 50 �V), myogenic, or mechanical artifacts. Finally, the aver-aged epochs were adjusted relative to the mean amplitude in the150-ms prestimulus period to remove direct current offset.
The intracranial generators of the observed ERFs at successive4-ms intervals were modeled as equivalent current dipoles (ECDs)by using the nonlinear Levenberg–Marquardt algorithm on aspherical head model. This method was used to search for the ECDsource that was most likely to have produced the observed mag-netic field distribution at a given point in time (according to theBiot–Savart law; e.g., Sarvas, 1987). ECD solutions were consid-ered as satisfactory if they were associated with a correlationcoefficient of at least .90 between the observed and the “best”predicted magnetic field distribution. The source estimation algo-rithm was applied to the magnetic flux measurements obtainedfrom a group of 34–38 channels, always including both magneticflux extrema. Source location was computed in reference to aCartesian coordinate system defined by a set of three anatomicallandmarks (fiduciary points): the right and left external meatusesand the nasion. The line passing through the right and left externalmeatuses served as the y-axis. The line between the nasion and themidpoint of the y-axis defined the x-axis, and the line perpendic-ular to the x–y plane, passing through the intersection of the x-axisand y-axis, defined the z-axis. The position of the magnetometersrelative to the participant’s head was precisely determined using
five coils, three of which were attached to the fiduciary points andtwo on the forehead. The coils were turned on briefly at thebeginning and again at the end of the recording session, and theirprecise location in three-dimensional space was determined usinga localization algorithm built into the system. During the recordingsession, a fiber-optic motion detector was used to ensure that theparticipant did not change position relative to the sensor.
Orthogonal coronal, sagittal, and axial T1-weighted structuralMRI images were obtained using a Signa 1.5 system (GeneralElectric, Fairfield, CT) (repetition time � 13.6 ms, echotime � 4.8 ms, recording matrix 256 � 256 pixels, 1 excitation,240-mm field of view, and 1.4-mm slice thickness). Precise coreg-istration of the MEG coordinate system with structural MRI im-ages was achieved by aligning MEG fiduciary points with highcontrast cod liver capsules (3 mm in diameter), which were affixedto the participant’s nasion and inserted in the external meatus priorto MRI scan.
The total number of successive activity sources that accountedfor the ERF components between 200 ms and 1,000 ms post–stimulus offset was used to estimate the degree, or total duration,of stimulus-locked neurophysiological activation in a particulararea. Studies from our group and others (Breier, Simos, et al.,2001; Breier, Simos, Zouridakis, Wheless, et al., 1999; Papanico-laou et al., 1999; Simos, Breier, et al., 1999; Simos, Breier,Zouridakis, & Papanicolaou, 1998a, 1998b; Simos, Papanicolaou,et al., 1999) support the concurrent validity of this procedure forconstructing brain activation profiles. These studies have shownthat this procedure is sufficiently accurate for identifying (a) thehemisphere that is more prominently involved in basic linguisticfunctions and (b) specific regions within the dominant hemispherethat are indispensable for particular cognitive processes such asdecoding and encoding of spoken and printed words.
The construct validity of the measure of brain activation used inthis procedure reflects the degree to which the measure provides anaccurate representation of both the spatial and the temporal extentof regionally elevated levels of neurophysiological activity. Aneurologically plausible rationale for using the number of sequen-tial activity sources as one such measure can be summarized asfollows. Processing of an incoming auditory stimulus requiresengagement of neurophysiological processes in primary auditoryand nearby association cortices. These processes involve instanta-neous increases in neuronal signaling in one or more neuronalpopulations. This, in turn, produces a time-limited increase inintracellular currents which, integrated, can be represented as anelectrical dipole. The greater the strength of the dipole (i.e., themagnitude of intracellular current) at each point in time, the greaterthe strength of the resulting magnetic flux. Given the dipolar natureof the source, which is concurred by the dipolar appearance of therecorded magnetic flux distribution (or contour map), the greaterthe strength of the recorded magnetic flux, the higher the likeli-hood that the parameters of the underlying source will be com-puted with a sufficient degree of confidence by the dipole-fittingalgorithm. The correlation coefficient between the observed and anideal or hypothesized underlying source is a widely used index ofthe degree to which the computed source solution approximatesthat of a dipolar source. In fact, the vast majority of activitysources were associated with correlations of .95 or greater. Thismeasure of goodness of fit reflects how well the computed dipoleparameters account for the observed distribution of magnetic fluxrecorded by the 148 magnetometer sensors at each 4-ms time slice.This correlation criterion was derived empirically in the context ofthe validation studies mentioned above.
It should be pointed out that this is a simplified account, as inreality other factors also contribute to the strength of the recorded
613ABNORMAL TEMPOROPARIETAL ACTIVATION IN DYSLEXIA

magnetic flux, such as the depth and orientation of the corticalpatch containing the active neurons relative to the plane of eachmagnetometer sensor and, of course, the characteristics of back-ground noise, or magnetic flux, produced by sources not related tothe neurophysiological activity that processing of the stimuli en-tails. The empirically established concurrent validity of this mea-sure (Breier, Simos, et al., 2001; Breier, Simos, Zouridakis,Wheless, et al., 1999; Maestu et al., 2002; Papanicolaou et al.,1999; Simos, Breier, et al., 1999; Simos et al., 1998a; Simos,Papanicolaou, et al., 1999), however, lends credence to the plau-sibility of the claim that the duration of focal cortical activity maybe a measure of the “degree of engagement” of a particular corticalregion in a given task. This measure is complementary to othersimilarly derived measures used by other imaging modalities, suchas the spatial extent of cortex that shows differential hemodynamicmodulation across two different tasks.
Results
Localization of MEG Activity Sources
As expected, analyses indicated typical early and latecomponents in all children (see Figure 1). The early portionof the ERF was dominated by the N1m component, whichtypically extended to about 200 ms post–stimulus onset.Sources of this early N1m component were generally dis-tributed bilaterally on the floor of the Sylvian fissure inchildren from both groups. As these sources reflect activa-
tion of primary auditory cortex (Nakasato et al., 1997;Pantev & Lutkenhoner, 2000; Zouridakis, Simos, Breier, &Papanicolaou, 1998), they are not considered further inthese analyses.
MEG activity occurring after the resolution of the N1mcomponent (i.e., between approximately 200 and 1,000 mspost–stimulus onset) is generally associated with activationof auditory association cortex (Breier, Simos, et al., 2001;Breier, Simos, Zouridakis, Wheless, et al., 1999; Papanico-laou et al., 1999; Papanicolaou et al., 2003; Simos, Castillo,et al., 2001; Simos, Papanicolaou, et al., 1999). Late MEGactivity sources (after 200 ms post–stimulus onset) werefound in every child in the left and/or right temporoparietallanguage areas (primarily in Brodmann’s area 22). Thisregion included cortex within the supratemporal plane andthe dorsal bank of the superior temporal sulcus in theposterior portion of the superior temporal gyrus, often ex-tending into nearby supramarginal gyrus. Activity sourceswere also observed in approximately half of the children inthe mesial temporal lobe (7 of 12 children with dyslexia, 6of 11 NI children) and the middle temporal gyrus (6 of 12children with dyslexia, 7/11 NI children) in the left and/orright hemispheres. Occasional activity was observed in theangular, inferior frontal, and/or inferior temporal gyri in theleft and/or right hemispheres. Because of the lack of con-sistent activation in these other areas, and as we were
Figure 1. Sample event-related magnetic field (ERF) waveforms to the consonant–vowel stimulifrom a child in the group with no impairment. Both waveforms were recorded at the sites ofmaximum magnetic outflux at the peak of the N1m component (first major deflection) over the left(top line) and right (bottom line) hemispheres. Stimulus onset is at zero. The magnitude of early ERFcomponents (usually between 60 and 200 ms) is bilaterally symmetrical with activity sourceslocalized at or near the primary auditory cortex. Later components (after 200 ms or the resolutionof the N1m component) are usually greater in amplitude over the left as compared with the righthemisphere and are associated with a greater number of consecutive activity sources localizedprimarily in auditory association cortices, although some activity sources are also found in thesupramarginal and middle temporal gyri and mesial temporal cortex.
614 BREIER ET AL.

specifically interested in interhemispheric asymmetries inactivity occurring in temporoparietal cortices, we restrictedanalyses to this region.
Hemispheric Asymmetries in MEG Activity inTemporoparietal Areas
Individual MEG scans from a representative NI child(top) and a child with dyslexia (bottom) are presented inFigure 2. The activation profile displayed by children in theNI group is characterized by a dense concentration of ac-tivity sources in the left hemisphere, with relatively sparseractivity in homotopic areas of the right hemisphere. Incontrast, the profile associated with dyslexia consists of awell-formed map in the right hemisphere. Although activityis also observed in left temporoparietal areas, it is somewhatmore diffuse and the map is not as well-defined.
Group differences in relative activity in left and righttemporoparietal areas were analyzed by forming a hemi-spheric asymmetry index (AI) for each child according tothe following formula:
�number of sources in right temporoparietal areas� number of sources in left temporoparietal areas
total number of sources in leftand right temporoparietal areas
.
AI scores were submitted to a one-way analysis of variance(ANOVA) with group membership (dyslexic, NI) as theindependent variable. Full Scale IQ and gender were in-cluded as covariates, as the NI and dyslexic groups differedon these two factors. There was a significant effect of group,F(1, 19) � 4.57, p � .05 (�2 � .19). There were nosignificant effects for IQ ( p � .35) or gender ( p � .8). Themean AI for each group is presented in Figure 3. A morenegative number indicates more relative activity in lefttemporoparietal areas. Whereas NI children exhibited moreactivity in left as compared with right temporoparietal areas,children with dyslexia showed, on average, more bilaterallyequivalent activity.
Timing of Relative Activation of Left and RightTemporoparietal Areas
A separate index of the degree of hemispheric asymmetryin temporoparietal activity was computed for each of theeight successive 100-ms time windows, beginning at theresolution of the N1m component (200–299 ms post–stimu-lus onset, 300–399 post–stimulus onset, etc.). Mean asym-metry indices for each group are plotted as a function oftime in Figure 4. Group effects for these AIs were evaluatedusing a multivariate approach to a repeated measuresANOVA with time window as the within-subjects factor
Figure 2. Individual magnetoencephalography scans from a child in the group with no impairment(NI; top) and a child in the group with dyslexia (bottom). Late activity sources (i.e., those occurringafter 200 ms post–stimulus onset) are represented by orange circles. As can be seen, the NI profileconsists of a well-formed map of activity in the left temporoparietal region with relatively reducedactivity in homotopic areas of the right hemisphere. In contrast, the profile associated with dyslexiaconsists of a well-formed map in the right temporoparietal region with equivalent but more diffuseactivity in homotopic areas of the left hemisphere.
615ABNORMAL TEMPOROPARIETAL ACTIVATION IN DYSLEXIA

and group (dyslexic, NI) as the between-subjects factor. FullScale IQ and gender served as covariates. There was asignificant Time Window � Group interaction, F(7,13) � 3.38, p � .028 (�2 � .65), indicating that groupdifferences on AI scores varied with time. There were nosignificant main or interaction effects for IQ or gender.Follow-up analysis within each time window using a criticalvalue of p � .0063 (.05/8) indicated significant effects forthe two time windows between 400 ms and 600 ms post–stimulus onset. As can be seen in Figure 4, NI childrenexhibit left-hemisphere lateralization of MEG activationacross the later portions of the recorded epoch. After theresolution of the N1m, however, children with dyslexiaexhibit a relative increase in MEG activity in the righthemisphere beginning at about 300 ms to 400 ms and lastinguntil about 600 ms to 700 ms post–stimulus onset.
The Relationship Between Abnormal Activity inTemporoparietal Areas and Phonological ProcessingSkills
As expected, children with dyslexia exhibited significantdeficits on phonological processing tasks, including pho-neme elision, immediate phonological memory, and rapidautomatized naming (see Table 2). We therefore examinedthe relationship between the amount of relative activation inright temporoparietal areas between 300 and 700 ms post–stimulus onset, the time window for the sharp peak ofabnormal activation in dyslexic children observed in theabove analyses, and the performance on phonological pro-cessing tasks using regression analyses with gender and FullScale IQ score as covariates. To evaluate statistical signif-icance, we used a nominal alpha of .0167 (.05/3) to maintainfamilywise Type I error rate at .05.
Analyses indicated a significant correlation between theAI for temporoparietal activity occurring between the300-ms and 700-ms time window and the Phoneme Elision
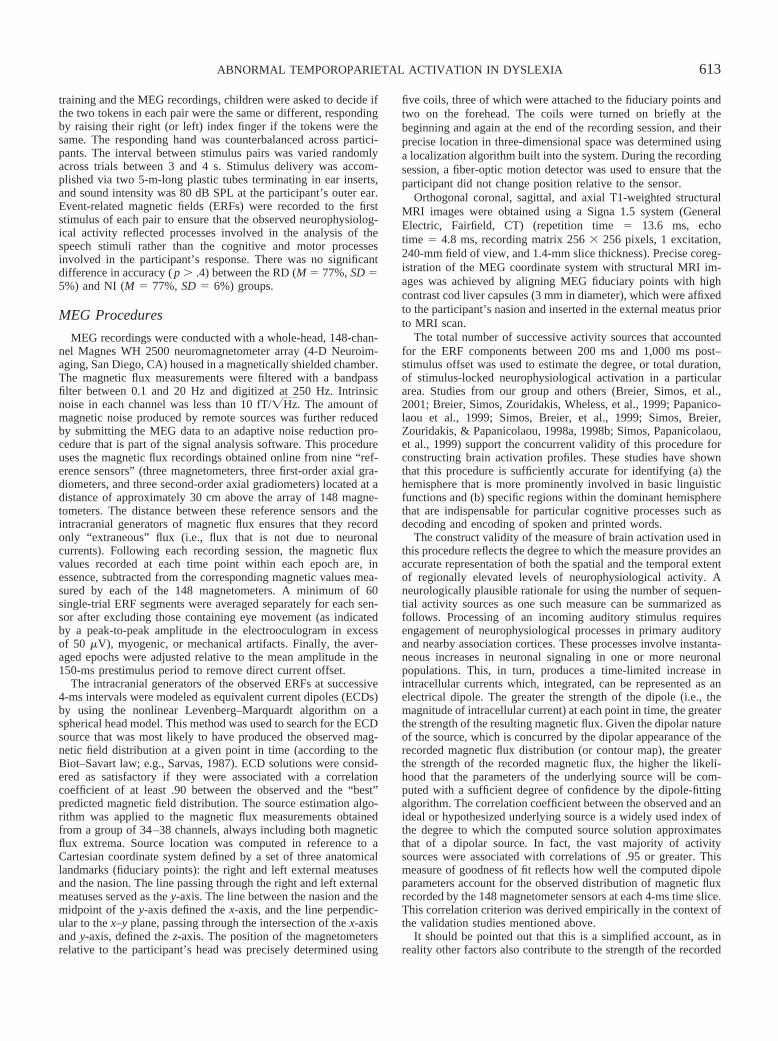
(pr � �.52, p � .016) subtest of the CTOPP, a measure ofphonemic awareness. There was also a marginally signifi-cant correlation between the MEG AI and rapid letter nam-ing (pr � �.49, p � .025). The correlation between the AIscores and the scores on the immediate phonological mem-ory for digits ( p � .20) were not significant. Age- andgender-adjusted phoneme elision scores are plotted as afunction of the MEG asymmetry index in Figure 5. Poorerperformance on the measure of phonological awareness(indicated by a lower z score) is associated with increasedrelative activity in right temporoparietal areas (indicated bya more positive number).
Discussion
In the current study, children with dyslexia demonstratedaberrant profiles of neurophysiological activity during theperceptual analysis of speech stimuli. Although activity intemporoparietal auditory association areas was observedbilaterally in virtually all children, NI children exhibitedrelatively greater activity in the left hemisphere as com-pared with the right hemisphere, a profile similar to thatobserved in adults performing the same task (Papanicolaouet al., 2003). In contrast, children with dyslexia generallyexhibited a reduced degree of lateralization of activity to theleft auditory association cortices, with a sharp increase inrelative activation of homotopic areas of the right hemi-sphere between 300 ms and 700 ms post–stimulus onset.These findings were independent of IQ and gender.
A large body of evidence suggests that posterior temporalcortex plays a crucial role in phonological analysis. How-ever, the precise functional organization of this region,which is part of the auditory association cortices, is not
Figure 4. Relative number of late magnetoencephalography(MEG) activity sources in right (r) as compared with left (l)temporoparietal areas [(right � left)/(right � left)] for childrenwith no impairment (NI) and children with dyslexia for successive100-ms time windows beginning after the resolution of the N1m.A more negative number indicates more relative activity in the lefthemisphere. Time windows with significant group differences( p � .05) are marked by asterisks.
Figure 3. Relative number of late magnetoencephalography(MEG) activity sources in right (r) as compared with left (l)temporoparietal areas [(right � left)/(right � left)] for childrenwith no impairment (NI) and children with dyslexia. A morenegative number indicates more relative activity in left temporopa-rietal areas (error bars indicate standard errors of the mean).
616 BREIER ET AL.
clear. According to one view, auditory association corticesin the left hemisphere can be subdivided, on the basis offunctional criteria, into three subregions: an area anterior toHeschl’s gyrus, the supratemporal plane that extends pos-terior to Heschl’s gyrus, and a cortex located on the dorsalbank of the superior temporal sulcus (e.g., Binder et al.,2000; Gernsbacher & Kaschak, 2002; Poeppel, 2001; Price,2000). Although predominant activation in one or more ofthe aforementioned superior temporal loci in the left hemi-sphere has been reported by some investigators in responseto speech stimuli (Binder et al., 2000; Burton et al., 2000;Demonet et al., 1992; Vouloumanos, Kiehl, Werker, &Liddle, 2001), others have failed to find hemispheric asym-metries in task-related changes in blood flow in this region(Belin, Zatorre, & Ahad, 2002; Jancke et al., 2002). UsingMEG, which measures neurophysiological activity in amore direct fashion than hemodynamic imaging methods,we found evidence for bilaterally symmetric activation ofprimary auditory cortices during the early stages of process-ing of simple speech stimuli (0–200 ms after stimulusonset), immediately followed by predominantly left-hemi-sphere activation of auditory association cortices in adultswithout reading problems (Papanicolaou et al., 2003). As inthe current study, Papanicolaou et al. (2003) observed earlyactivity primarily in the vicinity of the primary auditorycortex, in and around Heschl’s gyri. Later activity wasfound in all three major subregions of posterior temporalcortex listed above. Furthermore a comparison of the degreeof activity between speech sounds and nonspeech analogssuggested that speech sounds receive specialized processingby neurophysiological mechanisms located in the posterior
part of the left superior temporal gyrus even when thestimuli have no lexical referents. In the Papanicolaou et al.(2003) study, activation profiles associated with the percep-tion of speech and nonspeech stimuli were distinguishableon the basis of both anatomical and temporal features. Thus,both speech sounds and nonspeech analogs activated leftposterior temporal areas to the same extent during the earlystages of stimulus processing. Regional activation wasgreater, however, in response to speech than to nonspeechstimuli during the later stages of processing. Other studieshave shown that as the demands for lexical–semantic pro-cessing increase, activation appears to spread to more ven-tral areas, notably the middle temporal gyrus (Binder et al.,2000; Binder, Frost, Hammeke, Rao, & Cox, 1996; Booth etal., 2002; Castillo et al., 2001). Thus, data from MEGstudies support the notion that auditory association areasalong the left superior temporal gyrus are specialized for theanalysis of spoken language. Evidence for such specializa-tion, in the form of lateralized neurophysiological activityoccurring between approximately 200 ms and 1,000 mspost–stimulus onset, has been found in both adults andchildren who are normal readers.
Our group and others have shown that specific corticalsites within the auditory association cortex in the left hemi-sphere are functionally specialized for, and serve as indis-pensable components of, the brain circuit that supports,phonological processing of both spoken and printed linguis-tic stimuli. This notion is clearly supported by evidence that(a) word stimuli presented in either the visual or the audi-tory modality activate the same superior temporal loci at thesame latencies (e.g., Simos et al., 1998b), (b) electricalinterference with these sites selectively impairs the ability toprocess speech (Simos, Papanicolaou, Breier, et al., 1999),and (c) electrical currents applied transiently to the samecortical locations impair the ability to extract phonologicalinformation from pronounceable letter strings that lack lex-ical referents (pseudowords; Simos, Breier, Wheless, et al.,2000). It is therefore not surprising that children and adultswith severe reading disability (a) have pronounced difficul-ties in tasks that require mental manipulation of the phono-logical representations of spoken utterances and (b) showsignificantly reduced activation in left-hemisphere posteriortemporal cortices during tasks that involve phonologicaldecoding of print (Horwitz, Rumsey, & Donohue, 1998;Paulesu et al., 2001; Pugh et al., 2000; Shaywitz et al., 1998;Simos, Breier, Fletcher, Bergman, & Papanicolaou, et al.,2000; Simos, Breier, Fletcher, Foorman, et al., 2000). Anassociated increase in activity in homotopic areas of theright hemisphere has been observed in a number of studiesas well (Pugh et al., 2000; Simos, Breier, Fletcher, Berg-man, et al., 2000; Simos, Breier, Fletcher, Foorman, et al.,2000).
The present study extends findings, from studies usingreading tasks, by providing evidence that children withdyslexia may lack the predominant involvement of left-hemisphere auditory association cortices exhibited by chil-dren and adults without reading problems during the per-formance of a simple speech perception task. The task usedin the current study was specifically chosen to isolate the
Figure 5. Plot of performance on a measure of phonologicalawareness, the Phoneme Elision subtest of the ComprehensiveTest of Phonological Processing (a more negative number indi-cates worse performance), as a function of hemispheric asymme-tries in temporoparietal activation (a more positive number indi-cates greater lateralization of activity to the right hemisphere) forchildren with no impairment (NI) and children with dyslexia.Increased lateralization of activity to the right hemisphere is asso-ciated with poorer performance on this measure of phonologicalawareness.
617ABNORMAL TEMPOROPARIETAL ACTIVATION IN DYSLEXIA

neurophysiological processes involved in the acoustic andphonetic analysis of speech, minimizing memory-relatedand lexical processes. Event-related magnetic activity wasrecorded in response to the first stimulus of each pair tofurther ensure that the brain activity recorded correspondedto speech perception and did not reflect the additional cog-nitive operations that matching of the stimuli entails. Thelack of engagement of auditory association cortices duringspeech perception noted in the current study is consistentwith previous reports of aberrant changes in hemodynamicsduring engagement in other speech-processing tasks in in-dividuals with reading difficulties (Corina et al., 2001;Flowers et al., 1991; Rumsey et al., 1992).
Whether the late increase in right-hemisphere engage-ment characteristic of the present dyslexia group representscompensatory engagement of right-hemisphere auditory as-sociation areas in speech processing or the result of the useof alternative perceptual strategies, which are normally sup-ported by the right hemisphere, cannot be determined withcertainty at present. However, evidence suggests that re-duced activity in left-hemisphere and increased activity inright-hemisphere auditory association areas is a marker ofthe core functional deficit in reading disability and not anepiphenomenon. Children with dyslexia exhibit consistentdeficits on tasks requiring knowledge of the segmentalstructure of speech, or phonological awareness, and thesedeficits likely have a role in the etiology of dyslexia (Brad-ley & Bryant, 1983; Fletcher et al., 1994; Shankweiler &Crain, 1986; Stanovich & Siegel, 1994; Wagner et al.,1994). Children with dyslexia also show deficits in tasksthat tap into acoustic or phonetic processing abilities (Ad-lard & Hazan, 1998; Brady et al., 1983; Breier, Gray, et al.,2001; de Gelder & Vroomen, 1998; Godfrey et al., 1981;Manis et al., 1997; Mody et al., 1997; Reed, 1989). In thecurrent study, a significant relation was found between thedegree of hemispheric asymmetry in the activation of audi-tory association cortices and measures of phonological pro-cessing, including phonemic awareness. Increased relativeactivity in right posterior temporal areas was associatedwith reduced ability to segment spoken utterances as well asslowed access to letter sounds. These relationships appearedto be specific to children with dyslexia, suggesting that theremay be a continuum of dysfunction in left temporoparietalareas in children with dyslexia and that variance in phone-mic awareness in NI children may be related to otherfactors.
Although the speech signal is a complex quasicontinuousevent without intrinsic linguistic structure, representationsoccur in phonological store as discrete, ordered segmentswith distinct phonetic features (Liberman, Mann, Shank-weiler, & Werfelman, 1982). Thus, the process by which thephonetic structure of the speech signal is extracted is centralnot only to acquiring phonemic awareness but also, as thebeginning reader must learn to map graphemes onto thesediscrete segments (Treiman, Broderick, Tincoff, & Rodri-guez, 1998; Wagner & Torgesen, 1987; Wagner et al.,1994), to learning to read. This hierarchical relationshipbetween perceptual analysis, phonemic awareness, andreading has received empirical support from behavioral
studies (Breier, Gray, et al., 2001; McBride-Chang, 1996;Watson & Miller, 1993). It is therefore of significant interestthat current findings suggest that children with dyslexia andnormal readers differ in the brain mechanisms underlyingthe appreciation of the sound structure of spoken as well aswritten language. Although these results support hypothesesthat deficits in phonetic analysis may provide a more fun-damental basis for phonological processing deficits andultimately difficulty in acquiring reading skills, alternativeexplanations must also be considered. Phonetic analysis,phonological processing, and reading disability in childrenwith dyslexia may be correlated through a common cause:abnormal neurophysiological function in areas of the brainspecialized for these purposes. Further brain-imaging, ge-netic, and behavioral studies are needed to explore thedirection of the relationships between abnormalities in brainand behavioral function in dyslexia.
References
Adlard, A., & Hazan, V. (1998). Speech perception in childrenwith specific reading difficulties (dyslexia). Quarterly Journalof Experimental Psychology A, 51, 153–177.
American Speech–Language–Hearing Association Audiologic As-sessment Panel. (1997). Guidelines for audiologic screening.Rockville, MD: Author.
Belin, P., Zatorre, R. J., & Ahad, P. (2002). Human temporal-loberesponse to vocal sounds. Brain Research, Cognitive BrainResearch, 13, 17–26.
Binder, J. R., Frost, J. A., Hammeke, T. A., Bellgowan, P. S.,Springer, J. A., Kaufman, J. N., & Possing, E. T. (2000). Humantemporal lobe activation by speech and nonspeech sounds. Ce-rebral Cortex, 10, 512–528.
Binder, J. R., Frost, J. A., Hammeke, T. A., Rao, S. M., & Cox,R. W. (1996). Function of the left planum temporale in auditoryand linguistic processing. Brain, 119, 1239–1247.
Booth, J. R., Burman, D. D., Meyer, J. R., Gitelman, D. R., Parrish,T. B., & Mesulam, M. M. (2002). Modality independence ofword comprehension. Human Brain Mapping, 16, 251–261.
Booth, J., Burman, D., Van Santen, F., Harasaki, Y., Gitelman, D.,Parrish, T., & Mesulam, M. M. (2001). The development ofspecialized brain systems in reading and oral-language. Neuro-psychology, Development, and Cognition. Section C, Child Neu-ropsychology, 7, 119–141.
Bradley, L., & Bryant, P. E. (1983). Categorization of sounds andlearning to read—A causal connection. Nature, 301, 419–421.
Brady, S., Shankweiler, D., & Mann, V. (1983). Speech perceptionand memory coding in relation to reading ability. Journal ofExperimental Child Psychology, 35, 345–367.
Breier, J. I., Gray, L., Fletcher, J. M., Diehl, R. L., Klaas, P.,Foorman, B. R., & Molis, M. R. (2001). Perception of voice andtone onset time continua in children with dyslexia with andwithout attention deficit/hyperactivity disorder. Journal of Ex-perimental Child Psychology, 80, 245–270.
Breier, J. I., Simos, P. G., Wheless, J. W., Constantinou, J. E.,Baumgartner, J. E., Venkataraman, V., & Papanicolaou, A. C.(2001). Language dominance in children as determined by mag-netic source imaging and the intracarotid amobarbital proce-dure: A comparison. Journal of Child Neurology, 16, 124–130.
Breier, J. I., Simos, P. G., Zouridakis, G., & Papanicolaou, A. C.(1998). Relative timing of neuronal activity in distinct temporallobe areas during a recognition memory task for words. Journalof Clinical and Experimental Neuropsychology, 20, 782–790.
618 BREIER ET AL.

Breier, J. I., Simos, P. G., Zouridakis, G., & Papanicolaou, A. C.(1999). Temporal course of regional brain activation associatedwith phonological decoding. Journal of Clinical and Experi-mental Neuropsychology, 21, 465–476.
Breier, J. I., Simos, P. G., Zouridakis, G., & Papanicolaou, A. C.(2000). Lateralization of activity associated with language func-tion using magnetoencephalography: A reliability study. Jour-nal of Clinical Neurophysiology, 17, 503–510.
Breier, J. I., Simos, P. G., Zouridakis, G., Wheless, J. W., Will-more, L. J., Constantinou, J. E., et al. (1999). Language domi-nance determined by magnetic source imaging: A comparisonwith the Wada procedure. Neurology, 53, 938–945.
Burton, M. W., Small, S. L., & Blumstein, S. E. (2000). The roleof segmentation in phonological processing: An fMRI investi-gation. Journal of Cognitive Neuroscience, 12, 679–690.
Castillo, E. M., Simos, P. G., Davis, R. N., Breier, J., Fitzgerald,M. E., & Papanicolaou, A. C. (2001). Levels of word processingand incidental memory: Dissociable mechanisms in the tempo-ral lobe. Neuroreport, 12, 3561–3566.
Celsis, P., Boulanouar, K., Doyon, B., Ranjeva, J. P., Berry, I.,Nespoulous, J. L., & Chollet, F. (1999). Differential fMRIresponses in the left posterior superior temporal gyrus and leftsupramarginal gyrus to habituation and change detection insyllables and tones. Neuroimage, 9, 135–144.
Corina, D. P., Richards, T. L., Serafini, S., Richards, A. L., Steury,K., Abbott, R. D., et al. (2001). fMRI auditory language differ-ences between dyslexic and able reading children. Neurore-port, 12, 1195–1201.
de Gelder, B., & Vroomen, J. (1998). Impaired speech perceptionin poor readers: Evidence from hearing and speech reading.Brain and Language, 64, 269–281.
Demonet, J. F., Chollet, F., Ramsay, S., Cardebat, D., Nespoulous,J. L., Wise, R., et al. (1992). The anatomy of phonological andsemantic processing in normal subjects. Brain, 115, 1753–1768.
Fletcher, J. M., Shaywitz, S. E., Shankweiler, D. P., Katz, L.,Liberman, I. Y., Stuebing, K. K., et al. (1994). Cognitive pro-files of reading disability: Comparisons of discrepancy and lowachievement definitions. Journal of Educational Psychol-ogy, 86, 6–23.
Flowers, D. L., Wood, F. B., & Naylor, C. E. (1991). Regionalcerebral blood flow correlates of language processes in readingdisability. Archives of Neurology, 48, 637–643.
Foorman, B. R., Francis, D. J., Fletcher, J. M., & Lynn, A. (1996).Relation of phonological and orthographic processing to earlyreading: Comparing two approaches to regression-based, read-ing-level matched designs. Journal of Educational Psychol-ogy, 4, 639–652.
Frost, J. A., Binder, J. R., Springer, J. A., Hammeke, T. A.,Bellgowan, P. S., Rao, S. M., & Cox, R. W. (1999). Languageprocessing is strongly left lateralized in both sexes. Evidencefrom functional MRI. Brain, 122, 199–208.
Gernsbacher, M. A., & Kaschak, M. P. (2002). Neuroimagingstudies of language production and comprehension. Annual Re-view of Psychology, 17, 17.
Godfrey, J. J., Syrdal-Lasky, A. K., Millay, K. K., & Knox, C. M.(1981). Performance of dyslexic children on speech perceptiontests. Journal of Experimental Child Psychology, 32, 401–424.
Hagman, J. O., Wood, F., Buchsbaum, M. S., Tallal, P., Flowers,L., & Katz, W. (1992). Cerebral brain metabolism in adultdyslexic subjects assessed with positron emission tomographyduring performance of an auditory task. Archives of Neurol-ogy, 49, 734–739.
Hickok, G. (2001). Functional anatomy of speech perception andspeech production: Psycholinguistic implications. Journal ofPsycholinguistic Research, 30, 225–235.
Hollingshead, A. B. (1975). Four factor index of social status.Unpublished manuscript, Yale University, New Haven, CT.
Horwitz, B., Rumsey, J. M., & Donohue, B. C. (1998). Functionalconnectivity of the angular gyrus in normal reading and dys-lexia. Proceedings of the National Academy of Sciences,USA, 95, 8939–8944.
Jancke, L., Wustenberg, T., Scheich, H., & Heinze, H. J. (2002).Phonetic perception and the temporal cortex. Neuroimage, 15,733–746.
Joanisse, M. F., Manis, F. R., Keating, P., & Seidenberg, M. S.(2000). Language deficits in dyslexic children: Speech percep-tion, phonology, and morphology. Journal of ExperimentalChild Psychology, 77, 30–60.
Kober, H., Moller, M., Nimsky, C., Vieth, J., Fahlbusch, R., &Ganslandt, O. (2001). New approach to localize speech relevantbrain areas and hemispheric dominance using spatially filteredmagnetoencephalography. Human Brain Mapping, 14, 236–250.
Lewine, J. D. (1990). Neuromagnetic techniques for the noninva-sive analysis of brain function. In S. E. Freeman, E. Fukushima,& E. R. Green (Eds.), Noninvasive techniques in biology andmedicine (pp. 33–74). San Francisco: San Francisco Press.
Liberman, I. Y., Mann, V. A., Shankweiler, D., & Werfelman, M.(1982). Children’s memory for recurring linguistic and nonlin-guistic material in relation to reading ability. Cortex, 18, 367–375.
Lyon, G. R. (1995). Toward a definition of dyslexic. Annals ofDyslexia, 45, 3–27.
Maestu, F., Ortiz, T., Fernandez, A., Amo, C., Martin, P., Fernan-dez, S., & Sola, R. G. (2002). Spanish language mapping usingMEG: A validation study. Neuroimage, 17, 1579–1586.
Manis, F. R., McBride-Chang, C., Seidenberg, M. S., Keating, P.,Doi, L. M., Munson, B., & Petersen, A. (1997). Are speechperception deficits associated with developmental dyslexia?Journal of Experimental Child Psychology, 66, 211–235.
McBride-Chang, C. (1995). Phonological processing, speech per-ception, and reading disability: An integrative review. Educa-tional Psychologist, 30, 109–121.
McBride-Chang, C. (1996). Models of speech perception andphonological processing in reading. Child Development, 67,1836–1856.
McCrory, E., Frith, U., Brunswick, N., & Price, C. (2000). Ab-normal functional activation during a simple word repetitiontask: A PET study of adult dyslexics. Journal of CognitiveNeuroscience, 12, 753–762.
Mody, M., Studdert-Kennedy, M., & Brady, S. (1997). Speechperception deficits in poor readers: Auditory processing or pho-nological coding? Journal of Experimental Child Psychol-ogy, 64, 199–231.
Moore, C. J., & Price, C. J. (1999). Three distinct ventral occipi-totemporal regions for reading and object naming. Neuroim-age, 10, 181–192.
Nakada, T., Fujii, Y., Yoneoka, Y., & Kwee, I. L. (2001). Planumtemporale: Where spoken and written language meet. EuropeanNeurology, 46, 121–125.
Nakasato, N., Kumabe, T., Kanno, A., Ohtomo, S., Mizoi, K., &Yoshimoto, T. (1997). Neuromagnetic evaluation of corticalauditory function in patients with temporal lobe tumors. Journalof Neurosurgery, 86, 610–618.
619ABNORMAL TEMPOROPARIETAL ACTIVATION IN DYSLEXIA

Newman, S. D., & Twieg, D. (2001). Differences in auditoryprocessing of words and pseudowords: An fMRI study. HumanBrain Mapping, 14, 39–47.
Oldfield, R. C. (1971). The assessment and analysis of handedness:The Edinburgh inventory. Neuropsychologia, 9, 97–113.
Pantev, C., & Lutkenhoner, B. (2000). Magnetoencephalographicstudies of functional organization and plasticity of the humanauditory cortex. Journal of Clinical Neurophysiology, 17, 130–142.
Papanicolaou, A. C. (1998). Fundamentals of functional brainimaging. Lisse, The Netherlands: Swets & Zeitlinger.
Papanicolaou, A. C., Simos, P. G., Breier, J. I., Castillo, E. M.,Davis, R. N., Wheless, J. W., et al. (2001). Magnetoencepha-lography (MEG): A method comparable to the Wada procedurefor language laterality assessment. Epilepsia, 42, 75.
Papanicolaou, A. C., Simos, P. G., Breier, J. I., Zouridakis, G.,Willmore, L. J., Wheless, J. W., et al. (1999). Magnetoencepha-lographic mapping of the language-specific cortex. Journal ofNeurosurgery, 90, 85–93.
Papanicolaou, A. C., Simos, P. G., Castillo, E. M., Breier, J. I.,Davis, R. N., & Diehl, R. L. (2003). Differential brain activationpatterns during perception of voice and tone onset time series: AMEG study. Neuroimage, 18, 448–459.
Papanicolaou, A. C., & Tarkka, I. M. (1996). Magnetoencepha-lography. In E. D. Bigler (Ed.), Neuroimaging: Vol. 1. Basicscience (pp. 161–183). New York: Plenum Press.
Paulesu, E., Demonet, J. F., Fazio, F., McCrory, E., Chanoine, V.,Brunswick, N., et al. (2001, March 16). Dyslexia: Culturaldiversity and biological unity. Science, 291, 2165–2167.
Poeppel, D. (2001). A critical review of PET studies of phonolog-ical processing. Journal of Psycholinguistic Research, 30, 225–235.
Poldrack, R. A., Temple, E., Protopapas, A., Nagarajan, S., Tallal,P., Merzenich, M., & Gabrieli, J. D. (2001). Relations betweenthe neural bases of dynamic auditory processing and phonolog-ical processing: Evidence from fMRI. Journal of CognitiveNeuroscience, 13, 687–697.
Post, Y. V., Swank, P. R., Hiscock, M., & Fowler, A. E. (1999).Identification of vowel speech sounds by skilled and less skilledreaders and the relation with vowel spelling. Annals of Dys-lexia, 49, 162–194.
Price, C. J. (2000). The anatomy of language: Contributions fromfunctional neuroimaging. Journal of Anatomy, 197, 335–359.
Pugh, K. R., Mencl, W. E., Jenner, A. R., Katz, L., Frost, S. J., Lee,J. R., et al. (2000). Functional neuroimaging studies of readingand reading disability (developmental dyslexia). Mental Retar-dation and Developmental Disabilities Research Review, 6,207–213.
Reed, M. A. (1989). Speech perception and the discrimination ofbrief auditory cues in reading disabled children. Journal ofExperimental Child Psychology, 48, 270–292.
Rumsey, J. M., Andreason, P., Zametkin, A. J., Aquino, T., King,A. C., Hamburger, S. D., et al. (1992). Failure to activate the lefttemporoparietal cortex in dyslexia: An oxygen 15 positron emis-sion tomographic study. Archives of Neurology, 49, 527–534.
Rumsey, J. M., Nace, K., Donohue, B., Wise, D., Maisog, J. M., &Andreason, P. (1997). A positron emission tomographic study ofimpaired word recognition and phonological processing in dys-lexic men. Archives of Neurology, 54, 562–573.
Sarvas, J. (1987). Basic mathematical and electromagnetic con-cepts of the biomagnetic inverse problem. Physics in Medicineand Biology, 32, 11–22.
Semel, E., Wiig, E., & Secord, W. (1995). Clinical evaluation oflanguage fundamentals (3rd ed.). San Antonio, TX: Psycholog-ical Corporation.
Shankweiler, D., & Crain, S. (1986). Language mechanisms andreading disorder: A modular approach. Cognition, 24, 139–168.
Shaywitz, B. A., Fletcher, J. M., & Shaywitz, S. E. (1995). De-fining and classifying learning disability and attention-deficit/hyperactivity disorder. Journal of Child Neurology, 10(Suppl.1), S50–S57.
Shaywitz, B. A., & Shaywitz, S. E. (1994). Learning disabilitiesand attention disorders. In K. Swaiman (Ed.), Principles ofpediatric neurology (pp. 1119–1151). St. Louis, MO: Mosby.
Shaywitz, B. A., Shaywitz, S. E., Pugh, K. R., Mencl, W. E.,Fulbright, R. K., Skudlarski, P., et al. (2002). Disruption ofposterior brain systems for reading in children with develop-mental dyslexia. Biological Psychiatry, 52, 101–110.
Shaywitz, S. E., Shaywitz, B. A., Pugh, K. R., Fulbright, R. K.,Constable, R. T., Mencl, W. E., et al. (1998). Functional dis-ruption in the organization of the brain for reading in dyslexia.Proceedings of the National Academy of Sciences, USA, 95,2636–2641.
Simos, P. G., Breier, J. I., Fletcher, J. M., Bergman, E., & Papa-nicolaou, A. C. (2000). Cerebral mechanisms involved in wordreading in dyslexic children: A magnetic source imaging ap-proach. Cerebral Cortex, 10, 809–816.
Simos, P. G., Breier, J. I., Fletcher, J. M., Foorman, B. R.,Bergman, E., Fishbeck, K., & Papanicolaou, A. C. (2000). Brainactivation profiles in dyslexic children during nonword reading:A magnetic source imaging study. Neuroscience Letters, 290,61–65.
Simos, P. G., Breier, J. I., Fletcher, J. M., Foorman, B. R., Castillo,E. M., & Papanicolaou, A. C. (2002). Brain mechanisms forreading words and pseudowords: An integrated approach. Ce-rebral Cortex, 12, 297–305.
Simos, P. G., Breier, J. I., Fletcher, J. M., Foorman, B. R.,Mouzaki, A., & Papanicolaou, A. C. (2001). Age-relatedchanges in regional brain activation during phonological decod-ing and printed word recognition. Developmental Neuropsy-chology, 19, 191–210.
Simos, P. G., Breier, J. I., Maggio, W. W., Gormley, W. B.,Zouridakis, G., Willmore, L. J., et al. (1999). Atypical temporallobe language representation: MEG and intraoperative stimula-tion mapping correlation. Neuroreport, 10, 139–142.
Simos, P. G., Breier, J. I., Wheless, J. W., Maggio, W. W.,Fletcher, J. M., Castillo, E. M., & Papanicolaou, A. C. (2000).Brain mechanisms for reading: The role of the superior temporalgyrus in word and pseudoword naming. Neuroreport, 11, 2443–2447.
Simos, P. G., Breier, J. I., Zouridakis, G., & Papanicolaou, A. C.(1998a). Assessment of functional cerebral laterality for lan-guage using magnetoencephalography. Journal of Clinical Neu-rophysiology, 15, 364–372.
Simos, P. G., Breier, J. I., Zouridakis, G., & Papanicolaou, A. C.(1998b). Identification of language-specific brain activity usingmagnetoencephalography. Journal of Clinical and ExperimentalNeuropsychology, 20, 706–722.
Simos, P. G., Castillo, E. M., Fletcher, J. M., Francis, D. J.,Maestu, F., Breier, J. I., et al. (2001). Mapping of receptivelanguage cortex in bilingual volunteers by using magneticsource imaging. Journal of Neurosurgery, 95, 76–81.
Simos, P. G., Papanicolaou, A. C., Breier, J. I., Wheless, J. W.,Constantinou, J. E., Gormley, W. B., & Maggio, W. W. (1999).
620 BREIER ET AL.

Localization of language-specific cortex by using magneticsource imaging and electrical stimulation mapping. Journal ofNeurosurgery, 91, 787–796.
Stanovich, K. E., & Siegel, L. S. (1994). Phenotypic performanceprofile of children with reading disabilities: A regression-basedtest of the phonological-core variable-difference model. Journalof Educational Psychology, 86, 24–53.
Szymanski, M. D., Perry, D. W., Gage, N. M., Rowley, H. A.,Walker, J., Berger, M. S., & Roberts, T. F. (2001). Magneticsource imaging of late evoked field responses to vowels: To-ward an assessment of hemipsheric dominance for language.Journal of Neurosurgery, 94, 445–453.
Torgesen, J. K., & Wagner, R. (1999). Test of Word ReadingEfficiency. Austin, TX: Pro-Ed.
Treiman, R., Broderick, V., Tincoff, R., & Rodriguez, K. (1998).Children’s phonological awareness: Confusions between pho-nemes that differ only in voicing. Journal of Experimental ChildPsychology, 68, 3–21.
Vouloumanos, A., Kiehl, K. A., Werker, J. F., & Liddle, P. F.(2001). Detection of sounds in the auditory stream: Event-related fMRI evidence for differential activation to speech andnonspeech. Journal of Cognitive Neuroscience, 13, 994–1005.
Wagner, R. K., & Torgesen, J. K. (1987). The nature of phono-logical processing and its causal role in the acquisition ofreading skills. Psychological Bulletin, 101, 192–212.
Wagner, R. K., Torgesen, J. K., & Rashotte, C. A. (1994): Devel-opment of reading-related phonological processing abilities:New evidence of bidirectional causality from a latent variablelongitudinal study. Developmental Psychology, 30, 73–87.
Wagner, R., Torgesen, J., & Rashotte, C. (1999). Examiner’smanual: Comprehensive Test of Phonological Processing. Aus-tin, TX: Pro-Ed.
Watson, B. U., & Miller, T. K. (1993). Auditory perception,phonological processing, and reading ability/disability. Journalof Speech and Hearing Research, 36, 850–863.
Wechsler, D. (1992). Manual for the Wechsler Individual Achieve-ment Test. San Antonio, TX: Psychological Corporation.
Wechsler, D. (1999). Manual for the Wechsler Abbreviated Scaleof Intelligence. San Antonio, TX: Psychological Corporation.
Wise, R. J., Scott, S. K., Blank, S. C., Mummery, C. J., Murphy,K., & Warburton, E. A. (2001). Separate neural subsystemswithin “Wernicke’s area.” Brain, 124, 83–95.
Wong, D., Pisoni, D. B., Learn, J., Gandour, J. T., Miyamoto,R. T., & Hutchins, G. D., (2002). PET imaging of differentialcortical activation by monaural speech and nonspeech stimuli.Hearing Research, 166, 9–23.
Woodcock, R. W. (1998). Woodcock Reading Mastery Tests—Revised examiner’s manual. Circle Pines, MN: American Guid-ance Services.
Zeffiro, T., & Eden, G. (2000). The neural basis of developmentaldyslexia. Annals of Dyslexia, 50, 3–30.
Zouridakis, G., Simos, P. G., Breier, J. I., & Papanicolaou, A. C.(1998). Functional hemispheric asymmetry assessment in a vi-sual language task using MEG. Brain Topography, 11, 57–65.
Received January 28, 2002Revision received February 20, 2003
Accepted February 21, 2003 �
621ABNORMAL TEMPOROPARIETAL ACTIVATION IN DYSLEXIA