Embed Size (px)
Citation preview
1
GM
O Q
uant
itat
ive
Res
earc
h
abcd2003 Pensions Convention
1 - 3 JuneGrand Hotel, Brighton
TMT 1999 – 2001 A Bubble MovieAn analysis of the biggest investment bubble in history!
Simon Harris, GMO
What happened: a reminderUK Equities
GM
O Q
uant
itat
ive
Res
earc
h
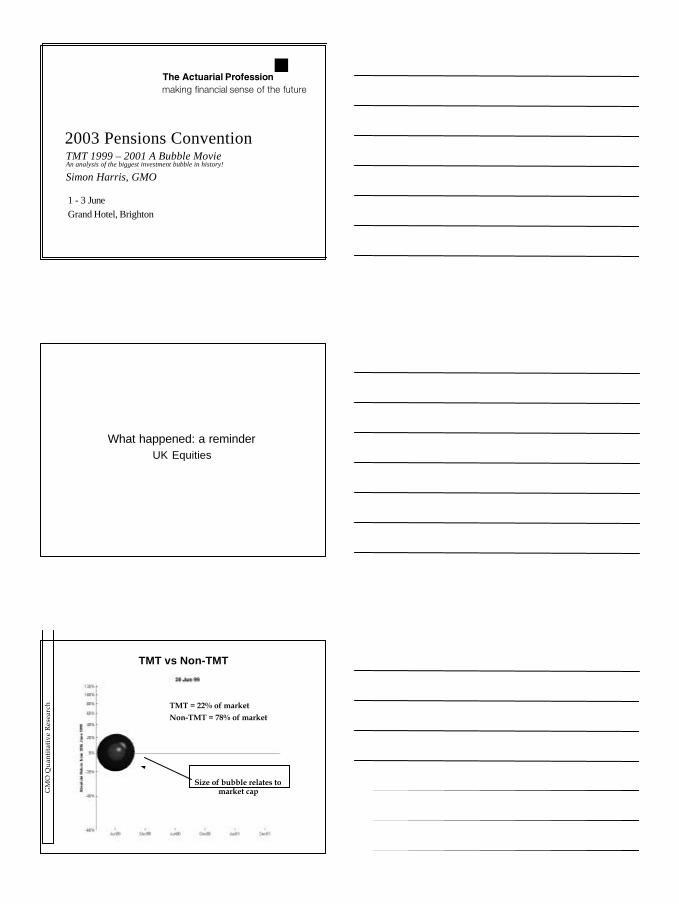
TMT vs Non-TMT
Size of bubble relates tomarket cap
Non-TMT = 78% of marketTMT = 22% of market
2
GM
O Q
uant
itat
ive
Res
earc
h
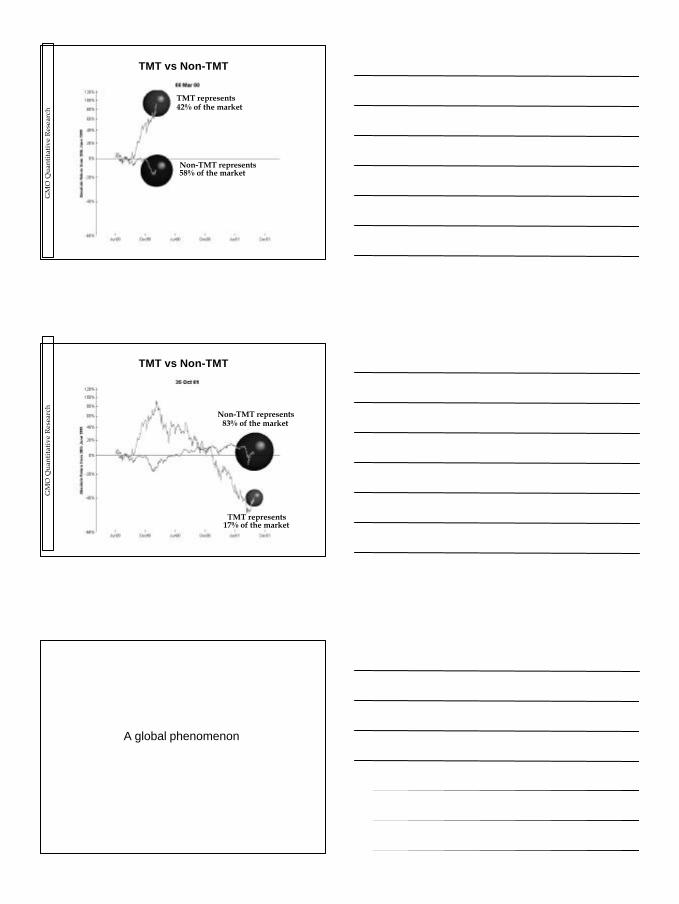
TMT vs Non-TMT
TMT represents42% of the market
Non-TMT represents58% of the market
GM
O Q
uant
itat
ive
Res
earc
h
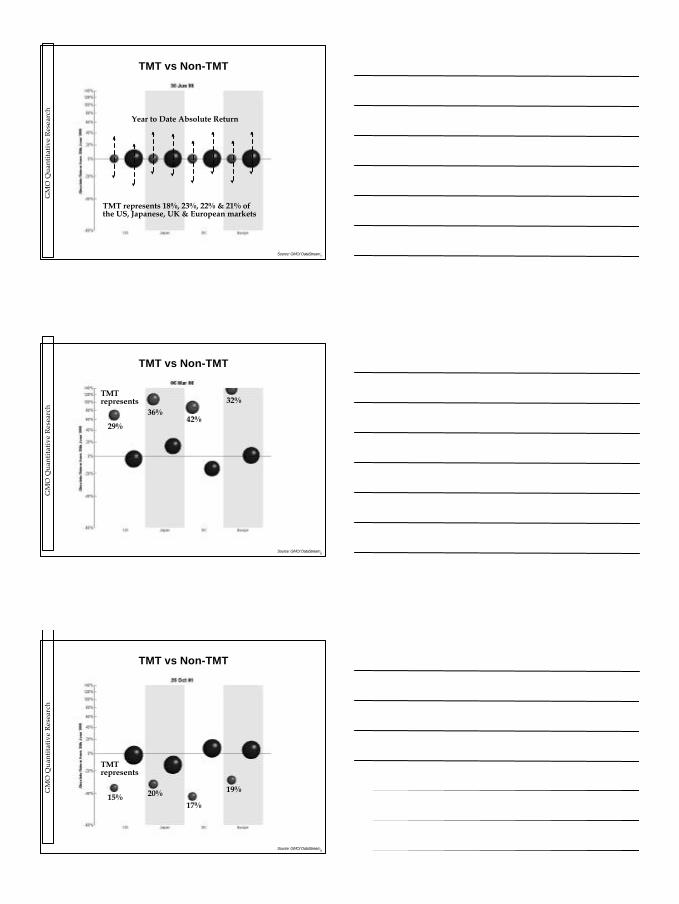
TMT vs Non-TMT
TMT represents17% of the market
Non-TMT represents83% of the market
A global phenomenon
3
GM
O Q
uant
itat
ive
Res
earc
h
7
TMT represents 18%, 23%, 22% & 21% ofthe US, Japanese, UK & European markets
Year to Date Absolute Return
TMT vs Non-TMT
Source: GMO/ DataStream
GM
O Q
uant
itat
ive
Res
earc
h
8
29%
36%42%
32%
TMT vs Non-TMT
TMTrepresents
Source: GMO/ DataStream
GM
O Q
uant
itat
ive
Res
earc
h
9
15% 20%17%
19%
TMT vs Non-TMT
TMTrepresents
Source: GMO/ DataStream
4
GM
O Q
uant
itat
ive
Res
earc
h
It really was silly season!
GM
O Q
uant
itat
ive
Res
earc
h
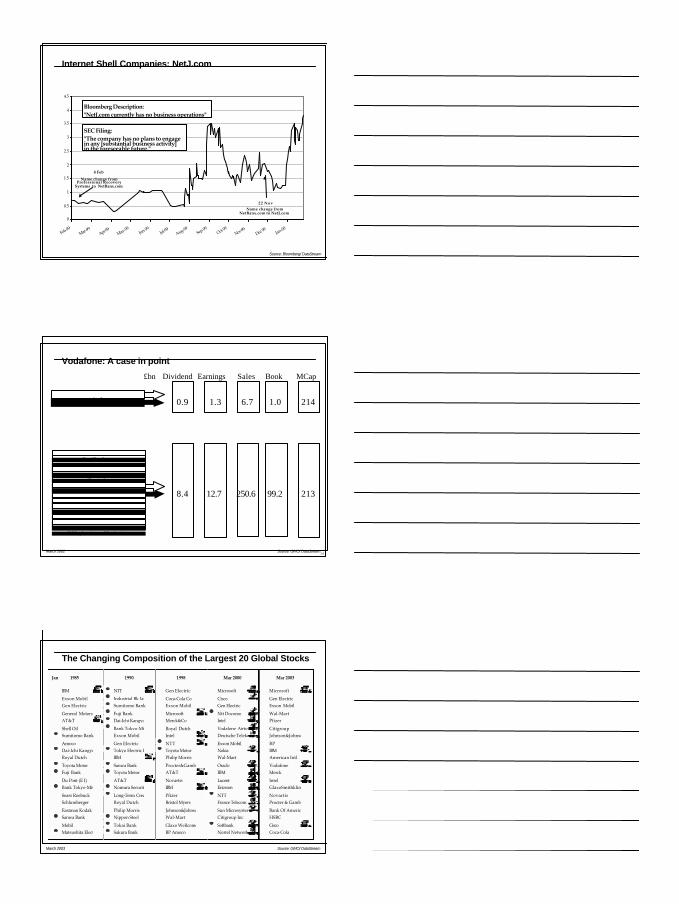
New technology of the railway - new infrastructure increasingthe speed of information flow and facilitating commerce
Huge media spend as companies ‘talked-up’ their sharesOver capacity and competition led to poor returns on
investments
Economy was in a new era of prosperity with an end tobooms and busts
A time of great technological change with automobiles,aviation, radios etc.
Huge public interest in equities with increasing debtStock Exchange turnover and volatility at increasing highs
Market breadth at lows with growth stocks like Radio &Westinghouse driving up the market
South Sea company triggered a rush of jointstock companies
A whole host of new ideas attractedspeculative investment with dire
consequencesHuge public interest in these schemes
It has been estimated that the stock marketdid not break its 1720 peak again until 1968 in
real terms
1720South
SeaBubble
1845RailwayMania
1690Diving
Bell
1929Radio
Bubble
1999InternetBubble
1630Tulip
Mania
1825Emerging
Country Debt
1989
JapaneseBubble
2000195019001600 1650 1700 1750 1800 1850
A brief history of financial bubbles
Source: GMO
GM
O Q
uant
itat
ive
Res
earc
h
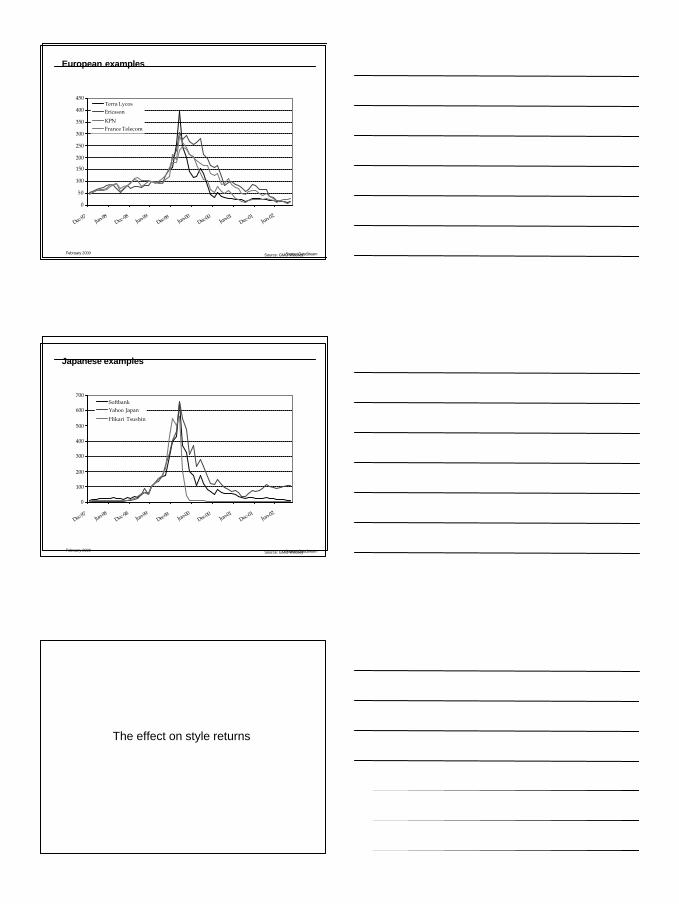
Internet Shell Companies: Blakes Clothing
0
20
40
60
80
100
120
140
160
3-Jan
5-Jan
7-Jan
9-Jan
11-Jan
13-Jan
15-Jan
17-Jan
19-Jan
21-Jan
23-Jan
25-Jan
27-Jan
A small £4m market capstruggling clothing
company with £1.3m ofassets
1. Hire two new directors2. Raise a small amount of cash3. Change to internet-related name4. Become internet acquisition vehicle
An £80m market capinternet related
company with £2.9m ofassets
Blakes ClothingShare Price in January 2000
E-Xentric
Source: GMO WoolleySource: GMO/ DataStream
5
GM
O Q
uant
itat
ive
Res
earc
h
0
0.5
1
1.5
2
2.5
3
3.5
4
4.5
Feb-99Mar-99
Apr-99 May-99Jun-99
Jul-99 Aug-99Sep-99
Oct-99
Nov-99Dec-9
9Jan-00
8 Feb
Name change fromProfessional Recovery
Systems to NetBanx.com
22 NovName change from
NetBanx.com to NetJ.com
Bloomberg Description:"NetJ.com currently has no business operations"
SEC Filing:"The company has no plans to engagein any [substantial business activity]in the foreseeable future."
Internet Shell Companies: NetJ.com
Source: Bloomberg/ DataStream
GM
O Q
uant
itat
ive
Res
earc
h
Vodafone: A case in point
Gas DistributionReal Estate
Food Retailers
Construction & Building MaterialsHealthcare
Engineering Vehicles
DistributorsDiversified Industrials
TobaccoChemicals
Alcoholic Beverages
Water
0.9 1.3 6.7 1.0
8.4 12.7 250.6 99.2
Dividend Earnings Sales Book£bn MCap
Vodafone 214
213
March 2002
Print, Paper & Packaging
Oil Exploration and ProductionHousehold Goods
14Source: GMO/ DataStream
GM
O Q
uant
itat
ive
Res
earc
h
Jan 1985 1990 1998 Mar 2000 Mar 2003
IBM NTT Gen Electric Microsoft Microsoft
Exxon Mobil Industrial Bk Japan Coca-Cola Co Cisco Gen Electric
Gen Electric Sumitomo Bank Exxon Mobil Gen Electric Exxon Mobil
General Motors Fuji Bank Microsoft Ntt Docomo Wal-Mart
AT&T Dai-Ichi Kangyo Bank Merck&Co Intel Pfizer
Shell Oil Bank Tokyo-Mitsubish Royal Dutch Vodafone Airtouch Citigroup
Sumitomo Bank Exxon Mobil Intel Deutsche Telekom Johnson&Johnson
Amoco Gen Electric NTT Exxon Mobil BP
Dai-Ichi Kangyo Bank Tokyo Electric Power Toyota Motor Nokia IBM
Royal Dutch IBM Philip Morris Wal-Mart American Intl
Toyota Motor Sanwa Bank Procter&Gamble Oracle Vodafone
Fuji Bank Toyota Motor AT&T IBM Merck
Du Pont (E I) AT&T Novartis Lucent Intel
Bank Tokyo-Mitsubish Nomura Securities Co IBM Ericsson GlaxoSmithkline
Sears Roebuck Long-Term Credit Ban Pfizer NTT Novartis
Schlumberger Royal Dutch Bristol Myers France Telecom Procter & Gamble
Eastman Kodak Philip Morris Johnson&Johnson Sun Microsystems Bank Of America
Sanwa Bank Nippon Steel Wal-Mart Citigroup Inc HSBC
Mobil Tokai Bank Glaxo Wellcome Softbank Cisco
Matsushita Elect Sakura Bank BP Amoco Nortel Networks Coca-Cola
The Changing Composition of the Largest 20 Global Stocks
Jan 1985 1990 1998 Mar 2000
IBM NTT Gen Electric Microsoft
Exxon Mobil Industrial Bk Japan Coca-Cola Co Cisco
Gen Electric Sumitomo Bank Exxon Mobil Gen Electric
General Motors Fuji Bank Microsoft Ntt Docomo
AT&T Dai-Ichi Kangyo Bank Merck&Co Intel
Shell Oil Bank Tokyo-Mitsubish Royal Dutch Vodafone Airtouch
Sumitomo Bank Exxon Mobil Intel Deutsche Telekom
Amoco Gen Electric NTT Exxon Mobil
Dai-Ichi Kangyo Bank Tokyo Electric Power Toyota Motor Nokia
Royal Dutch IBM Philip Morris Wal-Mart
Toyota Motor Sanwa Bank Procter&Gamble Oracle
Fuji Bank Toyota Motor AT&T IBM
Du Pont (E I) AT&T Novartis Lucent
Bank Tokyo-Mitsubish Nomura Securities Co IBM Ericsson
Sears Roebuck Long-Term Credit Ban Pfizer NTT
Schlumberger Royal Dutch Bristol Myers France Telecom
Eastman Kodak Philip Morris Johnson&Johnson Sun Microsystems
Sanwa Bank Nippon Steel Wal-Mart Citigroup Inc
Mobil Tokai Bank Glaxo Wellcome Softbank
Matsushita Elect Sakura Bank BP Amoco Nortel Networks
Jan 1985 1990 1998
IBM NTT Gen Electric
Exxon Mobil Industrial Bk Japan Coca-Cola Co
Gen Electric Sumitomo Bank Exxon Mobil
General Motors Fuji Bank Microsoft
AT&T Dai-Ichi Kangyo Bank Merck&Co
Shell Oil Bank Tokyo-Mitsubish Royal Dutch
Sumitomo Bank Exxon Mobil Intel
Amoco Gen Electric NTT
Dai-Ichi Kangyo Bank Tokyo Electric Power Toyota Motor
Royal Dutch IBM Philip Morris
Toyota Motor Sanwa Bank Procter&Gamble
Fuji Bank Toyota Motor AT&T
Du Pont (E I) AT&T Novartis
Bank Tokyo-Mitsubish Nomura Securities Co IBM
Sears Roebuck Long-Term Credit Ban Pfizer
Schlumberger Royal Dutch Bristol Myers
Eastman Kodak Philip Morris Johnson&Johnson
Sanwa Bank Nippon Steel Wal-Mart
Mobil Tokai Bank Glaxo Wellcome
Matsushita Elect Sakura Bank BP Amoco
Jan 1985 1990
IBM NTT
Exxon Mobil Industrial Bk Japan
Gen Electric Sumitomo Bank
General Motors Fuji Bank
AT&T Dai-Ichi Kangyo Bank
Shell Oil Bank Tokyo-Mitsubish
Sumitomo Bank Exxon Mobil
Amoco Gen Electric
Dai-Ichi Kangyo Bank Tokyo Electric Power
Royal Dutch IBM
Toyota Motor Sanwa Bank
Fuji Bank Toyota Motor
Du Pont (E I) AT&T
Bank Tokyo-Mitsubish Nomura Securities Co
Sears Roebuck Long-Term Credit Ban
Schlumberger Royal Dutch
Eastman Kodak Philip Morris
Sanwa Bank Nippon Steel
Mobil Tokai Bank
Matsushita Elect Sakura Bank
Jan 1985
IBM
Exxon Mobil
Gen Electric
General Motors
AT&T
Shell Oil
Sumitomo Bank
Amoco
Dai-Ichi Kangyo Bank
Royal Dutch
Toyota Motor
Fuji Bank
Du Pont (E I)
Bank Tokyo-Mitsubish
Sears Roebuck
Schlumberger
Eastman Kodak
Sanwa Bank
Mobil
Matsushita Elect
Source: GMO/ DataStreamMarch 2003
6
GM
O Q
uant
itat
ive
Res
earc
h
0
50
100
150
200
250
300
350
400
450
Dec-97
Jun-98Dec-98
Jun-99Dec-9
9Jun-00
Dec-00
Jun-01Dec-01
Jun-02
Terra LycosEricsson
KPNFrance Telecom
0
50
100
150
200
250
300
350
400
450
Dec-97
Jun-98Dec-98
Jun-99Dec-9
9Jun-00
Dec-00
Jun-01Dec-01
Jun-02
Terra LycosEricsson
KPNFrance Telecom
February 2000 Source: GMO Woolley
European examples
Source: DataStream
GM
O Q
uant
itat
ive
Res
earc
h
0
100
200
300
400
500
600
700
Dec-97
Jun-98Dec-98
Jun-99Dec-9
9Jun-00
Dec-00
Jun-01Dec-01
Jun-02
SoftbankYahoo Japan
Hikari Tsushin
0
100
200
300
400
500
600
700
Dec-97
Jun-98Dec-98
Jun-99Dec-9
9Jun-00
Dec-00
Jun-01Dec-01
Jun-02
SoftbankYahoo Japan
Hikari Tsushin
February 2000 Source: GMO Woolley
Japanese examples
Source: DataStream
The effect on style returns
7
GM
O Q
uant
itat
ive
Res
earc
h
-10%
-8%
-6%
-4%
-2%
0%
2%
4%
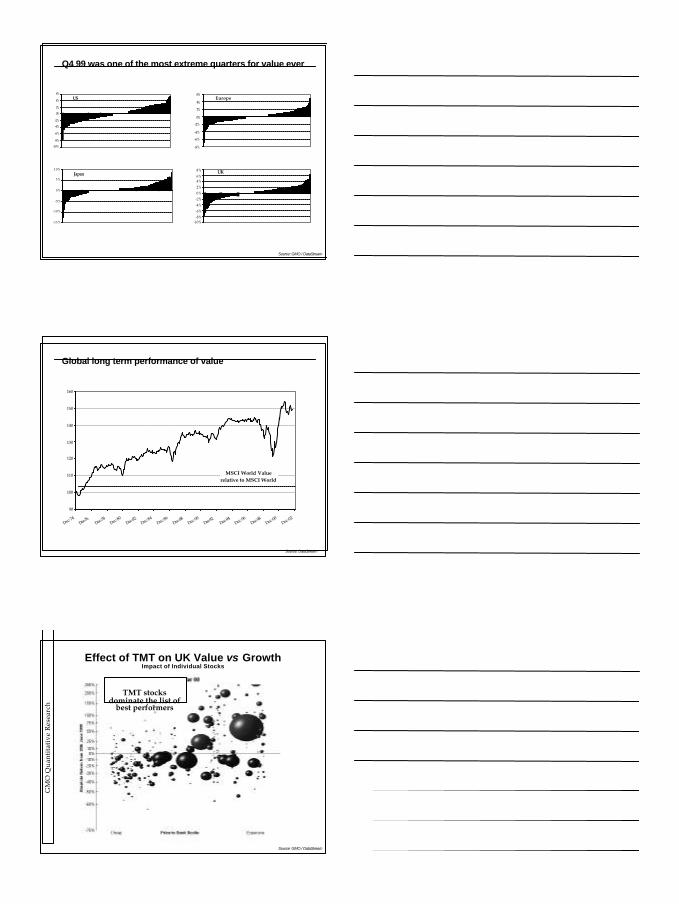
6%US
-10%-8%-6%-4%-2%0%2%4%6%8% UK
-8%
-6%
-4%
-2%
0%
2%
4%
6%Europe
-15%
-10%
-5%
0%
5%
10%Japan
Q4 99 was one of the most extreme quarters for value ever
Source: GMO / DataStream
GM
O Q
uant
itat
ive
Res
earc
h
Global long term performance of value
MSCI World Value relative to MSCI World
90
100
110
120
130
140
150
160
Dec-74Dec-76 Dec-7
8Dec-80
Dec-82
Dec-84Dec-86
Dec-88
Dec-90Dec-92 Dec-9
4Dec-96
Dec-98
Dec-00Dec-02
Source: DataStream
GM
O Q
uant
itat
ive
Res
earc
h
Effect of TMT on UK Value vs GrowthImpact of Individual Stocks
TMT stocksdominate the list of
best performers
Source: GMO / DataStream
8
GM
O Q
uant
itat
ive
Res
earc
h
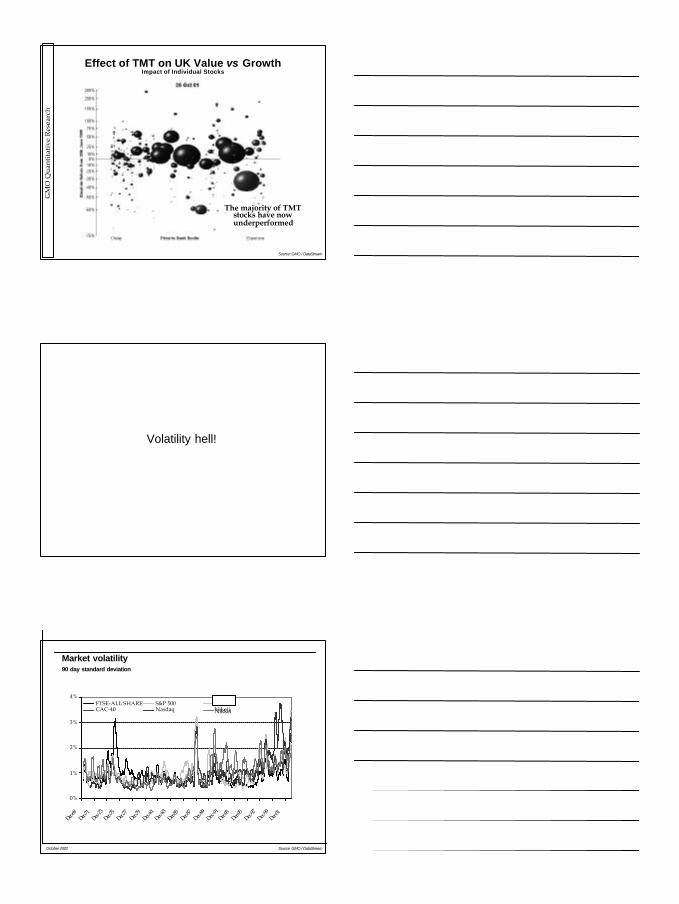
Effect of TMT on UK Value vs GrowthImpact of Individual Stocks
The majority of TMTstocks have nowunderperformed
Source: GMO / DataStream
Volatility hell!
GM
O Q
uant
itat
ive
Res
earc
h
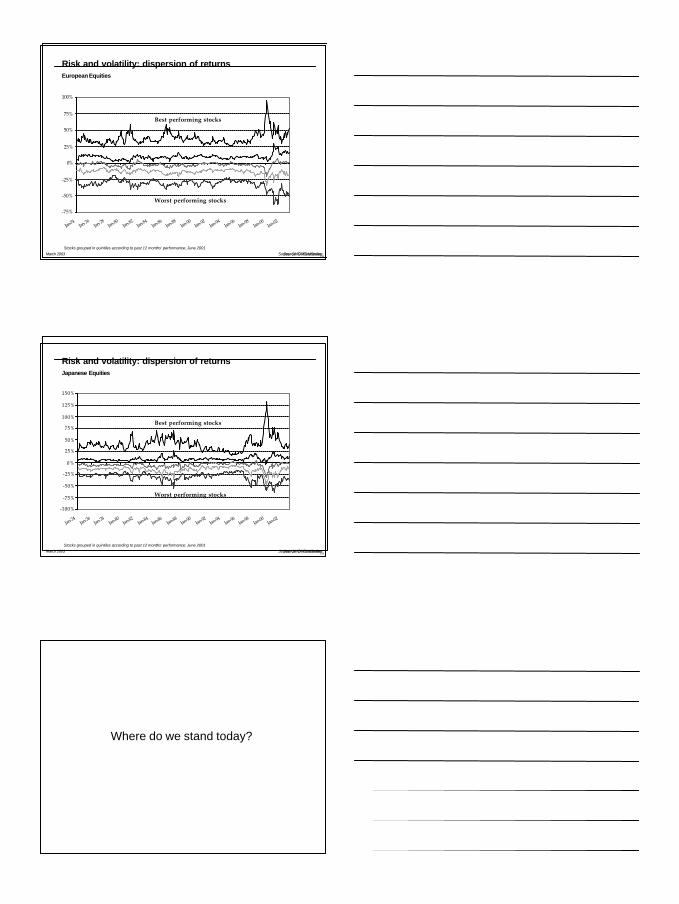
Market volatility90 day standard deviation
0%
1%
2%
3%
4%
Dec-69
Dec-71
Dec-73
Dec-75
Dec-77
Dec-79
Dec-81
Dec-83
Dec-85
Dec-87
Dec-89
Dec-91
Dec-93
Dec-95
Dec-97
Dec-99
Dec-01
FTSE-ALL SHARE S&P 500 DAXCAC-40 Nasdaq NikeiiNikkei
Source: GMO / DataStreamOctober 2002
9
GM
O Q
uant
itat
ive
Res
earc
h
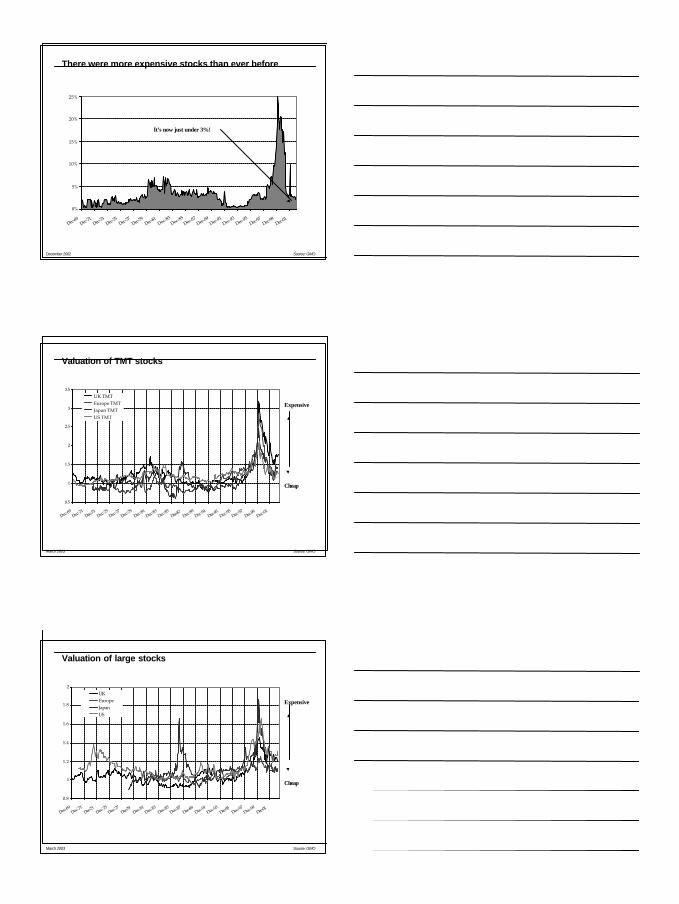
NASDAQ - Turnaround Tuesday
-13%
-5.8%
+14%
Source: BloombergApril 2000 Source: Bloomberg
GM
O Q
uant
itat
ive
Res
earc
h
0%
10%
20%
30%
40%
50%
60%
70%
80%
90%
100%
Dec-69
Dec-71
Dec-73
Dec-75
Dec-77
Dec-79
Dec-81
Dec-83
Dec-85
Dec-87
Dec-89
Dec-91
Dec-93
Dec-95
Dec-97
Dec-99
Dec-01
FTSE-ALL SHARE S&P 500DAX CAC-40Nasdaq NikeiiAverage
Nikkei
0%
10%
20%
30%
40%
50%
60%
70%
80%
90%
100%
Dec-69
Dec-71
Dec-73
Dec-75
Dec-77
Dec-79
Dec-81
Dec-83
Dec-85
Dec-87
Dec-89
Dec-91
Dec-93
Dec-95
Dec-97
Dec-99
Dec-01
FTSE-ALL SHARE S&P 500DAX CAC-40Nasdaq NikeiiAverage
Nikkei
Market volatilityPercentage of last 90 days with moves greater than 1%
Currentvolatility
October 2002 Source: GMO / DataStream
GM
O Q
uant
itat
ive
Res
earc
h
-75%
-50%
-25%
0%
25%
50%
75%
100%
Dec-65
Dec-68
Dec-71
Dec-74
Dec-77
Dec-80
Dec-83
Dec-86
Dec-89
Dec-92
Dec-95
Dec-98
Dec-01
-75%
-50%
-25%
0%
25%
50%
75%
100%
Dec-65
Dec-68
Dec-71
Dec-74
Dec-77
Dec-80
Dec-83
Dec-86
Dec-89
Dec-92
Dec-95
Dec-98
Dec-01
-75%
-50%
-25%
0%
25%
50%
75%
100%
Dec-65
Dec-68
Dec-71
Dec-74
Dec-77
Dec-80
Dec-83
Dec-86
Dec-89
Dec-92
Dec-95
Dec-98
Dec-01
-75%
-50%
-25%
0%
25%
50%
75%
100%
Dec-65
Dec-68
Dec-71
Dec-74
Dec-77
Dec-80
Dec-83
Dec-86
Dec-89
Dec-92
Dec-95
Dec-98
Dec-01
Source: GMO WoolleyStocks grouped in quintiles according to past 12 months’ performance; June 2001
27
Risk and volatility: dispersion of returnsUK Equities
Best performing stocks
Worst performing stocks
Source: GMO / DataStreamMarch 2003
10
GM
O Q
uant
itat
ive
Res
earc
h
-75%
-50%
-25%
0%
25%
50%
75%
100%
Jan-74 Jan-76Jan-78
Jan-80Jan-82
Jan-84Jan-86
Jan-88Jan-90
Jan-92Jan-94
Jan-96Jan-98
Jan-00Jan-02
-75%
-50%
-25%
0%
25%
50%
75%
100%
Jan-74 Jan-76Jan-78
Jan-80Jan-82
Jan-84Jan-86
Jan-88Jan-90
Jan-92Jan-94
Jan-96Jan-98
Jan-00Jan-02
Source: GMO WoolleyStocks grouped in quintiles according to past 12 months’ performance; June 2001
28
Risk and volatility: dispersion of returnsEuropean Equities
Best performing stocks
Worst performing stocks
Source: GMO / DataStreamMarch 2003
GM
O Q
uant
itat
ive
Res
earc
h
-100%
-75%
-50%
-25%
0 %
25%
50%
75%
100%
125%
150%
Jan-74Jan-76
Jan-78Jan-80
Jan-82Jan-84
Jan-86Jan-88
Jan-90Jan-92
Jan-94Jan-96
Jan-98Jan-00
Jan-02
-100%
-75%
-50%
-25%
0 %
25%
50%
75%
100%
125%
150%
Jan-74Jan-76
Jan-78Jan-80
Jan-82Jan-84
Jan-86Jan-88
Jan-90Jan-92
Jan-94Jan-96
Jan-98Jan-00
Jan-02
Source: GMO WoolleyStocks grouped in quintiles according to past 12 months’ performance; June 2001
29
Risk and volatility: dispersion of returnsJapanese Equities
Best performing stocks
Worst performing stocks
Source: GMO / DataStreamMarch 2003
Where do we stand today?
11
GM
O Q
uant
itat
ive
Res
earc
h
0%
5%
10%
15%
20%
25%
Dec-69
Dec-71
Dec-73
Dec-75
Dec-77
Dec-79
Dec-81
Dec-83Dec-85
Dec-87Dec-89
Dec-91Dec-93
Dec-95Dec-9
7Dec-9
9Dec-0
1
At the peak 25% of UK stocks weremore than 3 times overvalued
0%
5%
10%
15%
20%
25%
Dec-69
Dec-71
Dec-73
Dec-75
Dec-77
Dec-79
Dec-81
Dec-83Dec-85
Dec-87Dec-89
Dec-91Dec-93
Dec-95Dec-9
7Dec-9
9Dec-0
1
There were more expensive stocks than ever before
It’s now just under 3%!
Source: GMODecember 2002
GM
O Q
uant
itat
ive
Res
earc
h
0.5
1
1.5
2
2.5
3
3.5
Dec-69
Dec-71
Dec-73
Dec-75
Dec-77
Dec-79
Dec-81
Dec-83
Dec-85
Dec-87 Dec-89
Dec-91
Dec-93
Dec-95
Dec-97
Dec-99
Dec-01
UK TMTEurope TMTJapan TMTUS TMT
0.5
1
1.5
2
2.5
3
3.5
Dec-69
Dec-71
Dec-73
Dec-75
Dec-77
Dec-79
Dec-81
Dec-83
Dec-85
Dec-87 Dec-89
Dec-91
Dec-93
Dec-95
Dec-97
Dec-99
Dec-01
UK TMTEurope TMTJapan TMTUS TMT
Expensive
Cheap
Valuation of TMT stocks
March 2003 Source: GMO
GM
O Q
uant
itat
ive
Res
earc
h
0.8
1
1.2
1.4
1.6
1.8
2
Dec-69
Dec-71
Dec-73 Dec-75
Dec-77
Dec-79 Dec-81
Dec-83
Dec-85
Dec-87
Dec-89
Dec-91
Dec-93
Dec-95 Dec-97
Dec-99
Dec-01
UKEuropeJapanUS
0.8
1
1.2
1.4
1.6
1.8
2
Dec-69
Dec-71
Dec-73 Dec-75
Dec-77
Dec-79 Dec-81
Dec-83
Dec-85
Dec-87
Dec-89
Dec-91
Dec-93
Dec-95 Dec-97
Dec-99
Dec-01
UKEuropeJapanUS
Expensive
Cheap
Valuation of large stocks
March 2003 Source: GMO

12
GM
O Q
uant
itat
ive
Res
earc
h
abcd
2003 Pensions Convention
TMT 1999 – 2001A Bubble Movie
Simon Harris, GMO