Embed Size (px)
Citation preview
ABC NEWS/TIME MAGAZINE/WASHINGTON POST POLL: TRAFFIC – 1/31/05 EMBARGOED FOR RELEASE AFTER 7 a.m. Sunday, Feb. 13, 12005
A Look Under the Hood of a Nation on Wheels
Freeways get clogged, minutes tick by and tempers sometimes flare, but there’s another side to the daily commute for millions of Americans: Most of them actually like it. So it goes (and stops-and-goes) in the nation’s love-hate relationship with the daily task of getting around. In a country where 220 million adults average an hour and a half a day in their cars, views of traffic in America vary as much as highway conditions themselves, from the joy of the open blacktop to the misery of another rubberneck-inspired backup. On balance the road still offers more freedom than frustration. Three-quarters of Americans say driving often gives them a sense of independence, and nearly half say it’s often relaxing. Four in 10 love their cars – not just like them, but love them. But there’s a darker side: About a third can be classified as aggressive drivers. Six in 10 concede they sometimes go well over the speed limit. Sixty-two percent occasionally get frustrated behind the wheel, more than four in 10 get angry and two in 10 sometimes boil into road rage. And nothing fuels driver anger like getting stuck in a traffic jam.
74%
48%
62%56%
43%
0%
10%
20%
30%
40%
50%
60%
70%
80%
90%
100%
Independent Relaxed Frustrated Nervous Angry
Driving often makes you feel….. Driving occasionally makes you feel…..
Emotions Behind the WheelABC/Time/Post poll
2
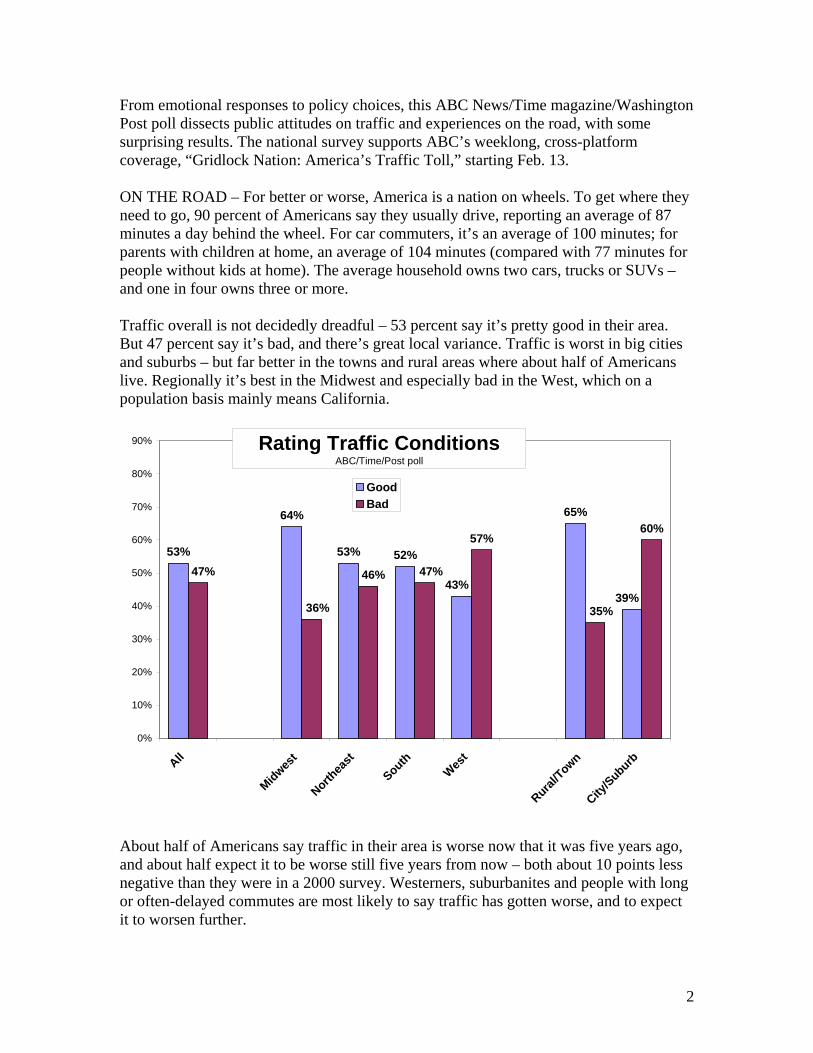
From emotional responses to policy choices, this ABC News/Time magazine/Washington Post poll dissects public attitudes on traffic and experiences on the road, with some surprising results. The national survey supports ABC’s weeklong, cross-platform coverage, “Gridlock Nation: America’s Traffic Toll,” starting Feb. 13. ON THE ROAD – For better or worse, America is a nation on wheels. To get where they need to go, 90 percent of Americans say they usually drive, reporting an average of 87 minutes a day behind the wheel. For car commuters, it’s an average of 100 minutes; for parents with children at home, an average of 104 minutes (compared with 77 minutes for people without kids at home). The average household owns two cars, trucks or SUVs – and one in four owns three or more. Traffic overall is not decidedly dreadful – 53 percent say it’s pretty good in their area. But 47 percent say it’s bad, and there’s great local variance. Traffic is worst in big cities and suburbs – but far better in the towns and rural areas where about half of Americans live. Regionally it’s best in the Midwest and especially bad in the West, which on a population basis mainly means California.
53%
64%
53% 52%
65%
57%60%
39%43%
35%
47%46%
36%
47%
0%
10%
20%
30%
40%
50%
60%
70%
80%
90%
All
Midwest
Northea
st
SouthWes
t
Rural/Town
City/Suburb
GoodBad
Rating Traffic ConditionsABC/Time/Post poll
About half of Americans say traffic in their area is worse now that it was five years ago, and about half expect it to be worse still five years from now – both about 10 points less negative than they were in a 2000 survey. Westerners, suburbanites and people with long or often-delayed commutes are most likely to say traffic has gotten worse, and to expect it to worsen further.
3
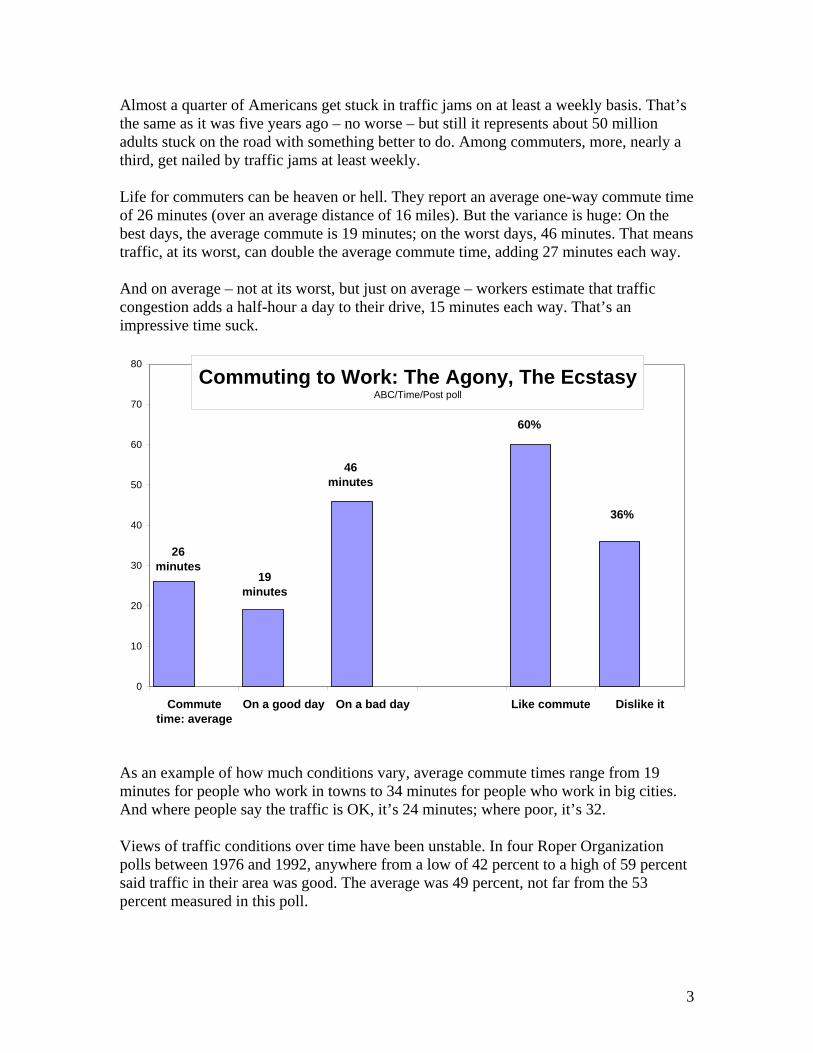
Almost a quarter of Americans get stuck in traffic jams on at least a weekly basis. That’s the same as it was five years ago – no worse – but still it represents about 50 million adults stuck on the road with something better to do. Among commuters, more, nearly a third, get nailed by traffic jams at least weekly. Life for commuters can be heaven or hell. They report an average one-way commute time of 26 minutes (over an average distance of 16 miles). But the variance is huge: On the best days, the average commute is 19 minutes; on the worst days, 46 minutes. That means traffic, at its worst, can double the average commute time, adding 27 minutes each way. And on average – not at its worst, but just on average – workers estimate that traffic congestion adds a half-hour a day to their drive, 15 minutes each way. That’s an impressive time suck.
46minutes
19minutes
26minutes
0
10
20
30
40
50
60
70
80
Commutetime: average
On a good day On a bad day Like commute Dislike it
60%
36%
Commuting to Work: The Agony, The EcstasyABC/Time/Post poll
46 minutes
As an example of how much conditions vary, average commute times range from 19 minutes for people who work in towns to 34 minutes for people who work in big cities. And where people say the traffic is OK, it’s 24 minutes; where poor, it’s 32. Views of traffic conditions over time have been unstable. In four Roper Organization polls between 1976 and 1992, anywhere from a low of 42 percent to a high of 59 percent said traffic in their area was good. The average was 49 percent, not far from the 53 percent measured in this poll.

4
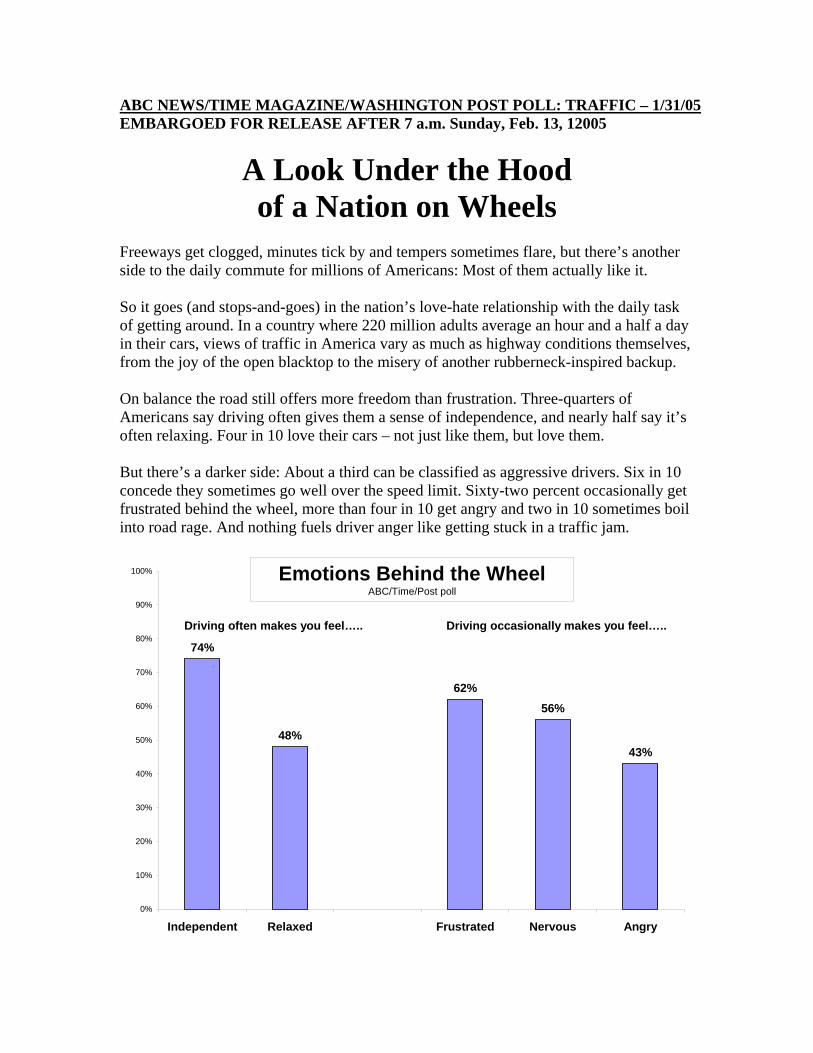
One difference: A fortunate 14 percent now say their traffic is “excellent,” the first time it’s cracked double digits. About as many, 15 percent, give their traffic the worst rating, “poor.” STRATEGIES – Traffic engenders impressive avoidance strategies. Two-thirds of Americans sometimes take a less direct route to avoid snarls. Six in 10 sometimes leave earlier or later than planned to duck the worst traffic. Two in 10 have moved homes mainly to improve a commute. A quarter have changed their work schedules, and 10 percent sometimes work at home to avoid a commute – obviously not an option for many workers. This rises to a fifth of people in high-congestion areas, and a quarter of those who really don’t like the drive. Fourteen percent of Americans say they’ve taken the ultimate commute-avoidance measure: Changed jobs, or simply left a job, primarily because of the commute.
68%
60%
40%
24%20%
14%
0%
10%
20%
30%
40%
50%
60%
70%
80%
90%
Take a lessdirect route
Leave earlieror later
Skip a plannedstop
Changed workschedule
Moved closerto work
Changed/left ajob
Traffic Avoidance StrategiesABC/Time/Post poll
Policy choices are a contentious brew. Among some of the most-discussed options, the public is somewhat skeptical about high-occupancy vehicle lanes, and downright hostile toward adjustable-rate or city-center tolls. Solutions such as quickly hooking and hauling breakdowns, retiming traffic lights and providing prompt traffic alerts are seen as the best choices, and automatic cameras to catch traffic offenders get 2-1 support. About half see building roads as very effective – but most oppose gasoline taxes to fund it.

5
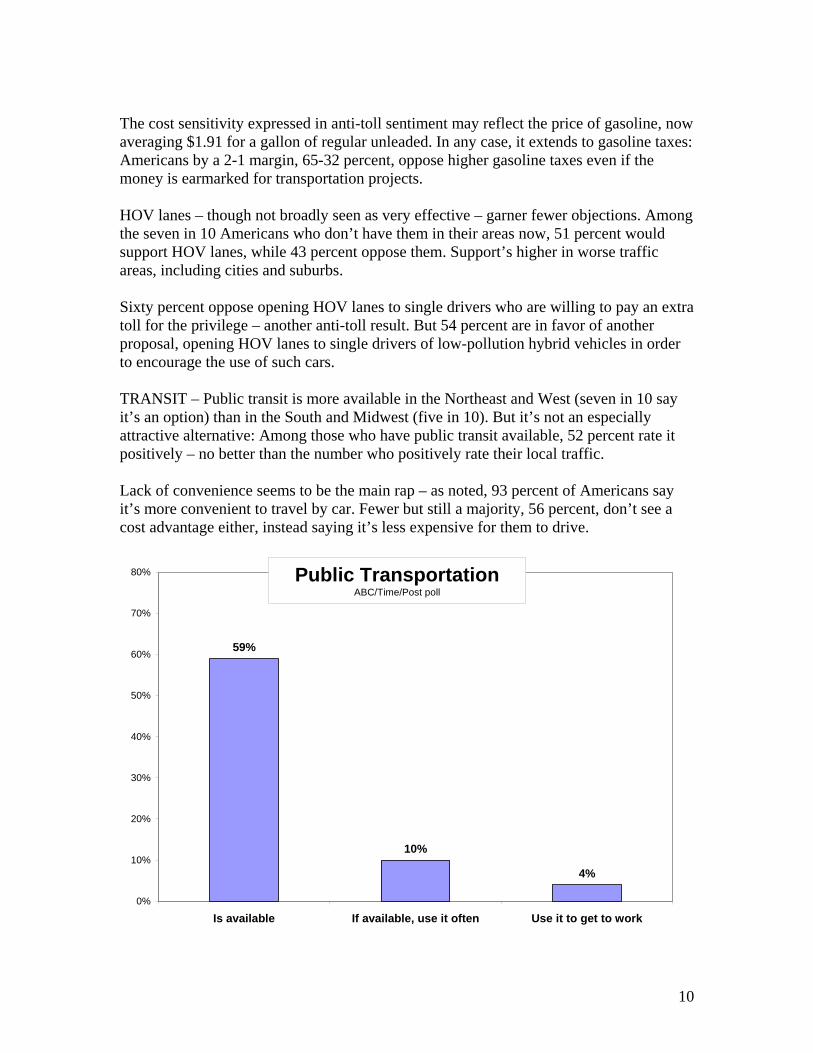
For most people, public transportation and carpooling remain far outside the fast track. While six in 10 Americans have public transit available, just 10 percent use it regularly, and just four percent of workers use it for their daily commute. (Ninety-three percent call driving more convenient.) Eighty-four percent drive alone to work; just eight percent drive with someone else, and 80 percent of solo drivers aren’t interested in carpooling. Alongside the traffic, there’s the other kind of congestion: Two-thirds of Americans are concerned about the effect of auto exhaust on their health, although fewer (four in 10) concede that their own driving is much to blame. LIKE IT/LOVE IT – Yet, as noted, for all the water-cooler gripes, 60 percent of people who work outside the home say they like their daily commute. How so? One secret is a sane trip: Happy commuters tend not to work in cities, report below-average travel times and distances, and say their local traffic isn’t bad. Among people who work in towns or rural areas (four in 10 commuters), 71 percent like the commute; but among those who work in big cities (three in 10 commuters) it’s 24 points lower.
60%
71%
56%
47%
74%
42%
74%
40%
71%
46%
0%
10%
20%
30%
40%
50%
60%
70%
80%
90%
100%
All
Work in ru
ral /to
wn
Work in su
burb
Work in ci
ty
<15 m
in. commute
>30 m
in. commute
<5 m
in. traff
ic dela
y
>15 m
in. traff
ic dela
y
Good loca
l traff
ic
Bad lo
cal tr
affic
The Commute: Liking itABC/Time/Post poll
Long commutes are no fun: Enjoyment is 32 points higher among people who spend 15 minutes or fewer each way on their daily commute, compared with those who take more than a half-hour. Similarly, people with a long-distance commute are 22 points less likely to say they like it.

6
Indeed about a quarter of commuters say the main reason they like it is because they’re blessed with a short or easy route. More, nearly four in 10, like the quiet time alone or the break between home and work. And others report simple pleasures such as the scenery or listening to music or the radio. Detroit may enjoy one finding: By a 10-point margin, people who “love” their cars are more apt to like their commute. Environmentalists may dislike another: It’s SUVs that win the most affection. Among the one in six Americans who drive an SUV, half love it. Among sedan drivers, by contrast, just 35 percent love their cars. BEHAVING BADLY– One common experience on the road is bad behavior. Majorities of motorists say they often see other drivers speeding (reported by 82 percent), driving inattentively (71 percent) or driving aggressively (64 percent). Four in 10 often see others run a red light or stop sign; 34 percent often witness “impolite gestures,” and 27 percent often see other drivers exhibiting road rage – “uncontrollable anger toward another driver on the road.” Traffic plays a big role. Among people who give the worst rating to their local traffic conditions, many more – 41 percent – see road rage, and 54 percent often see other drivers making angry or impolite gestures – double the number who see it in good traffic.
27%
22%
54%
41%
0%
10%
20%
30%
40%
50%
60%
70%
Often see: Impolite gestures Often see: Road rage
Local traffic: Ex/GoodLocal traffic: Poor
Bad Behavior on the RoadsABC/Time/Post poll

7
Given these, it’s no wonder that 30 percent of drivers say they feel nervous about their safety on the road very or somewhat often. Include those who feel this way at least occasionally, and the number jumps to 56 percent – a majority. Feelings on the road Very often Very/somewhat Occasionally or more Independent 54% 74% 98% Relaxed 20 48 73 Nervous about safety 12 30 56 Frustrated 10 30 62 Angry 5 19 43 As far as their own behavior, nearly a quarter of drivers fess up to speeding very or somewhat often, and more – 58 percent – say they do it at least occasionally. More than four in 10 concede that they drive inattentively at least occasionally, and three in 10 sometimes drive aggressively. Two in 10, or close to it, at least occasionally make impolite gestures, feel road rage, or run a light or stop sign. Have seen Have done very/somewhat often occasionally or more Speeding 82% 58% Inattentive driving 71 43 Aggressive driving 64 30 Run a light/stop sign 40 17 Impolite gestures 34 21 Road rage 27 19
58%
43%
30%
21%19%
17%
0%
10%
20%
30%
40%
50%
60%
70%
Speed Driveinattentively
Drive tooaggressively
Make impolitegestures
Feel road rage Run a stopsign or light
Fessing Up: Personal Behavior (At Least Occasionally)
ABC/Time/Post poll
8
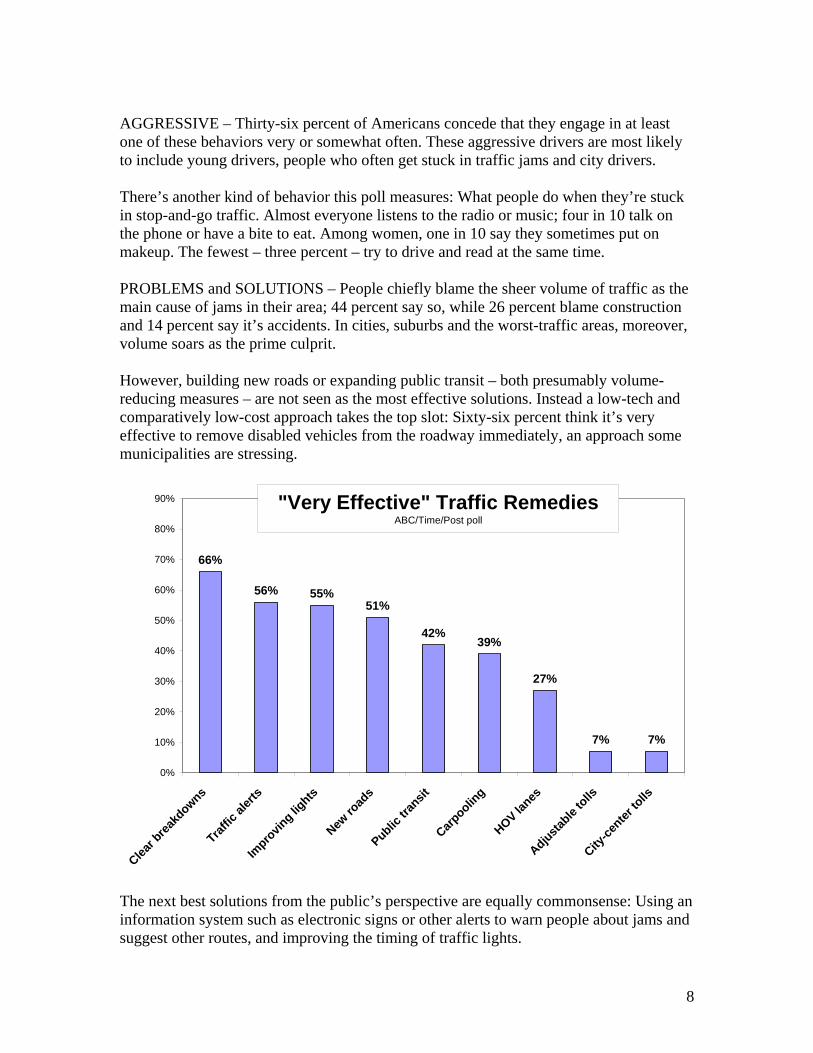
AGGRESSIVE – Thirty-six percent of Americans concede that they engage in at least one of these behaviors very or somewhat often. These aggressive drivers are most likely to include young drivers, people who often get stuck in traffic jams and city drivers. There’s another kind of behavior this poll measures: What people do when they’re stuck in stop-and-go traffic. Almost everyone listens to the radio or music; four in 10 talk on the phone or have a bite to eat. Among women, one in 10 say they sometimes put on makeup. The fewest – three percent – try to drive and read at the same time. PROBLEMS and SOLUTIONS – People chiefly blame the sheer volume of traffic as the main cause of jams in their area; 44 percent say so, while 26 percent blame construction and 14 percent say it’s accidents. In cities, suburbs and the worst-traffic areas, moreover, volume soars as the prime culprit. However, building new roads or expanding public transit – both presumably volume-reducing measures – are not seen as the most effective solutions. Instead a low-tech and comparatively low-cost approach takes the top slot: Sixty-six percent think it’s very effective to remove disabled vehicles from the roadway immediately, an approach some municipalities are stressing.
66%
56% 55%51%
42%39%
27%
7% 7%
0%
10%
20%
30%
40%
50%
60%
70%
80%
90%
Clear b
reakd
owns
Traffic
alert
s
Impro
ving lig
hts
New ro
ads
Public tr
ansit
Carpoolin
g
HOV lanes
Adjustable
tolls
City-ce
nter to
lls
"Very Effective" Traffic RemediesABC/Time/Post poll
The next best solutions from the public’s perspective are equally commonsense: Using an information system such as electronic signs or other alerts to warn people about jams and suggest other routes, and improving the timing of traffic lights.
9
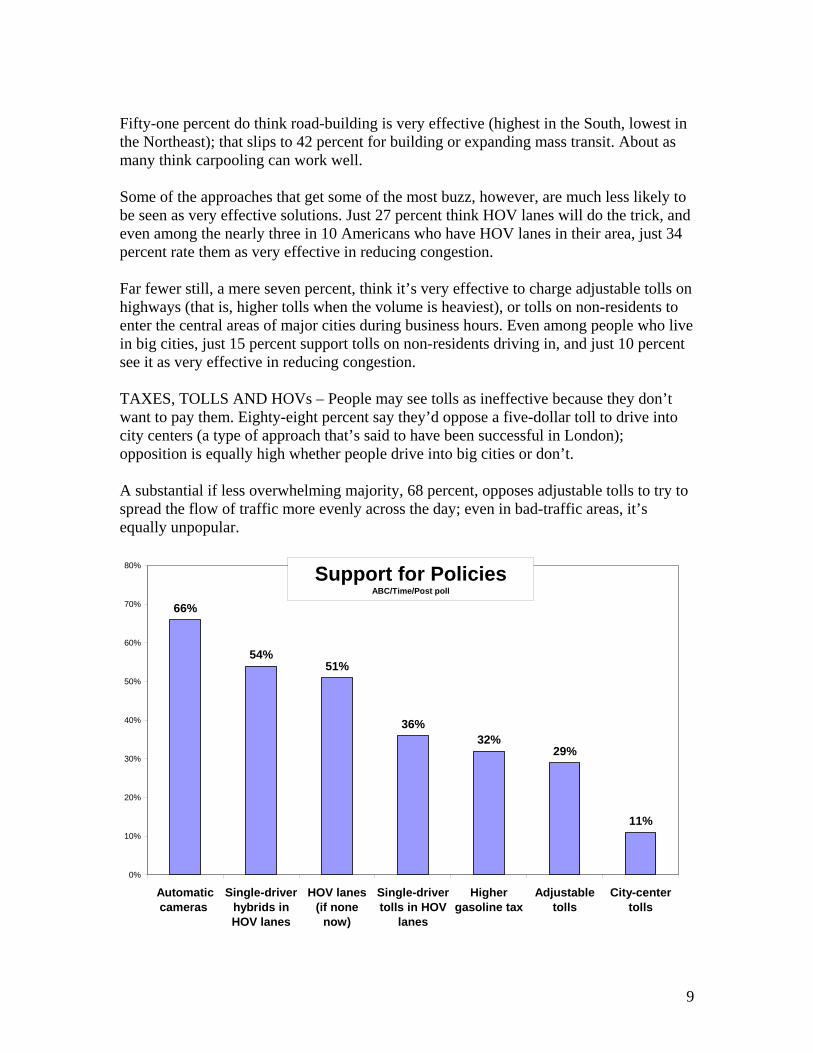
Fifty-one percent do think road-building is very effective (highest in the South, lowest in the Northeast); that slips to 42 percent for building or expanding mass transit. About as many think carpooling can work well. Some of the approaches that get some of the most buzz, however, are much less likely to be seen as very effective solutions. Just 27 percent think HOV lanes will do the trick, and even among the nearly three in 10 Americans who have HOV lanes in their area, just 34 percent rate them as very effective in reducing congestion. Far fewer still, a mere seven percent, think it’s very effective to charge adjustable tolls on highways (that is, higher tolls when the volume is heaviest), or tolls on non-residents to enter the central areas of major cities during business hours. Even among people who live in big cities, just 15 percent support tolls on non-residents driving in, and just 10 percent see it as very effective in reducing congestion. TAXES, TOLLS AND HOVs – People may see tolls as ineffective because they don’t want to pay them. Eighty-eight percent say they’d oppose a five-dollar toll to drive into city centers (a type of approach that’s said to have been successful in London); opposition is equally high whether people drive into big cities or don’t. A substantial if less overwhelming majority, 68 percent, opposes adjustable tolls to try to spread the flow of traffic more evenly across the day; even in bad-traffic areas, it’s equally unpopular.
66%
54%51%
36%32%
29%
11%
0%
10%
20%
30%
40%
50%
60%
70%
80%
Automaticcameras
Single-driverhybrids inHOV lanes
HOV lanes(if none
now)
Single-drivertolls in HOV
lanes
Highergasoline tax
Adjustabletolls
City-centertolls
Support for PoliciesABC/Time/Post poll
10
The cost sensitivity expressed in anti-toll sentiment may reflect the price of gasoline, now averaging $1.91 for a gallon of regular unleaded. In any case, it extends to gasoline taxes: Americans by a 2-1 margin, 65-32 percent, oppose higher gasoline taxes even if the money is earmarked for transportation projects. HOV lanes – though not broadly seen as very effective – garner fewer objections. Among the seven in 10 Americans who don’t have them in their areas now, 51 percent would support HOV lanes, while 43 percent oppose them. Support’s higher in worse traffic areas, including cities and suburbs. Sixty percent oppose opening HOV lanes to single drivers who are willing to pay an extra toll for the privilege – another anti-toll result. But 54 percent are in favor of another proposal, opening HOV lanes to single drivers of low-pollution hybrid vehicles in order to encourage the use of such cars. TRANSIT – Public transit is more available in the Northeast and West (seven in 10 say it’s an option) than in the South and Midwest (five in 10). But it’s not an especially attractive alternative: Among those who have public transit available, 52 percent rate it positively – no better than the number who positively rate their local traffic. Lack of convenience seems to be the main rap – as noted, 93 percent of Americans say it’s more convenient to travel by car. Fewer but still a majority, 56 percent, don’t see a cost advantage either, instead saying it’s less expensive for them to drive.
59%
10%
4%
0%
10%
20%
30%
40%
50%
60%
70%
80%
Is available If available, use it often Use it to get to work
Public TransportationABC/Time/Post poll
11
Incentives are few and far between: Just eight percent of people with jobs outside the home say their employers offer money or other incentives to encourage people to take public transportation to work. There is a plus for public transit: People who know it best like it. Among those who use it, 69 percent rate it positively; 23 points higher than among those who don’t. (Use of public transit peaks among city dwellers, minorities and lower-income Americans.) CARPOOL/CAR SHARE – While just eight percent of commuters currently carpool, 20 percent of solo drivers say they’d be interested in it – far from a majority, but enough to take plenty of cars off the road if they were to follow through. For most, though, that looks unlikely: Just six percent are “very” interested in a carpool arrangement. As with mass transit, convenience is the biggest objection: Asked the main reason they’re not in carpools now, 51 percent say it’d be inconvenient, and an additional 22 percent give reasons related to convenience or privacy. Eighteen percent, though, say it’s because they don’t know anyone to carpool with. There are roughly similar levels of interest in short-term car rentals – membership services that rent cars by the hour. A quarter of Americans say they’d be interested in replacing their main car with this kind of service; 32 percent say they might use it to replace a second car. The numbers who are very interested, however, are again much lower – eight and 10 percent, respectively. MEANS/MEDIANS – A word about numbers: While this analysis refers to averages (meaning the means) for results such as driving and commute times, they also can be computed as medians – the midpoint of responses. Medians, while less inclusive of the full range of responses, mitigate the effect of the extremes. It can make a difference. Americans say they spend an average of 87 minutes a day in their cars, but a median of 60 minutes. Commuters say their average commute takes 26 minutes; the median is 20 minutes. Their worst commute can take an average of 46 minutes, but a median of 30. The amount of time they estimate traffic adds to their commute averages 15 minutes, while the median is 10. HOLIDAY – It is, finally, close to another national holiday – President’s Day, Feb. 21. Get ready for traffic: Fourteen percent of Americans say they’ll be traveling by car on a special trip during the upcoming holiday weekend – translating to nearly 30 million cars on the road. METHODOLOGY – This ABC News/Time magazine/Washington Post poll was conducted by telephone Jan. 26-31, 2005, among a random national sample of 1,204 adults, including 750 commuters. The results have a three-point error margin for the full sample, 3.5 points for commuters. Sampling, data collection and tabulation by TNS of Horsham, Pa.

12
Analysis by Gary Langer. ABC News polls can be found at ABCNEWS.com on the Internet at: http://abcnews.go.com/us/pollvault/ Media contact: Cathie Levine, (212) 456-4934. Results follow. *= less than 0.5 percent 1. Previously released. 2. In general, when getting places you need to go in the area where you live, how often do you travel by car - nearly all the time, most of the time, some of the time or hardly ever? Nearly all Most of Some of Hardly Never No the time the time the time ever (vol.) op. 1/31/05 75 15 6 3 1 0 3. (IF EVER DRIVE) Do you usually drive, or does someone else usually drive? Respondent usually Someone else usually No drives drives opinion 1/31/05 84 16 * 4. How would you rate the traffic conditions in your area - excellent, good, fair or poor? ----Excellent/Good---- ----Fair/Poor---- No NET Excellent Good Net Fair Poor opinion 1/31/05 53 14 39 47 32 15 * 2/1/92* 59 8 51 39 29 10 2 1/25/86 43 6 37 55 35 20 2 1/22/83 50 6 44 49 35 14 1 1/17/76 42 4 38 57 39 18 1 *2/1/92 and previous: Roper. Wording: "(Here is a list of things having to do with community life. Would you go down this list and for each one tell me how you would rate it here in your area--excellent, good, fair, or poor?) - Traffic conditions." 5. Is public transportation like buses or commuter trains available in your area, or not? Yes No No opinion 1/31/05 59 40 * 6. (IF PUBLIC TRANSPORTATION IS AVAILABLE) How would you rate the quality of the public transportation system in your area – excellent, good, fair or poor? ----Excellent/Good---- ----Fair/Poor---- No NET Excellent Good Net Fair Poor opinion 1/31/05 52 13 40 39 27 11 9

13
7. (IF PUBLIC TRANSPORTATION IS AVAILABLE) How often do you use public transportation in your area – very often, somewhat often, occasionally or hardly ever? ------Often------- -------------Not often------------- No NET Very Smwt. NET Occas. Hardly Never (vol.) op. 1/31/05 10 7 3 90 17 49 24 * 8. (IF PUBLIC TRANSPORTATION IS AVAILABLE) For most of your daily travel needs, (READ ITEM) – (using public transportation), or (traveling by car)? 1/31/05 – Summary Table Public Traveling Both equally/No No transportation by car difference (vol.) op. a. which do you personally find more convenient 7 93 1 * b. which is less expensive 35 56 2 7 9. (IF EVER DRIVE) Just your best estimate, on an average day, how much time would you say you spend in a car for all reasons, including work, school, errands and leisure? (minutes) <30 30 31-59 60 >60 No op. Mean Median 1/31/05 15 12 6 22 43 2 87 60 10. (IF EVER DRIVE) When traveling by car, do you ever (READ ITEM) to avoid bad traffic, or not? IF YES: Do you do that very often, somewhat often, occasionally or hardly ever? 1/31/05 – Summary Table ----------------Yes---------------- Very Somewhat Hardly No NET often often Occas. ever No op. a. Take a less direct route 68 21 19 23 5 32 * b. Skip a stop you'd planned to make 40 6 10 19 6 59 * c. Leave earlier or later than you would have liked 60 22 16 18 4 40 1 11. Would you say the traffic in your area has gotten much better, somewhat better, stayed about the same, gotten somewhat worse or gotten much worse over the last five years? --------Better------- --------Worse-------- No NET Much Somewhat Same NET Somewhat Much op. 1/31/05 11 3 8 36 51 29 22 2 5/24/00* 9 3 6 27 62 32 30 2 *Gallup. 12. Looking ahead, do you anticipate that the traffic in your area will get much better, somewhat better, stay the same, get somewhat worse or get much worse over the next five years? --------Better------- --------Worse-------- No NET Much Somewhat Same NET Somewhat Much op. 1/31/05 15 3 12 32 52 30 22 1
14
5/24/00* 15 5 10 23 61 33 28 1 *Gallup. 13. How often do you, yourself, get stuck driving in traffic jams – every day, several times a week, several times a month, a few times a year, or never? --Daily/weekly-- Several ---Annually/Never--- Doesn't No NET Daily Wkly times/month NET Annually Never apply (vol.) op. 1/31/05 23 9 15 24 52 33 19 1 * 5/24/00* 25 11 14 22 51 31 20 2 * *Gallup. 14. What do you think is the main reason for the traffic jams in your area – (road construction), (traffic accidents), (a high volume of vehicles), or what? 1/31/05 A high volume of vehicles 44 Road construction 26 Traffic accidents 14 Mix/Varies day to day (vol.) 4 Other 8 None 2 No opinion 1 15. Are you yourself employed outside the home, or not? Yes No No opinion 1/31/05 62 38 0 16. (IF WORK OUTSIDE THE HOME) About how far do you live from your place of work, in miles? <5 5 6-19 20 >20 No op. Mean Median 1/31/05 23 10 36 8 21 3 16 10 17. (IF WORK OUTSIDE THE HOME) How do you usually get to work – do you drive alone, drive or ride with someone else, walk, take a bus, take other public transportation or what? 1/31/05 Drive alone 84 Drive or ride with someone else 8 Walk 3 Take a bus 3 Take other public transportation 1 Other (vol.) 1 No opinion 0 18. (IF DRIVE ALONE) How interested would you be personally in joining a carpool for your commute – very interested, somewhat interested, not so interested or not interested at all? -----Interested----- -----Not Interested----- No NET Very Somewhat Net Not so Not at all opinion 1/31/05 20 6 14 80 11 69 1
15
19. (IF DRIVE ALONE) What's the main reason you're not currently in a carpool? Is it because (it would be less convenient as far as your own schedule), (it would be less private), (you'd have to rely on somebody else), (you don't know anyone to carpool with) or what? 1/31/05 It would be less convenient 51 You don't know anyone to carpool with 18 Have to rely on somebody else 9 It would be less private 6 Vehicle is used for work/multiple tasks 5 No set schedule/hours vary/schedule conflicts 2 No reason/need to carpool 2 All of the above/multiple reasons 1 Other 7 No opinion 0 20. (IF WORK OUTSIDE THE HOME) How many minutes does it usually take you to commute from home to work? <15 15 16-29 30 31-59 60 >60 Varies (vol.) No op. Mean Med. 1/31/05 31 12 20 12 15 5 4 1 1 26 20 5/24/00* 28 14 17 23 9 3 2 2 1 *Gallup. Among people who work outside the home and drive themselves to work. 21. (IF WORK OUTSIDE THE HOME) What's your best commute time – the fastest you can get to work on a good day? <10 10 11-19 20 >20 No op. Mean Median 1/31/05 26 12 23 10 27 1 19 15 22. (IF WORK OUTSIDE THE HOME) And what's your worst commute time – the longest it can take you to get to the same work location because of traffic congestion? <20 20 21-44 45 >45 No op. Mean Median 1/31/05 26 8 27 9 28 2 46 30 23. (IF DRIVES ALONE, DRIVES WITH SOMEONE ELSE OR TAKES BUS) Just your best guess, on AVERAGE how much time do you think traffic congestion adds to your daily commute? That is, how many more minutes do you spend driving one way, compared to what it would be with no traffic? <5 5 6-14 15 >15 No op. Mean Median 1/31/05 23 15 21 14 24 3 15 10 24. (IF WORK OUTSIDE THE HOME) Is commuting to work something you like or dislike? ----------Like----------- ---------Dislike--------- No NET Great deal Somewhat NET Somewhat Great deal op. 1/31/05 60 19 41 36 23 12 5 24a. (IF LIKES COMMUTE) What do you like best about your commute? 1/31/05 Quiet time/relaxing/time alone/provides a break 38 Shorter than other people's I know 14
16
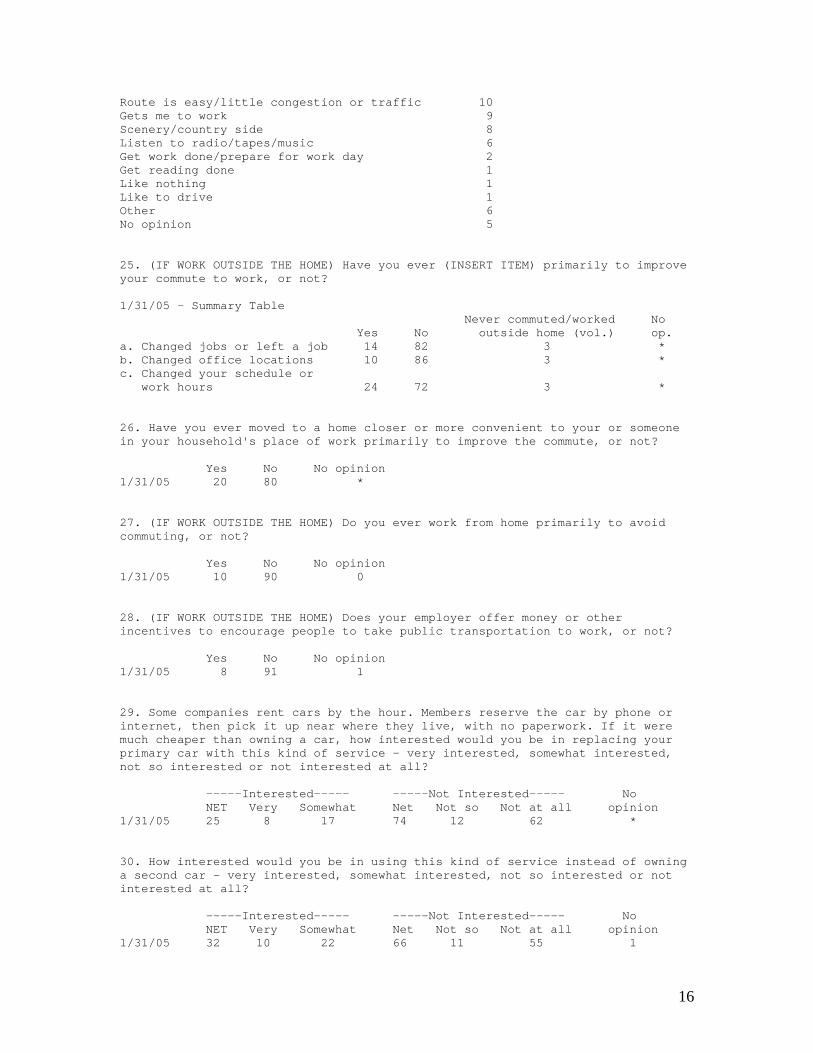
Route is easy/little congestion or traffic 10 Gets me to work 9 Scenery/country side 8 Listen to radio/tapes/music 6 Get work done/prepare for work day 2 Get reading done 1 Like nothing 1 Like to drive 1 Other 6 No opinion 5 25. (IF WORK OUTSIDE THE HOME) Have you ever (INSERT ITEM) primarily to improve your commute to work, or not? 1/31/05 – Summary Table Never commuted/worked No Yes No outside home (vol.) op. a. Changed jobs or left a job 14 82 3 * b. Changed office locations 10 86 3 * c. Changed your schedule or work hours 24 72 3 * 26. Have you ever moved to a home closer or more convenient to your or someone in your household's place of work primarily to improve the commute, or not? Yes No No opinion 1/31/05 20 80 * 27. (IF WORK OUTSIDE THE HOME) Do you ever work from home primarily to avoid commuting, or not? Yes No No opinion 1/31/05 10 90 0 28. (IF WORK OUTSIDE THE HOME) Does your employer offer money or other incentives to encourage people to take public transportation to work, or not? Yes No No opinion 1/31/05 8 91 1 29. Some companies rent cars by the hour. Members reserve the car by phone or internet, then pick it up near where they live, with no paperwork. If it were much cheaper than owning a car, how interested would you be in replacing your primary car with this kind of service - very interested, somewhat interested, not so interested or not interested at all? -----Interested----- -----Not Interested----- No NET Very Somewhat Net Not so Not at all opinion 1/31/05 25 8 17 74 12 62 * 30. How interested would you be in using this kind of service instead of owning a second car - very interested, somewhat interested, not so interested or not interested at all? -----Interested----- -----Not Interested----- No NET Very Somewhat Net Not so Not at all opinion 1/31/05 32 10 22 66 11 55 1

17
31. Highways in some areas have so-called high-occupancy vehicle lanes that are restricted to cars carrying at least two or three people. Are there H-O-V lanes on highways in your area, or not? Yes No No opinion 1/31/05 28 70 2 32. (IF NO HOV LANES) Would you support or oppose establishing H-O-V lanes in your area? Support Oppose No opinion 1/31/05 51 43 6 33. Some places open H-O-V lanes to single drivers who pay an extra toll. (Supporters say this eases traffic congestion and raises money for highway projects.) (Opponents say it's unfair to lower-income drivers who can't afford the extra toll.) What's your opinion - do you support or oppose this system? Support Oppose No opinion 1/31/05 36 60 4 34. Would you support or oppose making H-O-V lanes free for single drivers in hybrid cars that burn less gas, as a way of encouraging the use of these cars? Support Oppose No opinion 1/31/05 54 42 4 35. Another plan is to charge adjustable tolls on toll roads to try to spread out the flow of traffic – higher tolls at times of day when traffic is heavy, and lower tolls at times of day when traffic is light. Is that something you support or oppose? Support Oppose No opinion 1/31/05 29 68 3 36. For each item I name, please tell me how effective you think it is in easing traffic congestion – very effective, somewhat effective, not so effective, or not effective at all: 1/31/05 – Summary Table ----Effective---- ---Not Effective--- No NET Very Smwht. NET Not so At all op. a. Building new roads 83 51 33 15 7 8 2 b. Creating H-O-V lanes 70 27 43 27 10 17 3 c. Charging adjustable highway tolls 38 7 30 59 22 37 3 d. Charging non-residents a toll to drive into the central areas of major cities during business hours 28 7 21 70 22 48 2 e. Building or expanding public transportation 81 42 39 16 9 8 3 f. Immediately removing disabled or stalled vehicles from roadways 89 66 23 9 4 5 2
18
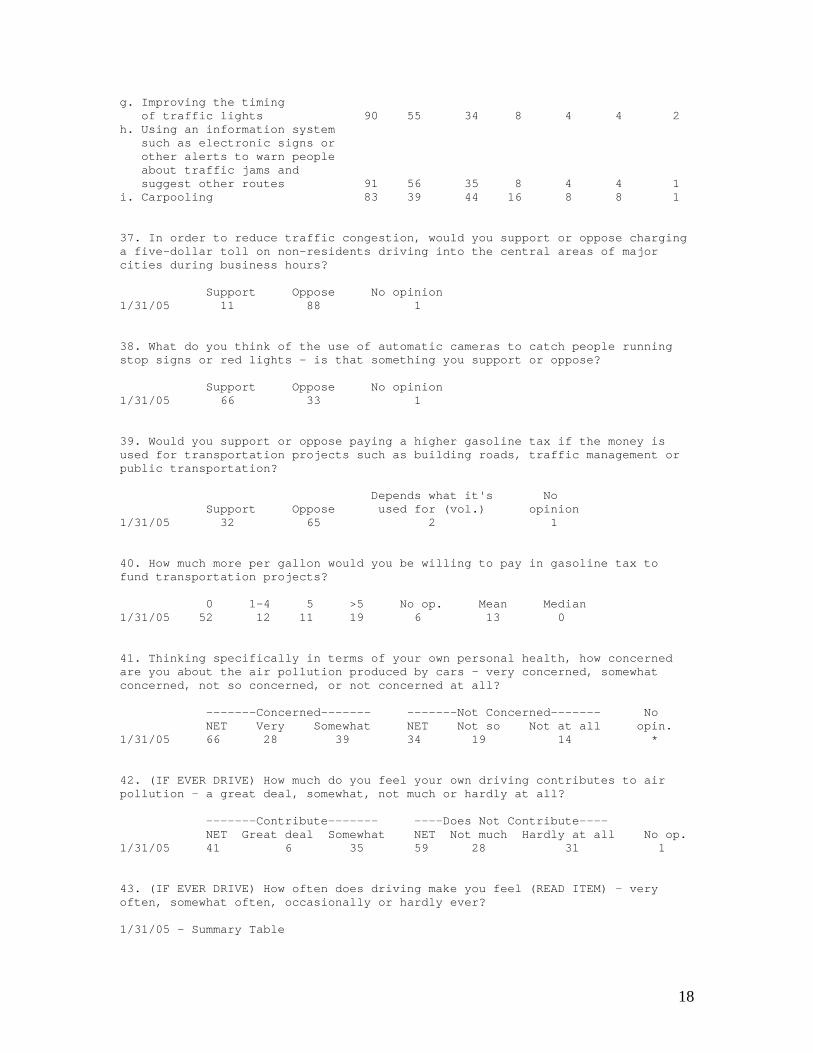
g. Improving the timing of traffic lights 90 55 34 8 4 4 2 h. Using an information system such as electronic signs or other alerts to warn people about traffic jams and suggest other routes 91 56 35 8 4 4 1 i. Carpooling 83 39 44 16 8 8 1 37. In order to reduce traffic congestion, would you support or oppose charging a five-dollar toll on non-residents driving into the central areas of major cities during business hours? Support Oppose No opinion 1/31/05 11 88 1 38. What do you think of the use of automatic cameras to catch people running stop signs or red lights – is that something you support or oppose? Support Oppose No opinion 1/31/05 66 33 1 39. Would you support or oppose paying a higher gasoline tax if the money is used for transportation projects such as building roads, traffic management or public transportation? Depends what it's No Support Oppose used for (vol.) opinion 1/31/05 32 65 2 1 40. How much more per gallon would you be willing to pay in gasoline tax to fund transportation projects? 0 1-4 5 >5 No op. Mean Median 1/31/05 52 12 11 19 6 13 0 41. Thinking specifically in terms of your own personal health, how concerned are you about the air pollution produced by cars – very concerned, somewhat concerned, not so concerned, or not concerned at all? -------Concerned------- -------Not Concerned------- No NET Very Somewhat NET Not so Not at all opin. 1/31/05 66 28 39 34 19 14 * 42. (IF EVER DRIVE) How much do you feel your own driving contributes to air pollution – a great deal, somewhat, not much or hardly at all? -------Contribute------- ----Does Not Contribute---- NET Great deal Somewhat NET Not much Hardly at all No op. 1/31/05 41 6 35 59 28 31 1 43. (IF EVER DRIVE) How often does driving make you feel (READ ITEM) - very often, somewhat often, occasionally or hardly ever? 1/31/05 – Summary Table
19
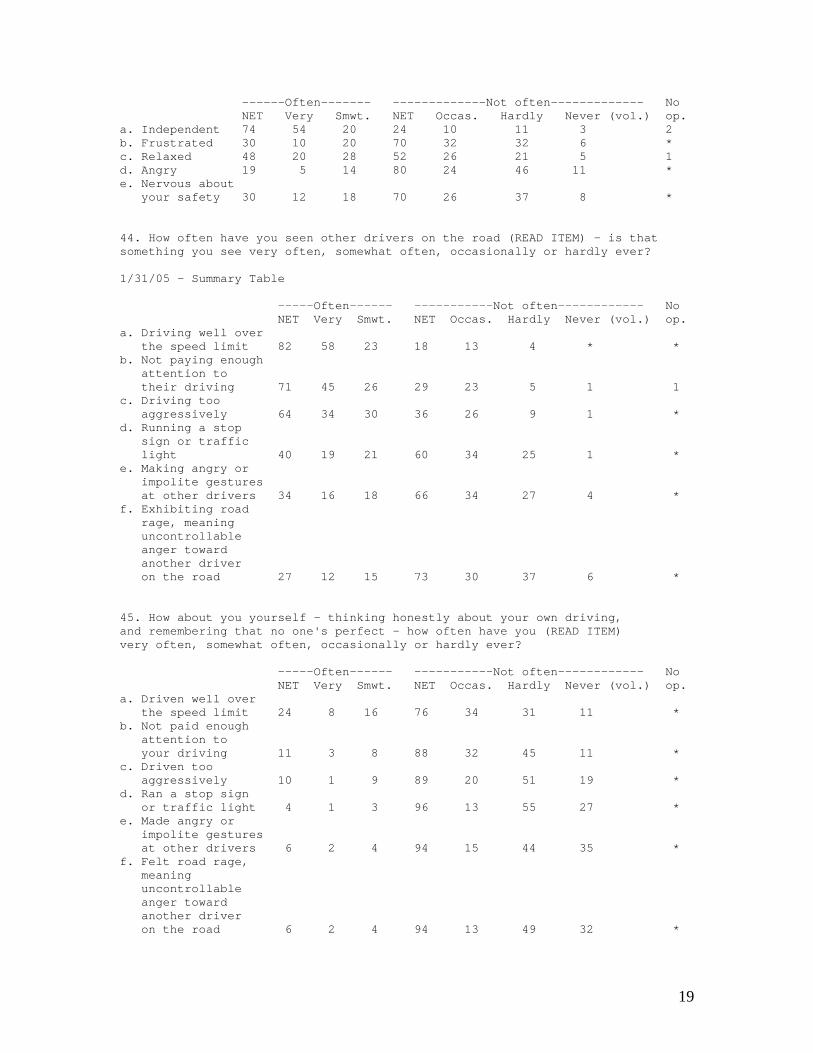
------Often------- -------------Not often------------- No NET Very Smwt. NET Occas. Hardly Never (vol.) op. a. Independent 74 54 20 24 10 11 3 2 b. Frustrated 30 10 20 70 32 32 6 * c. Relaxed 48 20 28 52 26 21 5 1 d. Angry 19 5 14 80 24 46 11 * e. Nervous about your safety 30 12 18 70 26 37 8 * 44. How often have you seen other drivers on the road (READ ITEM) – is that something you see very often, somewhat often, occasionally or hardly ever? 1/31/05 – Summary Table -----Often------ -----------Not often------------ No NET Very Smwt. NET Occas. Hardly Never (vol.) op. a. Driving well over the speed limit 82 58 23 18 13 4 * * b. Not paying enough attention to their driving 71 45 26 29 23 5 1 1 c. Driving too aggressively 64 34 30 36 26 9 1 * d. Running a stop sign or traffic light 40 19 21 60 34 25 1 * e. Making angry or impolite gestures at other drivers 34 16 18 66 34 27 4 * f. Exhibiting road rage, meaning uncontrollable anger toward another driver on the road 27 12 15 73 30 37 6 * 45. How about you yourself - thinking honestly about your own driving, and remembering that no one's perfect - how often have you (READ ITEM) very often, somewhat often, occasionally or hardly ever? -----Often------ -----------Not often------------ No NET Very Smwt. NET Occas. Hardly Never (vol.) op. a. Driven well over the speed limit 24 8 16 76 34 31 11 * b. Not paid enough attention to your driving 11 3 8 88 32 45 11 * c. Driven too aggressively 10 1 9 89 20 51 19 * d. Ran a stop sign or traffic light 4 1 3 96 13 55 27 * e. Made angry or impolite gestures at other drivers 6 2 4 94 15 44 35 * f. Felt road rage, meaning uncontrollable anger toward another driver on the road 6 2 4 94 13 49 32 *

20
47. Do you think frequently changing lanes helps you get to your destination faster, or not? Yes No No opinion 1/31/05 27 72 2 48. Which of the following do you think most endangers your own safety on the roads: (aggressive drivers), (traffic congestion), (drunk drivers), (large trucks), (overall road conditions) or what? 1/31/05 Aggressive drivers 32 Drunk drivers 32 Large trucks 11 Overall road conditions 11 Traffic congestion 7 Other (vol.) 6 None (vol.) * No opinion 1 49. (IF EVER DRIVE) Please tell me if you do any of the following things to pass the time when you're driving in stop-and-go traffic, or not. 1/31/05 – Summary Table Yes No No opinion a. Talk on the phone 40 60 0 b. Read a newspaper, book or magazine 3 97 0 d. Listen to the radio, tapes or CDs 93 7 0 e. Eat 41 58 * f. (WOMEN) Put on make-up 10 90 0 50. (IF EVER DRIVE) What kind of vehicle do you usually drive – a car, an SUV, a pickup truck, or what? Pickup Van/cargo Something No Car SUV truck van Minivan else opinion 1/31/05 55 17 19 5 3 1 * 51. (IF EVER DRIVE) How do you feel about this vehicle overall – do you love it, like it, dislike it or hate it? -------Like------- -------Dislike------ NET Love Like NET Dislike Hate No opin. 1/31/05 96 39 57 3 3 1 1 52. Including yourself, how many people with drivers' licenses live in your household? 0 1 2 3 >3 No op. Mean Median 1/31/05 3 28 50 12 7 0 2 2 53. All together, how many cars, SUVs or trucks do you or other members of your household own? This only includes vehicles that are in use. 0 1 2 3 >3 No op. Mean Median
21
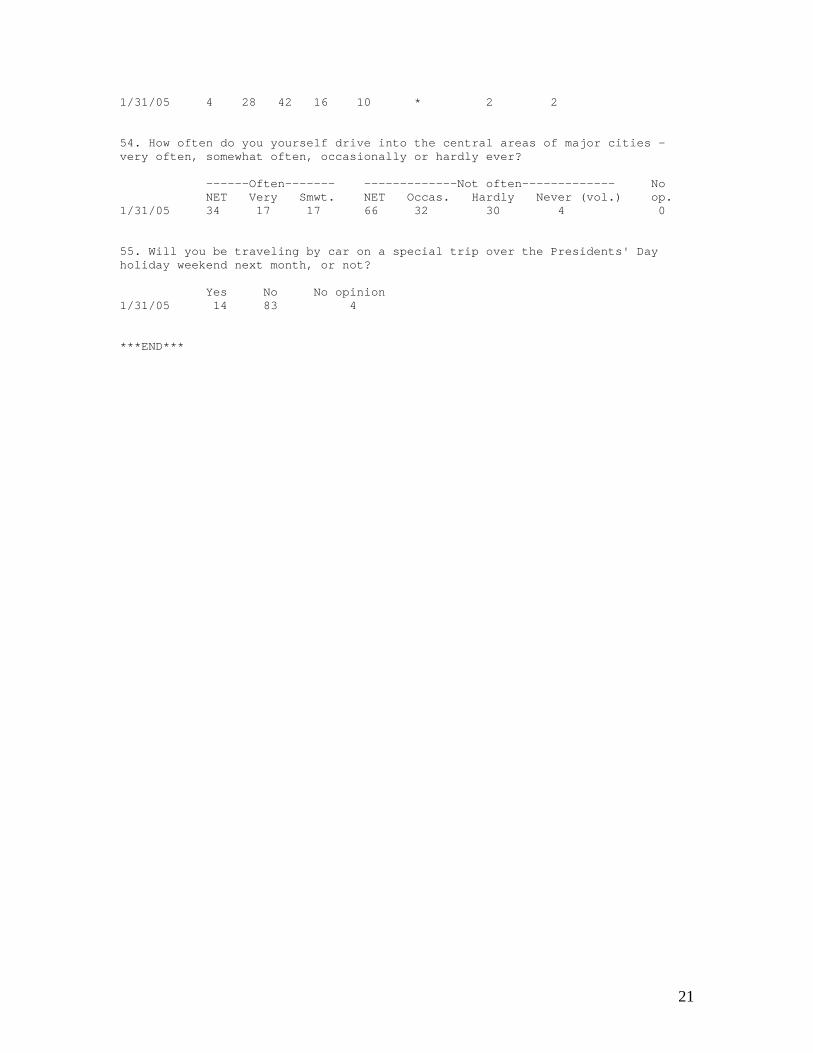
1/31/05 4 28 42 16 10 * 2 2 54. How often do you yourself drive into the central areas of major cities – very often, somewhat often, occasionally or hardly ever? ------Often------- -------------Not often------------- No NET Very Smwt. NET Occas. Hardly Never (vol.) op. 1/31/05 34 17 17 66 32 30 4 0 55. Will you be traveling by car on a special trip over the Presidents' Day holiday weekend next month, or not? Yes No No opinion 1/31/05 14 83 4 ***END***