Embed Size (px)
Citation preview
ABC NEWS/WASHINGTON POST POLL: Into the Debates
EMBARGOED FOR RELEASE AFTER 12:01 a.m. Monday, Oct. 1, 2012
Obama Leads on Expectations
– But the Race Itself Stays Close
Registered voters by 2-1 think Barack Obama will win the upcoming presidential debates and go
on to prevail in the November election. But expectations aside, the race remains close, with
strengths and vulnerabilities for both candidates in the campaign ahead.
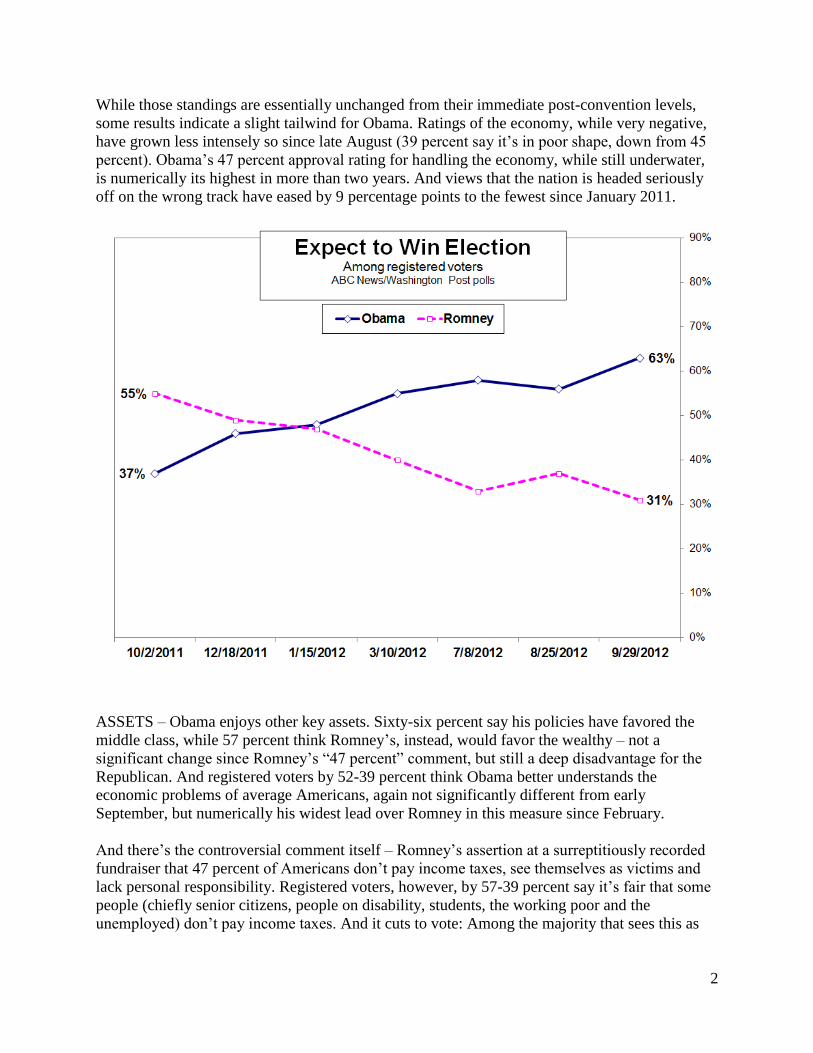
After a challenging period for Romney, registered voters by 63-31 percent expect Obama to win
re-election, his widest advantage in expectations in ABC News/Washington Post polls to date. A
year ago, in sharp contrast, Americans by an 18-point margin thought he’d lose.
Potential voters by a similar 56-29 percent also expect Obama to win the debates beginning
Wednesday night in Denver – a result that ratchets up the pressure on the president to perform,
leaving Romney, whatever his difficulties, greater opportunity to exceed expectations.
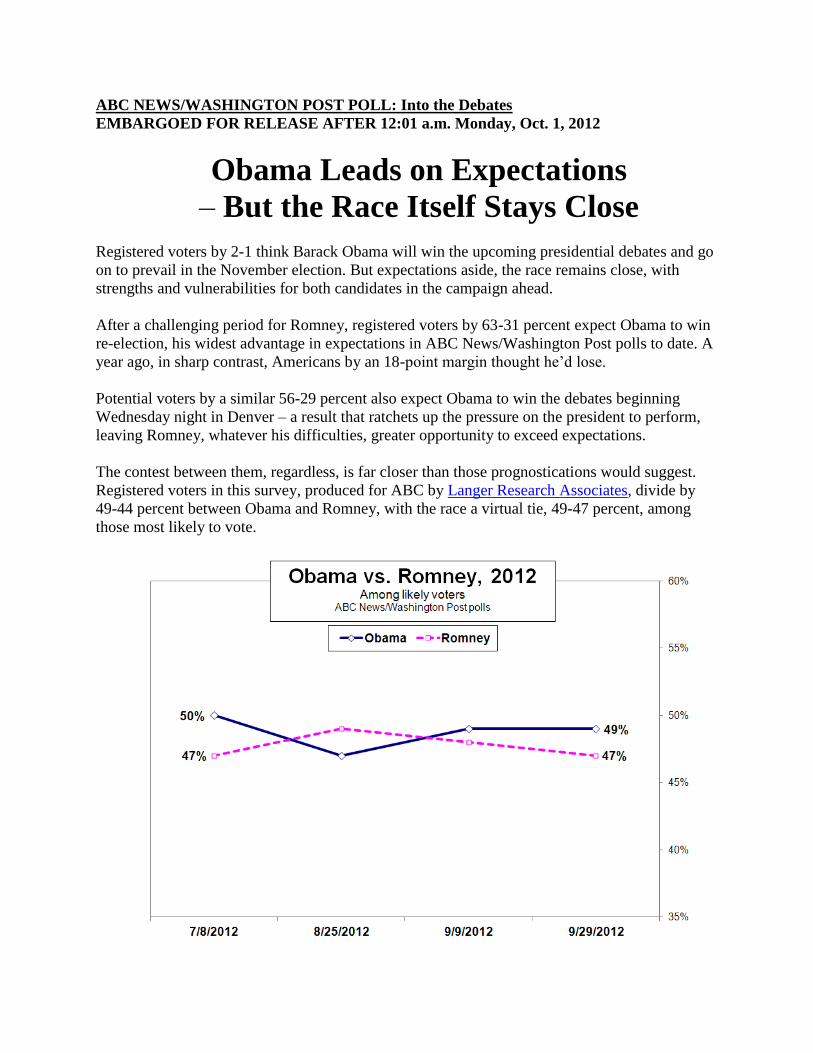
The contest between them, regardless, is far closer than those prognostications would suggest.
Registered voters in this survey, produced for ABC by Langer Research Associates, divide by
49-44 percent between Obama and Romney, with the race a virtual tie, 49-47 percent, among
those most likely to vote.
2
While those standings are essentially unchanged from their immediate post-convention levels,
some results indicate a slight tailwind for Obama. Ratings of the economy, while very negative,
have grown less intensely so since late August (39 percent say it’s in poor shape, down from 45
percent). Obama’s 47 percent approval rating for handling the economy, while still underwater,
is numerically its highest in more than two years. And views that the nation is headed seriously
off on the wrong track have eased by 9 percentage points to the fewest since January 2011.
ASSETS – Obama enjoys other key assets. Sixty-six percent say his policies have favored the
middle class, while 57 percent think Romney’s, instead, would favor the wealthy – not a
significant change since Romney’s “47 percent” comment, but still a deep disadvantage for the
Republican. And registered voters by 52-39 percent think Obama better understands the
economic problems of average Americans, again not significantly different from early
September, but numerically his widest lead over Romney in this measure since February.
And there’s the controversial comment itself – Romney’s assertion at a surreptitiously recorded
fundraiser that 47 percent of Americans don’t pay income taxes, see themselves as victims and
lack personal responsibility. Registered voters, however, by 57-39 percent say it’s fair that some
people (chiefly senior citizens, people on disability, students, the working poor and the
unemployed) don’t pay income taxes. And it cuts to vote: Among the majority that sees this as
3
fair, Obama leads by 20 points. Among those who think such people ought to pay at least some
taxes, though, it’s Romney by 17.
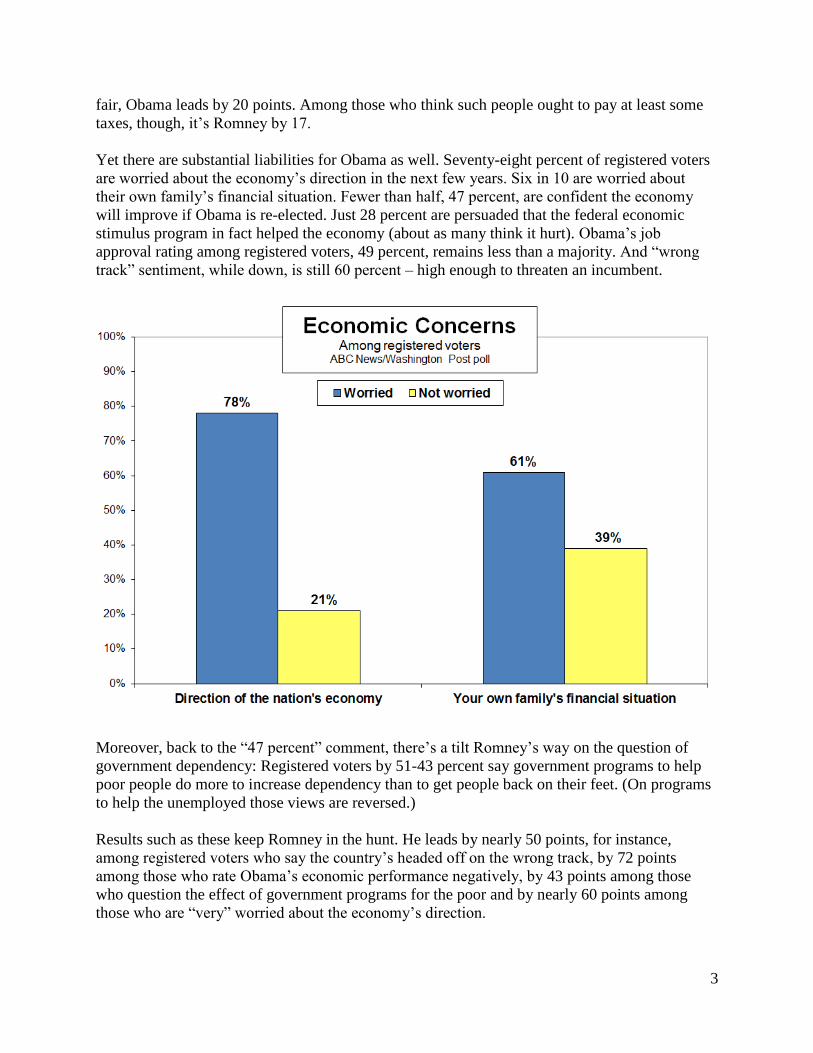
Yet there are substantial liabilities for Obama as well. Seventy-eight percent of registered voters
are worried about the economy’s direction in the next few years. Six in 10 are worried about
their own family’s financial situation. Fewer than half, 47 percent, are confident the economy
will improve if Obama is re-elected. Just 28 percent are persuaded that the federal economic
stimulus program in fact helped the economy (about as many think it hurt). Obama’s job
approval rating among registered voters, 49 percent, remains less than a majority. And “wrong
track” sentiment, while down, is still 60 percent – high enough to threaten an incumbent.
Moreover, back to the “47 percent” comment, there’s a tilt Romney’s way on the question of
government dependency: Registered voters by 51-43 percent say government programs to help
poor people do more to increase dependency than to get people back on their feet. (On programs
to help the unemployed those views are reversed.)
Results such as these keep Romney in the hunt. He leads by nearly 50 points, for instance,
among registered voters who say the country’s headed off on the wrong track, by 72 points
among those who rate Obama’s economic performance negatively, by 43 points among those
who question the effect of government programs for the poor and by nearly 60 points among
those who are “very” worried about the economy’s direction.
4
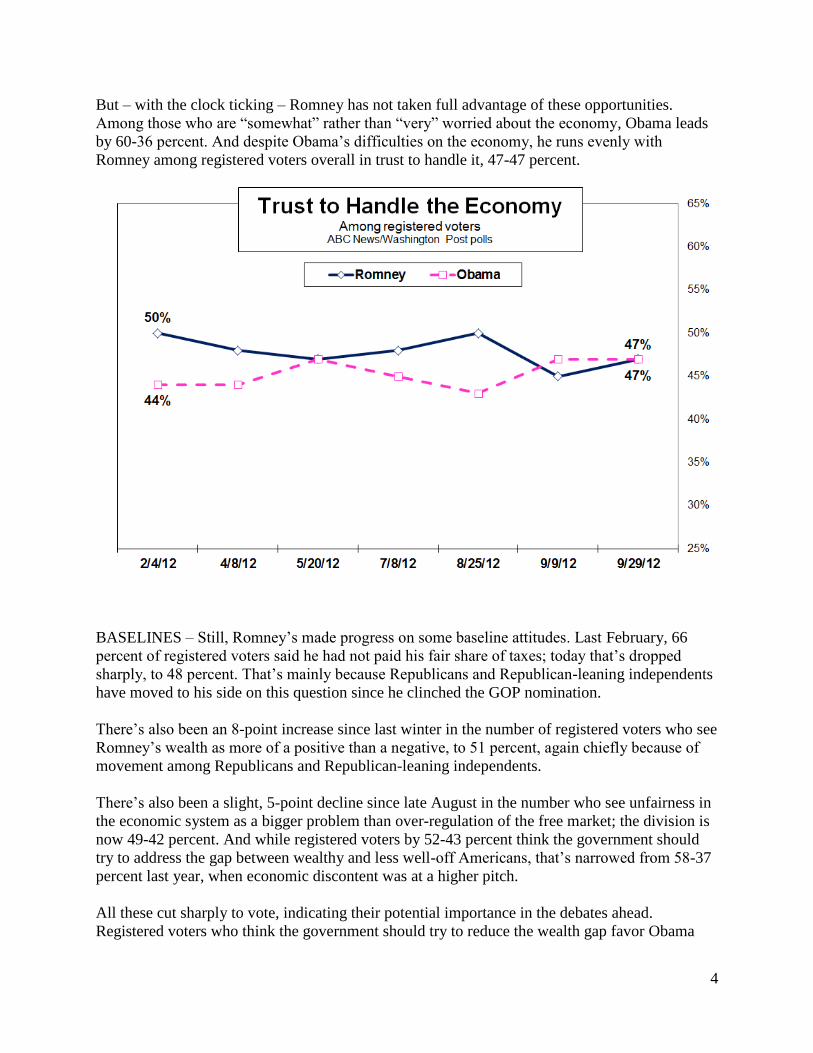
But – with the clock ticking – Romney has not taken full advantage of these opportunities.
Among those who are “somewhat” rather than “very” worried about the economy, Obama leads
by 60-36 percent. And despite Obama’s difficulties on the economy, he runs evenly with
Romney among registered voters overall in trust to handle it, 47-47 percent.
BASELINES – Still, Romney’s made progress on some baseline attitudes. Last February, 66
percent of registered voters said he had not paid his fair share of taxes; today that’s dropped
sharply, to 48 percent. That’s mainly because Republicans and Republican-leaning independents
have moved to his side on this question since he clinched the GOP nomination.
There’s also been an 8-point increase since last winter in the number of registered voters who see
Romney’s wealth as more of a positive than a negative, to 51 percent, again chiefly because of
movement among Republicans and Republican-leaning independents.
There’s also been a slight, 5-point decline since late August in the number who see unfairness in
the economic system as a bigger problem than over-regulation of the free market; the division is
now 49-42 percent. And while registered voters by 52-43 percent think the government should
try to address the gap between wealthy and less well-off Americans, that’s narrowed from 58-37
percent last year, when economic discontent was at a higher pitch.
All these cut sharply to vote, indicating their potential importance in the debates ahead.
Registered voters who think the government should try to reduce the wealth gap favor Obama
5
over Romney by 75-21 percent; those who say otherwise favor Romney, 72-20 percent. Those
more concerned with unfairness in the economic system are for Obama by 77-18 percent, while
those more focused on over-regulation back Romney, by an identical margin.
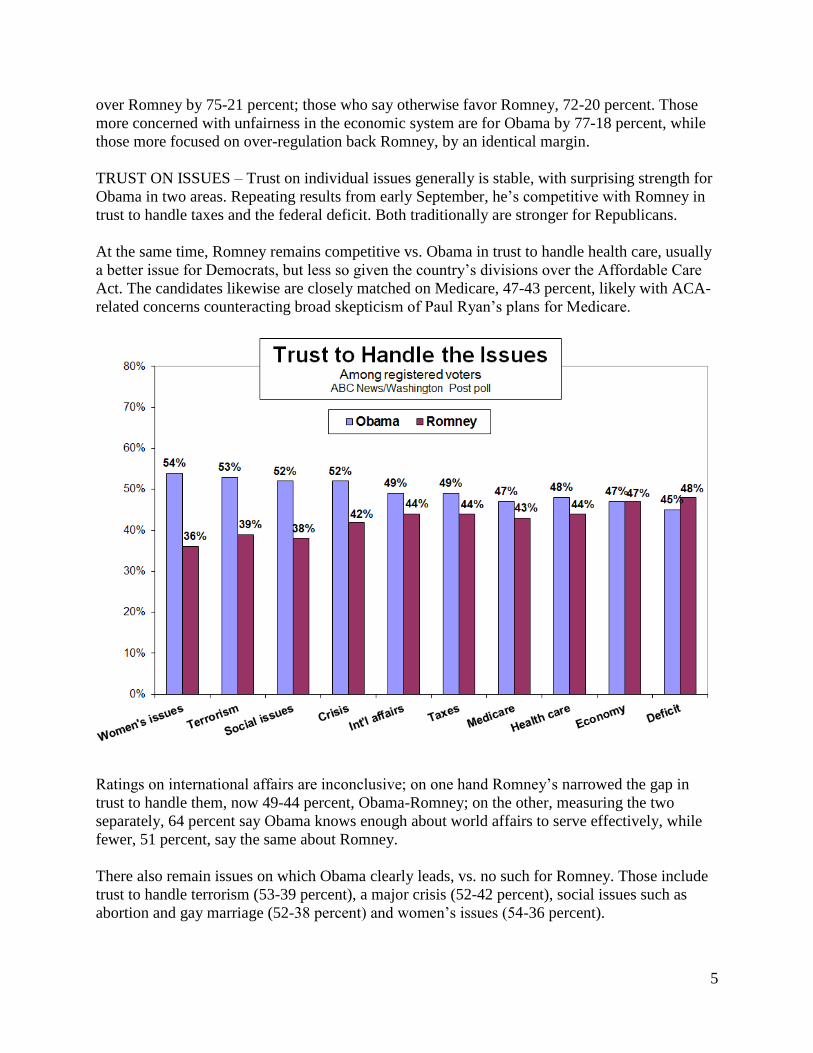
TRUST ON ISSUES – Trust on individual issues generally is stable, with surprising strength for
Obama in two areas. Repeating results from early September, he’s competitive with Romney in
trust to handle taxes and the federal deficit. Both traditionally are stronger for Republicans.
At the same time, Romney remains competitive vs. Obama in trust to handle health care, usually
a better issue for Democrats, but less so given the country’s divisions over the Affordable Care
Act. The candidates likewise are closely matched on Medicare, 47-43 percent, likely with ACA-
related concerns counteracting broad skepticism of Paul Ryan’s plans for Medicare.
Ratings on international affairs are inconclusive; on one hand Romney’s narrowed the gap in
trust to handle them, now 49-44 percent, Obama-Romney; on the other, measuring the two
separately, 64 percent say Obama knows enough about world affairs to serve effectively, while
fewer, 51 percent, say the same about Romney.
There also remain issues on which Obama clearly leads, vs. no such for Romney. Those include
trust to handle terrorism (53-39 percent), a major crisis (52-42 percent), social issues such as
abortion and gay marriage (52-38 percent) and women’s issues (54-36 percent).
6
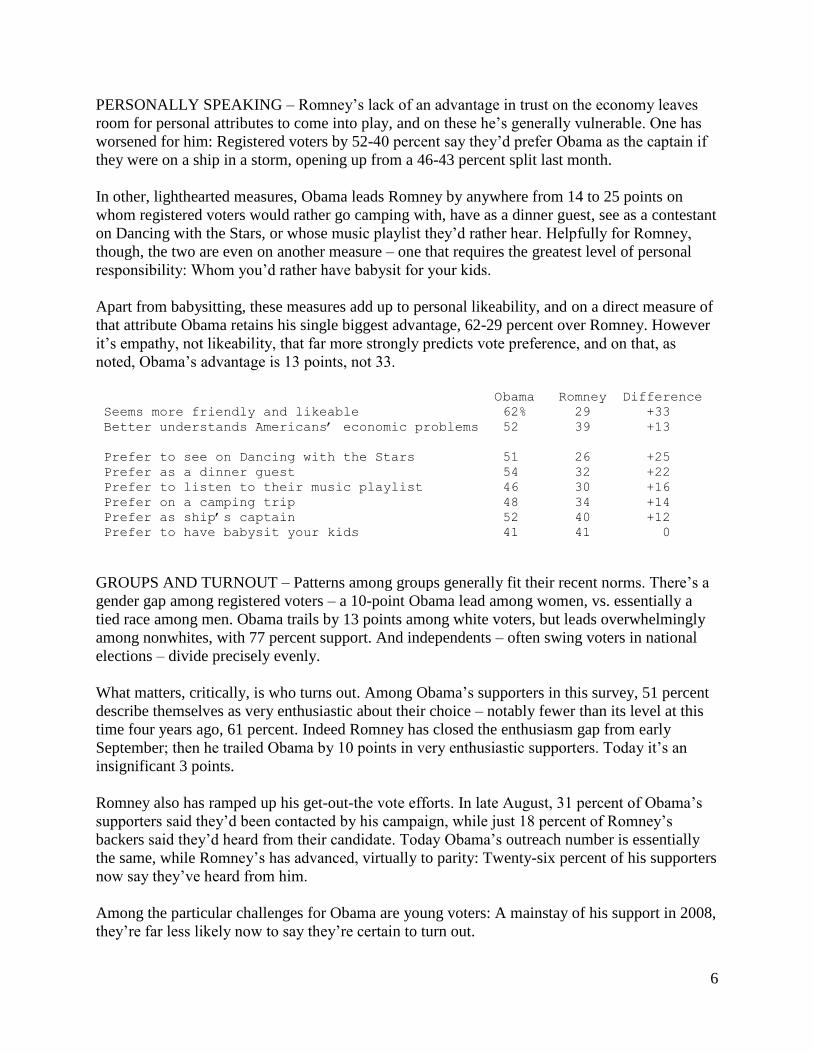
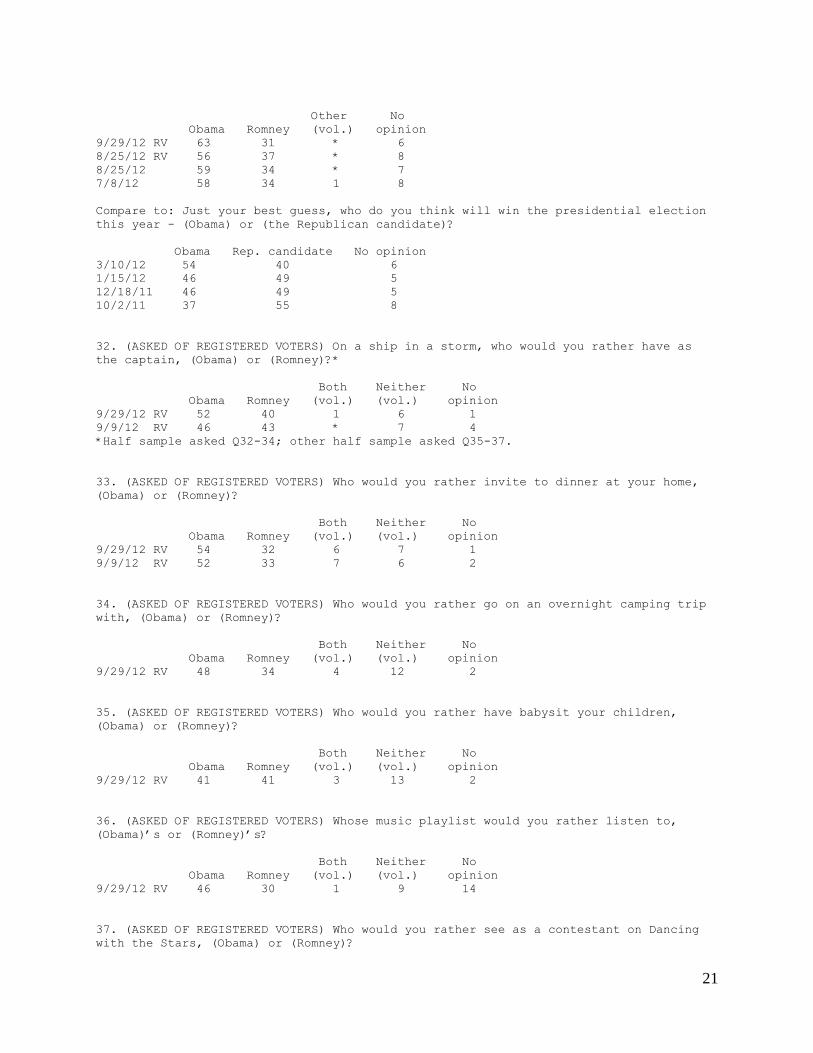
PERSONALLY SPEAKING – Romney’s lack of an advantage in trust on the economy leaves
room for personal attributes to come into play, and on these he’s generally vulnerable. One has
worsened for him: Registered voters by 52-40 percent say they’d prefer Obama as the captain if
they were on a ship in a storm, opening up from a 46-43 percent split last month.
In other, lighthearted measures, Obama leads Romney by anywhere from 14 to 25 points on
whom registered voters would rather go camping with, have as a dinner guest, see as a contestant
on Dancing with the Stars, or whose music playlist they’d rather hear. Helpfully for Romney,
though, the two are even on another measure – one that requires the greatest level of personal
responsibility: Whom you’d rather have babysit for your kids.
Apart from babysitting, these measures add up to personal likeability, and on a direct measure of
that attribute Obama retains his single biggest advantage, 62-29 percent over Romney. However
it’s empathy, not likeability, that far more strongly predicts vote preference, and on that, as
noted, Obama’s advantage is 13 points, not 33.
Obama Romney Difference Seems more friendly and likeable 62% 29 +33
Better understands Americans’ economic problems 52 39 +13
Prefer to see on Dancing with the Stars 51 26 +25
Prefer as a dinner guest 54 32 +22
Prefer to listen to their music playlist 46 30 +16
Prefer on a camping trip 48 34 +14
Prefer as ship’s captain 52 40 +12
Prefer to have babysit your kids 41 41 0
GROUPS AND TURNOUT – Patterns among groups generally fit their recent norms. There’s a
gender gap among registered voters – a 10-point Obama lead among women, vs. essentially a
tied race among men. Obama trails by 13 points among white voters, but leads overwhelmingly
among nonwhites, with 77 percent support. And independents – often swing voters in national
elections – divide precisely evenly.
What matters, critically, is who turns out. Among Obama’s supporters in this survey, 51 percent
describe themselves as very enthusiastic about their choice – notably fewer than its level at this
time four years ago, 61 percent. Indeed Romney has closed the enthusiasm gap from early
September; then he trailed Obama by 10 points in very enthusiastic supporters. Today it’s an
insignificant 3 points.
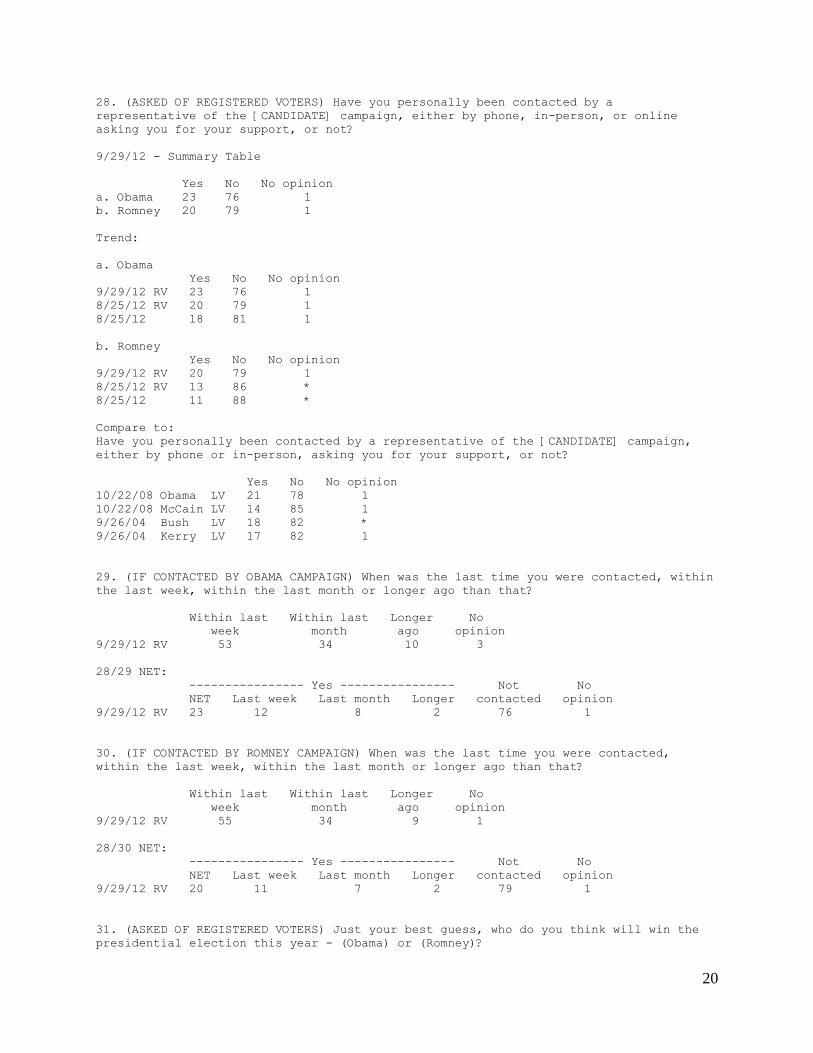
Romney also has ramped up his get-out-the vote efforts. In late August, 31 percent of Obama’s
supporters said they’d been contacted by his campaign, while just 18 percent of Romney’s
backers said they’d heard from their candidate. Today Obama’s outreach number is essentially
the same, while Romney’s has advanced, virtually to parity: Twenty-six percent of his supporters
now say they’ve heard from him.
Among the particular challenges for Obama are young voters: A mainstay of his support in 2008,
they’re far less likely now to say they’re certain to turn out.
7
Getting out the vote, for both candidates, may carry the extra burden of battling expectations.
Among Obama’s supporters, 96 percent expect him to win – raising the risk that some will feel
secure enough not to bother turning out. Among Romney’s, at the same time, 28 percent pick
Obama to win – suggesting the possibility they’ll be demotivated. Between the two, fighting
expectations may be hardest for Romney: In fall season election polling since 1984, when most
Americans have expected one candidate to win, he has.
METHODOLOGY – This ABC News/Washington Post poll was conducted by telephone Sept.
26-29, 2012, among a random national sample of 1,101 adults, including 929 registered voters
and 813 likely voters, including landline and cell-phone-only respondents. Results have a margin
of sampling error of 3.5 points for registered voters and 4 points for likely voters, including
design effect. The survey was produced for ABC News by Langer Research Associates of New
York, N.Y., with sampling, data collection and tabulation by Abt-SRBI of New York, N.Y.
Partisan divisions in this survey, Democrats-Republicans-independents, are 31-25-36 percent
among the general population, 33-28-34 percent among registered voters and 33-30-33 percent
among likely voters. Partisan divisions in the 2008 exit poll were 39-32-29 percent.
Analysis by Gary Langer.
ABC News polls can be found at ABCNEWS.com at http://abcnews.com/pollingunit.
Media contacts: David Ford, (212) 456-7243, and Julie Townsend, (212) 456-4934.
Full results follow.
*= less than 0.5 percent
1. (ASKED OF REGISTERED VOTERS) How closely are you following the 2012 presidential
race: very closely, somewhat closely, not so closely, or not closely at all?
---- Closely ----- ---- Not closely ----- No
NET Very Smwt NET Not so At all opinion
9/29/12 RV 86 47 39 14 8 6 0
9/9/12 RV 80 44 36 19 11 9 *
5/20/12 RV 82 38 44 18 9 8 *
2/4/12* RV 79 37 43 20 12 8 *
1/15/12 RV 76 33 43 24 14 10 *
*2/4/12 and previous "not too closely" instead of "not so closely"
2. (ASKED OF REGISTERED VOTERS) I'd like you to rate the chances that you will vote in
the presidential election in November: Are you absolutely certain to vote, will you
probably vote, are the chances 50-50, or less than that?
Don't think Already
Certain Probably Chances Less than will vote voted No
to vote vote 50/50 that (vol.) (vol.) op.
9/29/12 RV 84 7 7 2 * 0 *
9/9/12 RV 83 7 6 4 * NA 0
8/25/12 RV 81 8 6 3 1 NA *
7/8/12 RV 81 9 8 2 * NA *
Call for full trend.
8
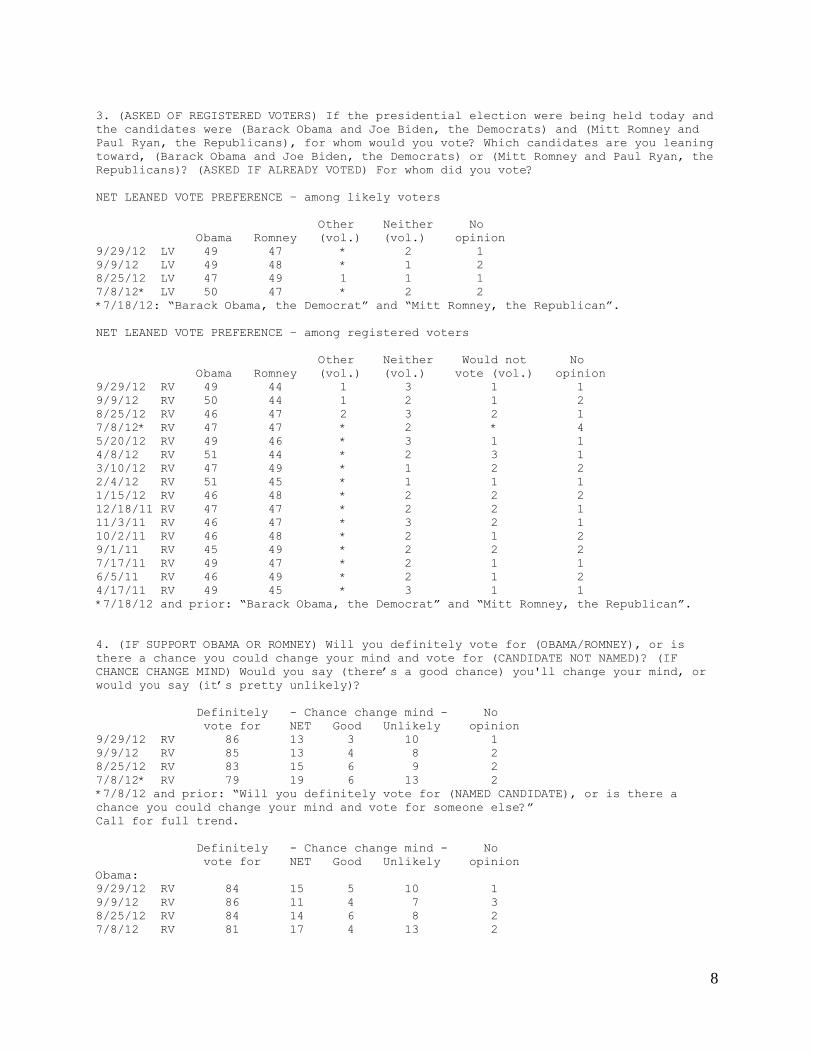
3. (ASKED OF REGISTERED VOTERS) If the presidential election were being held today and
the candidates were (Barack Obama and Joe Biden, the Democrats) and (Mitt Romney and
Paul Ryan, the Republicans), for whom would you vote? Which candidates are you leaning
toward, (Barack Obama and Joe Biden, the Democrats) or (Mitt Romney and Paul Ryan, the
Republicans)? (ASKED IF ALREADY VOTED) For whom did you vote?
NET LEANED VOTE PREFERENCE – among likely voters
Other Neither No
Obama Romney (vol.) (vol.) opinion
9/29/12 LV 49 47 * 2 1
9/9/12 LV 49 48 * 1 2
8/25/12 LV 47 49 1 1 1
7/8/12* LV 50 47 * 2 2
*7/18/12: “Barack Obama, the Democrat” and “Mitt Romney, the Republican”.
NET LEANED VOTE PREFERENCE – among registered voters
Other Neither Would not No
Obama Romney (vol.) (vol.) vote (vol.) opinion
9/29/12 RV 49 44 1 3 1 1
9/9/12 RV 50 44 1 2 1 2
8/25/12 RV 46 47 2 3 2 1
7/8/12* RV 47 47 * 2 * 4
5/20/12 RV 49 46 * 3 1 1
4/8/12 RV 51 44 * 2 3 1
3/10/12 RV 47 49 * 1 2 2
2/4/12 RV 51 45 * 1 1 1
1/15/12 RV 46 48 * 2 2 2
12/18/11 RV 47 47 * 2 2 1
11/3/11 RV 46 47 * 3 2 1
10/2/11 RV 46 48 * 2 1 2
9/1/11 RV 45 49 * 2 2 2
7/17/11 RV 49 47 * 2 1 1
6/5/11 RV 46 49 * 2 1 2
4/17/11 RV 49 45 * 3 1 1
*7/18/12 and prior: “Barack Obama, the Democrat” and “Mitt Romney, the Republican”.
4. (IF SUPPORT OBAMA OR ROMNEY) Will you definitely vote for (OBAMA/ROMNEY), or is
there a chance you could change your mind and vote for (CANDIDATE NOT NAMED)? (IF
CHANCE CHANGE MIND) Would you say (there’s a good chance) you'll change your mind, or
would you say (it’s pretty unlikely)?
Definitely - Chance change mind - No
vote for NET Good Unlikely opinion
9/29/12 RV 86 13 3 10 1
9/9/12 RV 85 13 4 8 2
8/25/12 RV 83 15 6 9 2
7/8/12* RV 79 19 6 13 2
*7/8/12 and prior: “Will you definitely vote for (NAMED CANDIDATE), or is there a
chance you could change your mind and vote for someone else?”
Call for full trend.
Definitely - Chance change mind - No
vote for NET Good Unlikely opinion
Obama:
9/29/12 RV 84 15 5 10 1
9/9/12 RV 86 11 4 7 3
8/25/12 RV 84 14 6 8 2
7/8/12 RV 81 17 4 13 2
9
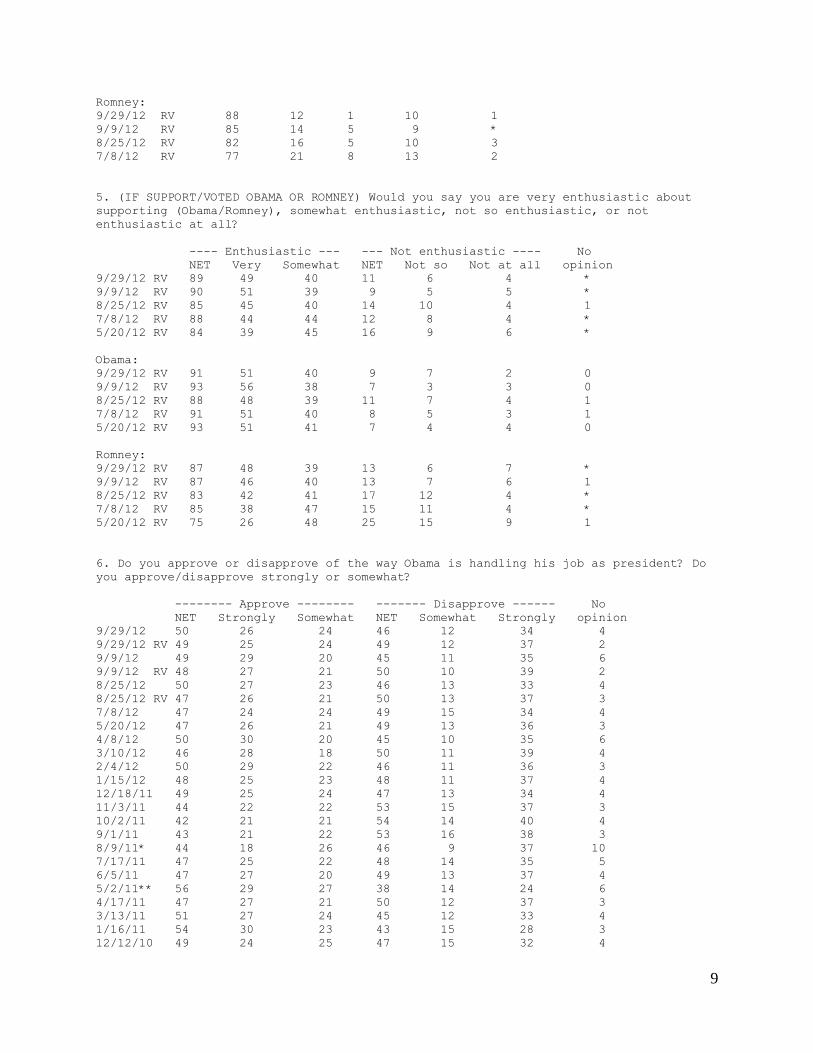
Romney:
9/29/12 RV 88 12 1 10 1
9/9/12 RV 85 14 5 9 *
8/25/12 RV 82 16 5 10 3
7/8/12 RV 77 21 8 13 2
5. (IF SUPPORT/VOTED OBAMA OR ROMNEY) Would you say you are very enthusiastic about
supporting (Obama/Romney), somewhat enthusiastic, not so enthusiastic, or not
enthusiastic at all?
---- Enthusiastic --- --- Not enthusiastic ---- No
NET Very Somewhat NET Not so Not at all opinion
9/29/12 RV 89 49 40 11 6 4 *
9/9/12 RV 90 51 39 9 5 5 *
8/25/12 RV 85 45 40 14 10 4 1
7/8/12 RV 88 44 44 12 8 4 *
5/20/12 RV 84 39 45 16 9 6 *
Obama:
9/29/12 RV 91 51 40 9 7 2 0
9/9/12 RV 93 56 38 7 3 3 0
8/25/12 RV 88 48 39 11 7 4 1
7/8/12 RV 91 51 40 8 5 3 1
5/20/12 RV 93 51 41 7 4 4 0
Romney:
9/29/12 RV 87 48 39 13 6 7 *
9/9/12 RV 87 46 40 13 7 6 1
8/25/12 RV 83 42 41 17 12 4 *
7/8/12 RV 85 38 47 15 11 4 *
5/20/12 RV 75 26 48 25 15 9 1
6. Do you approve or disapprove of the way Obama is handling his job as president? Do
you approve/disapprove strongly or somewhat?
-------- Approve -------- ------- Disapprove ------ No
NET Strongly Somewhat NET Somewhat Strongly opinion
9/29/12 50 26 24 46 12 34 4
9/29/12 RV 49 25 24 49 12 37 2
9/9/12 49 29 20 45 11 35 6
9/9/12 RV 48 27 21 50 10 39 2
8/25/12 50 27 23 46 13 33 4
8/25/12 RV 47 26 21 50 13 37 3
7/8/12 47 24 24 49 15 34 4
5/20/12 47 26 21 49 13 36 3
4/8/12 50 30 20 45 10 35 6
3/10/12 46 28 18 50 11 39 4
2/4/12 50 29 22 46 11 36 3
1/15/12 48 25 23 48 11 37 4
12/18/11 49 25 24 47 13 34 4
11/3/11 44 22 22 53 15 37 3
10/2/11 42 21 21 54 14 40 4
9/1/11 43 21 22 53 16 38 3
8/9/11* 44 18 26 46 9 37 10
7/17/11 47 25 22 48 14 35 5
6/5/11 47 27 20 49 13 37 4
5/2/11** 56 29 27 38 14 24 6
4/17/11 47 27 21 50 12 37 3
3/13/11 51 27 24 45 12 33 4
1/16/11 54 30 23 43 15 28 3
12/12/10 49 24 25 47 15 32 4
10
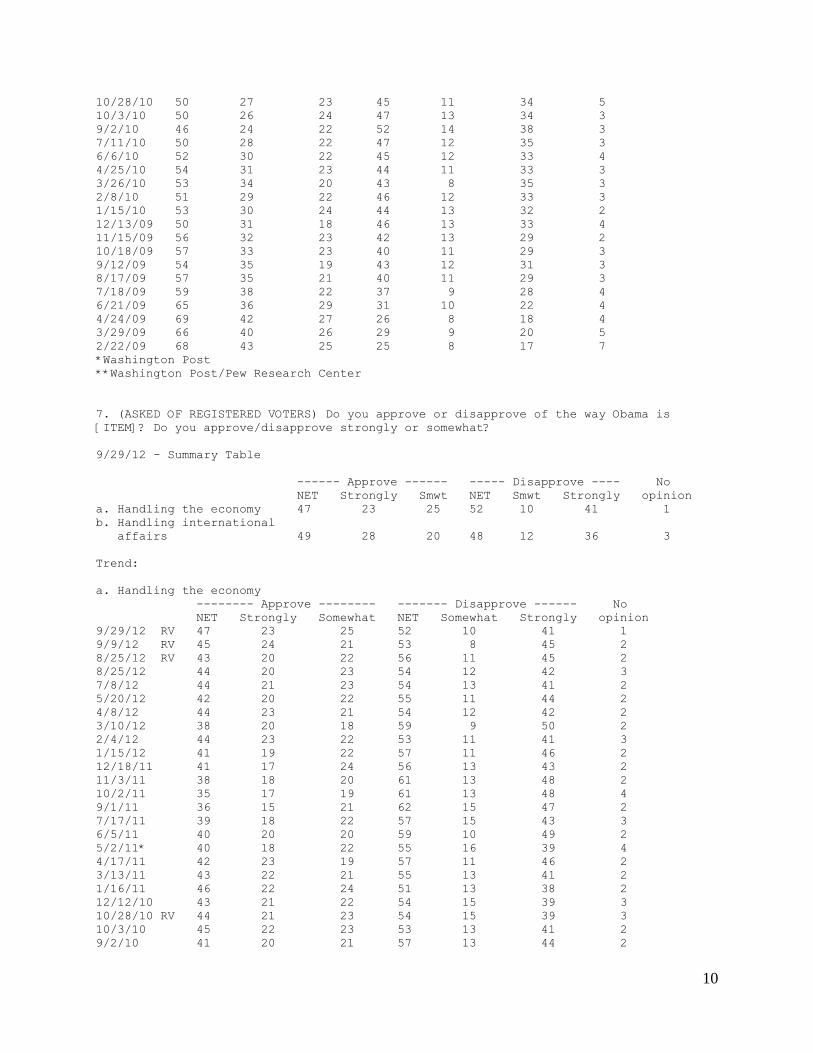
10/28/10 50 27 23 45 11 34 5
10/3/10 50 26 24 47 13 34 3
9/2/10 46 24 22 52 14 38 3
7/11/10 50 28 22 47 12 35 3
6/6/10 52 30 22 45 12 33 4
4/25/10 54 31 23 44 11 33 3
3/26/10 53 34 20 43 8 35 3
2/8/10 51 29 22 46 12 33 3
1/15/10 53 30 24 44 13 32 2
12/13/09 50 31 18 46 13 33 4
11/15/09 56 32 23 42 13 29 2
10/18/09 57 33 23 40 11 29 3
9/12/09 54 35 19 43 12 31 3
8/17/09 57 35 21 40 11 29 3
7/18/09 59 38 22 37 9 28 4
6/21/09 65 36 29 31 10 22 4
4/24/09 69 42 27 26 8 18 4
3/29/09 66 40 26 29 9 20 5
2/22/09 68 43 25 25 8 17 7
*Washington Post
**Washington Post/Pew Research Center
7. (ASKED OF REGISTERED VOTERS) Do you approve or disapprove of the way Obama is
[ITEM]? Do you approve/disapprove strongly or somewhat?
9/29/12 - Summary Table
------ Approve ------ ----- Disapprove ---- No
NET Strongly Smwt NET Smwt Strongly opinion
a. Handling the economy 47 23 25 52 10 41 1
b. Handling international
affairs 49 28 20 48 12 36 3
Trend:
a. Handling the economy
-------- Approve -------- ------- Disapprove ------ No
NET Strongly Somewhat NET Somewhat Strongly opinion
9/29/12 RV 47 23 25 52 10 41 1
9/9/12 RV 45 24 21 53 8 45 2
8/25/12 RV 43 20 22 56 11 45 2
8/25/12 44 20 23 54 12 42 3
7/8/12 44 21 23 54 13 41 2
5/20/12 42 20 22 55 11 44 2
4/8/12 44 23 21 54 12 42 2
3/10/12 38 20 18 59 9 50 2
2/4/12 44 23 22 53 11 41 3
1/15/12 41 19 22 57 11 46 2
12/18/11 41 17 24 56 13 43 2
11/3/11 38 18 20 61 13 48 2
10/2/11 35 17 19 61 13 48 4
9/1/11 36 15 21 62 15 47 2
7/17/11 39 18 22 57 15 43 3
6/5/11 40 20 20 59 10 49 2
5/2/11* 40 18 22 55 16 39 4
4/17/11 42 23 19 57 11 46 2
3/13/11 43 22 21 55 13 41 2
1/16/11 46 22 24 51 13 38 2
12/12/10 43 21 22 54 15 39 3
10/28/10 RV 44 21 23 54 15 39 3
10/3/10 45 22 23 53 13 41 2
9/2/10 41 20 21 57 13 44 2
11
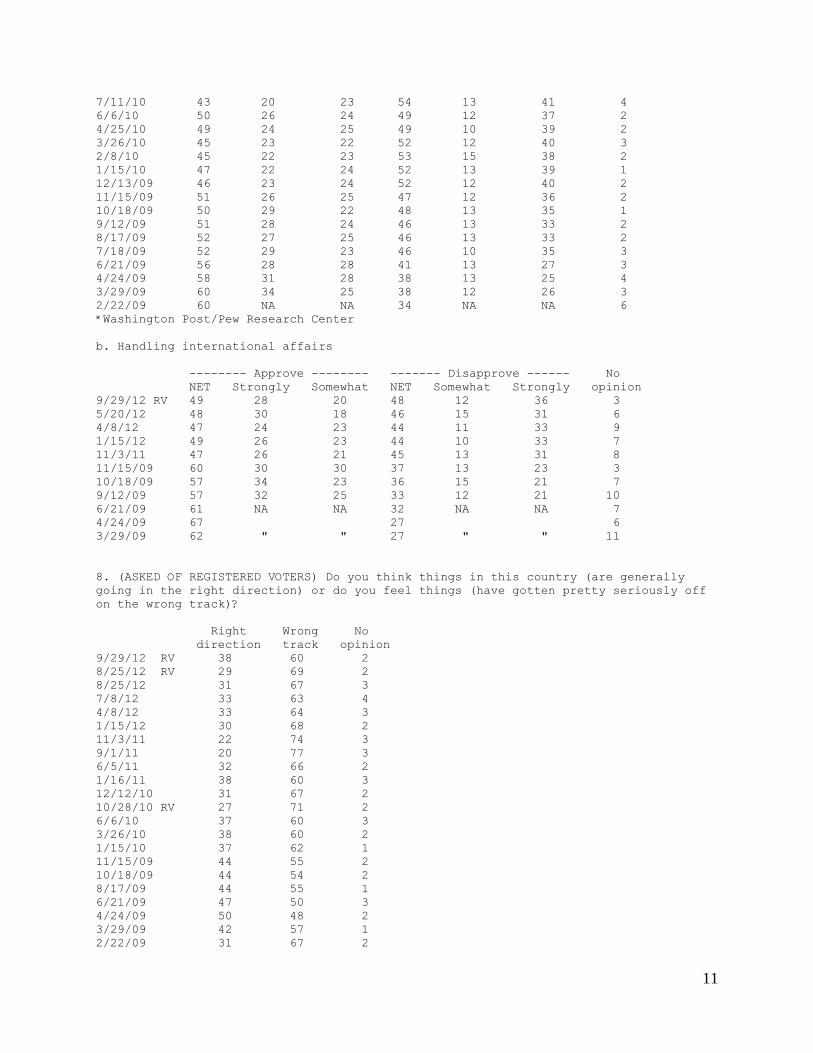
7/11/10 43 20 23 54 13 41 4
6/6/10 50 26 24 49 12 37 2
4/25/10 49 24 25 49 10 39 2
3/26/10 45 23 22 52 12 40 3
2/8/10 45 22 23 53 15 38 2
1/15/10 47 22 24 52 13 39 1
12/13/09 46 23 24 52 12 40 2
11/15/09 51 26 25 47 12 36 2
10/18/09 50 29 22 48 13 35 1
9/12/09 51 28 24 46 13 33 2
8/17/09 52 27 25 46 13 33 2
7/18/09 52 29 23 46 10 35 3
6/21/09 56 28 28 41 13 27 3
4/24/09 58 31 28 38 13 25 4
3/29/09 60 34 25 38 12 26 3
2/22/09 60 NA NA 34 NA NA 6
*Washington Post/Pew Research Center
b. Handling international affairs
-------- Approve -------- ------- Disapprove ------ No
NET Strongly Somewhat NET Somewhat Strongly opinion
9/29/12 RV 49 28 20 48 12 36 3
5/20/12 48 30 18 46 15 31 6
4/8/12 47 24 23 44 11 33 9
1/15/12 49 26 23 44 10 33 7
11/3/11 47 26 21 45 13 31 8
11/15/09 60 30 30 37 13 23 3
10/18/09 57 34 23 36 15 21 7
9/12/09 57 32 25 33 12 21 10
6/21/09 61 NA NA 32 NA NA 7
4/24/09 67 27 6
3/29/09 62 " " 27 " " 11
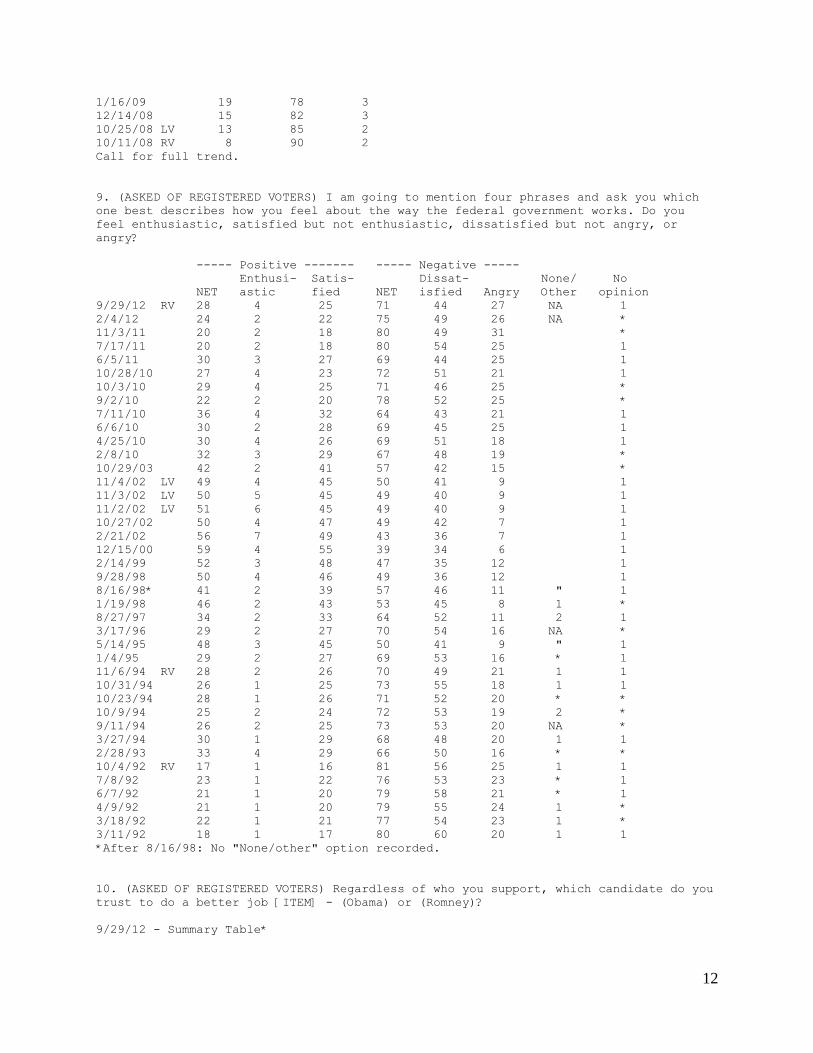
8. (ASKED OF REGISTERED VOTERS) Do you think things in this country (are generally
going in the right direction) or do you feel things (have gotten pretty seriously off
on the wrong track)?
Right Wrong No
direction track opinion
9/29/12 RV 38 60 2
8/25/12 RV 29 69 2
8/25/12 31 67 3
7/8/12 33 63 4
4/8/12 33 64 3
1/15/12 30 68 2
11/3/11 22 74 3
9/1/11 20 77 3
6/5/11 32 66 2
1/16/11 38 60 3
12/12/10 31 67 2
10/28/10 RV 27 71 2
6/6/10 37 60 3
3/26/10 38 60 2
1/15/10 37 62 1
11/15/09 44 55 2
10/18/09 44 54 2
8/17/09 44 55 1
6/21/09 47 50 3
4/24/09 50 48 2
3/29/09 42 57 1
2/22/09 31 67 2
12
1/16/09 19 78 3
12/14/08 15 82 3
10/25/08 LV 13 85 2
10/11/08 RV 8 90 2
Call for full trend.
9. (ASKED OF REGISTERED VOTERS) I am going to mention four phrases and ask you which
one best describes how you feel about the way the federal government works. Do you
feel enthusiastic, satisfied but not enthusiastic, dissatisfied but not angry, or
angry?
----- Positive ------- ----- Negative -----
Enthusi- Satis- Dissat- None/ No
NET astic fied NET isfied Angry Other opinion
9/29/12 RV 28 4 25 71 44 27 NA 1
2/4/12 24 2 22 75 49 26 NA *
11/3/11 20 2 18 80 49 31 *
7/17/11 20 2 18 80 54 25 1
6/5/11 30 3 27 69 44 25 1
10/28/10 27 4 23 72 51 21 1
10/3/10 29 4 25 71 46 25 *
9/2/10 22 2 20 78 52 25 *
7/11/10 36 4 32 64 43 21 1
6/6/10 30 2 28 69 45 25 1
4/25/10 30 4 26 69 51 18 1
2/8/10 32 3 29 67 48 19 *
10/29/03 42 2 41 57 42 15 *
11/4/02 LV 49 4 45 50 41 9 1
11/3/02 LV 50 5 45 49 40 9 1
11/2/02 LV 51 6 45 49 40 9 1
10/27/02 50 4 47 49 42 7 1
2/21/02 56 7 49 43 36 7 1
12/15/00 59 4 55 39 34 6 1
2/14/99 52 3 48 47 35 12 1
9/28/98 50 4 46 49 36 12 1
8/16/98* 41 2 39 57 46 11 " 1
1/19/98 46 2 43 53 45 8 1 *
8/27/97 34 2 33 64 52 11 2 1
3/17/96 29 2 27 70 54 16 NA *
5/14/95 48 3 45 50 41 9 " 1
1/4/95 29 2 27 69 53 16 * 1
11/6/94 RV 28 2 26 70 49 21 1 1
10/31/94 26 1 25 73 55 18 1 1
10/23/94 28 1 26 71 52 20 * *
10/9/94 25 2 24 72 53 19 2 *
9/11/94 26 2 25 73 53 20 NA *
3/27/94 30 1 29 68 48 20 1 1
2/28/93 33 4 29 66 50 16 * *
10/4/92 RV 17 1 16 81 56 25 1 1
7/8/92 23 1 22 76 53 23 * 1
6/7/92 21 1 20 79 58 21 * 1
4/9/92 21 1 20 79 55 24 1 *
3/18/92 22 1 21 77 54 23 1 *
3/11/92 18 1 17 80 60 20 1 1
*After 8/16/98: No "None/other" option recorded.
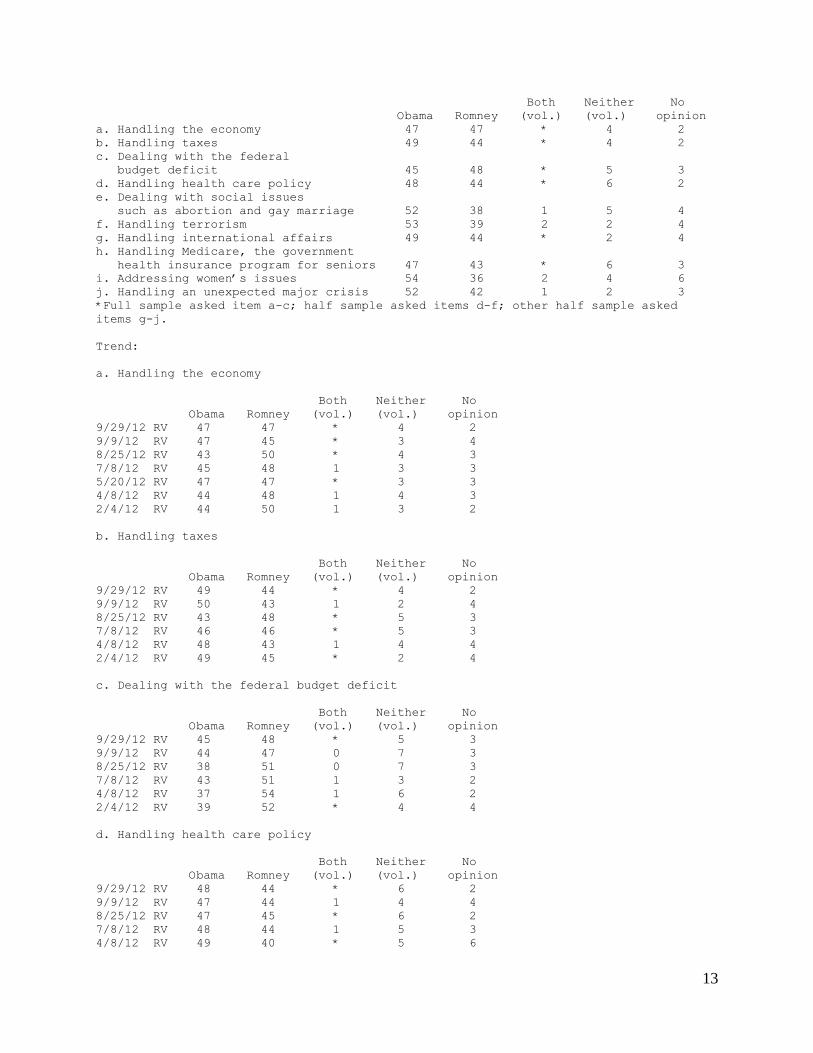
10. (ASKED OF REGISTERED VOTERS) Regardless of who you support, which candidate do you
trust to do a better job [ITEM] - (Obama) or (Romney)?
9/29/12 - Summary Table*
13
Both Neither No
Obama Romney (vol.) (vol.) opinion
a. Handling the economy 47 47 * 4 2
b. Handling taxes 49 44 * 4 2
c. Dealing with the federal
budget deficit 45 48 * 5 3
d. Handling health care policy 48 44 * 6 2
e. Dealing with social issues
such as abortion and gay marriage 52 38 1 5 4
f. Handling terrorism 53 39 2 2 4
g. Handling international affairs 49 44 * 2 4
h. Handling Medicare, the government
health insurance program for seniors 47 43 * 6 3
i. Addressing women’s issues 54 36 2 4 6
j. Handling an unexpected major crisis 52 42 1 2 3
*Full sample asked item a-c; half sample asked items d-f; other half sample asked
items g-j.
Trend:
a. Handling the economy
Both Neither No
Obama Romney (vol.) (vol.) opinion
9/29/12 RV 47 47 * 4 2
9/9/12 RV 47 45 * 3 4
8/25/12 RV 43 50 * 4 3
7/8/12 RV 45 48 1 3 3
5/20/12 RV 47 47 * 3 3
4/8/12 RV 44 48 1 4 3
2/4/12 RV 44 50 1 3 2
b. Handling taxes
Both Neither No
Obama Romney (vol.) (vol.) opinion
9/29/12 RV 49 44 * 4 2
9/9/12 RV 50 43 1 2 4
8/25/12 RV 43 48 * 5 3
7/8/12 RV 46 46 * 5 3
4/8/12 RV 48 43 1 4 4
2/4/12 RV 49 45 * 2 4
c. Dealing with the federal budget deficit
Both Neither No
Obama Romney (vol.) (vol.) opinion
9/29/12 RV 45 48 * 5 3
9/9/12 RV 44 47 0 7 3
8/25/12 RV 38 51 0 7 3
7/8/12 RV 43 51 1 3 2
4/8/12 RV 37 54 1 6 2
2/4/12 RV 39 52 * 4 4
d. Handling health care policy
Both Neither No
Obama Romney (vol.) (vol.) opinion
9/29/12 RV 48 44 * 6 2
9/9/12 RV 47 44 1 4 4
8/25/12 RV 47 45 * 6 2
7/8/12 RV 48 44 1 5 3
4/8/12 RV 49 40 * 5 6
14
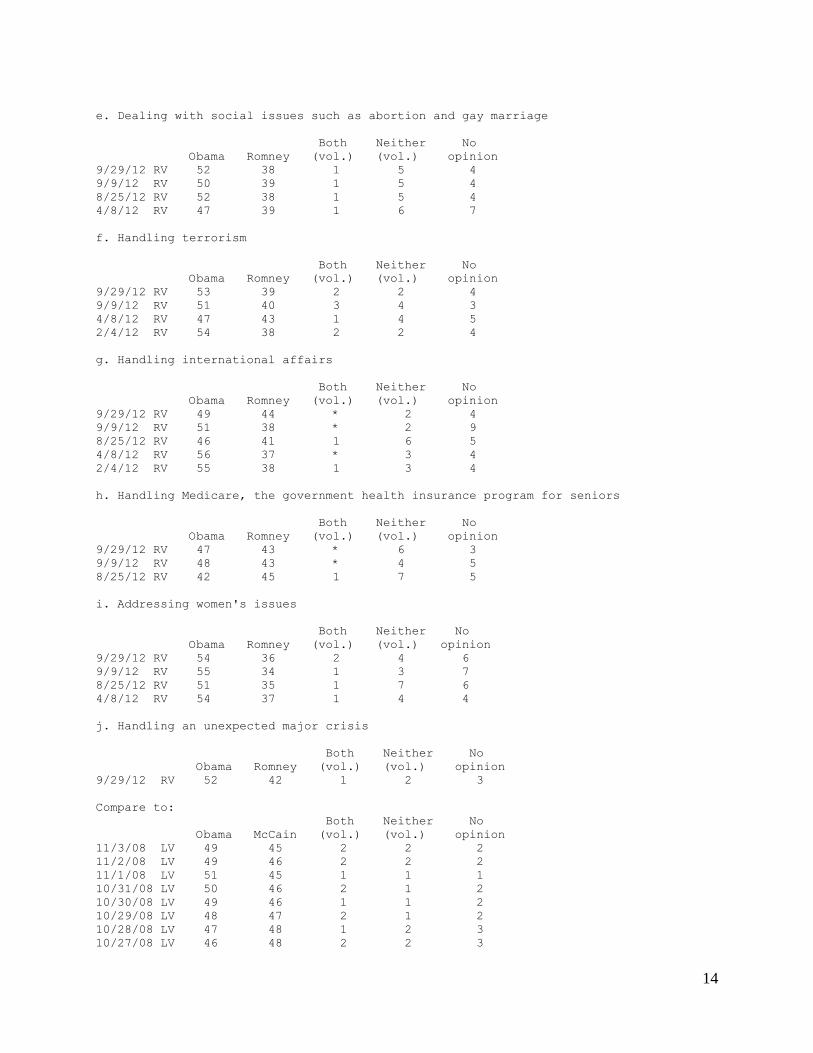
e. Dealing with social issues such as abortion and gay marriage
Both Neither No
Obama Romney (vol.) (vol.) opinion
9/29/12 RV 52 38 1 5 4
9/9/12 RV 50 39 1 5 4
8/25/12 RV 52 38 1 5 4
4/8/12 RV 47 39 1 6 7
f. Handling terrorism
Both Neither No
Obama Romney (vol.) (vol.) opinion
9/29/12 RV 53 39 2 2 4
9/9/12 RV 51 40 3 4 3
4/8/12 RV 47 43 1 4 5
2/4/12 RV 54 38 2 2 4
g. Handling international affairs
Both Neither No
Obama Romney (vol.) (vol.) opinion
9/29/12 RV 49 44 * 2 4
9/9/12 RV 51 38 * 2 9
8/25/12 RV 46 41 1 6 5
4/8/12 RV 56 37 * 3 4
2/4/12 RV 55 38 1 3 4
h. Handling Medicare, the government health insurance program for seniors
Both Neither No
Obama Romney (vol.) (vol.) opinion
9/29/12 RV 47 43 * 6 3
9/9/12 RV 48 43 * 4 5
8/25/12 RV 42 45 1 7 5
i. Addressing women's issues
Both Neither No
Obama Romney (vol.) (vol.) opinion
9/29/12 RV 54 36 2 4 6
9/9/12 RV 55 34 1 3 7
8/25/12 RV 51 35 1 7 6
4/8/12 RV 54 37 1 4 4
j. Handling an unexpected major crisis
Both Neither No
Obama Romney (vol.) (vol.) opinion
9/29/12 RV 52 42 1 2 3
Compare to:
Both Neither No
Obama McCain (vol.) (vol.) opinion
11/3/08 LV 49 45 2 2 2
11/2/08 LV 49 46 2 2 2
11/1/08 LV 51 45 1 1 1
10/31/08 LV 50 46 2 1 2
10/30/08 LV 49 46 1 1 2
10/29/08 LV 48 47 2 1 2
10/28/08 LV 47 48 1 2 3
10/27/08 LV 46 48 2 2 3
15
10/19/08 LV 49 45 1 2 2
10/11/08 LV 52 43 1 3 1
9/29/08 RV 44 50 1 2 3
9/22/08 RV 46 47 2 2 3
9/7/08 RV 37 54 2 3 3
8/22/08 RV 41 52 2 2 3
7/13/08 RV 42 51 3 2 3
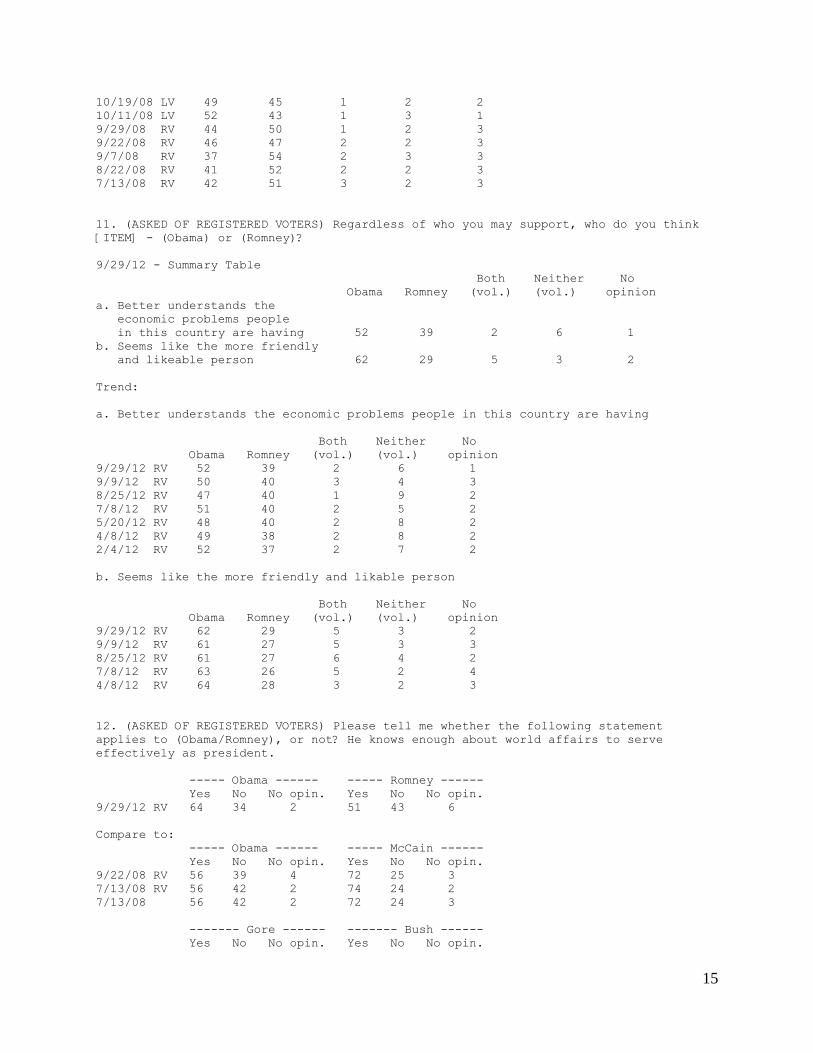
11. (ASKED OF REGISTERED VOTERS) Regardless of who you may support, who do you think
[ITEM] - (Obama) or (Romney)?
9/29/12 - Summary Table
Both Neither No
Obama Romney (vol.) (vol.) opinion
a. Better understands the
economic problems people
in this country are having 52 39 2 6 1
b. Seems like the more friendly
and likeable person 62 29 5 3 2
Trend:
a. Better understands the economic problems people in this country are having
Both Neither No
Obama Romney (vol.) (vol.) opinion
9/29/12 RV 52 39 2 6 1
9/9/12 RV 50 40 3 4 3
8/25/12 RV 47 40 1 9 2
7/8/12 RV 51 40 2 5 2
5/20/12 RV 48 40 2 8 2
4/8/12 RV 49 38 2 8 2
2/4/12 RV 52 37 2 7 2
b. Seems like the more friendly and likable person
Both Neither No
Obama Romney (vol.) (vol.) opinion
9/29/12 RV 62 29 5 3 2
9/9/12 RV 61 27 5 3 3
8/25/12 RV 61 27 6 4 2
7/8/12 RV 63 26 5 2 4
4/8/12 RV 64 28 3 2 3
12. (ASKED OF REGISTERED VOTERS) Please tell me whether the following statement
applies to (Obama/Romney), or not? He knows enough about world affairs to serve
effectively as president.
----- Obama ------ ----- Romney ------
Yes No No opin. Yes No No opin.
9/29/12 RV 64 34 2 51 43 6
Compare to:
----- Obama ------ ----- McCain ------
Yes No No opin. Yes No No opin.
9/22/08 RV 56 39 4 72 25 3
7/13/08 RV 56 42 2 74 24 2
7/13/08 56 42 2 72 24 3
------- Gore ------ ------- Bush ------
Yes No No opin. Yes No No opin.
16
9/6/00 RV 73 25 2 54 40 6
7/23/00 RV 67 29 4 52 42 5
7/23/00 66 29 5 52 42 6
4/2/00 71 23 6 57 36 7
2/27/00 70 25 5 55 39 6
2/6/00 69 26 5 52 42 6
1/16/00 65 28 8 49 40 10
12/15/99 68 27 6 54 38 8
11/14/99 NA NA NA 59 36 6
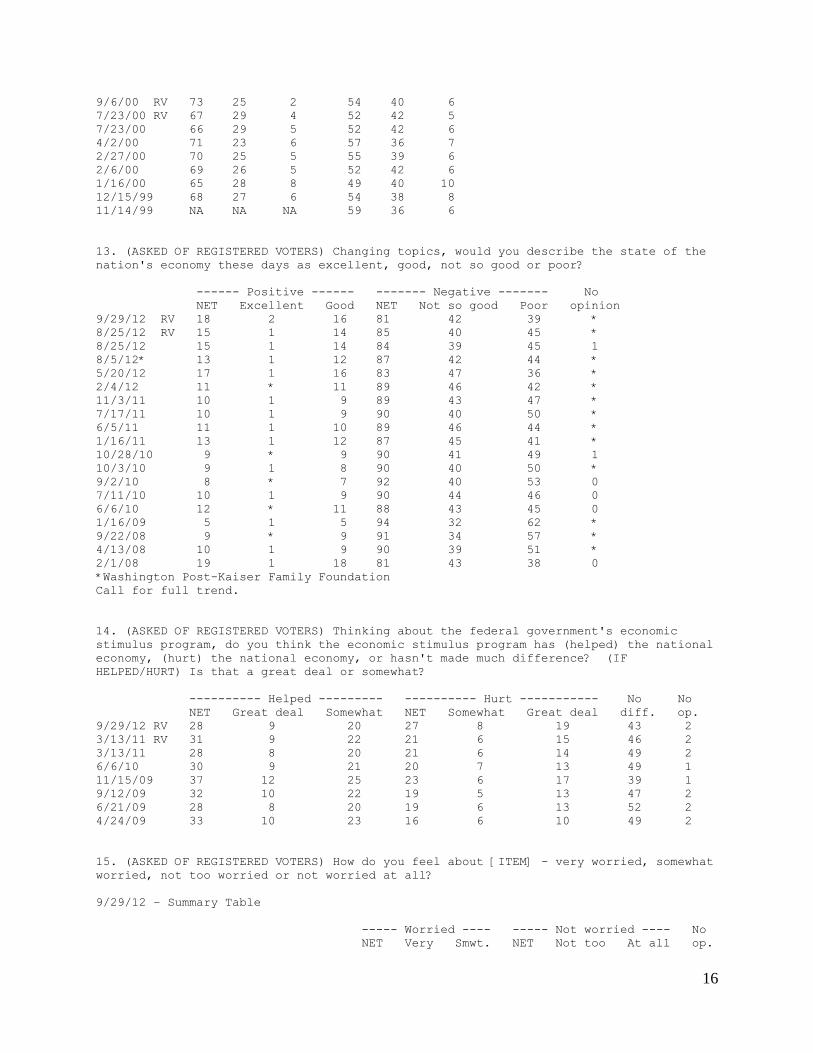
13. (ASKED OF REGISTERED VOTERS) Changing topics, would you describe the state of the
nation's economy these days as excellent, good, not so good or poor?
------ Positive ------ ------- Negative ------- No
NET Excellent Good NET Not so good Poor opinion
9/29/12 RV 18 2 16 81 42 39 *
8/25/12 RV 15 1 14 85 40 45 *
8/25/12 15 1 14 84 39 45 1
8/5/12* 13 1 12 87 42 44 *
5/20/12 17 1 16 83 47 36 *
2/4/12 11 * 11 89 46 42 *
11/3/11 10 1 9 89 43 47 *
7/17/11 10 1 9 90 40 50 *
6/5/11 11 1 10 89 46 44 *
1/16/11 13 1 12 87 45 41 *
10/28/10 9 * 9 90 41 49 1
10/3/10 9 1 8 90 40 50 *
9/2/10 8 * 7 92 40 53 0
7/11/10 10 1 9 90 44 46 0
6/6/10 12 * 11 88 43 45 0
1/16/09 5 1 5 94 32 62 *
9/22/08 9 * 9 91 34 57 *
4/13/08 10 1 9 90 39 51 *
2/1/08 19 1 18 81 43 38 0
*Washington Post-Kaiser Family Foundation
Call for full trend.
14. (ASKED OF REGISTERED VOTERS) Thinking about the federal government's economic
stimulus program, do you think the economic stimulus program has (helped) the national
economy, (hurt) the national economy, or hasn't made much difference? (IF
HELPED/HURT) Is that a great deal or somewhat?
---------- Helped --------- ---------- Hurt ----------- No No
NET Great deal Somewhat NET Somewhat Great deal diff. op.
9/29/12 RV 28 9 20 27 8 19 43 2
3/13/11 RV 31 9 22 21 6 15 46 2
3/13/11 28 8 20 21 6 14 49 2
6/6/10 30 9 21 20 7 13 49 1
11/15/09 37 12 25 23 6 17 39 1
9/12/09 32 10 22 19 5 13 47 2
6/21/09 28 8 20 19 6 13 52 2
4/24/09 33 10 23 16 6 10 49 2
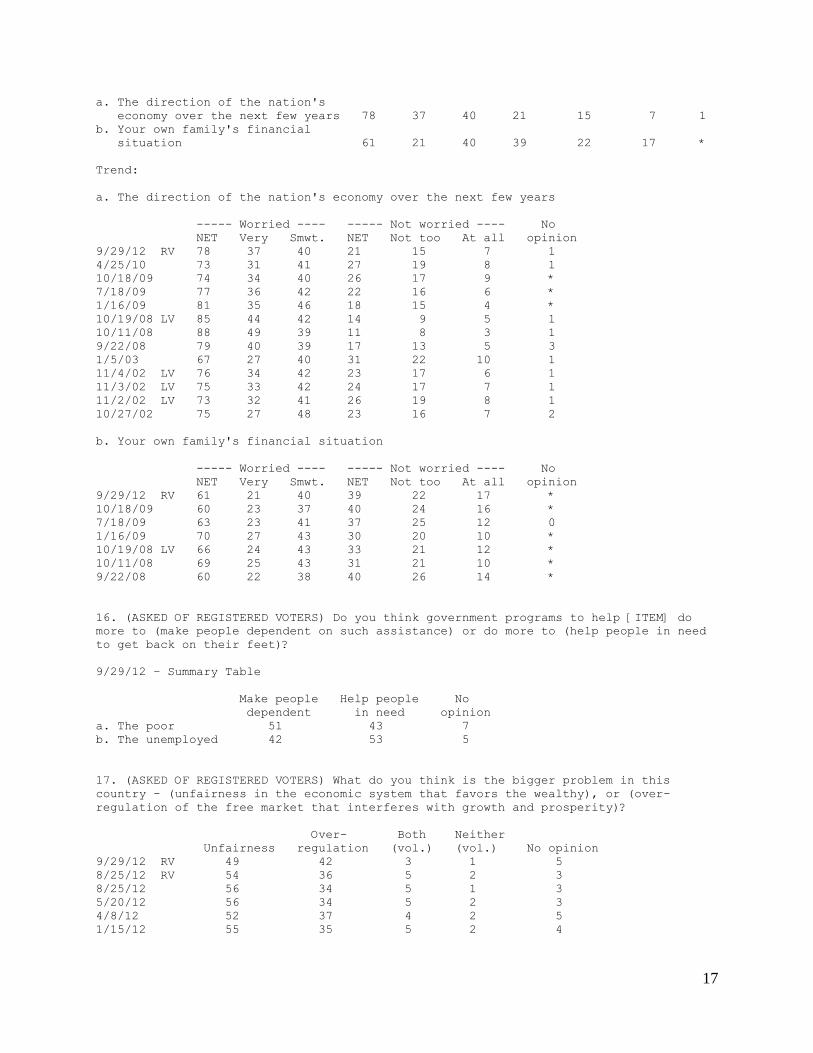
15. (ASKED OF REGISTERED VOTERS) How do you feel about [ITEM] - very worried, somewhat
worried, not too worried or not worried at all?
9/29/12 – Summary Table
----- Worried ---- ----- Not worried ---- No
NET Very Smwt. NET Not too At all op.
17
a. The direction of the nation's
economy over the next few years 78 37 40 21 15 7 1
b. Your own family's financial
situation 61 21 40 39 22 17 *
Trend:
a. The direction of the nation's economy over the next few years
----- Worried ---- ----- Not worried ---- No
NET Very Smwt. NET Not too At all opinion
9/29/12 RV 78 37 40 21 15 7 1
4/25/10 73 31 41 27 19 8 1
10/18/09 74 34 40 26 17 9 *
7/18/09 77 36 42 22 16 6 *
1/16/09 81 35 46 18 15 4 *
10/19/08 LV 85 44 42 14 9 5 1
10/11/08 88 49 39 11 8 3 1
9/22/08 79 40 39 17 13 5 3
1/5/03 67 27 40 31 22 10 1
11/4/02 LV 76 34 42 23 17 6 1
11/3/02 LV 75 33 42 24 17 7 1
11/2/02 LV 73 32 41 26 19 8 1
10/27/02 75 27 48 23 16 7 2
b. Your own family's financial situation
----- Worried ---- ----- Not worried ---- No
NET Very Smwt. NET Not too At all opinion
9/29/12 RV 61 21 40 39 22 17 *
10/18/09 60 23 37 40 24 16 *
7/18/09 63 23 41 37 25 12 0
1/16/09 70 27 43 30 20 10 *
10/19/08 LV 66 24 43 33 21 12 *
10/11/08 69 25 43 31 21 10 *
9/22/08 60 22 38 40 26 14 *
16. (ASKED OF REGISTERED VOTERS) Do you think government programs to help [ITEM] do
more to (make people dependent on such assistance) or do more to (help people in need
to get back on their feet)?
9/29/12 – Summary Table
Make people Help people No
dependent in need opinion
a. The poor 51 43 7
b. The unemployed 42 53 5
17. (ASKED OF REGISTERED VOTERS) What do you think is the bigger problem in this
country - (unfairness in the economic system that favors the wealthy), or (over-
regulation of the free market that interferes with growth and prosperity)?
Over- Both Neither
Unfairness regulation (vol.) (vol.) No opinion
9/29/12 RV 49 42 3 1 5
8/25/12 RV 54 36 5 2 3
8/25/12 56 34 5 1 3
5/20/12 56 34 5 2 3
4/8/12 52 37 4 2 5
1/15/12 55 35 5 2 4
18
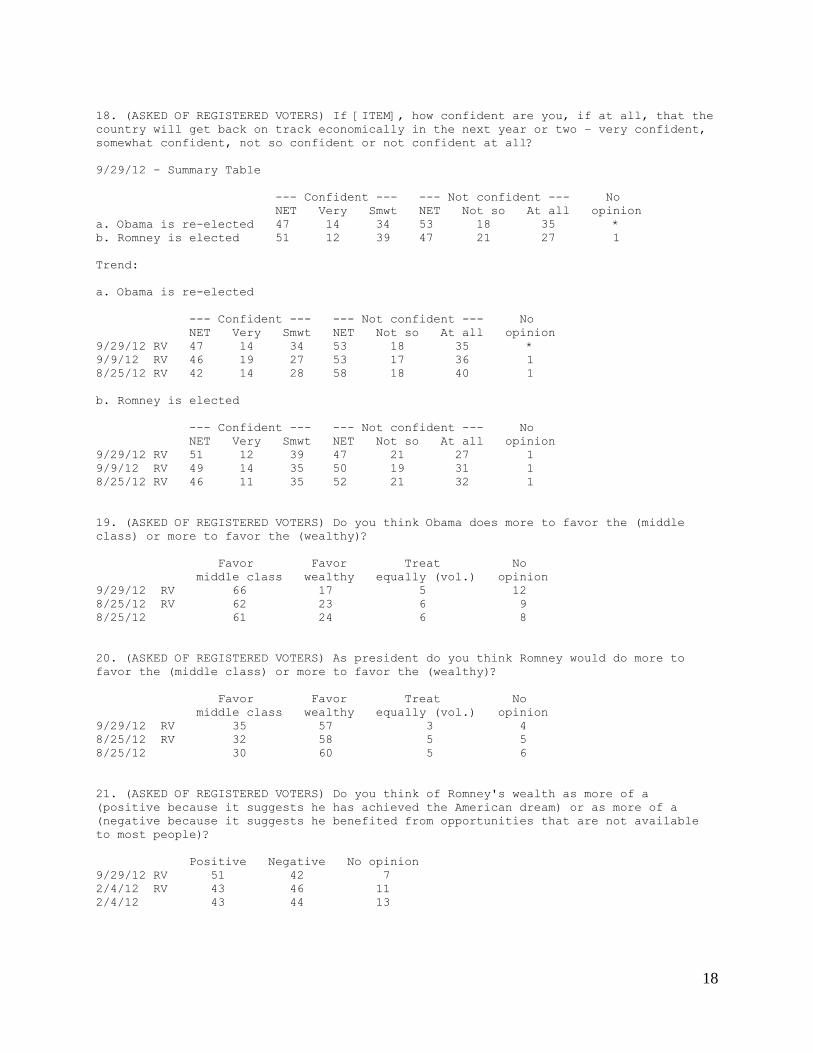
18. (ASKED OF REGISTERED VOTERS) If [ITEM], how confident are you, if at all, that the
country will get back on track economically in the next year or two – very confident,
somewhat confident, not so confident or not confident at all?
9/29/12 - Summary Table
--- Confident --- --- Not confident --- No
NET Very Smwt NET Not so At all opinion
a. Obama is re-elected 47 14 34 53 18 35 *
b. Romney is elected 51 12 39 47 21 27 1
Trend:
a. Obama is re-elected
--- Confident --- --- Not confident --- No
NET Very Smwt NET Not so At all opinion
9/29/12 RV 47 14 34 53 18 35 *
9/9/12 RV 46 19 27 53 17 36 1
8/25/12 RV 42 14 28 58 18 40 1
b. Romney is elected
--- Confident --- --- Not confident --- No
NET Very Smwt NET Not so At all opinion
9/29/12 RV 51 12 39 47 21 27 1
9/9/12 RV 49 14 35 50 19 31 1
8/25/12 RV 46 11 35 52 21 32 1
19. (ASKED OF REGISTERED VOTERS) Do you think Obama does more to favor the (middle
class) or more to favor the (wealthy)?
Favor Favor Treat No
middle class wealthy equally (vol.) opinion
9/29/12 RV 66 17 5 12
8/25/12 RV 62 23 6 9
8/25/12 61 24 6 8
20. (ASKED OF REGISTERED VOTERS) As president do you think Romney would do more to
favor the (middle class) or more to favor the (wealthy)?
Favor Favor Treat No
middle class wealthy equally (vol.) opinion
9/29/12 RV 35 57 3 4
8/25/12 RV 32 58 5 5
8/25/12 30 60 5 6
21. (ASKED OF REGISTERED VOTERS) Do you think of Romney's wealth as more of a
(positive because it suggests he has achieved the American dream) or as more of a
(negative because it suggests he benefited from opportunities that are not available
to most people)?
Positive Negative No opinion
9/29/12 RV 51 42 7
2/4/12 RV 43 46 11
2/4/12 43 44 13
19
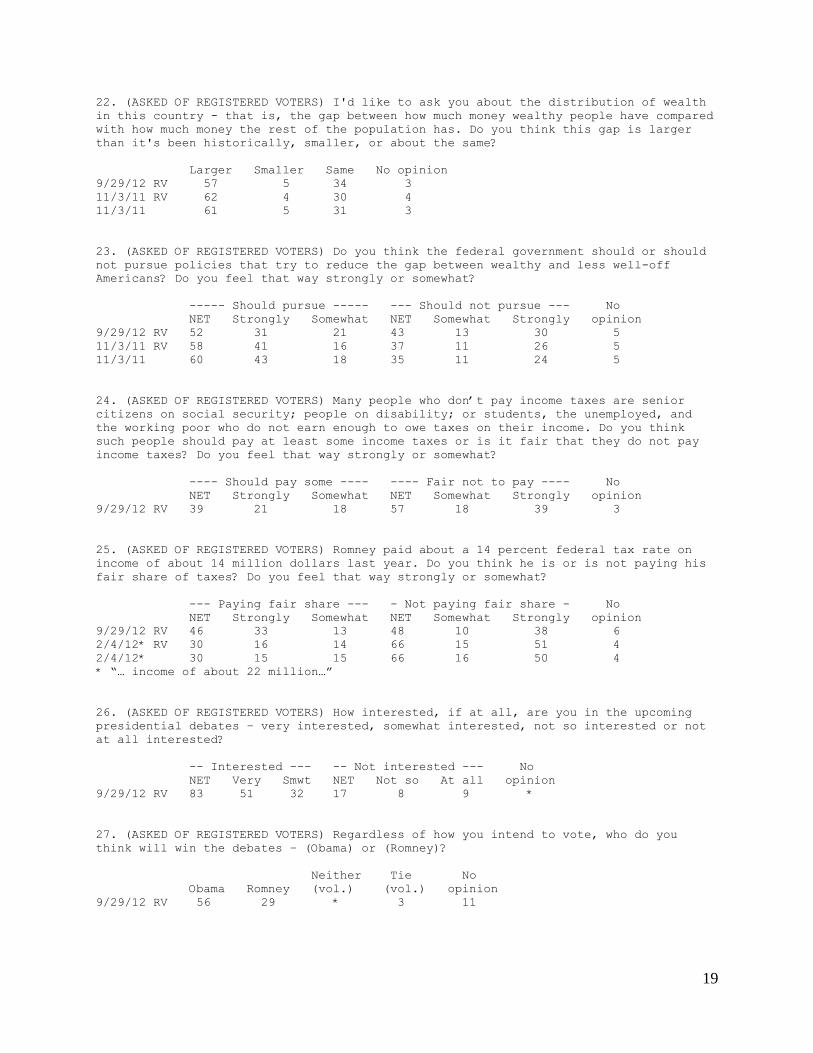
22. (ASKED OF REGISTERED VOTERS) I'd like to ask you about the distribution of wealth
in this country - that is, the gap between how much money wealthy people have compared
with how much money the rest of the population has. Do you think this gap is larger
than it's been historically, smaller, or about the same?
Larger Smaller Same No opinion
9/29/12 RV 57 5 34 3
11/3/11 RV 62 4 30 4
11/3/11 61 5 31 3
23. (ASKED OF REGISTERED VOTERS) Do you think the federal government should or should
not pursue policies that try to reduce the gap between wealthy and less well-off
Americans? Do you feel that way strongly or somewhat?
----- Should pursue ----- --- Should not pursue --- No
NET Strongly Somewhat NET Somewhat Strongly opinion
9/29/12 RV 52 31 21 43 13 30 5
11/3/11 RV 58 41 16 37 11 26 5
11/3/11 60 43 18 35 11 24 5
24. (ASKED OF REGISTERED VOTERS) Many people who don’t pay income taxes are senior
citizens on social security; people on disability; or students, the unemployed, and
the working poor who do not earn enough to owe taxes on their income. Do you think
such people should pay at least some income taxes or is it fair that they do not pay
income taxes? Do you feel that way strongly or somewhat?
---- Should pay some ---- ---- Fair not to pay ---- No
NET Strongly Somewhat NET Somewhat Strongly opinion
9/29/12 RV 39 21 18 57 18 39 3
25. (ASKED OF REGISTERED VOTERS) Romney paid about a 14 percent federal tax rate on
income of about 14 million dollars last year. Do you think he is or is not paying his
fair share of taxes? Do you feel that way strongly or somewhat?
--- Paying fair share --- - Not paying fair share - No
NET Strongly Somewhat NET Somewhat Strongly opinion
9/29/12 RV 46 33 13 48 10 38 6
2/4/12* RV 30 16 14 66 15 51 4
2/4/12* 30 15 15 66 16 50 4
* “… income of about 22 million…”
26. (ASKED OF REGISTERED VOTERS) How interested, if at all, are you in the upcoming
presidential debates – very interested, somewhat interested, not so interested or not
at all interested?
-- Interested --- -- Not interested --- No
NET Very Smwt NET Not so At all opinion
9/29/12 RV 83 51 32 17 8 9 *
27. (ASKED OF REGISTERED VOTERS) Regardless of how you intend to vote, who do you
think will win the debates – (Obama) or (Romney)?
Neither Tie No
Obama Romney (vol.) (vol.) opinion
9/29/12 RV 56 29 * 3 11
20
28. (ASKED OF REGISTERED VOTERS) Have you personally been contacted by a
representative of the [CANDIDATE] campaign, either by phone, in-person, or online
asking you for your support, or not?
9/29/12 - Summary Table
Yes No No opinion
a. Obama 23 76 1
b. Romney 20 79 1
Trend:
a. Obama
Yes No No opinion
9/29/12 RV 23 76 1
8/25/12 RV 20 79 1
8/25/12 18 81 1
b. Romney
Yes No No opinion
9/29/12 RV 20 79 1
8/25/12 RV 13 86 *
8/25/12 11 88 *
Compare to:
Have you personally been contacted by a representative of the [CANDIDATE] campaign,
either by phone or in-person, asking you for your support, or not?
Yes No No opinion
10/22/08 Obama LV 21 78 1
10/22/08 McCain LV 14 85 1
9/26/04 Bush LV 18 82 *
9/26/04 Kerry LV 17 82 1
29. (IF CONTACTED BY OBAMA CAMPAIGN) When was the last time you were contacted, within
the last week, within the last month or longer ago than that?
Within last Within last Longer No
week month ago opinion
9/29/12 RV 53 34 10 3
28/29 NET:
---------------- Yes ---------------- Not No
NET Last week Last month Longer contacted opinion
9/29/12 RV 23 12 8 2 76 1
30. (IF CONTACTED BY ROMNEY CAMPAIGN) When was the last time you were contacted,
within the last week, within the last month or longer ago than that?
Within last Within last Longer No
week month ago opinion
9/29/12 RV 55 34 9 1
28/30 NET:
---------------- Yes ---------------- Not No
NET Last week Last month Longer contacted opinion
9/29/12 RV 20 11 7 2 79 1
31. (ASKED OF REGISTERED VOTERS) Just your best guess, who do you think will win the
presidential election this year - (Obama) or (Romney)?
21
Other No
Obama Romney (vol.) opinion
9/29/12 RV 63 31 * 6
8/25/12 RV 56 37 * 8
8/25/12 59 34 * 7
7/8/12 58 34 1 8
Compare to: Just your best guess, who do you think will win the presidential election
this year - (Obama) or (the Republican candidate)?
Obama Rep. candidate No opinion
3/10/12 54 40 6
1/15/12 46 49 5
12/18/11 46 49 5
10/2/11 37 55 8
32. (ASKED OF REGISTERED VOTERS) On a ship in a storm, who would you rather have as
the captain, (Obama) or (Romney)?*
Both Neither No
Obama Romney (vol.) (vol.) opinion
9/29/12 RV 52 40 1 6 1
9/9/12 RV 46 43 * 7 4
*Half sample asked Q32-34; other half sample asked Q35-37.
33. (ASKED OF REGISTERED VOTERS) Who would you rather invite to dinner at your home,
(Obama) or (Romney)?
Both Neither No
Obama Romney (vol.) (vol.) opinion
9/29/12 RV 54 32 6 7 1
9/9/12 RV 52 33 7 6 2
34. (ASKED OF REGISTERED VOTERS) Who would you rather go on an overnight camping trip
with, (Obama) or (Romney)?
Both Neither No
Obama Romney (vol.) (vol.) opinion
9/29/12 RV 48 34 4 12 2
35. (ASKED OF REGISTERED VOTERS) Who would you rather have babysit your children,
(Obama) or (Romney)?
Both Neither No
Obama Romney (vol.) (vol.) opinion
9/29/12 RV 41 41 3 13 2
36. (ASKED OF REGISTERED VOTERS) Whose music playlist would you rather listen to,
(Obama)’s or (Romney)’s?
Both Neither No
Obama Romney (vol.) (vol.) opinion
9/29/12 RV 46 30 1 9 14
37. (ASKED OF REGISTERED VOTERS) Who would you rather see as a contestant on Dancing
with the Stars, (Obama) or (Romney)?

22
Both Neither No
Obama Romney (vol.) (vol.) opinion
9/29/12 RV 51 26 4 11 8
*** END ***