Embed Size (px)
Citation preview
PROJECT DESIGN DOCUMENT FORM (CDM PDD) - Version 03.1. CDM – Executive Board page 1
CLEAN DEVELOPMENT MECHANISM PROJECT DESIGN DOCUMENT FORM (CDM-PDD)
Version 03 - in effect as of: 28 July 2006
CONTENTS A. General description of project activity B. Application of a baseline and monitoring methodology C. Duration of the project activity / crediting period D. Environmental impacts E. Stakeholders’ comments
Annexes
Annex 1: Contact information on participants in the project activity Annex 2: Information regarding public funding Annex 3: Baseline information A: Flaring Policy and Regulation in Nigeria B: Legal Opinion regarding High Court Ruling on Flaring in Benin Judicial District C: Gas Composition and Carbon Content
Annex 4: Monitoring plan A: Description of Monitoring Plan B: Project Schematic with Monitoring Points C. Operating and Training Procedures for the Facility Annex 5: Additional Information A: Environmental Impact Assessment B: Letter of Support from Local Community
C: Letter of Approval from Designated National Authority D: Project economics

PROJECT DESIGN DOCUMENT FORM (CDM PDD) - Version 03.1. CDM – Executive Board page 2
SECTION A. General description of project activity A.1 Title of the project activity: >> Pan Ocean Gas Utilization Project Version 05 16 June 2008 A.2. Description of the project activity: >> The purpose of the project is to eliminate gas flaring at the Ovade-Ogharefe oil field operated by Pan Ocean Oil Corporation (Nigeria) in a Joint Venture Partnership with Nigerian National Petroleum Corporation (NNPC). The project activity will capture and process associated natural gas that is currently and in the future would be flared. The amount of flared gas will increase in the future due to the further development of the oil field. Absent this project activity, all the associated gas would continue to be flared at the oil field flow station. Under this project activity, the treated gas will be injected into an existing gas transmission line for sale to an Independent Power Plant (IPP) while the extracted NGLs will be transported and sold into the national and international market. The project activity will reduce flaring by approximately 98% at the Ovade-Ogharefe field thereby contributing substantially to the reduction of GHG emissions in Nigeria and improving the local environment for the nearby community. While this project PDD was under validation, the oil production from the field was halted due to terrorist activities that closed the Shell Pipeline Transport system in Delta State, by which the oil from this field is taken to market. The field was therefore closed from February 2006 to February 2008. As this is the only field that is operated by Pan Ocean Oil Corporation under the “Nigerian National Petroleum Corporation - Pan Ocean Oil Corporation (Nigeria) Joint Venture”, this has caused substantial financial hardship, and therefore the project implementation has been slowed and its execution timing altered – albeit the project concept and design remain the same. The project is now estimated to become operational at end-2009. The project contributes to the sustainable development of Nigeria through the reduction of flaring, thereby reducing local air pollution and other environmental impacts associated with the combustion of natural gas. Apart from the significant reduction in CO2 emissions, the project will also result in lower emissions of NOx, VOCs, and particulates. The project implementation will further generated jobs in the construction. Once in operation, the additions to skilled staff will be between 35-45 positions and about 150 unskilled positions. These jobs will continue over the estimated twenty years of the project. Given the scale of gas flaring in Nigeria (estimated by the World Bank to flare the second largest amount of gas in the world) this will serve as an important step in using CDM to address this crucial climate issue. Further as Pan Ocean is a Nigerian owned and run company, it signifies the ability of local Nigerian companies and the society to participate in CDM and the Kyoto Protocol. In addition the gas captured in this project is used for electrical generation in the region and thus supports the economic sustainability and growth of the country.
PROJECT DESIGN DOCUMENT FORM (CDM PDD) - Version 03.1. CDM – Executive Board page 3 A.3. Project participants: >> The project developer is the Nigerian National Petroleum Corporation (NNPC) - Pan Ocean Oil Corporation (Nigeria) Joint Venture (hereafter the Joint Venture). The Joint Venture is the legal entity that has the right to produce the oil and natural gas from the OML-98 concession block and owns the required facilities, including the project activity in this PDD. The Joint Venture is owned 60% by Nigerian National Petroleum Corporation (hereafter) NNPC and 40% by Pan Ocean Oil Corporation Nigeria (hereafter Pan Ocean). The project developer is referred to as Pan Ocean Co-Operation, by which Pan Ocean serves as operator for the Joint Venture. Host Parties Involved Private and/or Public Entities
(Project Participants) Does the Party Involved Wish to be Considered as a Project Participant
Federal Republic of Nigeria • Nigerian National Petroleum Corporation - Pan Ocean Oil Corporation (Nigeria) Joint Venture*
No
Norway • Carbon Limits AS No . * Also known as Pan Ocean Co-Operation for the purpose of this project activity
There is no Annex 1 partner in the project. The carbon credits produced will be sold to an Annex 1 country. Pan Ocean Co-Operation will seek a buyer for the credits once the PDD is advanced in registration. Pan Ocean Co-operation, on behalf of the Joint Venture, asserts the Joint Venture’s rights to any certified emission reductions produced by this project activity. Carbon Limits is responsible for the preparation of the PDD documentation. A.4. Technical description of the project activity: A.4.1. Location of the project activity: A.4.1.1. Host Party(ies): >> The Host Party is the Federal Republic of Nigeria. A.4.1.2. Region/State/Province etc.: >> The project is located in the north part of Delta State, Nigeria. A.4.1.3. City/Town/Community etc: >> The field is located in the area of the Ovade-Ogharefe community
PROJECT DESIGN DOCUMENT FORM (CDM PDD) - Version 03.1. CDM – Executive Board page 4 A.4.1.4. Detail of physical location, including information allowing the unique identification of this project activity (maximum one page):
The project is located in the OML-98 concession area.
Figure 1: Location Map of OML 98 Area
A.4.2. Category(ies) of project activity: >> Sectoral scope 10: Fugitive emissions from fuels (solid, oil, gas).
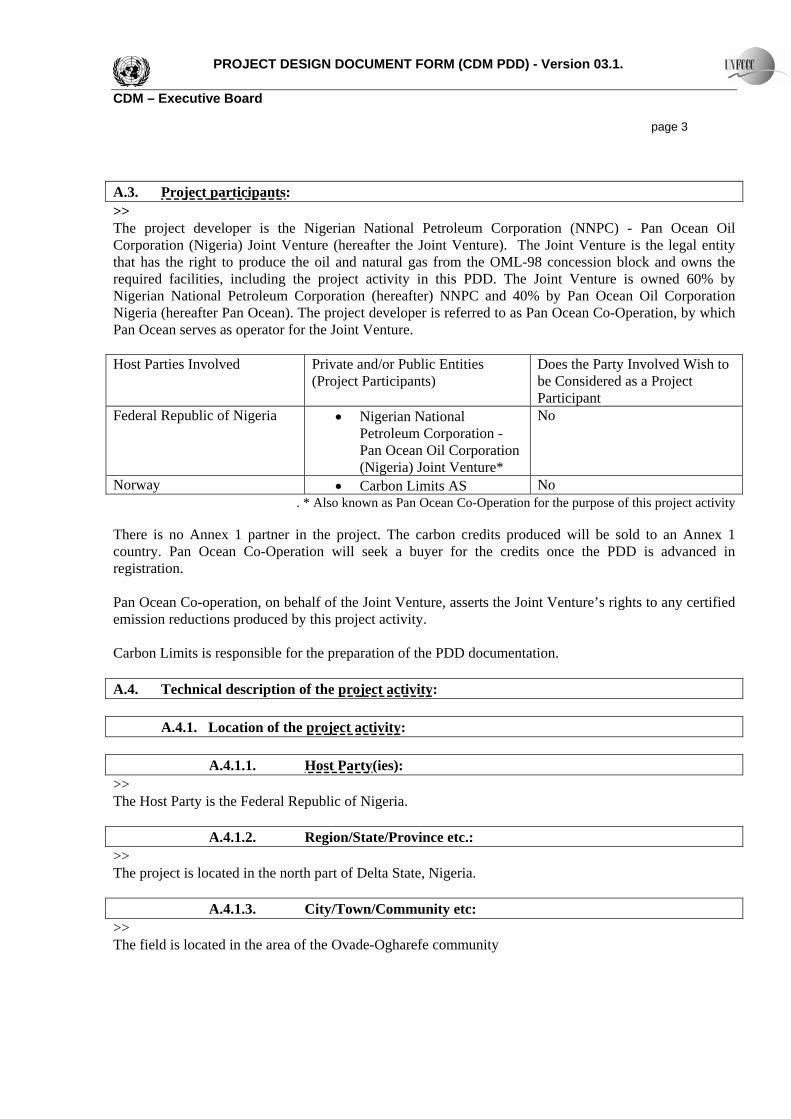
PROJECT DESIGN DOCUMENT FORM (CDM PDD) - Version 03.1. CDM – Executive Board page 5 A.4.3. Technology to be employed by the project activity: >> The CDM project activity is the capture, process, and sale1 of the associated natural gas that is currently flared at the site. This flared gas is untreated (wet) and contains NGLs and condensates as well as methane. Currently, when under operation, 75 million standard cubic feet per day (mmscfd) of gas is flared at the Ovade-Ogharefe field, and with the further development of the oil field, the volume is scheduled to increase to at least 130 mmscfd by 2009/10. The oil with the solution associated gas is produced at the wells and transported by gathering pipelines to a central flow station. At the flow station, the associated gas is separated from the oil and flared, and the oil is then shipped by pipeline to market. The project activity was originally designed as the integrated construction of a gas processing plant (GPP) to treat this associated gas and the related compression facilities to transport the lean gas to the existing gas grid (owned by Nigerian Gas Company, NGC) and the be implemented in one phase. However the political instability in the Niger Delta, which prevented the oil from being produced for two years, has required changes in the execution, but not the design, of the project. The execution of the project activity is now being done in two phases – Phase 1, the treatment and compression facilities to send the gas to market and Phase 2, the NGL fractionation plant to extract the LPGs. Phase 2 has the ability to be expanded as the ability to market LPGs improves. This two phase execution allows for minimizing costs and assuring that the gas flare-out can be done in the least time. The two phases overlap and are conceptually and practically the same as the original design. Phase 1, the most crucial for ending the flaring, is the installation of three-stage compression and treatment (consisting of dehydration, refrigeration) facility such that the gas can be used as fuel in an Independent Power Plant (IPP) now being constructed at Ihovbov (formerly Egean). The developer will construct a pipeline to transport the gas approximately 1 km, where it will be injected into an existing Nigerian National Gas Company Pipeline where it will be transported approximately 35 km to the IPP. The schematic in Figure 2 shows the design of the compression and treatment facilities. Figure 2 Ovade-Ogharefe Compression and Treatment Facility Design
LP Compression
IPCompression
HPCompression
TreatingFacility
SalesCompression
Existing Oil Facility
1 The ability to reinjection gas and LPG, on an emergency basis, is included as part of the project design to allow for temporary storage. This is due to prevent the flaring of these products in case of terrorism or other exogenous events outside the control of the project developer.
PROJECT DESIGN DOCUMENT FORM (CDM PDD) - Version 03.1. CDM – Executive Board page 6 The compression facilities will have the following design: Feed Rate (Design): 135 mmscfd Compression:
• LP – 18 psi to 200 psi (Reciprocating compressors) • IP – 150 psi to 500 psi • HP – 450 psi to 1200 psi • Sales Gas – 450 psi to 1300 psi
Treatment Facilities:
• Dehydration (mol sieve) – 7 lb water / mmscf • JT Unit / Refrigeration – 50 F Dew point vs. 85% C1 mol • NGL Stabilisation (12 RVP max)
Phase 2, the construction of the gas processing plant (GPP), is also in execution and the first component will likely be operational approximately six months after the compression facilities. The GPP is designed to be expanded as the ability to market LPGs improves. Initially 400 bbls per day are expected to be extracted. When fully implemented, the GPP will consist of a two train design for processing 130 mmcfpd. The principal components of the overall GPP will be a conditioning system, a compression system, a liquid extraction system, a fractionation system, and storage and dispatch facilities. The GPP will be built adjacent to the existing oil flow station at the same location as the facilities installed for Phase 1. All the facilities will be connected by seamless pipes of no more than a few hundred meters. A liquids connection of the same length will be constructed to transport the condensates extracted from the gas stream back to the oil storage at the flow station.2 The LPG (butane and propane) will be sold at the GPP gate. A third party will construct transport, storage and loading facilities to move these liquids to the coast and thence to market (either in Nigeria or international). A limited amount will be sold in the local market. This onward transport and sale to the LPGs is outside the boundary of the project. Given the security situation in the Delta and the logistical and marketing barriers related to LPG, the third party has had to reconsider the implementation of LPG distribution and marketing. Where previously, the third party had intended to build an LPG line to a port on the coast (approximately 90 km) the security situation now makes that unfeasible. Instead the third party intends build an LPG line to a nearby river port, market a portion of the LPG locally, and ship the remainder out by boat on the river.3 This is an
2 This pipeline connecting the GPP and the NGC pipeline could be built by a state company, but this is a minor part of the infrastructure. The contract is currently under negotiation. 3 In the early stages of implementation of the GPP, the first option will be to market the LPGs to the local market directly by truck and the incremental volumes will be transported downriver.
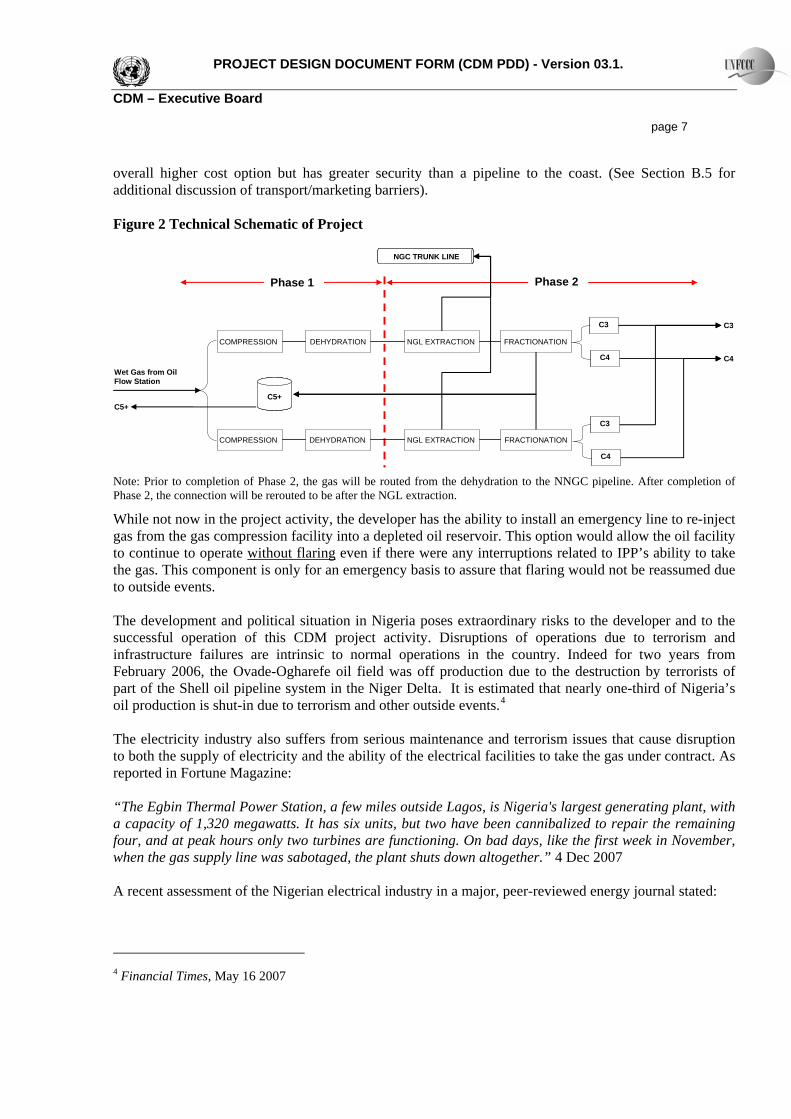
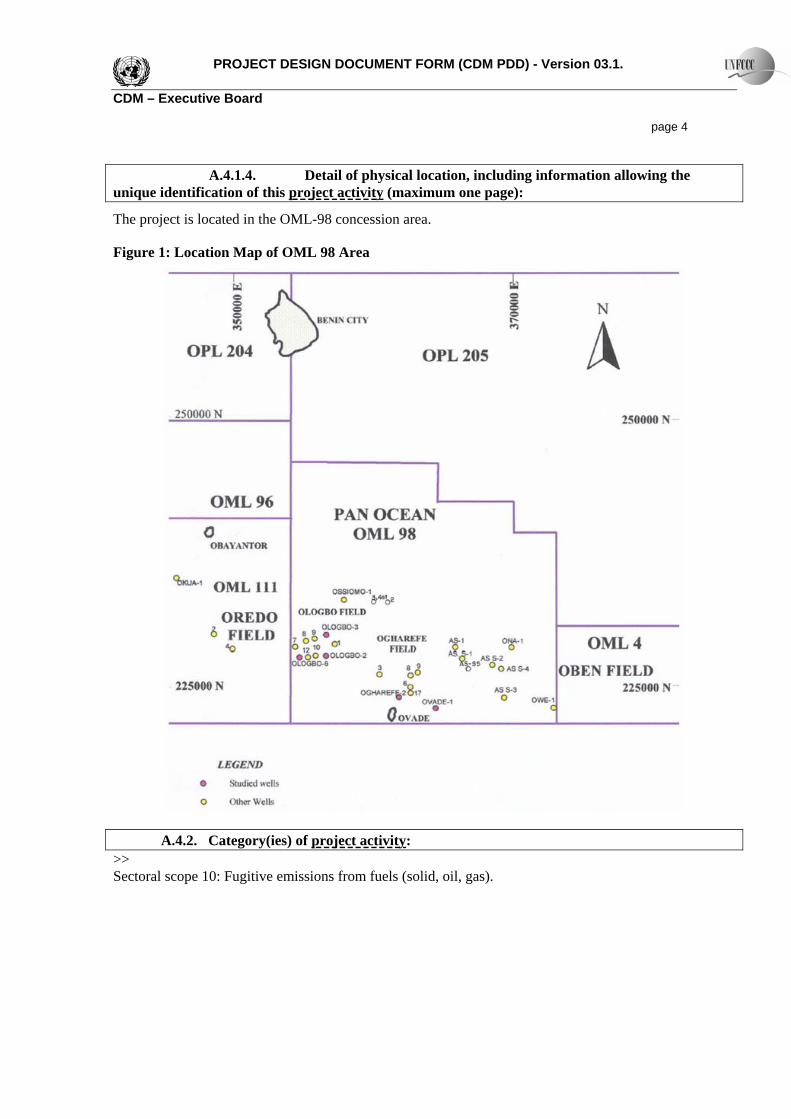
PROJECT DESIGN DOCUMENT FORM (CDM PDD) - Version 03.1. CDM – Executive Board page 7 overall higher cost option but has greater security than a pipeline to the coast. (See Section B.5 for additional discussion of transport/marketing barriers). Figure 2 Technical Schematic of Project
C3
C4
Wet Gas from Oil Flow Station
COMPRESSION DEHYDRATION NGL EXTRACTION
NGL EXTRACTIONCOMPRESSION DEHYDRATION
FRACTIONATION
FRACTIONATION
C5+
C3
C4
C3
C4
NGC TRUNK LINE
C5+
Phase 1 Phase 2
Note: Prior to completion of Phase 2, the gas will be routed from the dehydration to the NNGC pipeline. After completion of Phase 2, the connection will be rerouted to be after the NGL extraction.
While not now in the project activity, the developer has the ability to install an emergency line to re-inject gas from the gas compression facility into a depleted oil reservoir. This option would allow the oil facility to continue to operate without flaring even if there were any interruptions related to IPP’s ability to take the gas. This component is only for an emergency basis to assure that flaring would not be reassumed due to outside events. The development and political situation in Nigeria poses extraordinary risks to the developer and to the successful operation of this CDM project activity. Disruptions of operations due to terrorism and infrastructure failures are intrinsic to normal operations in the country. Indeed for two years from February 2006, the Ovade-Ogharefe oil field was off production due to the destruction by terrorists of part of the Shell oil pipeline system in the Niger Delta. It is estimated that nearly one-third of Nigeria’s oil production is shut-in due to terrorism and other outside events.4 The electricity industry also suffers from serious maintenance and terrorism issues that cause disruption to both the supply of electricity and the ability of the electrical facilities to take the gas under contract. As reported in Fortune Magazine: “The Egbin Thermal Power Station, a few miles outside Lagos, is Nigeria's largest generating plant, with a capacity of 1,320 megawatts. It has six units, but two have been cannibalized to repair the remaining four, and at peak hours only two turbines are functioning. On bad days, like the first week in November, when the gas supply line was sabotaged, the plant shuts down altogether.” 4 Dec 2007 A recent assessment of the Nigerian electrical industry in a major, peer-reviewed energy journal stated:
4 Financial Times, May 16 2007
PROJECT DESIGN DOCUMENT FORM (CDM PDD) - Version 03.1. CDM – Executive Board page 8 “Currently, the country faces a serious energy crisis due to declining electricity generation from domestic power plants which are basically dilapidated, obsolete, unreliable and in an appalling state of disrepair, reflecting the poor maintenance culture in the country and gross inefficiency of the public utility provider.” (J. Ikeme and Obas John Ebohon, in Energy Policy, Volume 33, issue 9, June 2005) Given these realities, the only prudent and responsible action for the developer is to plan the project such that flaring does not resume in case of disruptions to the gas supply or electrical system. In this case, the developer maintains the option to create an emergency system to inject the natural gas produced by the project activity in case there are disruptions to the ability to market the gas. In a development situation like Nigeria where the uncertainties are so great, this is a prudent and conservative practice. This is especially important because the overwhelming economic benefit to the Joint Venture comes from the oil production. Absent such a back-up option the developer would likely be forced to flare the gas and/or the natural gas liquids. Concerning the injection of dry gas in depleted reservoirs, it should be noted that in developed and transition countries the balancing and storage of such gas is normally the responsibility of the gas transmission/distribution system, and storage in depleted reservoirs is the standard industry practice.5 The Nigeria National Gas Company (NGC) has no such storage capacity and has no known policy that would obligate NGC to take the associated gas in case of disruptions at the IPP. In this case the responsibility of storing the gas and thereby preventing its flaring falls upon the project developer. It should be noted, that the re-injection of the gas is only a cost to the project developer and is done to fully conform to the objective and intent of AM0009 to assure that the gas is not flared and that GHG emissions are reduced. As all equipment needed for re-injection of the gas falls within the project boundaries, any increased project emissions is fully captured. (The project developer has been advised by the DOE that such an emergency system may not qualify under CDM and therefore has decided not to include such an emergency system at this time. The project developer maintains the option to implement such a system in the future and to apply for CDM registration for such a project activity.) As regards storage of LPG, this is a normal part of the LPG supply and distribution system. As discussed in the World Bank/ESMAP study6 the distribution system is built around LPG storage depots, but these are not always maintained. The developer obviously prefers the immediate sale of the LPG, but due to development and security issues in Nigeria, such immediate sale of the product is not always possible. Therefore the developer must undertake to store the LPG, usually in tanks at the facility. It should be noted that there is no impact on absolute GHG emissions if the LPG is stored either within or outside the project boundaries. To the degree such storage is fully utilized, the operator will not extract the LPG from the gas and instead send the rich gas to the IPP for use. In summary, the storage and re-injection options for both LPG and dry gas included as future options in no way impinge on the condition for application of AM0009, and would fully conform to the algorithms and monitoring procedures set forth in AM0009.
5 United States Energy Information Agency, “U.S. Underground Natural Gas Storage Developments: 1998-2005” October 2006, Washington DC
International Gas Union,, “Underground Storage of Gas”, complied report of Working Committee 2, chair Sergey Khan; June 2006, Amsterdam 6 “Nigerian LP Gas Sector Improvement Report”, World Bank/Energy Sector Management Assistance Program (ESMAP), March 2004, page ix; TDA Press Release http://abuja.usembassy.gov/pr_07122005.html
PROJECT DESIGN DOCUMENT FORM (CDM PDD) - Version 03.1. CDM – Executive Board page 9 While capture and use of associated gas in Nigeria is not common practice, the technology treatment/ compression in Phase I and the GPP in Phase II are well-known and much utilized in the international upstream oil and gas sector. This type of project presents no specific technological risk.
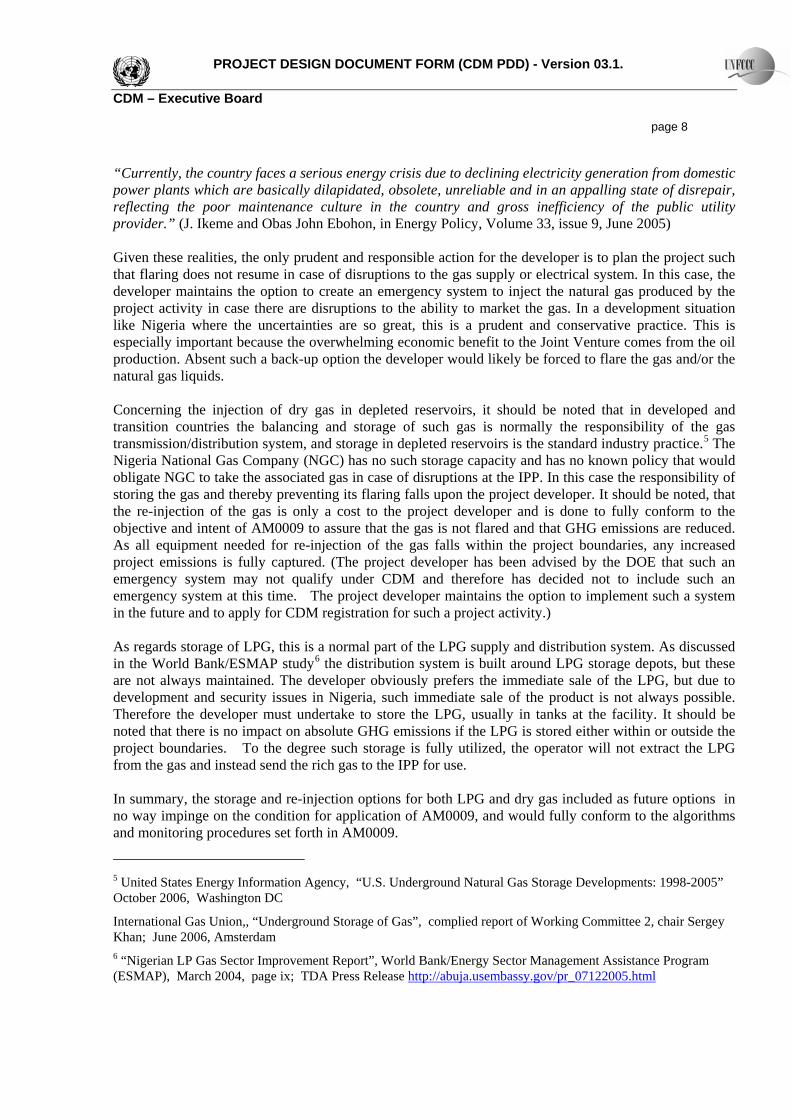
A.4.4 Estimated amount of emission reductions over the chosen crediting period: >> A crediting period of 10 years is requested for this project. Over the ten years, the net GHG emissions will be reduced by approximately 26.27 million tons CO2 equivalents. Years Annual estimation of emission reductions in
tonnes of CO2e Year 1 2,699,146Year 2 2,699,146Year 3 2,699,146Year 4 2,699,146Year 5 2,699,146Year 6 2,699,146Year 7 2,699,146Year 8 2,592,342Year 9 2,492,580Year 10 2,286,013Total estimated reduction (crediting period) 26,267,347Annual average over the crediting period of estimated reductions (tonnes of CO2e)
2,626,735
A.4.5. Public funding of the project activity:
None
SECTION B. Application of a baseline and monitoring methodology B.1. Title and reference of the approved baseline and monitoring methodology applied to the project activity: >> The project activity is developed with reference to approved methodology AM0009 Version 02.1 – “Recovery and utilization of gas from oil wells that would otherwise be flared”. B.2 Justification of the choice of the methodology and why it is applicable to the project activity: >> AM0009 lists six conditions for applicability, these are:
1. Gas at oil wells is recovered and transported in pipelines to a process plant where dry gas, LPG and condensate are produced;
2. Energy required for transport and processing of the recovered gas is generated by using the recovered gas;
PROJECT DESIGN DOCUMENT FORM (CDM PDD) - Version 03.1. CDM – Executive Board page 10
3. The products (dry gas, LPG and condensate) are likely to substitute in the market only the same type of fuels or fuels with a higher carbon content per unit of energy;
4. The substitution of fuels due to the project activity is unlikely to lead to an increase of fuel consumption in the respective market;
5. In the absence of the project activity, the gas is mainly flared; 6. Data (quantity and fraction of carbon) is accessible on the products of the gas processing plant
and on the gas recovered from other oil exploration facilities in cases where these facilities supply recovered gas to the same gas processing plant.
The project activity meets all the applicability conditions in AM0009. In particular:
1. Gas at oil wells is recovered for productive use. In Phase I pipeline and treatment/compression facilities are constructed and utilized and in Phase 2 the treatment facilities are expanded to include a GPP;
2. The gas processing plant and related facilities will be powered by the gas recovered; 3. The products marketed are gas and condensates in Phase 1. In Phase 2, LPG is also marketed. The
project’s gas will be sold for fuel use to an IPP. The IPP is new and designed for gas. To the degree there is any substitution in this market for the project’s gas it is in terms of other gas on a price basis. (Albeit this is unlikely in that there is a nationwide price set for all gas supplies to the electrical sector7.) The condensate is a minor portion of the oil supply and will have no effect. Under Phase 2, the LPG produced by this project will compete against other LPG supplies in the international and national market. The small amount of LPG added by this project activity will have no impact on the global LPG market in terms of price or inter-fuel competition;
4. The absolute amount of gas marketed by this project is a small percentage of the domestic gas market and is not expected to influence consumption in any significant way. Nevertheless should the domestic gas market expand, it would likely be positive in terms of carbon reduction by increasing gas used for electrical generation and thereby reducing the use of diesel for powering of small turbines. Concerning marketing of LPGs in Phase 2, this is planned to go to the national and international market; albeit some will likely be sold in the local market. The amount of LPG in terms of these markets is not significant and will largely offset imported LPG;
5. Without this project activity the “business as usual” scenario is to continue flaring as has been done for the past thirty years. The flaring of gas, while a loss of a natural resource, is the most reasonable economic option for the operator (this point is developed in Section B.4);
6. As the operator of both the oil field where the gas is flared and the proposed gas treatment/compression plants is the same, all information will be readily available.
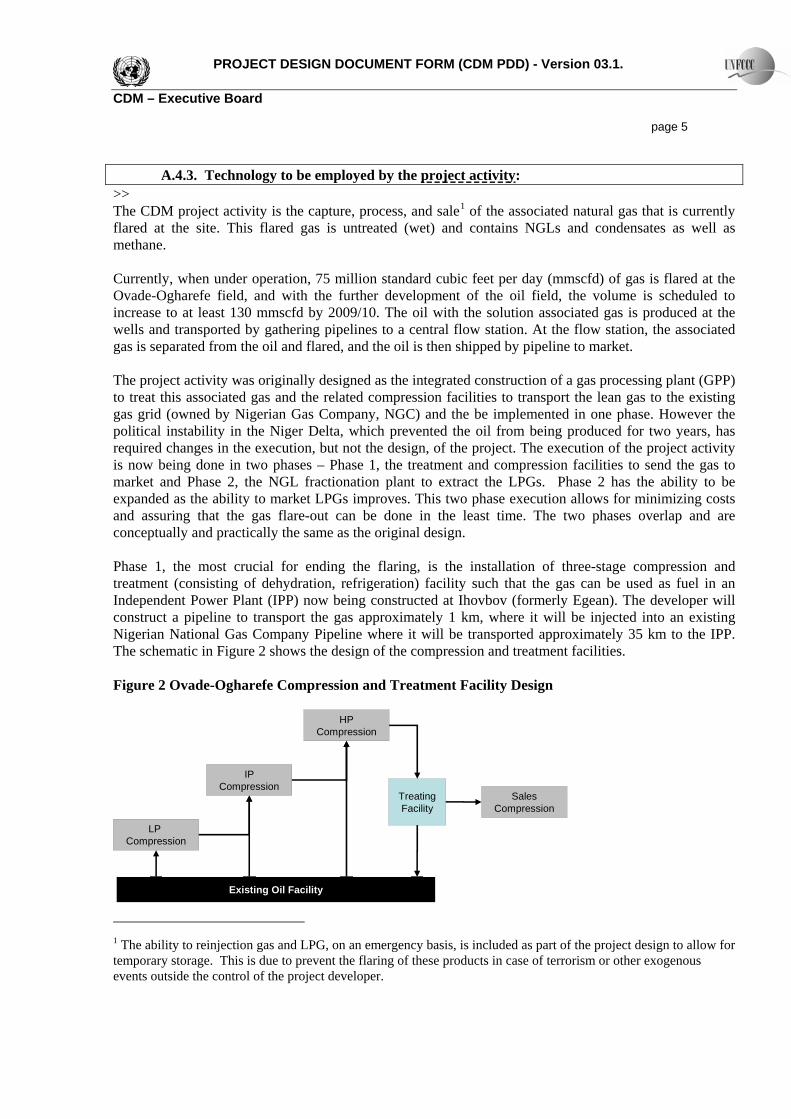
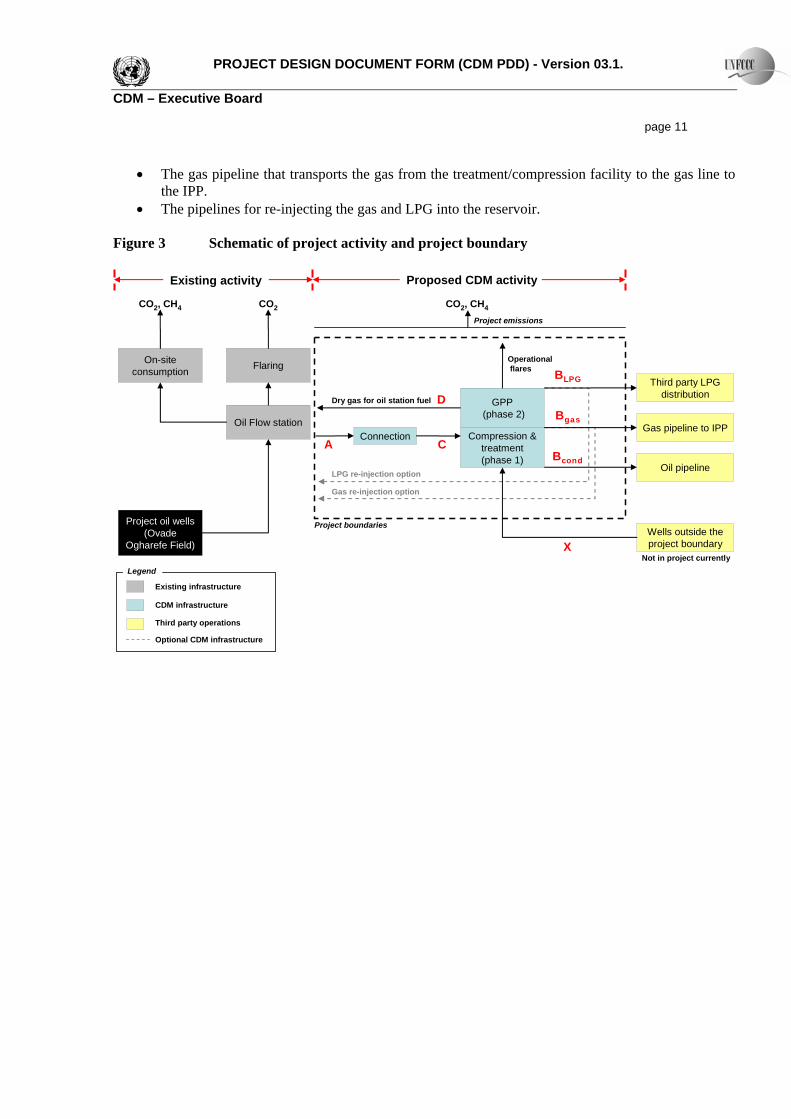
B.3. Description of the sources and gases included in the project boundary The project boundary encompasses all new gas related infrastructure under the control of the project developer that is constructed and relevant for this project activity (see Figure 3) Therefore it includes:
• The pipeline connections between the oil flow station (the site of the current flaring) and the gas treatment/compression facilities.
• The gas treatment/compression facility (Phase 1) and the GPP (Phase 2)
7 “National Gas Pricing Policy” The Government of the Federal Republic of Nigeria, 2008
PROJECT DESIGN DOCUMENT FORM (CDM PDD) - Version 03.1. CDM – Executive Board page 11
• The gas pipeline that transports the gas from the treatment/compression facility to the gas line to the IPP.
• The pipelines for re-injecting the gas and LPG into the reservoir. Figure 3 Schematic of project activity and project boundary
Existing activity Proposed CDM activity
Project oil wells (Ovade
Ogharefe Field)
On-site consumption
Oil Flow station
Flaring
Compression & treatment (phase 1)
GPP(phase 2)
Connection
Dry gas for oil station fuel
Third party LPG distribution
Gas pipeline to IPP
Oil pipeline
Wells outside the project boundary
A CBcond
Bgas
BLPG
Not in project currentlyX
LPG re-injection option
Gas re-injection option
Operationalflares
CO2CO2, CH4 CO2, CH4
Project emissions
Project boundaries
D
Optional CDM infrastructure
Third party operations
CDM infrastructure
Existing infrastructure
Legend

PROJECT DESIGN DOCUMENT FORM (CDM PDD) - Version 03.1. CDM – Executive Board page 12 The table below presents the gases and their sources which are included in the project boundary.
Source Gas Included? Justification / Explanation CO2 Yes Main source of emissions in baseline CH4 Yes Flaring does not achieve complete oxidation, so that
some CH4 is released in the atmosphere. As in AM0009, the flare efficiency is assumed to be 100%, and no CH4 emitted. This is a conservative assumption.
Bas
elin
e
Flaring
N2O No Assumed to be negligible CO2 Yes Emissions from natural gas (or any other fossil fuel)
used in these facilities CH4 Yes Minor leakages can occur at valves and flanges within
the facility
Fuel consumption by gas treatment and compression facilities N2O No Assumed negligible
CO2 No Assumed negligible CH4 Yes Fugitive emissions can occur at valves and flanges in
the pipeline Fugitive Emissions from Gas Pipelines
N2O No Assumed negligible CO2 No Assumed negligible CH4 Yes Fugitive emissions can occur if there is a pipeline
failure
Proj
ect A
ctiv
ity
Fugitive Emissions from accidents
N2O No Assumed negligible B.4. Description of how the baseline scenario is identified and description of the identified baseline scenario: The Baseline Scenario AM0009 lists five options by which associated gas is likely to be treated at oil fields. These options and the relevance to this project activity are: Option 1: Release to the atmosphere at the oil production site (venting). Venting of the gas in such quantities as produced at the Ovade-Ogharefe field would be extremely dangerous both to the workers and community due to the likelihood of explosion at the risk of life and property and for environmental health by inhaling methane and other gases. This option has never been considered viable for these reasons and is not considered.8 Option 2: Flaring at the production site This is the option that has been used since the field began production in 1975 and represents the “business as usual” case. The very low value of gas in the domestic market and the costs related to processing and 8 In that venting of methane would create magnitudes more GHG emissions than flaring, this option could never be considered from a CDM standpoint.
PROJECT DESIGN DOCUMENT FORM (CDM PDD) - Version 03.1. CDM – Executive Board page 13 marketing LPG and condensates have always caused this option to be uneconomic from the developer’s perspective. Further the security situation in the Delta has made all investments increasingly risky and financing difficult to obtain. It should be noted that this reasoning is shared by almost all other project owners (i.e. the energy companies that operate the oil fields) and the flaring of associated gas in Nigeria is the common practice. The government of Nigeria imposes a fine for the flaring of gas, but the payment of the fine is economically advantageous to investing in any other option. Therefore this option represents the business as usual case and is considered the baseline scenario. In 2006, a High Court ruling in the Benin Judicial District made a preliminary determination that gas flaring by the respondents in that case and in that specific location was not legal. This was carefully reviewed by Pan Ocean’s outside counsel who found that this ruling does not in anyway affect Pan Ocean and its operations in regarding to flaring of natural gas at the Ovade-Ogharefe oil field. The ruling has subsequently been dismissed and is no longer relevant. It should be noted that gas flaring in Nigeria is an issue of concern to the Nigerian Government and numerous proposals have been discussed for many years as to how to limit such flaring. Options that have been discussed include a legal ban on flaring and substantially increasing the fines for flaring. Despite these discussions, it is clear from the volumes of gas flared that this continues to be the common practice in Nigeria and will continue so for the foreseeable future. Indeed the most recent World Bank data show that flaring in Nigeria continues to increase.9 The Joint Venture’s flaring of gas at this field represents the common and prevailing practice in Nigeria. Option 3: On-site consumption Associated gas is currently used for this purpose, but this is less than 5% of the associated gas produced and this serves all feasible power needs. Therefore this option cannot be expanded. Option 4: Injection into the oil reservoir Associated gas is sometimes injected into oil reservoirs so as to enhance oil recovery (EOR). However the reservoir characteristics of the Ovade-Ogharefe field reveal that such injection would be of no or only marginal benefit in terms of improved oil recovery. Thus, on a stand alone basis injection in the oil reservoir is not economically feasible. Option 5: Recovery, transportation, processing and distribution to end-users Gas is only of minor value in the domestic Nigerian market, approximately $0.10 to 0.40 per mmbtu10. Thus gas marketing alone offers no incentive for undertaking such a major investment. The major value products produced from the processing of the gas are the condensates and LPG.
9http://web.worldbank.org/WBSITE/EXTERNAL/TOPICS/EXTOGMC/EXTGGFR/0,,contentMDK:21348978~pagePK:64168445~piPK:64168309~theSitePK:578069,00.html 10 Natonal Gas Pricing Policy, op cite
PROJECT DESIGN DOCUMENT FORM (CDM PDD) - Version 03.1. CDM – Executive Board page 14 Condensates are the highest value product and can be easily marketed via the existing oil pipeline. Nevertheless the condensate yield from the gas stream is relatively low at 460 bbls per day maximum – insufficient to justify the investment. The LPGs (butane and propane) represent the other potential revenue source, however this has been difficult to utilize in that there is very limited local market for LPGs and no economic way to transport the LPGs to the international market. Previously the preferred option was to build an LPG pipeline to the coast, but terrorist activity has precluded such an option. The current option is to take the LPG by pipeline to the nearest river port (approximately 10 km) where it will be sent by small boats to the coast. This is a very high cost operation, and given the amount of terrorism in this area, any operator will require substantial premiums to transport the LPG. (Pan Ocean will sell the LPG to a third party at the plant gate and thus is not directly involved in its transport and distribution.) While technically feasible, the cost of storage, loading, transportation, and marketing are such as to make the option at best economically marginal. B.5. Description of how the anthropogenic emissions of GHG by sources are reduced below those that would have occurred in the absence of the registered CDM project activity (assessment and demonstration of additionality): >> >> Reduction of anthropogenic emissions of GHG The anthropogenic emissions of GHG are reduced by the essential elimination (98%) of the gas flaring at the Ovade-Ogharefe oil field. It should be noted that the majority of this reduction is achieved in Phase 1 of the project. Phase 2 of the project, while important from a development and operational basis, only has a minor impact on flaring (through marketing of LPG) and should be viewed as an improvement in the overall treatment of the gas already captured. Therefore lacking this project, the only technically valid option is to continue to flare the gas (option 2 in Section B.4). Additionality The additionality of the proposed CDM project activity is assessed by following the stepwise procedure specified in AM0009. Identification of realistic and credible alternatives: Of the 5 options described in AM0009 and presented in Section B.4, only option 2 (flaring at the oil production site) and option 5 (proposed CDM project activity) are found to be credible and realistic. These two options will thus be further analyzed to determine additionality. Step 1: Evaluation legal aspects Under current law in Nigeria, the flaring of associated gas incurs a fine of 10 Naira per mscf but is not banned and it the common practice. Public discussion on gas flaring as well as overall gas utilization has been ongoing in Nigeria for many years, and such debates have included at times the possibility of greatly strengthen penalties related to gas

PROJECT DESIGN DOCUMENT FORM (CDM PDD) - Version 03.1. CDM – Executive Board page 15 flaring. Nevertheless an encompassing gas utilisation bill that covers gas production, transportation and distribution as well as flaring has yet to pass into law. This given the practical difficulty to end gas flaring it is unlikely any gas flare deadline will be put into regulation in the near or intermediate term. Indeed the Government’s policy to encourage investment coupled with the incentive provided by the Clean Development Mechanism could be the option of choice for eliminating the vast majority of flaring in Nigeria. Therefore at this time the only legal penalty for flaring is the fine cited above. Annex 3-A contains a more in-depth analysis of Government policy related to gas flaring in Nigeria. As a result of the above analysis, both option 2 and option 5 are found to be in compliance with mandatory legislation and regulations in Nigeria. Step 2: Evaluating the Economic Attractiveness Option 2 (flaring at the oil production site) is the current practice. The economics of this alternative will not be evaluated specifically. The continuation of current practice is used as a baseline when determining the economic attractiveness of option 5 (the proposed CDM project activity), and the outcome of the economic analysis will thus provide evidence of which of the two options is most economic. The economics of the proposed CDM project activity relies on the processing of wet gas and sale of dry gas, condensates, and LPGs, specifically:
• The dry gas will be sold for approximately $US 0.50 per mmbtu to the IPP (via NGC) • The condensates will be sold and transported by existing oil pipeline • The LPGs will be sold at the plant gate to a third party who will store, transport and market the
LPGs • The reduction in flaring will result in a reduction of flaring fines to be paid by the operator
As will be shown below, the financial returns earned by the project developer for implementing the proposed CDM project are marginal. A comprehensive project evaluation was done based on generally acceptable methods and principles used within the oil and gas industry as well as the fiscal regime under which the project developer operates in Nigeria. The project financial returns are calculated on a project, stand alone basis, as is normal for such evaluation. As identified in AM0009 the following parameters are used in calculating the financial returns:
• The overall projected gas production • The projected quantity of gas recovered, excluding gas flared, vented or consumed on-site • The agreed price for the delivery of the recovered gas • The net calorific value of the gas • Capital expenditures for gas recovery facilities, pipelines, etc. • Operational costs • Any cost recovery or profit sharing agreements
In addition because of the specifics of this project, the following parameters are also used:
PROJECT DESIGN DOCUMENT FORM (CDM PDD) - Version 03.1. CDM – Executive Board page 16
• The overall projected condensate and LPG production, based on the forecasted gas production • The volume of the dry gas marketed based on the contract amount with NGC • Within the operating costs:
o An overall amount equal to 5% of the capital for the operation and maintenance of the new gas related facilities, as customary in capital budgeting for such investments
o A tariff for the transport of the condensates via the existing oil pipelines o Net back price received by the operator for the LPGs. This net back price reflects the
tariffs and the transport, storage and marketing of the LPGs by the third party. It should be noted that the transport of the LPGs by river boat to market presents substantially security risks, and any prudent third-party operator will require a substantial risk premium for such an undertaking.
The prices used in the analysis are:
• For dry gas, US$ 0.50 mmbtu • A light crude price of $40/bbl. over the life of the project • A condensate price of crude plus $1.50/bbl • A market price for LPG of 85% of the crude price
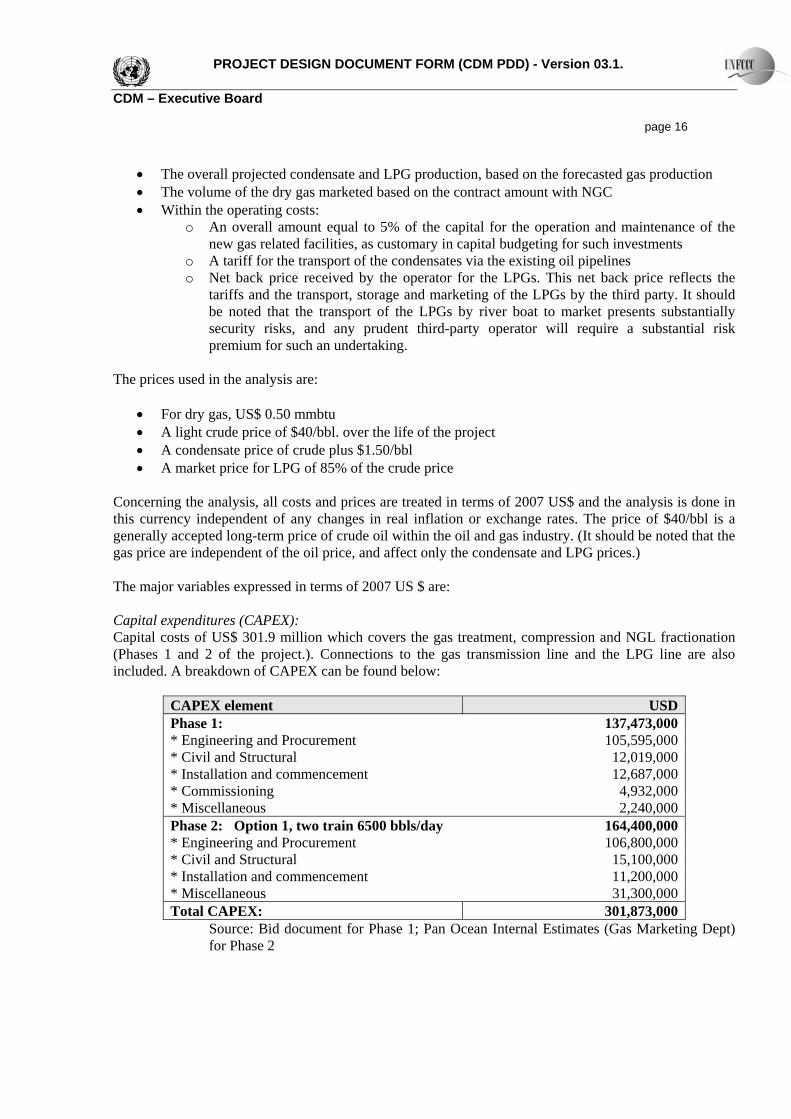
Concerning the analysis, all costs and prices are treated in terms of 2007 US$ and the analysis is done in this currency independent of any changes in real inflation or exchange rates. The price of $40/bbl is a generally accepted long-term price of crude oil within the oil and gas industry. (It should be noted that the gas price are independent of the oil price, and affect only the condensate and LPG prices.) The major variables expressed in terms of 2007 US $ are: Capital expenditures (CAPEX): Capital costs of US$ 301.9 million which covers the gas treatment, compression and NGL fractionation (Phases 1 and 2 of the project.). Connections to the gas transmission line and the LPG line are also included. A breakdown of CAPEX can be found below:
CAPEX element USDPhase 1: 137,473,000* Engineering and Procurement 105,595,000* Civil and Structural 12,019,000* Installation and commencement 12,687,000* Commissioning 4,932,000* Miscellaneous 2,240,000Phase 2: Option 1, two train 6500 bbls/day 164,400,000* Engineering and Procurement 106,800,000* Civil and Structural 15,100,000* Installation and commencement 11,200,000* Miscellaneous 31,300,000Total CAPEX: 301,873,000
Source: Bid document for Phase 1; Pan Ocean Internal Estimates (Gas Marketing Dept) for Phase 2
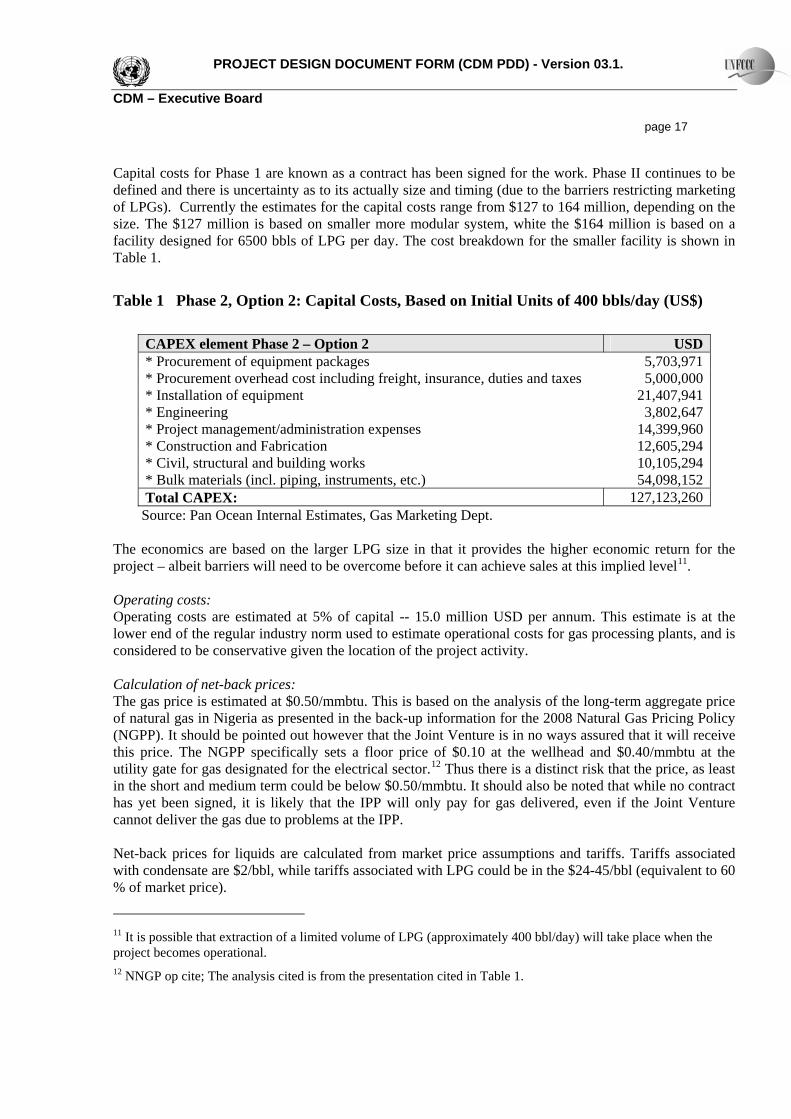
PROJECT DESIGN DOCUMENT FORM (CDM PDD) - Version 03.1. CDM – Executive Board page 17 Capital costs for Phase 1 are known as a contract has been signed for the work. Phase II continues to be defined and there is uncertainty as to its actually size and timing (due to the barriers restricting marketing of LPGs). Currently the estimates for the capital costs range from $127 to 164 million, depending on the size. The $127 million is based on smaller more modular system, white the $164 million is based on a facility designed for 6500 bbls of LPG per day. The cost breakdown for the smaller facility is shown in Table 1.
Table 1 Phase 2, Option 2: Capital Costs, Based on Initial Units of 400 bbls/day (US$)
CAPEX element Phase 2 – Option 2 USD* Procurement of equipment packages 5,703,971* Procurement overhead cost including freight, insurance, duties and taxes 5,000,000* Installation of equipment 21,407,941* Engineering 3,802,647* Project management/administration expenses 14,399,960* Construction and Fabrication 12,605,294* Civil, structural and building works 10,105,294* Bulk materials (incl. piping, instruments, etc.) 54,098,152Total CAPEX: 127,123,260
Source: Pan Ocean Internal Estimates, Gas Marketing Dept.
The economics are based on the larger LPG size in that it provides the higher economic return for the project – albeit barriers will need to be overcome before it can achieve sales at this implied level11. Operating costs: Operating costs are estimated at 5% of capital -- 15.0 million USD per annum. This estimate is at the lower end of the regular industry norm used to estimate operational costs for gas processing plants, and is considered to be conservative given the location of the project activity. Calculation of net-back prices: The gas price is estimated at $0.50/mmbtu. This is based on the analysis of the long-term aggregate price of natural gas in Nigeria as presented in the back-up information for the 2008 Natural Gas Pricing Policy (NGPP). It should be pointed out however that the Joint Venture is in no ways assured that it will receive this price. The NGPP specifically sets a floor price of $0.10 at the wellhead and $0.40/mmbtu at the utility gate for gas designated for the electrical sector.12 Thus there is a distinct risk that the price, as least in the short and medium term could be below $0.50/mmbtu. It should also be noted that while no contract has yet been signed, it is likely that the IPP will only pay for gas delivered, even if the Joint Venture cannot deliver the gas due to problems at the IPP. Net-back prices for liquids are calculated from market price assumptions and tariffs. Tariffs associated with condensate are $2/bbl, while tariffs associated with LPG could be in the $24-45/bbl (equivalent to 60 % of market price).
11 It is possible that extraction of a limited volume of LPG (approximately 400 bbl/day) will take place when the project becomes operational. 12 NNGP op cite; The analysis cited is from the presentation cited in Table 1.
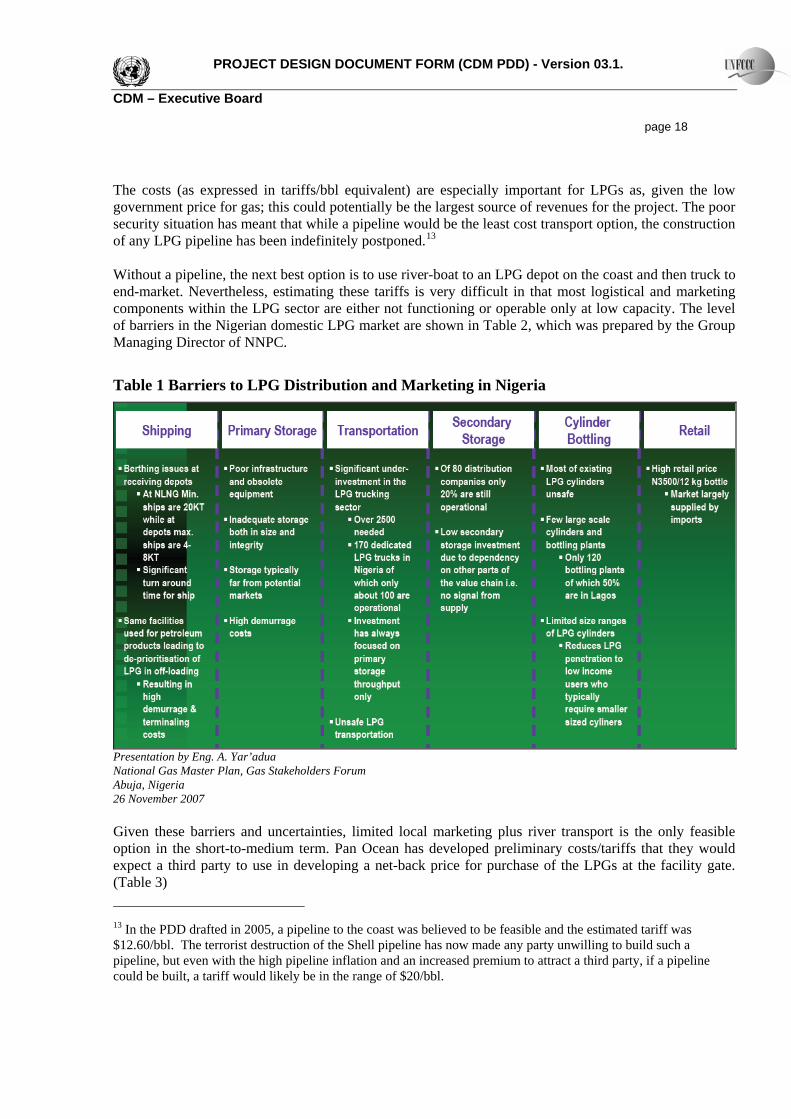
PROJECT DESIGN DOCUMENT FORM (CDM PDD) - Version 03.1. CDM – Executive Board page 18 The costs (as expressed in tariffs/bbl equivalent) are especially important for LPGs as, given the low government price for gas; this could potentially be the largest source of revenues for the project. The poor security situation has meant that while a pipeline would be the least cost transport option, the construction of any LPG pipeline has been indefinitely postponed.13 Without a pipeline, the next best option is to use river-boat to an LPG depot on the coast and then truck to end-market. Nevertheless, estimating these tariffs is very difficult in that most logistical and marketing components within the LPG sector are either not functioning or operable only at low capacity. The level of barriers in the Nigerian domestic LPG market are shown in Table 2, which was prepared by the Group Managing Director of NNPC.
Table 1 Barriers to LPG Distribution and Marketing in Nigeria
Presentation by Eng. A. Yar’adua National Gas Master Plan, Gas Stakeholders Forum Abuja, Nigeria 26 November 2007 Given these barriers and uncertainties, limited local marketing plus river transport is the only feasible option in the short-to-medium term. Pan Ocean has developed preliminary costs/tariffs that they would expect a third party to use in developing a net-back price for purchase of the LPGs at the facility gate. (Table 3) 13 In the PDD drafted in 2005, a pipeline to the coast was believed to be feasible and the estimated tariff was $12.60/bbl. The terrorist destruction of the Shell pipeline has now made any party unwilling to build such a pipeline, but even with the high pipeline inflation and an increased premium to attract a third party, if a pipeline could be built, a tariff would likely be in the range of $20/bbl.
PROJECT DESIGN DOCUMENT FORM (CDM PDD) - Version 03.1. CDM – Executive Board page 19
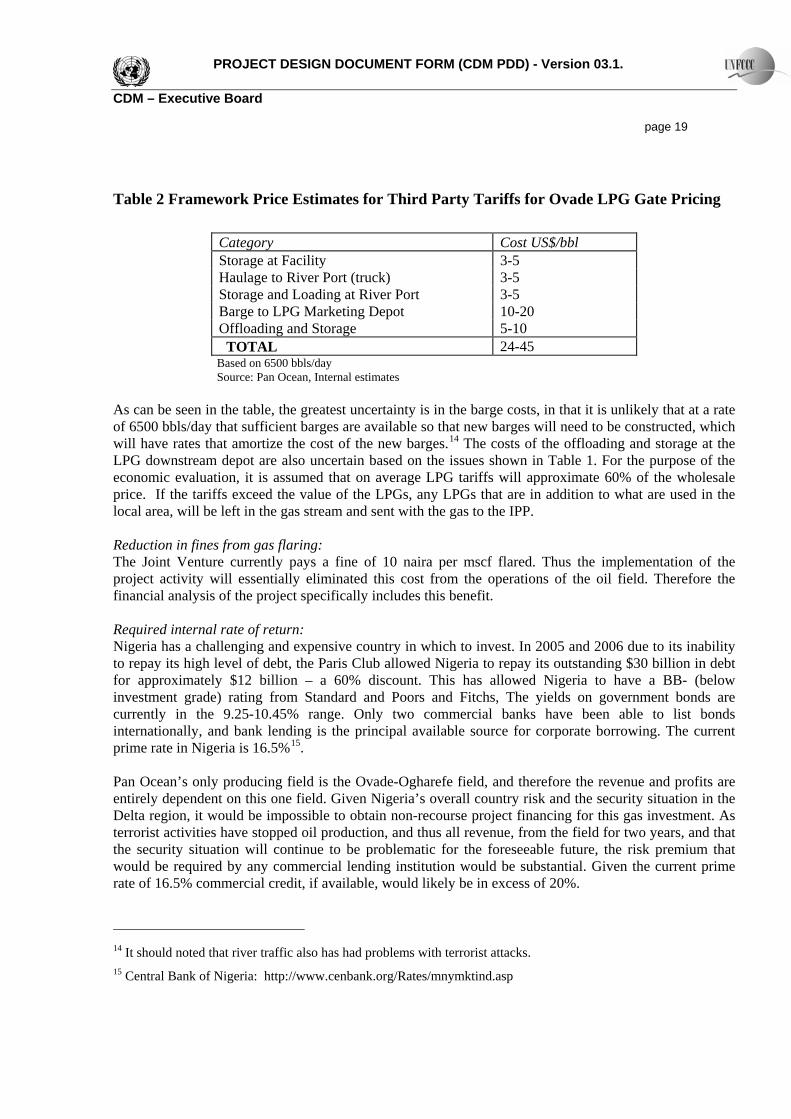
Table 2 Framework Price Estimates for Third Party Tariffs for Ovade LPG Gate Pricing
Category Cost US$/bbl Storage at Facility 3-5 Haulage to River Port (truck) 3-5 Storage and Loading at River Port 3-5 Barge to LPG Marketing Depot 10-20 Offloading and Storage 5-10 TOTAL 24-45 Based on 6500 bbls/day Source: Pan Ocean, Internal estimates
As can be seen in the table, the greatest uncertainty is in the barge costs, in that it is unlikely that at a rate of 6500 bbls/day that sufficient barges are available so that new barges will need to be constructed, which will have rates that amortize the cost of the new barges.14 The costs of the offloading and storage at the LPG downstream depot are also uncertain based on the issues shown in Table 1. For the purpose of the economic evaluation, it is assumed that on average LPG tariffs will approximate 60% of the wholesale price. If the tariffs exceed the value of the LPGs, any LPGs that are in addition to what are used in the local area, will be left in the gas stream and sent with the gas to the IPP. Reduction in fines from gas flaring: The Joint Venture currently pays a fine of 10 naira per mscf flared. Thus the implementation of the project activity will essentially eliminated this cost from the operations of the oil field. Therefore the financial analysis of the project specifically includes this benefit. Required internal rate of return: Nigeria has a challenging and expensive country in which to invest. In 2005 and 2006 due to its inability to repay its high level of debt, the Paris Club allowed Nigeria to repay its outstanding $30 billion in debt for approximately $12 billion – a 60% discount. This has allowed Nigeria to have a BB- (below investment grade) rating from Standard and Poors and Fitchs, The yields on government bonds are currently in the 9.25-10.45% range. Only two commercial banks have been able to list bonds internationally, and bank lending is the principal available source for corporate borrowing. The current prime rate in Nigeria is 16.5%15. Pan Ocean’s only producing field is the Ovade-Ogharefe field, and therefore the revenue and profits are entirely dependent on this one field. Given Nigeria’s overall country risk and the security situation in the Delta region, it would be impossible to obtain non-recourse project financing for this gas investment. As terrorist activities have stopped oil production, and thus all revenue, from the field for two years, and that the security situation will continue to be problematic for the foreseeable future, the risk premium that would be required by any commercial lending institution would be substantial. Given the current prime rate of 16.5% commercial credit, if available, would likely be in excess of 20%.
14 It should noted that river traffic also has had problems with terrorist attacks. 15 Central Bank of Nigeria: http://www.cenbank.org/Rates/mnymktind.asp
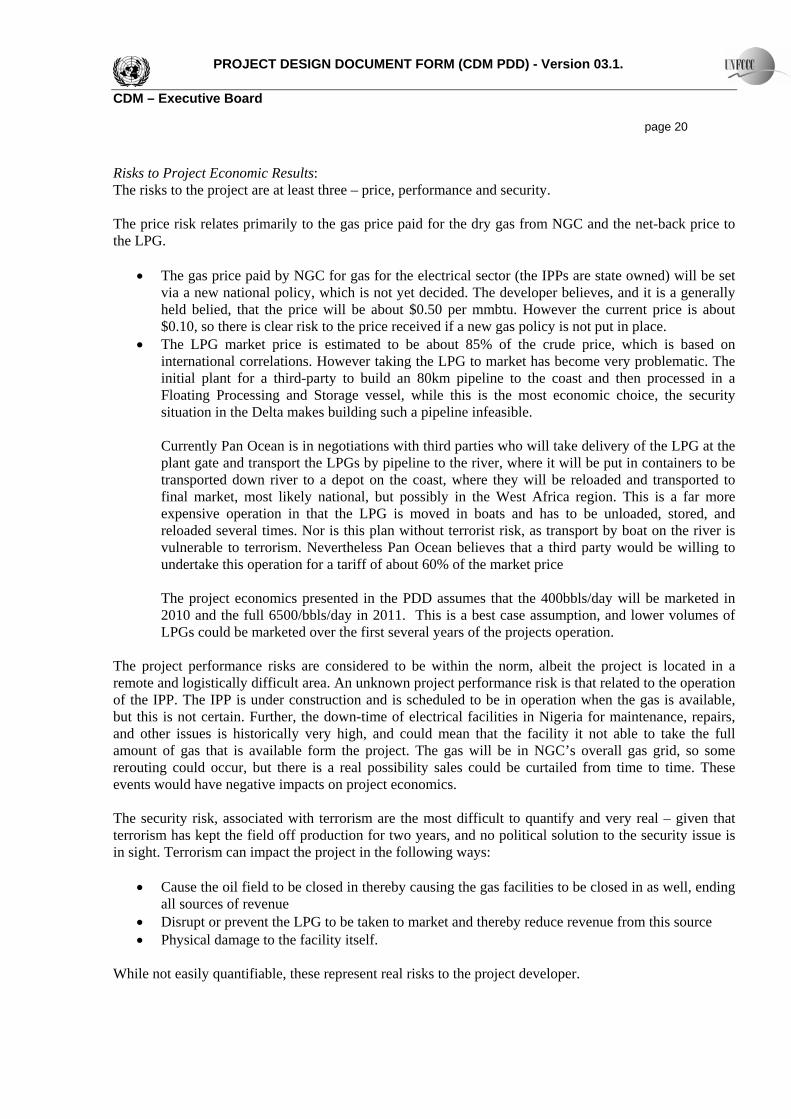
PROJECT DESIGN DOCUMENT FORM (CDM PDD) - Version 03.1. CDM – Executive Board page 20 Risks to Project Economic Results: The risks to the project are at least three – price, performance and security. The price risk relates primarily to the gas price paid for the dry gas from NGC and the net-back price to the LPG.
• The gas price paid by NGC for gas for the electrical sector (the IPPs are state owned) will be set via a new national policy, which is not yet decided. The developer believes, and it is a generally held belied, that the price will be about $0.50 per mmbtu. However the current price is about $0.10, so there is clear risk to the price received if a new gas policy is not put in place.
• The LPG market price is estimated to be about 85% of the crude price, which is based on international correlations. However taking the LPG to market has become very problematic. The initial plant for a third-party to build an 80km pipeline to the coast and then processed in a Floating Processing and Storage vessel, while this is the most economic choice, the security situation in the Delta makes building such a pipeline infeasible.
Currently Pan Ocean is in negotiations with third parties who will take delivery of the LPG at the plant gate and transport the LPGs by pipeline to the river, where it will be put in containers to be transported down river to a depot on the coast, where they will be reloaded and transported to final market, most likely national, but possibly in the West Africa region. This is a far more expensive operation in that the LPG is moved in boats and has to be unloaded, stored, and reloaded several times. Nor is this plan without terrorist risk, as transport by boat on the river is vulnerable to terrorism. Nevertheless Pan Ocean believes that a third party would be willing to undertake this operation for a tariff of about 60% of the market price The project economics presented in the PDD assumes that the 400bbls/day will be marketed in 2010 and the full 6500/bbls/day in 2011. This is a best case assumption, and lower volumes of LPGs could be marketed over the first several years of the projects operation.
The project performance risks are considered to be within the norm, albeit the project is located in a remote and logistically difficult area. An unknown project performance risk is that related to the operation of the IPP. The IPP is under construction and is scheduled to be in operation when the gas is available, but this is not certain. Further, the down-time of electrical facilities in Nigeria for maintenance, repairs, and other issues is historically very high, and could mean that the facility it not able to take the full amount of gas that is available form the project. The gas will be in NGC’s overall gas grid, so some rerouting could occur, but there is a real possibility sales could be curtailed from time to time. These events would have negative impacts on project economics. The security risk, associated with terrorism are the most difficult to quantify and very real – given that terrorism has kept the field off production for two years, and no political solution to the security issue is in sight. Terrorism can impact the project in the following ways:
• Cause the oil field to be closed in thereby causing the gas facilities to be closed in as well, ending all sources of revenue
• Disrupt or prevent the LPG to be taken to market and thereby reduce revenue from this source • Physical damage to the facility itself.
While not easily quantifiable, these represent real risks to the project developer.

PROJECT DESIGN DOCUMENT FORM (CDM PDD) - Version 03.1. CDM – Executive Board page 21 The calculated returns on a project basis are given in Table 1. Table 3: Key Financial Indicators for the Project Activity – before financing
Gross Revenues ($ million) 1,582.1 Undiscounted Net Cash Flow after Capex and Royalties ($ million) 138.1 Federal Taxes Paid ($ million, undiscounted) 57.3 Undiscounted Net Cash Flow after Federal Taxes Paid ($ million) 80.9 Present Value of After Tax Net Cash Flow at 20% ($ million) -95.4 Internal Rate of Return, based on Energy Sales 3.2 % Undiscounted after Tax Impact of Savings from Flaring Fees ($ million) 65.4 Internal Rate of Return, based on Energy Sales and Savings on Fines 5.4 %
Source: Pan Ocean As can be seen from Table 4 above, the financial returns earned by the project developer for implementing the proposed CDM project are marginal. As the economic analysis shows, the project is only marginal on a base-case scenario. Nevertheless the Joint Venture partners have carefully considered this project and believe it to have long-term upside potential, based on a positive view of the national development of the gas and electrical sectors and a slow, but steady improvement in the LPG sector. Further the developer believes that in the mid-to-long term that the security in Delta State will improve further facilitating development. In addition its ability to be registered with the CDM and thereby monetize the carbon credits offers an incentive to implement the project as soon as feasible, as the carbon credits provide a clear financial benefit for the project.
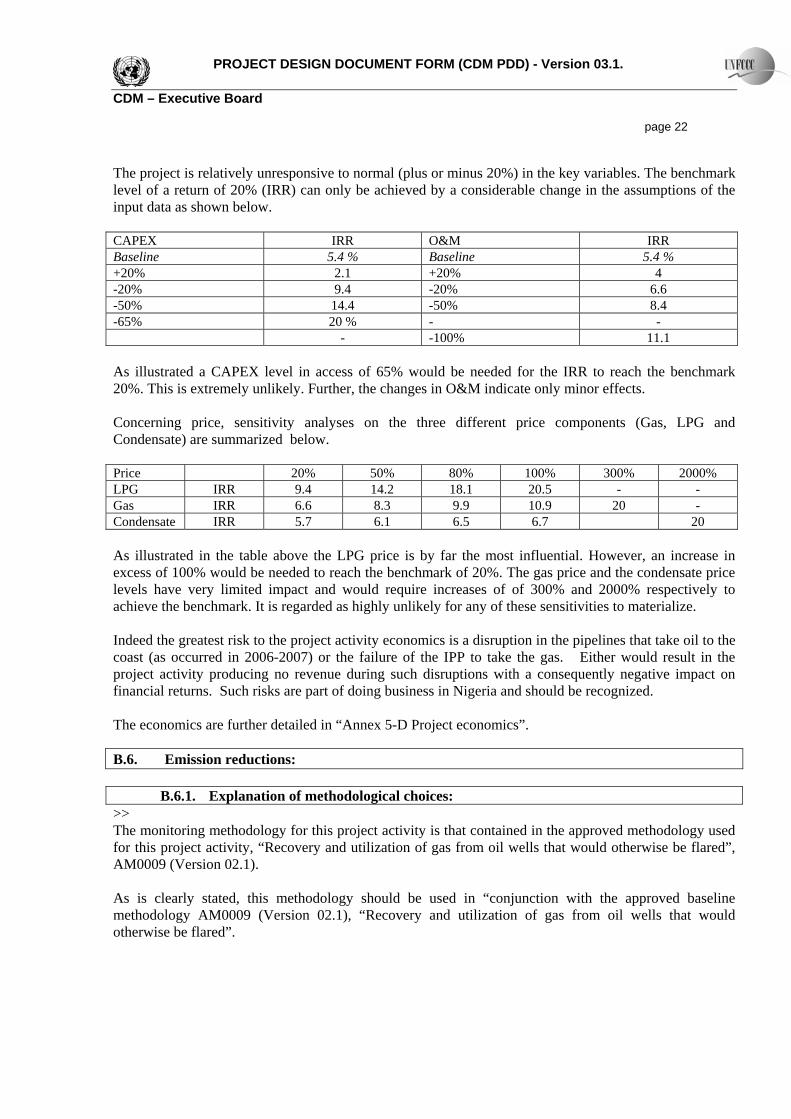
PROJECT DESIGN DOCUMENT FORM (CDM PDD) - Version 03.1. CDM – Executive Board page 22 The project is relatively unresponsive to normal (plus or minus 20%) in the key variables. The benchmark level of a return of 20% (IRR) can only be achieved by a considerable change in the assumptions of the input data as shown below. CAPEX IRR O&M IRR Baseline 5.4 % Baseline 5.4 % +20% 2.1 +20% 4 -20% 9.4 -20% 6.6 -50% 14.4 -50% 8.4 -65% 20 % - - - -100% 11.1 As illustrated a CAPEX level in access of 65% would be needed for the IRR to reach the benchmark 20%. This is extremely unlikely. Further, the changes in O&M indicate only minor effects. Concerning price, sensitivity analyses on the three different price components (Gas, LPG and Condensate) are summarized below. Price 20% 50% 80% 100% 300% 2000% LPG IRR 9.4 14.2 18.1 20.5 - - Gas IRR 6.6 8.3 9.9 10.9 20 - Condensate IRR 5.7 6.1 6.5 6.7 20 As illustrated in the table above the LPG price is by far the most influential. However, an increase in excess of 100% would be needed to reach the benchmark of 20%. The gas price and the condensate price levels have very limited impact and would require increases of of 300% and 2000% respectively to achieve the benchmark. It is regarded as highly unlikely for any of these sensitivities to materialize. Indeed the greatest risk to the project activity economics is a disruption in the pipelines that take oil to the coast (as occurred in 2006-2007) or the failure of the IPP to take the gas. Either would result in the project activity producing no revenue during such disruptions with a consequently negative impact on financial returns. Such risks are part of doing business in Nigeria and should be recognized. The economics are further detailed in “Annex 5-D Project economics”. B.6. Emission reductions:
B.6.1. Explanation of methodological choices: >> The monitoring methodology for this project activity is that contained in the approved methodology used for this project activity, “Recovery and utilization of gas from oil wells that would otherwise be flared”, AM0009 (Version 02.1). As is clearly stated, this methodology should be used in “conjunction with the approved baseline methodology AM0009 (Version 02.1), “Recovery and utilization of gas from oil wells that would otherwise be flared”.
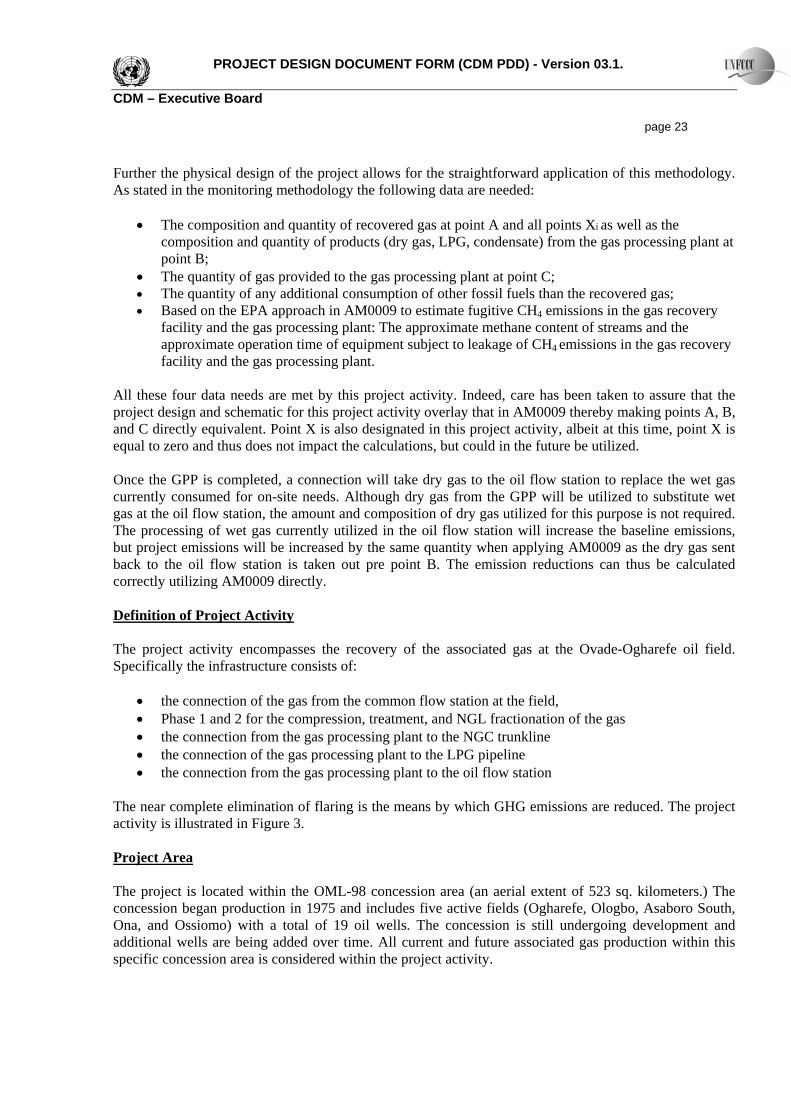
PROJECT DESIGN DOCUMENT FORM (CDM PDD) - Version 03.1. CDM – Executive Board page 23 Further the physical design of the project allows for the straightforward application of this methodology. As stated in the monitoring methodology the following data are needed:
• The composition and quantity of recovered gas at point A and all points Xi as well as the composition and quantity of products (dry gas, LPG, condensate) from the gas processing plant at point B;
• The quantity of gas provided to the gas processing plant at point C; • The quantity of any additional consumption of other fossil fuels than the recovered gas; • Based on the EPA approach in AM0009 to estimate fugitive CH4 emissions in the gas recovery
facility and the gas processing plant: The approximate methane content of streams and the approximate operation time of equipment subject to leakage of CH4 emissions in the gas recovery facility and the gas processing plant.
All these four data needs are met by this project activity. Indeed, care has been taken to assure that the project design and schematic for this project activity overlay that in AM0009 thereby making points A, B, and C directly equivalent. Point X is also designated in this project activity, albeit at this time, point X is equal to zero and thus does not impact the calculations, but could in the future be utilized. Once the GPP is completed, a connection will take dry gas to the oil flow station to replace the wet gas currently consumed for on-site needs. Although dry gas from the GPP will be utilized to substitute wet gas at the oil flow station, the amount and composition of dry gas utilized for this purpose is not required. The processing of wet gas currently utilized in the oil flow station will increase the baseline emissions, but project emissions will be increased by the same quantity when applying AM0009 as the dry gas sent back to the oil flow station is taken out pre point B. The emission reductions can thus be calculated correctly utilizing AM0009 directly. Definition of Project Activity The project activity encompasses the recovery of the associated gas at the Ovade-Ogharefe oil field. Specifically the infrastructure consists of:
• the connection of the gas from the common flow station at the field, • Phase 1 and 2 for the compression, treatment, and NGL fractionation of the gas • the connection from the gas processing plant to the NGC trunkline • the connection of the gas processing plant to the LPG pipeline • the connection from the gas processing plant to the oil flow station
The near complete elimination of flaring is the means by which GHG emissions are reduced. The project activity is illustrated in Figure 3. Project Area The project is located within the OML-98 concession area (an aerial extent of 523 sq. kilometers.) The concession began production in 1975 and includes five active fields (Ogharefe, Ologbo, Asaboro South, Ona, and Ossiomo) with a total of 19 oil wells. The concession is still undergoing development and additional wells are being added over time. All current and future associated gas production within this specific concession area is considered within the project activity.
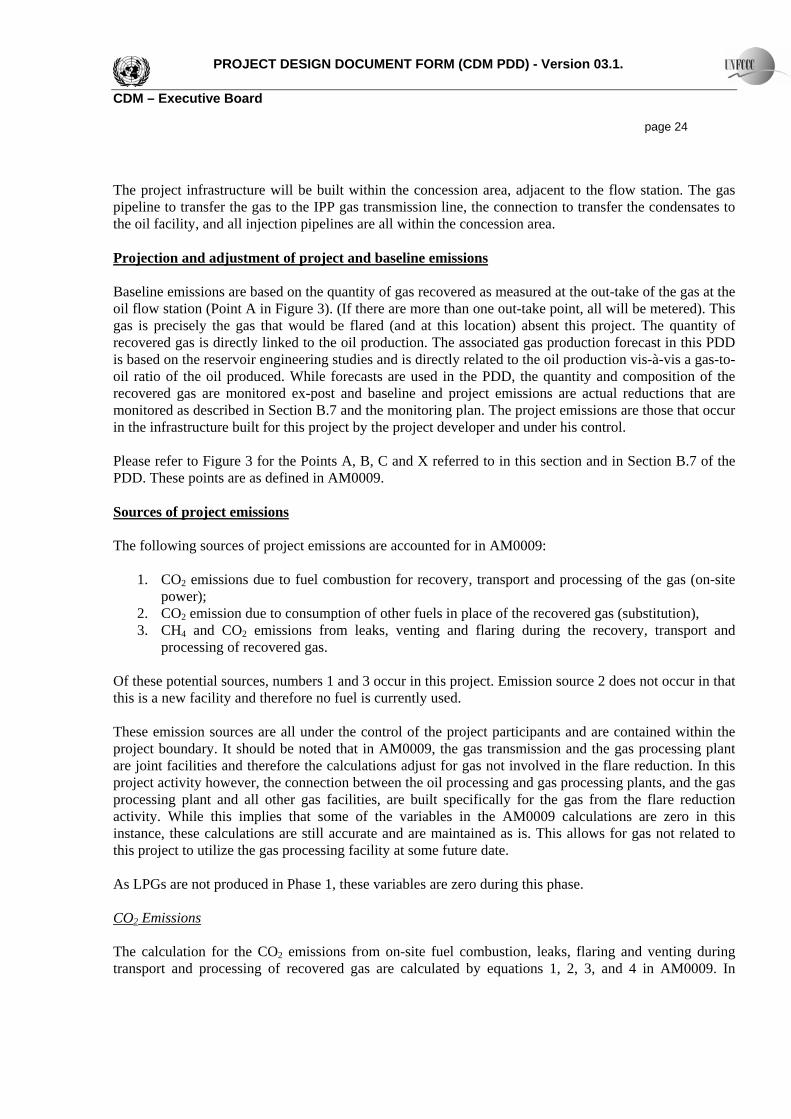
PROJECT DESIGN DOCUMENT FORM (CDM PDD) - Version 03.1. CDM – Executive Board page 24 The project infrastructure will be built within the concession area, adjacent to the flow station. The gas pipeline to transfer the gas to the IPP gas transmission line, the connection to transfer the condensates to the oil facility, and all injection pipelines are all within the concession area. Projection and adjustment of project and baseline emissions Baseline emissions are based on the quantity of gas recovered as measured at the out-take of the gas at the oil flow station (Point A in Figure 3). (If there are more than one out-take point, all will be metered). This gas is precisely the gas that would be flared (and at this location) absent this project. The quantity of recovered gas is directly linked to the oil production. The associated gas production forecast in this PDD is based on the reservoir engineering studies and is directly related to the oil production vis-à-vis a gas-to-oil ratio of the oil produced. While forecasts are used in the PDD, the quantity and composition of the recovered gas are monitored ex-post and baseline and project emissions are actual reductions that are monitored as described in Section B.7 and the monitoring plan. The project emissions are those that occur in the infrastructure built for this project by the project developer and under his control. Please refer to Figure 3 for the Points A, B, C and X referred to in this section and in Section B.7 of the PDD. These points are as defined in AM0009. Sources of project emissions The following sources of project emissions are accounted for in AM0009:
1. CO2 emissions due to fuel combustion for recovery, transport and processing of the gas (on-site power);
2. CO2 emission due to consumption of other fuels in place of the recovered gas (substitution), 3. CH4 and CO2 emissions from leaks, venting and flaring during the recovery, transport and
processing of recovered gas. Of these potential sources, numbers 1 and 3 occur in this project. Emission source 2 does not occur in that this is a new facility and therefore no fuel is currently used. These emission sources are all under the control of the project participants and are contained within the project boundary. It should be noted that in AM0009, the gas transmission and the gas processing plant are joint facilities and therefore the calculations adjust for gas not involved in the flare reduction. In this project activity however, the connection between the oil processing and gas processing plants, and the gas processing plant and all other gas facilities, are built specifically for the gas from the flare reduction activity. While this implies that some of the variables in the AM0009 calculations are zero in this instance, these calculations are still accurate and are maintained as is. This allows for gas not related to this project to utilize the gas processing facility at some future date. As LPGs are not produced in Phase 1, these variables are zero during this phase. CO2 Emissions The calculation for the CO2 emissions from on-site fuel combustion, leaks, flaring and venting during transport and processing of recovered gas are calculated by equations 1, 2, 3, and 4 in AM0009. In
PROJECT DESIGN DOCUMENT FORM (CDM PDD) - Version 03.1. CDM – Executive Board page 25 essence carbon is tracked from Point A (entry of the gas into the project activity) through Point B (the exit of the dry gas and liquids from the gas treatment/compression facilities (plus GPP in Phase 2). The calculations are based on the volume of the entering and leaving stream into the project activity, the carbon content of the gas (and liquids) at the entry and exit points, over the time interval. It should be noted that currently wet gas is used for power at the oil flow station. Once the GPP is completed, a connection will take dry gas to the oil flow station to replace the wet gas16. This connection will be taken from the GPP before point B so as to ensure correct determination of the emission reductions. As noted previously, all gas is from the project activity and therefore all variables related to Point X are zero at this time. Nevertheless the formula is maintained in case gas from outside the project activity is processed at this gas processing plant at some future date. See Section B.6.3 for the formulas and variables. CO2 emission due to consumption of other fuels in place of the recovered gas (substitution) As all infrastructure for this project activity will be new, no fuels are currently consumed. Natural gas that is processed in the facility will be used as the fuel for the facility; therefore this will be the primary source of project emissions. A diesel fired generator will be installed for backup, and if this is used, then equation number 5 in AM0009 will be used to calculate any emissions from this source. (It should be noted that the back-up generator would normally be used at most a few hours during a year.) CH4 emissions from leaks, venting and flaring during the recovery, transport and processing of recovered gas These emissions can occur principally at two stages within the Ovade-Oghrafe project activity – 1) transportation lines for the gas and 2) within the gas treatment/compression/GPP infrastructure. The first of the stages, the transportation, is a minor portion in this project activity in that the two facilities are in close proximity; therefore the gas pipelines from and to the oil flow station (designed for 135 mmscfd) will be about 0.5 km in length17. The connection line from the facility to the IPP transmission line will be about 1 km18. All calculations for project emissions will be done for all segments of gas pipeline within the project boundaries. As the pipelines will be relatively short, it is likely they will be seamless thus minimizing any potential emissions. CH4 emissions from recovery and processing of the gas All infrastructure built for the Ovade-Ogharefe project activity will use modern equipment and conform to international best practice. In this regard emissions during operations are expected to be very minor.
16 In essence, the current power supply of wet gas at the oil flow station will be replaced with dry gas that is somewhat lower in carbon content. 17 It should be noted that on the PDD accompanying the AM0009 methodology, the pipeline was much longer and thus it was a more important potential source of emissions. 18 This pipeline could be built and operated by a state company. In the re-injection options, a line for both dry gas and LPGs would transport them for re-injection and temporary storage in a depleted reservoir.
PROJECT DESIGN DOCUMENT FORM (CDM PDD) - Version 03.1. CDM – Executive Board page 26 Since the measurement of such emissions at each potential source is impractical, the average emission factors included in AM0009 will be utilized. These emission factors are taken from the IPCC Good Practice Guidance and/or from the 1995 Protocol for Equipment Leak Emission Estimates, published by EPA. This will likely provide greater estimated emissions than would occur, but this is done under the conservative principle suggested by the Executive Board. These sources are cited by AM0009. Upon the physical completion of the project, a complete data base of all relevant equipment installed (such as valves, pump seals, connectors, flanges, open-ended lines, etc.) will be made and the conversation factors applied. The data base will include:
o The number of each type of component in a unit (valve, connector, etc.). o The service each component is in (gas, light liquid or heavy liquid). o The total organic compound and methane concentration of the stream, and o The time period each component is in that service.
This data base will be maintained throughout the crediting period of the project activity. Using this approach, methane emissions are calculated for all relevant equipment by multiplying the CH4
concentration in the respective stream with the appropriate emission factors. The specific calculation is equation 6 in AM0009. See Section B.6.3 for the formulas and variables. CH4 emissions from transport of the gas in pipelines under the normal operation condition As noted, the pipeline system for the Ovade-Ogharefe project activity is the one to the IPP for marketing of the gas19. Equation 7 from AM0009 is used. No significant emissions are expected from this system. See Section B.6.3 for the formulas and variables. CH4 emissions from transport of the gas in pipelines when accidental event occurred In the event of a pipeline accident, methane will be released to the atmosphere. Again because of the short length of the project pipelines and that they are completely within the concession area thus assuring continuous surveillance, the likelihood of any such accidental leaks are anticipated to be very small20. AM0009 equations 8, 9, and 10 are used to estimate any leakage from this type of event: See Section B.6.3 for the formulas and variables. Baseline Emissions The baseline emissions are those that would occur from the flaring of the associated gas absent this project activity. 19 If the option for reinjection is implemented, emissions from this pipeline will be estimated in exactly the same way. 20 If the option for reinjection is implemented, emissions from this pipeline will be estimated in exactly the same way.
PROJECT DESIGN DOCUMENT FORM (CDM PDD) - Version 03.1. CDM – Executive Board page 27 The Ovade-Ogharefe field utilizes smokeless flares at the flow station where the flaring occurs. Even with such equipment, flaring is often conducted under sub-optimal combustion conditions and part of the gas is not combusted, but released as methane and other volatile gases. However, measurement of the quantity of methane released from flaring is difficult and in this instance not considered significant enough to justify inclusion. Hence, for the purpose of determining baseline emissions, it is assumed that all carbon in the gas is converted into carbon dioxide. This is a conservative estimate. As all flaring is done at the oil flow station, the reduction in gas flaring is quite straightforward. The mass of carbon in the gas leaving the flow station via the gas pipeline is equivalent to the carbon that would have been released as CO2 through flaring of wet gas absent this project activity. The calculation is based on equation 11 in AM0009. See Section B.6.3 for the formulas and variables. Leakage As noted in AM0009, three categories of leakage can typically occur with gas-flare reduction projects:
• CO2 emissions due to fuel combustion for transport and processing of the gas, where the transport and processing of the gas is not under control of project participants;
• CH4 and CO2 emissions from leaks, venting and flaring during transport and processing of recovered gas, where the transport and processing is not under control of project participants, and
• Changes in CO2 emissions due to the substitution of fuels or additional fuel consumption at end-users, where these effects occur.
Concerning the first category, all significant infrastructure related to transport and processing of the gas is under the control of the project participants and therefore fully captured in the project emissions described previously. Concerning the second category, the dry gas is injected into a gas transmission line to the IPP. The natural gas for sale to the IPP will be connected to the existing Nigerian Gas Company (NGC) grid, located approximately one (1) km from the facility. This will be a seamless pipe that will be welded and thus no flanges will exist. The pressure for the compression of the gas for transport is located within the project boundaries and thus is counted in project emissions. Once the gas enters the NGC grid, it is transported approximately 35 km where it is consumed at an IPP. There is no known reason for an increase in emissions by NGC in this existing infrastructure. Leakage is not expected to be significant. No appreciable effects for end-user substitution of natural gas are anticipated. The majority of natural gas used in Nigeria is for electrical generation and inter-fuel competition is limited. To the degree that inter-fuel competition occurs it is for diesel fuel for electrical generation. Therefore any inter-fuel competition that did occurred via improved gas supply from the grid would be positive – i.e. the gas would substitute for a higher-carbon diesel and therefore CO2 emissions would be reduced. One area of positive leakage for the project relates to the substitution of dry gas for wet gas for on-site fuel of the oil flow station in Phase 2. Currently, and absent this project activity, wet gas would be used for on-site fuel, while with this project activity, dry gas will be used. As average content of carbon of dry gas is estimated at 0.0139 kgC/MJ versus 0.0144 kgC/MJ for wet gas, thus the project activity allows for
PROJECT DESIGN DOCUMENT FORM (CDM PDD) - Version 03.1. CDM – Executive Board page 28 the substitution of a lower carbon fuel at the oil flow station. However in the interest of conservatism, this improvement in carbon emissions is not counted. Concerning LPG, at this time it is anticipated that all would be sold into the national and international markets. As the volume of LPG supplied from this project activity is not significant in relation to the market size, no demand or supply impacts are anticipated. While not included in the methodology, LPG transported and consumed outside the boundary, this is most likely results in lower GHG emissions. There are three factors by which the LPG produced by the project activity lowers the GHG emissions:
1. The structure of the LPG supply in Nigeria is such that while LPG is produced by the NGL plants associated with LNG production, this LPG is destined for export, not domestic use. For domestic needs, there is a shortage of LPG and Nigeria imports LPG to meet these needs21. While import statistics are not yet available, it is likely that imports have further increased due to the ending of import duties on LPG in 200722.
Imported LPG, due to the carbon emissions from its much longer international transport and its loading and offloading, entail higher CO2 emissions related to logistics per ton than LPG domestically produced LPG. The Pan Ocean project as a domestic source will have lower transport related CO2 emissions than that of the replaced imported supplies.
2. Currently transport of LPG domestically in Nigeria is by a combination of costal tanker and road23 (usually both modes in that it is first by costal tanker to an intermediate depot site and then road to the final site). There is no known reason to believe that CO2 emissions by river tanker are any higher than that by costal tanker. Further supply of LPG from the project to the local Warri market, planned by a third-party LPG company will reduce the amount of LPG that currently enters the region by truck (the highest CO2 emission part of the logistics chain).
3. If the security situation improves to where an LPG pipeline can be built in the future, this will
result in even lower carbon related transport emissions than by river transport. 4. Nigeria has one of the lowest per-capita uses of home use LPG in Africa. Further the World
Bank/ESMAP study shows that kerosene tends to be used due to the shortage and cost of LPG and that increases in LPG supply would encourage users to shift from kerosene to LPG24. In that LPG has a carbon coefficient of 16.99 million metric tons/quadrillion energy units versus 19.72 for kerosene25, end-use switching from kerosene to LPG reduces carbon emissions by 13.85%.
21 “Nigerian LP Gas Sector Improvement Report”, World Bank/Energy Sector Management Assistance Program (ESMAP), March 2004, page ix; TDA Press Release http://abuja.usembassy.gov/pr_07122005.html 22 Daily Triumph, 29 March 2007. 23 World Bank/ESMAP, op cite, page 41-42 24 World Bank/ESMAP, op cite, pg 53-66 25 United States Energy Information Agency, http://www.eia.doe.gov/oiaf/1605/archive/gg00rpt/tblb1.html
PROJECT DESIGN DOCUMENT FORM (CDM PDD) - Version 03.1. CDM – Executive Board page 29
Since the large majority of LPG produced by the Pan Ocean project is destined for the national market and partly replaces kerosene there will be a clear reduction in GHG emissions. It should be noted that it is Nigerian Government policy to support such a shift26.
In summary, the four known factors concerning CO2 emissions outside the boundary from the LPG produced by the project activity will lead to lower CO2 emissions than absent the project. In the interest of conservatism and the difficulty in measurement, the project developer does not claim credit for this positive leakage. Further it should be noted that the increased domestic supply and use is a clear development priority of the Nigerian Government. Based on this discussion, no significant leakage is anticipated from this project activity. Indeed should leakage occur, it is likely to be positive, not negative, by reducing GHG emissions. Utilizing the principle of conservatism, the leakage for this project activity is estimated at zero. Emission Reductions Based on the forgoing discussion, the emission reductions for the project are straightforward and equal to the Baseline Emissions minus all Project Related Emissions and Leakage – all being converted to tons of CO2 equivalent. As explained, leakage is assumed to be zero. Equation number 12 in AM0009 is used. See Section B.6.3 for the formulas and variables.
26 World Bank/ESMAP, op cite, page 7-11, Statement by Energy Minister in “Daily Triumph, 29 March 2007
PROJECT DESIGN DOCUMENT FORM (CDM PDD) - Version 03.1. CDM – Executive Board page 30
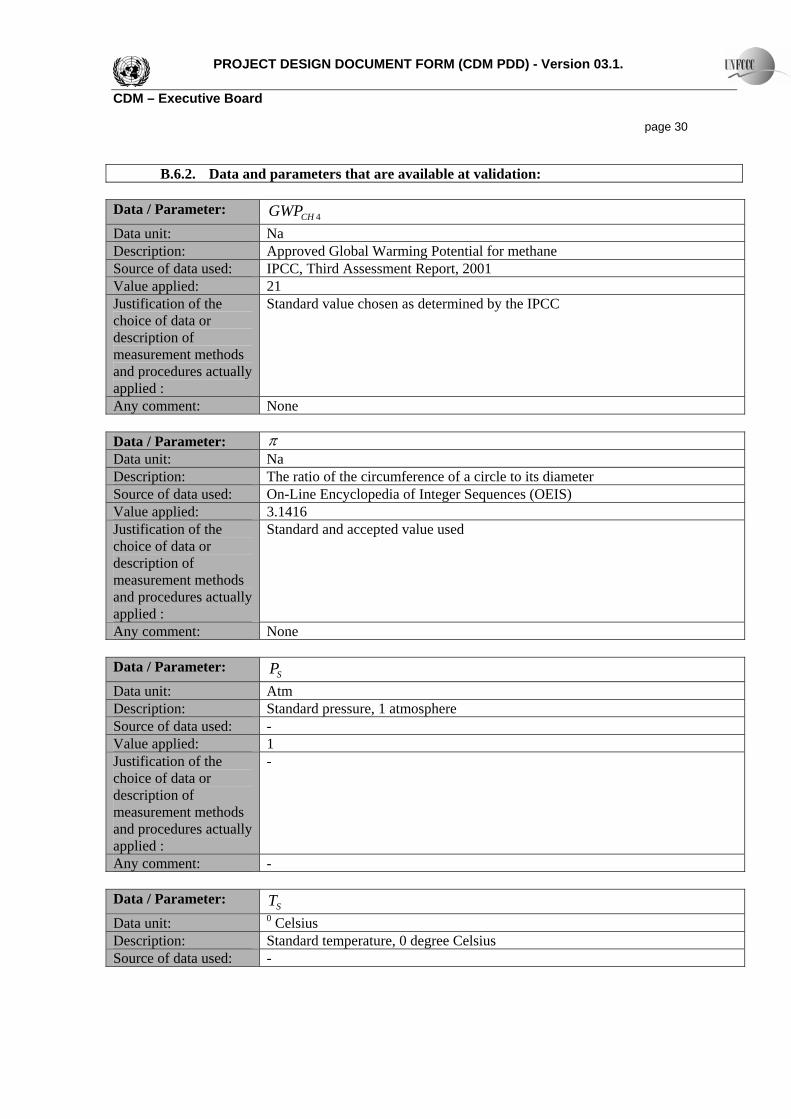
B.6.2. Data and parameters that are available at validation: Data / Parameter: 4CHGWP Data unit: Na Description: Approved Global Warming Potential for methane Source of data used: IPCC, Third Assessment Report, 2001 Value applied: 21 Justification of the choice of data or description of measurement methods and procedures actually applied :
Standard value chosen as determined by the IPCC
Any comment: None
Data / Parameter: π Data unit: Na Description: The ratio of the circumference of a circle to its diameter Source of data used: On-Line Encyclopedia of Integer Sequences (OEIS) Value applied: 3.1416 Justification of the choice of data or description of measurement methods and procedures actually applied :
Standard and accepted value used
Any comment: None Data / Parameter: SP Data unit: Atm Description: Standard pressure, 1 atmosphere Source of data used: - Value applied: 1 Justification of the choice of data or description of measurement methods and procedures actually applied :
-
Any comment: - Data / Parameter: ST Data unit: 0 Celsius Description: Standard temperature, 0 degree Celsius Source of data used: -

PROJECT DESIGN DOCUMENT FORM (CDM PDD) - Version 03.1. CDM – Executive Board page 31 Value applied: 0 Justification of the choice of data or description of measurement methods and procedures actually applied :
-
Any comment: - B.6.3 Ex-ante calculation of emission reductions:
>> This section contains description of formulae used to estimate project emissions (for each gas, source, formulae/algorithm, emission units of CO2e). Ex-ante estimates for most parameters are applied to calculate the baseline and project emissions. Project emissions The calculation of four distinct sources of project emissions is presented below. CO2 Emissions The calculation of CO2 emissions from on-site fuel combustion, leaks, flaring and venting during transport and processing of recovered gas are calculated by equations 1, 2, 3, and 4 in AM0009.
(1) 1000
11244)( ,,,,,,
,,,,
,,,,2 ⋅⋅−+⋅
+= yBcarbonyXcarbonyAcarbon
yXcarbonyAcarbon
yAcarbonygasCO mmm
mmm
PE
With: (2) yAcarbonyAyAcarbon wVm ,,,,, ⋅=
(3) yBLPGcarbonyBLPGyBgasdrycarbonyBgasdryByBcarbon wmwVm ,,,,,,,,,,,,, ⋅+⋅= −−
yBcondensatecarbonyBcondensate wm ,,,,, ⋅+
(4) ∑ ⋅=i
yXicarbonyXiyXcarbon wVm ,,,,,
Where:
ygasCOPE ,,2 CO2 emissions from the project activity due to combustion, flaring or venting of recovered gas during the period y, in tons of CO2
yAcarbonm ,, Quantity of carbon in the recovered gas from the project area at point A in Figure 3 during the period y, in kg C
yBcarbonm ,, Quantity of carbon in the products (dry gas, LPG, condensate) leaving the gas processing plant at point B in Figure 3 during the period y, in kg C
PROJECT DESIGN DOCUMENT FORM (CDM PDD) - Version 03.1. CDM – Executive Board page 32
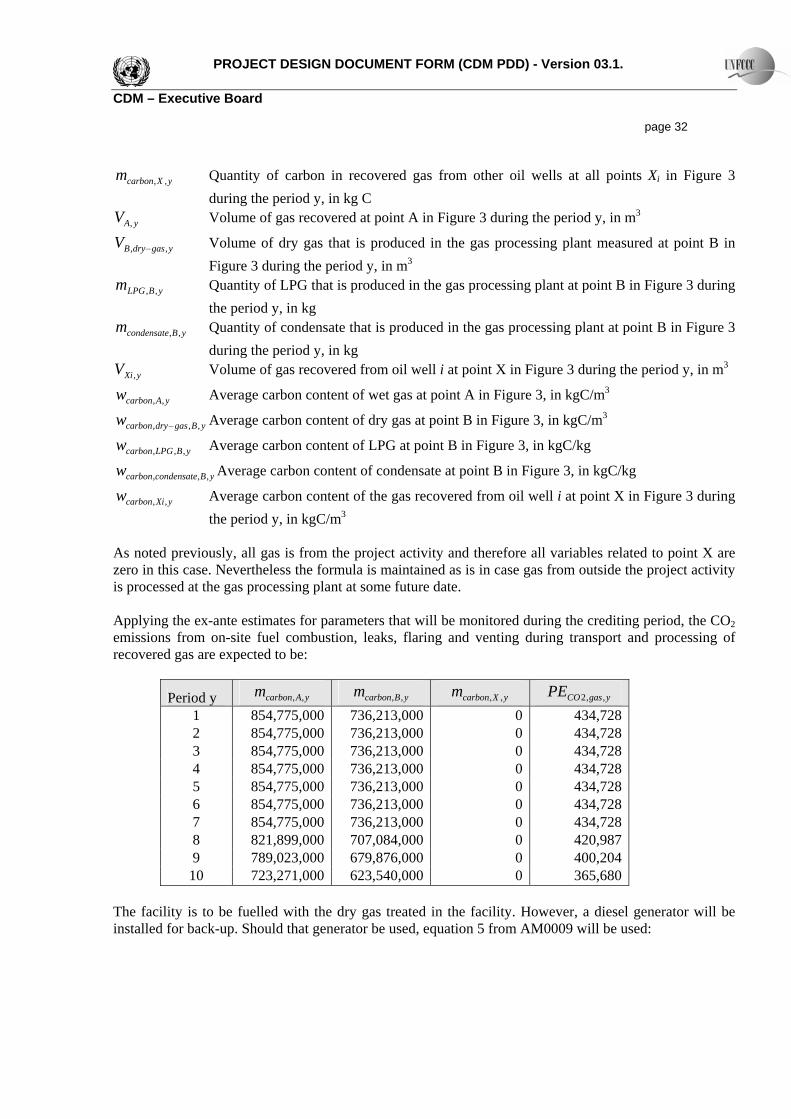
yXcarbonm ,, Quantity of carbon in recovered gas from other oil wells at all points Xi in Figure 3 during the period y, in kg C
yAV , Volume of gas recovered at point A in Figure 3 during the period y, in m3
ygasdryBV ,, − Volume of dry gas that is produced in the gas processing plant measured at point B in Figure 3 during the period y, in m3
yBLPGm ,, Quantity of LPG that is produced in the gas processing plant at point B in Figure 3 during the period y, in kg
yBcondensatem ,, Quantity of condensate that is produced in the gas processing plant at point B in Figure 3 during the period y, in kg
yXiV , Volume of gas recovered from oil well i at point X in Figure 3 during the period y, in m3
yAcarbonw ,, Average carbon content of wet gas at point A in Figure 3, in kgC/m3
yBgasdrycarbonw ,,, − Average carbon content of dry gas at point B in Figure 3, in kgC/m3
yBLPGcarbonw ,,, Average carbon content of LPG at point B in Figure 3, in kgC/kg
yBcondensatecarbonw ,,, Average carbon content of condensate at point B in Figure 3, in kgC/kg
yXicarbonw ,, Average carbon content of the gas recovered from oil well i at point X in Figure 3 during the period y, in kgC/m3
As noted previously, all gas is from the project activity and therefore all variables related to point X are zero in this case. Nevertheless the formula is maintained as is in case gas from outside the project activity is processed at the gas processing plant at some future date. Applying the ex-ante estimates for parameters that will be monitored during the crediting period, the CO2 emissions from on-site fuel combustion, leaks, flaring and venting during transport and processing of recovered gas are expected to be:
Period y yAcarbonm ,, yBcarbonm ,, yXcarbonm ,, ygasCOPE ,,2 1 854,775,000 736,213,000 0 434,728 2 854,775,000 736,213,000 0 434,728 3 854,775,000 736,213,000 0 434,728 4 854,775,000 736,213,000 0 434,728 5 854,775,000 736,213,000 0 434,728 6 854,775,000 736,213,000 0 434,728 7 854,775,000 736,213,000 0 434,728 8 821,899,000 707,084,000 0 420,987 9 789,023,000 679,876,000 0 400,204
10 723,271,000 623,540,000 0 365,680 The facility is to be fuelled with the dry gas treated in the facility. However, a diesel generator will be installed for back-up. Should that generator be used, equation 5 from AM0009 will be used:
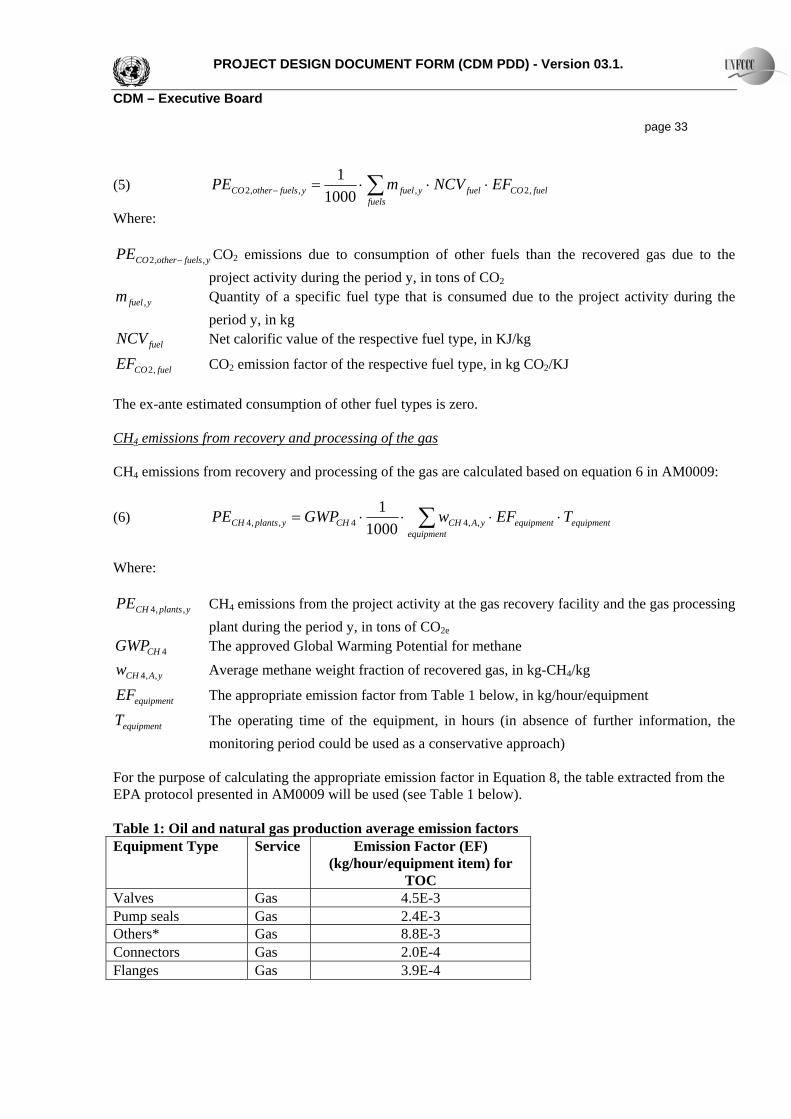
PROJECT DESIGN DOCUMENT FORM (CDM PDD) - Version 03.1. CDM – Executive Board page 33
(5) ∑ ⋅⋅⋅=−fuels
fuelCOfuelyfuelyfuelsotherCO EFNCVmPE ,2,,,2 10001
Where:
yfuelsotherCOPE ,,2 − CO2 emissions due to consumption of other fuels than the recovered gas due to the project activity during the period y, in tons of CO2
yfuelm , Quantity of a specific fuel type that is consumed due to the project activity during the period y, in kg
fuelNCV Net calorific value of the respective fuel type, in KJ/kg
fuelCOEF ,2 CO2 emission factor of the respective fuel type, in kg CO2/KJ The ex-ante estimated consumption of other fuel types is zero. CH4 emissions from recovery and processing of the gas CH4 emissions from recovery and processing of the gas are calculated based on equation 6 in AM0009:
(6) ∑ ⋅⋅⋅⋅=equipment
equipmentequipmentyACHCHyplantsCH TEFwGWPPE ,,44,,4 10001
Where:
yplantsCHPE ,,4 CH4 emissions from the project activity at the gas recovery facility and the gas processing plant during the period y, in tons of CO2e
4CHGWP The approved Global Warming Potential for methane
yACHw ,,4 Average methane weight fraction of recovered gas, in kg-CH4/kg
equipmentEF The appropriate emission factor from Table 1 below, in kg/hour/equipment
equipmentT The operating time of the equipment, in hours (in absence of further information, the monitoring period could be used as a conservative approach)
For the purpose of calculating the appropriate emission factor in Equation 8, the table extracted from the EPA protocol presented in AM0009 will be used (see Table 1 below). Table 1: Oil and natural gas production average emission factors Equipment Type Service Emission Factor (EF)
(kg/hour/equipment item) for TOC
Valves Gas 4.5E-3 Pump seals Gas 2.4E-3 Others* Gas 8.8E-3 Connectors Gas 2.0E-4 Flanges Gas 3.9E-4
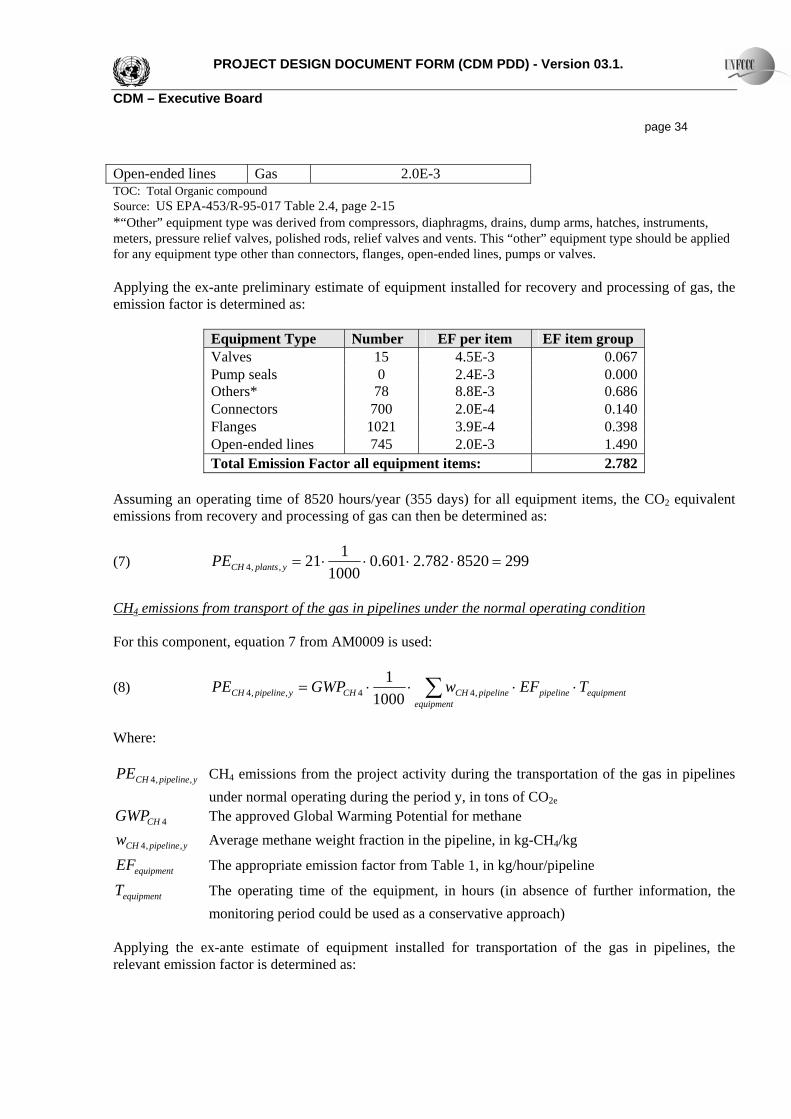
PROJECT DESIGN DOCUMENT FORM (CDM PDD) - Version 03.1. CDM – Executive Board page 34 Open-ended lines Gas 2.0E-3 TOC: Total Organic compound Source: US EPA-453/R-95-017 Table 2.4, page 2-15 *“Other” equipment type was derived from compressors, diaphragms, drains, dump arms, hatches, instruments, meters, pressure relief valves, polished rods, relief valves and vents. This “other” equipment type should be applied for any equipment type other than connectors, flanges, open-ended lines, pumps or valves. Applying the ex-ante preliminary estimate of equipment installed for recovery and processing of gas, the emission factor is determined as:
Equipment Type Number EF per item EF item group Valves 15 4.5E-3 0.067 Pump seals 0 2.4E-3 0.000 Others* 78 8.8E-3 0.686 Connectors 700 2.0E-4 0.140 Flanges 1021 3.9E-4 0.398 Open-ended lines 745 2.0E-3 1.490 Total Emission Factor all equipment items: 2.782
Assuming an operating time of 8520 hours/year (355 days) for all equipment items, the CO2 equivalent emissions from recovery and processing of gas can then be determined as:
(7) 2998520782.2601.01000
121,,4 =⋅⋅⋅⋅=yplantsCHPE
CH4 emissions from transport of the gas in pipelines under the normal operating condition For this component, equation 7 from AM0009 is used:
(8) ∑ ⋅⋅⋅⋅=equipment
equipmentpipelinepipelineCHCHypipelineCH TEFwGWPPE ,44,,4 10001
Where:
ypipelineCHPE ,,4 CH4 emissions from the project activity during the transportation of the gas in pipelines under normal operating during the period y, in tons of CO2e
4CHGWP The approved Global Warming Potential for methane
ypipelineCHw ,,4 Average methane weight fraction in the pipeline, in kg-CH4/kg
equipmentEF The appropriate emission factor from Table 1, in kg/hour/pipeline
equipmentT The operating time of the equipment, in hours (in absence of further information, the monitoring period could be used as a conservative approach)
Applying the ex-ante estimate of equipment installed for transportation of the gas in pipelines, the relevant emission factor is determined as:
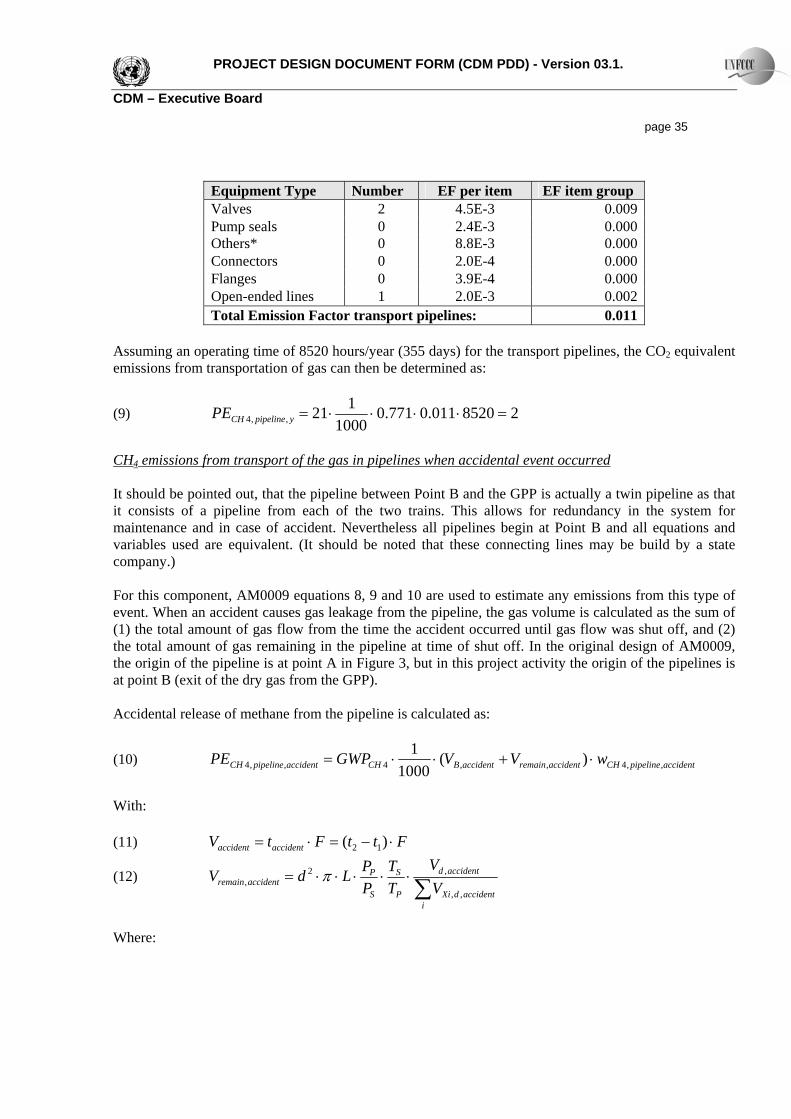
PROJECT DESIGN DOCUMENT FORM (CDM PDD) - Version 03.1. CDM – Executive Board page 35
Equipment Type Number EF per item EF item group Valves 2 4.5E-3 0.009 Pump seals 0 2.4E-3 0.000 Others* 0 8.8E-3 0.000 Connectors 0 2.0E-4 0.000 Flanges 0 3.9E-4 0.000 Open-ended lines 1 2.0E-3 0.002 Total Emission Factor transport pipelines: 0.011
Assuming an operating time of 8520 hours/year (355 days) for the transport pipelines, the CO2 equivalent emissions from transportation of gas can then be determined as:
(9) 28520011.0771.01000
121,,4 =⋅⋅⋅⋅=ypipelineCHPE
CH4 emissions from transport of the gas in pipelines when accidental event occurred It should be pointed out, that the pipeline between Point B and the GPP is actually a twin pipeline as that it consists of a pipeline from each of the two trains. This allows for redundancy in the system for maintenance and in case of accident. Nevertheless all pipelines begin at Point B and all equations and variables used are equivalent. (It should be noted that these connecting lines may be build by a state company.) For this component, AM0009 equations 8, 9 and 10 are used to estimate any emissions from this type of event. When an accident causes gas leakage from the pipeline, the gas volume is calculated as the sum of (1) the total amount of gas flow from the time the accident occurred until gas flow was shut off, and (2) the total amount of gas remaining in the pipeline at time of shut off. In the original design of AM0009, the origin of the pipeline is at point A in Figure 3, but in this project activity the origin of the pipelines is at point B (exit of the dry gas from the GPP). Accidental release of methane from the pipeline is calculated as:
(10) accidentpipelineCHaccidentremainaccidentBCHaccidentpipelineCH wVVGWPPE ,,4,,4,,4 )(1000
1⋅+⋅⋅=
With: (11) FttFtV accidentaccident ⋅−=⋅= )( 12
(12) ∑⋅⋅⋅⋅⋅=
iaccidentdXi
accidentd
P
S
S
Paccidentremain V
VTT
PPLdV
,,
,2, π
Where:
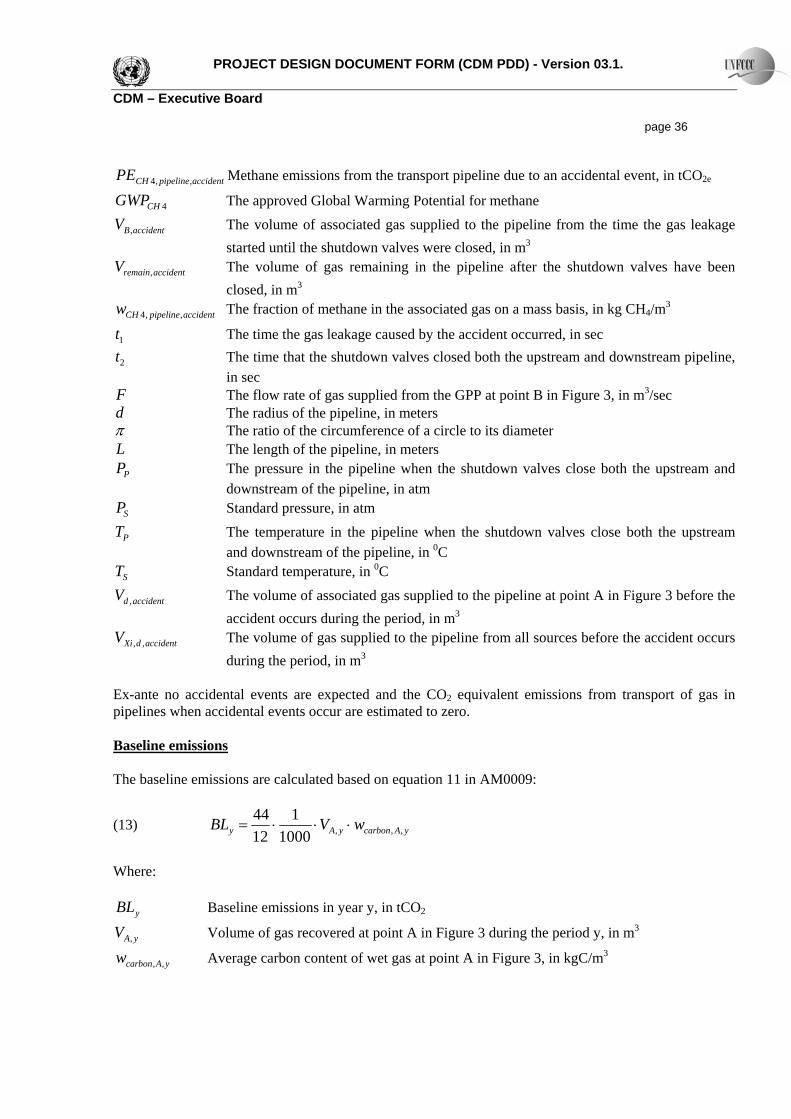
PROJECT DESIGN DOCUMENT FORM (CDM PDD) - Version 03.1. CDM – Executive Board page 36
accidentpipelineCHPE ,,4 Methane emissions from the transport pipeline due to an accidental event, in tCO2e
4CHGWP The approved Global Warming Potential for methane
accidentBV , The volume of associated gas supplied to the pipeline from the time the gas leakage started until the shutdown valves were closed, in m3
accidentremainV , The volume of gas remaining in the pipeline after the shutdown valves have been closed, in m3
accidentpipelineCHw ,,4 The fraction of methane in the associated gas on a mass basis, in kg CH4/m3
1t The time the gas leakage caused by the accident occurred, in sec
2t The time that the shutdown valves closed both the upstream and downstream pipeline, in sec
F The flow rate of gas supplied from the GPP at point B in Figure 3, in m3/sec d The radius of the pipeline, in meters π The ratio of the circumference of a circle to its diameter L The length of the pipeline, in meters
PP The pressure in the pipeline when the shutdown valves close both the upstream and downstream of the pipeline, in atm
SP Standard pressure, in atm
PT The temperature in the pipeline when the shutdown valves close both the upstream and downstream of the pipeline, in 0C
ST Standard temperature, in 0C
accidentdV , The volume of associated gas supplied to the pipeline at point A in Figure 3 before the accident occurs during the period, in m3
accidentdXiV ,, The volume of gas supplied to the pipeline from all sources before the accident occurs during the period, in m3
Ex-ante no accidental events are expected and the CO2 equivalent emissions from transport of gas in pipelines when accidental events occur are estimated to zero. Baseline emissions The baseline emissions are calculated based on equation 11 in AM0009:
(13) yAcarbonyAy wVBL ,,,10001
1244
⋅⋅⋅=
Where:
yBL Baseline emissions in year y, in tCO2
yAV , Volume of gas recovered at point A in Figure 3 during the period y, in m3
yAcarbonw ,, Average carbon content of wet gas at point A in Figure 3, in kgC/m3
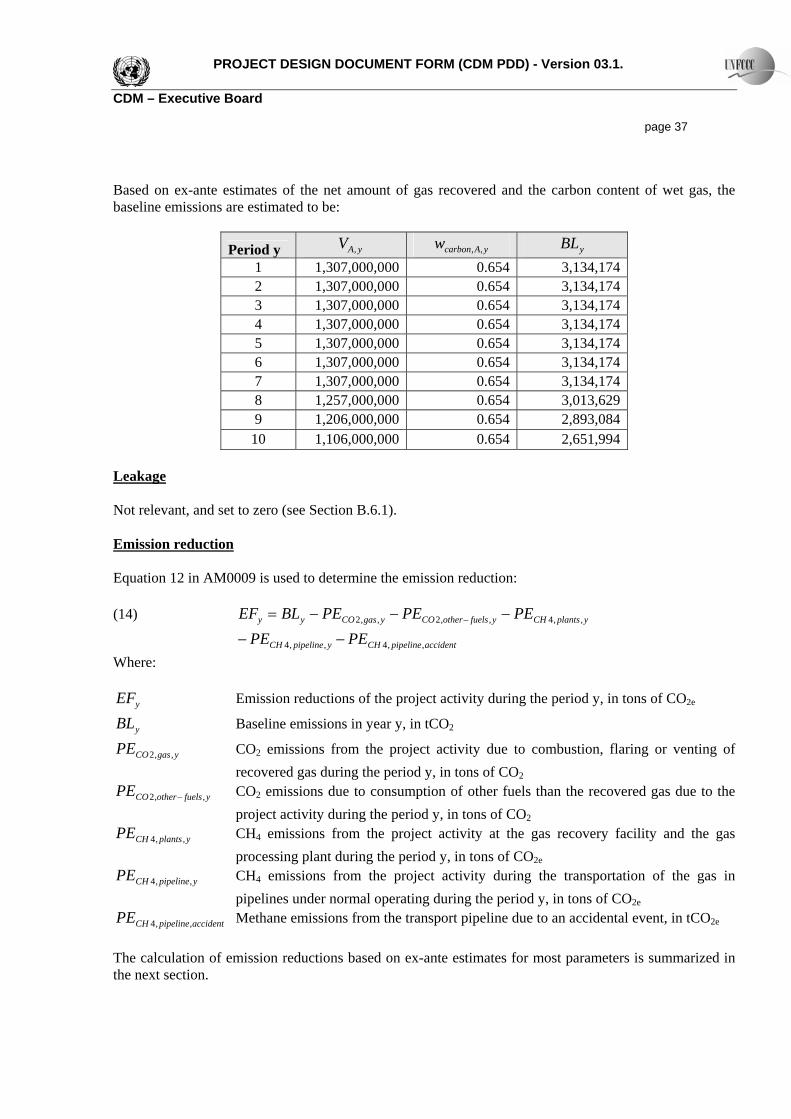
PROJECT DESIGN DOCUMENT FORM (CDM PDD) - Version 03.1. CDM – Executive Board page 37 Based on ex-ante estimates of the net amount of gas recovered and the carbon content of wet gas, the baseline emissions are estimated to be:
Period y yAV , yAcarbonw ,, yBL 1 1,307,000,000 0.654 3,134,174 2 1,307,000,000 0.654 3,134,174 3 1,307,000,000 0.654 3,134,174 4 1,307,000,000 0.654 3,134,174 5 1,307,000,000 0.654 3,134,174 6 1,307,000,000 0.654 3,134,174 7 1,307,000,000 0.654 3,134,174 8 1,257,000,000 0.654 3,013,629 9 1,206,000,000 0.654 2,893,084
10 1,106,000,000 0.654 2,651,994 Leakage Not relevant, and set to zero (see Section B.6.1). Emission reduction Equation 12 in AM0009 is used to determine the emission reduction: (14) yplantsCHyfuelsotherCOygasCOyy PEPEPEBLEF ,,4,,2,,2 −−−= −
accidentpipelineCHypipelineCH PEPE ,,4,,4 −− Where:
yEF Emission reductions of the project activity during the period y, in tons of CO2e
yBL Baseline emissions in year y, in tCO2
ygasCOPE ,,2 CO2 emissions from the project activity due to combustion, flaring or venting of recovered gas during the period y, in tons of CO2
yfuelsotherCOPE ,,2 − CO2 emissions due to consumption of other fuels than the recovered gas due to the project activity during the period y, in tons of CO2
yplantsCHPE ,,4 CH4 emissions from the project activity at the gas recovery facility and the gas processing plant during the period y, in tons of CO2e
ypipelineCHPE ,,4 CH4 emissions from the project activity during the transportation of the gas in pipelines under normal operating during the period y, in tons of CO2e
accidentpipelineCHPE ,,4 Methane emissions from the transport pipeline due to an accidental event, in tCO2e The calculation of emission reductions based on ex-ante estimates for most parameters is summarized in the next section.
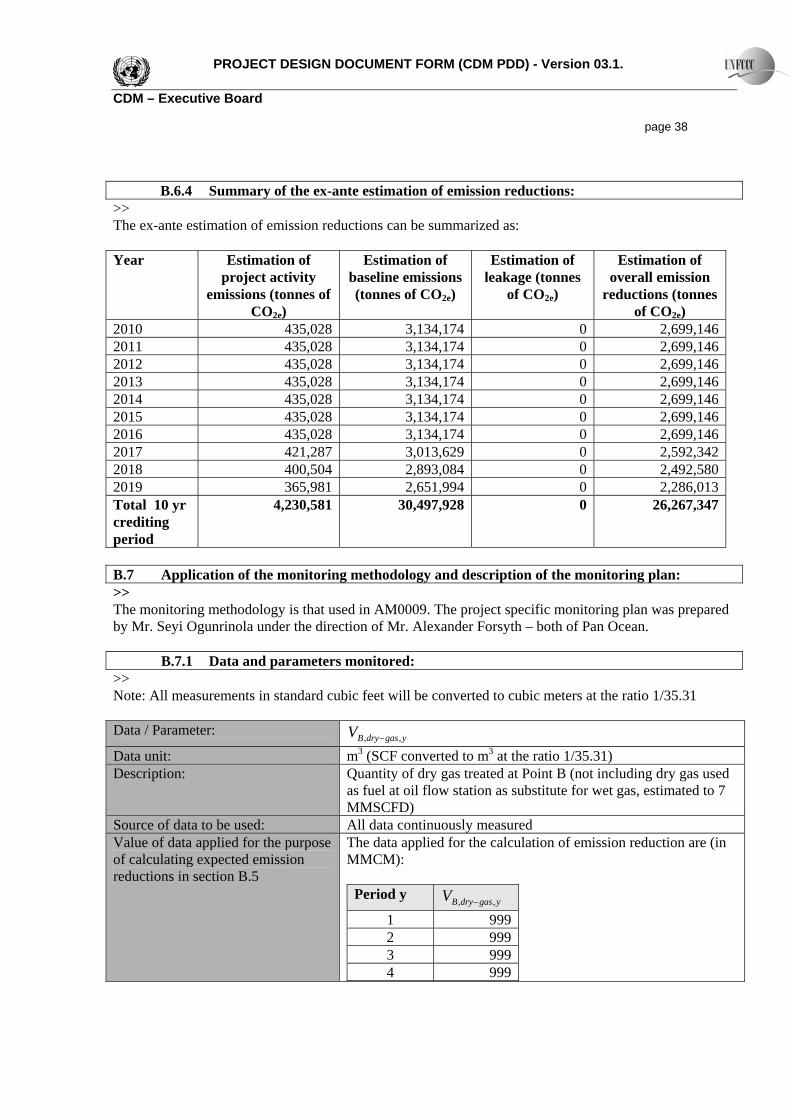
PROJECT DESIGN DOCUMENT FORM (CDM PDD) - Version 03.1. CDM – Executive Board page 38
B.6.4 Summary of the ex-ante estimation of emission reductions: >> The ex-ante estimation of emission reductions can be summarized as: Year Estimation of
project activity emissions (tonnes of
CO2e)
Estimation of baseline emissions (tonnes of CO2e)
Estimation of leakage (tonnes
of CO2e)
Estimation of overall emission
reductions (tonnes of CO2e)
2010 435,028 3,134,174 0 2,699,1462011 435,028 3,134,174 0 2,699,1462012 435,028 3,134,174 0 2,699,1462013 435,028 3,134,174 0 2,699,1462014 435,028 3,134,174 0 2,699,1462015 435,028 3,134,174 0 2,699,1462016 435,028 3,134,174 0 2,699,1462017 421,287 3,013,629 0 2,592,3422018 400,504 2,893,084 0 2,492,5802019 365,981 2,651,994 0 2,286,013Total 10 yr crediting period
4,230,581 30,497,928 0 26,267,347
B.7 Application of the monitoring methodology and description of the monitoring plan: >> The monitoring methodology is that used in AM0009. The project specific monitoring plan was prepared by Mr. Seyi Ogunrinola under the direction of Mr. Alexander Forsyth – both of Pan Ocean.
B.7.1 Data and parameters monitored: >> Note: All measurements in standard cubic feet will be converted to cubic meters at the ratio 1/35.31 Data / Parameter:
ygasdryBV ,, − Data unit: m3 (SCF converted to m3 at the ratio 1/35.31) Description: Quantity of dry gas treated at Point B (not including dry gas used
as fuel at oil flow station as substitute for wet gas, estimated to 7 MMSCFD)
Source of data to be used: All data continuously measured Value of data applied for the purpose of calculating expected emission reductions in section B.5
The data applied for the calculation of emission reduction are (in MMCM):
Period y ygasdryBV ,, − 1 9992 9993 9994 999
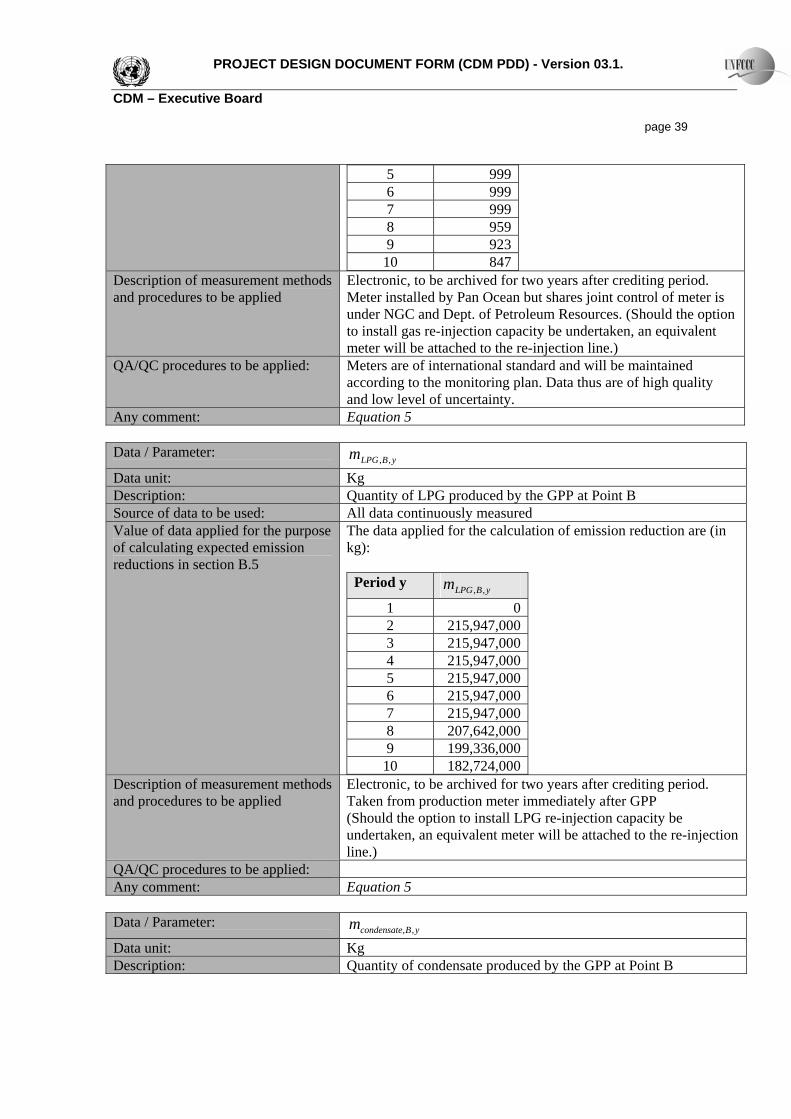
PROJECT DESIGN DOCUMENT FORM (CDM PDD) - Version 03.1. CDM – Executive Board page 39
5 9996 9997 9998 9599 923
10 847 Description of measurement methods and procedures to be applied
Electronic, to be archived for two years after crediting period. Meter installed by Pan Ocean but shares joint control of meter is under NGC and Dept. of Petroleum Resources. (Should the option to install gas re-injection capacity be undertaken, an equivalent meter will be attached to the re-injection line.)
QA/QC procedures to be applied: Meters are of international standard and will be maintained according to the monitoring plan. Data thus are of high quality and low level of uncertainty.
Any comment: Equation 5 Data / Parameter:
yBLPGm ,, Data unit: Kg Description: Quantity of LPG produced by the GPP at Point B Source of data to be used: All data continuously measured Value of data applied for the purpose of calculating expected emission reductions in section B.5
The data applied for the calculation of emission reduction are (in kg):
Period y yBLPGm ,, 1 02 215,947,0003 215,947,0004 215,947,0005 215,947,0006 215,947,0007 215,947,0008 207,642,0009 199,336,000
10 182,724,000 Description of measurement methods and procedures to be applied
Electronic, to be archived for two years after crediting period. Taken from production meter immediately after GPP (Should the option to install LPG re-injection capacity be undertaken, an equivalent meter will be attached to the re-injection line.)
QA/QC procedures to be applied: Any comment: Equation 5 Data / Parameter:
yBcondensatem ,, Data unit: Kg Description: Quantity of condensate produced by the GPP at Point B
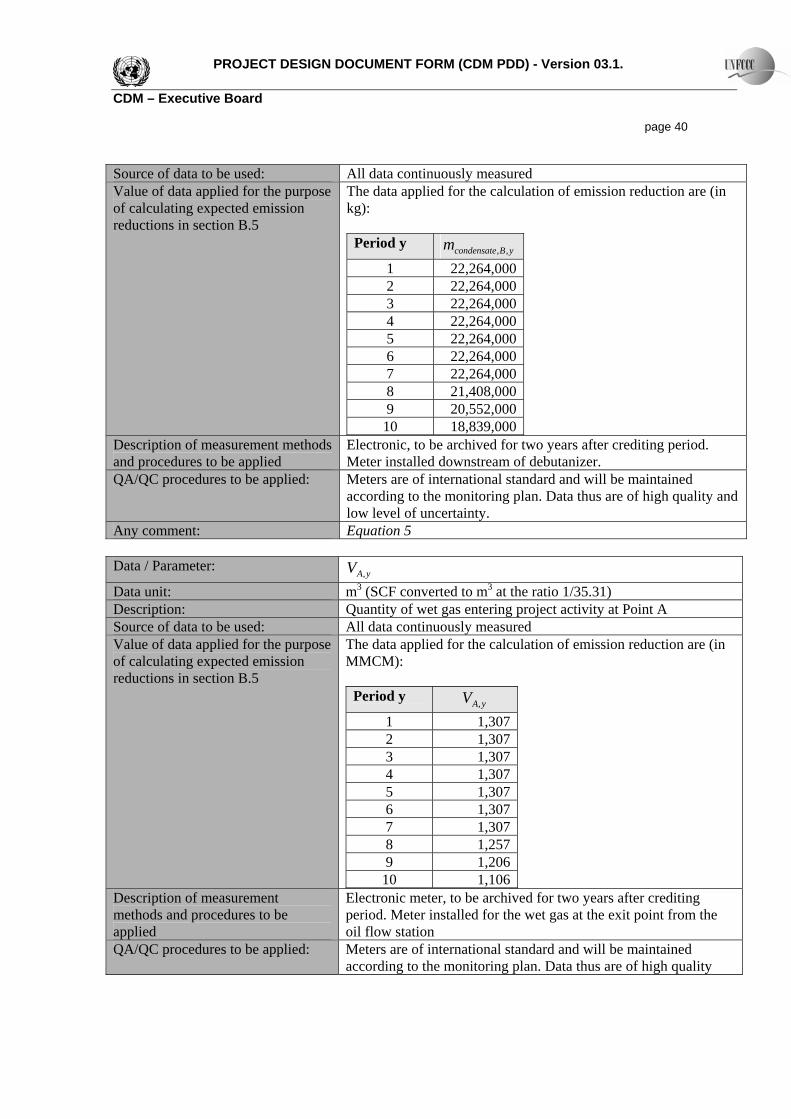
PROJECT DESIGN DOCUMENT FORM (CDM PDD) - Version 03.1. CDM – Executive Board page 40 Source of data to be used: All data continuously measured Value of data applied for the purpose of calculating expected emission reductions in section B.5
The data applied for the calculation of emission reduction are (in kg):
Period y yBcondensatem ,,
1 22,264,0002 22,264,0003 22,264,0004 22,264,0005 22,264,0006 22,264,0007 22,264,0008 21,408,0009 20,552,000
10 18,839,000 Description of measurement methods and procedures to be applied
Electronic, to be archived for two years after crediting period. Meter installed downstream of debutanizer.
QA/QC procedures to be applied: Meters are of international standard and will be maintained according to the monitoring plan. Data thus are of high quality and low level of uncertainty.
Any comment: Equation 5 Data / Parameter:
yAV , Data unit: m3 (SCF converted to m3 at the ratio 1/35.31) Description: Quantity of wet gas entering project activity at Point A Source of data to be used: All data continuously measured Value of data applied for the purpose of calculating expected emission reductions in section B.5
The data applied for the calculation of emission reduction are (in MMCM):
Period y yAV , 1 1,3072 1,3073 1,3074 1,3075 1,3076 1,3077 1,3078 1,2579 1,206
10 1,106 Description of measurement methods and procedures to be applied
Electronic meter, to be archived for two years after crediting period. Meter installed for the wet gas at the exit point from the oil flow station
QA/QC procedures to be applied: Meters are of international standard and will be maintained according to the monitoring plan. Data thus are of high quality
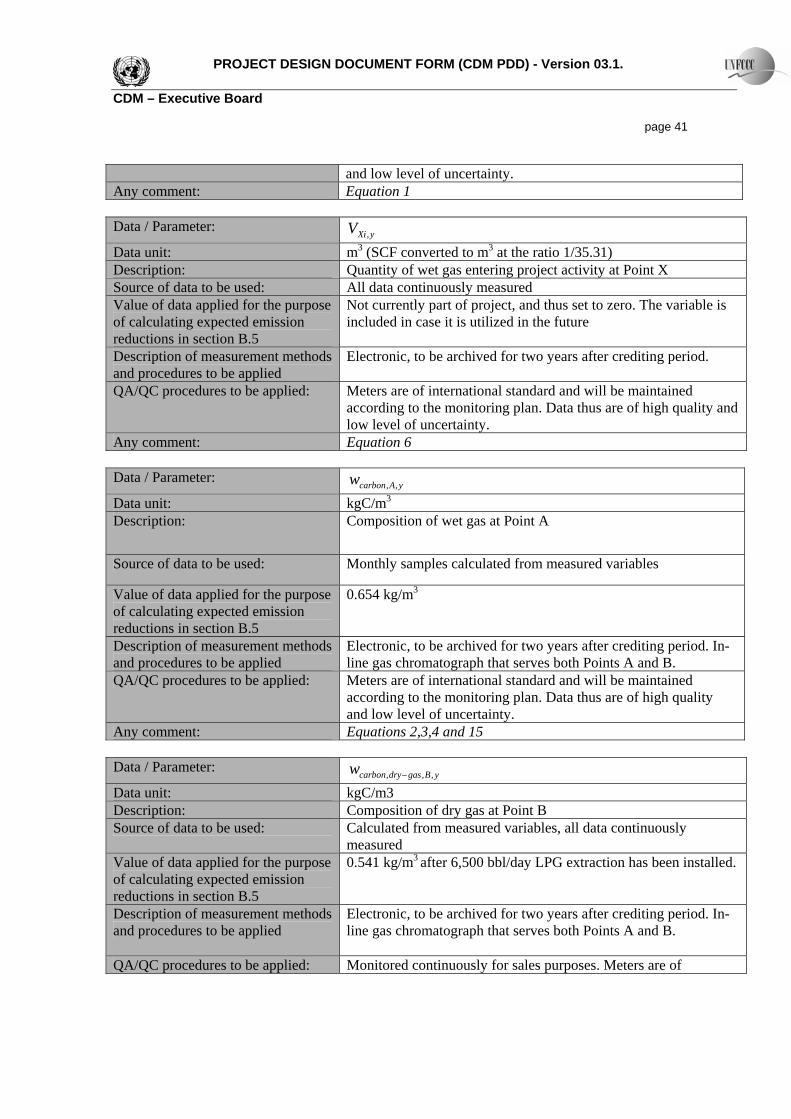
PROJECT DESIGN DOCUMENT FORM (CDM PDD) - Version 03.1. CDM – Executive Board page 41
and low level of uncertainty. Any comment: Equation 1 Data / Parameter:
yXiV , Data unit: m3 (SCF converted to m3 at the ratio 1/35.31) Description: Quantity of wet gas entering project activity at Point X Source of data to be used: All data continuously measured Value of data applied for the purpose of calculating expected emission reductions in section B.5
Not currently part of project, and thus set to zero. The variable is included in case it is utilized in the future
Description of measurement methods and procedures to be applied
Electronic, to be archived for two years after crediting period.
QA/QC procedures to be applied: Meters are of international standard and will be maintained according to the monitoring plan. Data thus are of high quality and low level of uncertainty.
Any comment: Equation 6 Data / Parameter:
yAcarbonw ,, Data unit: kgC/m3 Description: Composition of wet gas at Point A
Source of data to be used: Monthly samples calculated from measured variables
Value of data applied for the purpose of calculating expected emission reductions in section B.5
0.654 kg/m3
Description of measurement methods and procedures to be applied
Electronic, to be archived for two years after crediting period. In-line gas chromatograph that serves both Points A and B.
QA/QC procedures to be applied: Meters are of international standard and will be maintained according to the monitoring plan. Data thus are of high quality and low level of uncertainty.
Any comment: Equations 2,3,4 and 15 Data / Parameter:
yBgasdrycarbonw ,,, − Data unit: kgC/m3 Description: Composition of dry gas at Point B Source of data to be used: Calculated from measured variables, all data continuously
measured Value of data applied for the purpose of calculating expected emission reductions in section B.5
0.541 kg/m3 after 6,500 bbl/day LPG extraction has been installed.
Description of measurement methods and procedures to be applied
Electronic, to be archived for two years after crediting period. In-line gas chromatograph that serves both Points A and B.
QA/QC procedures to be applied: Monitored continuously for sales purposes. Meters are of
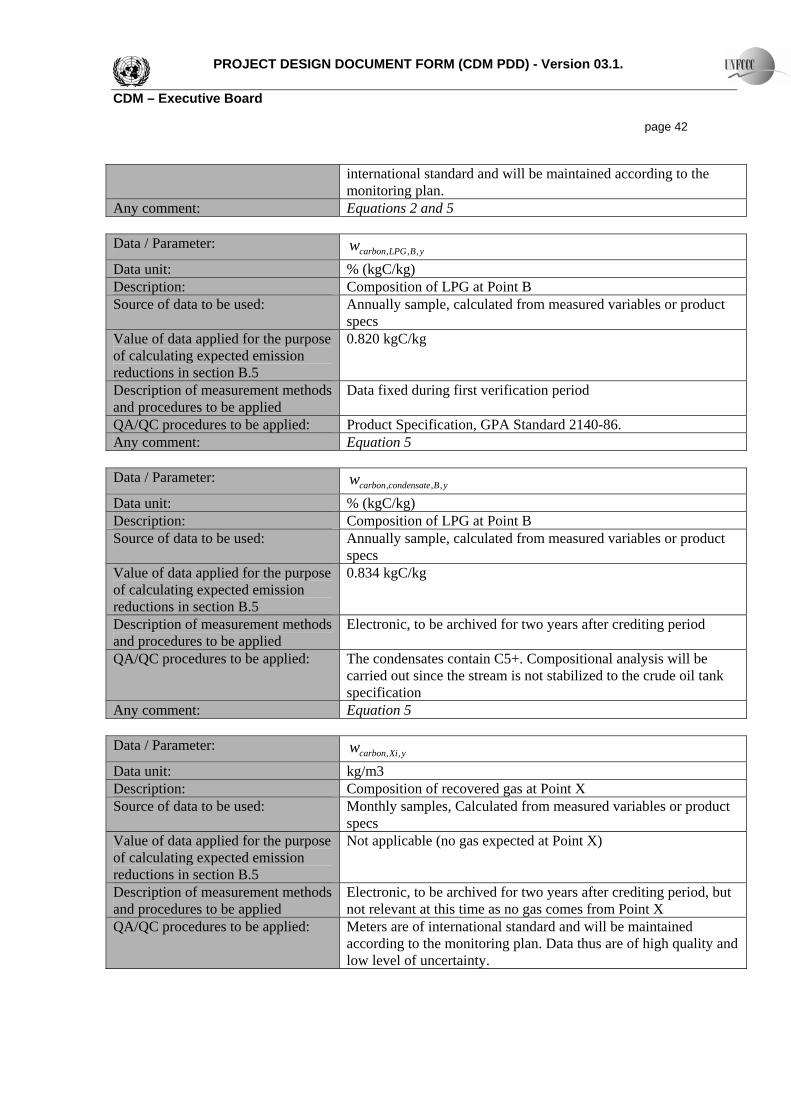
PROJECT DESIGN DOCUMENT FORM (CDM PDD) - Version 03.1. CDM – Executive Board page 42
international standard and will be maintained according to the monitoring plan.
Any comment: Equations 2 and 5 Data / Parameter:
yBLPGcarbonw ,,, Data unit: % (kgC/kg) Description: Composition of LPG at Point B Source of data to be used: Annually sample, calculated from measured variables or product
specs Value of data applied for the purpose of calculating expected emission reductions in section B.5
0.820 kgC/kg
Description of measurement methods and procedures to be applied
Data fixed during first verification period
QA/QC procedures to be applied: Product Specification, GPA Standard 2140-86. Any comment: Equation 5 Data / Parameter:
yBcondensatecarbonw ,,, Data unit: % (kgC/kg) Description: Composition of LPG at Point B Source of data to be used: Annually sample, calculated from measured variables or product
specs Value of data applied for the purpose of calculating expected emission reductions in section B.5
0.834 kgC/kg
Description of measurement methods and procedures to be applied
Electronic, to be archived for two years after crediting period
QA/QC procedures to be applied: The condensates contain C5+. Compositional analysis will be carried out since the stream is not stabilized to the crude oil tank specification
Any comment: Equation 5 Data / Parameter:
yXicarbonw ,, Data unit: kg/m3 Description: Composition of recovered gas at Point X Source of data to be used: Monthly samples, Calculated from measured variables or product
specs Value of data applied for the purpose of calculating expected emission reductions in section B.5
Not applicable (no gas expected at Point X)
Description of measurement methods and procedures to be applied
Electronic, to be archived for two years after crediting period, but not relevant at this time as no gas comes from Point X
QA/QC procedures to be applied: Meters are of international standard and will be maintained according to the monitoring plan. Data thus are of high quality and low level of uncertainty.
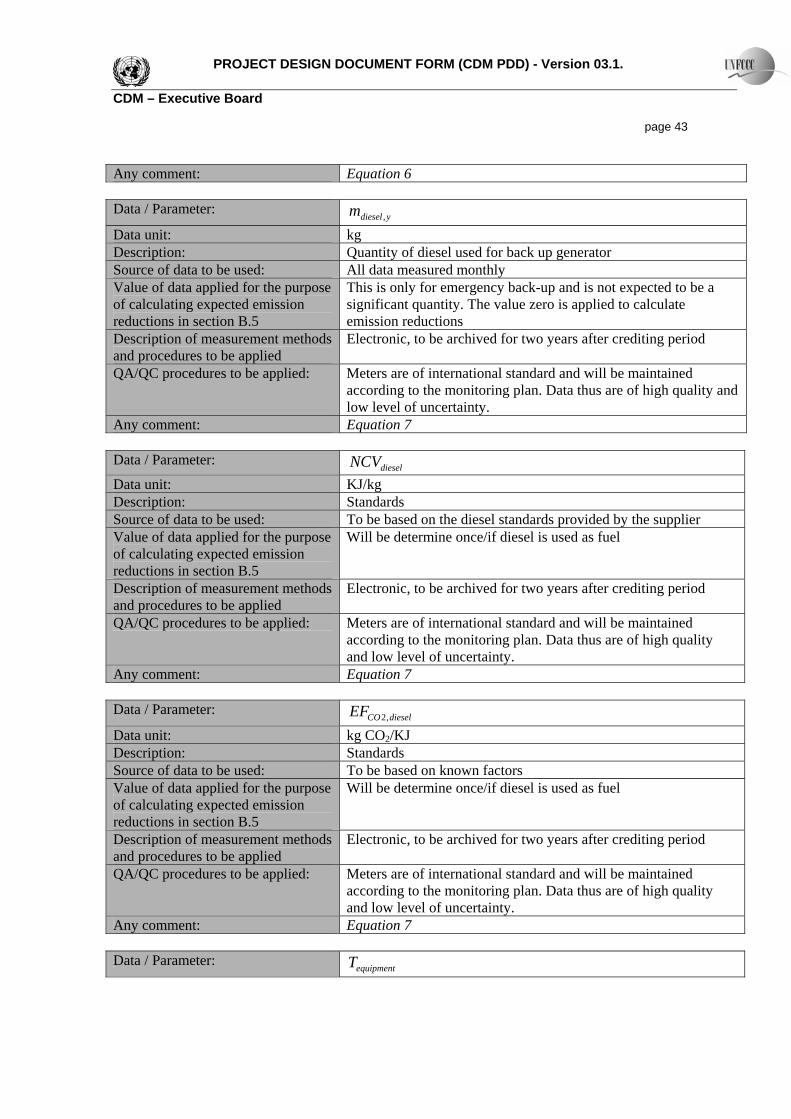
PROJECT DESIGN DOCUMENT FORM (CDM PDD) - Version 03.1. CDM – Executive Board page 43 Any comment: Equation 6 Data / Parameter:
ydieselm , Data unit: kg Description: Quantity of diesel used for back up generator Source of data to be used: All data measured monthly Value of data applied for the purpose of calculating expected emission reductions in section B.5
This is only for emergency back-up and is not expected to be a significant quantity. The value zero is applied to calculate emission reductions
Description of measurement methods and procedures to be applied
Electronic, to be archived for two years after crediting period
QA/QC procedures to be applied: Meters are of international standard and will be maintained according to the monitoring plan. Data thus are of high quality and low level of uncertainty.
Any comment: Equation 7 Data / Parameter:
dieselNCV Data unit: KJ/kg Description: Standards Source of data to be used: To be based on the diesel standards provided by the supplier Value of data applied for the purpose of calculating expected emission reductions in section B.5
Will be determine once/if diesel is used as fuel
Description of measurement methods and procedures to be applied
Electronic, to be archived for two years after crediting period
QA/QC procedures to be applied: Meters are of international standard and will be maintained according to the monitoring plan. Data thus are of high quality and low level of uncertainty.
Any comment: Equation 7 Data / Parameter:
dieselCOEF ,2 Data unit: kg CO2/KJ Description: Standards Source of data to be used: To be based on known factors Value of data applied for the purpose of calculating expected emission reductions in section B.5
Will be determine once/if diesel is used as fuel
Description of measurement methods and procedures to be applied
Electronic, to be archived for two years after crediting period
QA/QC procedures to be applied: Meters are of international standard and will be maintained according to the monitoring plan. Data thus are of high quality and low level of uncertainty.
Any comment: Equation 7 Data / Parameter:
equipmentT
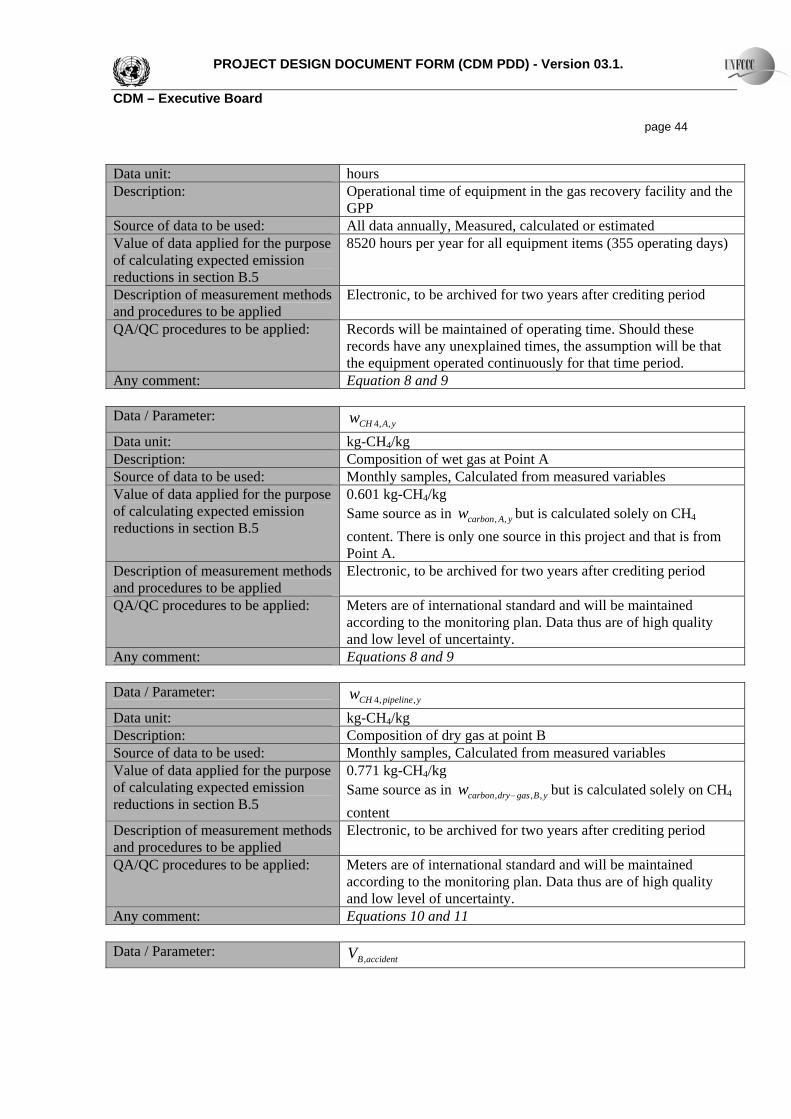
PROJECT DESIGN DOCUMENT FORM (CDM PDD) - Version 03.1. CDM – Executive Board page 44 Data unit: hours Description: Operational time of equipment in the gas recovery facility and the
GPP Source of data to be used: All data annually, Measured, calculated or estimated Value of data applied for the purpose of calculating expected emission reductions in section B.5
8520 hours per year for all equipment items (355 operating days)
Description of measurement methods and procedures to be applied
Electronic, to be archived for two years after crediting period
QA/QC procedures to be applied: Records will be maintained of operating time. Should these records have any unexplained times, the assumption will be that the equipment operated continuously for that time period.
Any comment: Equation 8 and 9 Data / Parameter:
yACHw ,,4 Data unit: kg-CH4/kg Description: Composition of wet gas at Point A Source of data to be used: Monthly samples, Calculated from measured variables Value of data applied for the purpose of calculating expected emission reductions in section B.5
0.601 kg-CH4/kg
Same source as in yAcarbonw ,, but is calculated solely on CH4 content. There is only one source in this project and that is from Point A.
Description of measurement methods and procedures to be applied
Electronic, to be archived for two years after crediting period
QA/QC procedures to be applied: Meters are of international standard and will be maintained according to the monitoring plan. Data thus are of high quality and low level of uncertainty.
Any comment: Equations 8 and 9 Data / Parameter:
ypipelineCHw ,,4 Data unit: kg-CH4/kg Description: Composition of dry gas at point B Source of data to be used: Monthly samples, Calculated from measured variables Value of data applied for the purpose of calculating expected emission reductions in section B.5
0.771 kg-CH4/kg
Same source as in yBgasdrycarbonw ,,, − but is calculated solely on CH4 content
Description of measurement methods and procedures to be applied
Electronic, to be archived for two years after crediting period
QA/QC procedures to be applied: Meters are of international standard and will be maintained according to the monitoring plan. Data thus are of high quality and low level of uncertainty.
Any comment: Equations 10 and 11 Data / Parameter:
accidentBV ,
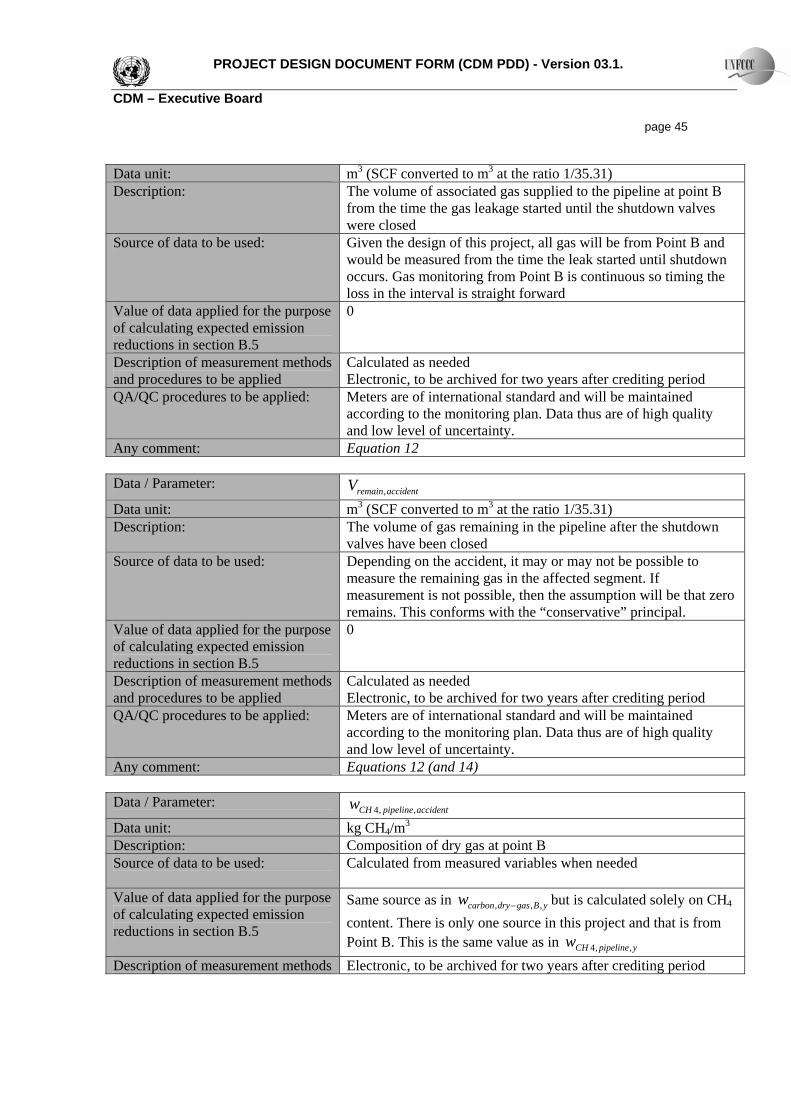
PROJECT DESIGN DOCUMENT FORM (CDM PDD) - Version 03.1. CDM – Executive Board page 45 Data unit: m3 (SCF converted to m3 at the ratio 1/35.31) Description: The volume of associated gas supplied to the pipeline at point B
from the time the gas leakage started until the shutdown valves were closed
Source of data to be used: Given the design of this project, all gas will be from Point B and would be measured from the time the leak started until shutdown occurs. Gas monitoring from Point B is continuous so timing the loss in the interval is straight forward
Value of data applied for the purpose of calculating expected emission reductions in section B.5
0
Description of measurement methods and procedures to be applied
Calculated as needed Electronic, to be archived for two years after crediting period
QA/QC procedures to be applied: Meters are of international standard and will be maintained according to the monitoring plan. Data thus are of high quality and low level of uncertainty.
Any comment: Equation 12 Data / Parameter:
accidentremainV , Data unit: m3 (SCF converted to m3 at the ratio 1/35.31) Description: The volume of gas remaining in the pipeline after the shutdown
valves have been closed Source of data to be used: Depending on the accident, it may or may not be possible to
measure the remaining gas in the affected segment. If measurement is not possible, then the assumption will be that zero remains. This conforms with the “conservative” principal.
Value of data applied for the purpose of calculating expected emission reductions in section B.5
0
Description of measurement methods and procedures to be applied
Calculated as needed Electronic, to be archived for two years after crediting period
QA/QC procedures to be applied: Meters are of international standard and will be maintained according to the monitoring plan. Data thus are of high quality and low level of uncertainty.
Any comment: Equations 12 (and 14) Data / Parameter:
accidentpipelineCHw ,,4 Data unit: kg CH4/m3 Description: Composition of dry gas at point B Source of data to be used: Calculated from measured variables when needed
Value of data applied for the purpose of calculating expected emission reductions in section B.5
Same source as in yBgasdrycarbonw ,,, − but is calculated solely on CH4 content. There is only one source in this project and that is from Point B. This is the same value as in ypipelineCHw ,,4
Description of measurement methods Electronic, to be archived for two years after crediting period
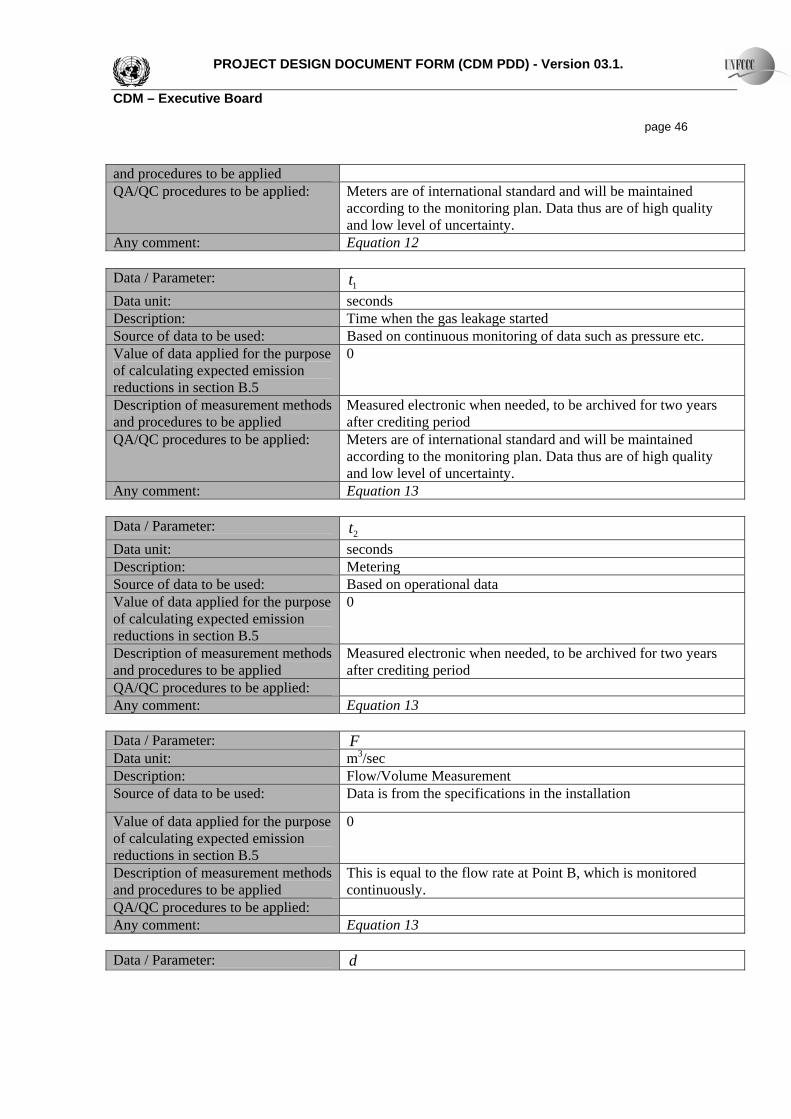
PROJECT DESIGN DOCUMENT FORM (CDM PDD) - Version 03.1. CDM – Executive Board page 46 and procedures to be applied QA/QC procedures to be applied: Meters are of international standard and will be maintained
according to the monitoring plan. Data thus are of high quality and low level of uncertainty.
Any comment: Equation 12 Data / Parameter:
1t Data unit: seconds Description: Time when the gas leakage started Source of data to be used: Based on continuous monitoring of data such as pressure etc. Value of data applied for the purpose of calculating expected emission reductions in section B.5
0
Description of measurement methods and procedures to be applied
Measured electronic when needed, to be archived for two years after crediting period
QA/QC procedures to be applied: Meters are of international standard and will be maintained according to the monitoring plan. Data thus are of high quality and low level of uncertainty.
Any comment: Equation 13 Data / Parameter:
2t Data unit: seconds Description: Metering Source of data to be used: Based on operational data Value of data applied for the purpose of calculating expected emission reductions in section B.5
0
Description of measurement methods and procedures to be applied
Measured electronic when needed, to be archived for two years after crediting period
QA/QC procedures to be applied: Any comment: Equation 13 Data / Parameter: F Data unit: m3/sec Description: Flow/Volume Measurement Source of data to be used: Data is from the specifications in the installation
Value of data applied for the purpose of calculating expected emission reductions in section B.5
0
Description of measurement methods and procedures to be applied
This is equal to the flow rate at Point B, which is monitored continuously.
QA/QC procedures to be applied: Any comment: Equation 13 Data / Parameter: d
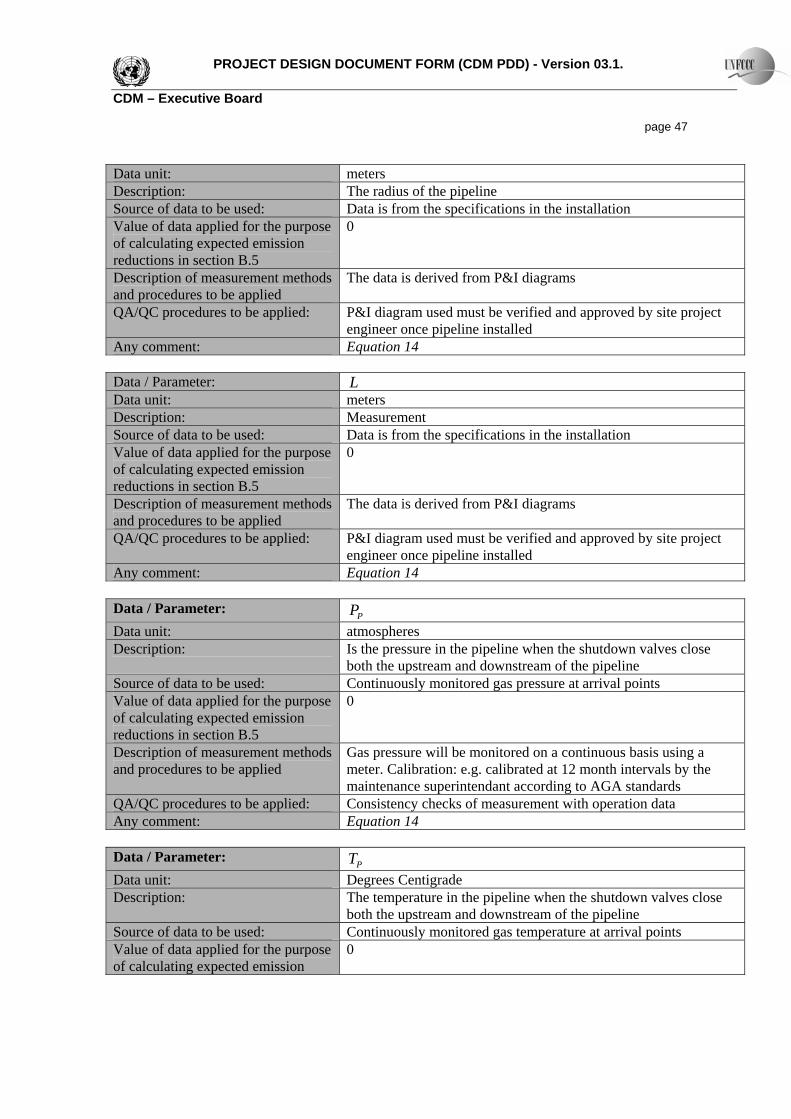
PROJECT DESIGN DOCUMENT FORM (CDM PDD) - Version 03.1. CDM – Executive Board page 47 Data unit: meters Description: The radius of the pipeline Source of data to be used: Data is from the specifications in the installation Value of data applied for the purpose of calculating expected emission reductions in section B.5
0
Description of measurement methods and procedures to be applied
The data is derived from P&I diagrams
QA/QC procedures to be applied: P&I diagram used must be verified and approved by site project engineer once pipeline installed
Any comment: Equation 14 Data / Parameter: L Data unit: meters Description: Measurement Source of data to be used: Data is from the specifications in the installation Value of data applied for the purpose of calculating expected emission reductions in section B.5
0
Description of measurement methods and procedures to be applied
The data is derived from P&I diagrams
QA/QC procedures to be applied: P&I diagram used must be verified and approved by site project engineer once pipeline installed
Any comment: Equation 14
Data / Parameter: PP Data unit: atmospheres Description: Is the pressure in the pipeline when the shutdown valves close
both the upstream and downstream of the pipeline Source of data to be used: Continuously monitored gas pressure at arrival points Value of data applied for the purpose of calculating expected emission reductions in section B.5
0
Description of measurement methods and procedures to be applied
Gas pressure will be monitored on a continuous basis using a meter. Calibration: e.g. calibrated at 12 month intervals by the maintenance superintendant according to AGA standards
QA/QC procedures to be applied: Consistency checks of measurement with operation data Any comment: Equation 14
Data / Parameter: PT Data unit: Degrees Centigrade Description: The temperature in the pipeline when the shutdown valves close
both the upstream and downstream of the pipeline Source of data to be used: Continuously monitored gas temperature at arrival points Value of data applied for the purpose of calculating expected emission
0

PROJECT DESIGN DOCUMENT FORM (CDM PDD) - Version 03.1. CDM – Executive Board page 48 reductions in section B.5 Description of measurement methods and procedures to be applied
Gas pressure will be monitored on a continuous basis using a meter. Calibration: e.g. calibrated at 12 month intervals by the maintenance superintendant according to AGA standards
QA/QC procedures to be applied: Consistency checks of measurement with operation data Any comment: Equation 14
Data / Parameter: pipelineEF Data unit: kgCH4/hour Description: Oil and natural gas average emission factor for the transport
pipeline(s) Source of data to be used: US EPA-453/R-95-017 Table 2.4, page 2-15 Value of data applied for the purpose of calculating expected emission reductions in section B.5
For the purpose of calculated emission reductions (taken from a similar type of plant elsewhere, will be updated during the first verification period once the P&I diagram is finalized):
Equipment Type EF item group Valves 2 Pump seals 0 Others* 0 Connectors 0 Flanges 0 Open-ended lines 1 Total EF pipeline: 0.011
Description of measurement methods and procedures to be applied
The data will be derived from P&I diagrams once finalized
QA/QC procedures to be applied: P&I diagram used must be verified and approved by site project engineer once pipeline installed
Any comment: Equations 10 and 11
Data / Parameter: equipmentEF Data unit: kgCH4/hour Description: Oil and natural gas average emission factor for equipment
installed in the recovery and processing plant(s) Source of data to be used: US EPA-453/R-95-017 Table 2.4, page 2-15 Value of data applied for the purpose of calculating expected emission reductions in section B.5
For the purpose of calculated emission reductions (preliminary estimate, will be updated during the first verification period once the P&I diagram is finalized):
Equipment Type EF item group Valves 15 Pump seals 0 Others* 78 Connectors 700 Flanges 1021
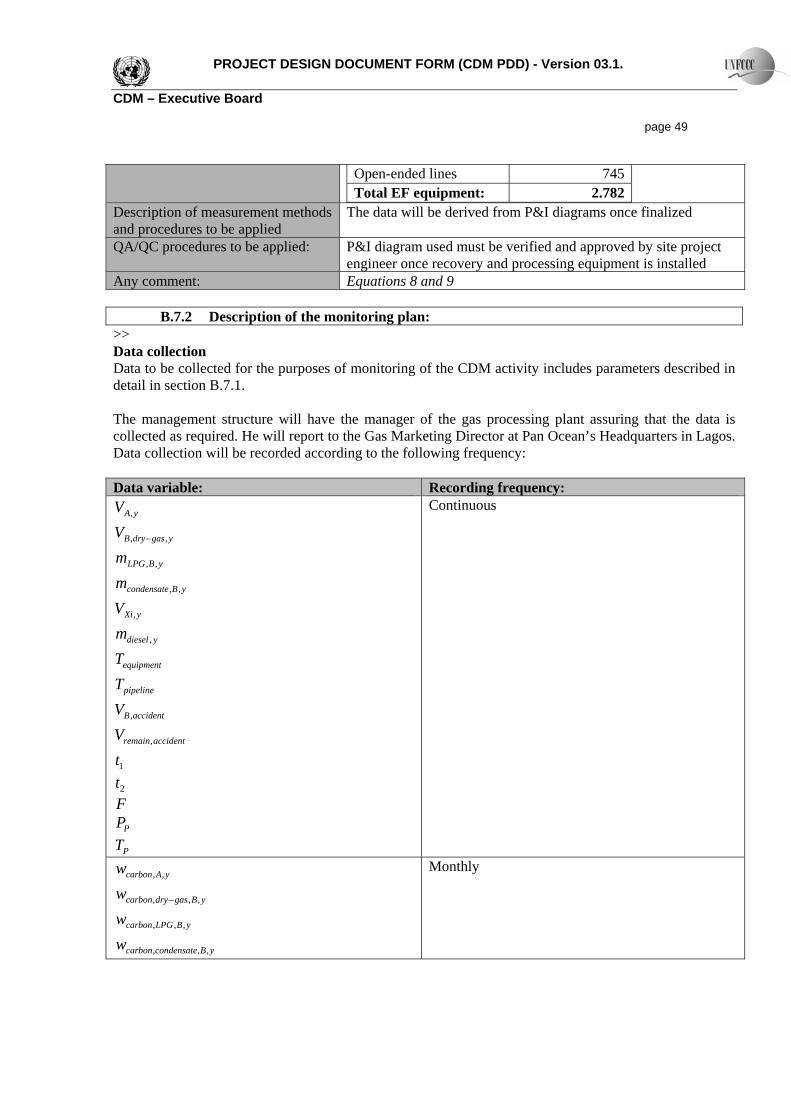
PROJECT DESIGN DOCUMENT FORM (CDM PDD) - Version 03.1. CDM – Executive Board page 49
Open-ended lines 745 Total EF equipment: 2.782
Description of measurement methods and procedures to be applied
The data will be derived from P&I diagrams once finalized
QA/QC procedures to be applied: P&I diagram used must be verified and approved by site project engineer once recovery and processing equipment is installed
Any comment: Equations 8 and 9 B.7.2 Description of the monitoring plan:
>> Data collection Data to be collected for the purposes of monitoring of the CDM activity includes parameters described in detail in section B.7.1. The management structure will have the manager of the gas processing plant assuring that the data is collected as required. He will report to the Gas Marketing Director at Pan Ocean’s Headquarters in Lagos. Data collection will be recorded according to the following frequency: Data variable: Recording frequency:
yAV ,
ygasdryBV ,, −
yBLPGm ,,
yBcondensatem ,,
yXiV ,
ydieselm ,
equipmentT
pipelineT
accidentBV ,
accidentremainV ,
1t
2t F
PP
PT
Continuous
yAcarbonw ,,
yBgasdrycarbonw ,,, −
yBLPGcarbonw ,,,
yBcondensatecarbonw ,,,
Monthly
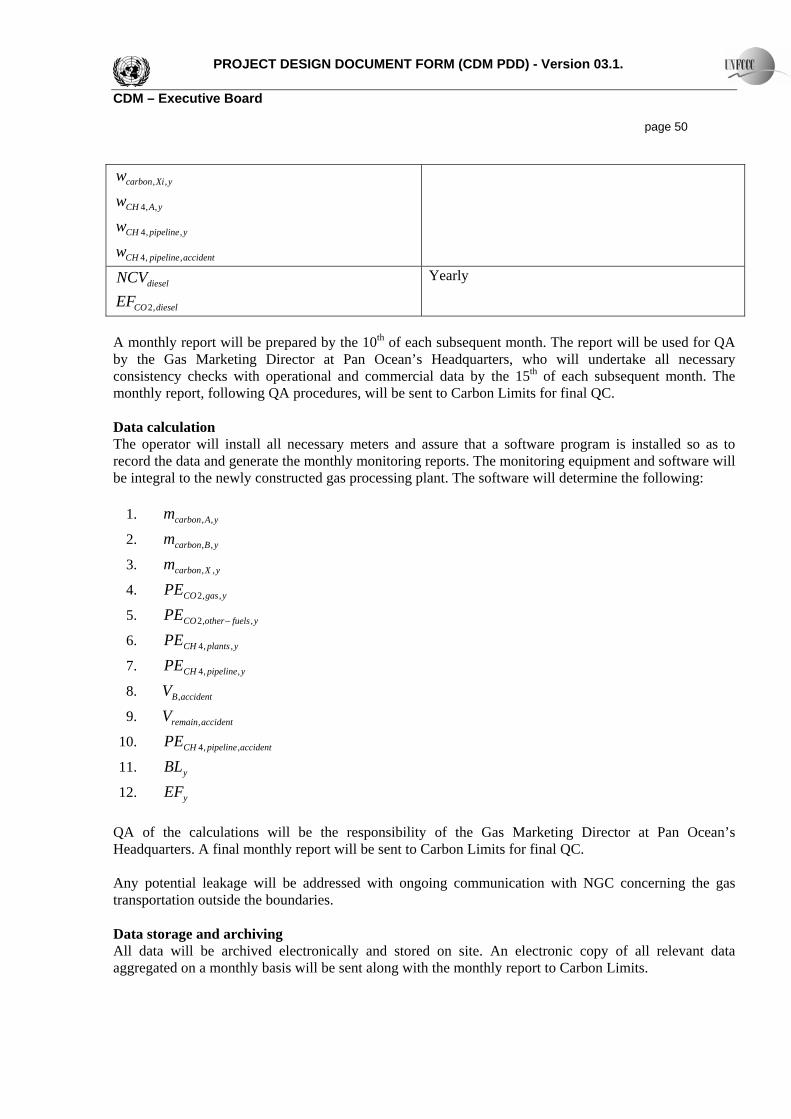
PROJECT DESIGN DOCUMENT FORM (CDM PDD) - Version 03.1. CDM – Executive Board page 50
yXicarbonw ,,
yACHw ,,4
ypipelineCHw ,,4
accidentpipelineCHw ,,4
dieselNCV
dieselCOEF ,2
Yearly
A monthly report will be prepared by the 10th of each subsequent month. The report will be used for QA by the Gas Marketing Director at Pan Ocean’s Headquarters, who will undertake all necessary consistency checks with operational and commercial data by the 15th of each subsequent month. The monthly report, following QA procedures, will be sent to Carbon Limits for final QC. Data calculation The operator will install all necessary meters and assure that a software program is installed so as to record the data and generate the monthly monitoring reports. The monitoring equipment and software will be integral to the newly constructed gas processing plant. The software will determine the following:
1. yAcarbonm ,,
2. yBcarbonm ,,
3. yXcarbonm ,,
4. ygasCOPE ,,2
5. yfuelsotherCOPE ,,2 −
6. yplantsCHPE ,,4
7. ypipelineCHPE ,,4
8. accidentBV ,
9. accidentremainV ,
10. accidentpipelineCHPE ,,4
11. yBL
12. yEF QA of the calculations will be the responsibility of the Gas Marketing Director at Pan Ocean’s Headquarters. A final monthly report will be sent to Carbon Limits for final QC. Any potential leakage will be addressed with ongoing communication with NGC concerning the gas transportation outside the boundaries. Data storage and archiving All data will be archived electronically and stored on site. An electronic copy of all relevant data aggregated on a monthly basis will be sent along with the monthly report to Carbon Limits.
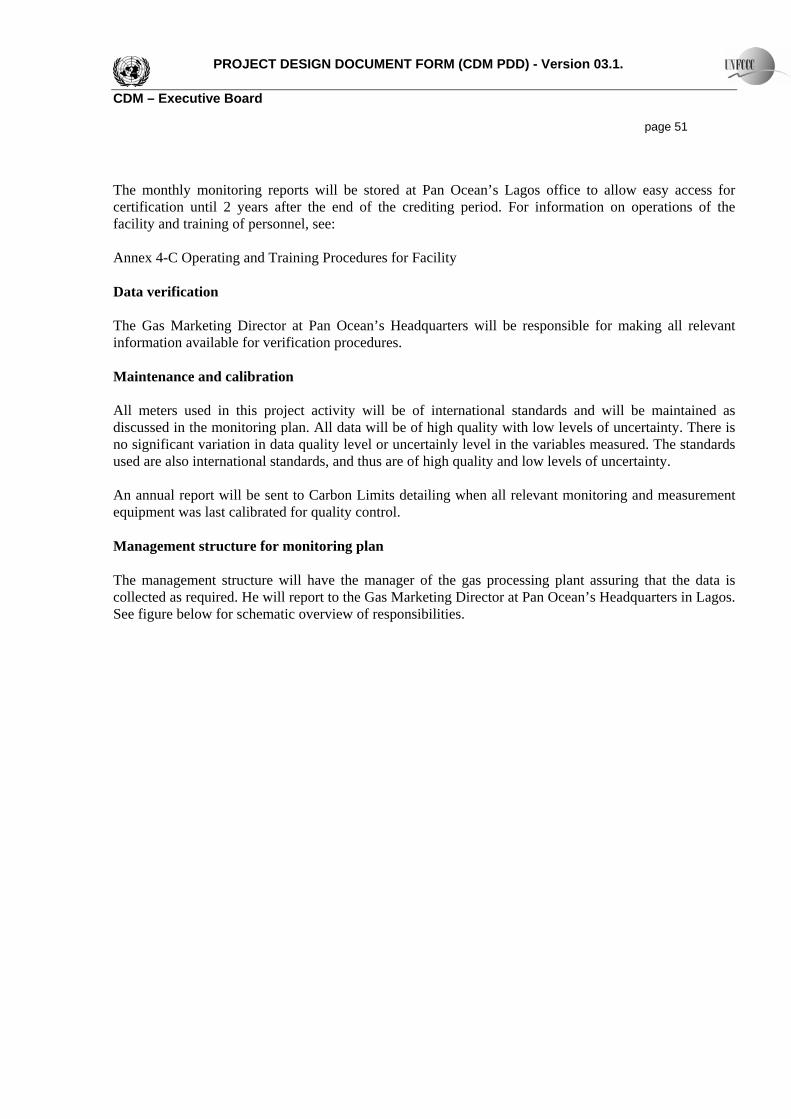
PROJECT DESIGN DOCUMENT FORM (CDM PDD) - Version 03.1. CDM – Executive Board page 51 The monthly monitoring reports will be stored at Pan Ocean’s Lagos office to allow easy access for certification until 2 years after the end of the crediting period. For information on operations of the facility and training of personnel, see: Annex 4-C Operating and Training Procedures for Facility Data verification The Gas Marketing Director at Pan Ocean’s Headquarters will be responsible for making all relevant information available for verification procedures. Maintenance and calibration All meters used in this project activity will be of international standards and will be maintained as discussed in the monitoring plan. All data will be of high quality with low levels of uncertainty. There is no significant variation in data quality level or uncertainly level in the variables measured. The standards used are also international standards, and thus are of high quality and low levels of uncertainty. An annual report will be sent to Carbon Limits detailing when all relevant monitoring and measurement equipment was last calibrated for quality control. Management structure for monitoring plan The management structure will have the manager of the gas processing plant assuring that the data is collected as required. He will report to the Gas Marketing Director at Pan Ocean’s Headquarters in Lagos. See figure below for schematic overview of responsibilities.
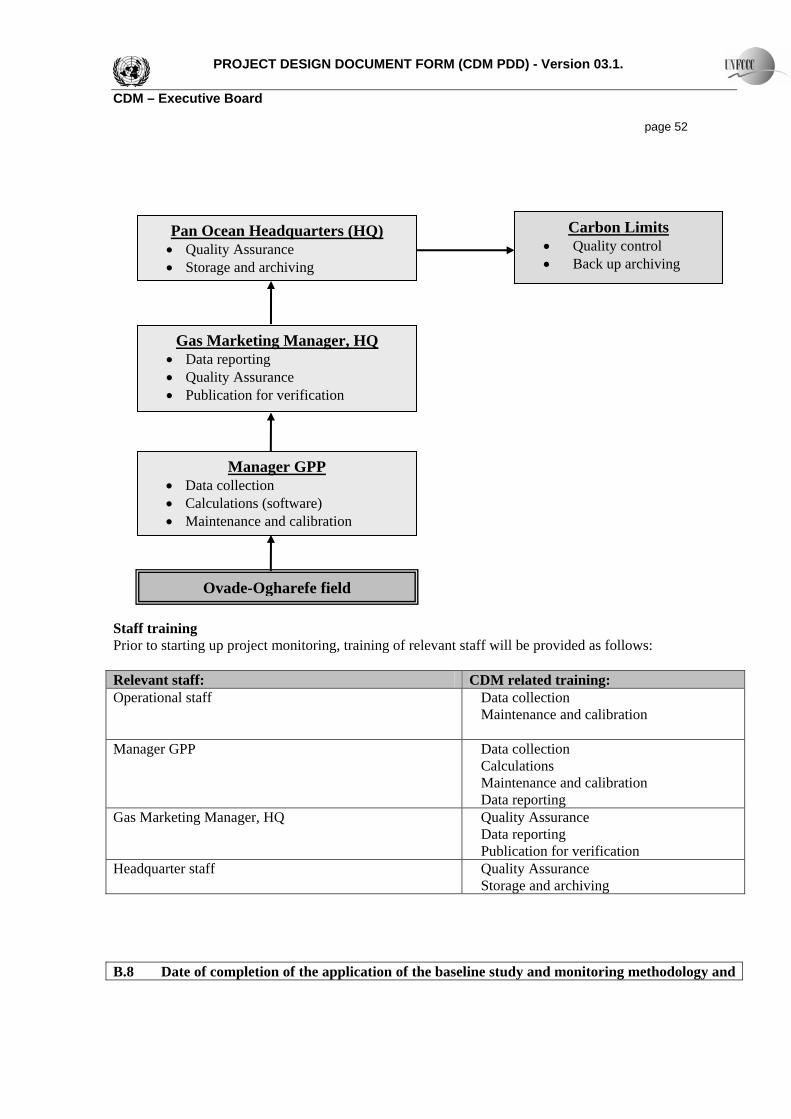
PROJECT DESIGN DOCUMENT FORM (CDM PDD) - Version 03.1. CDM – Executive Board page 52
Staff training Prior to starting up project monitoring, training of relevant staff will be provided as follows: Relevant staff: CDM related training: Operational staff
Data collection Maintenance and calibration
Manager GPP Data collection Calculations Maintenance and calibration Data reporting
Gas Marketing Manager, HQ
Quality Assurance Data reporting Publication for verification
Headquarter staff
Quality Assurance Storage and archiving
B.8 Date of completion of the application of the baseline study and monitoring methodology and
Ovade-Ogharefe field
Manager GPP • Data collection • Calculations (software) • Maintenance and calibration
Gas Marketing Manager, HQ • Data reporting • Quality Assurance • Publication for verification
Pan Ocean Headquarters (HQ) • Quality Assurance • Storage and archiving
Carbon Limits • Quality control • Back up archiving
PROJECT DESIGN DOCUMENT FORM (CDM PDD) - Version 03.1. CDM – Executive Board page 53 the name of the responsible person(s)/entity(ies) The baseline study was completed on 16 September 2005 and subsequently revised to reflect comments from the Validator as well as new information. Paul J. Parks of Carbon Limits was the principal author. SECTION C. Duration of the project activity / crediting period C.1 Duration of the project activity: C.1.1. Starting date of the project activity: >> The definition of the start date of the project activity is according to the definition determined in EB 33 “the dates at which the implementation or construction or real action of the project activity begins”. A contract for the civil construction on-site has been signed, and a contract for the construction of the first phase of the project was signed 9 July 2007. The only real construction work undertaken previously was site preparation. The CDM project activity is anticipated to commence at the completion of the physical implementation of the project, estimated for 01/01/2010. The starting date of the project activity is before the date of final validation. The incentive from the CDM has however been a main driver for the development of the proposed project activity from the start. The project was undergoing CDM validation by DNV in 2006, but the CDM process was then put on hold due to the shut-down of the field as a result of terrorism. Official correspondence with the DNA (see Annex 5 C) serves as evidence for the early focus on registering the project under CDM. C.1.2. Expected operational lifetime of the project activity: >> The project lifetime is estimated at twenty (20) years. At the end of this period, the current expectation is that the field would be plugged and abandoned according to best-practice techniques that will assure no further GHG emissions from the field. C.2 Choice of the crediting period and related information: C.2.1. Renewable crediting period C.2.1.1. Starting date of the first crediting period: >> Not applicable. C.2.1.2. Length of the first crediting period: >> Not applicable.
PROJECT DESIGN DOCUMENT FORM (CDM PDD) - Version 03.1. CDM – Executive Board page 54 C.2.2. Fixed crediting period: C.2.2.1. Starting date: >> The crediting period will begin once the project becomes operational. It is estimated that the starting date of the crediting period will be 01/01/2010. C.2.2.2. Length: >> The crediting period is scheduled to last ten years (120 months) from the beginning of project operations. SECTION D. Environmental impacts D.1. Documentation on the analysis of the environmental impacts, including transboundary impacts: >> The project activity is built on a brown field site and reduces the current emissions from the existing site by reducing the gas flared by an estimated 98%. Local pollution is reduced to the degree particulates were released into the atmosphere by gas flaring (albeit this was low in the base case since the facility already had smokeless flares.) There are no transboundary impacts. The overwhelming environmental impact is global from the reduction in GHG emissions. D.2. If environmental impacts are considered significant by the project participants or the host Party, please provide conclusions and all references to support documentation of an environmental impact assessment undertaken in accordance with the procedures as required by the host Party: >> No significant impacts anticipated. An EIA for the project was completed on December 2005. Please see Annex 5-A EIA for Project Facility. SECTION E. Stakeholders’ comments E.1. Brief description how comments by local stakeholders have been invited and compiled: >> Pan Ocean Oil Company has a long tradition of working with the local community. Pan Ocean has a Community Relations Department that maintains ongoing relations and liaison with the nearby communities. It has been active in providing public infrastructure such as roads for the communities near the field area. It should also be noted that in regard to gas flaring, Pan Ocean has previously acted to minimize any local effects of the gas flaring. Specifically the Company has installed “smokeless flares” on the flare pipes so as to assure the highest possible level of combustion so as to minimize particulates. Such flares are not required by Nigerian regulation and their installation exceeds common practice in the country- It is also worth mentioning here for the record, that at the end of 2005, Pan Ocean received an award of recognition from the National Association of Oghara Students, an umbrella association of students in
PROJECT DESIGN DOCUMENT FORM (CDM PDD) - Version 03.1. CDM – Executive Board page 55 institutions of higher learning from Ovade and environs, in appreciation of the Company’s contributions to the educational and economic development of Oghara kingdom through the Pan Ocean/NNPC JV University scholarship awards and the skills acquisition training scheme. The Community Relations team in Warri held a number of meetings with representatives of Ovade Community during which they deliberated on Pan Ocean’s plan to establish a Gas gathering project near the flow station facility. They were also briefed on the likely benefits the Community will derive from this investment in the area of job creation and ancillary services, as well as the eventual elimination of the gas flaring from our operations, which will bring about a cleaner and more environment-friendly atmosphere for the Community and the neighbourhood. It should also be pointed out, that during the two years that the field has been closed in due to terrorist activities, the Joint Venture has kept all employees on the payroll, so as to not to force its local employees into financial difficulties. Direct local employment impact from the construction is project is substantial. Once in operation, the additions to skilled staff will be between 35-45 positions and about 150 unskilled positions. These jobs will continue over the estimated twenty years of the project. E.2. Summary of the comments received: >> During the discussions, the community was supportive of the project but requested a MoU concerning local employment. E.3. Report on how due account was taken of any comments received: >> Pan Ocean has assured the community that the MoU on employment will be discussed and agreed upon by both parties before the project commences. This was accepted by the Community, bearing in mind the long standing association between them and Pan Ocean, and in recognition of the fact that the new investment was going to benefit them in many ways, both in the short term and long term. They have submitted a letter endorsing the project. (Annex 5-B) Pan Ocean is in regular touch with the host community, and all indications point to the fact that the Community is very favourably disposed to the Gas Utilization Project.
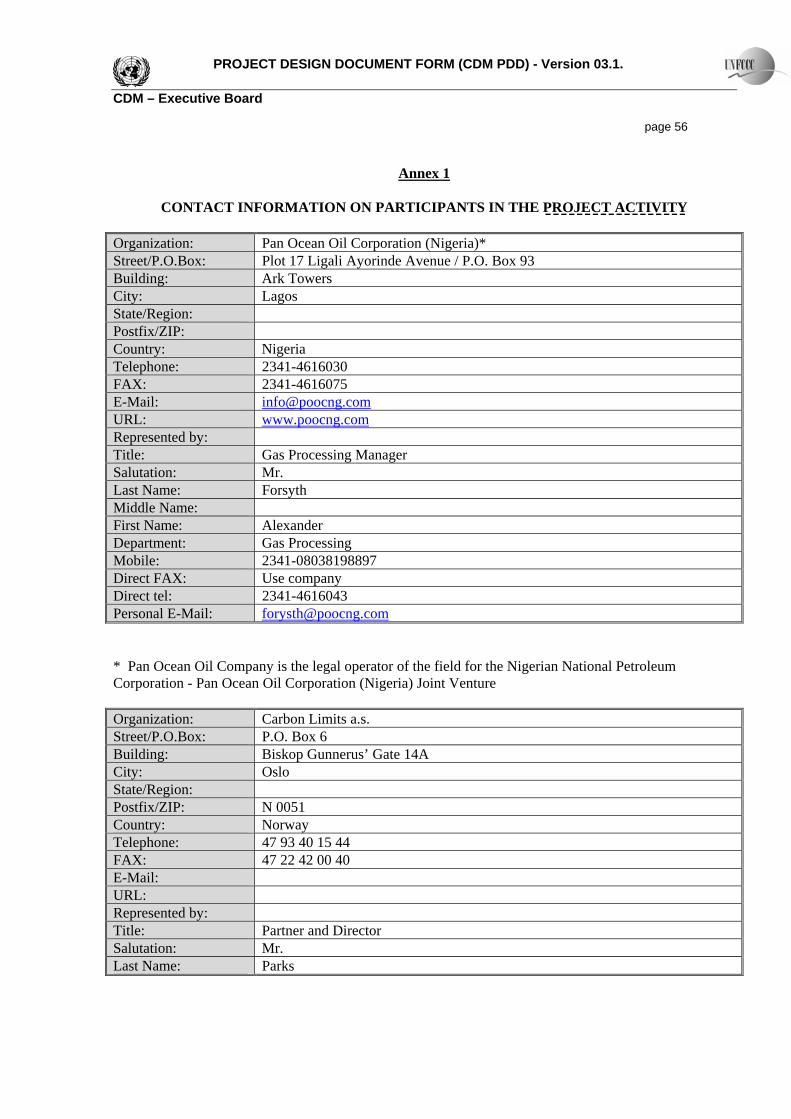
PROJECT DESIGN DOCUMENT FORM (CDM PDD) - Version 03.1. CDM – Executive Board page 56
Annex 1
CONTACT INFORMATION ON PARTICIPANTS IN THE PROJECT ACTIVITY Organization: Pan Ocean Oil Corporation (Nigeria)* Street/P.O.Box: Plot 17 Ligali Ayorinde Avenue / P.O. Box 93 Building: Ark Towers City: Lagos State/Region: Postfix/ZIP: Country: Nigeria Telephone: 2341-4616030 FAX: 2341-4616075 E-Mail: [email protected] URL: www.poocng.com Represented by: Title: Gas Processing Manager Salutation: Mr. Last Name: Forsyth Middle Name: First Name: Alexander Department: Gas Processing Mobile: 2341-08038198897 Direct FAX: Use company Direct tel: 2341-4616043 Personal E-Mail: [email protected]
* Pan Ocean Oil Company is the legal operator of the field for the Nigerian National Petroleum Corporation - Pan Ocean Oil Corporation (Nigeria) Joint Venture Organization: Carbon Limits a.s. Street/P.O.Box: P.O. Box 6 Building: Biskop Gunnerus’ Gate 14A City: Oslo State/Region: Postfix/ZIP: N 0051 Country: Norway Telephone: 47 93 40 15 44 FAX: 47 22 42 00 40 E-Mail: URL: Represented by: Title: Partner and Director Salutation: Mr. Last Name: Parks

PROJECT DESIGN DOCUMENT FORM (CDM PDD) - Version 03.1. CDM – Executive Board page 57 Middle Name: Jeffrey First Name: Paul Department: Executive Mobile: 39 349 813 3352 Direct FAX: Use company Direct tel: 39 041 277 0019 Personal E-Mail: [email protected]

PROJECT DESIGN DOCUMENT FORM (CDM PDD) - Version 03.1. CDM – Executive Board page 58
Annex 2
INFORMATION REGARDING PUBLIC FUNDING There is no public funding.
Annex 3
BASELINE INFORMATION Annex 3-A Review of Gas Flare Policy and Regulation in Nigeria Annex 3-B Legal Opinion regarding High Court Ruling on Flaring in Benin Judicial District Annex 3-C Gas and Liquids Composition and Carbon Content Calculation
Annex 4
MONITORING INFORMATION
Annex 4-A Monitoring Plan Description Annex 4-B Schematic of Monitoring Plan Annex 4-C Operating and Training Procedures for Facility
Annex 5 ADDITIONAL INFORMATION
Annex 5-A EIA for Project Facility Annex 5-B Letter of Support from Local Community Annex 5-C Letter of Approval from Designated National Authority Annex 5-D Project economics
- - - - -