Embed Size (px)
Citation preview

Ab Initio Enhanced CalphadModeling of Actinide Rich Nuclear
Fuels
Fuel Cycle R&D
Dr. Dane Morgan
University of Wisconsin, Madison
In collaboration with:
University of Florida
Frank Goldner, Federal POCJon Carmack, Technical POC
Project No. 09-787
NEUP 09-787
Ab Initio Enhanced Calphad Modeling of Actinide Rich Nuclear Fuels
Final Report
Lead Principal Investigators: Dane Morgan (UW-Madison)
Co-Principal Investigator: Y. Austin Chang (UW-Madison)
Collaborators: Todd Allen (UW-Madison) and Ying Yang (CompuTherm LLC)
Students: Wei Xie (graduate student), Chao Shen (graduate student), and Wei Xiong (post-doctoral associate)
University of Wisconsin-Madison Date: September 30th, 2013

I
Table of contents 1. Executive Summary ............................................................................................................ 1
2. Introduction .......................................................................................................................... 2
3. Methodology ......................................................................................................................... 3 3.1 Ab initio calculations ..................................................................................................................... 3 3.2 Calphad modeling .......................................................................................................................... 5
3.2.1 Disordered solution phase .................................................................................................................. 5 3.2.2 Ordered intermetallic compound ...................................................................................................... 6
4. Project Progress................................................................................................................... 7 4.1 Milestone status .............................................................................................................................. 7 4.2 Publications and Presentations ................................................................................................... 8
4.2.1 Journal Publications ............................................................................................................................. 8 4.2.2 Conference Presentations.................................................................................................................... 8
5. Results and discussion ..................................................................................................... 10 5.1 Systems that do not contain Np ............................................................................................... 10
5.1.1 Zr ............................................................................................................................................................. 10 5.1.2 U and U-Zr ........................................................................................................................................... 11
5.1.2.1 Ab initio calculations ................................................................................................................................... 11 1) Energetics ............................................................................................................................................................ 11 2). Volume................................................................................................................................................................ 18 3). Magnetic Moments ......................................................................................................................................... 22 4). Electronic structure ......................................................................................................................................... 24 5. Hubbard U for Uranium in U metal and U-Zr alloy ............................................................................. 32 6). Summary ............................................................................................................................................................ 33
5.1.2.2 Calphad modeling ......................................................................................................................................... 34 1) Model parameters ............................................................................................................................................. 34 2) Phase diagram and phase equilibria ........................................................................................................... 35 3) Thermodynamic properties ........................................................................................................................... 39 4) Summary.............................................................................................................................................................. 46
5.1.3 Pu ............................................................................................................................................................. 47 5.1.4 Pu-Zr, Pu-U and U-Zr-Pu ................................................................................................................ 47
5.2 Systems that contain Np ............................................................................................................ 48 5.2.1 Np and Np-Zr ...................................................................................................................................... 48
5.2.1.1 Phase diagram and phase equilibria ........................................................................................................ 48 5.2.1.2 Thermodynamic properties ........................................................................................................................ 50
1) Ab initio energetic calculations of the elemental Np and terminal solution phases .................. 50 2) Enthalpy of formation of the δ and bcc structures ................................................................................ 52 3) Model predicted excess entropy of mixing for the liquid phase ...................................................... 54
5.2.1.3 Summary .......................................................................................................................................................... 55 5.2.2 Np-U ....................................................................................................................................................... 55 5.2.3 Np-Pu ..................................................................................................................................................... 58 5.2.4 U-Zr-Np................................................................................................................................................. 60 5.2.5 U-Pu-Np and Pu-Zr-Np .................................................................................................................... 63
6. Conclusions ........................................................................................................................ 64
7. Acknowledgement ............................................................................................................ 66
8. References .......................................................................................................................... 67

II
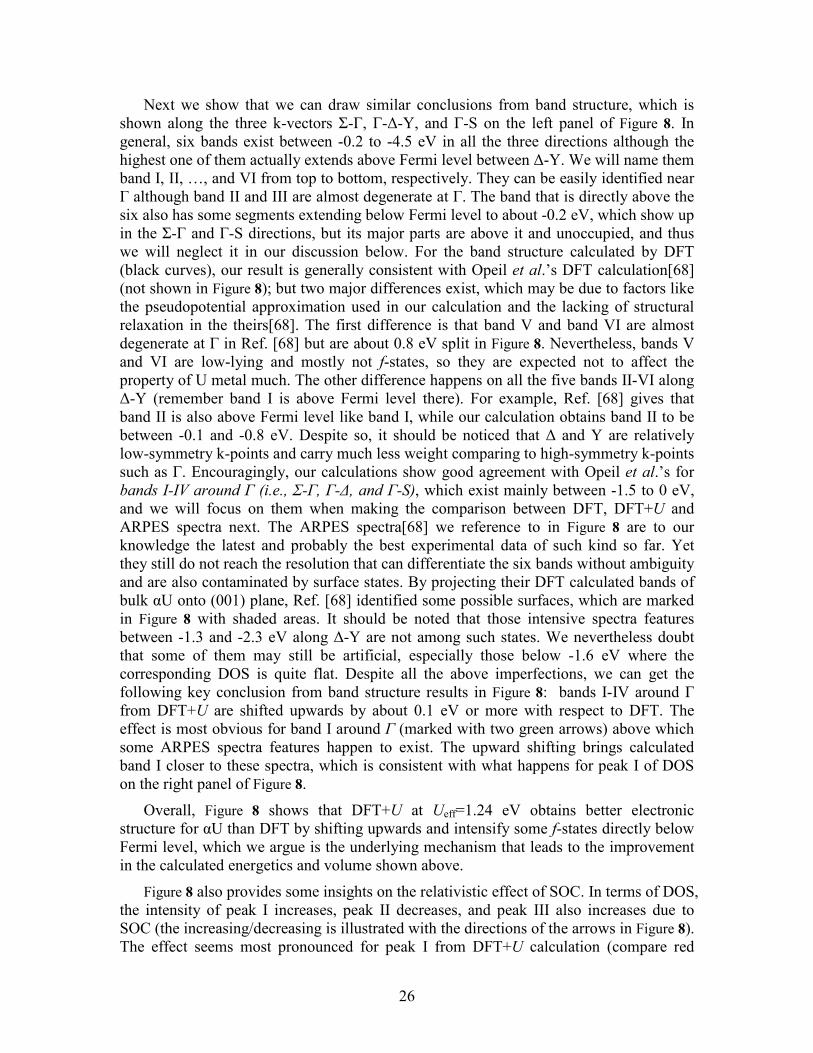
List of Figures Figure 1. Total energy for Zr metal as a function of volume. noSOC means that spin-orbit coupling effect was not considered in the ab initio calculations, while SOC means the spin-orbit coupling was taken into account. ..................................................................... 10 Figure 2. Energetics for U metal: a) cohesive energy for αU; enthalpy of formation for b) βU and c) γU. The vertical dash reference line is at Ueff=1.24 eV. Experimental cohesive energy of αU is from Ref. [52]; CALPHAD models are from Xiong et al. [6], Kurata[42], and Chevalier et al[43] which all use the same SGTE data for pure elements[53] and give the same enthalpy of formation for βU and γU. ........................... 12 Figure 3. Enthalpy of formation for U-Zr alloy: a) α(U) (6.3 at.% Zr), b) β(U) (3.3 at.% Zr), c) δ(U,Zr) (66.7 at.% Zr) and d) α(Zr) (93.8 at.% Zr), The vertical dash reference line is at Ueff=1.24 eV. Experimental enthalpy of formation for δ(U,Zr) -0.04±0.11 eV/atom is from Nagarajan et al.[44]; the very large error bar is not plotted in c). CALPHAD models are from Xiong et al.[6], Kurata[42], and Chevalier et al.[43]. ....................................... 13 Figure 4. RMS of enthalpy differences between Ab initio and CALPHAD for all solid phases of U metal and U-Zr alloy except αU and γ(U,Zr). DFT is at Ueff=0 eV while DFT+U is at Ueff > 0 eV. CALPHAD models are from Xiong et al. [6], Kurata[42], and Chevalier et al.[43]. See Error! Reference source not found. for quantitative statistics. . 15 Figure 5. Enthalpy of mixing for γ(U,Zr). DFT results are from Landa et al.’s noSOC calculations[39]; CALPAHD models are from Xiong et al.[6], Kurata[42] and Chevalier et al.[43]. Ueff used for DFT+U is given in parentheses in the legend. ............................ 18 Figure 6 .Volume for all solid phases of U metal and U-Zr alloy as a function of Ueff: a) αU; b) α(U) (6.3 at.% Zr); c) βU; d) β(U) (3.3 at.% Zr), e) γU; f) γ(U,Zr) (6.3 at.% Zr); g) γ(U,Zr) (25.0 at.% Zr); h) γ(U,Zr) (50.0 at.% Zr); i) γ(U,Zr) (75.0 at.% Zr); j) γ(U,Zr) (93.8 at.% Zr); k) δ(U,Zr) (66.7 at.% Zr); and l) αZr (93.8 at.% Zr). The vertical dash reference line is at Ueff=1.24 eV. Experiments data are from those referenced in Table 3; no direct experimental data are found for b), d), f), j) and k). .......................................... 19 Figure 7. Spin, orbital and total magnetic moments for all solid phases of U metal and U-Zr alloy as functions of Ueff: a) αU; b) α(U) (6.3 at.% Zr); c) βU; d) β(U) (3.3 at.% Zr), e) γU; f) γ(U,Zr) (6.3 at.% Zr); g) γ(U,Zr) (25.0 at.% Zr); h) γ(U,Zr) (50.0 at.% Zr); i) γ(U,Zr) (75.0 at.% Zr); j) γ(U,Zr) (93.8 at.% Zr); k) δ(U,Zr) (66.7at.% Zr); and l) αZr (93.8 at.% Zr). The vertical dash reference line is at Ueff=1.24 eV. The unsmooth segment between 1.5 and 2.0 eV for γ(U,Zr) (75.0 at.% Zr) might be metastable solutions. ......... 23 Figure 8. Band structure (left panel) and density of states (right panel) for αU. The respective experimental references are ARPES spectra from Opeil et al.[68] and UPS spectra from Opeil et al.[69] for αU(001) single crystal. All experimental spectra are plotted as blue circles, while DFT and DFT+U (Ueff=1.24 eV) calculated results are plotted as black and red curves, respectively; solid and dash line style distiguish noSOC and SOC. On the left, green arraws indicate two representative improvements of bands going from DFT to DFT+U. On the right, the positions of peaks from experiment, DFT and DFT+U are marked with blue, black and red arrows, respectively. Gray areas on the left and dash arrows on the right indicate spectra features from surfaces states that are not modeled in the calculations. Only the occupied part between -4.5 and 0 eV relative to Fermi level is shown. See FIG. 2 in Ref.[68] for an illutration of Brillouin zone and the special k-points used here. ................................................................................................ 24

III
Figure 9. Density of states for αU as a function of Ueff. The vertical dash reference line is Fermi level. Experimental reference is Baer and Lang’s XPS and BIS spectra[70]. The full valence band, both occupied and unoccupied is shown ............................................. 27 Figure 10. Total, d- and f-orbital projected density of states for all solid phases of U, Zr metal and U-Zr alloy as functions of Ueff. The vertical dash reference line is Fermi level.The first column is calculated by DFT, the second, third and fourth by DFT+U at Ueff=1.24, 2.49, and 3.99 eV, respectively. Results from both noSOC (dash) and SOC (solid) are given. The highest unoccupied part of the valence band is missing for some systems due to limited number of bands included in the calculations. ............................. 30 Figure 11. Total f-orbital occupation for all solid phases of U metal and U-Zr alloy as a function of Ueff. Low and intermediate temperature phases αU, α(U), βU, β(U), α(Zr) and δ(U,Zr) are plotted in the left panel; high temperature phase γU and γ(U,Zr) are in the right. Solid curves are from SOC calculations, while dash from noSOC. ........................ 32 Figure 12. Comparison of phase diagram between experimental data [81-84] and this work for temperatures above 1400 K................................................................................ 36 Figure 13. Comparison of the solid phase diagram between experimental data [82, 85-94] and thermodynamic descriptions [77, 79], (b) and (c) are magnified parts of (a). ........... 36 Figure 14. Comparison of heat capacity of the U-Zr alloys between CALPHAD model-prediction [77, 79] and experimental data [92-94, 103]. (a) Summary of the experimental information provided by different research groups [92-94, 103], (b) Comparison for the U-13, 14 and 14.3 Zr alloys, the CALPHAD-type results are plotted for U-13.5Zr alloy; (c) comparison for the U-20Zr alloy; (d) comparison for the U-35, 41, and 61 Zr alloys. S denotes the unit for shifting the heat capacity in the plot to facilitate reading; (e) Comparison for the U-72 and 73Zr alloys, the CALPHAD-type results are plotted for U-72.5Zr alloy; (f) Comparison for the U-89 and 91Zr alloys, the CALPHAD-type results are plotted for U-90Zr alloy; (g) Comparison for pure U; (f) Comparison for pure Zr. ... 40 Figure 15. Comparison of activity of U in the δ phase between experimental results by Murakami et al. [102] and CALPHAD model-prediction in this work. ........................... 41 Figure 16. Comparison of activity of U and Zr in the U-Zr alloys at different temperatures. Reference for U is the liquid phase, while for Zr is hcp (Zr). Different colors indicate different temperatures for both symbols (experimental data) and curves (calculations). .................................................................................................................... 42 Figure 17. Comparison of the excess entropy of mixing at 2200 K for the liquid phase among different thermodynamic modeling [77, 107]. ...................................................... 42 Figure 18. Model-predicted bcc miscibility gap of the U-Zr system according to different CALPHAD type modeling [77, 79]. ................................................................................. 43 Figure 19. Comparison of the enthalpy of formation of the γ(U,Zr) phase between ab initio calculations at 0 K and CALPHAD modeling at 298 K. SOC means Spin-Orbit Coupling. ........................................................................................................................... 44 Figure 20. (a) Comparison of the enthalpy of formation for the δ phase among ab initio [105], CALPHAD [77, 79] and experimental data [44]. In CALPHAD modeling from the present work, case 1A is using the energy difference of (Zr) between hcp and δ structures as 1000 J/mol for model 1 (Zr)1(U,Zr)2, while case 1B is using 527.5 J/mol for model 1 (Zr)1(U,Zr)2. (b) Magnification of (a) from 98 to 100 at.% Zr. ....................................... 45

IV
Figure 21. Comparison of the phase diagram assessed in the present work. Case 1A is using the energy difference of (Zr) between hcp and δ structures as 1000 J/mol, while case 1B is using 527.5 J/mol. ............................................................................................ 46 Figure 22. Enthalpy of formation for a) γPu, b) δPu, c) δ'Pu, and d) εPu calculated without SOC. The enthalpy is referenced to that of the ground state phase αPu. ............. 47 Figure 23. Comparison of the phase diagram of Np-Zr between the CALPHAD modeling and experimental data. (a) calculated phase diagram in this work and experimental data; (b) calculated phase diagram in the work by Bajaj et al. [41] and experimental data; (c) magnified part of (a); (d) magnified part of (b). ............................................................... 50 Figure 24. Ab initio energetics for Np metal at 0 K: (a) cohesive energy for αNp, and enthalpy of formation for (b) βNp and (c) γNp. The data from SGTE and experiments are considered at 298 K. Experimental data in (a) are taken from Ref. [52]. ......................... 51 Figure 25. Comparison of the enthalpy of formation for Np-Zr alloy phases at 0 K: (a) (αNp) (6.3 at.% Zr); (b) (βNp) (6.3 at.% Zr); (c) (αZr) (93.8 at.% Zr). The CALPHAD values are calculated at 298 K. ......................................................................................... 51 Figure 26. RMS of enthalpy differences between ab initio and CALPHAD in this work. βNp, γNp, (αNp) (6.3 at.% Zr), (βNp) (6.3 at.% Zr) and (αZr) (93.8 at.% Zr) are considered. The lines connecting the ab initio results are used for guiding the eyes. ...... 52 Figure 27. Comparison of the enthalpy of mixing of the δ phase between ab initio calculations and CALPHAD modeling. The dotted lines connecting the ab initio results are used for guiding the eyes. Model 1 in the work by Bajaj et al. [41] takes hcp as the stable structure for pure Zr, while model 2 takes the ω phase. ......................................... 53 Figure 28. Comparison of the enthalpy of mixing of the bcc structure between ab initio calculations and CALPHAD modeling. The dotted lines connecting the ab initio results are used for guiding the eyes. ........................................................................................... 54 Figure 29. Comparison of the excess entropy of mixing of the liquid phase at 2500 K between this work and Bajaj et al. [41]. ............................................................................ 55 Figure 30. Calculated phase diagram of Np-U. The experimental data (square dots) are from [114]. ........................................................................................................................ 56 Figure 31. Enthalpy of formation for Np-U alloy: a) α(Np) (6.3 at.%U), b) β(Np) (6.3 at.%U), c) α(U) (6.3 at.%Np), , b) β(U) (3.3 at.%Np), ..................................................... 57 Figure 32. Enthalpy of mixing for (γNp, γU) without SOC. ............................................ 58 Figure 33. Comparison between the calculated Np-Pu phase diagram from this work and experimental data from (a) Mardon et al[115], (c) K.S. Chan et al[116]. and T. Ogawa[117], and (d) calculated from Kurata.M[118]. (b) is a close-up of (a). ................ 59 Figure 34. Represenctative Isothermal section of Np-U-Zr phase diagrams .................... 61 Figure 35. Isopleth paths in ab initio calculation of bcc Np-U-Zr: 1 (U0.5Zr0.5)1-xNpx; 2 Np0.5(ZrxU1-x)0.5; 3 (Np0.5Zr0.5)1-xUx; 4 U0.5(NpxZr1-x)0.5; 5 (Np0.5U0.5)1-xZrx; 6 Zr0.5(UxNp1-x)0.5; ....................................................................................................... 62 Figure 36. Comparison of enthalpy of mixing for bcc Np-U-Zr from CALPHAD and ab initio calculations. ............................................................................................................. 63 Figure 37. Isothermal sections of a) Np-U-Pu and b) Np-Pu-Zr ternaries at 973K .......... 64

V
List of tables Table 1. Energeticsa for solid phases of U, Zr metal and U-Zr alloy (unit: eV/atom). ..... 14 Table 2. Differences in energetics between DFT, DFT+U (1.24 eV) and CALPHAD for all solid phases of U metal and U-Zr except αU and γ(U,Zr)a (unit: eV/atom). ............... 16 Table 3. Volume for U, Zr metal and U-Zr alloy (unit: Å3/atom). ................................... 20 Table 4. Theoretical Hubbard U for Uranium in all solid phases of U metal and U-Zr alloy evaluated with the linear response approach of Ref. [24]. ....................................... 33 Table 5. Crystal structure information of solid phases in the U-Zr system ...................... 34 Table 6. Thermodynamic models and optimized CALPHAD type parameters for different phases of the U-Zr system in this work ............................................................................ 34 Table 7. Comparison of invariant reaction in the U-Zr phase diagram ∆ .......................... 38 Table 8. Thermodynamic models and optimized CALPHAD type parameters for different phases of the Np-Zr system in this work .......................................................................... 48 Table 9. Comparison between the calculated and assessed critical data of the invariant reactions in the Np-Pu system........................................................................................... 59 Table 10. Thermodynamic parameters of phases in the Np-Pu system ............................ 60

1
1. Executive Summary
This project has developed modeling and simulation approaches to predict fundamental phase equilibrium and thermochemical properties of metallic nuclear fuels. The safe and optimal use of the fuels is strongly affected by the complex thermokinetic properties of the multicomponent fuel systems that are difficult and expensive to measure experimentally due to their radioactive and toxic nature. The approaches developed in this work can provide essential data from modeling with considerable accuracy, thereby reducing the number of required experiments. More broadly, the modeling is of value for interpreting experimental results, guiding new experiments, validating analytical models, and for optimizing fuel design by enabling rapid and inexpensive exploration of new fuel systems and operating conditions.
The properties predicted with the modeling are 1) phase diagram, which provides the phase change reactions and phase boundaries at both fuel operating and transient temperatures; and 2) thermochemical data, which dictates the extent and speed of constituents migration, solubility limit, phase separation etc. The work has focused on U-Pu-Zr based fuel, which is a leading candidate for advanced fast reactor fuels. The effect of minor actinide Np is also investigated.
The modeling uses ab initio approaches based on DFT and DFT+U as well as the Calphad method for phase diagram calculation. Results were validated against existing computational and experimental data in the literature, and were also cross-validated between the two modeling approaches. Although this work is focused on a particular set of systems, the approaches and tools developed will enable prediction of the phase stability for a wide variety of metallic nuclear fuels.

2
2. Introduction
In this work we validated state of the art electronic structure approaches for U-Pu-Zr-Np and used the resulting energetics in a Calphad approach to model its phase stability.
The overall objectives of this work are to:
• Develop and validate an ab initio approach for predicting actinide alloy energetics for thermodynamic modeling.
• Provide a thermodynamic model for U-Pu-Zr-Np for improving and controlling reactor fuels.
The work consists of 2 main tasks:
• Task 1 – Ab initio energetics: Establish best-practice ab initio approaches for calculating U-Pu-Zr-Np energetics and the optimized approaches to predict key energetics of U-Pu-Zr-Np alloys for developing improved Calphad models.
• Task 2 – Calphad model: Construct a Calphad model for the thermodynamics of U-Pu-Zr-Np using existing experimental data and thermodynamic models with additional input of ab initio data from Task 1.
For Task 1, we focused our search on ab initio approaches that can predict the energetics of U-Pu-Zr-Np with a good compromise of accuracy and speed. The challenges are to model the correlation and relativistic effects that are often significant in actinide materials. For the correlation effects, we validated the so called density functional theory plus Hubbard U (DFT+U) [1] approach and compared it to the standard density functional theory (DFT) [2, 3] based on generalized gradient approximation. We examined the effect of Hubbard U and determined their optimal values for U, Np and Pu. For the relativistic effects, we focused on assessing the effect of spin-orbit coupling (SOC). Ab initio calculations have been performed on all solid phases of U, Np and Pu unary and U-Zr, Np-Zr and Np-U binary systems, as well as on the bcc phase of Np-U-Zr ternary system.
For Task 2, we performed thermodynamic modeling based on the CALPHAD approach using the Pandat and Thermo-Calc software. We evaluated the phase equilibria and thermodynamic properties for all the proposed binary (i.e., U-Zr, Pu-U, Pu-Zr, Np-U, Pu-Np and Np-Zr) and ternary (i.e., U-Pu-Zr, U-Pu-Np, U-Zr-Np, Pu-Zr-Np) sub-alloy systems of U-Pu-Zr-Np based on reported experimental data. A few binaries (e.g., Np-U) do not have enough experimental data available for robust Calphad fitting, and we further refined the models by incorporating ab initio data from Task 1. All the ternary systems except U-Pu-Zr lack enough experimental data to guide Calphad fitting, and their models were obtained from the extrapolation of the binary sub-alloys.
In the following we describe the methodology (Sec. 3), the overall project progress (Sec. 4), and then the detailed results (Sec. 5). We finish with a summary of conclusions (Sec. 6).

3
3. Methodology
Here we provide a general description of the methodology we employed in this work. More technical details and model parameters can be found in our manuscripts that are published or to appear[4-8].
3.1 Ab initio calculations All ab initio calculations are performed in the general framework of DFT[2, 3] using
the Vienna Ab initio Simulation Package (VASP)[9, 10]. The electron-ion interaction is described with the projector-augmented-wave (PAW) method[11] as implemented by Kresse and Joubert[12]. The PAW potentials used treat 6s26p6 7s2 5f3 6d1, 6s26p6 7s2 5f4 6d1, 6s26p6 7s2 5f6 and 4s24p65s24d2 as valence electrons for U, Np, Pu and Zr, respectively. The exchange-correlation functional parameterized in the GGA[13] by Perdew, Burke and Ernzerhof (PBE)[14] is used. The stopping criteria for self-consistent loops used are 0.1 meV and 1 meV tolerance of total free energy for the electronic and ionic relaxation, respectively. We do not explicitly set force as a stopping criterion, but when the total free energy is converged according to the criteria above, the Hellmann-Feynman forces on atoms are generally <0.1 eV/Å or smaller. Cutoff energy of 450 eV is used throughout all calculations. The Brillouin zone is sampled with Monkhorst–Pack[15] k-point meshes that have1000 k-points per reciprocal atom (KPPRA).We have tested that such k-point meshes and cutoff energy converge the total energy at least to 3 meV/atom, most even to 1 meV/atom. The partial occupancies are set using the Methfessel-Paxton method[16] of order one with a smearing width of 0.2 eV. All calculations have included spin polarization.
DFT+U[17] is an effective action theory that uses a functional of both the spin density, as in DFT, and the local spin-density matrix of some correlated subspace. The correlated subspace is typically defined using local, atomic-like orbitals as basis sets, and in this work we use the standard implementation[18] in VASP. The screened interactions for these orbitals must be determined (i.e., U and J) and then the local interaction potential for this subspace is constructed within Hartree-Fock formalism. Given that one typically employs standard approximations (i.e., LDA/GGA) for the density dependent potential, a double counting correction must be used to remove the local correlations that are already present in LDA/GGA, and in this work we use the standard fully localized limit (FLL) double courting correction[1]. Following Dudarev et al.[19], we use a version of DFT+U functional that does not introduce explicit local exchange J term and is dependent on the effective value of Ueff=U-J. The functional recovers DFT exactly at Ueff=0. This practice should be justified given that we are using a spin-density functional which already contains the effects of local exchange.
The additional local spin-density matrix in the DFT+U functional introduces vast spin and orbital degrees of freedom, which pose a significant challenge to numerical optimization algorithms and often result in metastable solutions. We frequently encounter such problem in our systems. To avoid metastable solution, Dorado et al.[20] suggested to perform a manual combinatorial search for the ground state orbital configuration and impose it afterwards. We cannot afford such search here due to the large numbers of systems and Ueff points we pursue. Alternatively, Meredig et al.[21] proposed in the U-

4
ramping method to perform a series of calculations starting from DFT and extending adiabatically towards the point at desired Ueff with each step initializing from the charge density and relaxed structure of its previous one. We find Meredig et al.’s original approach cannot always guarantee low energy solution for our systems. In general calculated properties of our systems are smooth functions of Ueff that have a clear three-stage pattern, as detailed in Section III. Metastable solutions are quite easy to identify as they break the pattern. Take αU as an example. We find that DFT correctly reproduces its experimental paramagnetic structure[22, 23]; DFT+U promotes spin and orbital polarization, which are still quenched at small Ueff by kinetic energy but will eventually overcome it after Ueff is larger than a critical value. So the ground state solutions of DFT+U to αU should have zero magnetic moments at small Ueff’s until a critical point after which moments emerge. Metastable solutions are characterized by wrong magnetic moments. If we follow Meredig et al.’s original proposal[21] to do U-ramping starting from DFT (i.e., Ueff =0), we obtain solutions without moments even when Ueff is larger than 2.5 eV which has passed the critical Ueff and should have moments. On the other hand, if we do reverse U-ramping starting from large Ueff (large enough to promote net polarization, e.g., 4 eV for U and U-Zr) and gradually reducing Ueff, we always obtain solutions with large moments even when Ueff is smaller than 1.5 eV which has passed the critical Ueff and should have no or small moments. Fortunately, low energy solutions are usually successfully obtained from the first series below 1.5 eV and from the second series above 2.5 eV. The problem lies within a critical region of 1.5-2.5 eV where solution from the two series, though have very different magnetic moments, are very similar in energy. We thus have to manually select the low energy solution from the two series in the critical region between 1.5-2.5 eV. With such care and efforts, we should have removed most metastable solutions in this study.
To compare with the Ueff from empirically fitting, we implement the linear response approach proposed by Cococcioni and de Gironcoli[24] in VASP and theoretically evaluate Hubbard U for Uranium in both U metal and U-Zr alloy with self-consistent calculations described in the following. For elemental phases αU, βU and γU, 2×2×2, 1×1×1 and 3×3×3 supercells of their primitive cells that have 16, 30 and 27 atoms with Monkhorst–Pack k-point meshes of 6×6×4, 3×3×6 and 5×5×5, respectively are used. For alloyed phases α(U), β(U), α(Zr), δ(U,Zr) and γ(U,Zr), the same supercells for bulk relaxations are used. All other numerical details are also the same as given above. Localized potential perturbations of -0.1, -0.05, 0, 0.05, and 0.1 eV are applied on symmetrically distinct U atomic site (called Hubbard site) to build the full response matrix and ultimately calculate Ueff following the procedures outlined in Ref. [24].
Regarding the relativistic effects, VASP always includes the mass-velocity and Darwin corrections using the methods proposed in Refs. [25, 26] and thus all of our calculations are at least so-called scalar-relativistic. In more accurate calculations, we have included the effect of SOC in the LS-coupling limit. For convenience, in this paper we designate calculations as SOC and noSOC, respectively for those with and without SOC included. SOC uses quantization axis (0, 0, 1) (i.e., z axis), starts with the charge density from noSOC and relaxes both the magnitude and the direction of the magnetic moments self-consistently. All noSOC calculations treat magnetism collinearly while SOC non-collinearly, with one exception: when evaluating the band structure of αU,
5
noSOC calculations also treat magnetism non-collinearly to avoid a bug that corrupts the calculated band structure.
Finally, we describe the types of structural crystal cells used in the calculations. For pure allotropes of U, Np, Pu, and Zr, we used the known primitive unit cells. Alloy phases in the study usually contain at least some configurational disorder, so we used supercells with the proper composition and crystal structure that were generated and optimized to yield the most random possible correlations within the first four nearest-neighbour pairs using the Special Quasi-random Structure (SQS) technique [27], as implemented in the Alloy Theory Automated Toolkit (ATAT) [28].
3.2 Calphad modeling Most of the thermodynamic modeling reported here was performed using the
PARRROT module [29] of Thermo-Calc software package [30]. Some earlier work was carried out with the PanOptimizer module of Pandat software[31]. Both Thermo-Calc and Pandat are commercial software that implement the CALPHAD (CALculation of PHAse Diagram) approach[32].
3.2.1 Disordered solution phase
The Gibbs energy of a binary substitutional solution phase is described by the following equation (take U-Zr as an example):
where xU and xZr are the mole fractions of component elements respectively. oUGϕ and
oZrGϕ represent the Gibbs energies of pure U and pure Zr with the φ structure, respectively.
The Gibbs energy of pure element i, oiG , was taken from the SGTE (Scientific Group
Thermodata Europe) database [33], which is referred to the enthalpy of its stable state at 298.15K. The next term is the Gibbs energy from ideal mixing, while R is the gas constant and T is the temperature. The last term, the excess Gibbs energy of the φ phase, is described by the Redlich-Kister polynomial [34]:
( )0
niex i
m U Zr UZr U Zri
G x x L x xϕ ϕ
=
= −∑
where iL are the binary interaction parameters and take the form of a + b∙T with “a” and “b” being the model parameters to be optimized in terms of experimental data.
The Gibbs energy of a ternary substitutional solution phase is obtained by extrapolating from the binaries using the Muggianu symmetric methods[35]. Take bcc Np-U-Zr as example, its Gibbs energy is:
where xi is the mole fraction of element i, and the Gibbs energy of element i in the bcc form. The forth term is the contribution of ideal entropy of mixing to the Gibbs

6
energy, which is followed by the excess Gibbs energy of the binaries that is again described by Redlich–Kister polynomial [34]. The parameters denoted by i,j
bccL are the
interaction parameters from the binary systems. , ,bccNp U ZrL is the ternary interaction
parameter which is set to zero in our model (i.e., assuming no additional ternary interaction). The standard element reference (SER) [33] is used as the Gibbs energy reference state (i.e., the stable structure of the element at 25 ºC and 1 bar).
3.2.2 Ordered intermetallic compound
The Gibbs energy function of intermetallic compound phase is modeled with the compound energy formalism [36]. For example, for δ(U,Zr) that is modeled using the sublattice model of (Zr)1(U,Zr)2, the Gibbs energy per mole of atoms of could be described by the following equation:
where and are the site fractions of U and Zr in the second sublattice respectively. :
oZr UGδ and :
oZr ZrGδ are the Gibbs energies of the end-members: Zr1U2 and Zr
of the δ phase. : ,Zr U ZrLδ represents the interaction energy term between U and Zr in the second sublattice with only Zr being present in the first sublattice. Other intermetallic compound phases like δ(Np,Zr) and δ(Np,U) are modeled in similar manners.

7
4. Project Progress 4.1 Milestone status
Due to Co-PI Prof. Y. Austin Chang’s sudden passing away in the second year of the project, this project was granted a no-cost extension of one-year and the milestones were rescoped to focus on the more tractable systems of U-Pu-Zr-Np, leaving the minor actinide Am for future exploration.
The completion status in terms of the revised milestones is as follows:
Milestone Description Planned Completion Date
Actual Completion Date
Percent complete
U-Zr (including U) 9/30/2011 12/30/2011 100 Np-Zr (including Np) 9/30/2011 12/30/2012 100
Np-U 3/31/2013 09/30/2012 100 Pu-Zr (including Pu) 3/30/2012 60%
Pu-U 6/30/2013 60%
We successfully finished the proposed work for the U-Zr, Np-Zr and Np-U binaries. Additinally, we also finished modeling the Np-U-Zr, Pu-Np-Zr, and Pu-Np-U ternaries.
For Pu-Zr and Pu-U, we have finished Calphad modeling of the phase diagrams, but there is work remaining for the ab initio calculations of the two systems that we are continuing at present. The reason for the delay is that we found DFT+U is more computationally intensive and challenging in terms of stability and space of possible approaches than anticipated and therefore moved more slowly than originally planned. The problem is that DFT+U calculations often obtain metastable solutions for f-electron system like the actinide materials that we are modeling in this project. The issue is particularly significant for Pu, which sits on the critical point of electron localization and has the largest number of elemental allotropes among all elements. We employed the so called U-ramping method[21] to resolve the issue. The method is considered to be one of the most cost-effective approaches to avoid metastable DFT+U solutions, yet it still needs a significantly larger number of calculations, because it essentially involves a series of DFT+U calculations starting from Ueff=0 and extending adiabatically to the target Ueff (usually around 2 eV for actinide metals) in step of 0.25 eV or smaller. Despite so, we have already finished the majority of ab initio calculations for elemental Pu metal. Completing Pu metal is the major challenge for modeling the binaries. We believe we will complete the Pu metal studies, thereby providing a strong foundation for later Pu alloy work. However, the Pu-Zr and Pu-U alloy studies will not be accessible within the scope of this project due to the convergence issue delays.
Overall, despite the aforementioned setbacks, the work we finished so far have fulfilled the original objectives of this project to develop ab initio approaches and predict the phase diagrams of metallic nuclear fuels. As listed on section 3.2 below, our work has resulted two journal articles published/accepted, one under review, and two in preparation, as well as four contributed conference talks and five posters. Although this work is focused on the particular set of U-Pu-Zr-Np systems, the approaches and tools

8
developed are generally applicable to metallic nuclear fuels that contain other minor actinides such as Am and Cm.
4.2 Publications and Presentations
4.2.1 Journal Publications
• Two articles are published/accepted, one submitted and two in preparation o W. Xiong, W. Xie, C. Shen, and D. Morgan, Thermodynamic Modeling of
the U-Zr System - A Revisit, J. Nucl. Mater. 443, 331 (2013). o W. Xie, W. Xiong, C. A. Marianetti, and D. Morgan, Correlation and
relativistic effects in U metal and U-Zr alloy: Validation of ab initio approaches, Phys. Rev. B Accepted (2013).
o W. Xiong, W. Xie, and D. Morgan, Thermodynamic Evaluation of the Np-Zr System Using CALPHAD and DFT+U, J. Nucl. Mater. Submitted, (2013).
o W. Xie, W. Xiong, and D. Morgan, Ab initio enhanced CALPHAD modeling of Np-U, In preparation (2013).
o W. Xie, W. Xiong, C. Jiang, and D. Morgan, Phase Stability of BCC Np-U-Zr Ternary Alloy, In preparation (2013).
4.2.2 Conference Presentations
• Four contributed talks. o D. Morgan, W. Xie, C. Shen, C. A. Marianetti, Y. A. Chang, Ab initio
modeling of U-Zr phase stability with DFT+U, NuMat 2012, Osaka, Japan, October 22-25, (2012).
o W. Xie, W. Xiong, C. Shen, C. A. Marianetti, Y. Austin Chang and D. Morgan, Ab Initio Calculations of the U-Zr System, 2013 TMS Meeting & Exhibition, San Antonio, USA, March 3-7, (2013)
o W. Xiong, W. Xie, C. Shen, and D. Morgan, Thermodynamic Modeling of the U-Zr System - A Revisit, 2013 TMS Meeting & Exhibition, San Antonio, USA, March 3-7, (2013)
o W. Xie, W. Xiong, C. A. Marianetti, Y. Austin Chang and D. Morgan, Ab initio Enhanced CALPHAD Modeling of Actinide Rich Metallic Nuclear Fuels, CALPHAD XLII Conference, San Sebastian, Spain, May 26-31, (2013)
• Five posters o W. Xie, C. Shen, D. Morgan, Ab initio enhanced CALPHAD modeling of
U-Zr alloy, F-Bridge School 2011, Cambridge, United Kingdom, September 19-23, (2011).
o W. Xie, C. Shen, D. Morgan, Combined ab initio and CALPHAD modeling of UZr metallic alloy fuels, MMSNF Workshop 2011, Aix-en-Provence, France, September 26-28, (2011).
o W. Xie, C. Shen, D. Morgan, Validation of First-principles Approaches in Calculating U-Zr, Np-Zr and Np-U for Thermodynamic Modeling, 2012

9
MRS Spring Meeting &Exhibit, San Francisco, USA, April 9-13, (2012).
o W. Xie, C. Shen, C. A. Marianetti, Y. A. Chang, D. Morgan, DFT+U study of elemental Uranium and Uranium-Zirconium alloy, CECAM Workshop: What about U? - Corrective approaches to DFT for strongly-correlated systems, Lausanne, Switzerland, June 18-21, (2012).
o W. Xie, W. Xiong, C. Shen, C. A. Marianetti, Y. A. Chang, D. Morgan, Ab initio calculations of the U-Zr-Np: DFT vs. DFT+U, MMSNF Workshop 2013, Chicago, USA, October 14-16, (2013)

10
5. Results and discussion 5.1 Systems that do not contain Np
5.1.1 Zr
Total energy as a function of volume for all the three solid phases of Zr metal ─ αZr (hcp_A3), ωZr (Hexagonal_C32) and βZr (bcc_A2) is shown in in Figure 1. At the equilibrium volumes (i.e., zero pressure), the total energy is in the order αZr < ωZr < βZr. This shows that our DFT-PAW calculation correctly reproduces experimental finding [37, 38] that αZr is the most stable ground state phase at zero temperature and pressure, with total energy 96.485 J/mole lower than ωZr. This result also matches previous DFT calculations using both FPLMTO [39] and PAW [40]. However, previous calculations by Bajaj et al. [41] found the energy of αZr to be about 1 kJ/mole higher than ωZr. One reason for the difference may be the structure relaxation methods, which Bajaj et al. [41] did not describe in their work. Our earlier calculations performing only one-step automatic full structure relaxation also obtained αZr to be less stable than ωZr. It is only our later calculations manually performing a series of constant volume relaxation to most accurately identify the equilibrium volume and energy that reproduce the correct phase stability reported here. Another reason may be energy cutoff convergence. In general, because absolute convergence is very hard to reach, when comparing the energetic difference between different systems it is best to use the same cutoff for all the systems under comparison to best cancel the convergence error (i.e., reaching relative convergence). Bajaj et al. [41] used different cutoff energies for different systems and hence the convergence error may have not have been cancelled between the Zr structures.
Figure 1. Total energy for Zr metal as a function of volume. noSOC means that spin-orbit coupling effect was not considered in the ab initio calculations, while SOC means the spin-orbit coupling was taken into account.
11
5.1.2 U and U-Zr
5.1.2.1 Ab initio calculations
1) Energetics
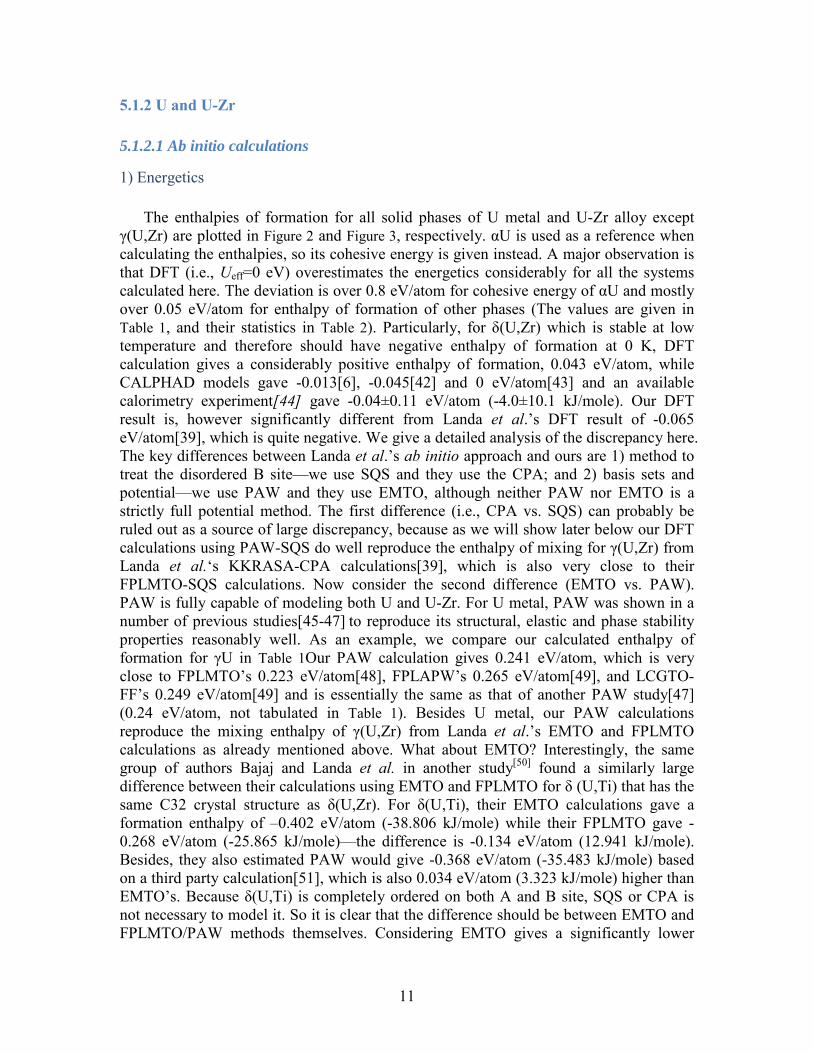
The enthalpies of formation for all solid phases of U metal and U-Zr alloy except γ(U,Zr) are plotted in Figure 2 and Figure 3, respectively. αU is used as a reference when calculating the enthalpies, so its cohesive energy is given instead. A major observation is that DFT (i.e., Ueff=0 eV) overestimates the energetics considerably for all the systems calculated here. The deviation is over 0.8 eV/atom for cohesive energy of αU and mostly over 0.05 eV/atom for enthalpy of formation of other phases (The values are given in Table 1, and their statistics in Table 2). Particularly, for δ(U,Zr) which is stable at low temperature and therefore should have negative enthalpy of formation at 0 K, DFT calculation gives a considerably positive enthalpy of formation, 0.043 eV/atom, while CALPHAD models gave -0.013[6], -0.045[42] and 0 eV/atom[43] and an available calorimetry experiment[44] gave -0.04±0.11 eV/atom (-4.0±10.1 kJ/mole). Our DFT result is, however significantly different from Landa et al.’s DFT result of -0.065 eV/atom[39], which is quite negative. We give a detailed analysis of the discrepancy here. The key differences between Landa et al.’s ab initio approach and ours are 1) method to treat the disordered B site—we use SQS and they use the CPA; and 2) basis sets and potential—we use PAW and they use EMTO, although neither PAW nor EMTO is a strictly full potential method. The first difference (i.e., CPA vs. SQS) can probably be ruled out as a source of large discrepancy, because as we will show later below our DFT calculations using PAW-SQS do well reproduce the enthalpy of mixing for γ(U,Zr) from Landa et al.‘s KKRASA-CPA calculations[39], which is also very close to their FPLMTO-SQS calculations. Now consider the second difference (EMTO vs. PAW). PAW is fully capable of modeling both U and U-Zr. For U metal, PAW was shown in a number of previous studies[45-47] to reproduce its structural, elastic and phase stability properties reasonably well. As an example, we compare our calculated enthalpy of formation for γU in Table 1Our PAW calculation gives 0.241 eV/atom, which is very close to FPLMTO’s 0.223 eV/atom[48], FPLAPW’s 0.265 eV/atom[49], and LCGTO-FF’s 0.249 eV/atom[49] and is essentially the same as that of another PAW study[47] (0.24 eV/atom, not tabulated in Table 1). Besides U metal, our PAW calculations reproduce the mixing enthalpy of γ(U,Zr) from Landa et al.’s EMTO and FPLMTO calculations as already mentioned above. What about EMTO? Interestingly, the same group of authors Bajaj and Landa et al. in another study[50] found a similarly large difference between their calculations using EMTO and FPLMTO for δ (U,Ti) that has the same C32 crystal structure as δ(U,Zr). For δ(U,Ti), their EMTO calculations gave a formation enthalpy of –0.402 eV/atom (-38.806 kJ/mole) while their FPLMTO gave -0.268 eV/atom (-25.865 kJ/mole)—the difference is -0.134 eV/atom (12.941 kJ/mole). Besides, they also estimated PAW would give -0.368 eV/atom (-35.483 kJ/mole) based on a third party calculation[51], which is also 0.034 eV/atom (3.323 kJ/mole) higher than EMTO’s. Because δ(U,Ti) is completely ordered on both A and B site, SQS or CPA is not necessary to model it. So it is clear that the difference should be between EMTO and FPLMTO/PAW methods themselves. Considering EMTO gives a significantly lower

12
enthalpy than FPLMTO for δ(U,Ti) and also that FPLMTO is one of the most accurate full potential method, it is possible that EMTO similarly underestimates enthalpy for δ(U,Zr) and hence explaining the large difference between our and Landa et al.’s DFT results.
Figure 2. Energetics for U metal: a) cohesive energy for αU; enthalpy of formation for b) βU and c) γU. The vertical dash reference line is at Ueff=1.24 eV. Experimental cohesive energy of αU is from Ref. [52]; CALPHAD models are from Xiong et al. [6], Kurata[42], and Chevalier et al[43] which all use the same SGTE data for pure elements[53] and give the same enthalpy of formation for βU and γU.

13
Figure 3. Enthalpy of formation for U-Zr alloy: a) α(U) (6.3 at.% Zr), b) β(U) (3.3 at.% Zr), c) δ(U,Zr) (66.7 at.% Zr) and d) α(Zr) (93.8 at.% Zr), The vertical dash reference line is at Ueff=1.24 eV. Experimental enthalpy of formation for δ(U,Zr) -0.04±0.11 eV/atom is from Nagarajan et al.[44]; the very large error bar is not plotted in c). CALPHAD models are from Xiong et al.[6], Kurata[42], and Chevalier et al.[43].
What about DFT+U? Figure 2 and Figure 3 show that when we apply DFT+U with a gradually increased Ueff, calculated energetics will firstly decrease and approach CALPHAD values. For example, DFT+U gives 0.009 and -0.006 eV/atom at Ueff=1.24 and 1.49 eV, respectively for the enthalpy of formation of δ(U,Zr), which are finally reasonable comparing to both experiment and CALPHAD models. Ab initio energy curves generally cross the CALPHAD lines in the range between Ueff =1 and 1.5 eV. The point of crossing varies somewhat among different systems, and is usually before the point where the energy drops to minimum near Ueff=2 eV. After the minimal points, the

14
curves rise drastically and for most systems they will cross the CALPHAD lines again. We stress that neither the minimal nor the second cross should be picked as the empirical Ueff and we will explain the reason when we discuss the electronic structure below. Finally SOC and noSOC energetic curves in Figure 2 and Figure 3 show very similar qualitative features as functions of Ueff, but those of SOC are almost always below noSOC in the whole range of 0-4 eV range, showing including SOC will improve the energetics, which reflects correct physics and is totally expected for these actinide systems. Table 1. Energeticsa for solid phases of U, Zr metal and U-Zr alloy (unit: eV/atom).
Phase Composition (at.% Zr)
DFT (0 K)
DFT+Ub (0 K)
CALPHAD (300 K)
DFT-Refs. (0 K)
Expt. (var. T)
noSOC SOC noSOC SOC Xiong et alc Kuratad Chevalier
et ale
αU 0 6.375 6.246 5.421 5.326 5.55j α(U) 6.3 0.058 0.044 0.046 0.041 0.025 0.018 0.022 βU 0 0.110 0.063 0.086 0.049 0.033 0.033 0.033
β(U) 3.3 0.125 0.099 0.078 0.062 0.044 0.049 0.051
γU 0 0.282 0.239 0.205 0.173 0.099 0.099 0.099 0.223/ 0.265/ 0.249f
γ(U,Zr)
6.3 0.038 0.040 0.018 (0.023)
0.006 (0.021) 0.026 0.038 0.036
25.0 0.107 0.098 0.037 (0.058)
0.006 (0.036) 0.067 0.119 0.112 0.102g
50.0 0.124 0.101 0.036 (0.058)
-0.006 (0.024) 0.060 0.150 0.138 0.120g
75.0 0.071 0.050 0.013 (0.027)
-0.012 (0.003) 0.026 0.107 0.097 0.067g
93.8 0.019 0.011 0.001 (0.006)
-0.007 (-0.003) 0.004 0.031 0.030
βZr 100 0.079 0.078 0.076 0.076 0.076
δ(U,Zr) 66.7 0.058 0.043 0.026 (0.014)
0.009 (-0.006) -0.013 -0.045 0.000 -0.065h -0.04±0.1k
ωZr 100 0.001 0.001 0.005 0.011 0.000 0.006i α(Zr) 93.8 0.067 0.056 0.042 0.044 0.023 0.023 0.022 αZr 100 6.160 6.158 6.25j
aCohesive energy for αU/αZr, enthalpy of mixing for γ(U,Zr), and enthalpy of formation for all other phases. bResult at Ueff=1.24 eV for all is given; additional result at Ueff=0.99 eV for γ(U,Zr) and at Ueff=1.49 eV for δ(U,Zr) is also given in parenthesis. DFT+U is not applied on Zr in all calculations. cXiong et al. in Ref. [6]. dKurata in Ref. [42]. eChevalier et al. in Ref. [43]. fSoderlind’s FPLMTO in Ref. [48], and Boettger’s FPLAPW and and LCGTO-FF in Ref. [49]. gLanda et al.’s FPLMTO-SQS result in Ref. [39]; their KKR-ASA-CPA result is similar and not tabulated but plotted in Figure 5.

15
hLanda et al.’s EMTO-CPA results in Ref.[39]. iEstimated from Landa et al.’s FPLMTO result (FIG. 9 in Ref. [39]). jKittel in Ref. [52]. kNagarajan et al.’s experimental result at 298 K in Ref. [44].
Putting all these energetic data together, let us look at the root mean square (RMS) of the differences between ab initio and CALPHAD energetics as a function of Ueff in Figure 4. It shows that no matter which CALPHAD model we compare to, DFT always overestimates enthalpies significantly, and DFT+U always matches CALPHAD values better than DFT at Ueff ~ 1-1.5 eV. A statistically optimal Ueff is 1.24 eV although the RMS of differences is very close in the whole 1-1.5 eV range. Note we do not include the cohesive energy for αU in Figure 4. The reason is that cohesive energy does not directly impact phase stability as modeled in CALPHAD and including it will sweep the statistics because it is an order of magnitude larger than the formation enthalpies that are our major interest. However, the trend in cohesive energy as a function of Ueff is similar to those found for the enthalpies in Figure 2 and Figure 3.
Figure 4. RMS of enthalpy differences between Ab initio and CALPHAD for all solid phases of U metal and U-Zr alloy except αU and γ(U,Zr). DFT is at Ueff=0 eV while DFT+U is at Ueff > 0 eV. CALPHAD models are from Xiong et al. [6], Kurata[42], and Chevalier et al.[43]. See Error! Reference source not found. for quantitative statistics.
The above visual impressions from Figure 4Figure 4are confirmed by quantitative statistics listed in Table 2. The RMS of the differences in energetics between DFT and CALPHAD is approximately 0.10 and 0.07 eV/atom without and with SOC included, respectively. DFT+U at Ueff=1.24 eV reduces it to 0.04 and 0.02 eV/atom. These together show that the improvement of DFT+U over DFT is ~0.05 eV/atom (~5 kJ/mole) and the effect of SOC is ~0.02 eV/atom (~2 kJ/mole). The former is a substantial amount of
16
energy in the context of CALPHAD modeling, and the latter, despite smaller in extent, is not negligible either. Our systematic model validation here shows that DFT significantly overestimates energetics, so it is necessary to go beyond DFT to treat correlation in U and U-Zr for applications that requires high energetic accuracy and DFT+U with Ueff =1.24 eV seems a promising option. The relativistic effect of SOC is relatively small but should be included for applications that demand best accuracy. Table 2. Differences in energetics between DFT, DFT+U (1.24 eV) and CALPHAD for all solid phases of U metal and U-Zr except αU and γ(U,Zr)a (unit: eV/atom).
CALPHAD Model
Statistics of Differencesa
DFT DFT+U noSOC SOC noSOC SOC
Xiong et al.c
RMS 0.095 0.071 0.038 0.022 Mean 0.081 0.060 0.027 0.009
Max positive 0.183 0.140 0.079 0.045 Max negativef N/A N/A N/A -0.010
Kuratad
RMS 0.099 0.076 0.045 0.030 Mean 0.086 0.065 0.032 0.014
Max positive 0.183 0.140 0.079 0.053 Max negativef N/A N/A N/A -0.015
Chevalier et al.e
RMS 0.092 0.069 0.035 0.021 Mean 0.077 0.057 0.024 0.006
Max positive 0.183 0.140 0.079 0.045 Max negativef N/Ae N/Ae N/Ae -0.017
aαU is used as reference and γ(U,Zr) is controversial due to mechanical instability. bRMS is root mean square. Positive/negative difference means ab initio enthalpy is larger/smaller than CALPHAD’s. cXiong, et al. in Ref [6]. dKurata in Ref.[42]. eChevalier et al. in Ref. [43] fN/A means none of ab initio values is smaller than CALPHAD’s.
With experiences gained on the above well established phases, we now proceed to the controversial high temperature bcc solid solution phase γ(U,Zr), and show its enthalpy of mixing in Figure 5. First of all, our DFT calculations using PAW-SQS give the enthalpy to be strongly positive (>0.1 eV/atom) and overall symmetric as a function of composition in the whole region from 0 to 100 at.%Zr. As mentioned above when discussing δ(U,Zr), it is almost identical to Landa et al.’s DFT result from FPLMTO-SQS[39] (circle dots), which is also very close to their DFT result from KKRASA-CPA[39] (cross dots). Note they do not include SOC in neither of the calculations and we should compare their results to ours in the left figure of Figure 5. These DFT results also reproduce Kurata[42] (green dash curve) and Chevalier[43] et al’s (red dash curve)’s CALPHAD results well, all suggesting strong demixing of bcc U and Zr. However, a latest CALPHAD model[6] (black dash curve) gives a mixing enthalpy that is 1) only slightly positive and 2) asymmetric with the U-rich end higher. Based on our experience on the other phases in Figure 2 and Figure 3, our most accurate predictions should be from DFT+U at Ueff 1-1.5 eV, which very interestingly all also give weekly positive (or even slightly negative on the Zr rich end) and asymmetric mixing enthalpy. It should be
17
pointed out that this latest CALPHAD model by Xiong et al.[6] was developed in our group with knowledge of ab initio results reported here; however, attempt was deliberately made not to fit its model parameters to our ab initio results but only to best available experiments in order to provide an independent source of reference. Showing excellent match with experimental phase boundary and heat capacity data in wide composition and temperature ranges, Xiong et al.’s CALPHAD model[6] is in no way less accurate, and in some ways more accurate than previous CALPHAD models, suggesting that the weaker demixing found here is possible and does not contradict with existing experimental data. Note that our DFT+U result at 1.24 eV from SOC is slightly negative on the Zr rich end, and is about 0.04 eV/atom below at the maximum point from that of Xiong et al.’s, while the one at Ueff=0.99 eV or even 0.49 agrees with it better. It is possible that we should use a smaller Ueff value for example 1eV for γ(U,Zr), rather than 1.24 eV, because as we see inFigure 2 and Figure 3, the point of Ueff where DFT+U curves cross CALPHAD does vary slightly between 1 and 1.5 eV among different phases. However, due to the possible error in our ab initio energetics resulted from constrained relaxation and other approximations and also considering the error bar of CAPHAD energetics, the two sets of energetics can still be considered as reasonably consistent. Besides all the above modeling studies, one experimental measurement of the mixing enthalpy of γ(U,Zr) by emf at 1073 K[54] is available (not plotted in Figure 4). The emf result is substantially negative explaining the complete miscibility between bcc U and Zr at such high temperature. Due to the huge temperature difference, our modeling results cannot be directly compared to it in terms of quantitative values. Yet it is interesting to note that the emf enthalpy is also asymmetric with U-rich end higher. The fact that both our DFT+U calculation and the latest CALPHAD model[6] reproduce the same asymmetry of the experimental emf data suggests that our prediction is possibly closer to the true value. Overall, there are still controversies on this high temperature phase due to the scattering of previous results, the scarcity of direct experimental thermochemical data, and the uncertainty resulted from our model approximations, and we call for more experimental measurements to resolve this controversy.

18
Figure 5. Enthalpy of mixing for γ(U,Zr). DFT results are from Landa et al.’s noSOC calculations[39]; CALPAHD models are from Xiong et al.[6], Kurata[42] and Chevalier et al.[43]. Ueff used for DFT+U is given in parentheses in the legend.
2). Volume Next we present the calculated volume, which is tabulated in Table 3 for all systems
of U, Zr metal and U-Zr alloys at the two Ueff points of 0 and 1.24 eV only, as well as plotted in Figure 6 for U metal and U-Zr alloy only in the whole region of Ueff =0-4 eV. Again, we discuss the results in terms of DFT vs. DFT+U, and noSOC vs. SOC.

19
Figure 6 .Volume for all solid phases of U metal and U-Zr alloy as a function of Ueff: a) αU; b) α(U) (6.3 at.% Zr); c) βU; d) β(U) (3.3 at.% Zr), e) γU; f) γ(U,Zr) (6.3 at.% Zr); g) γ(U,Zr) (25.0 at.% Zr); h) γ(U,Zr) (50.0 at.% Zr); i) γ(U,Zr) (75.0 at.% Zr); j) γ(U,Zr) (93.8 at.% Zr); k) δ(U,Zr) (66.7 at.% Zr); and l) αZr (93.8 at.% Zr). The vertical dash reference line is at Ueff=1.24 eV. Experiments data are from those referenced in Table 3; no direct experimental data are found for b), d), f), j) and k).
Firstly, for all the three phases of U metal, volumes calculated by DFT are smaller than the experimental data. The point is best illustrated by αU, as it is the stable phase of U metal at zero K (the ground state phase) that has best low temperature experimental data[55] available. As tabulated in Table 3, the experiment in Ref.[55] measured its volume to be 20.58 Å3/atom at 4.2 K. Using PAW, we get 20.06 and 20.07 Å3/atom from noSOC and SOC calculations, respectively, which are about 3% smaller than experiment. They are quite close to what was obtained in a previous PAW study[47]—20.19 and 20.07 Å3/atom from noSOC and SOC calculations, respectively (not tabulated in Table 3). To see if the error is due to the pseudopotential approximation of PAW, we further

20
compare them to ab initio results obtained from full potential methods. The FPLMTO method[48] got ~20.45 (estimated from FIG. 6 in Ref. [48]) and 20.67 Å3/atom from noSOC and SOC calculations, respectively. However, an earlier SOC calculation[56] by the same author using the same FPLMTO method and GGA functional obtained 19.49 Å3/atom (not tabulated in Table 3). Another full potential method FPLAPW13, 14 gives 20.41 and 20.76 Å3/atom from noSOC and SOC calculations, respectively. The full potential values are about 2% larger than our PAW values, so the pseudopotential approximation probably has contributed part of the underestimation. Nevertheless, full potential values at least from noSOC calculations are still smaller than the experimental value by about 1%; those from SOC calculations are not all consistent—the smallest value is 5% below but the largest one is about 0.5% over the experimental value. However, in a previous high throughput study[57] of 10,768 compounds in the International Crystal Structure Database, it is found that the median error for DFT-GGA’s volume prediction is positive (i.e. overestimated) 3.2%; also as a specific example, as listed in Table 3, our own calculations show that DFT-GGA overestimates the volume of αZr by about 1.3%. So, if it is still debatable to suggest that DFT-GGA underestimates the volume of U metal in the absolute sense, it is definitely safe to argue that DFT-GGA’s volume prediction for U metal is biased towards the negative (i.e., underestimated) end in the statistical distribution of the volume prediction errors. Such finding is not surprising. In fact, it follows the general trend of DFT-GGA’s underestimation of the volume of actinide metals[58]. The trend debatably starts at U, as we have discussed above, and becomes more significant as the atomic number increases—for Np and Pu the calculated volumes are clearly smaller than experimental values even in the most accurate full potential calculations with SOC included (see TABLE I of Ref.[58]). Since the correlation effects become more pronounced with higher atomic number along the actinide series, it is expected that the volume underestimation is due to the correlation effects. Table 3. Volume for U, Zr metal and U-Zr alloy (unit: Å3/atom).
Phase Composition (at.% Zr)
DFT (0 K)
DFT+U (1.24 eV) (0 K) DFT-Refs.
Expt. (var. T) noSOC SOC noSOC SOC
αU 0 20.06 20.07 20.75 20.94 20.67/20.39/20.5i
(0 K) 20.58 (4.2 K)a
α(U) 6.3 20.50 20.57 21.19 21.39 βU 0 20.49 20.49 21.51 21.91 21.81 (955 K)b
β(U) 3.3 20.63 20.62 21.75 22.07
γU 0 20.13 20.17 21.28 22.77 20.71/20.51/20.29i
(0 K) 22.05b/21.07c (1060
/1073 K)
γ(U,Zr)
6.3 20.36 20.41 21.96 22.79 25.0 21.10 21.18 22.62 23.20 22.25 (300 K)j 22.37 (room T)d 50.0 21.97 22.06 23.02 23.33 22.90 (300 K)j 22.29 (room T)d 75.0 22.43 22.60 23.04 23.23 23.52 (300 K)j 22.75 (room T)d 93.8 22.88 22.86 23.01 22.97
βZr 100 22.91 22.91 22.71e δ(U,Zr) 66.7 22.61 22.68 22.99 23.17 22.49(0 K)k 22.49(room T)f

21
ωZr 100 23.28 23.31 22.75(room T)g α(Zr) 93.8 23.54 23.55 23.66 23.68 αZr 100 23.52 23.55 23.22h
aRef. [55]. bRef. [59]. cRef. [60]. dRef. [61]. eRef. [62]. fRef. [63]. gRef. [64]. hRef. [65]. iSoderlind’s FPLMTO in Ref. [48], and Boettger’s FPLAPW and and LCGTO-FF in Ref. [49]. jLanda et al.’s KKRASA-CPA results at 300k in Ref. [39]. kLanda et al.’s EMTO-CPA results at 0K in Ref.[39].
Different from U metal, U-Zr alloy only has experimental volume data available for γ(U,Zr) at 25, 50 and 75 at.%Zr and for δ(U,Zr) at 66.7 at.%Zr. For γ(U,Zr), DFT seems to underestimate the volumes to certain extent at all the three compositions, which is consistent with what we get for U metal above. δ(U,Zr)’s volume are 22.61 and 22.68 Å3/atom from noSOC and SOC calculations, respectively, which are nevertheless larger than the experimental value[63] of 22.49 Å3/atom. However, the result seems to be quite sensitive to the choice of PAW potential, because our earlier DFT calculations based on the PAW potential for Zr that treats 5s24d25p0 as valence orbitals obtained the volume of δ(U,Zr) at 66.7 at.%Zr to be 22.00 and 22.08 Å3/atom in noSOC and SOC calculations, respectively, which are both about 2% smaller than the experimental value. Our PAW results based on both of the PAW potentials of Zr are again different from Landa et al.’s EMTO result[39] that does not include SOC but already matches the experimental value almost perfectly. The discrepancy can be due to similar reasons that explain the difference in our calculated enthalpies for δ(U,Zr) discussed above, but can also stem from approximations in our calculations such as pseudopotential. Other alloyed phases do not have direct experimental volume data, but we can assume the trend will be similar.
What about DFT+U? Figure 6 shows that the calculated volumes increase monotonically with Ueff from 0 to 4 eV for all the twelve systems, and therefore in general they will reproduce the experiment values at some reasonable Ueff. However, unlike energetics from CALPHAD that have been extrapolated to low temperature, many of the available experimental volume data are measured at high temperatures that contain considerable finite temperature effects neglected in our calculations; the zero point effects are also not included. Moreover, the supercell approximation for U-Zr alloy in general and the constrained relaxation for γ(U,Zr) may also introduce some uncertainty. We therefore refrain from quantitative fitting of the calculated volumes to experimental volume data for an optimal Uef here. Nevertheless, if we only make a crude observation, Figure 6 shows that optimal matches with experiment again seem to happen near Ueff=1.24 eV (the vertical dash reference lines). Besides comparing to experiments, we note that the calculated volume increases almost linearly in three stages with different slopes as a function of Ueff. The phenomenon is negligible at 93.8 at.%Zr for both γ(U,Zr) and α(Zr) but becomes more pronounced with increased U concentration and is most

22
obvious in αU. We will keep finding such three-stage differentiation on other calculated properties below.
Regarding the effect of SOC on volume, for all systems in Figure 6, volumes from SOC calculations are slightly larger (<0.5%) than or at least equal to those from noSOC when using both DFT and DFT+U with Ueff in the reasonable range of 0 to 2 eV (the meaning of “reasonable” will become evident after we discuss other calculated properties below). Especially, this is true for all the three solid phases of U metal, which reflects correct physics[66] and agrees with previous full potential studies using FPLMTO16,
83and FPLAPW[48, 58, 66], as we have discussed above.
On the whole, the above results of calculated volumes suggest that correlation effects also have a significant impact on volume: based on GGA, DFT under-predicts the volume of U and U-Zr, and the error is somewhat corrected using DFT+U. The relativistic effect of SOC is also relevant, which increases the volume and brings in further improvement. Such results on volume are consistent with those on energetics discussed above.
3). Magnetic Moments

23
Figure 7. Spin, orbital and total magnetic moments for all solid phases of U metal and U-Zr alloy as functions of Ueff: a) αU; b) α(U) (6.3 at.% Zr); c) βU; d) β(U) (3.3 at.% Zr), e) γU; f) γ(U,Zr) (6.3 at.% Zr); g) γ(U,Zr) (25.0 at.% Zr); h) γ(U,Zr) (50.0 at.% Zr); i) γ(U,Zr) (75.0 at.% Zr); j) γ(U,Zr) (93.8 at.% Zr); k) δ(U,Zr) (66.7at.% Zr); and l) αZr (93.8 at.% Zr). The vertical dash reference line is at Ueff=1.24 eV. The unsmooth segment between 1.5 and 2.0 eV for γ(U,Zr) (75.0 at.% Zr) might be metastable solutions.
The calculated spin, orbital and total magnetic moments are given as functions of Ueff for all solid phases of U metal and U-Zr alloy in Figure 7. The magnetic moments evolve in three stages as well. Initially, total magnetic moments are zero for all systems; spin/orbital moments are also zero for U metal and U-Zr alloy with high U concentrations, and are finite but small for U-Zr alloy with low U concentration After a threshold value of Ueff, total magnetic moments emerge and start to increase with larger Ueff. Finally, these moments level out after reaching a certain saturation level. The empirical optimal Ueff=1.24 eV from energetic and volume fitting in general lies in the first stage. We comment on the magnetic configurations of U and U-Zr next. Experimentally, αU is confirmed Pauli paramagnetic with vanishing local magnetic moments (<0.005μB/atom) [22, 23] and βU and γU show similar behavior in magnetic susceptibility measurement[22, 23]. Our DFT calculations indeed get zero magnetic moments on every atomic site for all three phases of U metal, and therefore correctly reproduce its magnetic structure. For U-Zr alloy, DFT also gets no local magnetic moments on the U-rich end but seems to like some moments on the Zr-rich side, which are on U rather than Zr atomic sites though. Note γ(U,Zr)’s results here are from constrained relaxation only. If fully relaxed, they are also found to have vanishing local spin and orbital magnetic moments. On the other hand, DFT+U at Ueff =1.24 eV in general gets non-zero local spin magnetic moments for at least some of the atomic sites even in U metal. However, these moments are very small, close to zero for U metal and not exceeding 0.5 μB even in the Zr-rich U-Zr alloy systems; moreover the local spin moments are also largely canceled by orbital moments. Take αU as an example. At Ueff =1.24 eV the spin moments for αU on each of the two atomic sites are 0.045 μB and the orbital moments are -0.043 μB. The uncompressed 0.002 μB total local moments are antiparallel between the two sites and give zero integrated total magnetic moments. The antiparallel alignment complies to Hund’s third rule which indicates that spin-orbit coupling in U metal is correctly described in the LS coupling limit, as suggested for example in Ref. [67]. For other systems with larger supercells, local magnetic moments, if existing are quite random in terms of both magnitude and direction, and we do not observe any long-range ferromagnetic or antiferromagnetic ordering. Most importantly, the total magnetic moments on each atomic site are still very small at this point. Therefore, DFT+U at Ueff =1.24 eV can still be considered as giving no ordered magnetism for U and U-Zr. In short, DFT+U promotes spin/orbital polarization, which are still quenched at small Ueff but emerge at larger Ueff. At the empirical 1.24 eV, total magnetic moments are still zero in general and no long range magnetic ordering is observed. Our DFT and DFT+U at small Ueff values both correctly reproduce the paramagnetism in U metal. We did not find experimental study of U-Zr alloy’s magnetic structure, but our current ab initio calculations suggest that U-Zr alloy is possibly paramagnetic as well, at least on the U-rich end.

24
4). Electronic structure Next we show that DFT+U’s improvement in the calculated energy and volume
relative to DFT is not fortuitous—it is based on better account of the electronic structure. We make the case on experimentally most-characterized system αU by comparing its calculated valence band electronic structure to experimental photoelectron spectra in Figure 8 and Figure 9.
Figure 8. Band structure (left panel) and density of states (right panel) for αU. The respective experimental references are ARPES spectra from Opeil et al.[68] and UPS spectra from Opeil et al.[69] for αU(001) single crystal. All experimental spectra are plotted as blue circles, while DFT and DFT+U (Ueff=1.24 eV) calculated results are plotted as black and red curves, respectively; solid and dash line style distiguish noSOC and SOC. On the left, green arraws indicate two representative improvements of bands going from DFT to DFT+U. On the right, the positions of peaks from experiment, DFT and DFT+U are marked with blue, black and red arrows, respectively. Gray areas on the left and dash arrows on the right indicate spectra features from surfaces states that are not modeled in the calculations. Only the occupied part between -4.5 and 0 eV relative to Fermi level is shown. See FIG. 2 in Ref.[68] for an illutration of Brillouin zone and the special k-points used here.
Let us first focus in Figure 8 on the occupied part between -4.5 and 0 eV relative to Fermi level. Here, latest experimental ARPES[68] and UPS[69] spectra of αU (001) single crystal are used as references for the calculated band structure (left panel) and density of states (DOS, right panel) of bulk αU, respectively. Before we start the comparison, a few clarifications regarding the experimental spectra should be made. Firstly, some features of the spectra are due to surface states as the escape depth of the phonon source used is “at most 2-3 atomic layers”[68]. Some of the possible surface states features are suggested based on DFT calculations of bulk αU[68, 69]. These features are marked roughly with gray areas on the left and dash arrows on the right panel of Figure 8. They are not expected to exist in our ab initio results. Second, the UPS

25
spectra in Figure 8 reflect states mainly along the ΓΖ direction (we follow the k-point designation given in FIG. 2 of Ref. [68]). Our calculated DOS is however total DOS (TDOS) integrated over the whole Brillouin zone and thus may show additional features not seen in the UPS spectra. On the other hand, the ARPES spectra reflect mainly states along k-vectors in the (001) plane that is normal to ΓΖ, so the ARPES and UPS spectra may not strictly align with each other. However, the anisotropy of electronic states for such metallic system should be small and we can probably still make meaningful comparison between the three groups of data. Finally, the UPS spectra are not normalized, so their absolute intensity is not comparable to the calculated DOS, and we should focus the comparison on energy.
Now we start our discussion with the right panel of Figure 8. There the UPS spectra mainly show five peaks at -0.1, -0.3, -1.2, -2.2 and -3.2 eV, respectively, which are marked with blue arrows. The two at -0.1 and -2.2 eV are suggested to be surface states[69], and their arrows are dashed and annotated with text. The remaining three peaks all show up in the calculated TDOS, which are marked correspondingly with black and red arrows for DFT and DFT+U. Moreover, two additional small peaks also exist near -2.7 and -4.2 eV (not marked) in the calculated TDOS, which are not seen in the UPS spectra (not to confuse the TDOS peak near -2.7 eV with the UPS surface state peak near -2.2 eV). As explained above, they are presumably from electronic states along other directions of the Brillouin zone, for example those shown on the left panel of Figure 8. In fact, these additional two DOS peaks’ positions are consistent with where some bands turn around on the left. We neglect the two UPS peaks due to surface states and the two TDOS peaks not existent along the ΓΖ direction, and focus on the three peaks near -0.3, -1.2, and -3.2 eV. For the sake of convenience, we will refer to them as peak I, peak II and peak III, respectively in the next. Figure 8 shows that peak I and peak II from DFT shift downwards to -0.4 eV and -1.4 eV, respectively, while peak III does not change much relative to UPS. To see if the difference is due to the direction of the UPS spectra, we cite the directional DOS (DDOS) calculated exactly along ΓΖ with DFT-GGA in Ref. [69], which shows that peak I also downshifts to -0.6 eV, while peak II and III are rather well reproduced. So the error of downward shifting of peak I should be real while that of peak II is possibly artificial and due to anisotropy. Such result is totally expected. If we look at the orbital projected DOS of αU in the first row of Figure 9, we will find that f-states dominate mainly between 0 and -1.3 eV. So peak I is mainly due to f-states, while peak II and III are probably more of other states (i.e., s- and d- states). The above analysis points to peak I as a key indicator of the correlation effects and how well they are modeled. Now we present a key point of Figure 8: peak I from DFT+U is shifted upwards with respect to DFT to around -0.35 eV, partially correcting the downward shifting error and is therefore in better agreement with UPS. The shift in energy seems relatively small (about 0.1 eV), but peak I is directly below Fermi level and has the largest magnitude among the peaks below Fermi level, so the effect is still significant. Besides position, the magnitude of peak I from DFT+U is also larger than DFT. It is in fact another improvement that is not evident in Figure 8 in which UPS spectra’s absolute magnitude is not meaningful, as mentioned above, but will become clear below when we compare them to the properly normalized spectra in Figure 9. All these factors make the seemly small change in peak I a substantial improvement.
26
Next we show that we can draw similar conclusions from band structure, which is shown along the three k-vectors Σ-Γ, Γ-Δ-Υ, and Γ-S on the left panel of Figure 8. In general, six bands exist between -0.2 to -4.5 eV in all the three directions although the highest one of them actually extends above Fermi level between Δ-Υ. We will name them band I, II, …, and VI from top to bottom, respectively. They can be easily identified near Γ although band II and III are almost degenerate at Γ. The band that is directly above the six also has some segments extending below Fermi level to about -0.2 eV, which show up in the Σ-Γ and Γ-S directions, but its major parts are above it and unoccupied, and thus we will neglect it in our discussion below. For the band structure calculated by DFT (black curves), our result is generally consistent with Opeil et al.’s DFT calculation[68] (not shown in Figure 8); but two major differences exist, which may be due to factors like the pseudopotential approximation used in our calculation and the lacking of structural relaxation in the theirs[68]. The first difference is that band V and band VI are almost degenerate at Γ in Ref. [68] but are about 0.8 eV split in Figure 8. Nevertheless, bands V and VI are low-lying and mostly not f-states, so they are expected not to affect the property of U metal much. The other difference happens on all the five bands II-VI along Δ-Υ (remember band I is above Fermi level there). For example, Ref. [68] gives that band II is also above Fermi level like band I, while our calculation obtains band II to be between -0.1 and -0.8 eV. Despite so, it should be noticed that Δ and Υ are relatively low-symmetry k-points and carry much less weight comparing to high-symmetry k-points such as Γ. Encouragingly, our calculations show good agreement with Opeil et al.’s for bands I-IV around Γ (i.e., Σ-Γ, Γ-Δ, and Γ-S), which exist mainly between -1.5 to 0 eV, and we will focus on them when making the comparison between DFT, DFT+U and ARPES spectra next. The ARPES spectra[68] we reference to in Figure 8 are to our knowledge the latest and probably the best experimental data of such kind so far. Yet they still do not reach the resolution that can differentiate the six bands without ambiguity and are also contaminated by surface states. By projecting their DFT calculated bands of bulk αU onto (001) plane, Ref. [68] identified some possible surfaces, which are marked in Figure 8 with shaded areas. It should be noted that those intensive spectra features between -1.3 and -2.3 eV along Δ-Υ are not among such states. We nevertheless doubt that some of them may still be artificial, especially those below -1.6 eV where the corresponding DOS is quite flat. Despite all the above imperfections, we can get the following key conclusion from band structure results in Figure 8: bands I-IV around Γ from DFT+U are shifted upwards by about 0.1 eV or more with respect to DFT. The effect is most obvious for band I around Γ (marked with two green arrows) above which some ARPES spectra features happen to exist. The upward shifting brings calculated band I closer to these spectra, which is consistent with what happens for peak I of DOS on the right panel of Figure 8.
Overall, Figure 8 shows that DFT+U at Ueff=1.24 eV obtains better electronic structure for αU than DFT by shifting upwards and intensify some f-states directly below Fermi level, which we argue is the underlying mechanism that leads to the improvement in the calculated energetics and volume shown above.
Figure 8 also provides some insights on the relativistic effect of SOC. In terms of DOS, the intensity of peak I increases, peak II decreases, and peak III also increases due to SOC (the increasing/decreasing is illustrated with the directions of the arrows in Figure 8). The effect seems most pronounced for peak I from DFT+U calculation (compare red

27
solid and red dash peak I). The positions of these peaks however almost stay the same. Not surprisingly, Figure 8 also shows that there is no significant shifting or splitting of bands due to SOC below Fermi level. In general, there is only small difference between noSOC and SOC in the calculated DOS in the occupied part of valence band shown in Figure 8, which is in agreement with the previous study by FPLMTO [48]. The major effect of SOC that leads to the slight improvement in calculated properties for αU is to adjust the intensity of electronic states. The adjustment is small, and hence the improvement is also not large, about 0.02 eV/atom in terms of energetics, as we have found above.
Figure 9. Density of states for αU as a function of Ueff. The vertical dash reference line is Fermi level. Experimental reference is Baer and Lang’s XPS and BIS spectra[70]. The full valence band, both occupied and unoccupied is shown
Next we look at the full valence band of αU in Figure 9. Here instead of the UPS spectra from Ref. [69] that is used above, we use the X-ray photoemission (XPS) and the bremsstrahlung isochromat spectroscopy (BIS) spectra from Ref. [70] as the experimental
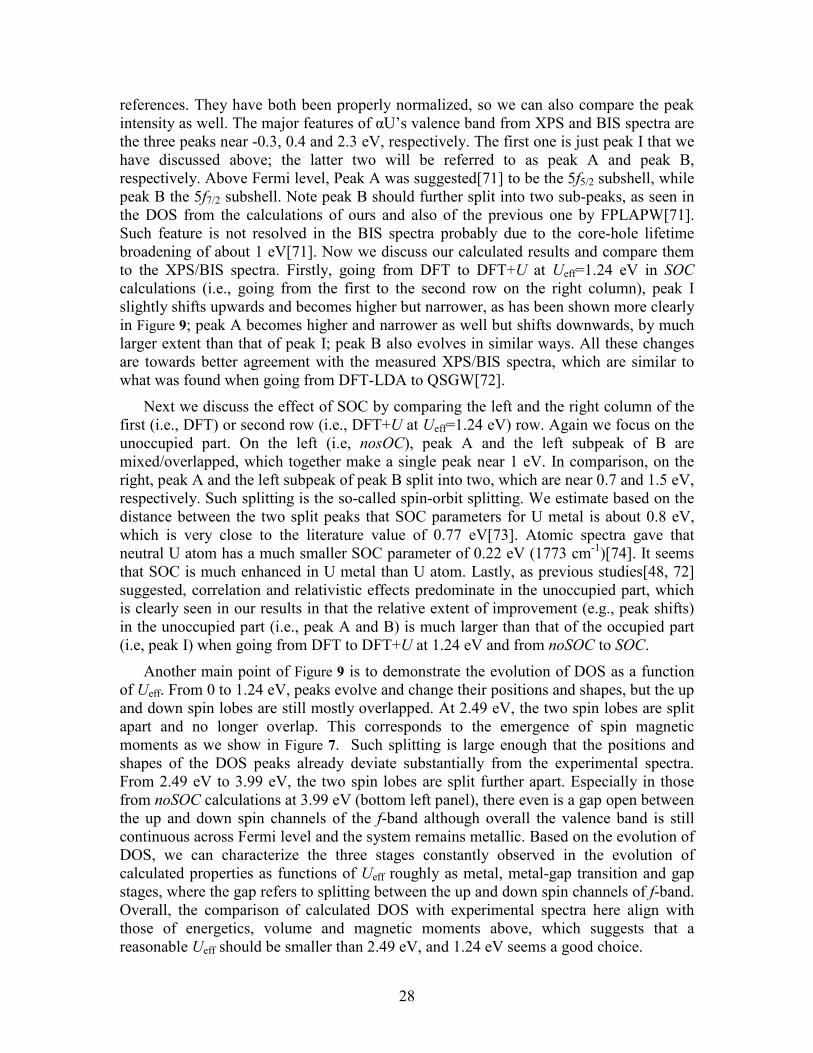
28
references. They have both been properly normalized, so we can also compare the peak intensity as well. The major features of αU’s valence band from XPS and BIS spectra are the three peaks near -0.3, 0.4 and 2.3 eV, respectively. The first one is just peak I that we have discussed above; the latter two will be referred to as peak A and peak B, respectively. Above Fermi level, Peak A was suggested[71] to be the 5f5/2 subshell, while peak B the 5f7/2 subshell. Note peak B should further split into two sub-peaks, as seen in the DOS from the calculations of ours and also of the previous one by FPLAPW[71]. Such feature is not resolved in the BIS spectra probably due to the core-hole lifetime broadening of about 1 eV[71]. Now we discuss our calculated results and compare them to the XPS/BIS spectra. Firstly, going from DFT to DFT+U at Ueff=1.24 eV in SOC calculations (i.e., going from the first to the second row on the right column), peak I slightly shifts upwards and becomes higher but narrower, as has been shown more clearly in Figure 9; peak A becomes higher and narrower as well but shifts downwards, by much larger extent than that of peak I; peak B also evolves in similar ways. All these changes are towards better agreement with the measured XPS/BIS spectra, which are similar to what was found when going from DFT-LDA to QSGW[72].
Next we discuss the effect of SOC by comparing the left and the right column of the first (i.e., DFT) or second row (i.e., DFT+U at Ueff=1.24 eV) row. Again we focus on the unoccupied part. On the left (i.e, nosOC), peak A and the left subpeak of B are mixed/overlapped, which together make a single peak near 1 eV. In comparison, on the right, peak A and the left subpeak of peak B split into two, which are near 0.7 and 1.5 eV, respectively. Such splitting is the so-called spin-orbit splitting. We estimate based on the distance between the two split peaks that SOC parameters for U metal is about 0.8 eV, which is very close to the literature value of 0.77 eV[73]. Atomic spectra gave that neutral U atom has a much smaller SOC parameter of 0.22 eV (1773 cm-1)[74]. It seems that SOC is much enhanced in U metal than U atom. Lastly, as previous studies[48, 72] suggested, correlation and relativistic effects predominate in the unoccupied part, which is clearly seen in our results in that the relative extent of improvement (e.g., peak shifts) in the unoccupied part (i.e., peak A and B) is much larger than that of the occupied part (i.e, peak I) when going from DFT to DFT+U at 1.24 eV and from noSOC to SOC.
Another main point of Figure 9 is to demonstrate the evolution of DOS as a function of Ueff. From 0 to 1.24 eV, peaks evolve and change their positions and shapes, but the up and down spin lobes are still mostly overlapped. At 2.49 eV, the two spin lobes are split apart and no longer overlap. This corresponds to the emergence of spin magnetic moments as we show in Figure 7. Such splitting is large enough that the positions and shapes of the DOS peaks already deviate substantially from the experimental spectra. From 2.49 eV to 3.99 eV, the two spin lobes are split further apart. Especially in those from noSOC calculations at 3.99 eV (bottom left panel), there even is a gap open between the up and down spin channels of the f-band although overall the valence band is still continuous across Fermi level and the system remains metallic. Based on the evolution of DOS, we can characterize the three stages constantly observed in the evolution of calculated properties as functions of Ueff roughly as metal, metal-gap transition and gap stages, where the gap refers to splitting between the up and down spin channels of f-band. Overall, the comparison of calculated DOS with experimental spectra here align with those of energetics, volume and magnetic moments above, which suggests that a reasonable Ueff should be smaller than 2.49 eV, and 1.24 eV seems a good choice.

29
Such pattern for the change of DOS as a function of Ueff is actually quite similar for all solid phases of U metal and U-Zr alloy, as we can see in Figure 10. Although the highest unoccupied part of the valence bands are not shown because they are not included in our calculations due to computing capability limits, the available data in Figure 10 are enough to offer the following insights. Firstly, slightly different from αU, in some systems, like α(U) (6.3at.% Zr) and γU, the two 5f lobes already separate enough at Ueff =2.49 eV to open a gap for the f-band although the whole valence band only shows a pseudo-gap because the d band (blue curves) stays essentially unchanged. The Ueff’s corresponding to the minimum in enthalpy or the second cross with the CALPHAD lines in Figure 2 and Figure 3 are in this region. Such pseudo-gap should be unphysical for these metallic systems and hence the Ueff’s should not be picked as the optimal Ueff. Moreover, the DOS curves in Figure 10 also show the impact on U electronic properties upon alloying with Zr. No significant changes of the position and shape of the valence bands happen after U and Zr is alloyed. This phenomenon is most evident if we look at the DOS curves for γ(U,Zr) at various Zr concentrations between the sixth and the tenth row in Figure 10. They look quite like linear suppositions of the DOS curves for γU and βZr metal end members in the fifth and eleventh row. These trends show that alloying with Zr does not dramatically impact the qualitative U electronic structure, and therefore U-Zr alloy should have similar correlation strength as U metal.

30
Figure 10. Total, d- and f-orbital projected density of states for all solid phases of U, Zr metal and U-Zr alloy as functions of Ueff. The vertical dash reference line is Fermi level.The first column is calculated by DFT, the second, third and fourth by DFT+U at Ueff=1.24, 2.49, and 3.99 eV, respectively. Results from both noSOC (dash) and SOC (solid) are given. The highest unoccupied part of the valence band is missing for some systems due to limited number of bands included in the calculations.
The total f-orbital occupation for U and U-Zr as a function of Ueff is shown in Figure 11. First consider the magnitude of the occupation as calculated by DFT. We point out beforehand that our values presented next are calculated using the quick projection scheme (LORBIT=11) implemented in VASP, and are probably underestimated to some extent possibly because the projection sphere radii are not sufficiently large. For the three allotropes of U metal—αU, βU to γU, the f occupation decreases consecutively from 3.01,

31
to 2.87 and 2.81, respectively. Let us compare our values to the literature. Chantis et al.[72] obtained the f-orbital occupation of αU to be 3.57 and 3.19 respectively from DFT-LDA and QSGW calculations, respectively. Our DFT-GGA calculation gets 3.01 due to the projection issue. U atom has three f electron in the ground atomic state[67]; in crystal it should have less than three due to hybridization with other orbitals such as 6d. Despite the projection issue, our DFT calculations still get a value larger than 3, and hence has reproduced the previous observation[72] that DFT overestimates the f-orbital occupation for U metal. Alloying with Zr in general reduces the f-occupation. The reduction is negligible when the Zr concentration is small. For example, at 3.3 at.%Zr, β(U)’s f-occupation curves are almost indistinguishable from βU’s. However, it becomes more significant when the Zr concentration gets higher. This is most evident if we look at γ(U,Zr), which has f-orbital occupations of 2.78, 2.69, 2.60, 2.57 and 2.57 at 6.3, 25.0, 50.0, 75.0 and 93.8 at.%Zr, respectively, suggesting that at higher Zr concentration the f orbitals of U have stronger hybridization with Zr. Secondly, Figure 11 also shows that similar to QSGW, DFT+U reduces f-orbital occupation relative to DFT for all the systems considered, which serves as another evidence that it models the correlation effects better. These lost charges can be due to the hybridization of f orbitals with other orbitals of U atoms, which is presumably the only mechanism for U metal. For U-Zr alloy, f orbitals can also hybridize with orbitals of Zr atoms—mostly d orbitals, as evidenced by the slightly increased d-orbital occupation of Zr (not shown in Figure 11). Thirdly, SOC also reduces the occupation when Ueff is in the reasonable range of < 2eV (i.e., the dashed curves from noSOC are generally above the solid curves from SOC in this region); the change is marginally small, on the order of 0.001. Finally, for most systems, the total f-orbital occupation decreases in the whole Ueff=0-4 eV range, and there seems to be a slight change of slope near Ueff= 2eV. However, for α(Zr) at 93.8at.% Zr, the occupation starts to recover at Ueff near 2.5 eV. We point out this is probably not an anomaly because in a few systems we also perform calculations that go beyond Ueff=4 eV and find that for them the total f-occupation also goes up at some higher Ueff’s. Therefore, total f-occupation can also be considered to evolve in three stages as a function of Ueff. In general, Figure 11 suggests that the total f-occupation is a good parameter to characterize the correlation effects and how well they are modeled.

32
Figure 11. Total f-orbital occupation for all solid phases of U metal and U-Zr alloy as a function of Ueff. Low and intermediate temperature phases αU, α(U), βU, β(U), α(Zr) and δ(U,Zr) are plotted in the left panel; high temperature phase γU and γ(U,Zr) are in the right. Solid curves are from SOC calculations, while dash from noSOC.
5. Hubbard U for Uranium in U metal and U-Zr alloy Summarizing all the fitting results above suggests that empirical Ueff for U and U-Zr
should be between 1-1.5 eV with the statistical optimal from energetic fitting to be 1.24 eV. How does it compare to theoretical Hubbard U? Note correlation is normally characterized by the ratio U/W where U is Hubbard U and W is valence bandwidth. Therefore, an appropriate energy scale to characterize the magnitude of U is ~4 eV which is W for αU. Table 4 gives that theoretical U goes from 1.87 eV for αU to 2.34 eV for γ(U,Zr) at 50 at.%Zr. So theoretical U’s are close to but larger than the empirical Ueff by 0.63 to 1.1 eV, or 16% to 28% W. This result is not surprising because DFT+U is a based on Hartree-Fock that is known to overestimate spin/orbital polarization and so in real calculations smaller Ueff should be used to compensate the effect. The difference suggests that 1) it may not be optimal to use theoretical U directly in DFT+U calculations of U and U-Zr, and 2) theoretical U’s are still reasonably close to and can definitely provide the guideline for empirical Ueff. Moreover, Table 4 also illustrates the important point that there is only small change of Hubbard U for Uranium between different phases and at different compositions of U and U-Zr. Among different phases, for example, αU, βU and γU have theoretical U values of 1.87, 2.10 and 2.10 eV, respectively and the span is 0.23 eV, or 6% of W. The effect of composition is best illustrated when we look at the bcc

33
phases, γU and γ(U,Zr). We see that when going from 0 to 93.75 at.%Zr, U reaches a maximum of 2.34 eV at 50 at.%Zr, which is about 0.24 eV higher than the minimum at 0 at.%Zr, or 6% W again. The small variations in U suggest that we may use a single Ueff for DFT+U calculations of U and U-Zr. Based on our study, we suggest to use Ueff=1.24 eV. Its magnitude is much smaller than that for U oxides like UO2 for which Ref. [75] suggests the empirical Ueff to be 3 eV. Table 4. Theoretical Hubbard U for Uranium in all solid phases of U metal and U-Zr alloy evaluated with the linear response approach of Ref. [24].
Phase Composition (at.% Zr)
Hubbard U (eV)
αU 0 1.87 α(U) 6.3 1.95 βU 0 2.10
β(U) 3.3 2.20 γU 0 2.10
γ(U,Zr)
6.3 2.15 25.0 2.27 50.0 2.34 75.0 2.20 93.8 2.15
δ(U,Zr) 66.7 2.21 α(Zr) 93.8 2.33
6). Summary In conclusion, we have explored the correlation and relativistic effects in U metal and
U-Zr alloy. All solid phases of U metal and U-Zr alloy have been studied in both DFT and DFT+U calculations without and with SOC included using the effective Hubbard U parameter Ueff ranging from 0 to 4 eV.
DFT overestimates the formation energetics of phases relative to the stable end-members by 0.10 and 0.07 eV/atom without and with SOC as compared to best-established CALPHAD models; DFT+U improves the energetics which matches CALPHAD at Ueff =1-1.5 eV. A statistically best agreement is found at Ueff=1.24 eV with which DFT+U reduces the error to 0.04 and 0.02 eV/atom without and with SOC. Our validated DFT+U approach predicts that the bcc solution phase γ(U,Zr) only has a weakly positive and asymmetric mixing enthalpy, quite different from DFT and previous CALPHAD’s results but consistent with a latest CALPHAD model.
Besides energetics, DFT also underestimates volume, misplaces bands immediately below Fermi level, and overestimates f-orbital occupation, while DFT+U with Ueff=1-1.5 eV consistently improve all these properties, and in general still neither promotes ordered magnetic moments nor opens unphysical band gap, consistent with experiment.
The calculated properties in general evolve as functions of Ueff in three stages, roughly corresponding to metal, metal-gap transition and gap states, where the gap refers

34
to splitting between the up and down spin channels of f-bands.
The empirical Ueff values of 1-1.5 eV are close to but smaller than theoretical estimation of 1.9-2.3 eV that we obtain from the linear response approach. Ueff is found to vary only slightly between different phases and at different compositions of U and U-Zr, and thus a single Ueff =1.24 eV, which is the statistical optimal from energetic fitting is suggested for both U and U-Zr.
The relativistic effect of SOC is found to lower energy by 0.02 eV/atom, increase volume by <0.5%, adjust intensities of states below Fermi level and split bands above it, and also very slightly reduces the f-orbital occupation. It predominates in the unoccupied part of the valence band, so the effect on all these calculated ground state properties is small.
Finally, alloying with Zr generally reduces the f-orbital occupation and increases Hubbard U slightly but does not change the qualitative features of valence bands. U-Zr alloy therefore should have similar strength of correlations as U metal.
5.1.2.2 Calphad modeling
1) Model parameters There are six phases in the U-Zr system: liquid, γ(U,Zr), α(U), β(U), δ, (Zr). The crystal structural information of different solid phases is listed in Table 5, and the models used in different assessments [76-81] are given in
Table 6.
Table 5. Crystal structure information of solid phases in the U-Zr system
Phase Structure name Pearson Symbol / Space Group / Prototype
γ(U,Zr) Bcc_A2 cI2 / Im 3 m / W
β(U) Tetragonal_Ab tP30 / P42/mnm / β(U)
α(U) Orthorhombic_A20 oC4 / Cmcm / αU
(Zr) Hcp_A3 hP2 / P63/mmc / Mg
δ Hexagonal_C32 hP3 / P6/mmm /AlB2
Table 6. Thermodynamic models and optimized CALPHAD type parameters for different phases of the U-Zr system in this work
Phase Model Thermodynamic parameters (Energy unit: J/mol∙atom)
Liquid (U,Zr) 0, 33465.2 14.55Liquid
U ZrL T= − ⋅
1, 19809.4 18.07Liquid
U ZrL T= − ⋅

35
γ(U,Zr) (U,Zr) 0, 23296.9 8.97U ZrL Tγ = − ⋅
1, 21149.0 16.93U ZrL Tγ = − ⋅
2, 2841.6U ZrLγ =
β(U) (U,Zr) 0, 27980.5U ZrLβ =
α(U) (U,Zr) 0, 30312.4U ZrLα =
(Zr) (U,Zr) 0 ( ), 24184.4Zr
U ZrL =
δ (Zr)1/3(U,Zr)2/3 Case 1A: 1000o oZr ZrG Gδ δ= +
1 2
2.81 0.333 0.667o o oZrU Zr UG T G Gδ δ δ= ⋅ + ⋅ + ⋅
0: , 16179.9 23.90Zr U ZrL Tδ = − + ⋅
1: , 10248.5 13.81Zr U ZrL Tδ = − ⋅
Case 1B: 527.5o oZr ZrG Gδ δ= +
1 2
3.73 0.333 0.667o o oZrU Zr UG T G Gδ δ δ= ⋅ + ⋅ + ⋅
0: , 7565.2 12.22Zr U ZrL Tδ = − + ⋅
1: , 4479.8 11.37Zr U ZrL Tδ = − ⋅
2) Phase diagram and phase equilibria

36
Figure 12. Comparison of phase diagram between experimental data [81-84] and this work for temperatures above 1400 K.
Figure 13. Comparison of the solid phase diagram between experimental data [82, 85-94] and thermodynamic descriptions [77, 79], (b) and (c) are magnified parts of (a).
The phase diagram of the U-Zr system is plotted in Figs. 12 and 13, which also show the comparison between reported experiments and available thermodynamic descriptions.

37
In Fig. 12, experimental information [81-84, 92] of the phase boundary shows consistency only up to 50 at.% Zr. Furthermore, experimental data from Summers-Smith [82] and Kanno et al. [84] show large discrepancies. Both thermodynamic assessments performed in this work and the one performed by Chevalier et al. [79] fit to the experimental phase transition temperature measured in the work of Refs. [81-83] but not the one by Kanno et al. [84]. As will be discussed later, the measured activity of U and Zr by Kanno et al. [84] also show significant difference with other experimental data [83] and our assessment.
Since the experimental information of the phase equilibria related to the liquid phase are rather limited, it is helpful to have some additional criteria to judge the quality of different liquid thermodynamic descriptions. Here we consider the values of the excess entropy of mixing of the liquid. In Fig. 17, the excess entropy of mixing is plotted at 2200 K for the liquid phase. Obviously, the calculation according to the work by Kurata [77] shows a much larger excess entropy of mixing than the ones by Chevalier et al. [79] and this work. This large value indicates that Kurata has a strong interaction between atoms even in the high temperature range in the liquid phase, which would be quite unusual for a metallic alloy. As discussed in the work by Okamoto [95], the excess entropy of mixing of an intermetallic liquid phase is normally in the range of –10 and 5 J/(mol∙atom∙K), which can be found in many different metallic systems [95-98]. Thus the excess entropy values of Kurata [77] are likely too large, while ours are consistent with other intermetallic alloys.
A detailed comparison of the solid phase diagram between experiments and different thermodynamic calculations is shown in Fig. 13. Although the U-Zr system has been thermodynamically assessed several times before, it is easy to observe that there are some considerable differences among these calculations. It should be noted that since the thermodynamic assessments performed by Ogawa et al. [80] and Leibowitz et al. 1989 [81] were not based on the lattice stability by SGTE [33], they are not considered in the present discussion for comparison. To keep the comparison tractable, only the most updated version of the thermodynamic modeling performed by Chevalier et al. [79] and Kurata [77] (but not their earlier versions [76, 78]) are considered for comparison. However, one should also notice that in the work by Chevalier et al. [79], the thermodynamic description of the tetragonal (Zr) as the unstable structure is described differently than in the SGTE database [33]. The use of the SGTE database for the pure elements is very widely adopted in CALPHAD modeling to make it easy to construct thermodynamic databases based on the same basis of unary, and the reason for this unconventional approach in Chevalier’s model [79] is not clear.
According to Fig. 13, the homogeneity range of the δ phase calculated from this work is distinctly different from the previous assessments [77, 79]. This difference is at least in part because the experimental data reported in the work by Akabori [88] was assigned with the highest weight during the present thermodynamic optimization. For this same reason the calculated homogeneity range of the δ phase in this work agrees well with the one by Akabori [88] within the experimental uncertainty. The arguments for weighing the Akabori data preferentially, which are based on purity and accuracy of the experimental techniques, are given in Section 2.

38
Another discrepancy with previous models is the thermodynamic description of the bcc miscibility gap below 50 at.% Zr, which is plotted in Fig. 13b. As mentioned in Section 2, the experimental phase boundary of the bcc miscibility gap should not be considered to have high accuracy. A comparison of the bcc miscibility gap between different models over the whole composition and temperature ranges is shown in Fig. 18. The model-described consolute temperature and composition of the bcc phase, γ(U,Zr), in this work agree with the one by Kurata [77], but not Chevalier et al. [79]. Further experiments to validate the model-predictions on the bcc miscibility gap are needed.
A comprehensive comparison of the invariant equilibria between the experiments and models is presented in Table 5. It should be noted that the composition of the reaction related to the δ phase is not well determined yet. The difference of the reaction temperature among CALPHAD modeling is relatively large for the eutectoid reaction: γ(U,Zr) = δ + (Zr). It is also worth noting that the present calculation agrees well with the experimental temperature measured by Holden [99], Duffey and Bruch [86], and Rough et al. [85], as well as the one evaluated by Sheldon [100]. While the other two CALPHAD calculations [77, 79] show higher temperatures, and only agree with the phase diagram compilation in the ASM handbook [101]. More seriously, the peritectoid reaction, γ(U,Zr) + α(U) = δ, was described as the eutectoid type: γ(U,Zr) = α(U) + δ, by Chevalier et al. [79] as shown in Fig. 13c and Table 5. It is noteworthy that the present calculation agrees well with the experimental data of the phase boundary for the γ(U,Zr) to δ transformation determined by Rough et al. [85] (see Fig. 13c).
Table 7. Comparison of invariant reaction in the U-Zr phase diagram ∆
Reaction Phase composition, at.% Zr T, K Reference *
' ( )Uγ γ β↔ +
17.2 44.6 1.0 965.5 [79] C 11.0 48.0 1.9 967.7 [77] C 11.2 44.0 1.2 963.7 This work 10.9 42.4 1.1 966 [100] V 9.7 47 ― 961 [101] V 14.5 ~57 2.5 966 ± 3 [82] E 11.0 42.4 1.06 966 [87] E
( ) ( )U Uβ α γ↔ +
1.0 0.7 55.4 934.2 [79] C 1.9 1.7 62.6 937.0 [77] C 1.1 0.8 56.3 934.7 This work 0.8 0.5 60 935 [100] V 1.1 ― 57 932 [101] V ~1.5 ~1 61 935 ± 2 [82] E ― 0.55 ― 935 [87] E
( )Uγ α δ↔ + 64.1 0.7 64.0 888.4 [79] C
( )Uγ α δ+ ↔ 77.9 1.6 63.5 887.8 [77] C 67.5 0.69 64.0 892.3 This work

39
~66 ~0.5 63 890 [100] V 68 0.5 65 885 [101] V ― ― ― ~885 [99] E ― ― 62.5 890 [86] E ― ― ― 880 [85] E
( )Zrγ δ↔ +
80.1 78.3 99.5 882.9 [79] C 81.4 75.2 98.2 883.5 [77] C 81.2 76.3 98.7 876.2 This work ~81 ~78 99.6 879 [100] V 78 76 99.6 883 [101] V ― ― ― ~868 [99] E 76.1 ― ― 879 [86] E ― ― ― 866 [85] E
∆: The calculated result according to this work is taken from case 1B shown in Fig. 10.
*: “C” stands for CALPHAD modeling, “E” stands for experimental work, and “V” denotes thermodynamic evaluation only based on literature review.
3) Thermodynamic properties Figures 15 and 16 show the comparison of the activity of U and Zr in different phases. In Fig. 16, the model-predicted activity of Zr agree with the one measured by Maeda [83], but not Kanno [84]. According to Maeda [83], the disagreement may be due to the choice of material used for the Knudsen cells in the experiment. Obviously, from Fig. 16, the experimental phase transition temperature by Kanno [84] is inconsistent with the other experimental data. During optimization, we found that any attempt to fit experimental activities from Kanno [84] makes the model inconsistent with other experimental data for the phase diagram and thermodynamic properties related to the liquid phase. We therefore believe that the Zr activity data from Kanno [84] should not be used in fitting the thermodynamic model.
Figure 15 is the comparison of the activity of U in the δ phase between this work and experimental data by Murakami et al. [102]. The calculated results generally agree well with the experimental data. However, the activity of U in the δ phase apparently varies a lot with the concentration of Zr in the δ phase. Assuming Zr dissolves homogenously in the δ phase, the increase of the activity of U determined by experiment [102] is more rapid than the model-prediction. This disagreement can be due to the small composition fluctuation of the solute in experiments, and will not have a significant impact on the phase diagram or other essential thermodynamic properties. Moreover, as pointed out in Section 2, the accuracy of the measurement by Murakami et al. [102] should be questioned, since the concentration of Zr in the δ phase of samples was not well-determined. Further experiments to confirm the current model-prediction are warranted.
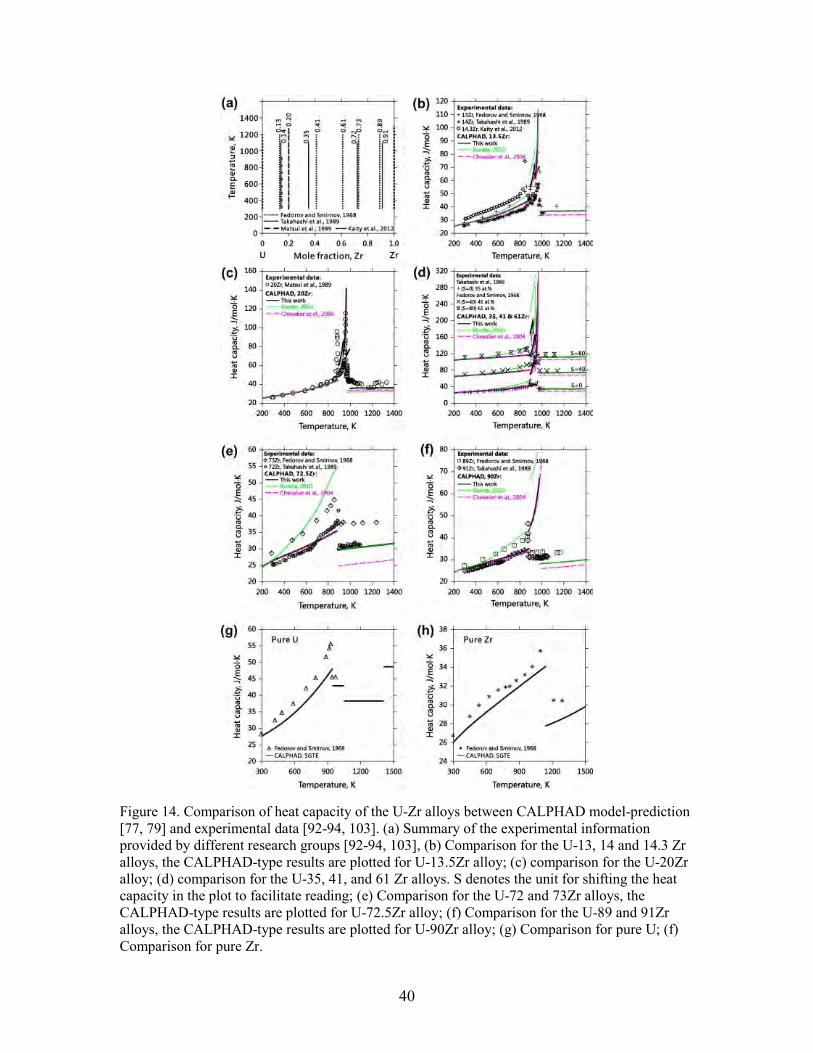
40
Figure 14. Comparison of heat capacity of the U-Zr alloys between CALPHAD model-prediction [77, 79] and experimental data [92-94, 103]. (a) Summary of the experimental information provided by different research groups [92-94, 103], (b) Comparison for the U-13, 14 and 14.3 Zr alloys, the CALPHAD-type results are plotted for U-13.5Zr alloy; (c) comparison for the U-20Zr alloy; (d) comparison for the U-35, 41, and 61 Zr alloys. S denotes the unit for shifting the heat capacity in the plot to facilitate reading; (e) Comparison for the U-72 and 73Zr alloys, the CALPHAD-type results are plotted for U-72.5Zr alloy; (f) Comparison for the U-89 and 91Zr alloys, the CALPHAD-type results are plotted for U-90Zr alloy; (g) Comparison for pure U; (f) Comparison for pure Zr.

41
The comparison of enthalpy of formation of the γ(U,Zr) phase is shown in Fig. 19. Since there are no experimental data available, model-predictions extracted from the phase equilibria are quite valuable. The ab initio calculations by Landa et al. [104, 105] using DFT agree well with the previous assessments by Chevalier et al. [79] and Kurata [77], which are all quite close to our own ab initio claculations using DFT as well. The CALPHAD modeling and ab initio calculations using DFT+U in this work also agree with each other, but show notably lower and more asymmetric values than the previous CALPHAD and ab initio studies. While it is not possible at this point to rigorously determine which values are correct, it is worth noting that the DFT+U ab initio methods used in this work are shown in Ref. [106] to be significantly more accurate for U-Zr alloying energetics than the DFT methods used in previous studies [104, 105]. We therefore believe that the somewhat lower and more asymmetric enthalpy of mixing found in the present studies is likely to be closer to the true U-Zr thermodynamics than that obtained in the previous thermodynamic [77, 79] and ab initio [104, 105] models.
Figure 15. Comparison of activity of U in the δ phase between experimental results by Murakami et al. [102] and CALPHAD model-prediction in this work.
In Fig. 20, the enthalpy of formation of the δ phase at 298 K is calculated in this work in order to compare with the previous assessments [77, 79], ab initio calculations [105] as well as experiments by Nagarajan et al. [44]. As noted in section 3.2., there are two choices of the thermodynamic model for the δ phase in the previous assessments. According to the crystal structure information, the most suitable model for the δ phase is: (Zr)1(U,Zr)2. This is named as model 1 in the discussion, which was employed by Chevalier et al. [79]. The second model (model 2) is the one proposed in the work of Kurata [77], which is (U,Zr)1(U,Zr)2. This model 2 may allow more flexibility than model 1 as U is allowed to occupy the first sublattice, which generate four end-members cover the whole composition range. To assess if this occupation is likely we compared the model 2 U1Zr2 energy with that of a candidate model 1 δ-phase structure (Zr)1(U,Zr)2. The details of the calculation are given in Ref. [106]. As shown in Fig. 20, the enthalpy of formation with 66.7 at.% Zr calculated using the model 1 (Zr)1(U,Zr)2 structure (open square symbol) yields a significantly lower energy than the model 2 U1Zr2 structure (open

42
cross symbol). These calculations suggest that the more constrained model 1 is the most appropriate model for the δ phase.
Figure 16. Comparison of activity of U and Zr in the U-Zr alloys at different temperatures. Reference for U is the liquid phase, while for Zr is hcp (Zr). Different colors indicate different temperatures for both symbols (experimental data) and curves (calculations).
Figure 17. Comparison of the excess entropy of mixing at 2200 K for the liquid phase among different thermodynamic modeling [77, 107].
It should be noted that even though the model adopted in the work by Kurata [77] is the second model: (U,Zr)1(U,Zr)2, which we demonstrate above is likely not correct, the calculated enthalpy agrees well with the experimental data determined by Nagarajan et al. [44] and the ab initio calculations reported by Landa et al. [104, 105]. However, this apparent agreement with experiment cannot be considered as a strong reason to believe either the previous ab initio data or Kurata’s model over the ab initio data and model found for the δ phase in this work, since the uncertainty of the measurement by

43
Nagarajan et al. [44] is as large as 10.1 kJ/mol and therefore includes all the calculated and modeled values being considered.
Figure 18. Model-predicted bcc miscibility gap of the U-Zr system according to different CALPHAD type modeling [77, 79].
The disagreement in the enthalpy of the δ phase between the previous ab initio studies of Landa et al. [104, 105] and the ab initio studies shown here does suggest that there is significant work still to be done to establish a robust ab initio approach. However, as mentioned above, Xie et al. [106] have shown that the DFT+U methods we are using are more accurate than the pure DFT methods used by Landa et al. [104, 105]. This result would argue that our values are typically more reliable. However, it should also be noted that Landa et al. [104, 105] treat the disordered phase with the Coherent potential Approximation (CPA), while we have used an SQS approach to disorder, and use an exact Muffin-Tin Orbitals (EMTO) code, while we have used the PAW approach in a plane wave code (VASP). These differences can also play a significant role. As these energy differences are relatively small between the different methods a large number of comparisons would have to be made to establish which approach is truly the most robust and what are the typical error bars for each technique when compared to experiment. Such benchmarking has been initiated by Xie et al., and can be found further discussed in Ref. [106].

44
Figure 19. Comparison of the enthalpy of formation of the γ(U,Zr) phase between ab initio calculations at 0 K and CALPHAD modeling at 298 K. SOC means Spin-Orbit Coupling.
Interestingly, it is found that the CALPHAD model-prediction is strongly influenced by the thermodynamic description of the pure Zr end-member for the δ phase. The energy difference of pure Zr between the δ and hcp structure considered in the present thermodynamic modeling is different with the conventional value 5000 J/mol used in the CALPHAD community for database construction. In the present thermodynamic modeling, we found that 5000 J/mol is too large to consider as a reasonable value to describe the δ phase, as this large value can cause errors when extending the composition homogeneity range of the δ phase to the Zr-rich side during the thermodynamic assessment. Moreover, according to the ab initio calculations in Landa’s work [104, 105] and ours, the energy difference for pure Zr between the δ and hcp phase are rather small (97 J/mol in this work, less than 50 J/mol in the work by Landa et al. [105]). Since the ab initio predictions are for 0 K, in this work, we assume that the there will be a somewhat larger energy difference of (Zr) between δ and bcc structure at 298 K, which may not necessary to be exactly the same as, but should be close to, the value calculated from DFT in this work. As a consequence, the energy difference of (Zr) between these two different structures, ΔE(Zr), is also assessed during the thermodynamic modeling of the δ phase in this work. It is found that a higher value of ΔE(Zr) will generate a lower δ-phase enthalpy of formation at 66.7 at.% Zr, as shown in case 1A in Fig. 20 (ΔE(Zr) = 1kJ/mol). A reasonable assessed ΔE(Zr) = 527.5 J/mol will generate a value for δ-phase enthalpy of formation at 66.7 at.% as -1627.5 J/mol at 298 K, which agrees fairly well with the ab initio results in this work using DFT+U (-579 J/mol at 66.7 at.% Zr). This coupling between the ΔE(Zr) and the δ-phase formation enthalpy is reasonable and can be easily explained by the tie-line construction using the common tangent of the Gibbs energy curves at 298 K. However, according to the present optimization, it should be noted that the phase diagram will not be significantly affected by mildly different descriptions of the (Zr) and δ phases, as shown in Fig. 21. Specifically, Case 1A with ΔE(Zr) = 1000 J/mol will only show negligible difference with Case 1B using ΔE(Zr) = 527.5 J/mol (see Fig. 10). Although both model-predicted enthalpies of formation of the δ phase are within the range of experimental uncertainty, the one consistent to the DFT+U is preferable, because it generates reasonable energetic value that is consistent with both experiments and optimized ab initio calculations.

45
Figure 20. (a) Comparison of the enthalpy of formation for the δ phase among ab initio [105], CALPHAD [77, 79] and experimental data [44]. In CALPHAD modeling from the present work, case 1A is using the energy difference of (Zr) between hcp and δ structures as 1000 J/mol for model 1 (Zr)1(U,Zr)2, while case 1B is using 527.5 J/mol for model 1 (Zr)1(U,Zr)2. (b) Magnification of (a) from 98 to 100 at.% Zr.
In Fig. 14, the experimental information about the determined heat capacity is summarized. The comparison of the heat capacity curve between thermodynamic modeling in this work and reported experimental data are given in Fig. 14. According to the comparison made in Fig. 14, the present CALPHAD assessment agrees well with the experimental data reported by Takahashi et al. [94] and Matsui et al. [93]. Regarding the previous modeling, the one performed by Chevalier et al. [79] can only describe well the low-temperature range, roughly below 900 K, while the model by Kurata [77] is better in the description for the relatively high-temperature range, i.e., roughly above 900 K. Based on the comparison for pure U and Zr between the SGTE database and the experimental data by Fedorov and Smirnov [103] given in Figs. 14g and 14h, one can easily find that the experimental heat capacities of U and Zr are higher than the SGTE values, which should be considered as the suggested heat capacity based on a comprehensive evaluation of accurate experiments. The discrepancy found in the case of pure U and Zr can be the cause of the fact that the heat capacity of the alloys reported by Fedorov and Smirnov [103] are systematically higher than the model-predicted results shown in Fig. 14. The experimental data provided by Kaity et al. [92] should be also questioned, since the measured heat capacity of U-14.3Zr in Fig. 14b is even higher than the one by Fedorov and Smirnov [103].

46
Figure 21. Comparison of the phase diagram assessed in the present work. Case 1A is using the energy difference of (Zr) between hcp and δ structures as 1000 J/mol, while case 1B is using 527.5 J/mol.
4) Summary The U-Zr system has been assessed using the CALPHAD approach assisted by
DFT+U calculations. A set of self-consistent thermodynamic parameters have been obtained. It can be employed to describe phase equilibria of the U-Zr system accurately, and to predict thermodynamic properties of the U-Zr alloys successfully.
The present work has provided a better thermodynamic description of all phases in the U-Zr system comparing with the previous thermodynamic modeling [77, 79]. Particularly, different choices of thermodynamic models of the δ phase have been studied thoroughly under the help of ab initio calculations. The improved thermodynamic modeling of the δ phase in this work can predict reasonable enthalpy of formation, which is consistent with both DFT+U calculations in the present work as well as reliable experimental data in previous reports.
The present model of the liquid phase showed a better agreement with the reliable experimental data. Moreover, the thermodynamic parameters of the liquid phase are approved to be more reliable the previous modeling [77].
The enthalpy of formation of the bcc structure predicted in the present work agrees with the DFT+U results in this work, which are expected to be more reliable than the previous DFT calculations [104, 105, 108].
Comparison of heat capacity between experiments and the present model-predictions indicates the reliability of the thermodynamic description of the U-Zr system performed in this work.
This work demonstrates the development of a full thermodynamic description of an

47
actinide alloy system using a combined approach of ab initio and CALPHAD, which can be applied to other systems as well.
5.1.3 Pu
Figure 22. Enthalpy of formation for a) γPu, b) δPu, c) δ'Pu, and d) εPu calculated without SOC. The enthalpy is referenced to that of the ground state phase αPu.
Figure 22 shows the enthalpy of formation for elemental phases of Pu calculated by DFT+U at different Ueff’s compared to STGE values generally used in CALPHAD modeling[53]. Spin-orbit coupling has not been included in these initial calculations. Despite this limitation, we have seen again consistent trend as for U and Np. DFT generally overestimates the enthalpies (γPu is an exception). DFT+U gives lower enthalpy and closer matches to CALPHAD values. From cases available now, a statistical optimal match happens near Ueff=1.5 eV.
5.1.4 Pu-Zr, Pu-U and U-Zr-Pu
We performed critical literature review and found that there were substantial amount of experimental data and robust Calphad models available for the three system, see for example Refs [42, 109]. We therefore did not attempt to further refine the models and used the results of Kurata [42, 109] directly in our work.
-0.10
-0.05
0.00
0.05
0.10
0.15
0.20
0 1 2 3 4
En
thal
py
of
Fo
rmat
ion
(e
V/a
tom
)
Ueff (eV)
a) γPu
Ab Initio
CALPHAD
-0.15
-0.05
0.05
0.15
0.25
0.35
0.45
0 1 2 3 4
En
thal
py
of
Fo
rmat
ion
(e
V/a
tom
)
Ueff (eV)
b) δPu
Ab Initio
CALPHAD
-0.15
-0.05
0.05
0.15
0.25
0.35
0.45
0 1 2 3 4
En
thal
py
of
Fo
rmat
ion
(e
V/a
tom
)
Ueff (eV)
c) δ'Pu Ab Initio
CALPHAD
-0.10
0.10
0.30
0.50
0.70
0 1 2 3 4
En
thal
py
of
Fo
rmat
ion
(e
V/a
tom
)
Ueff (eV)
d) εPu
Ab Initio
CALPHAD

48
5.2 Systems that contain Np
5.2.1 Np and Np-Zr
5.2.1.1 Phase diagram and phase equilibria Table 8 lists the evaluated thermodynamic parameters according to the present work. Since the lattice stability for pure Zr with orthorhombic_AC and Tetragonal_AD structures are unknown, the energy difference calculated by ab initio in this work is adopted. However, it should be noted that this is only a rough estimation of these two unstable structures of pure Zr, since no temperature dependence of the lattice stability can be estimated reasonably using ab initio modeling performed at 0 K. Table 8. Thermodynamic models and optimized CALPHAD type parameters for different phases of the Np-Zr system in this work
Phase Model Thermodynamic parameters (Energy unit: J/mol∙atom)
Liquid (Np,Zr) 0, 1142.97Liquid
Np ZrL =
1, 10193.88Liquid
Np ZrL =
(αNp) (Np,Zr) ( ) 5804Npo o SERZr ZrG Gα = +
(βNp) (Np,Zr) ( ) 5331Npo o SERZr ZrG Gβ = +
(γNp,βZr) (Np,Zr) ( ),0
, 12335.36 3.971Np ZrNp ZrL Tγ β = + ⋅
( ),1, 4303.97Np Zr
Np ZrL γ β =
(αZr) (Np,Zr) ( ) 19000Zro o SERNp NpG Gα = +
0, 2107.94Np ZrLβ = −
θ (Np)0.8(Zr)0.2 0
: 415.97 0.8 0.2o SER o SERNp Zr Np ZrG G Gθ = − + ⋅ + ⋅
δ (Zr)1/3(Np,Zr)2
/3 527.5o o SER
Zr ZrG Gδ = +
49
0: , 26498.21 43.189Zr Np ZrL Tδ = − + ⋅
1: , 12532.42 15.912Zr Np ZrL Tδ = − + ⋅
According to Fig. 23, it is obvious that the calculated phase diagram of Bajaj et al. [41] only qualitatively agree with the reliable experimental data. One should keep in mind that transition temperatures of different invariant reactions in the Np-Zr system have been determined rather well in the experiments by Gibson and Haire [110, 111] using both in-situ and ex-situ DTA measurements. By comparing with experimental invariant reaction temperature in Fig. 1, it is obvious that the present thermodynamic modeling agrees better with the experimental transition temperature than the one performed by Bajaj et al. [41]. It is noteworthy that in the calculated phase diagram by Bajaj et al. [41] as shown in Fig. 1, the invariant reactions, (γNp) + (βZr) = δ and (βZr) = δ + (αZr), only shows a 0.03 K difference in the reaction temperature, which is quite hard to verify by thermal analysis, which normally has an accuracy with uncertainty of 0.1 K.
Moreover, it should be pointed out that the calculated solubility boundary of (βZr) by Bajaj et al. [41] shows an unusual curvature in the region between 900 and 1200 K without support from experimental data or ab initio modeling. Overall, comparisons between experimental data and the calculated phase diagrams from thermodynamic modeling in this work and Ref. [41] indicate notable improvements of the thermodynamic modeling in this work.

50
Figure 23. Comparison of the phase diagram of Np-Zr between the CALPHAD modeling and experimental data. (a) calculated phase diagram in this work and experimental data; (b) calculated phase diagram in the work by Bajaj et al. [41] and experimental data; (c) magnified part of (a); (d) magnified part of (b).
5.2.1.2 Thermodynamic properties
1) Ab initio energetic calculations of the elemental Np and terminal solution phases Now we validate ab initio approaches (i.e., DFT vs. DFT+U; noSOC vs. SOC) in modeling the correlation and relativistic effects in Np and Np-Zr. To avoid any bias, we compare ab inito energetics to the CALPHAD models in this work as well as the one by Bajaj et al. [41]. Also, we focus the comparison on all the three solid phases of Np metal and the low and intermediate temperature terminal solution phases of Np-Zr alloy in Figs. 26 and 27, respectively. The remaining two phases δ(Np,Zr) and (γNp, βZr) are subject to uncertainty due to the controversy on αZr vs. ωZr as ground state phase and the constrained relaxation approach, respectively, and we will discuss them separately later. Figures 26 and 27 show that, similar to U and U-Zr [4], Np and Np-Zr’s energetics are significantly overestimated by DFT (i.e., at Ueff= 0 eV). This overestimation can be seen

51
by comparing to the experimental cohesive energy of αNp [52], the SGTE data for pure elements [33], and both of the CALPHAD models to the DFT values. DFT+U gives smaller formation energies and thus better agreement with the above references. The energetics also evolve as functions of Ueff in three stages, similar to those for U and U-Zr [4]. The first stage is between 0 to 1 eV, the second 1 to 2 eV, and the third > 2 eV. The ab initio curves in general cross the experimentally derived reference curves at Ueff between 0.65 to 0.9 eV.
Figure 24. Ab initio energetics for Np metal at 0 K: (a) cohesive energy for αNp, and enthalpy of formation for (b) βNp and (c) γNp. The data from SGTE and experiments are considered at 298 K. Experimental data in (a) are taken from Ref. [52].
Figure 25. Comparison of the enthalpy of formation for Np-Zr alloy phases at 0 K: (a) (αNp) (6.3 at.% Zr); (b) (βNp) (6.3 at.% Zr); (c) (αZr) (93.8 at.% Zr). The CALPHAD values are calculated at 298 K.
Figure 26 summarizes the comparison in Figs. 24 and 25 and show the root mean square (RMS) of enthalpy differences between ab initio and measured or CALPHAD modeled energetics. At this level of comparison there is no visible difference in the comparison to the CALPHAD model in this work and the one by Bajaj et al. [41]. Note that we include only energies relative to the end members in Fig. 6 (formation energies), not the overall cohesive energy of the stable end members αNp or Zr. These are n cohesive energies do not impact the phase stability being modeled here. However, the trend in accuracy of cohesive energy with Ueff for αNp is similar to those found for the formation energies of other phases, with an optimal Ueff of around 1 eV. as shown in Fig. 4 (a). Figure 26 shows two qualitative features that are the most important: (1) the RMS of enthalpy differences for the SOC case keeps going down from 0 to 0.9 eV, reaches minimum at 0.9 eV, and gradually increases thereafter; (2) the RMS of enthalpy
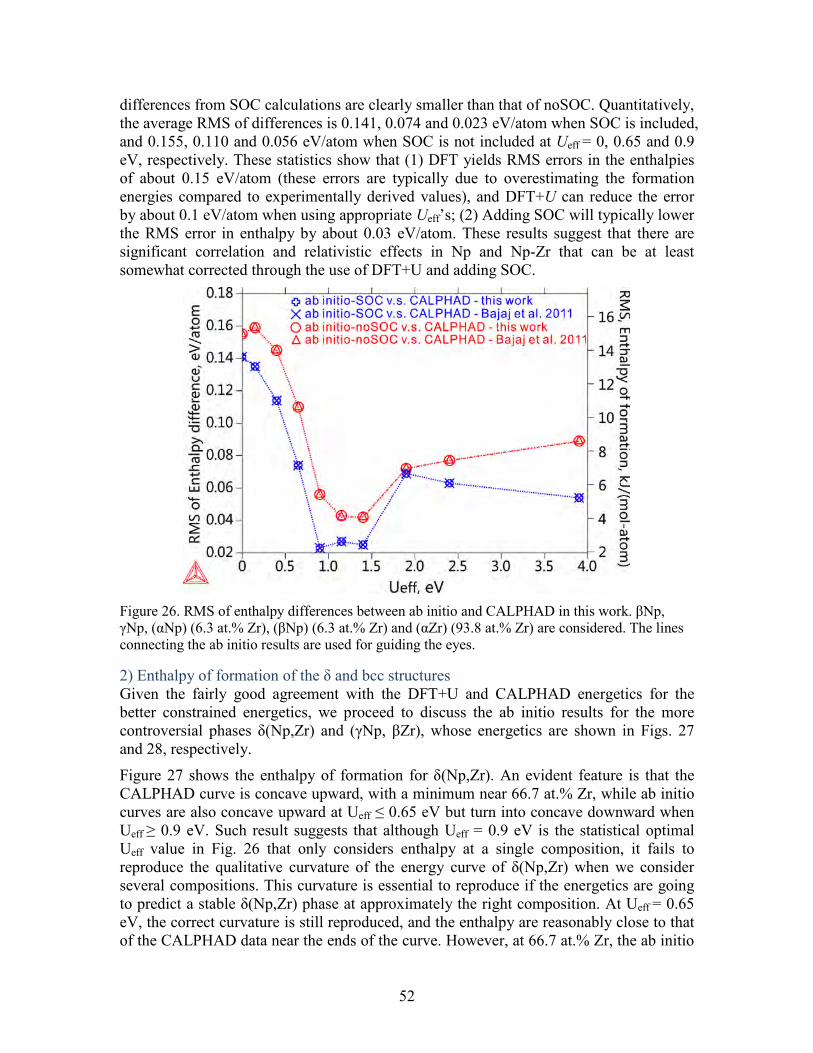
52
differences from SOC calculations are clearly smaller than that of noSOC. Quantitatively, the average RMS of differences is 0.141, 0.074 and 0.023 eV/atom when SOC is included, and 0.155, 0.110 and 0.056 eV/atom when SOC is not included at Ueff = 0, 0.65 and 0.9 eV, respectively. These statistics show that (1) DFT yields RMS errors in the enthalpies of about 0.15 eV/atom (these errors are typically due to overestimating the formation energies compared to experimentally derived values), and DFT+U can reduce the error by about 0.1 eV/atom when using appropriate Ueff’s; (2) Adding SOC will typically lower the RMS error in enthalpy by about 0.03 eV/atom. These results suggest that there are significant correlation and relativistic effects in Np and Np-Zr that can be at least somewhat corrected through the use of DFT+U and adding SOC.
Figure 26. RMS of enthalpy differences between ab initio and CALPHAD in this work. βNp, γNp, (αNp) (6.3 at.% Zr), (βNp) (6.3 at.% Zr) and (αZr) (93.8 at.% Zr) are considered. The lines connecting the ab initio results are used for guiding the eyes.
2) Enthalpy of formation of the δ and bcc structures Given the fairly good agreement with the DFT+U and CALPHAD energetics for the better constrained energetics, we proceed to discuss the ab initio results for the more controversial phases δ(Np,Zr) and (γNp, βZr), whose energetics are shown in Figs. 27 and 28, respectively.
Figure 27 shows the enthalpy of formation for δ(Np,Zr). An evident feature is that the CALPHAD curve is concave upward, with a minimum near 66.7 at.% Zr, while ab initio curves are also concave upward at Ueff ≤ 0.65 eV but turn into concave downward when Ueff ≥ 0.9 eV. Such result suggests that although Ueff = 0.9 eV is the statistical optimal Ueff value in Fig. 26 that only considers enthalpy at a single composition, it fails to reproduce the qualitative curvature of the energy curve of δ(Np,Zr) when we consider several compositions. This curvature is essential to reproduce if the energetics are going to predict a stable δ(Np,Zr) phase at approximately the right composition. At Ueff = 0.65 eV, the correct curvature is still reproduced, and the enthalpy are reasonably close to that of the CALPHAD data near the ends of the curve. However, at 66.7 at.% Zr, the ab initio

53
enthalpy is somewhat larger than the CALPHAD model-prediction. A minor improvement in agreement between the DFT+U and CALPHAD values might still be possible through exploring additional Ueff values, but further searching and fitting on a finer Ueff mesh is computationally expensive and will probably not yield a significantly more accurate Ueff value given the accuracy that our CALPHAD and ab initio approaches can reach at present. Overall, although there is clearly significant discrepancy between CALPHAD and ab initio, we find errors for δ(Np,Zr) in some ways similar to those found when comparing to the better constrained data in Section 5.3.1, in that DFT also significantly overestimates the energetics for δ(Np,Zr) by about 0.15 eV/atom, and DFT+U reduces the error by about 0.1 eV/atom using Ueff in the range 0.65-0.9 eV.
Figure 27. Comparison of the enthalpy of mixing of the δ phase between ab initio calculations and CALPHAD modeling. The dotted lines connecting the ab initio results are used for guiding the eyes. Model 1 in the work by Bajaj et al. [41] takes hcp as the stable structure for pure Zr, while model 2 takes the ω phase.
Figure 28 shows the enthalpy of mixing for (γNp, βZr). We first note the discrepancy between the CALPHAD result of this work and Bajaj et al.’s [41], the former being slightly positive (~0.025 eV/atom) while the later quite substantially positive (~0.3 eV/atom). We have shown above that our CALHPAD model gives phase boundary that match existing experimental data equally or better than Bajaj et al.’s [41], which suggests that the present model values are probably more reliable. To further assess the accuracy of the two models, we compare them to ab initio results. Figure 28 shows that DFT also gives large and positive mixing enthalpy, although our DFT-PAW-SQS results are somewhat smaller than Bajaj et al.’s KKR-CPA result [41], which may be due to the differences between PAW and KKR and between SQS and CPA. However, all the comparisons discussed in Section 5.3.1 and 5.3.2, as well as previous work on U-Zr [4, 112]have suggested that our DFT+U energy values provide a more accurate description than just the DFT energy values. The DFT+U (0.65 eV)-SOC enthalpy curve is very close to our CALPHAD curve. Both curves also show the same asymmetry, with the Np-rich end slightly higher, although it is more pronounced in the ab initio data. Such excellent match between our ab initio and CALPHAD results that are essentially

54
independently obtained validates both the CALPHAD and ab initio values. Therefore, we argue that (γNp, βZr) should probably also have a slightly positive enthalpy, similar to the bcc structure, (γU, βZr), in the U-Zr system as found in Ref. [4]. Overall, there is still controversy in this high temperature phase, and further experimental validation is needed. It might be a concern that the CALPHAD model from this work was fit to data that biased it to match the DFT+U calculations. However, our CALPHAD model is developed mainly by fitting to experimental phase boundary data with the only ab initio inputs being the enthalpy differences for pure Zr metal between the crystal structures of αNp and βNp and for pure Np metal between the crystal structures of αZr, and ωZr. Therefore, for (γNp, βZr), our CALPHAD and ab initio DFT+U results can be used to validate each other.
Figure 28. Comparison of the enthalpy of mixing of the bcc structure between ab initio calculations and CALPHAD modeling. The dotted lines connecting the ab initio results are used for guiding the eyes.
It is worth noting that the agreement of the CALPHAD modeling between this work and the one from Bajaj et al. [41] at 33.3 at.% Zr is fairly good if the ω phase is considered as the stable phase at ground state in the model of Bajaj et al. [41]. As shown in Figure 27, the model 1 with hcp as the stable structure for pure Zr indicates a significantly lower value of the enthalpy of formation for the δ phase in the work of Bajaj et al. [41]. However, we consider this agreement fortuitous as it emerges from using an incorrect ground state for Zr. In addition, it is surprising that a change of the stable structure in the ground state of pure (Zr) can lead to such a large difference for thermodynamic properties of the delta phase. This sensitivity suggests that the energy of the system at 33.3 at.% Zr in Bajaj et al.’s model [41] may be rather unreliable.
3) Model predicted excess entropy of mixing for the liquid phase The comparison of excess entropy of mixing for the liquid phase at 2500 K from this work and Bajaj et al. [41] is shown in Fig. 29. The excess entropy of mixing of a metallic
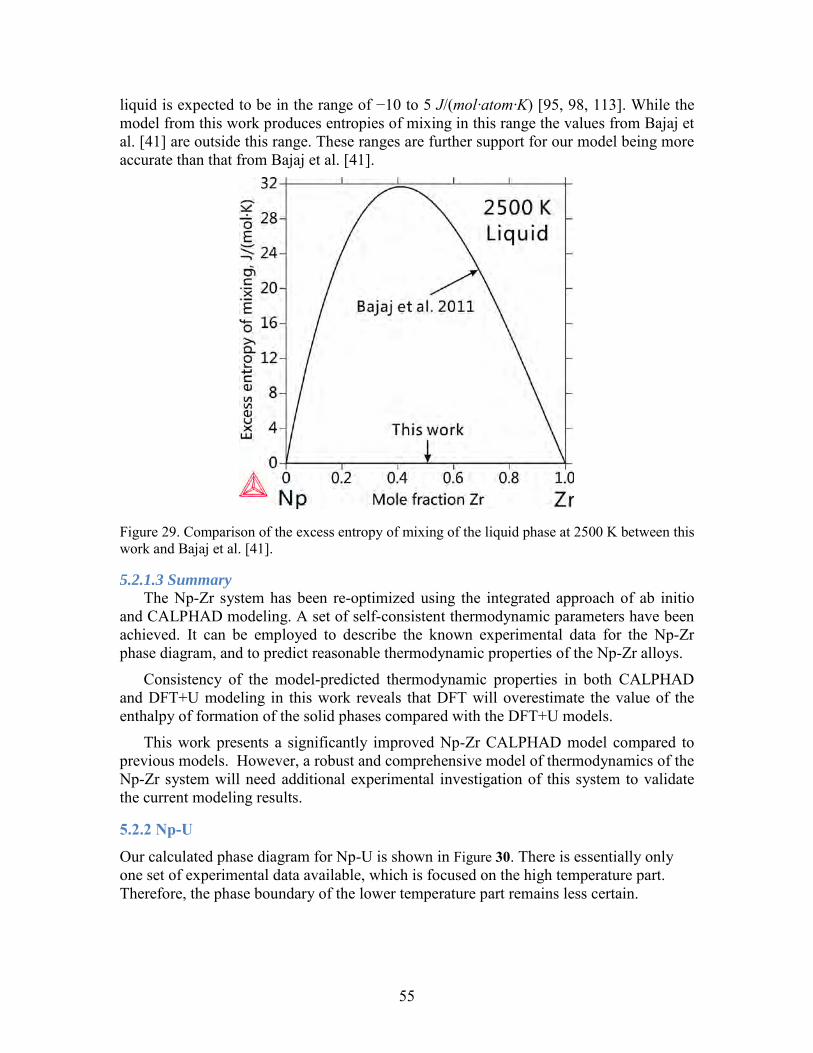
55
liquid is expected to be in the range of −10 to 5 J/(mol·atom·K) [95, 98, 113]. While the model from this work produces entropies of mixing in this range the values from Bajaj et al. [41] are outside this range. These ranges are further support for our model being more accurate than that from Bajaj et al. [41].
Figure 29. Comparison of the excess entropy of mixing of the liquid phase at 2500 K between this work and Bajaj et al. [41].
5.2.1.3 Summary The Np-Zr system has been re-optimized using the integrated approach of ab initio
and CALPHAD modeling. A set of self-consistent thermodynamic parameters have been achieved. It can be employed to describe the known experimental data for the Np-Zr phase diagram, and to predict reasonable thermodynamic properties of the Np-Zr alloys.
Consistency of the model-predicted thermodynamic properties in both CALPHAD and DFT+U modeling in this work reveals that DFT will overestimate the value of the enthalpy of formation of the solid phases compared with the DFT+U models.
This work presents a significantly improved Np-Zr CALPHAD model compared to previous models. However, a robust and comprehensive model of thermodynamics of the Np-Zr system will need additional experimental investigation of this system to validate the current modeling results.
5.2.2 Np-U
Our calculated phase diagram for Np-U is shown in Figure 30. There is essentially only one set of experimental data available, which is focused on the high temperature part. Therefore, the phase boundary of the lower temperature part remains less certain.

56
Figure 30. Calculated phase diagram of Np-U. The experimental data (square dots) are from [114].
Considering the scarcity of experimental data, we also performed ab initio calculations of Np-U, and the results are given in Figure 31 and Figure 32.
Figure 31 shows the enthalpy of formation for the four terminal solution phases α(Np), β(Np), α(U), and β(U). A major point is that DFT+U results using the fitted optimal Ueff’es we obtain individually from U-Zr and Np-Zr match our CALPHAD results for Np-U reasonable well on all solution phases (αU), (βU), (αNp), (βNp). This suggest validating ab initio approaches on systems that have reliable experimental data (e.g, U-Zr and Np-Zr) is effective.
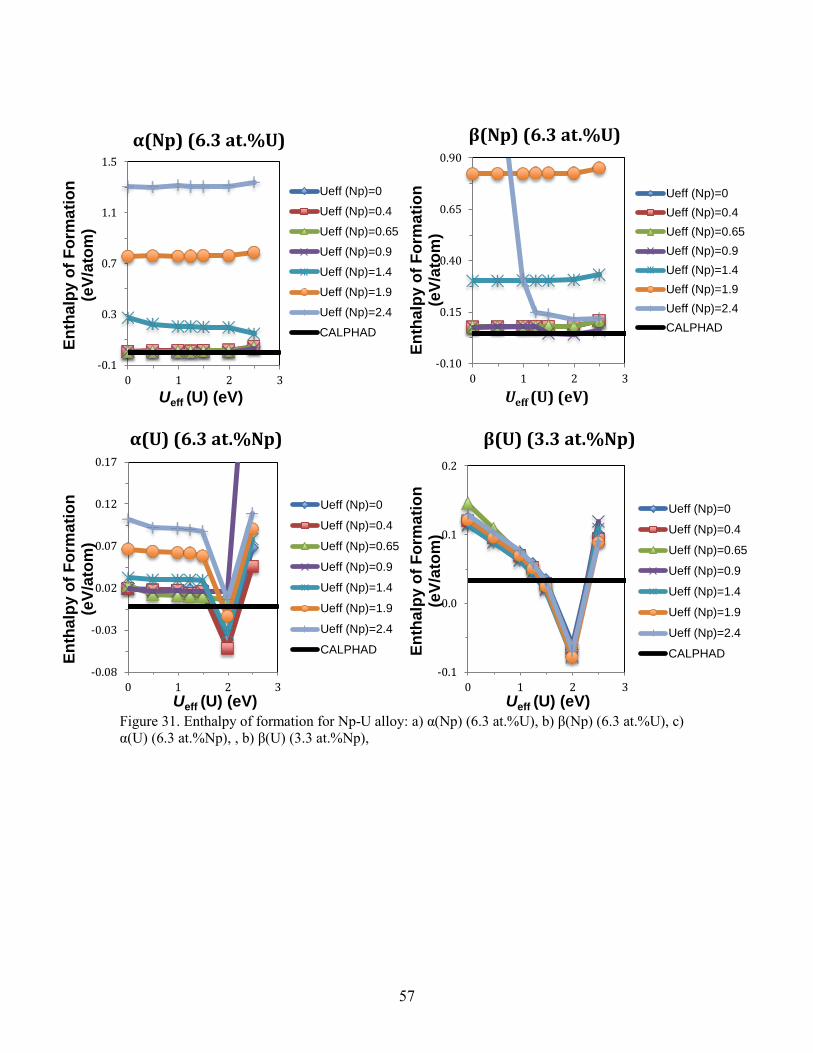
57
Figure 31. Enthalpy of formation for Np-U alloy: a) α(Np) (6.3 at.%U), b) β(Np) (6.3 at.%U), c) α(U) (6.3 at.%Np), , b) β(U) (3.3 at.%Np),
-0.1
0.3
0.7
1.1
1.5
0 1 2 3
En
tha
lpy
of
Fo
rma
tio
n
(eV
/ato
m)
Ueff (U) (eV)
α(Np) (6.3 at.%U)
Ueff (Np)=0
Ueff (Np)=0.4
Ueff (Np)=0.65
Ueff (Np)=0.9
Ueff (Np)=1.4
Ueff (Np)=1.9
Ueff (Np)=2.4
CALPHAD
-0.10
0.15
0.40
0.65
0.90
0 1 2 3
En
tha
lpy
of
Fo
rma
tio
n
(eV
/ato
m)
Ueff (U) (eV)
β(Np) (6.3 at.%U)
Ueff (Np)=0Ueff (Np)=0.4Ueff (Np)=0.65Ueff (Np)=0.9Ueff (Np)=1.4Ueff (Np)=1.9Ueff (Np)=2.4CALPHAD
-0.08
-0.03
0.02
0.07
0.12
0.17
0 1 2 3
En
tha
lpy
of
Fo
rma
tio
n
(eV
/ato
m)
Ueff (U) (eV)
α(U) (6.3 at.%Np)
Ueff (Np)=0
Ueff (Np)=0.4
Ueff (Np)=0.65
Ueff (Np)=0.9
Ueff (Np)=1.4
Ueff (Np)=1.9
Ueff (Np)=2.4
CALPHAD
-0.1
0.0
0.1
0.2
0 1 2 3
En
tha
lpy
of
Fo
rma
tio
n
(eV
/ato
m)
Ueff (U) (eV)
β(U) (3.3 at.%Np)
Ueff (Np)=0
Ueff (Np)=0.4
Ueff (Np)=0.65
Ueff (Np)=0.9
Ueff (Np)=1.4
Ueff (Np)=1.9
Ueff (Np)=2.4
CALPHAD

58
Figure 32. Enthalpy of mixing for (γNp, γU) without SOC.
Figure 32 shows the enthalpy of mixing for (γNp, γU). The Ueff’s used for U and Np are given in the corresponding parentheses in the figure legend. Our current CALPHAD model gives a flat mixing enthalpy curve; the almost vanishing enthalpy suggests that the mixing between Np and U in bcc lattice is almost ideal. DFT gives a slightly positive enthalpy of mixing curve, with the maximum biased towards the Np-rich end. With gradually increased Ueff’s, DFT+U gives lower and overall slightly negative enthalpy curvess. At significantly higher Ueff’s, however the calculated enthalpies become positive again. Based on our comprehensive fitting in U-Zr, Np-Zr and other phases of Np-U, our current best ab initio prediction would be the brown curve with Ueff=1.24 eV for U and 0.65 eV for Np, which is a symmetric and slightly negative enthalpy of mixing curve. However, we want to point out that the differences between the enthalpies from CALPHAD, DFT and DFT+U are less than 50 meV/atom and therefore well within the range of errors for these methodologies. Overall, results on (γNp, γU) suggest DFT and DFT+U give similar energetics, which are both close to the CALPHAD values.
5.2.3 Np-Pu We calculated the Np-Pu phase diagram, which is shown in Figure 33. Comparison between the calculation and the experimental data from Mardon’s work[115] is shown in Figure 33(a). Comparisons between current work and partial phase diagrams from K.S. Chan et al[116] by means of Kaufman approach calculation and T. Ogawa[117] predicted by Brewer valence bond model are shown in Figure 33 (c). Figure 33 (d) shows the calculated diagram from Kurata’s work[118]. Figure 33 (b) is a close up of Fig. 4(a) on the top right corner. Similar as the Np-U system, Mardon’s work[115] is almost the only source of experimental data, and it is preferred in the present modeling. The calculated diagram shows good agreement with the experimental data within the experimental uncertainties. From Figure 33 (b), the solid state boundaries show reasonable agreement with experimental data. It can be seen from Figure 33 (c) that the partial diagram from K.S. Chan’s calculation[116] has large deviations from other author’s work and cannot be reconciled in the present modeling. Kurata[118] also developed a thermodynamic description of the Np-Pu system using the same kind of Calphad method as used in the present modeling. The phase diagram boundaries between β-Np and β-Pu, β-Np
-0.04
-0.02
0.00
0.02
0.04
0 0.25 0.5 0.75 1
Enth
alpy
of M
ixin
g (e
V/at
om)
Mole Fraction of Np
(γNp,γU) CALPHAD
Np(0),U(0)
Np(0.15),U(0.24)
Np(0.4),U(0.49)
Np(0.65),U(0.74)
Np(0.65),U(1.24)
Np(0.9),U(0.99)
Np(1.15),U(1.24)
Np(1.4),U(1.49)

59
and BCC, β-Pu and BCC are improved in the present description compared with Kurata’s work[118]. The calculated critical data of the seven invariant reactions in the Np-Pu system are listed in Table 9 and compared with the critically evaluated data by Sheldon. R. and D. Peterson[119], which again indicates reasonable good agreement between current results and experimental data. The values of the optimized model parameters are listed in
Table 10.
a b
c d
Figure 33. Comparison between the calculated Np-Pu phase diagram from this work and experimental data from (a) Mardon et al[115], (c) K.S. Chan et al[116]. and T. Ogawa[117], and (d) calculated from Kurata.M[118]. (b) is a close-up of (a).
Table 9. Comparison between the calculated and assessed critical data of the invariant reactions in the Np-Pu system
Invariant Reaction T [K] Composition (Pu) Reference β-Np+BCC↔β-Pu β-Np BCC β-Pu 813.15 0.1 0.22 0.15 Sheldon. R. et al[119] 813.19 0.117 0.136 0.132 This work β-Pu+BCC↔η β-Pu BCC η
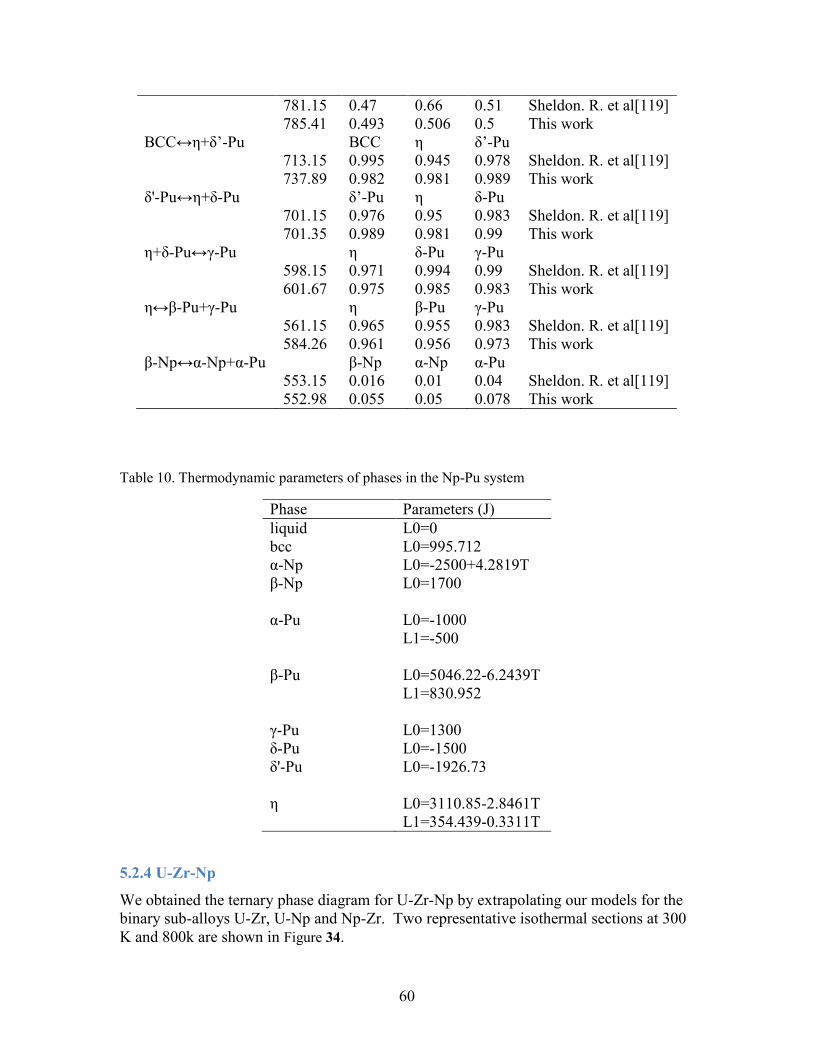
60
781.15 0.47 0.66 0.51 Sheldon. R. et al[119] 785.41 0.493 0.506 0.5 This work BCC↔η+δ’-Pu BCC η δ’-Pu 713.15 0.995 0.945 0.978 Sheldon. R. et al[119] 737.89 0.982 0.981 0.989 This work δ'-Pu↔η+δ-Pu δ’-Pu η δ-Pu 701.15 0.976 0.95 0.983 Sheldon. R. et al[119] 701.35 0.989 0.981 0.99 This work η+δ-Pu↔γ-Pu η δ-Pu γ-Pu 598.15 0.971 0.994 0.99 Sheldon. R. et al[119] 601.67 0.975 0.985 0.983 This work η↔β-Pu+γ-Pu η β-Pu γ-Pu 561.15 0.965 0.955 0.983 Sheldon. R. et al[119] 584.26 0.961 0.956 0.973 This work β-Np↔α-Np+α-Pu β-Np α-Np α-Pu 553.15 0.016 0.01 0.04 Sheldon. R. et al[119] 552.98 0.055 0.05 0.078 This work
Table 10. Thermodynamic parameters of phases in the Np-Pu system
Phase Parameters (J) liquid L0=0 bcc L0=995.712 α-Np L0=-2500+4.2819T β-Np L0=1700 α-Pu L0=-1000 L1=-500 β-Pu L0=5046.22-6.2439T L1=830.952 γ-Pu L0=1300 δ-Pu L0=-1500 δ'-Pu L0=-1926.73 η L0=3110.85-2.8461T L1=354.439-0.3311T
5.2.4 U-Zr-Np
We obtained the ternary phase diagram for U-Zr-Np by extrapolating our models for the binary sub-alloys U-Zr, U-Np and Np-Zr. Two representative isothermal sections at 300 K and 800k are shown in Figure 34.

61
Figure 34. Represenctative Isothermal section of Np-U-Zr phase diagrams
Due to the lacking of experimental data, we performed ab initio calculations of bcc U-Zr-Np along six isopleth paths, as shown in Figure 35. On paths 1, 3 and 5, four SQS structures A1B1C1, A2B1C1, A6B1C1, and A2B3C3 that have 36, 32, 64, 64 atoms, respectively as generated by one of us in Ref.[120] are calculated; on path 2, 4 and 6, two additional SQS structures A4B3C1 and A4B1C3 that both have 64 atoms as generated by us following the same spirit of Ref.[120] are calculated.

62
Figure 35. Isopleth paths in ab initio calculation of bcc Np-U-Zr: 1 (U0.5Zr0.5)1-xNpx; 2 Np0.5(ZrxU1-x)0.5; 3 (Np0.5Zr0.5)1-xUx; 4 U0.5(NpxZr1-x)0.5; 5 (Np0.5U0.5)1-xZrx; 6 Zr0.5(UxNp1-x)0.5;
Figure 36 shows the comparison of the enthalpy of mixing for bcc Np-U-Zr between CALPHAD and ab initio. We have shown in our previous validation of DFT vs. DFT+U approach on U-Zr[4, 112] and Np-Zr[5] that DFT+U offers significantly more accurate results for the enthalpy of mixing of the bcc phases than DFT and optimal effective Hubbard U parameters Ueff for Np and U are 0.65 and 1.24 eV, respectively. Here we shown in Figure 36 that the conclusion remains valid on the ternary bcc Np-U-Zr system. Not only DFT+U gives much lower and hence better mixing enthalpy than DFT, but also the optimal Ueff’s for Np and U are again found to be 0.65 and 1.24 eV, respectively. The multiply cross-validation shows the robust of our combined DFT+U and CALPHAD modeling for the phase stability of Np-U-Zr.
-0.05
0.05
0.15
0.25
0 0.2 0.4 0.6 0.8 1En
tha
lpy
of
Mix
ing
(e
V/a
tom
)
Mole Fraction of U
Path 1: (Np0.5Zr0.5)1-xUx Np(0),U(0)Np(0.15),U(0.24)Np(0.4),U(0.49)Np(0.65),U(0.74)Np(0.65),U(1.24)Np(0.9),U(0.99)CALPHAD
-0.05
0.05
0.15
0.25
0 0.2 0.4 0.6 0.8 1En
tha
lpy
of
Mix
ing
(e
V/a
tom
)
Mole fraction of Zr
Path2: (Np0.5U0.5)1-xZrx Np(0),U(0)Np(0.15),U(0.24)Np(0.4),U(0.49)Np(0.65),U(0.74)Np(0.65),U(1.24)Np(0.9),U(0.99)CALPHAD

63
Figure 36. Comparison of enthalpy of mixing for bcc Np-U-Zr from CALPHAD and ab initio calculations.
5.2.5 U-Pu-Np and Pu-Zr-Np
The remaining two Np containing ternaries were also obtained by extrapolation from the sub-binaries. They were both based on the Pu-Np models that we developed in this work. Figure 37 are the calculated 973K isothermal sections of the two systems. Based on the success on U-Zr-Np, we expect ab initio calculations will also obtain consistent results using the optimal Ueff’s that we determined from the binary results.
-0.05
0.05
0.15
0.25
0 0.2 0.4 0.6 0.8 1
En
tha
lpy
of
Mix
ing
(e
V/a
tom
)
Mole Fraction of Np
Path 3: (U0.5Zr0.5)1-xNpx Np(0),U(0)Np(0.15),U(0.24)Np(0.4),U(0.49)Np(0.65),U(0.74)Np(0.65),U(1.24)Np(0.9),U(0.99)
-0.05
0.05
0.15
0.25
0 0.1 0.2 0.3 0.4 0.5
En
tha
lpy
of
Mix
ing
(e
V/a
tom
)
Mole Fraction of Np
Path 4: U0.5(NpxZr1-x)0.5 Np(0),U(0)Np(0.15),U(0.24)Np(0.4),U(0.49)Np(0.65),U(0.74)Np(0.65),U(1.24)Np(0.9),U(0.99)CALPHAD
-0.05
0.05
0.15
0.25
0.0 0.1 0.2 0.3 0.4 0.5En
tha
lpy
of
Mix
ing
(e
V/a
tom
)
Mole Fraction of U
Path 5: Zr0.5(UxNp1-x)0.5 Np(0),U(0)Np(0.15),U(0.24)Np(0.4),U(0.49)Np(0.65),U(0.74)Np(0.65),U(1.24)Np(0.9),U(0.99)
-0.05
0.05
0.15
0.25
0 0.1 0.2 0.3 0.4 0.5
En
tha
lpy
of
Mix
ing
(e
V/a
tom
)
Mole Fraction of Zr
Path 6: Np0.5(ZrxU1-x)0.5 Np(0),U(0)Np(0.15),U(0.24)Np(0.4),U(0.49)Np(0.65),U(0.74)Np(0.65),U(1.24)Np(0.9),U(0.99)

64
(a) isothermal section of Np-U-Pu at
973K (b) isothermal section of Np-Pu-Zr at
973K
Figure 37. Isothermal sections of a) Np-U-Pu and b) Np-Pu-Zr ternaries at 973K
6. Conclusions
We performed thermodynamic modeling of the actinide rich metallic nuclear fuel systems of U-Pu-Zr-Np using the Calphad approach. We obtained new phase diagrams and thermodynamic models for U-Zr, Np-Zr, Np-U, Pu-Np binaries, and Np-U-Zr, Pu-Np-Zr and Pu-Np-U ternaries. Among them, particularly robust results are those for U-Zr and Np-Zr, which are based on reliable experiential data. Comparing to available experiments in the literature, our models are able to predict thermochemical properties like heat capacity in wide composition and temperature ranges with good accuracy, which is a major improvement over previous models that only fit experimental data in certain ranges.
We therefore used our Calphad models for U-Zr and Np-Zr to validate ab initio approaches. We found that DFT-GGA significantly overestimates the enthalpies of formation/mixing. For U and U-Zr, the error is about 0.1 eV/atom and for Np and Np-Zr the error is about 0.15 eV/atom. Most importantly, we found that DFT+U can reduce the error to <0.05 eV/atom when it is applied with proper Ueff parameters, which we found to be approximately 1.24 and 0.65 eV for U and Np, respectively. It was also an encouraging discovery that this set of Ueff values should also be optimal even in other metallic fuels systems, which we have demonstrated on Np-U binary and Np-U-Zr ternary systems. We also further determined the optimal Ueff for Pu to be around 1.5 eV. This discovery is a major step forward on ab initio modeling of metallic fuels, as there were very few attempts to use DFT+U for such systems previously.

65
We then further improved the Calphad models for systems that have less experimental data available with input from validated ab initio approaches. One such system is Np-U, which has an intermediate phase that has wide composition range and large number of Wyckoff sites with complex occupation pattern. Our work demonstrated that the so-called ab initio enhanced Calphad modeling is a promising approach to probe such complex multiple-component systems of metallic nuclear fuels.
Overall, the new and improved thermodynamic models that we developed will help better understand and control fuel behaviors like constituents redistribution, and will also help improve the design of new fuels. In addition, the validation of the accuracy of DFT and DFT+U methods, and also the determination of the optimal Ueff values, makes DFT-based modeling a more effective tool for studying the challenging materials of actinide alloys.

66
7. Acknowledgement
This research is funded by the U.S. Department of Energy Office of Nuclear Energy's Nuclear Energy University Programs under contract number 00088978. We acknowledge computing time from Idaho National Laboratory’s Center for Advanced Modeling and Simulation and also from TeraGrid resources provided by Texas Advanced Computing Center under grant number [TG-DMR090023]. Wei Xiong is grateful to the Thermo-Calc software Company, Sweden, for providing the Thermo-Calc software to perform the thermodynamic modeling.

67
8. References
[1] A.I. Liechtenstein, V.I. Anisimov, J. Zaanen, Density-functional Theory and Strong Interactions: Orbital Ordering in Mott-Hubbard Insulators, Phys. Rev. B, 52 (1995) R5467-R5470. [2] P. Hohenberg, W. Kohn, Inhomogeneous Electron Gas, Phys. Rev. B, 136 (1964) 864-871. [3] W. Kohn, L.J. Sham, Self-Consistent Equations Including Exchange and Correlation Effects, Phys. Rev., 140 (1965) 1133-1138. [4] W. Xie, W. Xiong, C.A. Marianetti, D. Morgan, Correlation and relativistic effects in U metal and U-Zr alloy: validation of ab initio approaches, Phys. Rev. B, Accepted (2013). [5] W. Xiong, W. Xie, D. Morgan, Thermodynamic Evaluation of the Np-Zr System Using CALPHAD and DFT+U, in, 2013. [6] W. Xiong, W. Xie, C. Shen, D. Morgan, Thermodynamic Modeling of the U-Zr System - A Revisit, J. Nucl. Mater., 443 (2013) 331-341. [7] W. Xie, W. Xiong, D. Morgan, Ab initio enhanced CALPHAD modeling of Np-U, In preparation (2013). [8] W. Xie, W. Xiong, C. Jiang, D. Morgan, Phase Stability of BCC Np-U-Zr Ternary Alloy, In preparation (2013). [9] G. Kresse, J. Hafner, Ab initio Moleculear Dynamics for Liquid Metals, Phys. Rev. B, 47 (1993) 558-561. [10] G. Kresse, J. Furthmuller, Efficient iterative schemes for ab initio total-energy calculations using a plane-wave basis set, Phys. Rev. B, 54 (1996) 11169-11186. [11] P.E. Blochl, Projector Augmented-Wave Method, Phys. Rev. B, 50 (1994) 17953-17979. [12] G. Kresse, D. Joubert, From ultrasoft pseudopotentials to the projector augmented-wave method, Phys. Rev. B, 59 (1999) 1758-1775. [13] D.C. Langreth, J.P. Perdew, Theory of Nonuniform Electronic Systems .1. Analysis of the Gradient Approximation and a Generalization That Works, Phys. Rev. B, 21 (1980) 5469-5493. [14] J.P. Perdew, K. Burke, M. Ernzerhof, Generalized gradient approximation made simple, Phys. Rev. Lett., 77 (1996) 3865-3868. [15] H.J. Monkhorst, J.D. Pack, Special Points for Brillouin-Zone Integrations, Phys. Rev. B, 13 (1976) 5188-5192. [16] M. Methfessel, A.T. Paxton, High-Precision Sampling for Brillouin-Zone Integration in Metals, Phys. Rev. B, 40 (1989) 3616-3621. [17] V.I. Anisimov, F. Aryasetiawan, A.I. Lichtenstein, First-principles calculations of the electronic structure and spectra of strongly correlated systems: The LDA+U method, J. Phys.: Condens. Matter, 9 (1997) 767-808. [18] O. Bengone, M. Alouani, P. Blochl, J. Hugel, Implementation of the projector augmented-wave LDA+U method: Application to the electronic structure of NiO, Phys. Rev. B, 62 (2000) 16392-16401.

68
[19] S.L. Dudarev, G.A. Botton, S.Y. Savrasov, C.J. Humphreys, A.P. Sutton, Electron-energy-loss spectra and the structural stability of nickel oxide: An LSDA+U study, Phys. Rev. B, 57 (1998) 1505-1509. [20] B. Dorado, B. Amadon, M. Freyss, M. Bertolus, DFT+U calculations of the ground state and metastable states of uranium dioxide, Phys. Rev. B, 79 (2009) 235125. [21] B. Meredig, A. Thompson, H.A. Hansen, C. Wolverton, A. van de Walle, Method for locating low-energy solutions within DFT plus U, Phys. Rev. B, 82 (2010) 195128. [22] J.W. Ross, D.J. Lam, Magnetic Susceptibility of Single-Crystal Alpha-Uranium, Phys. Rev., 165 (1968) 617-&. [23] G.H. Lander, M.H. Mueller, Neutron Diffraction Study of α-Uranium at Low Temperatures, Acta Crystallogr., B26 (1970) 129-136. [24] M. Cococcioni, S. de Gironcoli, Linear response approach to the calculation of the effective interaction parameters in the LDA+U method, Phys. Rev. B, 71 (2005) 035105. [25] L. Kleinman, Relativistic Norm-Conserving Pseudopotential, Phys. Rev. B, 21 (1980) 2630-2631. [26] A.H. Macdonald, W.E. Pickett, D.D. Koelling, A Linearized Relativistic Augmented-Plane-Wave Method Utilizing Approximate Pure Spin Basis Functions, J. Phys. C., 13 (1980) 2675-2683. [27] A. Zunger, S.H. Wei, L.G. Ferreira, J.E. Bernard, Special Quasirandom Structures, Phys. Rev. Lett., 65 (1990) 353-356. [28] A. van de Walle, M. Asta, G. Ceder, The Alloy Theoretic Automated Toolkit: A user guide, CALPHAD: Comput. Coupling Phase Diagrams Thermochem., 26 (2002) 539-553. [29] B. Sundman, B. Jansson, J.O. Andersson, The Thermo-Calc Databank System, CALPHAD: Comput. Coupling Phase Diagrams Thermochem., 9 (1985) 153-190. [30] http://www.thermocalc.se, in. [31] S.L. Chen, S. Daniel, F. Zhang, Y.A. Chang, X.Y. Yan, F.Y. Xie, R. Schmid-Fetzer, W.A. Oates, The PANDAT software package and its applications, Calphad, 26 (2002) 175-188. [32] L.B.H. Kaufman, Computer calculation of phase diagrams with special reference to refractory metals, Academic Press, New York, 1970. [33] A.T. Dinsdale, SGTE Data for Pure Elements, CALPHAD: Comput. Coupling Phase Diagrams Thermochem., 15 (1991) 317-425. [34] O. Redlich, A.T. Kister, Thermodynamics of nonelectrolytic solutions. Algebraic representation of thermodynamic properties and the classification of solutions, Industrial & Engineering Chemistry, 40 (1948) 345-348. [35] Y.M. Muggianu, M. Gambino, J.P. Bros, ENTHALPIES OF FORMATION OF LIQUID ALLOYS BISMUTH-GALLIUM-TIN AT 723K - CHOICE OF AN ANALYTICAL REPRESENTATION OF INTEGRAL AND PARTIAL THERMODYNAMIC FUNCTIONS OF MIXING FOR THIS TERNARY-SYSTEM, Journal De Chimie Physique Et De Physico-Chimie Biologique, 72 (1975) 83-88. [36] M. Hillert, The compound energy formalism, J. Alloys Compd., 320 (2001) 161-176. [37] S.K. Sikka, Y.K. Vohra, R. Chidambaram, Omega phase in materials, Progress in Materials Science, 27 (1982) 245-310. [38] J. Zhang, Y. Zhao, C. Pantea, J. Qian, L.L. Daemen, P.A. Pigg, R.S. Hixson, C.W. Greeff, G.T.G. Iii, Y. Yang, L. Wang, T. Uchida, Experimental constraints on the phase

69
diagram of elemental zirconium, Journal of Physics and Chemistry of Solids, 66 (2005) 1213-1219. [39] A. Landa, P. Soderlind, P.E.A. Turchi, Density-functional study of the U-Zr system, J. Alloys Compd., 478 (2009) 103-110. [40] Y.J. Hao, L. Zhang, X.R. Chen, L.C. Cai, Q. Wu, D. Alfe, Ab initio calculations of the thermodynamics and phase diagram of zirconium, Physical Review B, 78 (2008) 134101. [41] S. Bajaj, A. Garay, A. Landa, P. Soderlind, P. Turchi, R. Arroyave, Thermodynamic study of the Np-Zr system, Journal of Nuclear Materials, 409 (2011) 1-8. [42] M. Kurata, Thermodynamic database on U-Pu-Zr-Np-Am-Fe alloy system I - Re-evaluation of U-Pu-Zr alloy system, IOP Conf. Ser.: Mater. Sci. Eng., 9 (2010) 012022. [43] P.Y. Chevalier, E. Fischer, B. Cheynet, Progress in the thermodynamic modelling of the O-U-Zr ternary system, Calphad, 28 (2004) 15-40. [44] K. Nagarajan, R. Babu, C.K. Mathews, Enthalpy of formation of UZr2 by calorimetry, J. Nucl. Mater., 203 (1993) 221-223. [45] S. Adak, H. Nakotte, P.F. de Chatel, B. Kiefer, Uranium at high pressure from first principles, Physica B, 406 (2011) 3342-3347. [46] J.H. Li, Q.B. Ren, C.H. Lu, L. Lu, Y. Dai, B.X. Liu, Structure, formation energies and elastic constants of uranium metal investigated by first principles calculations, J. Alloys Compd., 516 (2012) 139-143. [47] C.D. Taylor, Evaluation of first-principles techniques for obtaining materials parameters of alpha-uranium and the (001)alpha-uranium surface, Phys. Rev. B, 77 (2008) 094119. [48] P. Soderlind, First-principles elastic and structural properties of uranium metal, Phys. Rev. B, 66 (2002) 085113. [49] J.C. Boettger, M.D. Jones, R.C. Albers, Structural properties of crystalline uranium from linear combination of Gaussian-type orbitals calculations, Int. J. Quantum Chem., 75 (1999) 911-915. [50] S. Bajaj, A. Landa, P. Soderlind, P.E.A. Turchi, R. Arroyave, The U-Ti system: Strengths and weaknesses of the CALPHAD method, J. Nucl. Mater., 419 (2011) 177-185. [51] A. Berche, N. Dupin, C. Gueneau, C. Rado, B. Sundman, J.C. Dumas, Calphad thermodynamic description of some binary systems involving U, J. Nucl. Mater., 411 (2011) 131-143. [52] C. Kittel, Introduction to solid state physics, Wiley, Hoboken, NJ, 2005. [53] A.T. Dinsdale, SGTE data for pure elements, Calphad, 15 (1991) 317-425. [54] G.B. Fedorov, E.A. Smirnov, Thermodynamic properties of the γ-phase in the uranium-zirconium system, At. Energ., 21 (1966) 837-840. [55] C.S. Barrett, M.H. Mueller, R.L. Hitterman, Crystal Structure Variations in Alpha Uranium at Low Temperatures, Phys. Rev., 129 (1963) 625-629. [56] P. Soderlind, O. Eriksson, B. Johansson, J.M. Wills, Electronic-Properties of f-Electron Metals Using the Generalized Gradient Approximation, Phys. Rev. B, 50 (1994) 7291-7294. [57] A. Jain, G. Hautier, C.J. Moore, S.P. Ong, C.C. Fischer, T. Mueller, K.A. Persson, G. Ceder, A high-throughput infrastructure for density functional theory calculations, Comput. Mater. Sci., 50 (2011) 2295-2310.

70
[58] M.D. Jones, J.C. Boettger, R.C. Albers, D.J. Singh, Theoretical atomic volumes of the light actinides, Phys. Rev. B, 61 (2000) 4644-4650. [59] A.C. Lawson, C.E. Olsen, J.W.J. Richardson, M.H. Mueller, G.H. Lander, Structure of β-uranium, Acta Crystallogr., B44 (1988) 89-96. [60] A.S. Wilson, R.E. Rundle, The Structures of Uranium Metal, Acta Crystallogr., 2 (1949) 126-127. [61] J.G. Huber, P.H. Ansari, The Superconductivity of Bcc U-Zr Alloys, Physica B+C, 135 (1985) 441-444. [62] V.N. German, A.A. Bakanova, L.A. Tarasova, Y.N. Sumulov, Phase Transformation of Titanium and Zirconium Shock Waves, Sov. Phys. Solid State, 12 (1970) 490-&. [63] M. Akabori, A. Itoh, T. Ogawa, F. Kobayashi, Y. Suzuki, Stability and structure of the δ phase of the U-Zr alloys, J. Nucl. Mater., 188 (1992) 249-254. [64] J.C. Jamieson, Crystal Structures of Titanium, Zirconium, and Hafnium at High Pressures, Science, 140 (1963) 72-73. [65] J. Goldak, L.T. Lloyd, C.S. Barrett, Lattice Parameters Thermal Expansions and Gruneisen Coefficients of Zirconium 4.2 to 1130 Degrees K, Phys. Rev., 144 (1966) 478-484. [66] P. Soderlind, L. Nordstrom, Y.M. Lou, B. Johansson, Relativistic Effects on The Thermal Expansion of The Actinide Elements, Phys. Rev. B, 42 (1990) 4544-4552. [67] K.T. Moore, G. van der Laan, Nature of The 5f States in Actinide Metals, Rev. Mod. Phys., 81 (2009) 235-298. [68] C.P. Opeil, R.K. Schulze, H.M. Volz, J.C. Lashley, M.E. Manley, W.L. Hults, R.J. Hanrahan, J.L. Smith, B. Mihaila, K.B. Blagoev, R.C. Albers, P.B. Littlewood, Angle-Resolved Photoemission and First-Principles Electronic Structure of Single-Crystalline Alpha-U(001), Phys. Rev. B, 75 (2007) 045120. [69] C.P. Opeil, R.K. Schulze, M.E. Manley, J.C. Lashley, W.L. Hults, R.J. Hanrahan, J.L. Smith, B. Mihaila, K.B. Blagoev, R.C. Albers, P.B. Littlewood, Valence-band UPS, 6p core-level XPS, and LEED of a uranium (001) single crystal, Phys. Rev. B, 73 (2006) 165109. [70] Y. Baer, J.K. Lang, High-Energy Spectroscopic Study of the Occupied and Unoccupied 5f and Valence States in Th and U Metals, Phys. Rev. B, 21 (1980) 2060-2062. [71] J.G. Tobin, K.T. Moore, B.W. Chung, M.A. Wall, A.J. Schwartz, G. van der Laan, A.L. Kutepov, Competition between delocalization and spin-orbit splitting in the actinide 5f states, Phys. Rev. B, 72 (2005) 085109. [72] A.N. Chantis, R.C. Albers, M.D. Jones, M. van Schilfgaarde, T. Kotani, Many-body electronic structure of metallic alpha-uranium, Phys. Rev. B, 78 (2008) 081101. [73] M.S.S. Brooks, Calculated ground state properties of light actinide metals and their compounds, Physica B+C, 130 (1985) 6-12. [74] N. Spector, Ground-State Configuration of Neutral Uranium (U I), Phys. Rev. A, 8 (1973) 3270-3273. [75] J.G. Yu, R. Devanathan, W.J. Weber, First-principles study of defects and phase transition in UO2, J. Phys.: Condens. Matter, 21 (2009) 435401. [76] M. Kurata, T. Ogata, K. Nakamura, T. Ogawa, Thermodynamic assessment of the Fe-U, U-Zr and Fe-U-Zr systems, J. Alloys Compd., 271-273 (1998) 636-640.
71
[77] M. Kurata, Thermodynamic database on U-Pu-Zr-Np-Am-Fe alloy system I - Re-evaluation of U-Pu-Zr alloy system, IOP Conference Series: Materials Science and Engineering, 9 (2010) 012022/012021-012022/012028. [78] P.Y. Chevalier, E. Fischer, Thermodynamic modelling of the O-U-Zr system, J. Nucl. Mater., 257 (1998) 213-255. [79] P.Y. Chevalier, E. Fischer, B. Cheynet, Progress in the thermodynamic modelling of the O-U-Zr ternary system, CALPHAD: Comput. Coupling Phase Diagrams Thermochem., 28 (2004) 15-40. [80] T. Ogawa, T. Iwai, Thermochemical modelling of U-Zr alloys, J. Less-Common Met., 170 (1991) 101-108. [81] L. Leibowitz, R.A. Blomquist, A.D. Pelton, Thermodynamics of the uranium-zirconium system, J. Nucl. Mater., 167 (1989) 76-81. [82] D. Summers-Smith, The constitution of uranium-zirconium alloys, J. Inst. Met., 83 (1955) 277-282. [83] A. Maeda, Y. Suzuki, T. Ohmichi, Uranium activity of uranium-rich U-Zr alloys by Knudsen effusion mass spectrometry, J. Alloys Compd., 179 (1992) L21-L24. [84] M. Kanno, M. Yamawaki, T. Koyama, N. Morioka, Thermodynamic activity measurements of U-Zr alloys by knudsen effusion mass spectrometry, J. Nucl. Mater., 154 (1988) 154-160. [85] F.A. Rough, A.E. Austin, A.A. Bauer, J. Robert Doig, The stability and existence range of the Zirconium-Uranium epsilon phase, in: Report No. BMI-1092, Battelle Memorial Institute, Ohio, 1956, pp. 36. [86] J.F. Duffey, C.A. Bruch, Delta phase field of U-Zr equilibrium diagram, Trans. AIME, 212 (1958) 17-19. [87] S.T. Zegler, The uranium-rich end of the uranium-zirconium system, in: USAEC REP.ANL-6055, 1962. [88] M. Akabori, A. Itoh, T. Ogawa, F. Kobayashi, Y. Suzuki, Stability and Structure of the Delta-Phase of the U-Zr Alloys, J. Nucl. Mater., 188 (1992) 249-254. [89] C.B. Basak, Microstructural evaluation of U-rich U-Zr alloys under near-equilibrium condition, J. Nucl. Mater., 416 (2011) 280-287. [90] M. Akabori, T. Ogawa, A. Itoh, Y. Morii, The Lattice Stability and Structure of Delta-UZr2 at Elevated-Temperatures, J. Phys.: Condens. Matter, 7 (1995) 8249-8257. [91] C.B. Basak, S. Neogy, D. Srivastava, G.K. Dey, S. Banerjee, Disordered bcc gamma-phase to delta-phase transformation in Zr-rich U-Zr alloy, Philos. Mag., 91 (2011) 3290-3306. [92] S. Kaity, J. Banerjee, M.R. Nair, K. Ravi, S. Dash, T.R.G. Kutty, A. Kumar, R.P. Singh, Microstructural and thermophysical properties of U–6wt.%Zr alloy for fast reactor application, J. Nucl. Mater., 427 (2012) 1-11. [93] T. Matsui, T. Natsume, K. Naito, Heat capacity measurements of U0.80Zr0.20 and U0.80Mo0.20 alloys from room temperature to 1300 K, J. Nucl. Mater., 167 (1989) 152-159. [94] Y. Takahashi, K. Yamamoto, T. Ohsato, H. Shimada, T. Terai, M. Yamawaki, Heat capacities of uranium-zirconium alloys from 300 to 1100 K, J. Nucl. Mater., 167 (1989) 147-151. [95] H. Okamoto, Reevaluation of thermodynamic models for phase diagram evaluation, Journal of Phase Equilibria, 12 (1991) 623-643.

72
[96] W. Xiong, P. Hedstrom, M. Selleby, J. Odqvist, M. Thuvander, Q. Chen, An improved thermodynamic modeling of the Fe-Cr system down to zero kelvin coupled with key experiments, CALPHAD: Comput. Coupling Phase Diagrams Thermochem., 35 (2011) 355-366. [97] W. Xiong, Y. Du, X. Lu, J.C. Schuster, H. Chen, Reassessment of the Ce–Ni binary system supported by key experiments and ab initio calculations, Intermetallics, 15 (2007) 1401-1408. [98] W. Xiong, Y. Kong, Y. Du, Z.K. Liu, M. Selleby, W.H. Sun, Thermodynamic investigation of the galvanizing systems, I: Refinement of the thermodynamic description for the Fe-Zn system, CALPHAD: Computer Coupling of Phase Diagrams and Thermochemistry, 33 (2009) 433-440. [99] A.N. Holden, Metallography of the ε phase in the uranium-zirconium system, U. S. A. E. C., TID-7523 (1956) 40-64. [100] R.I. Sheldon, D.E. Peterson, The U-Zr (uranium-zirconium) system, Bull. Alloy Phase Diagrams, 10 (1989) 165-171, 205-166. [101] H. Baker, ASM Handbook: alloy phase diagrams, 1992. [102] T. Murakami, T. Kato, M. Kurata, H. Yamana, Electrochemical formation of uranium-zirconium alloy in LiCl-KCl melts, J. Nucl. Mater., 394 (2009) 131-135. [103] G.B. Fedorov, E.A. Smirnov, Specific heat of uranium-zirconium alloys, Sov. Atom. Energy, 25 (1968) 795-797. [104] A. Landa, P. Söderlind, P.E.A. Turchi, Density-functional study of U–Mo and U–Zr alloys, J. Nucl. Mater., 414 (2011) 132-137. [105] A. Landa, P. Söderlind, P.E.A. Turchi, Density-functional study of the U–Zr system, J. Alloys Compd., 478 (2009) 103-110. [106] W. Xie, W. Xiong, C.A. Marianetti, D. Morgan, Ab initio modeling of U metal and U-Zr alloy: DFT v.s. DFT+U, Phys. Rev. B: Condens. Matter Mater. Phys., to be submitted (2013). [107] B. Cheynet, P. Chaud, P.Y. Chevalier, E. Fischer, P. Mason, M. Mignanelli, NUCLEA: thermodynamic properties and phase equilibria in the nuclear systems of interest; NUCLEA proprietes thermodynamiques et equilibres de phases dans les systemes d'interet nucleaire, in, EDP Sciences, 2004, pp. 61-64. [108] A. Landa, P. Soderlind, P.E.A. Turchi, L. Vitos, A. Ruban, Density-functional study of Zr-based actinide alloys: 2. U-Pu-Zr system, J. Nucl. Mater., 393 (2009) 141-145. [109] M. Kurata, Thermodynamic database on U-Pu-Zr-Np-Am-Fe alloy system II - Evaluation of Np, Am, and Fe containing systems, IOP Conf. Ser.: Mater. Sci. Eng., 9 (2010) 012023. [110] J.K. Gibson, R.G. Haire, High-temperature DTA of transuranium materials with applicaiton to the Np-Zr phase daigram, Thermochimica Acta, 207 (1992) 65-78. [111] J.K. Gibson, R.G. Haire, Investigation of the neptunium-zirconium phase daigram by differential thermal analysis, Journal of Nuclear Materials, 201 (1993) 225-230. [112] W. Xiong, W. Xie, C. Shen, D. Morgan, Thermodynamic Modeling of the U-Zr System - A Revisit, J. Nucl. Mater., Accepted (2013). [113] W. Xiong, Y. Du, X. Lu, J.C. Schuster, H. Chen, Reassessment of the Ce-Ni binary system supported by key experiments and ab initio calculations, Intermetallics, 15 (2007) 1401-1408.

73
[114] P.G. Mardon, J.H. Pearce, An Investigation of the Neptunium-Uranium Equilibrium Diagram, J. Less-Common Met., 1 (1959) 467-475. [115] P.G. Mardon, J.H. Pearce, J.A.C. Marples, Constitution Studies On the Neptunium Plutonium Alloy System, J. Less-Common Met., 3 (1961) 281-292. [116] K.S. Chan, J.K. Lee, H.I. Aaronson, Kaufman approach calculations of partial phase diagrams amongst Th, U, Np and Pu, Journal of Nuclear Materials, 92 (1980) 237-242. [117] T. Ogawa, Alloying Behavior among U, Np, Pu and Am Predicted with the Brewer Valence Bond Model, J. Alloys Compd., 194 (1993) 1-7. [118] M. Kurata, Thermodynamic database on U-Pu-Zr-Np-Am-Fe alloy system II — Evaluation of Np, Am, and Fe containing systems, IOP Conference Series: Materials Science and Engineering, 9 (2010) 012023. [119] R. Sheldon, D. Peterson, The Np−Pu (Neptunium-Plutonium) system, J. Phase Equilib., 6 (1985) 215-217. [120] C. Jiang, First-principles study of ternary bcc alloys using special quasi-random structures, Acta Mater, 57 (2009) 4716-4726.