Embed Size (px)
Citation preview

The new worldwide microscalewind resource assessment data on IRENA’s Global Atlas
The EUDP Global Wind Atlas
Jake Badger, Neil Davis, Andrea Hahmann, Bjarke T. Olsen Xiaoli G. Larsén, Mark C. Kelly, Patrick Volker, Merete Badger, Tobias T. Ahsbahs, Niels Mortensen, Hans Jørgensen, Erik Lundtang Petersen, Julia Lange, DTU Nicolas Fichaux, IRENA
EUDP 11-II, Globalt Vind Atlas, 64011-0347
EWEA RESOURCE ASSESSMENT 2015
Helsinki, 2-3 June 2015
DTU Wind Energy, Technical University of Denmark
Outline
• Project context
• Model chain
• Input data
• Output and verification
• Web user interface, walk through
• Future plans
• Global assessments of the technical potential
2

DTU Wind Energy, Technical University of Denmark3
23 participating CEM governments account for 80 percent of global greenhouse gas emissions
Lead countries are Denmark, Germany and Spain.+ 11 countries and EC
Coordinated byInternational Renewable Energy Agency (IRENA)
Energy Technology development and Demonstration (EUDP)Global Wind Atlas by DTU Wind Energy
Project context - International collaboration

DTU Wind Energy, Technical University of Denmark4
International collaborationWhat is IRENA’s Global Atlas?
It is a high-level prospector for renewable energy opportunities• builds on publicly available information• information released by the private sector• data released by institutions,
• i.e. EUDP Global Wind Atlas • New European Wind Atlas
http://globalatlas.irena.org/

DTU Wind Energy, Technical University of Denmark5
International collaborationIRENA’s Global Atlas
It supports• countries in prospecting their renewable energy opportunities • companies to approach new markets• the general public in gaining interest in renewable energy
http://globalatlas.irena.org/

DTU Wind Energy, Technical University of Denmark
• provide wind resource data accounting for high resolution effects
• use microscale modelling to capture small scale wind speed variability (crucial for better estimates of total wind resource)
• use a unified methodology
• ensure transparency about the methodology
• verify the results in representative selected areas
For:
• Aggregation, upscaling analysis and energy integration modelling for energy planners and policy makers
Not for:
• Not for wind farm siting
6
The global wind atlas objective

DTU Wind Energy, Technical University of Denmark7
Wind resource (power density) calculated at different resolutions
2.5 km 100 m
50 km
50 k
m
323 W/m2
410 W/m2
505 W/m2
641 W/m2
mean power density of total area mean power density for windiest 50% of area
Wind farms are not randomly located but are built on favourable areas
Mesoscale Mesoscale +
microscale
Project context

DTU Wind Energy, Technical University of Denmark8
Mean wind power density for windiest half of area
Note:
This area exhibits large topography effects.
Even for Danish landscape effect can give 25 % boast in wind resource at the windiest 5 percentile.
Project context
DTU Wind Energy, Technical University of Denmark
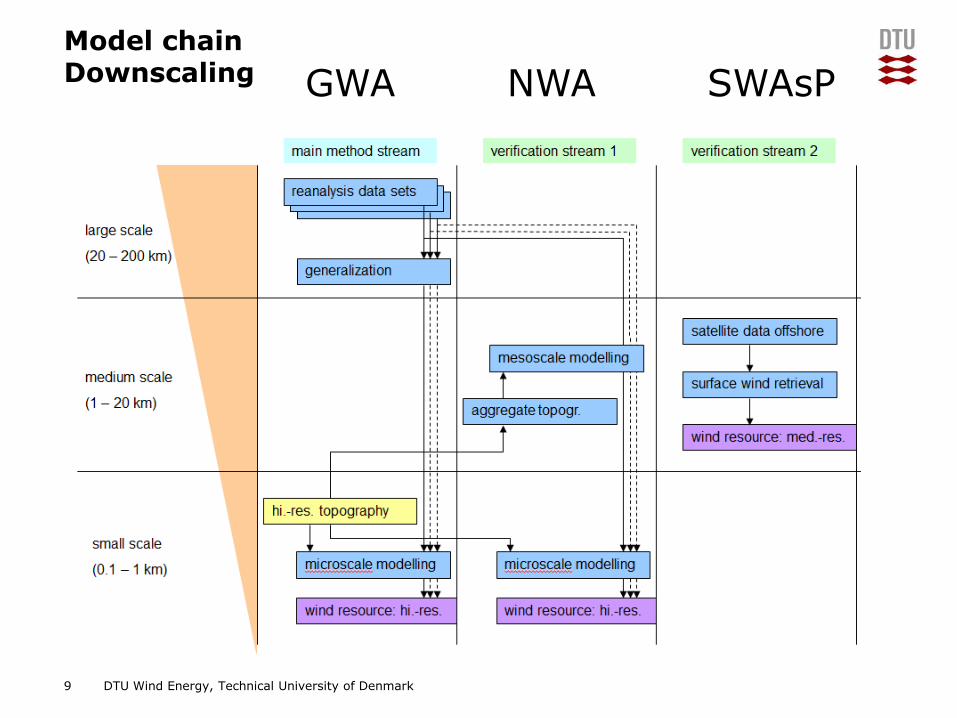
Model chain Downscaling
9
NWAGWA SWAsP
DTU Wind Energy, Technical University of Denmark
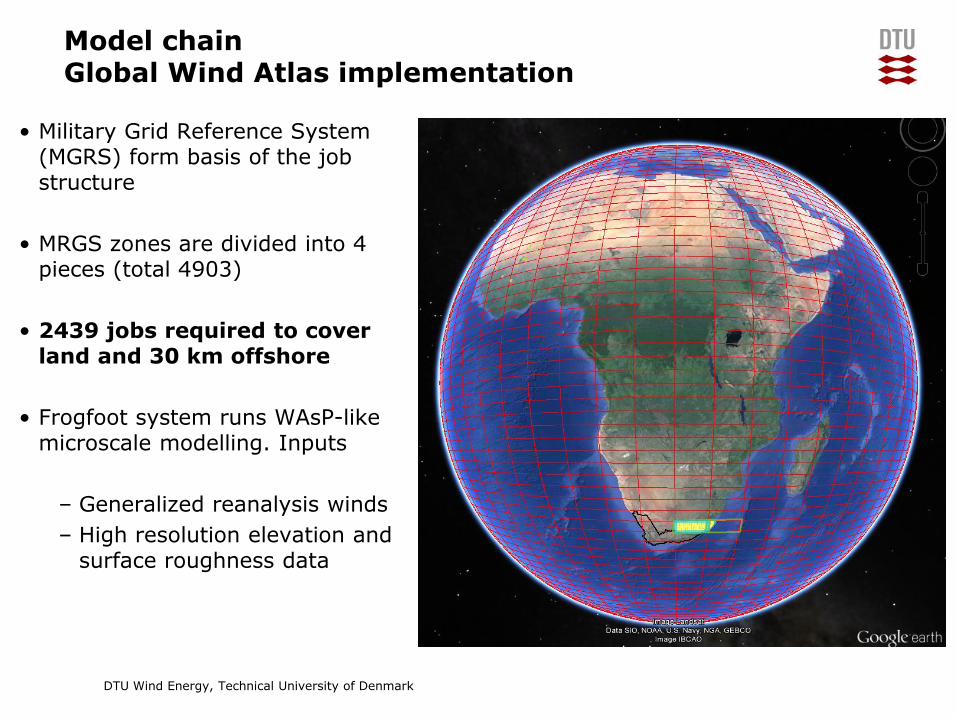
Model chain Global Wind Atlas implementation
• Military Grid Reference System (MGRS) form basis of the job structure
• MRGS zones are divided into 4 pieces (total 4903)
• 2439 jobs required to cover land and 30 km offshore
• Frogfoot system runs WAsP-like microscale modelling. Inputs
– Generalized reanalysis winds
– High resolution elevation and surface roughness data
DTU Wind Energy, Technical University of Denmark11
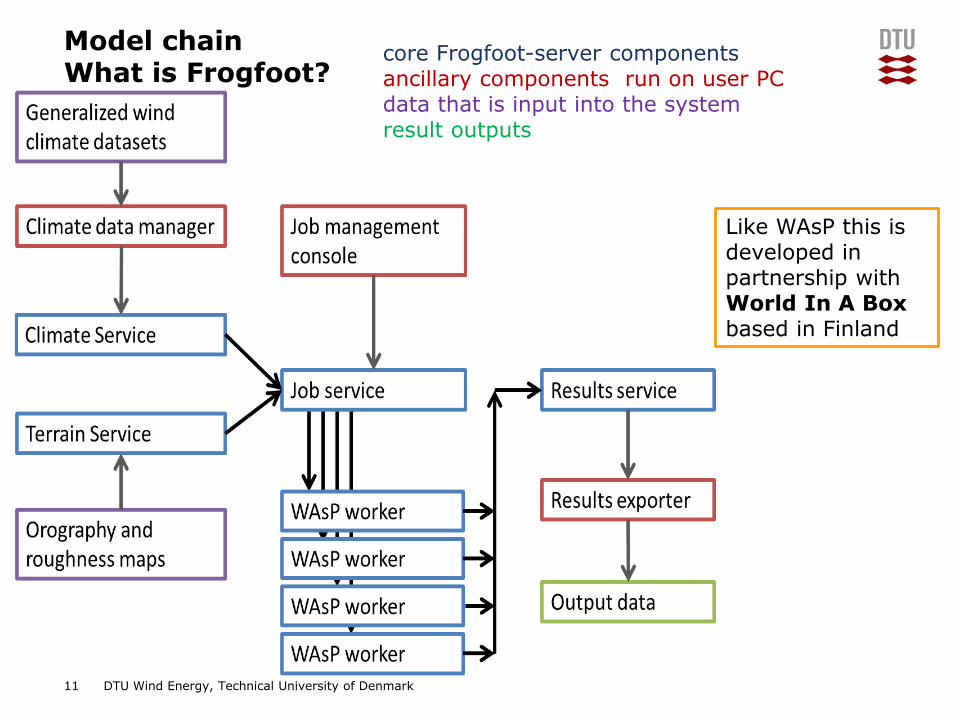
Model chain What is Frogfoot?
core Frogfoot-server components ancillary components run on user PCdata that is input into the systemresult outputs
Like WAsP this is developed in partnership with World In A Box based in Finland

DTU Wind Energy, Technical University of Denmark
Frogfoot components
12
Job Creation
Job Management Console
WAsP Worker
Results Exporter

DTU Wind Energy, Technical University of Denmark13
WAsP Worker(s)
Model chain How to work with Frogfoot?

DTU Wind Energy, Technical University of Denmark
MicroscaleOrographic speed-up
14
Streamlines closer together means faster flow
Modification of the wind profile
Winds speed up on hills
Winds slow down in valleys

DTU Wind Energy, Technical University of Denmark15
MicroscaleSurface roughness length

DTU Wind Energy, Technical University of Denmark16
New log-profile
Transition profileUnchanged profile
Rule of thumb:
1:100
MicroscaleSurface roughness change
Accounted for by roughnessspeed-up and meso roughnessparameters from WAsP flow model

DTU Wind Energy, Technical University of Denmark
Datasets: atmospheric data
Reanalysis
17
Product Model system Horizontal resolution
Period covered
Temporal resolution
ERA Interim reanalysis
T255, 60 vertical levels, 4DVar
~0.7° × 0.7° 1979-
present 3-hourly
NASA – GAO/MERRA
GEOS5 data assimilation system (Incremental
Analysis Updates), 72 levels 0.5° × 0.67°
1979-present
hourly
NCAR CFDDA
MM5 (regional model)+ FDDA
~40 km 1985-2005 hourly
CFSR NCEP GFS (global forecast
system) ~38 km
1979-2009 (& updating)
hourly

DTU Wind Energy, Technical University of Denmark
Challenges in generalizing wind climatologies
• Roughness length among the various reanalysis varies
• The response of the simulated wind profile to the surface roughness varies from model to model
18 2 June 2015
surface roughness length (m)

DTU Wind Energy, Technical University of Denmark
Datasets terrain: elevation and roughness
Topography: surface description
Elevation
Shuttle Radar Topography Mission (SRTM) resolution 90 - 30 m
Viewfinder, compiles SRTM and other datasets resolution 90 - 30 m
ASTER Global Digital Elevation Model (ASTER GDEM) resolution 30 m
Land cover
ESA GlobCover resolution 300 m
Modis, land cover classification resolution 500 m
19

DTU Wind Energy, Technical University of Denmark
Challenges in determining surface roughness
GLOBCOVER
20

DTU Wind Energy, Technical University of Denmark
Challenges in determining surface roughness Roughness lengths used in the GWA
21

DTU Wind Energy, Technical University of Denmark
Example output 250 m calculation node spacing
22

DTU Wind Energy, Technical University of Denmark23
Output and verification
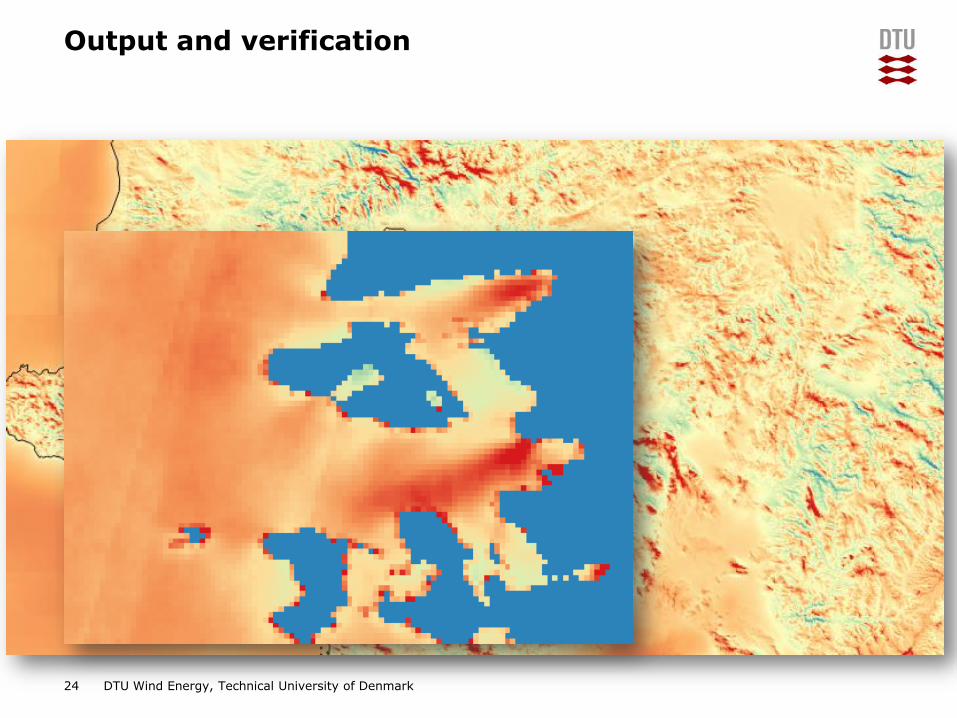
DTU Wind Energy, Technical University of Denmark24
Output and verification

DTU Wind Energy, Technical University of Denmark25
Output and verification

DTU Wind Energy, Technical University of Denmark
Output and verification
26
Contingency map for a power density threshold of 600W/m^2 comparing WASA and GWA, Tobias Ahsbahs, 2015

DTU Wind Energy, Technical University of Denmark27
Web user interface, walk through

DTU Wind Energy, Technical University of Denmark28
Roughness length
DTU Wind Energy, Technical University of Denmark29
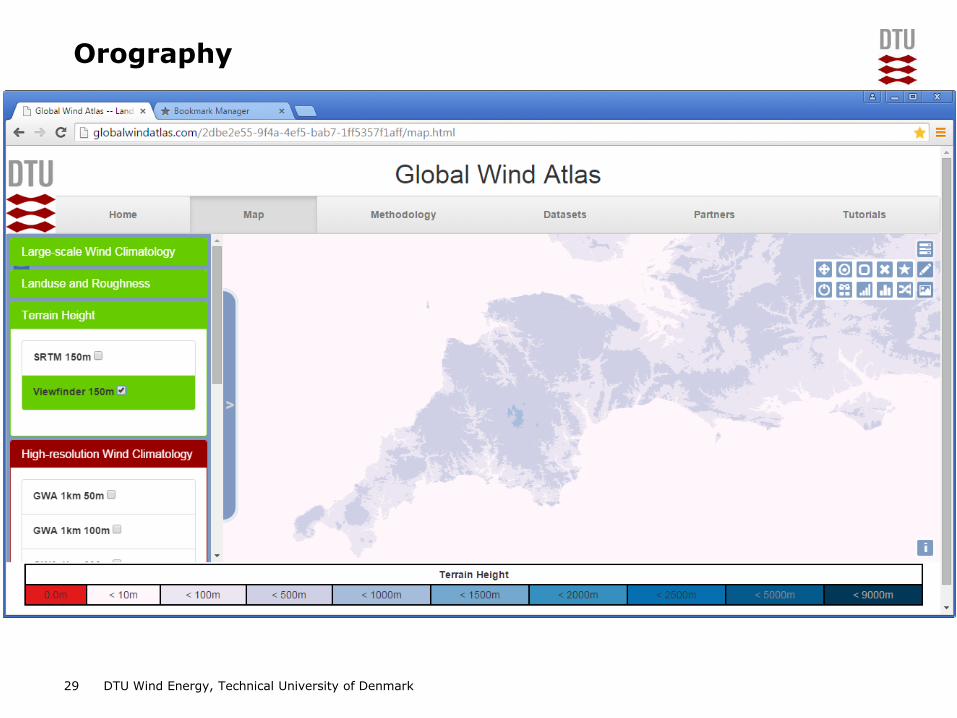
Orography

DTU Wind Energy, Technical University of Denmark30
WAsP Mesoroughness per sector

DTU Wind Energy, Technical University of Denmark31
Orographic speed-up per sector

DTU Wind Energy, Technical University of Denmark32
Annual mean wind climate

DTU Wind Energy, Technical University of Denmark34
Selection of aggregation area

DTU Wind Energy, Technical University of Denmark35
Wind rose

DTU Wind Energy, Technical University of Denmark36
Windiest fractile plot

DTU Wind Energy, Technical University of Denmark37
Wind speed distribution

DTU Wind Energy, Technical University of Denmark38
Distribution of mean wind speed over area

DTU Wind Energy, Technical University of Denmark39
Mean annual cycle over area

DTU Wind Energy, Technical University of Denmark
Still to complete
• Global runs with alternative reanalyses (1000 m)
• Complete verification
• Integration into IRENA global atlas
• Launch – IRENA-coordinated web event, September 2015
40

DTU Wind Energy, Technical University of Denmark
• Following projects
– Framework agreement led by ECN (NL) to supply renewable resource data to JRC TIMES-EU energy model.
– Foundation for data inputs and concepts for server platform for the New European Wind Atlas
• Roughness mapping improvements
• Elevation data verification would be of value
• Model chain development
– Many possibilities for post processing of data
41
Future plans

DTU Wind Energy, Technical University of Denmark
Global assessments of the technical potential
42
IPCC Special Report on Renewable Energy Sources and Climate Change: range tech. pot. 19 – 125 PWh / year (onshore and near shore)

DTU Wind Energy, Technical University of Denmark43
We can use the EUDP Global Wind Atlas to determine global potential accounting for high resolution effects and get a better spatial breakdown.
So far “back of the envelope” calculations suggest 2 – 300 PWh / year
The challenge is to create a consistent approach, with range of tested assumptions, available for the community to scrutinize.
The Global Wind Atlas makes this easier via
• Transparency of methodology• Providing data to allow annual energy production calculation• GIS integration of datasets
Global assessments of the technical potential

DTU Wind Energy, Technical University of Denmark
Thank you for your attention
Funding:
EUDP 11-II, Globalt Vind Atlas, 64011-0347
44

DTU Wind Energy, Technical University of Denmark45

DTU Wind Energy, Technical University of Denmark46

DTU Wind Energy, Technical University of Denmark47

DTU Wind Energy, Technical University of Denmark48

DTU Wind Energy, Technical University of Denmark49

DTU Wind Energy, Technical University of Denmark50

DTU Wind Energy, Technical University of Denmark51

DTU Wind Energy, Technical University of Denmark52

DTU Wind Energy, Technical University of Denmark53