Embed Size (px)
Citation preview
© 2014 Inmar, Inc. CONFIDENTIAL – DO NOT COPY, DISTRIBUTE OR USE WITHOUT INMAR WRITTEN PERMISSION• Presenter Title Goes Here
• Name of Presenter Goes Here
Repairing Warranty
ManagementIn Automotive Aftermarket
Maintenance Required
© 2014 Inmar, Inc. CONFIDENTIAL – DO NOT COPY, DISTRIBUTE OR USE WITHOUT INMAR WRITTEN PERMISSION
2
Rob ZomokSr. Director,Supply ChainPerformance Analytics
Dave MillerVice President ofMarketing,Automotive Aftermarket
© 2014 Inmar, Inc. CONFIDENTIAL – DO NOT COPY, DISTRIBUTE OR USE WITHOUT INMAR WRITTEN PERMISSION
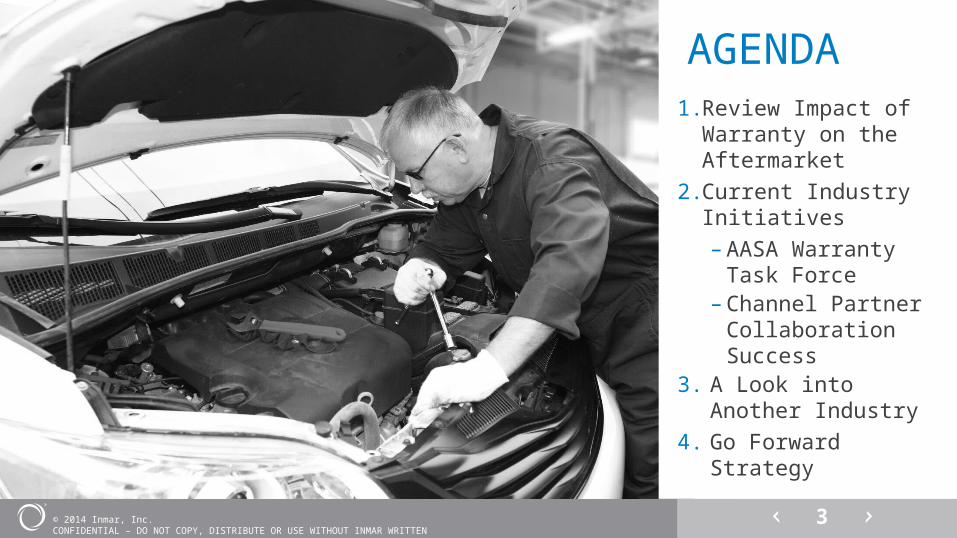
AGENDA1. Review Impact of
Warranty on the Aftermarket
2. Current Industry Initiatives– AASA Warranty Task
Force– Channel Partner
Collaboration Success
3. A Look into Another Industry
4. Go Forward Strategy3
© 2014 Inmar, Inc. CONFIDENTIAL – DO NOT COPY, DISTRIBUTE OR USE WITHOUT INMAR WRITTEN PERMISSION
4
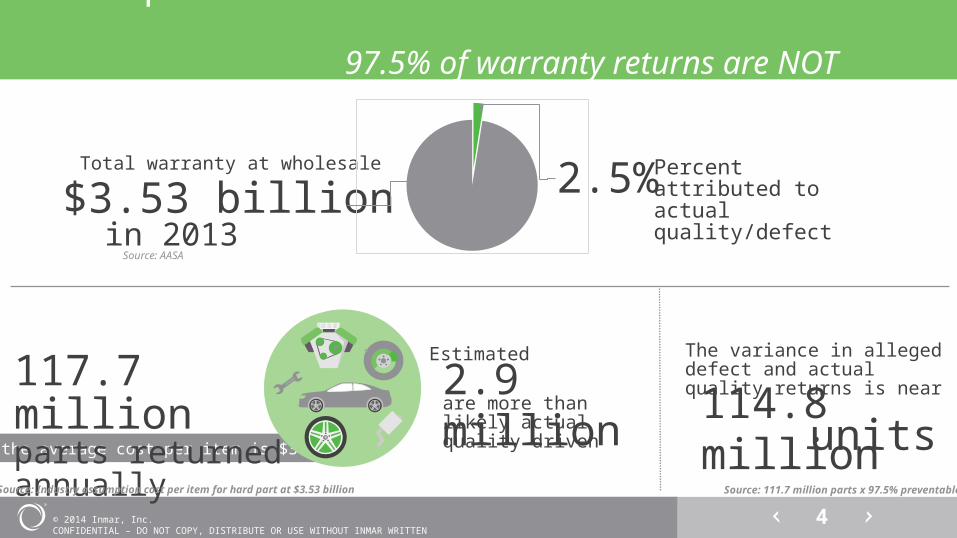
The Impact: 97.5% of warranty returns are NOT QUALITY RELATED
Total warranty at wholesale
$3.53 billionin 2013
2.5% Percent attributed to actual quality/defect
Source: AASA
*If the average cost per item is $30
117.7 millionparts returned annually
2.9 millionEstimated
are more than likely actual quality driven
The variance in alleged defect and actual quality returns is near
114.8 million units
Source: Industry assumption cost per item for hard part at $3.53 billion Source: 111.7 million parts x 97.5% preventable
© 2014 Inmar, Inc. CONFIDENTIAL – DO NOT COPY, DISTRIBUTE OR USE WITHOUT INMAR WRITTEN PERMISSION
5
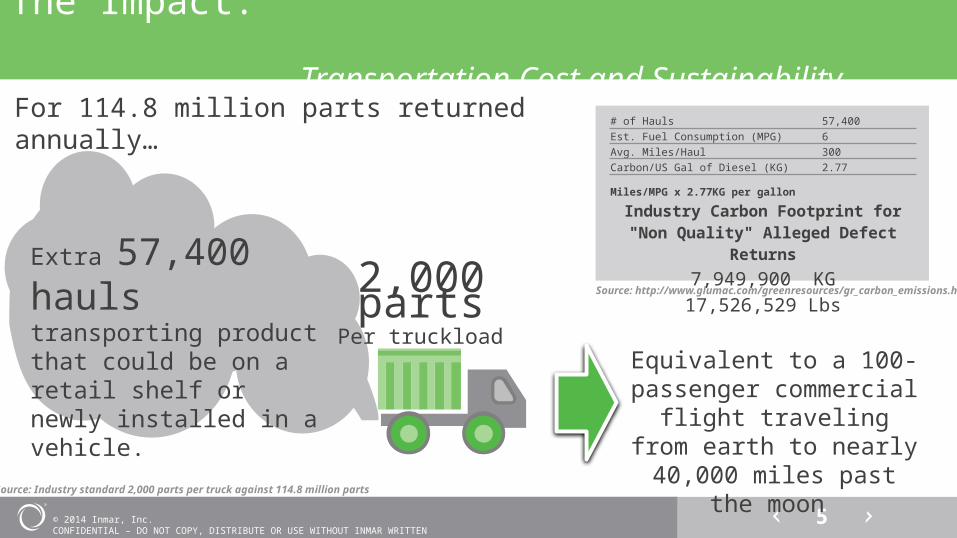
The Impact: Transportation Cost and Sustainability
# of Hauls 57,400 Est. Fuel Consumption (MPG) 6Avg. Miles/Haul 300Carbon/US Gal of Diesel (KG) 2.77
Miles/MPG x 2.77KG per gallonIndustry Carbon Footprint for "Non Quality"
Alleged Defect Returns7,949,900 KG
17,526,529 Lbs
2,000parts
Extra 57,400 hauls transporting product that could be on a retail shelf or newly installed in a vehicle.
Equivalent to a 100-passenger commercial
flight traveling from earth to nearly 40,000 miles past the moon
Source: http://www.glumac.com/greenresources/gr_carbon_emissions.html
For 114.8 million parts returned annually…
Per truckload
Source: Industry standard 2,000 parts per truck against 114.8 million parts
© 2014 Inmar, Inc. CONFIDENTIAL – DO NOT COPY, DISTRIBUTE OR USE WITHOUT INMAR WRITTEN PERMISSION
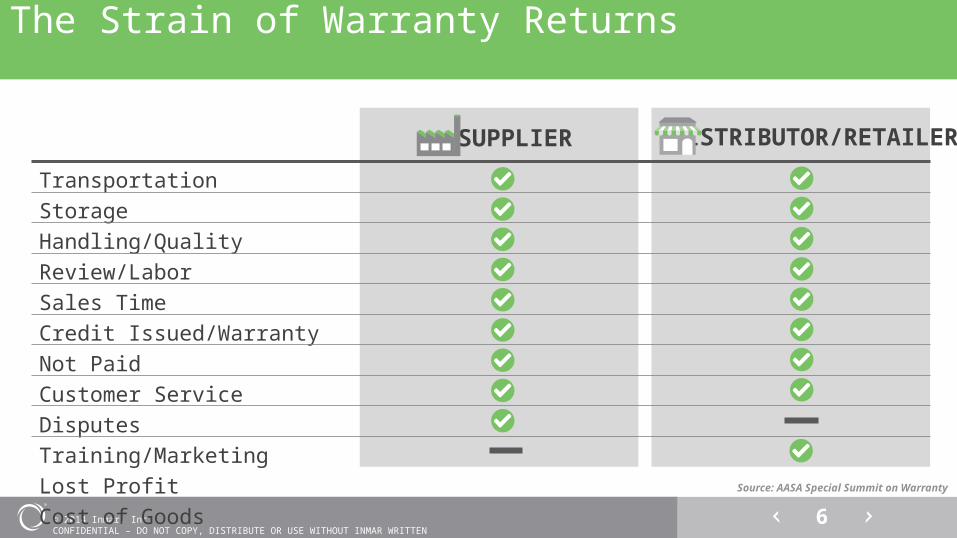
The Strain of Warranty Returns On Suppliers and Distribution Partners are identical
Source: AASA Special Summit on Warranty
DISTRIBUTOR/RETAILER
TransportationStorageHandling/Quality Review/LaborSales TimeCredit Issued/Warranty Not PaidCustomer ServiceDisputes Training/MarketingLost ProfitCost of Goods
SUPPLIER
6
© 2014 Inmar, Inc. CONFIDENTIAL – DO NOT COPY, DISTRIBUTE OR USE WITHOUT INMAR WRITTEN PERMISSION
7
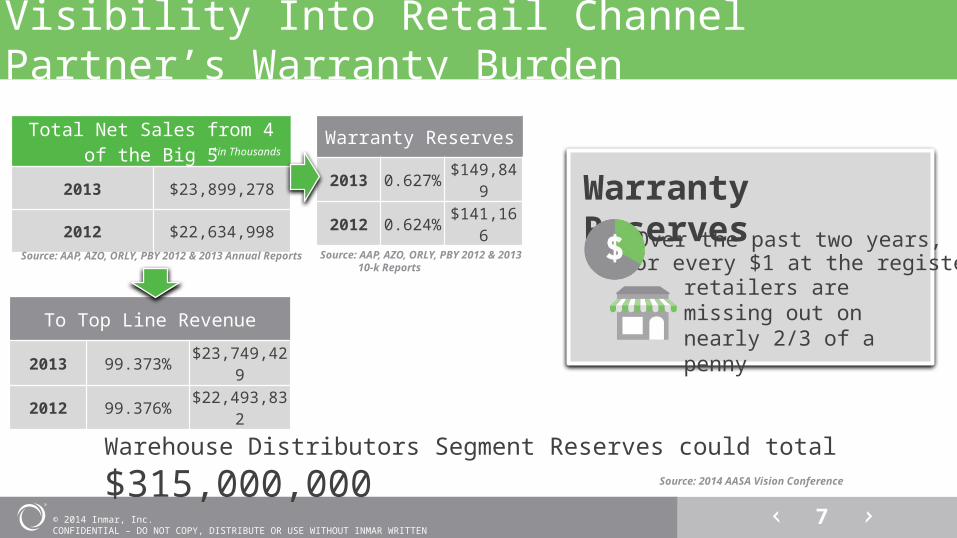
Total Net Sales from 4 of the Big 5
2013 $23,899,278
2012 $22,634,998
To Top Line Revenue
2013 99.373% $23,749,429
2012 99.376% $22,493,832
Warranty Reserves
2013 0.627% $149,849
2012 0.624% $141,166
Visibility Into Retail Channel Partner’s Warranty Burden
Warranty Reserves
Warehouse Distributors Segment Reserves could total $315,000,000
*in Thousands
Over the past two years,for every $1 at the registerretailers are missing out on nearly 2/3 of a penny
Source: AAP, AZO, ORLY, PBY 2012 & 2013 Annual Reports Source: AAP, AZO, ORLY, PBY 2012 & 2013 10-k Reports
Source: 2014 AASA Vision Conference
© 2014 Inmar, Inc. CONFIDENTIAL – DO NOT COPY, DISTRIBUTE OR USE WITHOUT INMAR WRITTEN PERMISSION
8
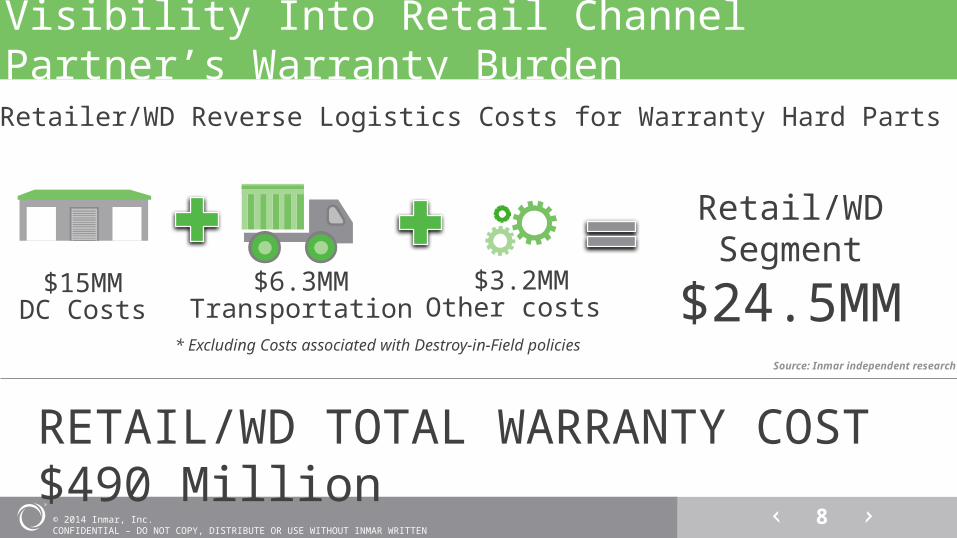
Visibility Into Retail Channel Partner’s Warranty Burden
* Excluding Costs associated with Destroy-in-Field policies
Assumed Retailer/WD Reverse Logistics Costs for Warranty Hard Parts Returns
$15MMDC Costs
$6.3MMTransportation
$3.2MMOther costs
Retail/WD Segment
$24.5MM
RETAIL/WD TOTAL WARRANTY COST $490 Million
Source: Inmar independent research
© 2014 Inmar, Inc. CONFIDENTIAL – DO NOT COPY, DISTRIBUTE OR USE WITHOUT INMAR WRITTEN PERMISSION
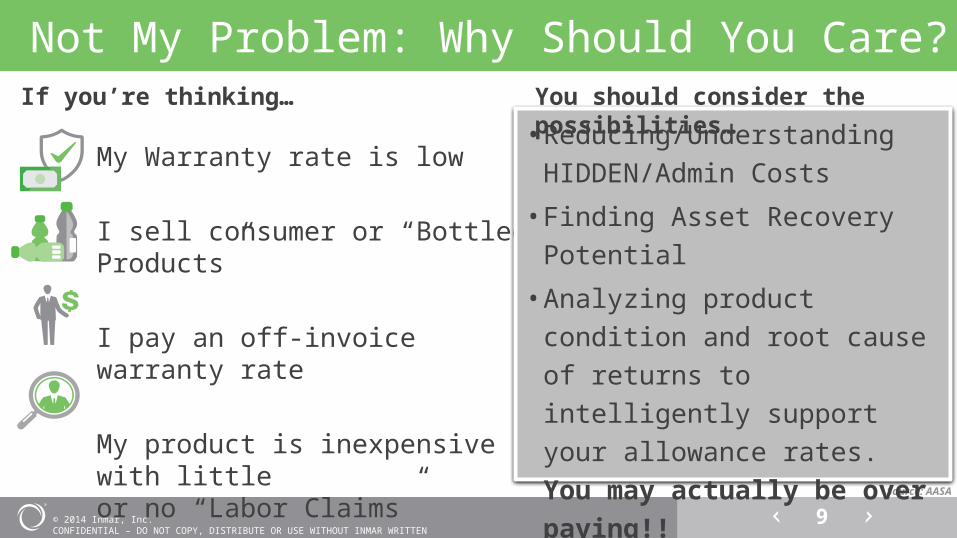
Not My Problem: Why Should You Care?
My Warranty rate is low
I sell consumer or “Bottled Products”
I pay an off-invoice warranty rate My product is inexpensive with little or no “Labor Claims”
Source: AASA
• Reducing/Understanding HIDDEN/Admin Costs
• Finding Asset Recovery Potential
• Analyzing product condition and root cause of returns to intelligently support your allowance rates. You may actually be over paying!!
• Improving Supply Chain handling practices
9
If you’re thinking… You should consider the possibilities…
© 2014 Inmar, Inc. CONFIDENTIAL – DO NOT COPY, DISTRIBUTE OR USE WITHOUT INMAR WRITTEN PERMISSION
10
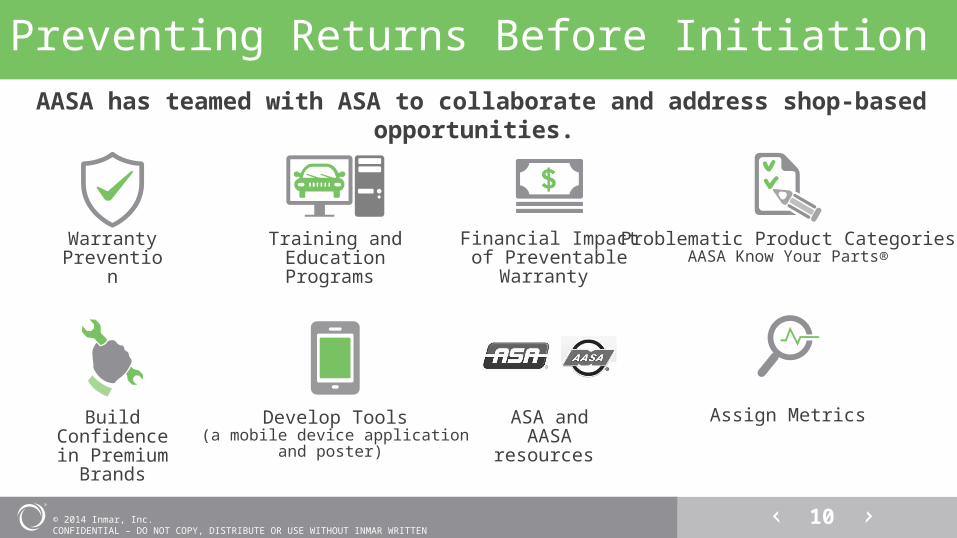
Preventing Returns Before InitiationAASA has teamed with ASA to collaborate and address shop-based opportunities.
Warranty Prevention
Training and Education Programs
Financial Impact of Preventable Warranty
Problematic Product CategoriesAASA Know Your Parts®
Build Confidence in
Premium Brands
Develop Tools(a mobile device application
and poster)
ASA and AASA
resources
Assign Metrics
© 2014 Inmar, Inc. CONFIDENTIAL – DO NOT COPY, DISTRIBUTE OR USE WITHOUT INMAR WRITTEN PERMISSION
11
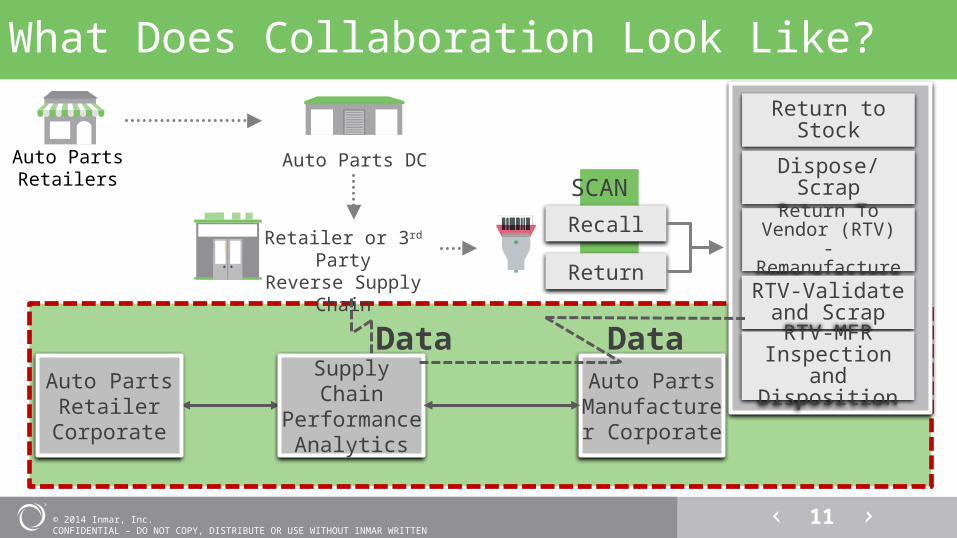
What Does Collaboration Look Like?
Recall
Return
Return to Stock
Dispose/Scrap
Return To Vendor (RTV) -
Remanufacture
RTV-Validate and Scrap
Supply Chain Performance
Analytics
Auto PartsRetailer
Corporate
Auto PartsManufacturer
Corporate
SCAN
Data RTV-MFR Inspection and
Disposition
Data
Auto PartsRetailers
Auto Parts DC
Retailer or 3rd PartyReverse Supply
Chain
© 2014 Inmar, Inc. CONFIDENTIAL – DO NOT COPY, DISTRIBUTE OR USE WITHOUT INMAR WRITTEN PERMISSION
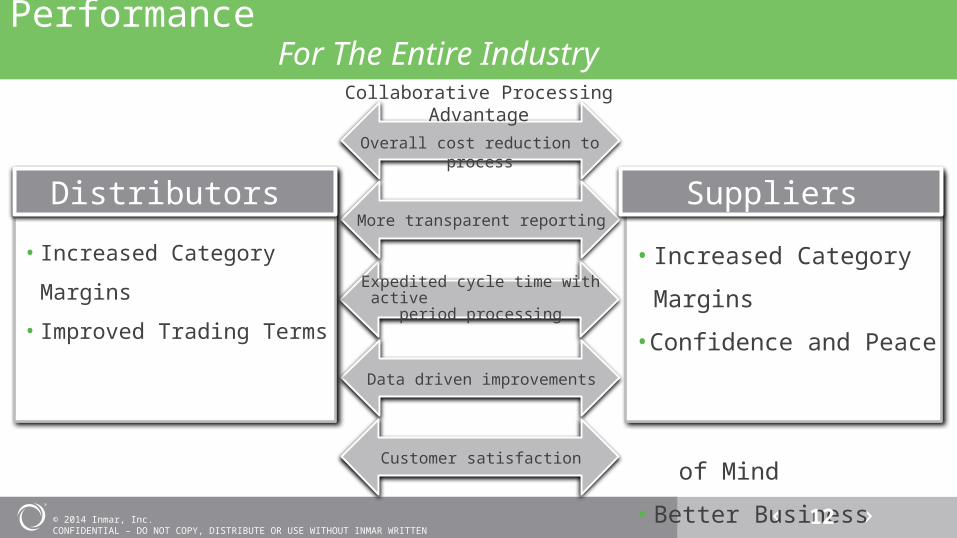
Collaboration Elevates Financial Performance For The Entire Industry
Expedited cycle time with active period
processing
Overall cost reduction to process
More transparent reporting
Data driven improvements
Collaborative Processing Advantage
• Increased Category Margins
• Improved Trading Terms
Distributors
• Increased Category Margins
•Confidence and Peace
of Mind
• Better Business Decisions
Suppliers
12
Customer satisfaction
© 2014 Inmar, Inc. CONFIDENTIAL – DO NOT COPY, DISTRIBUTE OR USE WITHOUT INMAR WRITTEN PERMISSION
13
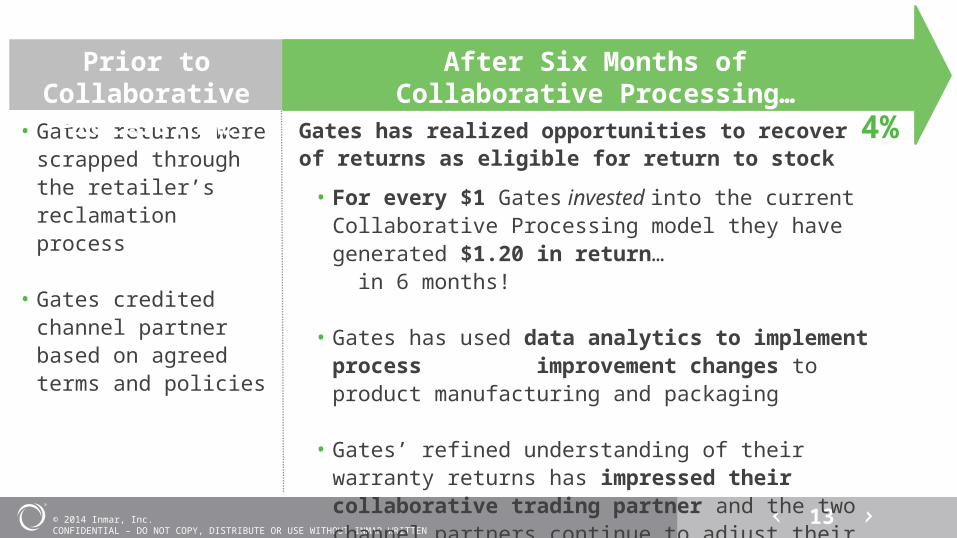
• Gates returns were scrapped through the retailer’s reclamation process
• Gates credited channel partner based on agreed terms and policies
Prior to Collaborative Processing…
After Six Months of Collaborative Processing…
Gates has realized opportunities to recover 4% of returns as eligible for return to stock
• For every $1 Gates invested into the current Collaborative Processing model they have generated $1.20 in return… in 6 months!
• Gates has used data analytics to implement process improvement changes to product manufacturing and packaging
• Gates’ refined understanding of their warranty returns has impressed their collaborative trading partner and the two channel partners continue to adjust their partnership policies for everyone’s best interest.
© 2014 Inmar, Inc. CONFIDENTIAL – DO NOT COPY, DISTRIBUTE OR USE WITHOUT INMAR WRITTEN PERMISSION
14
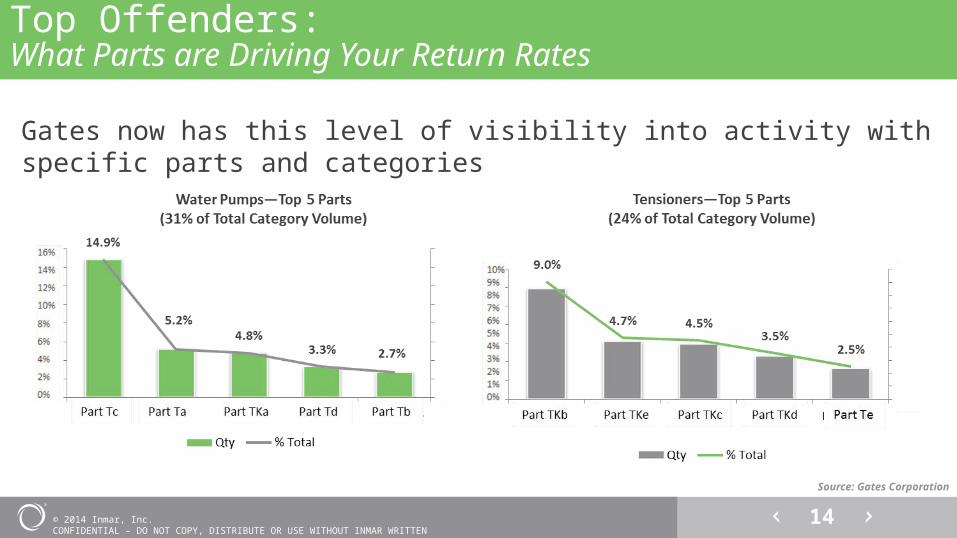
Top Offenders:What Parts are Driving Your Return Rates
Gates now has this level of visibility into activity with specific parts and categories
Source: Gates Corporation
© 2014 Inmar, Inc. CONFIDENTIAL – DO NOT COPY, DISTRIBUTE OR USE WITHOUT INMAR WRITTEN PERMISSION
15
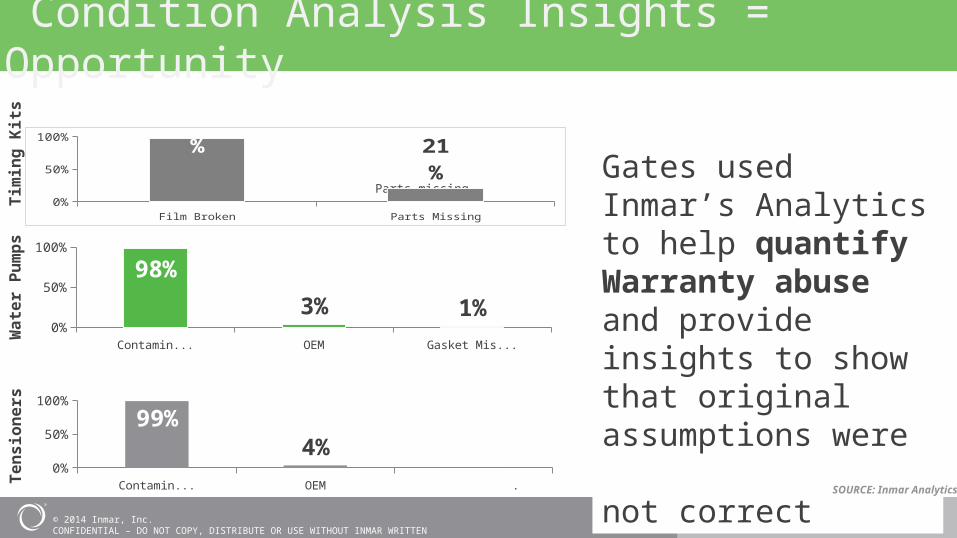
Condition Analysis Insights = Opportunity
Contaminated OEM Gasket Missing0%
20%40%60%80%
100%
98%
3% 1%
Contaminated OEM Gasket Missing0%
20%40%60%80%
100%
99%4%
0.2%
Gates used Inmar’s Analytics to help quantify Warranty abuse and provide insights to show that original assumptions were not correct
Parts missing
SOURCE: Inmar Analytics
Film Broken Parts Missing0%
20%40%60%80%
100% 97%
21%
Tim
ing
Kits
Wat
er P
umps
Tens
ione
rs
© 2014 Inmar, Inc. CONFIDENTIAL – DO NOT COPY, DISTRIBUTE OR USE WITHOUT INMAR WRITTEN PERMISSION
16
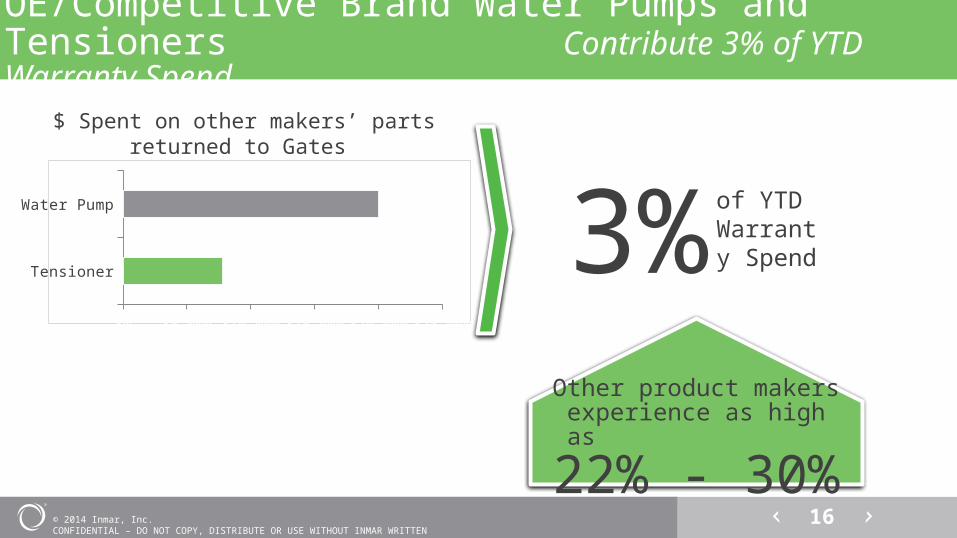
OE/Competitive Brand Water Pumps and Tensioners Contribute 3% of YTD Warranty Spend
Tensioner
Water Pump
$0 $5,000 $10,000 $15,000 $20,000 $25,000
3% of YTD Warranty Spend
Other product makers experience as high as
22% - 30%
$ Spent on other makers’ parts returned to Gates
© 2014 Inmar, Inc. CONFIDENTIAL – DO NOT COPY, DISTRIBUTE OR USE WITHOUT INMAR WRITTEN PERMISSION
17
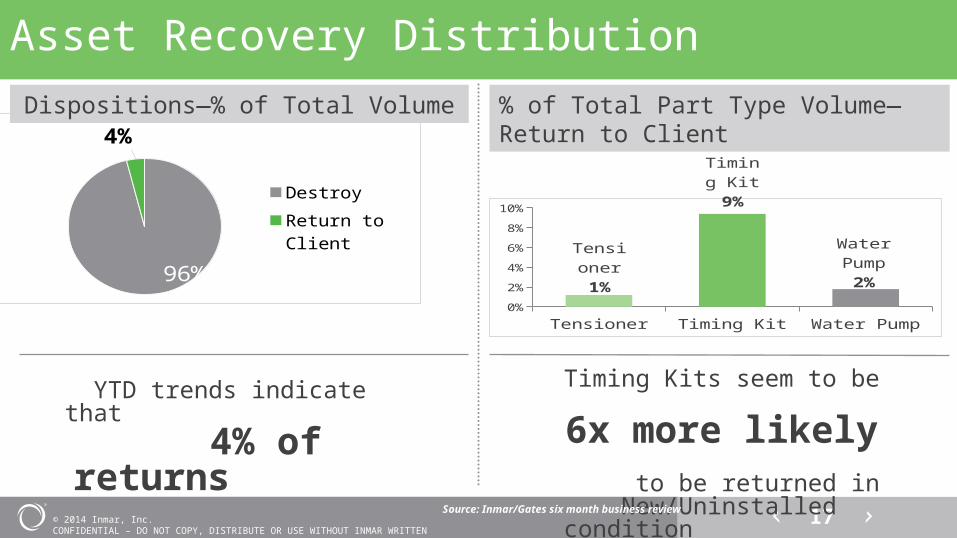
96%
4%
Destroy
Return to Client
Asset Recovery DistributionDispositions—% of Total Volume
YTD trends indicate that 4% of returns are
recovered as eligible for return to stock
Tensioner Timing Kit Water Pump0%
2%
4%
6%
8%
10%
Ten-sioner
1%
Timing Kit9%
Water Pump
2%
Timing Kits seem to be 6x more likely
to be returned in New/Uninstalled condition
than Tensioners and Water Pumps
% of Total Part Type Volume—Return to Client
Source: Inmar/Gates six month business review

© 2014 Inmar, Inc. CONFIDENTIAL – DO NOT COPY, DISTRIBUTE OR USE WITHOUT INMAR WRITTEN PERMISSION
18
Let’s Explore What’s Missing
We are not alone…other industries face these challenges
You are here
What they do:• Metrics in place to quantify results/losses• Industry benchmarks for competitive comparison• Agreement on policy related to costs of returns for
both sides• Collaboration between channel partners
Source: AASA
© 2014 Inmar, Inc. CONFIDENTIAL – DO NOT COPY, DISTRIBUTE OR USE WITHOUT INMAR WRITTEN PERMISSION
19
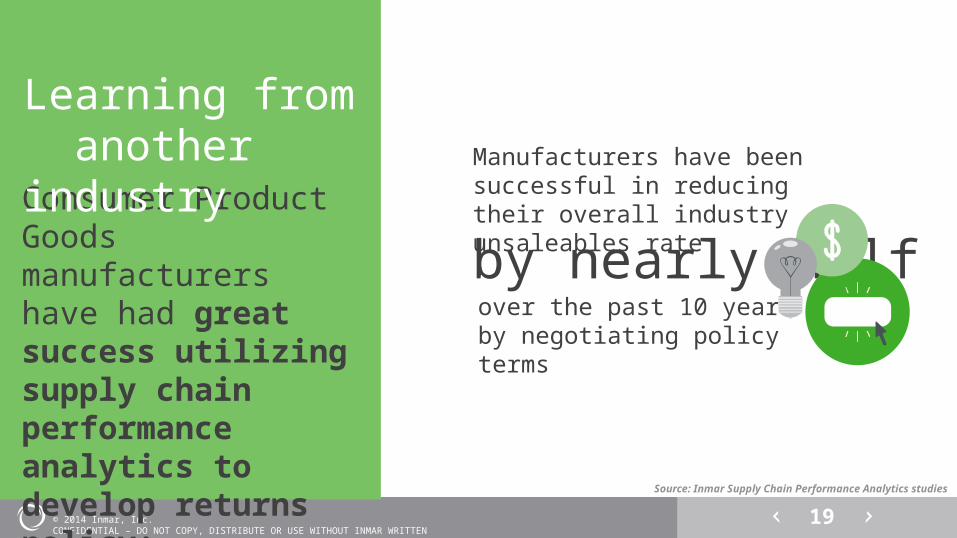
Consumer Product Goods manufacturers have had great success utilizing supply chain performance analytics to develop returns policy:
by nearly half
Learning from another industry Manufacturers have been
successful in reducing their overall industry unsaleables rate
over the past 10 years by negotiating policy terms
Source: Inmar Supply Chain Performance Analytics studies
© 2014 Inmar, Inc. CONFIDENTIAL – DO NOT COPY, DISTRIBUTE OR USE WITHOUT INMAR WRITTEN PERMISSION
20
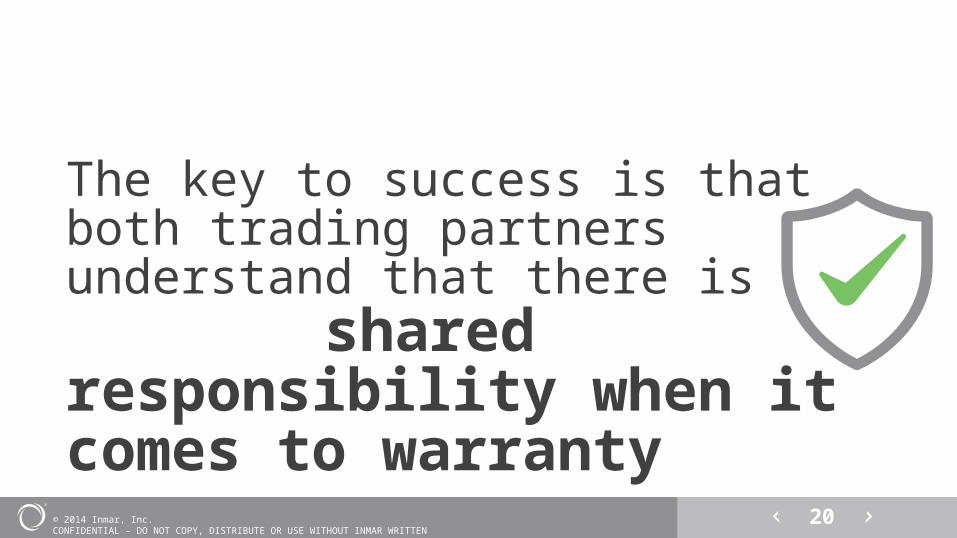
The key to success is that both trading partners understand that there is shared responsibility when it comes to warranty
© 2014 Inmar, Inc. CONFIDENTIAL – DO NOT COPY, DISTRIBUTE OR USE WITHOUT INMAR WRITTEN PERMISSION
21
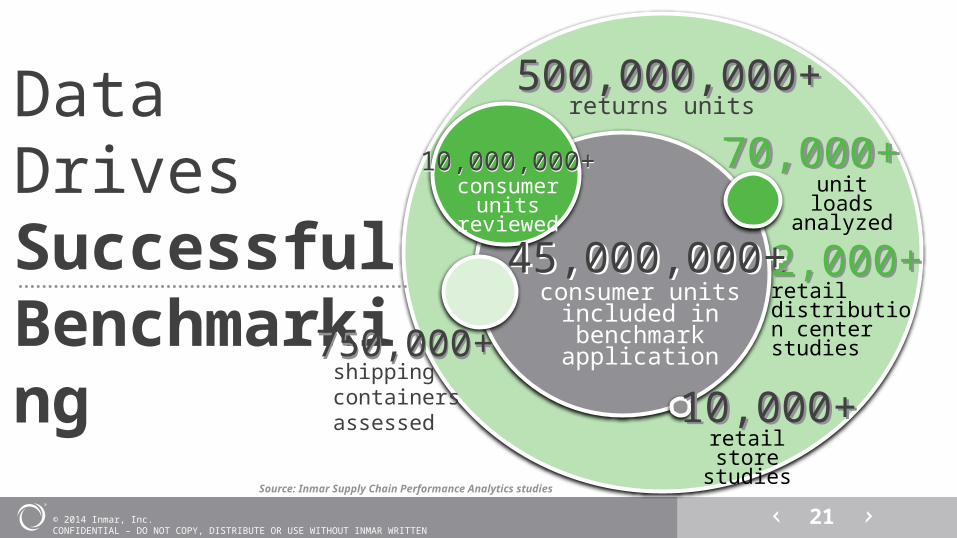
retail distribution center studies
consumer units included in benchmark
application
consumer units reviewed
retail store studies
unit loads analyzed
returns units Data Drives Successful Benchmarking
500,000,000+500,000,000+
10,000,000+10,000,000+ 70,000+70,000+
2,000+2,000+
10,000+
45,000,000+45,000,000+
10,000+
750,000+750,000+shipping containers assessed
Source: Inmar Supply Chain Performance Analytics studies
© 2014 Inmar, Inc. CONFIDENTIAL – DO NOT COPY, DISTRIBUTE OR USE WITHOUT INMAR WRITTEN PERMISSION
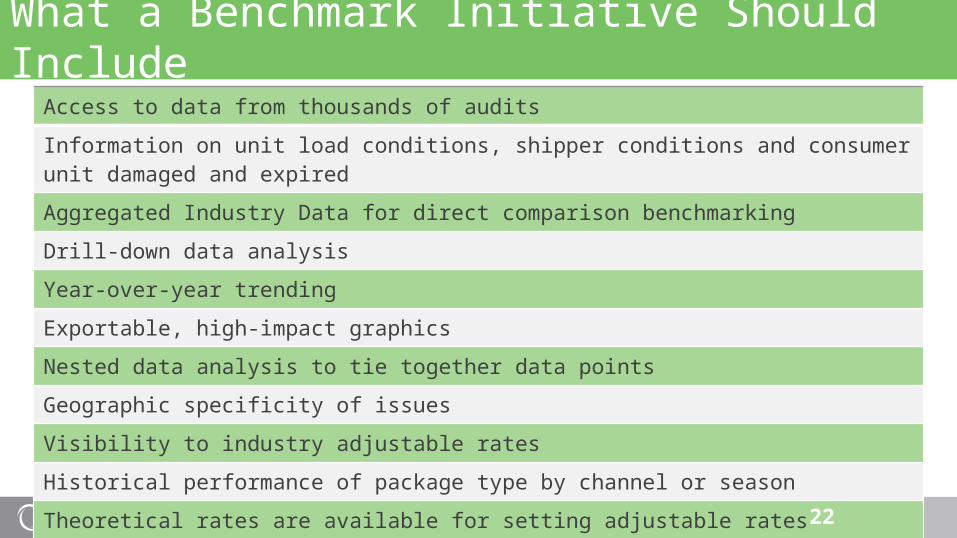
What a Benchmark Initiative Should Include Access to data from thousands of audits
Information on unit load conditions, shipper conditions and consumer unit damaged and expired
Aggregated Industry Data for direct comparison benchmarking
Drill-down data analysis
Year-over-year trending
Exportable, high-impact graphics
Nested data analysis to tie together data points
Geographic specificity of issues
Visibility to industry adjustable rates
Historical performance of package type by channel or season
Theoretical rates are available for setting adjustable rates
22
© 2014 Inmar, Inc. CONFIDENTIAL – DO NOT COPY, DISTRIBUTE OR USE WITHOUT INMAR WRITTEN PERMISSION
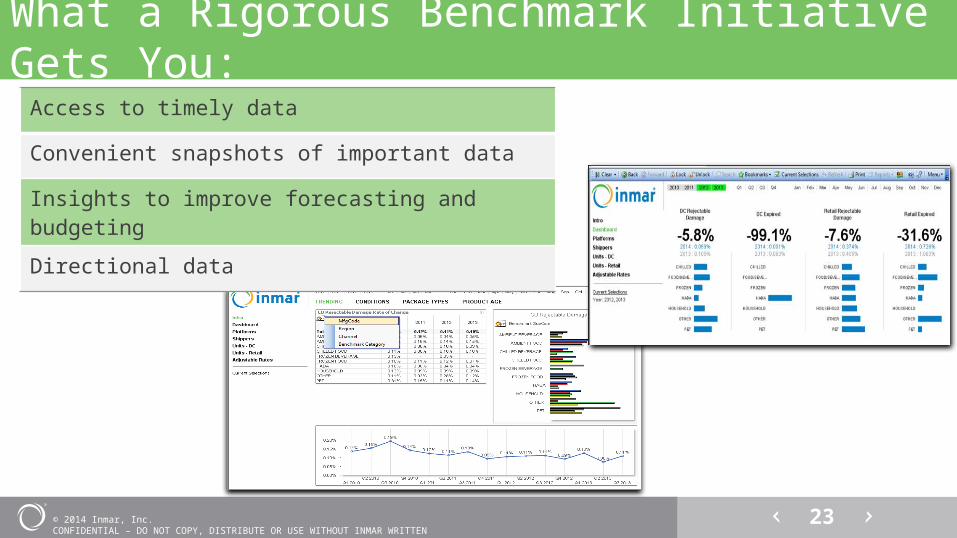
What a Rigorous Benchmark Initiative Gets You:Access to timely data
Convenient snapshots of important data
Insights to improve forecasting and budgeting
Directional data
23
© 2014 Inmar, Inc. CONFIDENTIAL – DO NOT COPY, DISTRIBUTE OR USE WITHOUT INMAR WRITTEN PERMISSION
24Source: Inmar Supply Chain Data 2008--2013
2008 2009 2010 2011 2012 20130
0.20.40.60.8
11.21.41.61.8
2
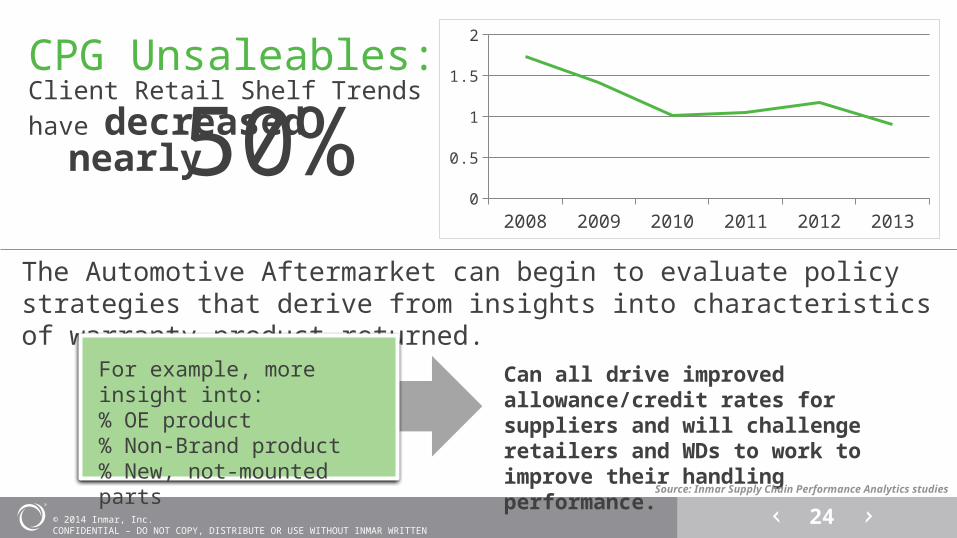
CPG Unsaleables:Client Retail Shelf Trends have decreased
The Automotive Aftermarket can begin to evaluate policy strategies that derive from insights into characteristics of warranty product returned.
Can all drive improved allowance/credit rates for suppliers and will challenge retailers and WDs to work to improve their handling performance.
For example, more insight into:% OE product% Non-Brand product% New, not-mounted parts
nearly50%
Source: Inmar Supply Chain Performance Analytics studies
© 2014 Inmar, Inc. CONFIDENTIAL – DO NOT COPY, DISTRIBUTE OR USE WITHOUT INMAR WRITTEN PERMISSION
25
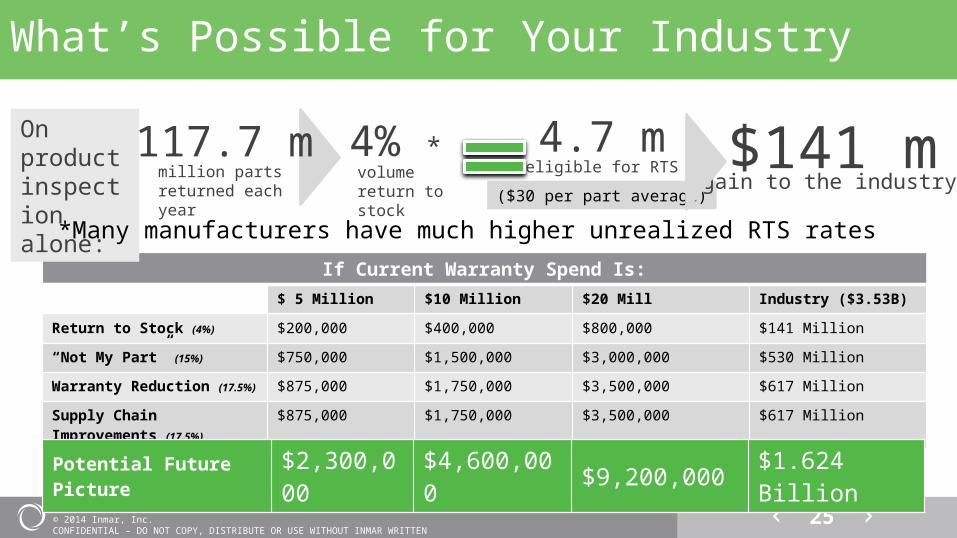
What’s Possible for Your Industry
If Current Warranty Spend Is:$ 5 Million $10 Million $20 Mill Industry ($3.53B)
Return to Stock (4%) $200,000 $400,000 $800,000 $141 Million
“Not My Part” (15%) $750,000 $1,500,000 $3,000,000 $530 Million
Warranty Reduction (17.5%) $875,000 $1,750,000 $3,500,000 $617 Million
Supply Chain Improvements (17.5%)
$875,000 $1,750,000 $3,500,000 $617 Million
Potential Future Picture $2,300,000 $4,600,000 $9,200,000 $1.624 Billion
On product inspection alone:
117.7 mmillion parts returned each year
4% *volume return to stock
4.7 meligible for RTS
($30 per part average)gain to the industry
$141 m*Many manufacturers have much higher unrealized RTS rates
© 2014 Inmar, Inc. CONFIDENTIAL – DO NOT COPY, DISTRIBUTE OR USE WITHOUT INMAR WRITTEN PERMISSION
26
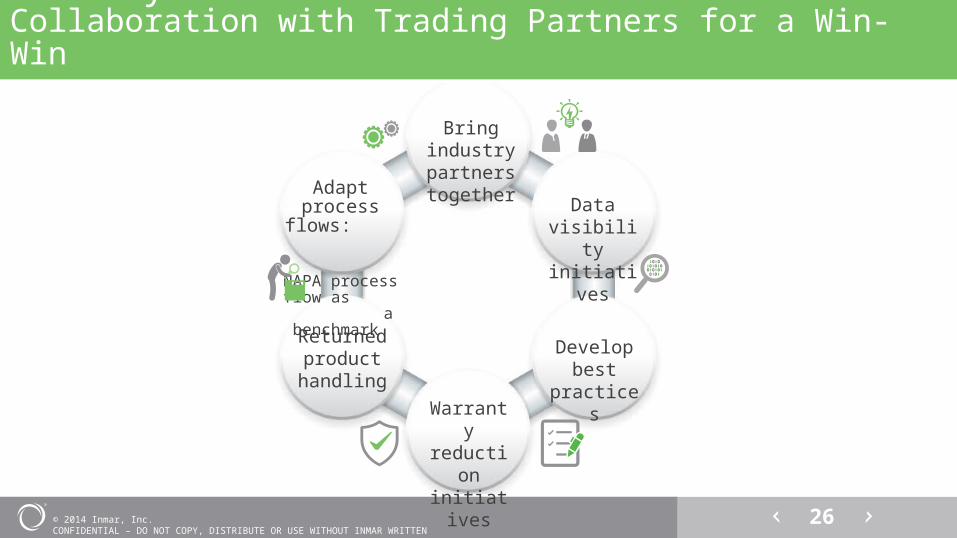
The Key:Collaboration with Trading Partners for a Win-Win
Bring industry partnerstogether Data
visibility initiatives
Develop best
practicesWarranty reductio
n initiative
s
Returned product handling
Adapt process
flows: NAPA process flow
as a benchmark
© 2014 Inmar, Inc. CONFIDENTIAL – DO NOT COPY, DISTRIBUTE OR USE WITHOUT INMAR WRITTEN PERMISSION
27
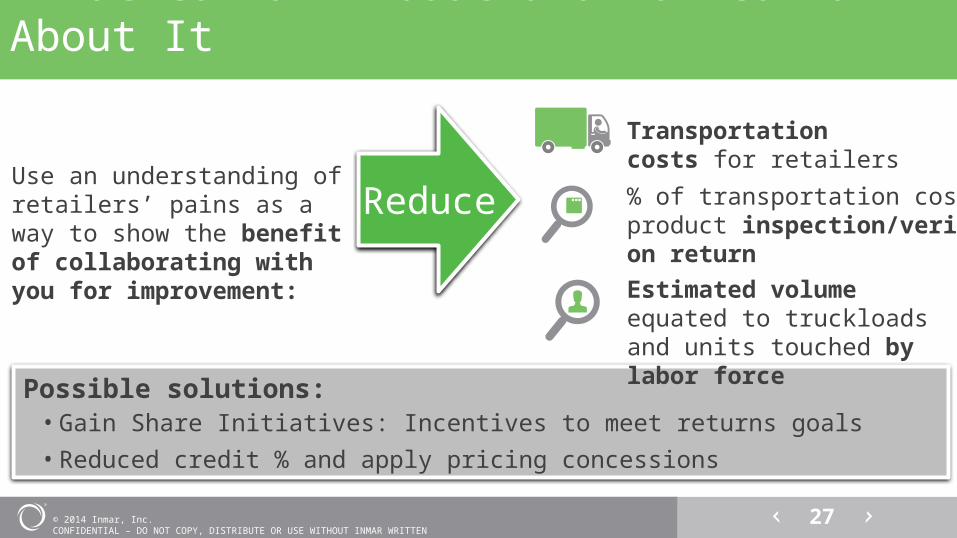
What to Talk About and How to Talk About It
Use an understanding of retailers’ pains as a way to show the benefit of collaborating with you for improvement:
Reduce
Possible solutions:• Gain Share Initiatives: Incentives to meet returns goals• Reduced credit % and apply pricing concessions
Transportation costs for retailers
% of transportation cost with product inspection/verification on returnEstimated volume equated to truckloads and units touched by labor force
© 2014 Inmar, Inc. CONFIDENTIAL – DO NOT COPY, DISTRIBUTE OR USE WITHOUT INMAR WRITTEN PERMISSION
28
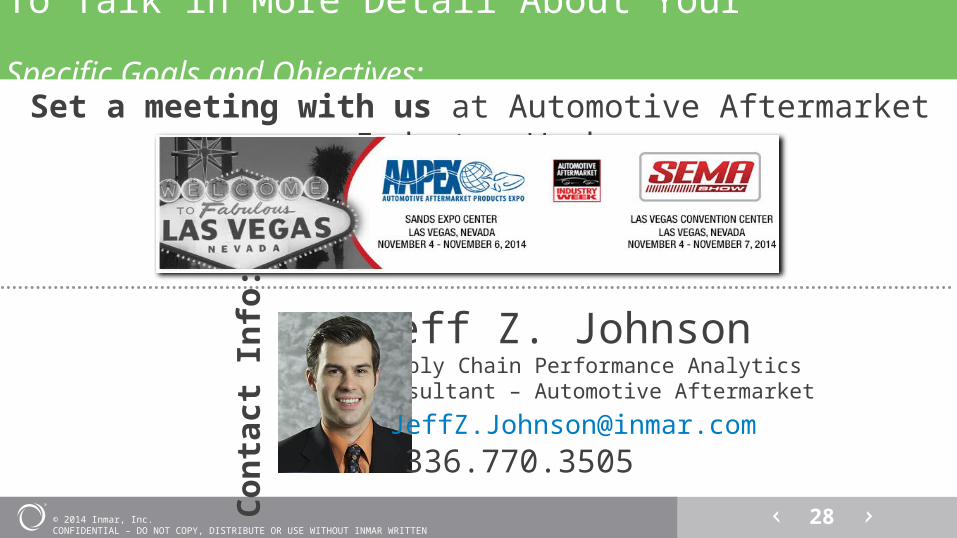
To Talk in More Detail About Your Specific Goals and Objectives:
Set a meeting with us at Automotive Aftermarket Industry Week
Jeff Z. JohnsonSupply Chain Performance AnalyticsConsultant – Automotive Aftermarket
Con
tact
Info
: