Embed Size (px)
Citation preview
Aalborg Universitet
On Modal Parameter Estimates from Ambient Vibration Tests
Agneni, A.; Brincker, Rune; Coppotelli, B.
Published in:Proceedings of the International Conference on Noise and Vibration Engineering
Publication date:2004
Document VersionPublisher's PDF, also known as Version of record
Link to publication from Aalborg University
Citation for published version (APA):Agneni, A., Brincker, R., & Coppotelli, B. (2004). On Modal Parameter Estimates from Ambient Vibration Tests.In Proceedings of the International Conference on Noise and Vibration Engineering: ISMA2004 : Leuven,Belgium, 20 - 22 September, 2004
General rightsCopyright and moral rights for the publications made accessible in the public portal are retained by the authors and/or other copyright ownersand it is a condition of accessing publications that users recognise and abide by the legal requirements associated with these rights.
? Users may download and print one copy of any publication from the public portal for the purpose of private study or research. ? You may not further distribute the material or use it for any profit-making activity or commercial gain ? You may freely distribute the URL identifying the publication in the public portal ?
Take down policyIf you believe that this document breaches copyright please contact us at [email protected] providing details, and we will remove access tothe work immediately and investigate your claim.
Downloaded from vbn.aau.dk on: juli 21, 2018

On Modal Parameter Estimates from Ambient Vibration Tests
A. Agnenit, R. Brinckerl, G. Coppotellit t Aerospace and Astronautics Engineering Department, University of Rome "La Sapienza"- Via Eudossiana, 16-00184 Rome, Italy e-mail: [email protected] t Department of Building Technology and Structural Engineering Aalborg University- Sohngaardsholmsvej 57- 9000, Aalborg, Denmark e-mail: [email protected]
Abstract Modal parameter estimates from ambient vibration testing are turning into the preferred technique when one is interested in systems under actualloadings and operational conditions. Moreover, with this approach, expensive devices to excite the structure are not needed, since it can be adequately excited by human activities, wind, gust, etc. In this paper, the comparison between two different vibration testing techniques is presented. The first approach takes advantage of the frequency domain decomposition, FDD, of the response cross power spectral densities to estimate both the natural frequencies and the "unsealed" mode shapes, whereas the second one, starting from the Hilbert transform of auto power spectral densities and taking account of the cross power spectral densities, allows one to get the frequency response fi.mctions. Both the techniques have been used to estimate the modal parameters of two simple structures (a beam and a plate), excited by an acoustical random signal.
1 Introduction
Some years ago, instead of deriving the mode shapes from modal surveys (carried out by using the inputoutput data) i.e., from the frequency response fi.mctions (FRF), a teclmique which pem1its to get the operating deflection shapes has been introduced, see for instance [ l, 2, 3]. Recently, the practice to derive the modal parameters - natural frequencies, damping ratios and mode shapes - only from the output data, under suitable conditions for the input signals, has become common, and so these methods have been applied, not only to operating machines, but also in the aerospace field, for instance on airplanes [ 4] excited either by turbulence or by wind. Obviously some assumptions, as mentioned before, must be made on the input signals, in particular they are considered random, uncorrelated, with zero mean and unknown standard deviation. The obtained results were completely acceptable, and the modal scale factors (modal masses) could be estimated by a technique, similar to the one introduced in [5], presented in [6, 7, 8, 9]. The paper presents a comparison between two different approaches in order to estimate the modal parameters from ambient vibration tests. The first method is based on the frequency domain decomposition (FDD), [1 0], which, through the singular value decomposition (SVD) of the power spectral density matrix (PSD) of the output signals, detennines both the natural frequencies and the mode shapes. Whereas the damping factors are estimated from the response in the time domain, [I I, I 2]. The second approach starts from the output auto spectral densities, and by applying the Hilbert transfonn, allows one to get the frequency response functions in the driving points, [13]. Then, by using the cross spectral densities and the above-mentioned FRFs, the whole FRFs matrix could be estimated. Obviously, since the random input is unknown, under suitable conditions, all the FRFs are biased by an unknown constant, as besides it happens for the previous method. In this last case the modal parameters could be obtained by a least square fitting of the FRFs, also by a commercial estimating code. Nevertheless, both techniques allows one only to estimate the unsealed
2239
Supplied by The British Library- "The world's knowledge"
2240 PROCEEDINGS OF ISMA2004
mode shapes. If several tests have to be carried out on a single structure, the unknown biasing constant varies from test to test, and then it is necessary to have a reference measurement point, equal for each test, so as to normalize the modal displacements of the whole structure.
Experimental tests were carried out on an aluminum cantilever beam and on a free aluminum plate both excited by an acoustic random signal, irradiated from a loudspeaker driven by the analyzer signal generator.
2 Theoretical basis
Hereafter the two approaches, both the one based on the frequency domain decomposition and the one founded on the Hilbert transform, will be briefly outlined.
2.1 Frequency Domain Decomposition
Modal parameter estimates by using the Frequency Domain Decomposition (FDD) technique, core of the commercial code ARTeMISfrom SVS, [10], are based on the evaluation of the power spectral density matrix of the responses, under the hypothesis that a broad banded input loading is acting on a lightly damped structure. The relation between the PSD ofboth the input and the output signals, i.e., [G(w)Jxx and [G(w)]ff respectively, and the frequency response function matrix, [H(w)], could be expressed as (superscripts"*" and" T" denote complex conjugate and transpose respectively):
[G(w)Jxx = [H(w)]" [G(w)]ff [H(w)]T (1)
On the other hand, if the first M modes are considered in the frequency band of interest, it is possible to demonstrate that Eq. (1) is equivalent to, [7]:
(2)
where { '1/J} k and )..k represent the k-th mode and pole, superscript H the hennitian operation, whereas dk is an unknown scalar quantity that depends on the unknown excitation level if the input loading is uncorrelated, stationary, zero mean, and broad banded. Moreover, recalling that the Fourier transform of an even signal is real even, the SVD decomposition of the PSD matrix of the responses leads to:
[G(w)Jxx = [U(w)] [I:(w)J [U(w)JT (3)
where [U(w )] and [I:(w)] are the matrices of the singular vectors and the singular values respectively. When
the above decomposition is evaluated for w = Wnk, then only one singular value, aJ:l, is not zero, so the natural frequency is obtained from this peak (peak picking method) . If the mode shapes are well separated (corresponding to a structure that vibrates as SDOF system near the k-th natural frequency) . Therefore,
under these conditions, the corresponding singular vector { u} ~) is an estimate of the k-th mode.
Damping ratios could be finally achieved in the time domain, by means of the logarithmic decrement method, considering the auto correlation functions as results of the Inverse Fast Fourier Transfonn of the PSD matrix, [8, 14].
Supplied by The British Library- "The world's knowledge"
OPERATIONAL MODAL ANALYSIS 2241
2.2 Hilbert Transform Identification
Modal parameters could be also estimated by considering output only data starting from the Hilbert transform of the auto power spectral densities of the measured responses, as presented in [ 13]. With this approach, the
auto power spectral densities of the input load, Gfi/i(w), together with the con·esponding spectrum of the response signal, Gxi xi (w)- both evaluated at the experimental degree of freedom i- could be used to estimate
a biased driving point FRF. In fact, as shown in [15], one can write:
(4)
where IHii(w)l is the magnitude of the driving point FRF, that could be, in turn, expressed as:
(5)
Since the power spectral density of the loading, G ftf; ( w), could be considered constant in the frequency
band of interest when the excitation is assumed as white noise, performing the Hilbert transform ofEq. (4), and recalling that the Hilbert transform of a constant is zero , [16], the following relationship is achieved:
H [In Gx;x;(w)] = 2 H [ln lfhi(w)l] (6)
Moreover, the responses are from an actual vibrating structure , therefore they must be causal, so the phase,
<I> ii(w ), can be estimated by the following relationship, [17]:
<I>ii(w) =- H [lniHii(w)IJ (7)
Substituting Eq. (7) into Eq. (6), one gets:
(8)
Finally, the biased frequency response functions , evaluated at the driving points , can be obtained only from the knowledge of the output data:
(9)
Indeed, it has been demonstrated that the biasing constant, VGJJ:, does not change the values of the natural frequencies and damping ratios, [13], so the modal parameters could be evaluated by a least square fitting of the F RF s, also with commercial codes.
The off-diagonal frequency response fi.mctions, could be also estimated once the driving point FRFs, H ii ( w ),
are disposable from Eq. (9). In fact, the F RF relative to the experimental points i and j, could be expressed as follows, [13):
(10)
Therefore, all the F RF matrix could be estimated evaluating only the auto and cross power densities of the output signals.
Supplied by The British Library- "The world's knowledge"

2242
fi1G1<1<11 D'""UIIoc"'>....-!';ll·h•ltU~
" ""'~~'"'" "' ""'.,.~ ••o• t1 ""'"" "" O"U10uo-.. •nuoroo t>r•~•·
PROCEEDINGS OF ISMA2004
Figure 1: Peak Picking of the beam with FDD.
3 Experimental investigation
Two different structures have been considered in order to test the previous approaches. Both the structures were excited by random acoustic waves generated by a loudspeaker. The resulting signal is therefore random in time, but detenninistic in space, being the position of the loudspeaker fixed. The used experimental instnnnentation is presented in the following Table 1.
Spectrum Analyzer LMS SCADAS III Accelerometers PCB (352A 1 0)
AC Power Supply B&K.
Table 1: Experimental setup.
3.1 Cantilever Beam
The considered cantilever beam, whose dimensions were 0.16 x 0.015 x 0.0295 m, had four accelerometers glued on it, equally spaced along the beam span and numbered in increasing order from grid point 2, because the grid point 1 corresponds to the clamped end. Since the loudspeaker was positioned apart from the beam in the neighborhood of the free end, it could excite well the last two grid points, and so this type of excitation -from a practical point of view- could be regarded as an almost MIMO system. The natural frequencies estimated by the two approaches, along with the ones theoretically evaluated, are reported in Tab. 2, where subscripts FDD and HTM stand for Frequency Domain Decomposition and Hilbert Transfom1 Method respectively. The values presented have been obtained by the peak picking method when the FDD approach is adopted, as shown in Fig. 1, where the singular values of the PSD matrix are depicted as frequency function. On the contrary, the natural frequencies evaluated by the HTM method have been estimated by a least square fitting of the biased Frequency Response Functions.
Mode# frheoTy H Z j fFDD H Z !HTM Hz 1 80.82 I 80.90 80.64 : 2 498.3 I 509 508 .5 3 1385 I 1413 1411
Table 2: Comparison between the natural frequencies for the cantilever beam
Moreover, Tab. 3 presents the comparison between the damping factors obtained by applying the previous methodologies .
As one can see, the errors on the natural frequency estimates, derived from the two methods and the ones achieved from the analytical predictions, are irrunaterial. On the contrary, although the damping factor estimates are not so coincident, as the natural frequencies, they are completely acceptable.
Supplied by The British Library- "The world's knowledge''

OPERATIONAL MODAL ANALYSIS 2243
Mode# (FDD% (HTM% 1 0.94 0.82 2 0.90 0.80 3 0.20 0.26
Table 3: Comparison between the damping ratios for the cantilever beam
Figrne 2: Estimate of Mode #I of the beam with FDD.
Figure 3: Estimate of Mode #2 of the beam with FDD.
Figure 4: Estimate of Mode #3 of the beam with FDD.
The first three mode shapes are shown in the Figs. from 2 to 7. The first three ones have been derived by applying the FDD, whereas the last from the HTM. As one could expect, because of the good agreement on the natural frequencies and damping ratios, the mode shapes are practically coincident.
3.2 Free-Free Plate
The second structure considered was an alurninum square plate, 0.25 >< 0.25 x 0.0025 m, excited by a loudspeaker positioned in front of the middle of the plate, at a distance of 10 cm, while vertical responses have been measured at 9 experimental DOFs uniformly distributed on the structure, using 3 rowing accelerometers.
The natural frequencies obtained by applying the two methods are compared with the ones given by the theoretical analysis in Tab. 4. As happened for the cantilever beam, an almost good correlation has been obtained. The peak picking estimate has been shown in Fig. 8.
Supplied by The British library- "The world's knowledge"

2244 PROCEED[NGS OF ISMA2004
0.035~----~---~-----.-------,
0.03
0.025
0.02
~ 0.015
0.01
0.005
Grid Poinls
Figure 5: Estimate of Mode #1 of the beam with Hilbert Transform.
0.03
0.02
0.01
~
~ ~
§ - O.o1
"' -0.02
-o.o3 ·
- 0 ,04 1
Grid Point
Figure 6: Estimate of Mode #2 of the beam with Hilbert Transfom1.
0.015
0.01
0.005 .
] "' E :E
-0.005 1-
-0.01
-0.015
-0.02 1
Grid Poinl
Figure 7: Estimate of Mode #3 of the beam with Hiibert Transform.
Supplied by The British Library- "The world's knowledge"

OPERATIONAL MODAL ANALYSIS
Mode# !Theory Hz !FDD Hz !I-ITM Hz 1 75.59 69.40 70.90
2 109.9 101.7 101.6
3 136.5 148.7 148.2
4 194.0 187.5 190.8
Table 4: Comparison between the natural frequencies for the free-free plate
r ... ~_,~,Ditnii\OiutQ>fllcn· l'U~Pit""t Shf"•rV•IJoool ,,,....,, Dlno~~'l:lri<u
e iD"ll ht: Tll~
Figure 8: Peak Picking of the plate with FDD.
Figure 9: Estimate of Mode #1 of the plate with FDD
The relative damping ratios have been reported in Tab. 5.
Mode# (;;_uu (,~ ·rM
1 0.45 0.55 2 0.23 0.48 3 0.81 0.96 4 0.68 0.59
Table 5: Comparison between the damping ratios for the free-free plate
2245
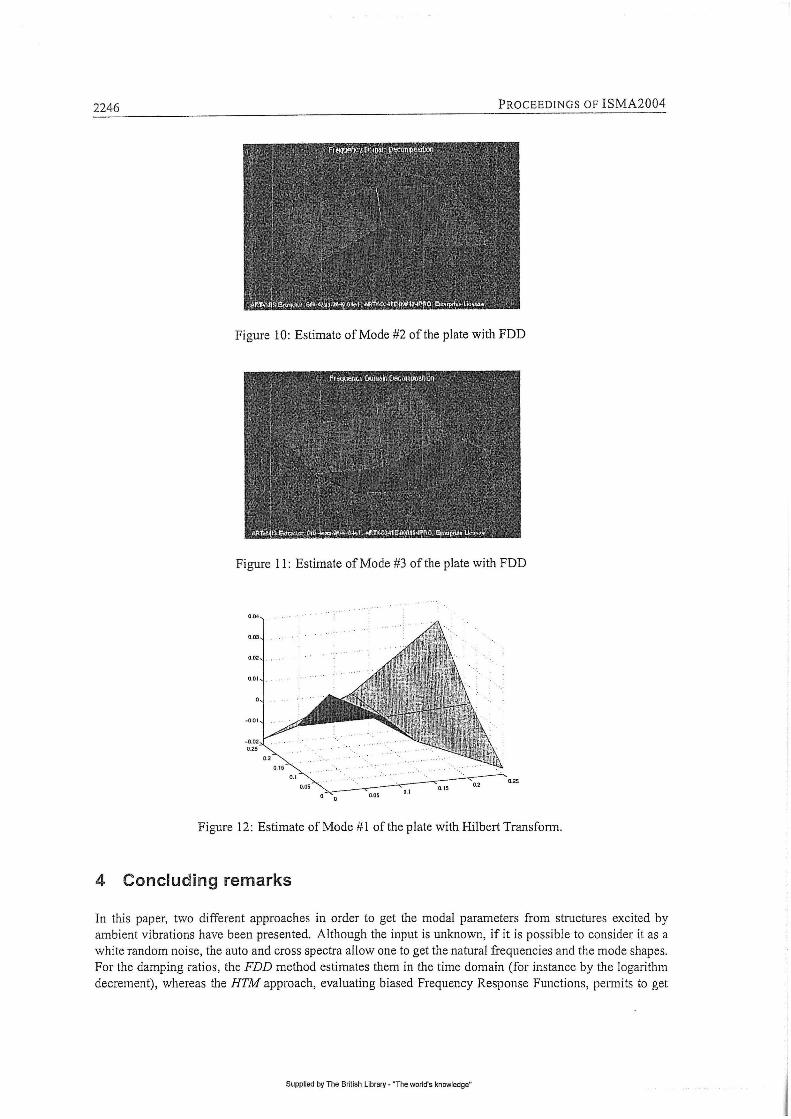
Although with much more scattering, with respect to the values gained for the cantilever beam, from a practical point of view, the estimates are acceptable. Finally, the first three mode shapes of the plate are shown from Figs . 9 to 14. The first three figmes are relative to the FDD method, on the contrary the last three ones have been obtained by the HTM approach.
It is worth noting that a good correlation has been achieved for the presented modes, except for the second one. Probably the con·e!ation between the two approaches, especially for the damping ratio and amplitude estimates, could be enhanced if a longer time sequence were recorded. That allows one to perform a higher number of averages, which reduces the standard deviation of the noise, without losing in frequency definition.
Supplied by The British Library- 'The world's knowledge"
2246 PROCEEDINGS OF ISMA2004
Figure 10: Estimate of Mode #2 of the plate with FDD
Figure 11: Estimate ofMode #3 ofthe plate with FDD
0.25
Figure 12: Estimate of Mode #1 of the plate with Hilbert Transform.
4 Concluding remarks
In this paper, two different approaches in order to get the modal parameters from structures excited by ambient vibrations have been presented. Although the input is unknown, if it is possible to consider it as a white random noise, the auto and cross spectra allow one to get the natural frequencies and the mode shapes. For the damping ratios, the FDD method estimates them in the time domain (for instance by the logarithm decrement), whereas the HTM approach, evaluating biased Frequency Response Functions, pem1its to get
Supplied by The British Library· 'The world's knowledge"
j

OPERATIONAL MODAL ANALYSIS 2247
: .,
0.25
0 0
Figure 13: Estimate of Mode #2 of the plate with Hilbert Transfonn.
0.25
0.25
0 0
Figure 14: Estimate of Mode #3 of the plate with Hilbert Transform.
all the modal parameters in the frequency domain. The comparison between the two approaches has shown a generally good agreement among the results for both a cantilever beam and a free-free plate, excited by acoustic random signals. Therefore, although the FDD technique has been already used and commercialized in the ARTeMIS code, even the HTlvf could represent a valid tool for these purposes.
Acknowledgements
This work has been supported by the University of Rome "La Sapienza" by the grant: Facolta 2002 -"Jmpiego di materiali piezoelettrici nella progettazione integrata di velivoli non pilotati" and by the grant Facolta 2003- "Stima dei Parametri Modali dalle sole Risposte Dinamiche di Sistemi Aerospaziali ".
References
[1] P. L. McHargue, M. H. Richardson, Operating Deflection Shapes from Time versus Frequency Domain Measurements, XI IMAC, Kissirnmee, FL, (USA), (1993).
Supplied by The British Library- "The world"s knowledge··

2248 PROCEEDINGS OF ISMA2004
[2] M. H. Richardson, Is It a Mode Shape an Operating Deflection Shape?, Sound and Vobration Magazine, (1997).
[3] B. J. Schwarz, M. H. Richardson, Introduction to Operating Deflection Shapes, CSI Reliability Week, Orlando, FL, (USA), ( 1999).
[4] B . Cauberghe, P. Guillaume, P. Verboven, and E. Parloo, Modal Parameter Estimation from Output-Only Measurements in Presence of Transient Phenomena, Proc. ofiSMA2002, Sept., 16-18, Leuven, (2002), pp. 1265-1271.
[5] G. De Vries, Sondage des Systemes Vibrantes par Masses Additionelles, La Recherche Aeronatique, No. 30, Paris, (1952), pp. 47-49.
[6] J. Deweer, B. Dierckx, Obtaining Scaled Modal Model of Panel Type Structures Using Acoustic Excitation, XVII IMAC, (1999), pp. 2042-2048.
[7] R. Brincker, L. Zhang, P. Andersen, Modal Identification from Ambient Responses Using Frequency Domain Decomposition, XVIII IMAC, S. Antonio, TX, (USA), (2000).
[8] R. Brincker, C. E. Ventura, P. Andersen, Damping Estimation by Frequency Domain Decomposition, XIX IMAC, Kissimee, FL, (USA), (2001).
[9] G. Coppotelli, Identification of Frequency Response Functions by "Output-Only" Experimental Data, in Proceedings of XVII Associazione Italiana di Aeronautica e Astronautica, Rome, ITALY, (2003).
[ 1 0] Structural Vibration Solutions, Getting Started Manual for all Versions of ARTeMIS Exstractor, NOVI Science Park, Aalborg, DK, (2003).
[I 1] D. J. Ewins, Modal Testing: Themy and Practice, Research Studies Press Ltd, England (1984).
[12] J. He, Z.F. Fu, Modal Analysis, Butterworth-Heinemann, Great Britain (2001).
[13] A. Agneni, L. Balis Crema, G. Coppotelli, Time and Frequency Domain Model Parameter Estimation by Output Only Functions, in Proceedings of International Forum on Aeroelasticity and Structural Dynamics, Amsterdam, NL, 2003.
[I4] R. Brincker, J. B. Frandsen, P. Andersen, Ambient Response Analysis of the Great Belt Bridge, XVIII IMAC, S. Antonio, TX, USA, (2000).
[I5] J. Bendat, A. G. Piersol, Random Data, Analysis and Measurement Procedures, J. Wiley and Sons, (1986).
[16] A. V. Oppenheim, R.W. Schafer, Elaborazione Numerica dei Segnali, F. Angeli Ed., ITALY, (1981), pp. 371-385.
[17] E.A. Robinson, M.T. Silva, Digital Signal Processing and Time Series Analysis, Holden Day, (I 978), pp. 283-290.
Supplied by The British Library- "The world's knowledge"'