Embed Size (px)
Citation preview

Aalborg Universitet
Comparing the Reliability of Regular Topologies on a Backbone Network. A CaseStudyCecilio, Sergio Labeage; Lopez, Jose Manuel Guterrez Lopez; Riaz, Tahir; Pedersen, JensMyrupPublished in:Image Processing & Communications
Publication date:2009
Document VersionEarly version, also known as pre-print
Link to publication from Aalborg University
Citation for published version (APA):Cecilio, S. L., Gutierrez Lopez, J. M., Riaz, M. T., & Pedersen, J. M. (2009). Comparing the Reliability of RegularTopologies on a Backbone Network. A Case Study.
General rightsCopyright and moral rights for the publications made accessible in the public portal are retained by the authors and/or other copyright ownersand it is a condition of accessing publications that users recognise and abide by the legal requirements associated with these rights.
? Users may download and print one copy of any publication from the public portal for the purpose of private study or research. ? You may not further distribute the material or use it for any profit-making activity or commercial gain ? You may freely distribute the URL identifying the publication in the public portal ?
Take down policyIf you believe that this document breaches copyright please contact us at [email protected] providing details, and we will remove access tothe work immediately and investigate your claim.
Downloaded from vbn.aau.dk on: juli 05, 2018

Image Processing & Communication, vol. 13,no. 1-2, pp. 1-1 1
Comparing the Reliability of Regular Topologies on a Backbone Network. A Case Study.
SERGIO LABEAGA, JOSE GUTIERREZ, TAHIR RIAZ ,JENS PEDERSEN
Networking and Security Section, Department of Electronic Systems, Aalborg University,Niels Jernes Vej 12, 9220, Aalborg, Denmarkmailto: [email protected]
Abstract The aim of this paper is to compare thereliability of regular topologies on a backbone net-work. The study is focused on a large-scale fiber-optic network. Different regular topological solu-tions as single ring, double ring or 4-Regular grid areapplied to the case study, and compared in terms ofdegree, diameter, average distance, economical costand availability. Furthermore, other non-quantitativeparameters such as expandability, embeddability andalgorithmic support are introduced.
Key words regular topologies, backbone, grid,N2R, double ring, comparison, availability study.
1 Introduction
The use of regular topologies in backbone networkshas been studied in detail in the past with satisfactoryresults [1]. Furthermore, year after year, users andcompanies demand more and more bandwidth, lowerdelay and higher network availability [2] [3].
Communication networks play an important rolein many social and economic activities. Interruptionsin data transmission and exchange, even for a shortperiod of time, can suspend critical operations andlead to a significant loss of revenue. Furthermore,new emerging services as telemedicine and e-healthcare will increase even more, the necessity of design-ing more and more reliable networks [4].
Even though protocols are being developed to en-sure reliability [5], the physical network structures
limit the level of reliability that can be offered: twonodes can only communicate if there is a physicallink between them.
Traditionally, rings have been used as alternativesto tree structures. Rings offer connectivity in caseof any single failure. However, given the expecteddemands of availability, this is likely to become in-sufficient in near future. More information about re-dundancy in ring topologies can be found in [6] and[7].
This document studies the applicability of differ-ent regular topologies as backbone for a regionalnetwork. The access technology -in this regionalnetwork- was a combination of FTTH and WiMAXtechnologies.
Both qualitative and quantitative parameters areused in the comparison, e.g. connectivity number,economical cost, availability, support to topologicalrouting, etc. The main goal is to evaluate how theseregular topologies perform as solutions for back-bones, and compare them to single ring solutions,paying special attention to two key parameters: theeconomical cost and the availability that they canprovide.
The three main reasons for analyzing regulartopologies are:
1. It is possible to define and document well-known parameters and metrics which ease thenetwork characterization. Besides, based onwell-known metrics, it is easy to compare dif-

Image Processing & Communication, vol. 13,no. 1-2, pp. 1-1 2
ferent topology designs in a proper way.
2. Topological routing. Based on regular topolo-gies it is possible to define topological routingtechniques which allow faster communication,faster restoration, and the reduction of routingoverhead within the network. [9]
3. Expandability and upgradability. It is easier toadd links to improve the network performanceor to add nodes in order to expand it (in an or-ganized way). [10]
The organization of the paper is as follows: Sec-tion 2 introduces the different topologies. Section 3presents the case study and briefly explains the cur-rent situation of the IT infrastructure in Denmark.Then, in section 4 the methodology is described.Section 5 shows the results of the study. Finally, sec-tions 6 and 7 contain the conclusion and future worklines respectively.
2 Introduction to regular topologies
• Single Ring. A single ring network, is a topol-ogy in which each node connects to exactly twoother nodes, forming a circular pathway for sig-nals: a ring (Fig. 1).
• Double Ring. It consists of dividing the nodesof the network in 2 groups, and connecting themusing a ring for each group. Then, each nodeof the outer ring must be linked with its peer ofthe inner one. Double rings are simple 3-regulartopologies, which offer easy routing, restorationand protections schemes, but suffer from largedistances [11]. (Fig. 2)
• N2R. The N2R topology (Fig. 3) is a type ofgeneralized Double Ring (DR) topology. It con-sists of two rings, denoted inner ring and outerring. Hence, the number of nodes in the N2Rstructure is any positive even integer larger orequal to 6. These rings each contain the samenumber of nodes (p). The inner ring links donot interconnect physically to neighbor nodes.
Fig. 1. Single Ring Topology
Fig. 2. Double Ring Topology

Image Processing & Communication, vol. 13,no. 1-2, pp. 1-1 3
Fig. 3. N2R Topology
The links in the outer ring, and the links inter-connecting the two rings, can be described inthe same way as the DR structure, but links inthe inner ring are interconnecting node Ii andnode I(i+p)modq, where q is a positive integer.To avoid forming two separated networks in theinner ring, q must fulfil gcd(p,q)=1 (GreatestCommon Divisor), also q is evaluated from 1to p/2 [8].
• Grid. A 4-regular Grid topology (Fig. 4) con-sists of linking the nodes in such a way that thefinal result is a grid. Final structure S must bemodeled with node set N and line set L. Letdimx and dimy be prohibitive integers. Everynode in N is associated with a pair of coordi-nates (x,y) such that 0 ≤ dimx and 0 ≤ dimy,and every coordinate pair is associated to anode. Furthermore, no two nodes are associatedto the same pair of coordinates. Consequently,there are exactly (dimx+1)(dimy+1)nodes in S.If a node u is associated to a coordinate pair,(xu, yu) we write u=(xu, yu) to ease the nota-tion [12].
Fig. 4. 4-Regular Grid Topology
3 Case Study
Northern Jutland is the northern region of Denmarkand it is also the less populated one. Its largest cityis Aalborg, the fourth largest one in Denmark, with apopulation of 100.731 inhabitants in 2007. (Fig. 5)
Northern Jutland covers an area of 8.020 km2,which means that its population density is about 72inhabitants per sqkm, the lowest one in the country[16].
The current situation of the IT Infrastructure inDenmark is quite similar to the average situation inother developed countries in terms of bandwidth andFTTH deployment [19] [17]. (Fig. 6) Despite thefact that Denmark is leading (in Europe) with re-spect to broadband availability and penetration (Fig.7), the main technology used in the last mile is stillxDSL [17].
Important backbone networks are already de-ployed, but there is a bottle neck in the accessnetworks of those users located far from their centraloffices (local loop) [17].
This bottleneck is due to the bandwidth limit of thetraditional copper lines (Fig. 8). The replacement ofthe old access network based on copper wires fromPOTS (Plain Old Telephone Service), to new genera-

Image Processing & Communication, vol. 13,no. 1-2, pp. 1-1 4
Fig. 5. Region of Northern Jutland, Denmark
Fig. 6. Average advertised broadbanddownload speed, [kbps], Data extracted from
OECD [17], September 2008
Fig. 7. Broadband penetration per 100inhabitants, by technology, Data extracted from
OECD [17], 2008
Fig. 8. Average advertised broadband speeds,by technology, [kbps], Data extracted from
OECD [17], 2008

Image Processing & Communication, vol. 13,no. 1-2, pp. 1-1 5
tion wired technologies (such as FTTH), that are ableto provide higher transfer rates, is becoming a realitynowdays.
New generation access technologies will provideto the society the opportunity to use a new se-ries of emergent services, such as e-health care ortelemedicine. These new services will require highnetwork availability, not only at the backbone, butalso in the distribution and access networks.
4 Methodology
The aim of this section is to study the methodologyapplied to the case study. The methodology can bedivided into three main stages:
1. The location of the nodes.
2. The general comparison of the topologies.
3. The study of the availability.
4.1 Nodes location process
The first stage in which the nodes are located in thescenario, consists of a computer assisted process thatrequires several iterations, due to the high number ofparameters to optimize (e.g. economical cost, usersdistribution, network balance, etc.).
This process is divided onto three sequencialsteps:
1. Step 1: Locating the nodes in the most denselyareas. The first step consisted of placing thenodes in the most densely populated areas ofthe map. If we assume that every user will beconnected using a wired technology to a node,by placing the nodes in the regions with moreusers density, we minimize the digging in thedistribution and access networks. This diggingreduction implies both lower economical cost,and faster network deployment. MAP Info Soft-ware [18] and Geographic Information System(GIS) Data, with the position of all the NetworkTerminals (NT) of the region, has been used to
carry out this phase. MAP Info provides re-sources to easily create density maps from anyGIS Data. Afterwards, different kinds of filtershave been applied in order to point out those”hot cells”, or areas with highest NT density,potential candidates to allocate a node.
2. Step 2: Adapting the nodes to the WiMAX dis-tribution network. In this second step, the loca-tion of the backbone nodes suffers from minorvariations in order to merge its location withthose WiMAX base stations that are in a rela-tively short distance from them. This way, al-location expenses are reduced, and if the needarises, the backbone can be exploited not onlyby wired, but also by wireless access users.
3. Step 3: Final adjustments and backbone adap-tion. Other minor adjustements were performedin order to achieve new goals as traffic distribu-tion. The goal was to modify the located nodesin such a way that they covered a similar num-ber of NTs. See Eq. 1:
NTsperNode =TotalN.ofNTs
Numberofnodes(1)
Further information about the methodology can befound in [19].
4.2 General Comparison
The second stage consists of comparing regulartopologies as backbone for the case study. Eachtopological model is adapted to the number of nodesdefined in stage 1 (16 nodes for this studied sce-nario). Then, the following parameters are used forthe comparison:
I. Diameter. The maximum distance (number ofhops) between any pair of nodes in the network. Thisparameter is important, because it has direct influ-ence on the maximum delay.
II. Average distance. The average number ofhops between any pair of nodes. This parameter isimportant, because it has direct influence on the av-erage delay. The average distance for the secondary

Image Processing & Communication, vol. 13,no. 1-2, pp. 1-1 6
independent path has also been calculated. (In net-work planning, secondary independent path appliesto the possibility of a node A, to send data to a nodeB, by using an alternative path, physically indepen-dent from the primary path. In other words, if a fail-ure occurs, there exists a spare route, so the flux ofdata can be re-routed and the communication is notlost.)
III. Connectivity number (Degree). The numberof neighbors of each node. This parameter is impor-tant, because it has direct influence on the reliabil-ity of the network. If e.g. a node has degree 2, itmeans that it is connected to two other nodes in thenetwork. Thus, two simultaneous fails (one in eachlink) should occur in order to become isolated fromthe network. If the node had degree 3, three simulta-neous fails should occur, and so on.
IV. Economical cost. An estimation of the over-all fiber deployment cost. This estimation has beenrealized using GIS Data and Map Info software.Distances between nodes have been calculated us-ing (Geographic Information System) GIS data, andmultiplied by the approximate cost of deploying 1meter of fiber [19].
Moreover, some extra qualitative parameters de-fined in the SQoS evaluation framework, and pre-sented in 2004 at the Information Technology andTelecommunication Conference [20], have been dis-cussed. Due to their non-quantitative nature, theyhave not been directly included in the numericalcomparison:
V. Algorithmic support. For example, topologi-cal routing support.
VI. Embeddability. This parameter is impor-tant when implementing graph structures in the realworld. Some structures are easier to embed than oth-ers; this depends highly on physical conditions. Pla-nar structures are relatively easier to embed. Fig. 4shows an example of embeddability: the N2R topol-ogy embedded in the considered scenario.
VII. Expandability. The graph structures havedifferent properties with respect to support SQoSparameters. An expansion of these structures candegrade these properties if not expanded correctly.Some structures, especially planar ones, are easier to
expand than the non-planar ones.
4.3 Availability Estimation
The third stage consists of studying the availabilityof each of the considered solutions.
Availability is the probability that a system isavailable for use at a given time, or in other words,the ratio of the total time a functional unit is capableof being used during a given interval to the length ofthis interval. [21]
Before focusing on how to calculate it, some pa-rameters should be introduced:
• MTBF. Mean Time Between Failures (MTBF)-also known as Mean Time To Fail (MTTF)- isthe average time between failures of hardwaremodules. It is the average time a manufacturerestimates before a failure occurs in a hardwaremodule.
• MTTR. Mean Time To Repair (MTTR), is thetime taken to repair a failed hardware mod-ule. In an operational system, repair generallymeans replacing the hardware module. In ouroptical fiber network context, MTTR could beviewed as the mean time to replace the segmentof fiber that has been damaged.
Network availability can be calculated in severalways. In this study we have chosen two differentapproaches as availability indicators:
• Approach 1: It considers the whole network asa unique system. We have calculated the avail-ability as the possibility of loosing the connec-tivity between any pair of nodes within the net-work. In other words, if between any pair ofnodes the communication is lost, the whole sys-tem is considered as unavailable.
• Approach 2: It calculates the availability from anode perspective. We have calculated the prob-ability of a node to be totally isolated from therest of the backbone. This means that we cal-culate, for every node, which is the possibilityof a simultaneous fail in each of the links that

Image Processing & Communication, vol. 13,no. 1-2, pp. 1-1 7
Fig. 9. Availability in Series
connects it to its neighbours. This situation willbe less common than the handled in the first ap-proach, but also more critical, because the af-fected node will be unable to communicate notwith some, but with any of the other nodes ofthe network.
Network Availability is calculated by modelingthe system as an interconnection of parts in seriesand parallel [21]. The following rules are used todecide if components should be placed in series orparallel:
• If failure of a part leads to the combination be-coming inoperationable, the two parts are con-sidered to be operating in series.
• If failure of a part leads to the other part takingover the operations of the failed part, the twoparts are considered to be operating in parallel.
4.4 Availability in series
As stated above, two parts X and Y are considered tobe operating in series, if failure of either of the partsresults in failure of the combination. The combinedsystem is operational only if both Part X and Part Yare available. From this it follows that the combinedavailability is a product of the availability of the twoparts. The combined availability is shown by the Eq.2:
A = Ax ×Ay (2)
4.5 Availability in parallel
As stated above, two parts are considered to be op-erating in parallel if the combination is consideredfailed when both parts fail. The combined system isoperational, if either is available. From this it fol-lows that the combined availability is 1 - (both parts
Fig. 10. Availability in Parallel
are unavailable). The combined availability is shownby the Eq. 3:
A = 1− [(1−Ax)(1−Ay)] (3)
4.6 Calculating the availability of individ-ual components
MTBF (Mean Time Between Failure) and MTTR(Mean Time To Repair) values are estimated for eachcomponent. Once MTBF and MTTR are known, theavailability of the component can be calculated usingthe following formula (Eq. 4):
A =MTBF
MTBF + MTTR(4)
4.7 Assumptions and data
Due to ubiquitious deployment, optical networksare prone to failures. While a considerable efforthas been devoted to improve the physical protec-tion of underground and underwater cables, fiber cutsoccur at a significant rate. According to the USFederal Communications Commission (FCC), metronetworks annually experience 13 cuts for every 1000miles of fiber (0.81 cuts per 100 km per year), whilelong haul networks experience 3 cuts for every 1000miles of fiber (0,19 cuts per 100km per year). [22]
In this study 0,8 errors per year per 100km of ditchhas been considered as appropiate rate for the worstcase calculations, while 0,5 errors per 100km peryear has been considered as rate for the average cal-culations.
Repairing a cable typically takes up to 14 hours,but it may take as long as 100 hours in extreme cases.[22]

Image Processing & Communication, vol. 13,no. 1-2, pp. 1-1 8
The following list contains the input parametersused for the availability estimation:
• MTBF1 = 0,5 errors/year per 100km of ditchin average cases.
• MTBF2 = 0,8 error/year per 100km of ditch inthe worst case.
• MTTR1 = 12 hours to fix a failure in averagecases.
• MTTR2 = 100 hours to fix a failure in worstcases.
• Fails in the nodes have not been considered.The probability of having fails in the nodeshardware compared to the probability of havingfails in the fibers has been studied before andcan be considered negligible. [23] [24].
• In the case of Grid topologies, corner nodes arethe worst case for the availability study, becausethey are connected to the rest of the network us-ing only 2 independent paths.
4.8 Availability Algorithm for Approach 1
Focusing on our first approach, the next procedurehas been followed in order to calculate the averageavailability of the network:
1. Estimating the average MTBF1st. MTBF1st
denotes the average MTBF for the first inde-pendent path (primary path). This estimation iscalculated by multiplying the average numberof hops (of the primary path) by the average linkdistance by the MTBF1 parameter (Eq. 5):
MTBF1st = hops× dist.×MTBF1 (5)
2. Estimating the average MTBF2nd. MTBF2nd
denotes the average MTBF for the second in-dependent path (secondary path). This estima-tion is calculated by multiplying the averagenumber of hops (of the seconddary path) by the
average link distance by the MTBF1 parame-ter (Eq. 6):
MTBF2nd = hops× dist.×MTBF1 (6)
3. Using MTTR1 as MTTR value.
4. Using MTBF1st and MTBF2nd, as MTBF forthe first and second path, respectively.
5. Applying the calculated parameters into theequation 4, in order to obtain the availability forboth primary, and secondary path.
6. Calculating the final availability as the parallelof the first and the second independent path.
The availability of the network considering theworst case situation is calculated as follows:
1. Estimating the average MTBFd1. MTBFd1
denotes the average MTBF for the longest firstindependent path (worst case), that correspondsto the diameter. This estimation is calculated bymultiplying the diameter (of the primary path)by the longest link distance by the MTBF2 pa-rameter (Eq. 7):
MTBFd1 = diam.×Mdist.×MTBF2 (7)
2. Estimating the average MTBFd2. MTBFd2
denotes the average MTBF for the longest sec-ond independent path, that corresponds to thediameter of the second independent path. Thisestimation is calculated by multiplying the di-ameter (of the secondary path) by the longestlink distance by the MTBF2 parameter (Eq. 8):
MTBFd2 = diam.×Mdist.×MTBF2 (8)
3. Using MTTR2 as MTTR value.
4. Using MTBFd1 and MTBFd2, as MTBF forthe first and second path, respectively.
5. Applying the calculated parameters into theequation 4, in order to obtain the availability forboth primary, and secondary path.
6. Calculating the final availability as the parallelof the first and the second independent path.

Image Processing & Communication, vol. 13,no. 1-2, pp. 1-1 9
4.9 Availability Algorithm for Approach 2
Focusing on our second approach, the next procedurehas been followed in order to calculate the averageavailability of every topological solution:
1. Estimating the MTBF for each link. This esti-mation is calculated by multiplying the link dis-tance by the MTBF1 parameter.
2. Using MTTR1 as MTTR value.
3. Calculating the availability of every node. Theavailability of every node will be calculated asthe availability of all its links in parallel.
4. Calculating the average (Eq. 9):
A =ΣAi
N(9)
where Ai is the availability in the node i, and Nis the total number of nodes.
The availability of the node placed in the most crit-ical situation has been calculated as follows:
1. Estimating the MTBF for each link. This esti-mation is calculated by multiplying the link dis-tance by the MTBF2 parameter.
2. Using MTTR2 as MTTR value.
3. Calculating the availability of every node. Theavailability of every node will be calculated asthe availability of all its links in parallalel.
4. The final output result will correspond to thenode with minor availability result ”worstcase”.
5 Results
Fig.11 summarizes the results obtained after apply-ing the selected topologies to the case study scenario.The first column shows the degree of each topology.In the single ring, double ring and N2R cases it issimple to obtain the degree, because they are com-pletely regular topologies. However, in the case of 4
Fig. 11. General Topological Comparison
regular Grid, it is not so trivial because the topologyis not completely regular. Internal nodes have degree4 (valued showed by the table), whereas the nodes inthe sides have degree 3, and the ones at the cornersonly degree 2. In our case study, with 16 nodes, theaverage degree is 3.
As it was commented in Sec. 4, the degree has adirect influence on the network reliability, because itlimits the number of independent physical paths.
Regarding the diameter, single ring shows theworst results due to its structure: To reach an op-posite node in a single ring, it is necessary to coverhalf of it. The most valuable topology in this area isN2R. A diameter of 4 for the first independent path,and 5 for the second, shows to be the most advancedsolution. Notice that despite Grid has in the innernodes degree 4, the average topological degree inour case study is 3, so diameter results are not bet-ter than in other degree 3 solutions. Even the doublering presents better results in this aspect. A possiblesolution to improve the results of the Grid, is to up-grade it to a ”Torus” network. This has been studiedin [19].
The average distance is the parameter that empha-sizes the difference between the topologies the most.Thus, we see that the simplest topology has verylow results compared to the rest. 11,73 is the aver-age distance for the secondary path using single ring,while the worst secondary path average distance re-sult among the rest of topologies, corresponds toN2R and is only 3,9. N2R is the most favorabletopology taking the first independent path into ac-

Image Processing & Communication, vol. 13,no. 1-2, pp. 1-1 10
count. However, if we also consider the second one,Grid is the referable solution.
The economic cost is favorable to the single ring.As reflected in the last column of Fig. 11, the eco-nomic cost is similar in all the advance topologies.
Regarding the non-quantitative parameters, 4 reg-ular grid is the most interesting topology becauseof its well-known properties to support topologicalrouting and expandability.
All the studied topologies are based on planarstructures. In general, if we compare planar vs. non-planar topologies (e.g. Torus), the embeddability ofthe first group is higuer. Focusing on the studiedtopologies, Single Ring presents the most favorableembeddability properties, while Grid shows up asthe worst case. This is due to the difficulty to findenough physical independent paths -typically roads-to construct a Grid topology on the real world.
Fig. 12, 13, 14, 15 and 16 contain the results fromthe availability study. Both the average and the worstcase results are shown in every topology. Notice thatthey have been highlithed in the last row of each ta-ble.
In the first approach (Fig. 12) only the first twoindependent pahts have been taking into account dueto the level of complexity that implies calculating thenecessary parameters (average number of hops anddiameter) for the 3th (and 4th in the Grid topology)independent paths. Therefore, the availability differ-ences between the degree 2 topologies (Single Ring)and the degree 3 topologies (Double Ring and N2R)are not significant.
According to the results from the second ap-proach, single Ring performs good on average withresults over five 9’s, but not good enough in worstcase conditions, where it shows much worse resultsthan the rest of the compared topologies (only two9’s).
With similar results, Double Ring and N2Rtopologies arise as the most robust solutions. Bothaverage results and worst case results, accomplishthe five 9’s high availability criteria.
Finally, 4-Regular Grid topology achieves up toseven 9’s on average, and four 9’s for the worst case.
Next, Figure 17 summarizes -according the
Fig. 17. Downtime during a year
second approach- the availability parameter as thedowntime in a year scale:
6 Conclusion
This paper has emphasized the importance of high-available backbones for new Internet applicationsand services.
A comparison framework has been shown. Be-sides, high reliable regular topologies have beencompared to traditional solutions as single ring. Fi-nally, the results of the study have been analyzedachieving the following conclusions:
1. Single ring topology is a really economical so-lution, but it is also the most limited one inall the studied features. Its large diameter, itslower average distance, and mainly its low de-gree (that limits the availability), may force it tobe non-recommendable for next generation net-works. Furthermore, we cannot guarantee highavailability (≥ 0,99999) for all the nodes condi-tions.
2. Focusing on degree 3 topologies, it has beenproved that N2R obtains better results (in termsof average distances and diameter), than stan-dard double ring. Regarding the availability,both have obtained results over five 9s.
3. 4-Regular Grid presents a similar cost thanN2R. Its diameter is longer than in N2R, but onthe other hand, the average distance for the sec-ond independent path is shorter. Also the scal-ability -it is easy to change the 4-Regular meshinto a triangular one, or to expand it as showedin [9]- and the possibility of using topological
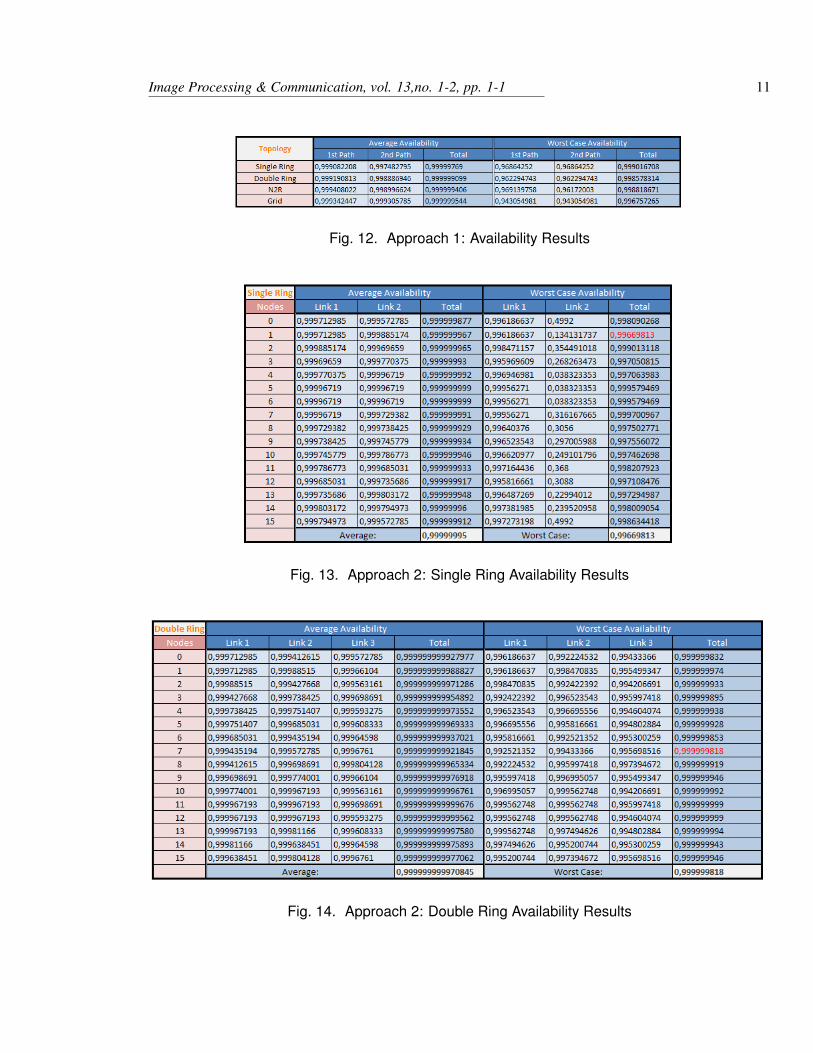
Image Processing & Communication, vol. 13,no. 1-2, pp. 1-1 11
Fig. 12. Approach 1: Availability Results
Fig. 13. Approach 2: Single Ring Availability Results
Fig. 14. Approach 2: Double Ring Availability Results

Image Processing & Communication, vol. 13,no. 1-2, pp. 1-1 12
Fig. 15. Approach 3: N2R Availability Results
Fig. 16. Approach 4: 4-Regular Grid Availability Results

Image Processing & Communication, vol. 13,no. 1-2, pp. 1-1 13
routing is valued but also difficult to quantify.Availability is high on average terms, but not asgood as degree 3 topologies in worst cases, dueto the critical situation of the corner nodes.
7 Future Work
Creating an objective evaluation framework, inwhich each parameter had a scale to be evaluated(including the non-quantitative ones). The solutionwith higher average ranking would be selected.Networks could be classified so that a frameworkcould be constructed, based on a combination oftechnical and business-model parameters.
Improving the approach 1 in the availability study:Including the third independent path (or even 4thwhere correspond) in the calculations, in order toemphasize the difference between topologies of dif-ferent degree.
Extending the availability study (approach 2) tothe nodes including the availability of them: Despitethe erors in the hardware are not common, powersupply fails, and other external factors could be con-sidered. Thus, networks managers could decide if itis more efficient to invest in node redundancy, or increating new independent paths in order to improveat a certain level the availability of their networks.
References
[1] Pedersen JM, Patel A, Knudsen TP, Mad-sen OB (2006)Applying 4-regularGrid struc-tures in large-scale access networks. ComputerCommunications 29: 1359–1362
[2] MITS Minessota Internet Traffic Studies(2008) Minessota University, USA
[3] Madsen OB, Nielsen JD, Schioler H (2002)Convergence. In: First International Workshopon Real-Time LANs in the Internet Age. Vi-enna, Austria.
[4] Booker G, Sprintson A, Singh C, GuikemaS (2008) Efficient Availability evaluation for
Transport Backbone Networks. InternationalConference on Optical Network Design andModeling, ONDM 2008.
[5] Shen KY, Gu JC, Chen TH (2007) A novel pro-tection scheme for ring type distribution sys-tems. In: International Journal of Power andEnergy Systems. Vol. 27: 247–255
[6] Lin N, Jr CB (1990) A reliability comparisonof single and double rings. In: Ninth AnnualJoint Conference of the IEEE Computer andCommunication Societies: 504–511
[7] Dabipi IK (1989) Utilizing redundant ring inthe double ring network. In: Energy and In-formation Technologies in the Southeast: 906–910
[8] Jogersen T, Pedersen L, Pedersen JM (2005)Reliability in single, double and N2R ring net-work structures. In: The International Confer-ence on Communications in Computing. LasVegas, USA.
[9] Pedersen JM, Knudsen TP, Madsen OB (2004)Topological routing in large-scale networks.In: The Sixth International Conference on Ad-vance Communication Techonology. Korea.
[10] Gutierrez J, Imine M, Cuevas R, PedesersenJM, Madsen OB (2008) Multi-level networkcharacterization using regular topologies. In:Elsvier Journal, Computer Networks: Vol. 52,pp. 2344
[11] Pedersen JM, Riaz TM, Madsen OB (2005)Distances in Generalized Double Ringsand Degree Three Chordal Rings. Proc. ofIASTED PDCN 2005. The IASTED Interna-tional Conference on Parallel and DistrubutedComputing and Networks. Innsbruck, Austria.
[12] Riaz TM (2008) SQoS Based Planning forNetwork Infrastructures. PhD Thesis. Aalborg,Denmark.

Image Processing & Communication, vol. 13,no. 1-2, pp. 1-1 14
[13] Khan MN, Ghauri S (2008) The WiMAX802.16e physical layer model. In: InternationalConference on Wireless, Mobile and Multi-meda Networks: 117–120.
[14] Hal Varian University of California and Mor-gan Stanley Statistics (2004) University ofCalifornia, USA.
[15] Horrich S, Elayoubi SE, Jemaa SB (2008) Onthe impact of mobiility and joint RRM poli-cies on a cooperative WiMAX/HSDPA net-work. In: Wireless Communications and Net-working Conference: 2027–2032.
[16] National IT and Telecom Agency (2007) Tele-com Statistics -first half 2007 Report, Den-mark.
[17] Organization for Economic Co-operation andDevelopment (OECD) (2009) OECD Commu-nications Outlook 2009.
[18] Pitney Bowes Corporation, MapInfo Profes-sional, http://www.pbinsight.com/ , AccessedOctober 2009.
[19] Labeaga S (2008) Design of a new IT infras-tructure for the region of Nordjylland. MAThesis, Aalborg University, Denmark.
[20] Pedersen JM, Knudsen TP, Madsen OB (2004)An evaluation framework for large-scale net-work structures. Limerick, Ireland.
[21] EventHelix (2007) System Reliability andAvailability. From EventHelix.com , RetrievedOctober 2009.
[22] Grover W (2004) Mesh-Based Survivable Net-works: Options and Strategies for Optical,MPLS, SONET and ATM Networking. Pren-tice Hall PTR, Upper Saddle River, NJ, USA.
[23] To M, and Neusy P (1994) UnavailabilityAnalysis of Long-Haul Networks. IEEE Jour-nal on Selected Areas in Communications,Vol. 12, No. 1, January 1994.
[24] Gutierrez J, Cuevas R, Riaz T, Pedersen J,Madsen O, On Backbone Structure For a Fu-ture Multipurpose Network. International Con-ference on Advanced Communication Tech-nology, ICACT ’08, February 2008, PhoenixPark, South Korea.