Embed Size (px)
Citation preview
Yehuda Handelsman, MD, FACP, FNLA, MACECourtyard by Marriott, Saturday, April 7, 2018, Sherman Oaks, CA
AACE Diabetes Algorithm- Focus on:
SGLT2-inhibitors and GLP1-ra Therapies
California Chapter of the American Association of Clinical Endocrinologists
Presents:
Hot Topics in Diabetes and Endocrinology for Primary Care
Yehuda Handelsman, MD, FACP, FNLA, MACE
Medical Director & Principal investigator
Metabolic Institute of America
Chair
AACE/ACE Diabetes & lipid Scientific Committees
President
Pacific Lipids association
Program Chair & Director
“Heart in Diabetes” 7/13-15/2018, Philadelphia, PN16th WCIRDC 11/29-12/1/2018, Los Angeles, CA
Solo practice
Endocrinology, Diabetes & Metabolism
Tarzana, California
Handelsman Disclosures Research grant- Amgen, AZ, BMS, BI, Gan & Lee, Grifolis, Hamni,
Lexicon, Merck, Mylan, Novo Nordisk, Sanofi
Consultant – Aegerion, Amarin, Amgen, BMS, BI, Gilead, Janssen,
Lilly, Merck, Novo-Nordisk, Sanofi.
Speaker’s Bureau- Aegerion, Amarin, Amgen, AZ, BI-Lilly, Janssen,
Merck, Novo-Nordisk, Regeneron, Sanofi.
Dr Handelsman & his immediate family do not have ownership interest & or stocks of any Pharmaceutical or device company
Case : Jack, 63 years, male
Diagnoses:
• Diabetes mellitus Type 2 for 5 years
• Obesity BMI 31.3 kg/m²
• HTN
• Hyperlipidemia
• ASCVD- TIA (CVA?) 3 years ago; ACS 6 months ago.
Presentation to office for better lipid control
Physical exam:
• Height 176 cm
• Weight 97 kg BMI 31.3
• Waist circumference 101 cm,
• Blood pressure 145/88 mmHg
• Pulse 84 min.
• Pedal pulses palpable
• Pretibial edema bilaterally
Case : Jack, 63 years, male

The reason of the visit:
Consult to prevention of further ASCVD
Current medications:
• Metformin 1000 mg QD
• Aspirin 81 mg QD
• Prasugrel 10 mg QD
• Ramipril 5 mg QD
• Bisoprolol 5 mg QD
• Simvastatin 20 mg QD
Case : Jack, 63 years, male
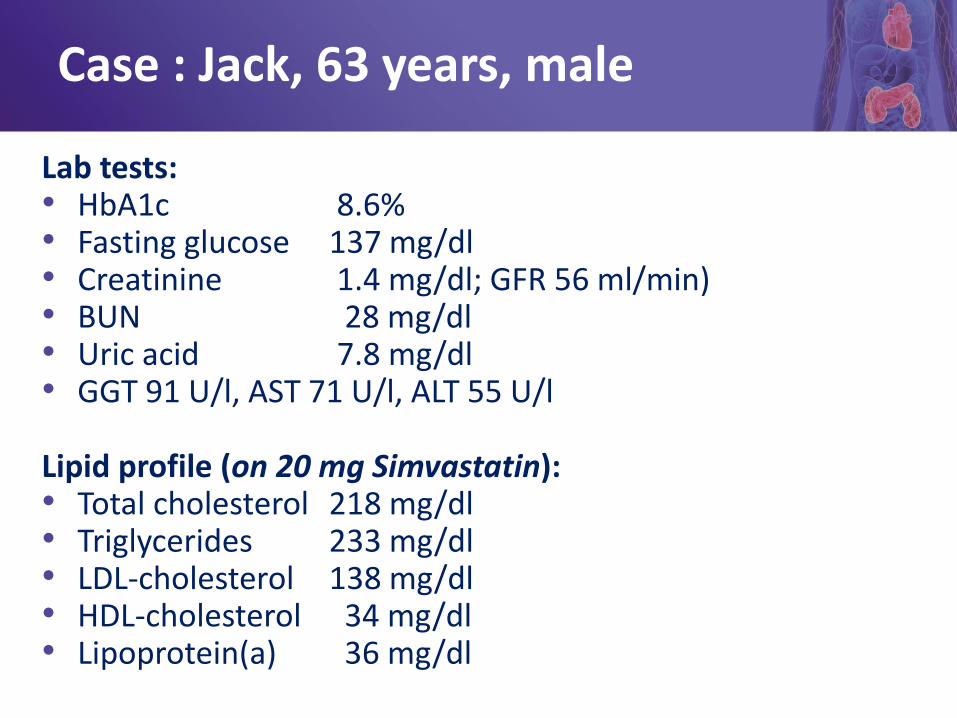
Lab tests:• HbA1c 8.6%• Fasting glucose 137 mg/dl • Creatinine 1.4 mg/dl; GFR 56 ml/min)• BUN 28 mg/dl • Uric acid 7.8 mg/dl • GGT 91 U/l, AST 71 U/l, ALT 55 U/l
Lipid profile (on 20 mg Simvastatin):• Total cholesterol 218 mg/dl • Triglycerides 233 mg/dl • LDL-cholesterol 138 mg/dl • HDL-cholesterol 34 mg/dl • Lipoprotein(a) 36 mg/dl
Case : Jack, 63 years, male
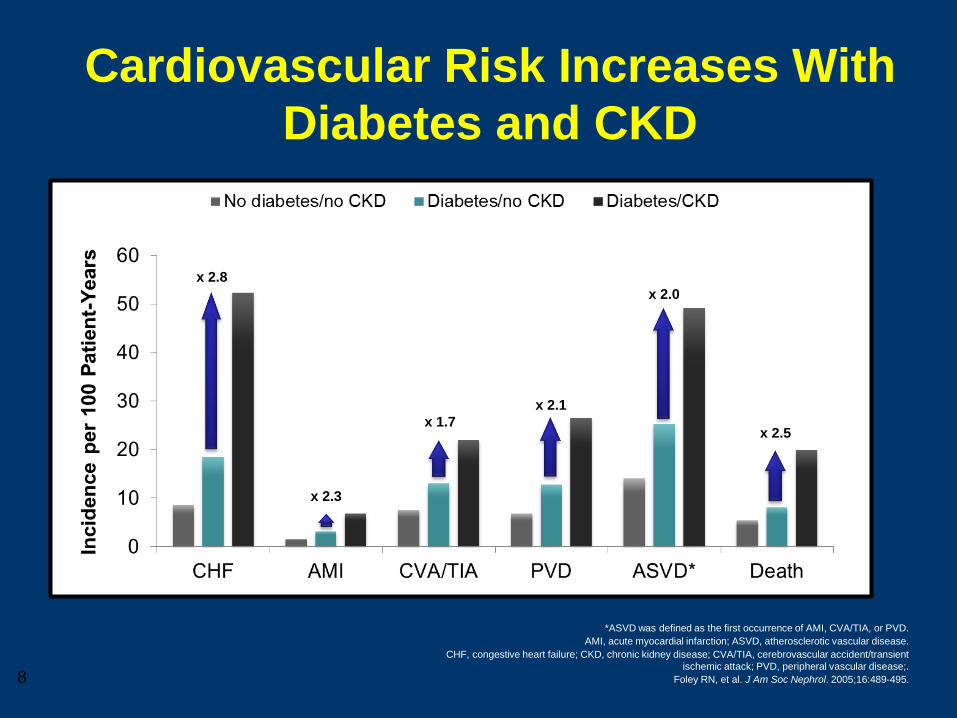
Cardiovascular Risk Increases With
Diabetes and CKD
*ASVD was defined as the first occurrence of AMI, CVA/TIA, or PVD.
AMI, acute myocardial infarction; ASVD, atherosclerotic vascular disease.
CHF, congestive heart failure; CKD, chronic kidney disease; CVA/TIA, cerebrovascular accident/transient
ischemic attack; PVD, peripheral vascular disease;.
Foley RN, et al. J Am Soc Nephrol. 2005;16:489-495.
x 2.8
x 2.3
x 1.7
x 2.1
x 2.0
x 2.5
8

Type 2 Diabetesis a
Cardiovascular Disease
Treat All Risk Factors
Handelsman Y, 1998
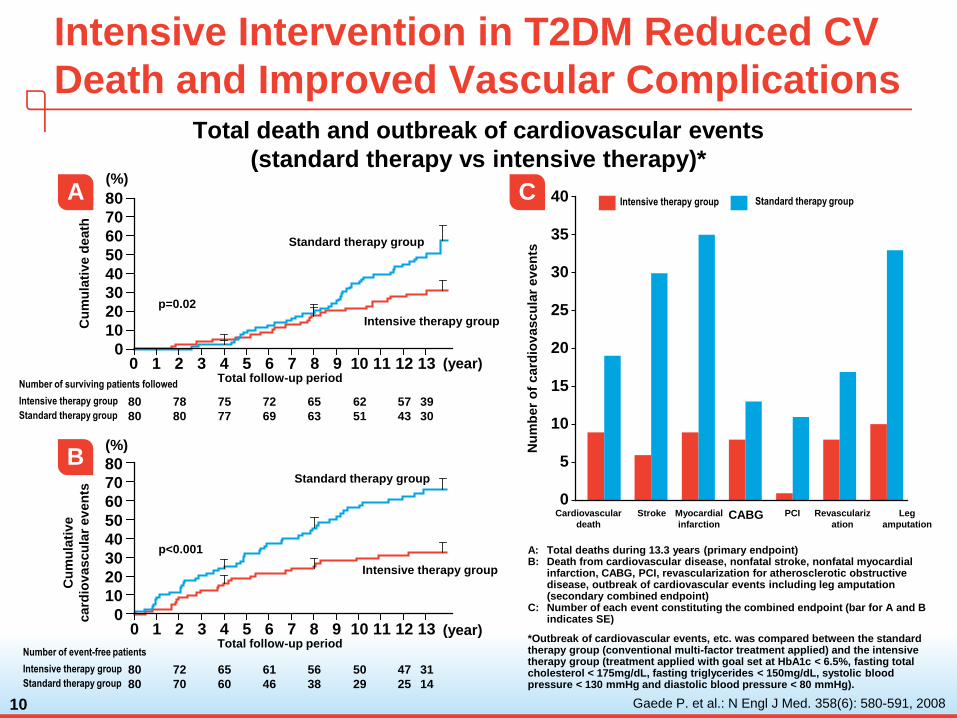
A: Total deaths during 13.3 years (primary endpoint)B: Death from cardiovascular disease, nonfatal stroke, nonfatal myocardial
infarction, CABG, PCI, revascularization for atherosclerotic obstructive disease, outbreak of cardiovascular events including leg amputation (secondary combined endpoint)
C: Number of each event constituting the combined endpoint (bar for A and B indicates SE)
*Outbreak of cardiovascular events, etc. was compared between the standard therapy group (conventional multi-factor treatment applied) and the intensive therapy group (treatment applied with goal set at HbA1c < 6.5%, fasting total cholesterol < 175mg/dL, fasting triglycerides < 150mg/dL, systolic blood pressure < 130 mmHg and diastolic blood pressure < 80 mmHg).
10
Intensive Intervention in T2DM Reduced CV
Death and Improved Vascular Complications
Gaede P. et al.: N Engl J Med. 358(6): 580-591, 2008
Intensive therapy group Standard therapy group
Nu
mb
er
of
card
iov
ascu
lar
ev
en
ts
40
35
30
25
20
15
10
5
0Cardiovascular
death
Stroke Myocardial
infarctionCABG PCI Revasculariz
ation
Leg
amputation
C
Cu
mu
lati
ve d
eath
Total follow-up period0 1 2 3 4 5 6 7 8 9 10 11 12 13
Intensive therapy group
Standard therapy group
80
70
60
50
40
30
20
10
0
p=0.02
Number of surviving patients followed
80 78 75 72 65 62 57 39
80 80 77 69 63 51 43 30
Intensive therapy group
Standard therapy group
(%)
(year)
A
Cu
mu
lati
ve
card
iov
ascu
lar
ev
en
ts
80
70
60
50
40
30
20
10
0
p<0.001
Standard therapy group
Intensive therapy group
Total follow-up period0 1 2 3 4 5 6 7 8 9 10 11 12 13
Number of event-free patients
80 72 65 61 56 50 47 31
80 70 60 46 38 29 25 14
Intensive therapy group
Standard therapy group
(%)
(year)
B
Total death and outbreak of cardiovascular events
(standard therapy vs intensive therapy)*
ENDOCRINE PRACTICE Vol 21 No. 4 April 2015
American Association of Clinical Endocrinologists andAmerican College of
Endocrinology Clinical Practice Guidelines for Developing a
Diabetes Mellitus Comprehensive Care Plan
Writing Committee Cochairpersons
Yehuda Handelsman MD, FACP, FACE, FNLA
Zachary T. Bloomgarden, MD, MACE
George Grunberger, MD, FACP, FACE
Guillermo Umpierrez, MD, FACP, FACE
Robert S. Zimmerman, MD, FACE
11
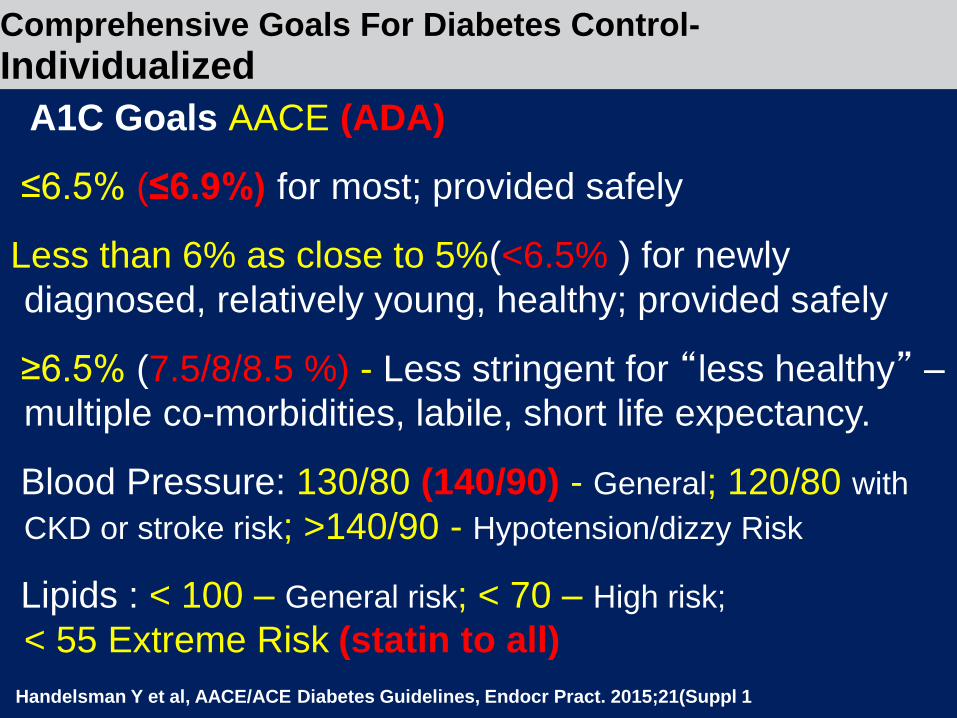
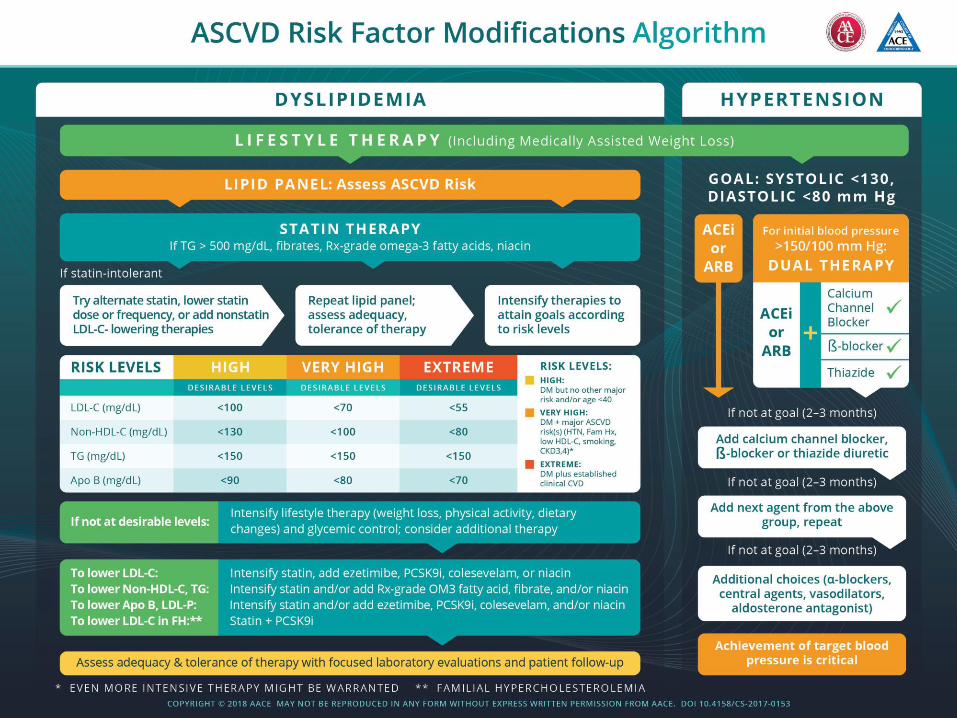
Comprehensive Goals For Diabetes Control-
Individualized
A1C Goals AACE (ADA)
≤6.5% (≤6.9%) for most; provided safely
Less than 6% as close to 5%(<6.5% ) for newly
diagnosed, relatively young, healthy; provided safely
≥6.5% (7.5/8/8.5 %) - Less stringent for “less healthy” –
multiple co-morbidities, labile, short life expectancy.
Blood Pressure: 130/80 (140/90) - General; 120/80 with
CKD or stroke risk; >140/90 - Hypotension/dizzy Risk
Lipids : < 100 – General risk; < 70 – High risk;
< 55 Extreme Risk (statin to all)
Handelsman Y et al, AACE/ACE Diabetes Guidelines, Endocr Pract. 2015;21(Suppl 1
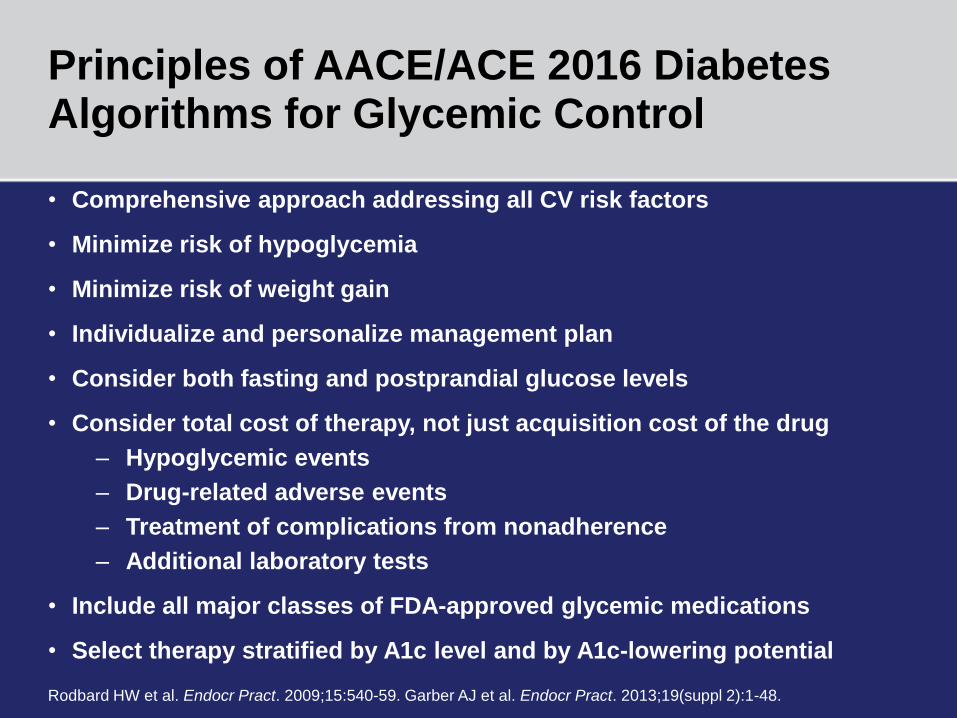
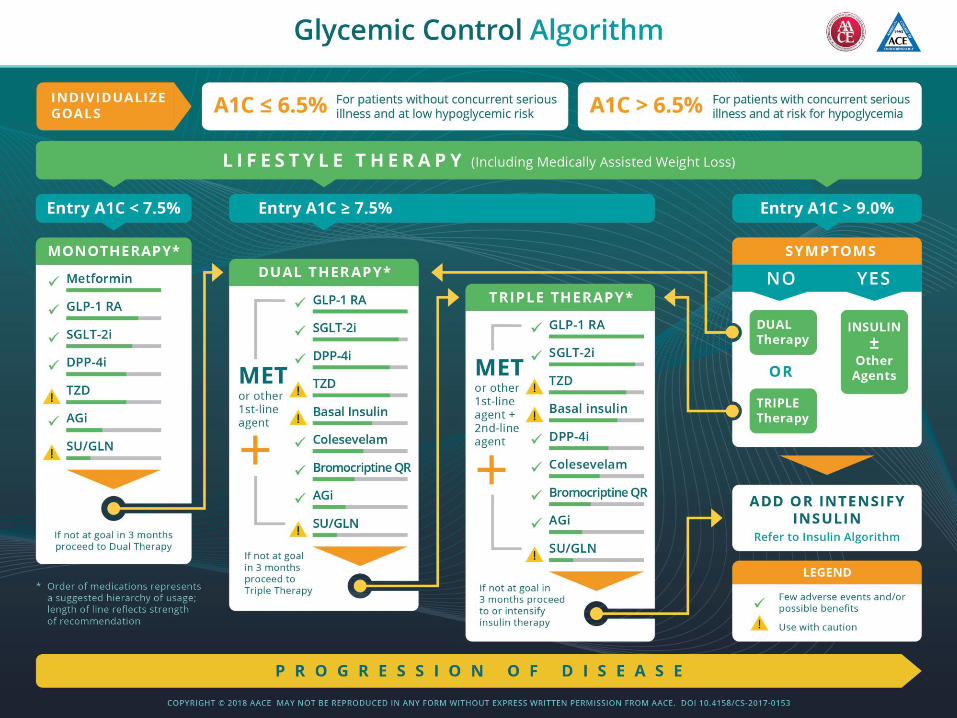
Principles of AACE/ACE 2016 Diabetes Algorithms for Glycemic Control
• Comprehensive approach addressing all CV risk factors
• Minimize risk of hypoglycemia
• Minimize risk of weight gain
• Individualize and personalize management plan
• Consider both fasting and postprandial glucose levels
• Consider total cost of therapy, not just acquisition cost of the drug
– Hypoglycemic events
– Drug-related adverse events
– Treatment of complications from nonadherence
– Additional laboratory tests
• Include all major classes of FDA-approved glycemic medications
• Select therapy stratified by A1c level and by A1c-lowering potential
Rodbard HW et al. Endocr Pract. 2009;15:540-59. Garber AJ et al. Endocr Pract. 2013;19(suppl 2):1-48.

Hyperglycemia
β α
Treatment based on pathophysiology
INSULIN
RESISTANCE
↑glucose reabsorption
↓insulin 50-
80% at
diagnosis
↑Hepatic glucose
production
Decreased incretineffect and faster carb absorption
Neurotransmitter dysfunction
Decreased glucose uptake
DeFranzo R, et al. Diabetes Care, Volume 36, Supplement 2, August 2013 S127-
138
Islet- α cell
↑ glucagon
secretion
Lipolysis increased
DPP IV inhibitors
GLP-1 agonists
Sulfonylureas
Meglitinides
Insulin GLP-1 agonists
SGLT-2
inhibitors
TZDs
InsulinInsulin
TZDs
GLP-agonists
DPP IV inhibitors
Metformin
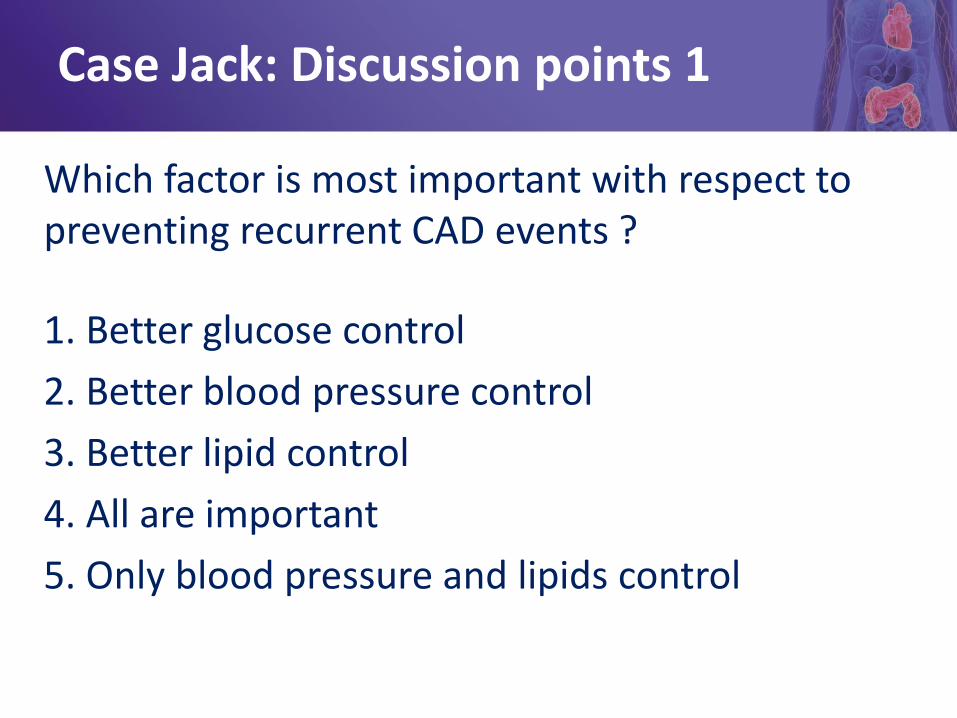
1. Better glucose control
2. Better blood pressure control
3. Better lipid control
4. All are important
5. Only blood pressure and lipids control
Case Jack: Discussion points 1
Which factor is most important with respect to preventing recurrent CAD events ?
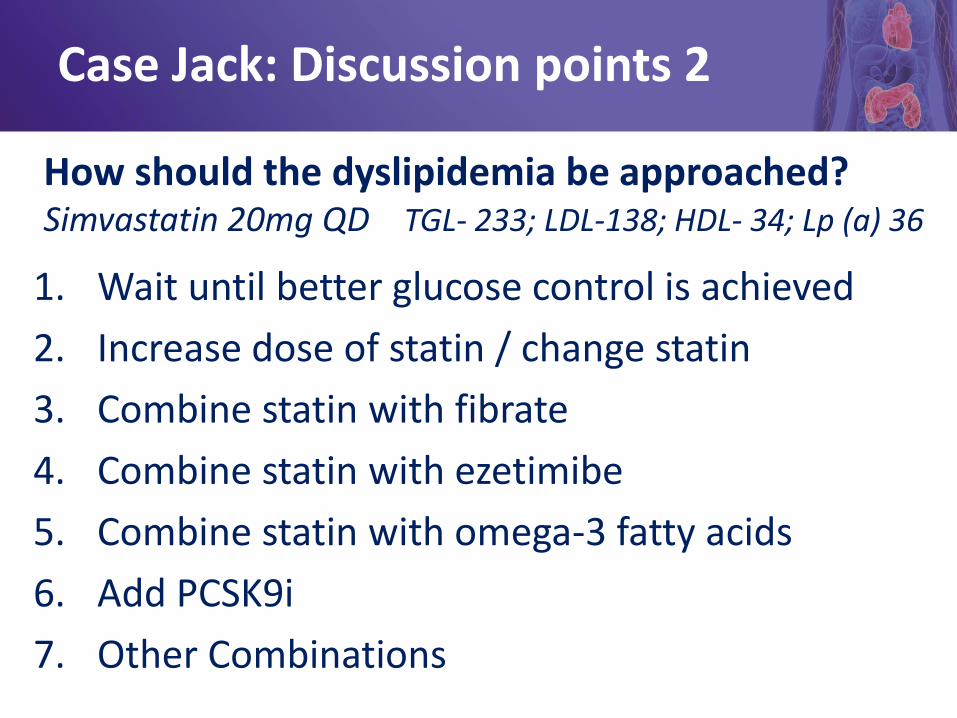
How should the dyslipidemia be approached? Simvastatin 20mg QD TGL- 233; LDL-138; HDL- 34; Lp (a) 36
Case Jack: Discussion points 2
1. Wait until better glucose control is achieved
2. Increase dose of statin / change statin
3. Combine statin with fibrate
4. Combine statin with ezetimibe
5. Combine statin with omega-3 fatty acids
6. Add PCSK9i
7. Other Combinations
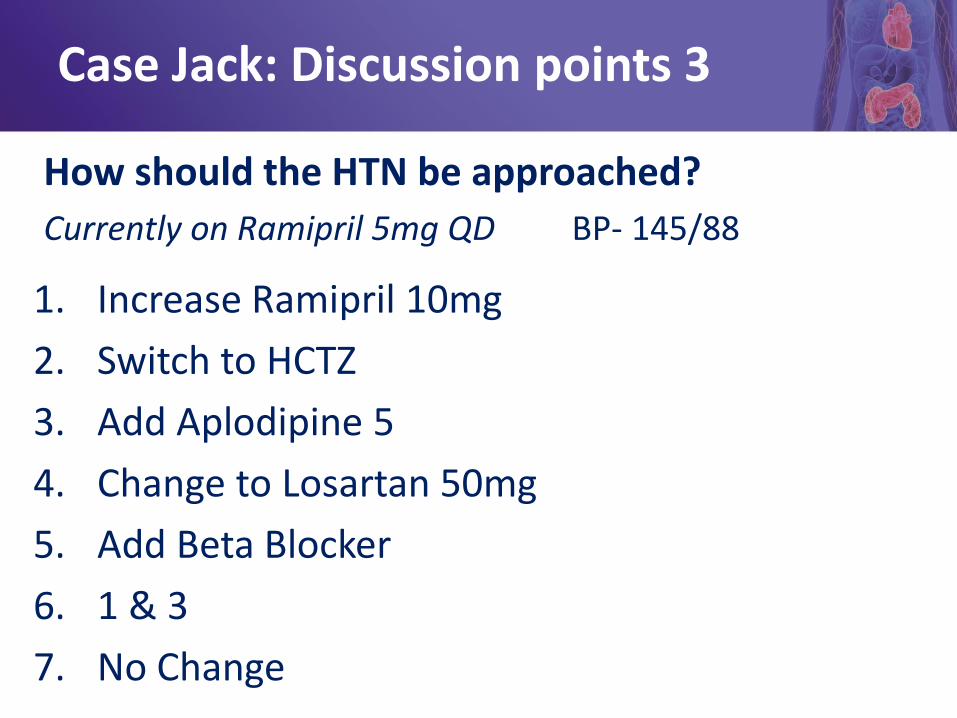
How should the HTN be approached?
Currently on Ramipril 5mg QD BP- 145/88
Case Jack: Discussion points 3
1. Increase Ramipril 10mg
2. Switch to HCTZ
3. Add Aplodipine 5
4. Change to Losartan 50mg
5. Add Beta Blocker
6. 1 & 3
7. No Change
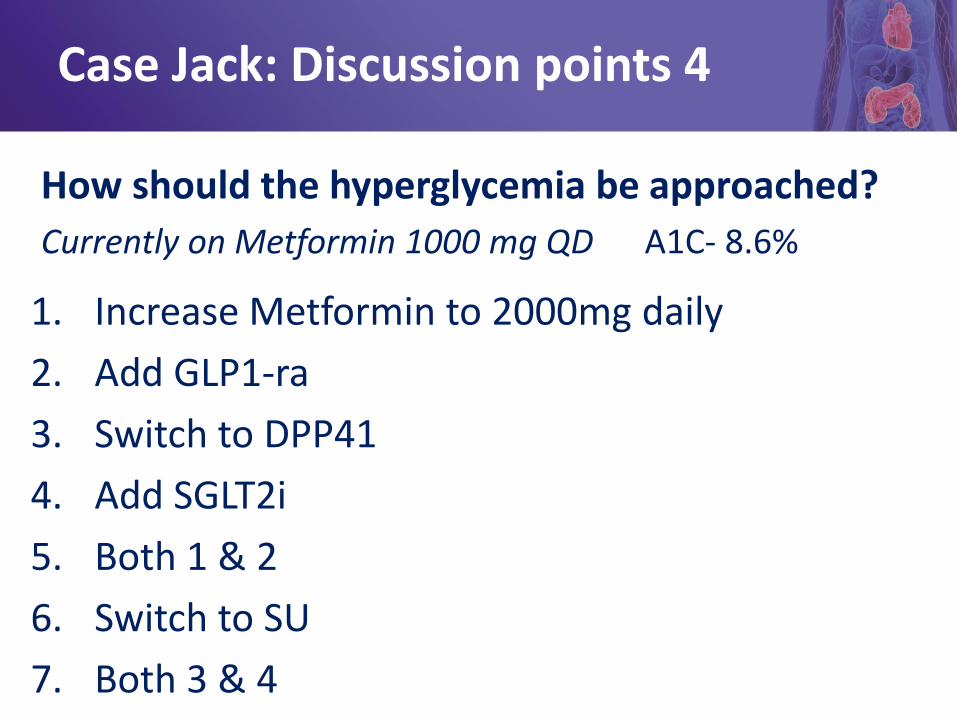
How should the hyperglycemia be approached?
Currently on Metformin 1000 mg QD A1C- 8.6%
Case Jack: Discussion points 4
1. Increase Metformin to 2000mg daily
2. Add GLP1-ra
3. Switch to DPP41
4. Add SGLT2i
5. Both 1 & 2
6. Switch to SU
7. Both 3 & 4
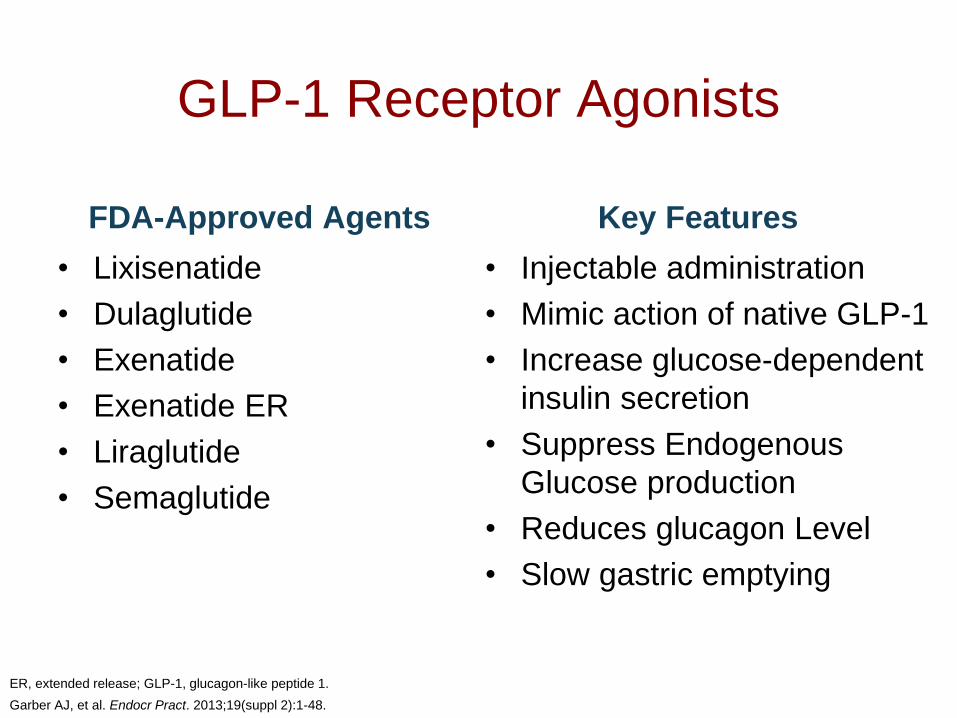
GLP-1 Receptor Agonists
FDA-Approved Agents
• Lixisenatide
• Dulaglutide
• Exenatide
• Exenatide ER
• Liraglutide
• Semaglutide
Key Features
• Injectable administration
• Mimic action of native GLP-1
• Increase glucose-dependent
insulin secretion
• Suppress Endogenous
Glucose production
• Reduces glucagon Level
• Slow gastric emptying
ER, extended release; GLP-1, glucagon-like peptide 1.
Garber AJ, et al. Endocr Pract. 2013;19(suppl 2):1-48.
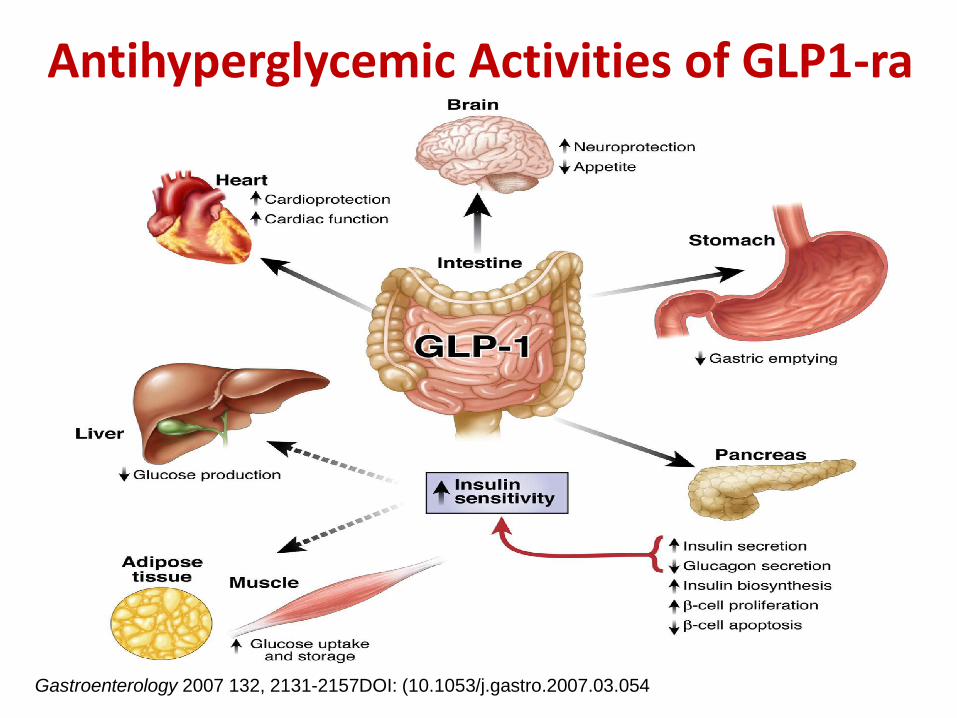
Gastroenterology 2007 132, 2131-2157DOI: (10.1053/j.gastro.2007.03.054
Antihyperglycemic Activities of GLP1-ra
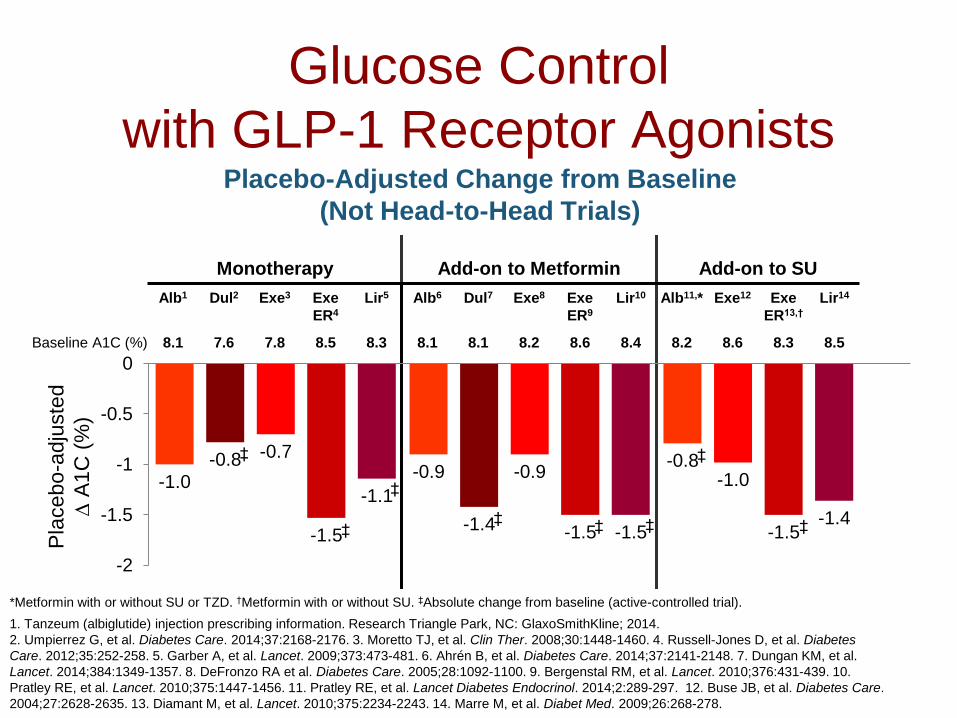
Monotherapy Add-on to Metformin Add-on to SU
Alb1 Dul2 Exe3 Exe
ER4
Lir5 Alb6 Dul7 Exe8 Exe
ER9
Lir10 Alb11,* Exe12 Exe
ER13,†
Lir14
Baseline A1C (%) 8.1 7.6 7.8 8.5 8.3 8.1 8.1 8.2 8.6 8.4 8.2 8.6 8.3 8.5
Glucose Control
with GLP-1 Receptor Agonists
-1.0-0.9
-0.8-0.8
-1.4
-1.0
-0.7-0.9
-1.5-1.5 -1.5-1.4
-1.1
-1.5
-2
-1.5
-1
-0.5
0
Placebo-Adjusted Change from Baseline
(Not Head-to-Head Trials)
*Metformin with or without SU or TZD. †Metformin with or without SU. ‡Absolute change from baseline (active-controlled trial).
1. Tanzeum (albiglutide) injection prescribing information. Research Triangle Park, NC: GlaxoSmithKline; 2014.
2. Umpierrez G, et al. Diabetes Care. 2014;37:2168-2176. 3. Moretto TJ, et al. Clin Ther. 2008;30:1448-1460. 4. Russell-Jones D, et al. Diabetes
Care. 2012;35:252-258. 5. Garber A, et al. Lancet. 2009;373:473-481. 6. Ahrén B, et al. Diabetes Care. 2014;37:2141-2148. 7. Dungan KM, et al.
Lancet. 2014;384:1349-1357. 8. DeFronzo RA et al. Diabetes Care. 2005;28:1092-1100. 9. Bergenstal RM, et al. Lancet. 2010;376:431-439. 10.
Pratley RE, et al. Lancet. 2010;375:1447-1456. 11. Pratley RE, et al. Lancet Diabetes Endocrinol. 2014;2:289-297. 12. Buse JB, et al. Diabetes Care.
2004;27:2628-2635. 13. Diamant M, et al. Lancet. 2010;375:2234-2243. 14. Marre M, et al. Diabet Med. 2009;26:268-278.
Pla
cebo
-adju
ste
d
A
1C
(%
)
‡
‡
‡ ‡
‡
‡
‡
‡
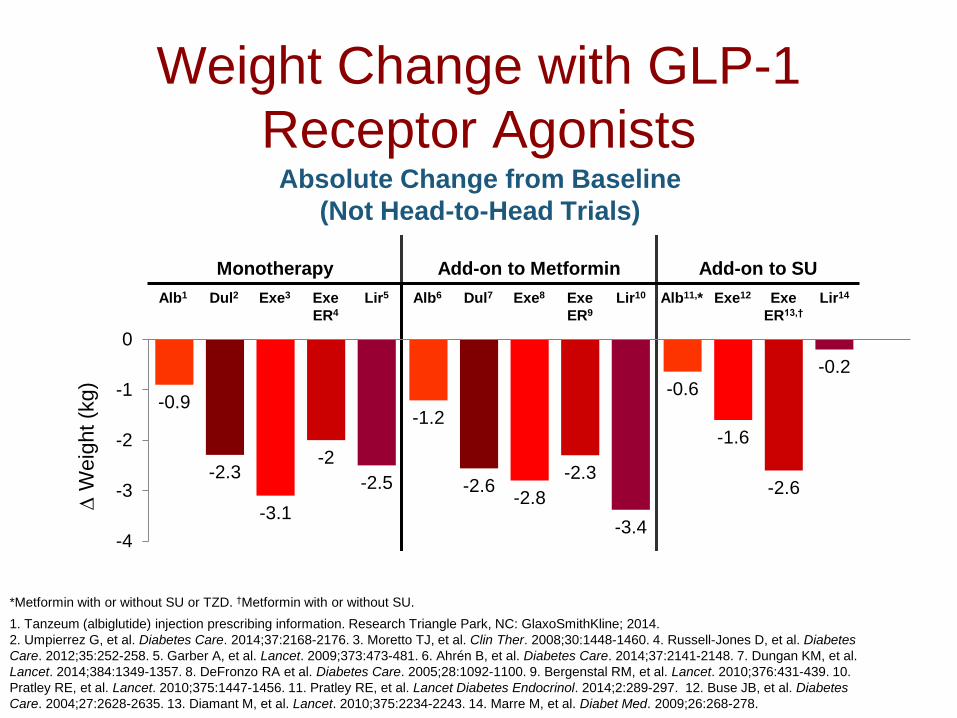
Monotherapy Add-on to Metformin Add-on to SU
Alb1 Dul2 Exe3 Exe
ER4
Lir5 Alb6 Dul7 Exe8 Exe
ER9
Lir10 Alb11,* Exe12 Exe
ER13,†
Lir14
Weight Change with GLP-1
Receptor Agonists
-0.9-1.2
-0.6
-2.3-2.6
-1.6
-3.1-2.8
-2.6
-2-2.3
-0.2
-2.5
-3.4-4
-3
-2
-1
0
*Metformin with or without SU or TZD. †Metformin with or without SU.
1. Tanzeum (albiglutide) injection prescribing information. Research Triangle Park, NC: GlaxoSmithKline; 2014.
2. Umpierrez G, et al. Diabetes Care. 2014;37:2168-2176. 3. Moretto TJ, et al. Clin Ther. 2008;30:1448-1460. 4. Russell-Jones D, et al. Diabetes
Care. 2012;35:252-258. 5. Garber A, et al. Lancet. 2009;373:473-481. 6. Ahrén B, et al. Diabetes Care. 2014;37:2141-2148. 7. Dungan KM, et al.
Lancet. 2014;384:1349-1357. 8. DeFronzo RA et al. Diabetes Care. 2005;28:1092-1100. 9. Bergenstal RM, et al. Lancet. 2010;376:431-439. 10.
Pratley RE, et al. Lancet. 2010;375:1447-1456. 11. Pratley RE, et al. Lancet Diabetes Endocrinol. 2014;2:289-297. 12. Buse JB, et al. Diabetes
Care. 2004;27:2628-2635. 13. Diamant M, et al. Lancet. 2010;375:2234-2243. 14. Marre M, et al. Diabet Med. 2009;26:268-278.
W
eig
ht (k
g)
Absolute Change from Baseline
(Not Head-to-Head Trials)
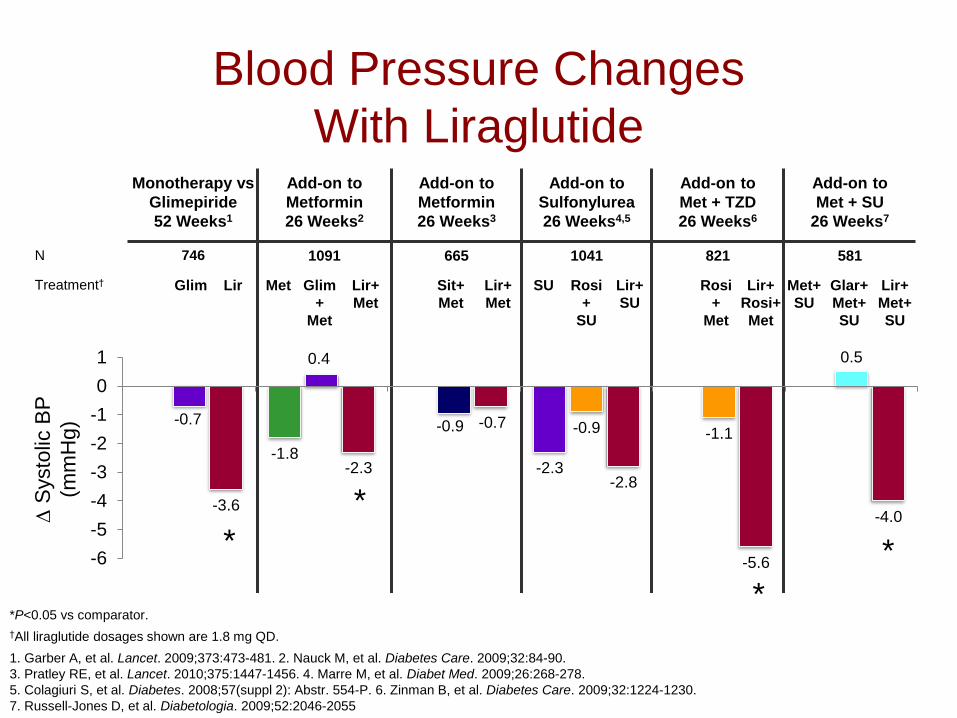
Blood Pressure Changes
With LiraglutideMonotherapy vs
Glimepiride
52 Weeks1
Add-on to
Metformin
26 Weeks2
Add-on to
Metformin
26 Weeks3
Add-on to
Sulfonylurea
26 Weeks4,5
Add-on to
Met + TZD
26 Weeks6
Add-on to
Met + SU
26 Weeks7
N 746 1091 665 1041 821 581
Treatment† Glim Lir Met Glim
+
Met
Lir+
Met
Sit+
Met
Lir+
Met
SU Rosi
+
SU
Lir+
SU
Rosi
+
Met
Lir+
Rosi+
Met
Met+
SU
Glar+
Met+
SU
Lir+
Met+
SU
*P<0.05 vs comparator.
†All liraglutide dosages shown are 1.8 mg QD.
1. Garber A, et al. Lancet. 2009;373:473-481. 2. Nauck M, et al. Diabetes Care. 2009;32:84-90.
3. Pratley RE, et al. Lancet. 2010;375:1447-1456. 4. Marre M, et al. Diabet Med. 2009;26:268-278.
5. Colagiuri S, et al. Diabetes. 2008;57(suppl 2): Abstr. 554-P. 6. Zinman B, et al. Diabetes Care. 2009;32:1224-1230.
7. Russell-Jones D, et al. Diabetologia. 2009;52:2046-2055
-1.8-2.3
-0.7
0.4
-0.9 -0.9 -1.1
0.5
-3.6
-2.3
-0.7
-2.8
-5.6
-4.0
-6
-5
-4
-3
-2
-1
0
1
S
ysto
lic B
P
(mm
Hg)
*
*
*
*
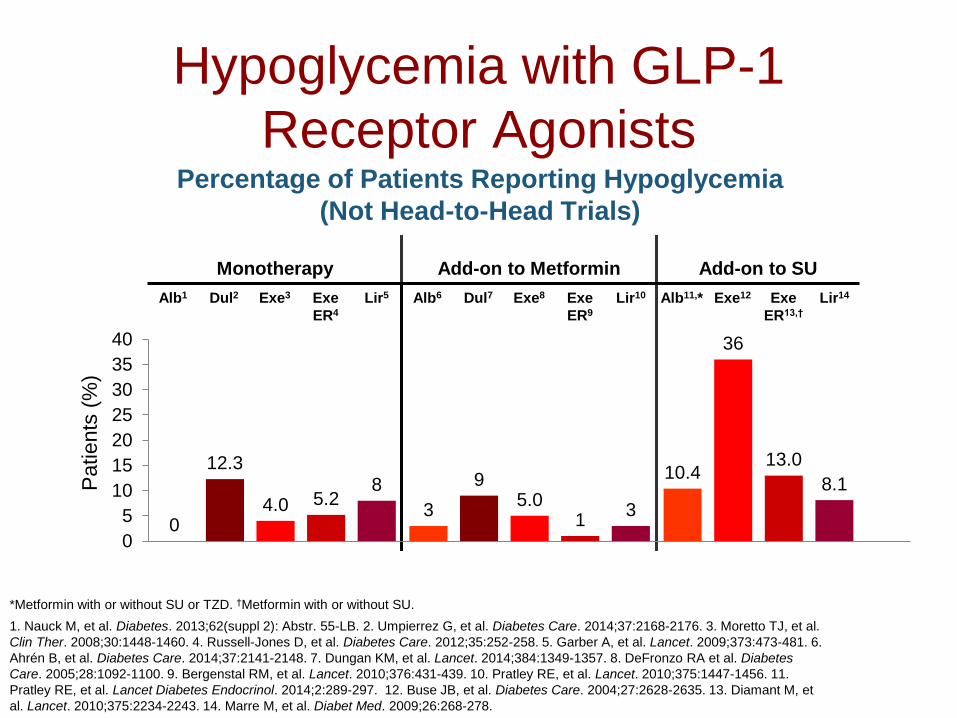
Monotherapy Add-on to Metformin Add-on to SU
Alb1 Dul2 Exe3 Exe
ER4
Lir5 Alb6 Dul7 Exe8 Exe
ER9
Lir10 Alb11,* Exe12 Exe
ER13,†
Lir14
Hypoglycemia with GLP-1
Receptor Agonists
03
10.412.3
9
36
4.0 5.0
13.0
5.21
8.18
3
0
5
10
15
20
25
30
35
40
*Metformin with or without SU or TZD. †Metformin with or without SU.
1. Nauck M, et al. Diabetes. 2013;62(suppl 2): Abstr. 55-LB. 2. Umpierrez G, et al. Diabetes Care. 2014;37:2168-2176. 3. Moretto TJ, et al.
Clin Ther. 2008;30:1448-1460. 4. Russell-Jones D, et al. Diabetes Care. 2012;35:252-258. 5. Garber A, et al. Lancet. 2009;373:473-481. 6.
Ahrén B, et al. Diabetes Care. 2014;37:2141-2148. 7. Dungan KM, et al. Lancet. 2014;384:1349-1357. 8. DeFronzo RA et al. Diabetes
Care. 2005;28:1092-1100. 9. Bergenstal RM, et al. Lancet. 2010;376:431-439. 10. Pratley RE, et al. Lancet. 2010;375:1447-1456. 11.
Pratley RE, et al. Lancet Diabetes Endocrinol. 2014;2:289-297. 12. Buse JB, et al. Diabetes Care. 2004;27:2628-2635. 13. Diamant M, et
al. Lancet. 2010;375:2234-2243. 14. Marre M, et al. Diabet Med. 2009;26:268-278.
Percentage of Patients Reporting Hypoglycemia
(Not Head-to-Head Trials)
Patients
(%
)
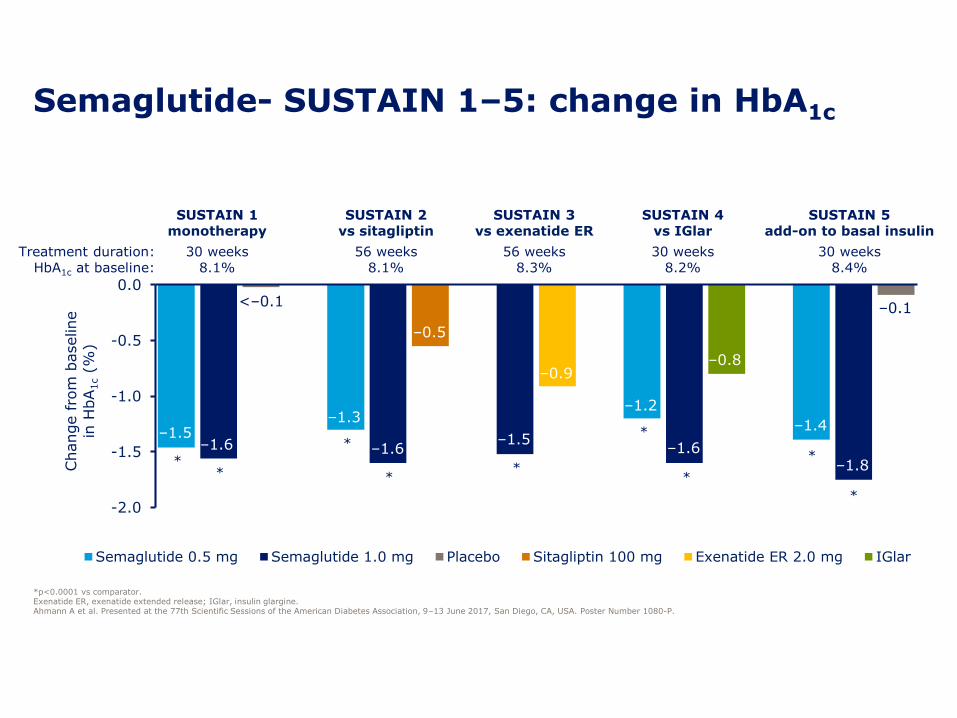
-2.0
-1.5
-1.0
-0.5
0.0
Change fro
m b
aseline
in H
bA
1c(%
)
Semaglutide 0.5 mg Semaglutide 1.0 mg Placebo Sitagliptin 100 mg Exenatide ER 2.0 mg IGlar
–1.5–1.6
–1.3
–1.6
–0.5
–1.5
–0.9
–1.2
–1.6
–0.8
–1.4
–1.8
–0.1<–0.1
Semaglutide- SUSTAIN 1–5: change in HbA1c
*p<0.0001 vs comparator. Exenatide ER, exenatide extended release; IGlar, insulin glargine.Ahmann A et al. Presented at the 77th Scientific Sessions of the American Diabetes Association, 9–13 June 2017, San Diego, CA, USA. Poster Number 1080-P.
SUSTAIN 1monotherapy
SUSTAIN 2vs sitagliptin
SUSTAIN 3vs exenatide ER
SUSTAIN 4vs IGlar
SUSTAIN 5add-on to basal insulin
Treatment duration: 30 weeks 56 weeks 56 weeks 30 weeks 30 weeksHbA1c at baseline: 8.1% 8.1% 8.3% 8.2% 8.4%
**
*
**
*
*
*
*
-8.0
-7.0
-6.0
-5.0
-4.0
-3.0
-2.0
-1.0
0.0
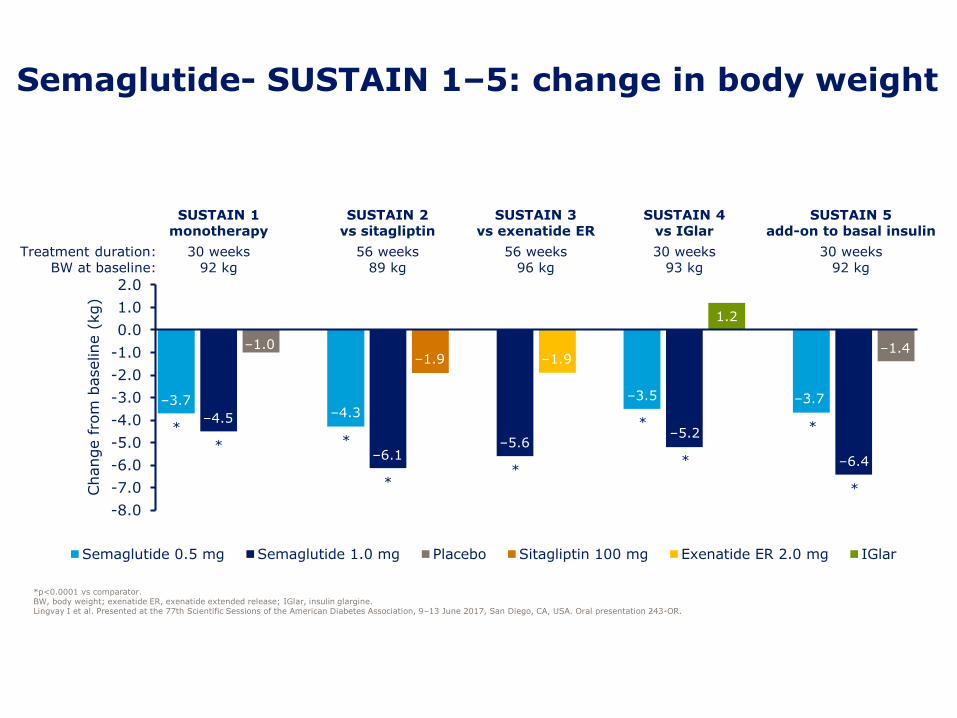
1.0
2.0
Change fro
m b
aseline (
kg)
Semaglutide 0.5 mg Semaglutide 1.0 mg Placebo Sitagliptin 100 mg Exenatide ER 2.0 mg IGlar
–3.7
–4.5
–1.0
–4.3
–6.1
–1.9
–5.6
–1.9
–3.5
–5.2
1.2
–3.7
–6.4
–1.4
Semaglutide- SUSTAIN 1–5: change in body weight
*p<0.0001 vs comparator. BW, body weight; exenatide ER, exenatide extended release; IGlar, insulin glargine.Lingvay I et al. Presented at the 77th Scientific Sessions of the American Diabetes Association, 9–13 June 2017, San Diego, CA, USA. Oral presentation 243-OR.
SUSTAIN 1monotherapy
SUSTAIN 2vs sitagliptin
SUSTAIN 3vs exenatide ER
SUSTAIN 4vs IGlar
SUSTAIN 5add-on to basal insulin
Treatment duration: 30 weeks 56 weeks 56 weeks 30 weeks 30 weeksBW at baseline: 92 kg 89 kg 96 kg 93 kg 92 kg
*
* *
**
*
*
*
*
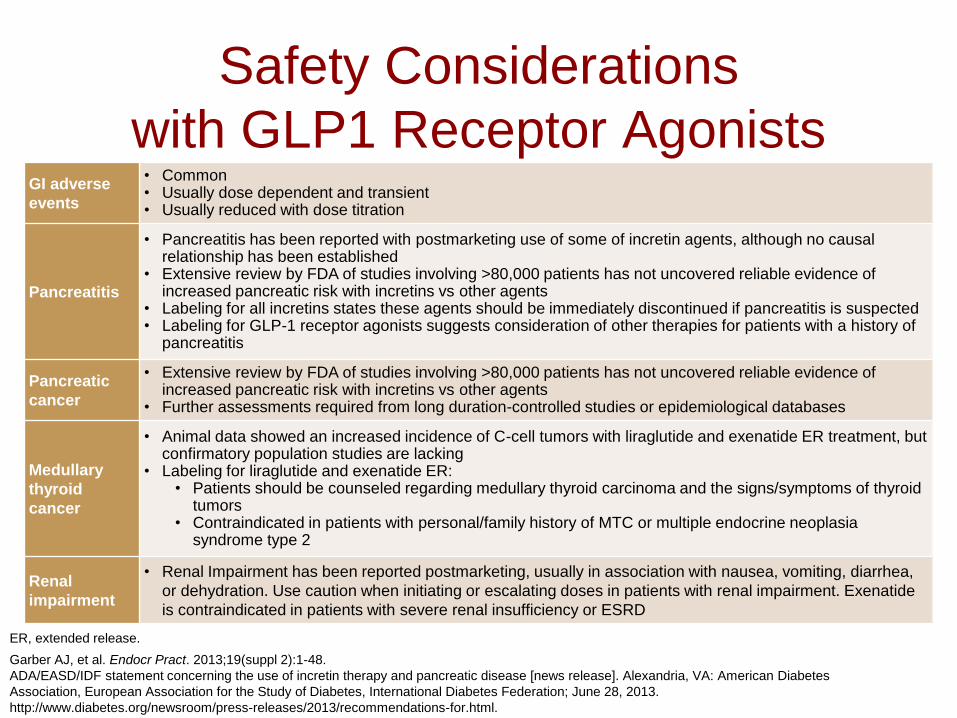
Safety Considerations
with GLP1 Receptor AgonistsGI adverse
events
• Common • Usually dose dependent and transient• Usually reduced with dose titration
Pancreatitis
• Pancreatitis has been reported with postmarketing use of some of incretin agents, although no causal relationship has been established
• Extensive review by FDA of studies involving >80,000 patients has not uncovered reliable evidence of increased pancreatic risk with incretins vs other agents
• Labeling for all incretins states these agents should be immediately discontinued if pancreatitis is suspected• Labeling for GLP-1 receptor agonists suggests consideration of other therapies for patients with a history of
pancreatitis
Pancreatic
cancer
• Extensive review by FDA of studies involving >80,000 patients has not uncovered reliable evidence of increased pancreatic risk with incretins vs other agents
• Further assessments required from long duration-controlled studies or epidemiological databases
Medullary
thyroid
cancer
• Animal data showed an increased incidence of C-cell tumors with liraglutide and exenatide ER treatment, but confirmatory population studies are lacking
• Labeling for liraglutide and exenatide ER:• Patients should be counseled regarding medullary thyroid carcinoma and the signs/symptoms of thyroid
tumors• Contraindicated in patients with personal/family history of MTC or multiple endocrine neoplasia
syndrome type 2
Renal
impairment
• Renal Impairment has been reported postmarketing, usually in association with nausea, vomiting, diarrhea,
or dehydration. Use caution when initiating or escalating doses in patients with renal impairment. Exenatide
is contraindicated in patients with severe renal insufficiency or ESRD
ER, extended release.
Garber AJ, et al. Endocr Pract. 2013;19(suppl 2):1-48.
ADA/EASD/IDF statement concerning the use of incretin therapy and pancreatic disease [news release]. Alexandria, VA: American Diabetes
Association, European Association for the Study of Diabetes, International Diabetes Federation; June 28, 2013.
http://www.diabetes.org/newsroom/press-releases/2013/recommendations-for.html.

Jane• 54 yrs old woman comes for second Opinion
– Type 2 diabetes for 6.5 yrs, 2 yrs ago MI.
– Recently hospitalized for dyspnea diagnosed with CHF, now stable
– ROS: Fatigue, sleep disturbance, joint pain
– Social: office manager, Diet- Variable; exercise-none. Married, 2 adult children. Fx Hx- DM, CVD
– SMBG: 120–170 mg, mostly fasting.
– Medications: Lisinopril 10mg, torsemide 10, Atenolol 25, Metformin 1000mg BID, Atorvastatin 40mg daily
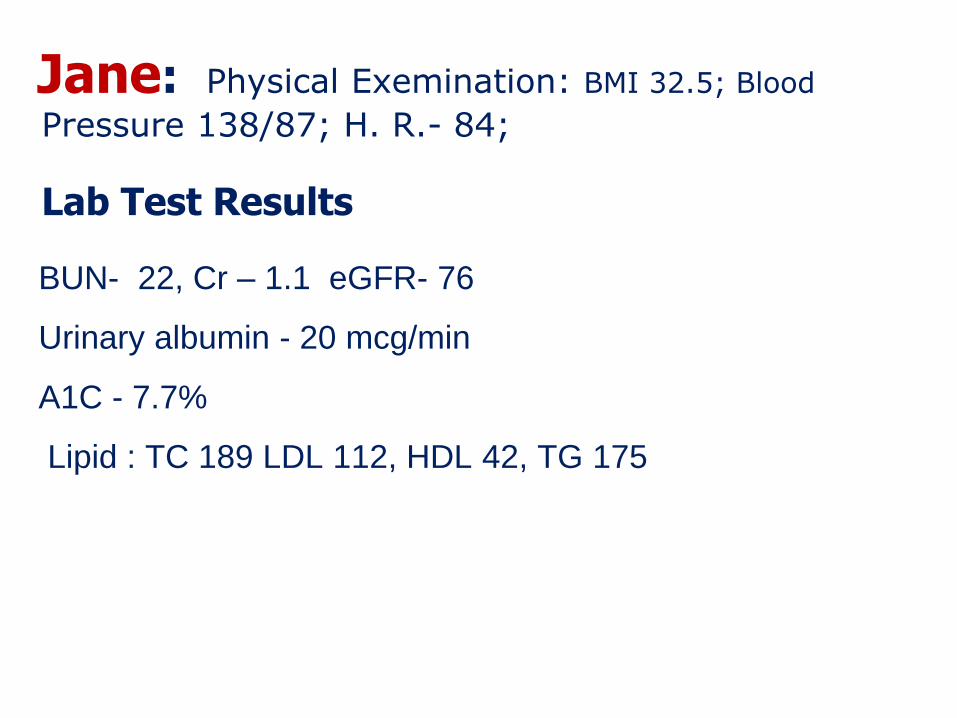
Jane: Physical Exemination: BMI 32.5; Blood
Pressure 138/87; H. R.- 84;
Lab Test Results
BUN- 22, Cr – 1.1 eGFR- 76
Urinary albumin - 20 mcg/min
A1C - 7.7%
Lipid : TC 189 LDL 112, HDL 42, TG 175
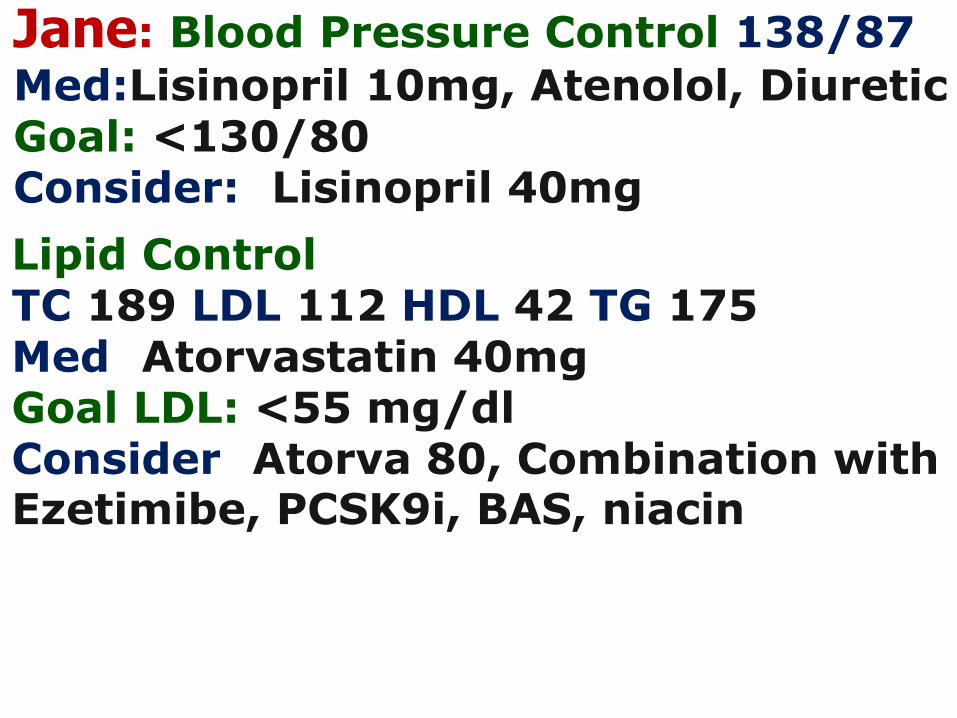
Jane: Blood Pressure Control 138/87
Med:Lisinopril 10mg, Atenolol, DiureticGoal: <130/80Consider:: Lisinopril 40mg
Lipid ControlTC 189 LDL 112 HDL 42 TG 175Med: Atorvastatin 40mgGoal LDL: <55 mg/dlConsider: Atorva 80, Combination with Ezetimibe, PCSK9i, BAS, niacin
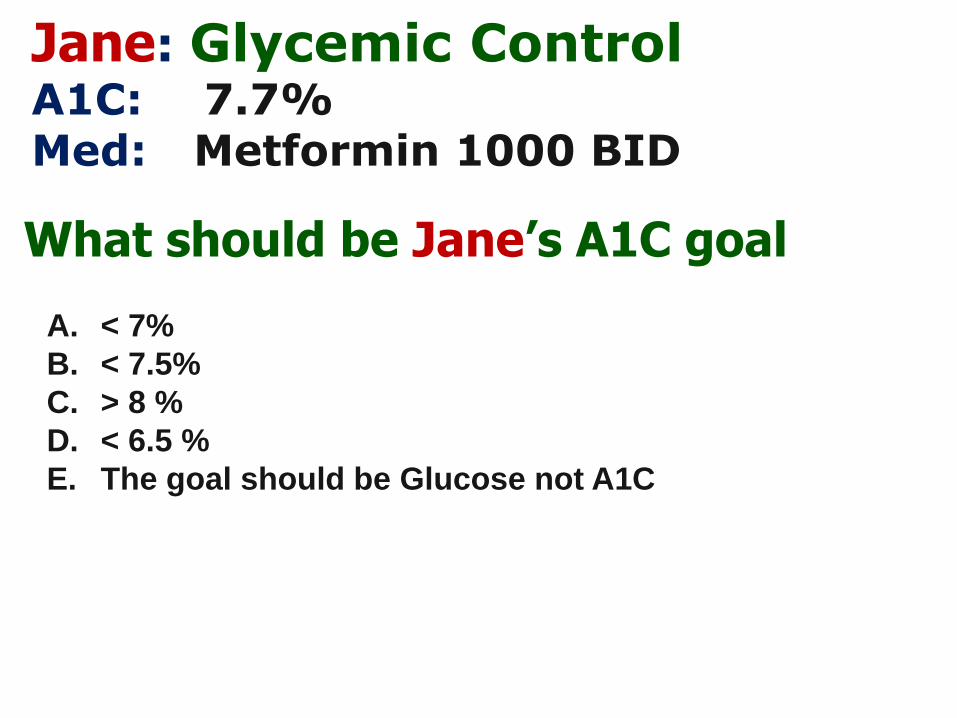
Jane: Glycemic ControlA1C: : 7.7% Med: : Metformin 1000 BID
What should be Jane’s A1C goal
A. < 7%
B. < 7.5%
C. > 8 %
D. < 6.5 %
E. The goal should be Glucose not A1C
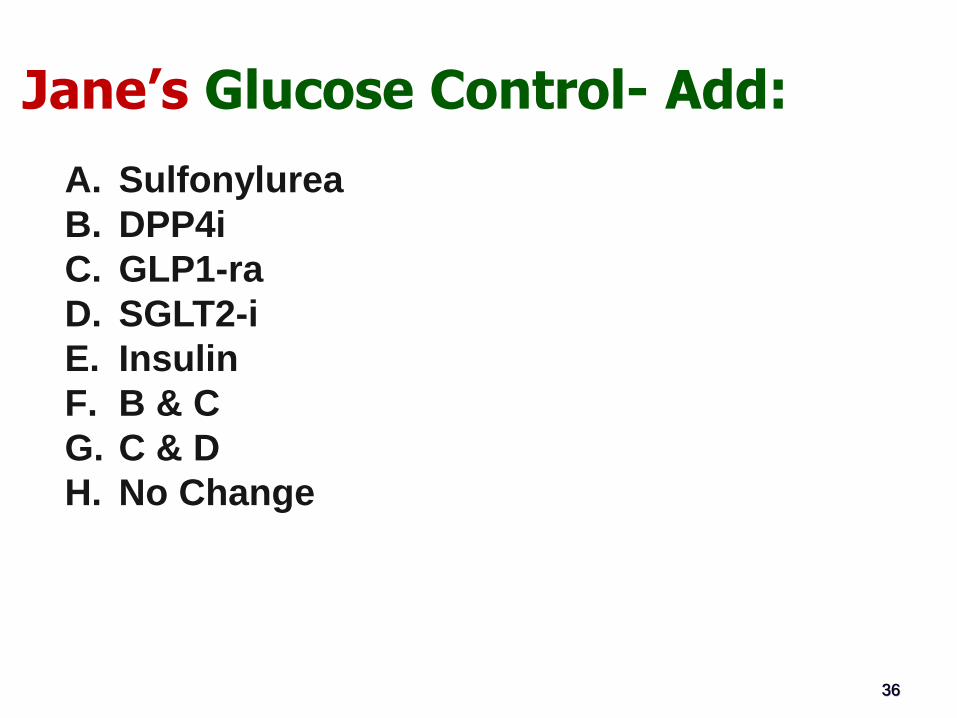
Jane’s Glucose Control- Add:
36
A. Sulfonylurea
B. DPP4i
C. GLP1-ra
D. SGLT2-i
E. Insulin
F. B & C
G. C & D
H. No Change
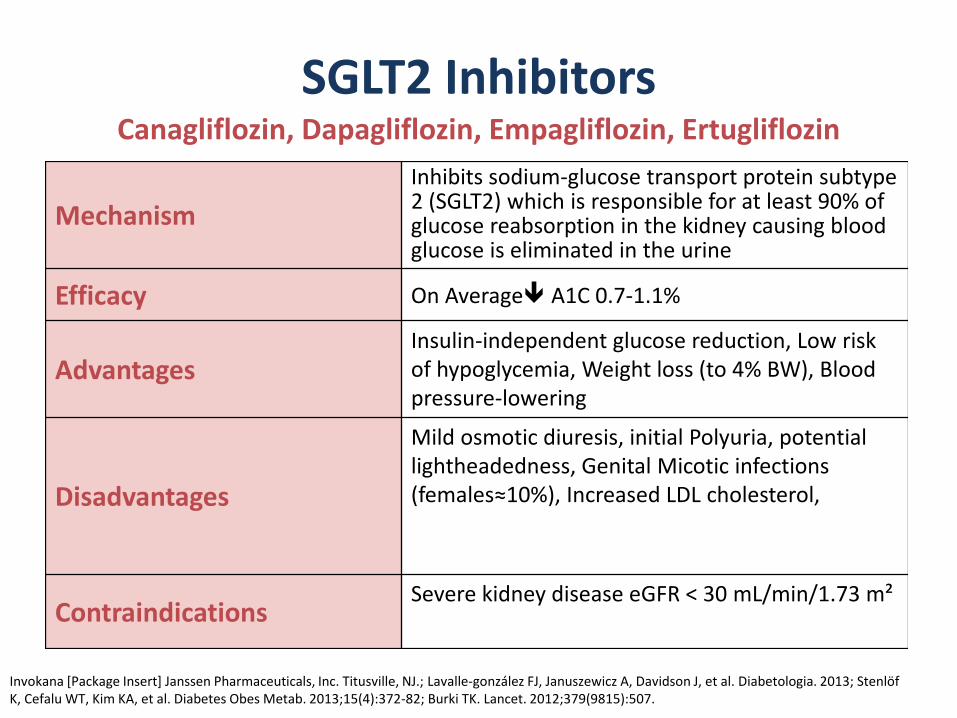
SGLT2 InhibitorsCanagliflozin, Dapagliflozin, Empagliflozin, Ertugliflozin
Invokana [Package Insert] Janssen Pharmaceuticals, Inc. Titusville, NJ.; Lavalle-gonzález FJ, Januszewicz A, Davidson J, et al. Diabetologia. 2013; StenlöfK, Cefalu WT, Kim KA, et al. Diabetes Obes Metab. 2013;15(4):372-82; Burki TK. Lancet. 2012;379(9815):507.
Mechanism
Inhibits sodium-glucose transport protein subtype 2 (SGLT2) which is responsible for at least 90% of glucose reabsorption in the kidney causing blood glucose is eliminated in the urine
Efficacy On Average A1C 0.7-1.1%
AdvantagesInsulin-independent glucose reduction, Low risk of hypoglycemia, Weight loss (to 4% BW), Blood pressure-lowering
Disadvantages
Mild osmotic diuresis, initial Polyuria, potential lightheadedness, Genital Micotic infections (females≈10%), Increased LDL cholesterol,
ContraindicationsSevere kidney disease eGFR < 30 mL/min/1.73 m²
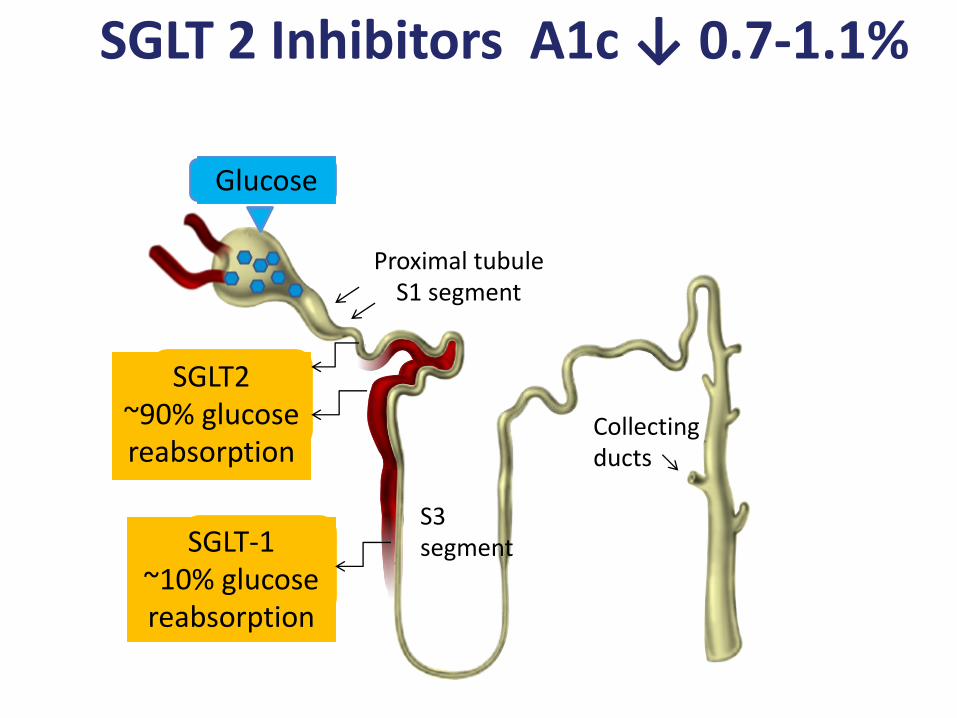
Glucose
Proximal tubuleS1 segment
SGLT2~90% glucose reabsorption
SGLT-1~10% glucose reabsorption
S3 segment
Collectingducts
SGLT 2 Inhibitors A1c ↓ 0.7-1.1%
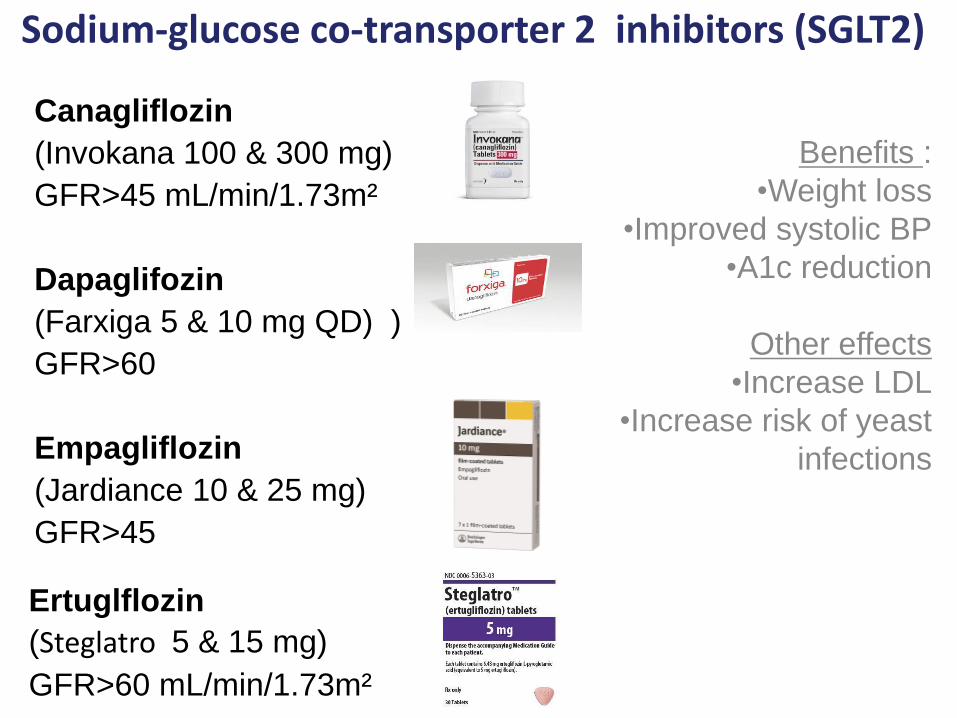
Sodium-glucose co-transporter 2 inhibitors (SGLT2)
Benefits :
•Weight loss
•Improved systolic BP
•A1c reduction
Other effects
•Increase LDL
•Increase risk of yeast
infections
Canagliflozin
(Invokana 100 & 300 mg)
GFR>45 mL/min/1.73m²
Dapaglifozin
(Farxiga 5 & 10 mg QD) )
GFR>60
Empagliflozin
(Jardiance 10 & 25 mg)
GFR>45
Ertuglflozin
(Steglatro 5 & 15 mg)
GFR>60 mL/min/1.73m²
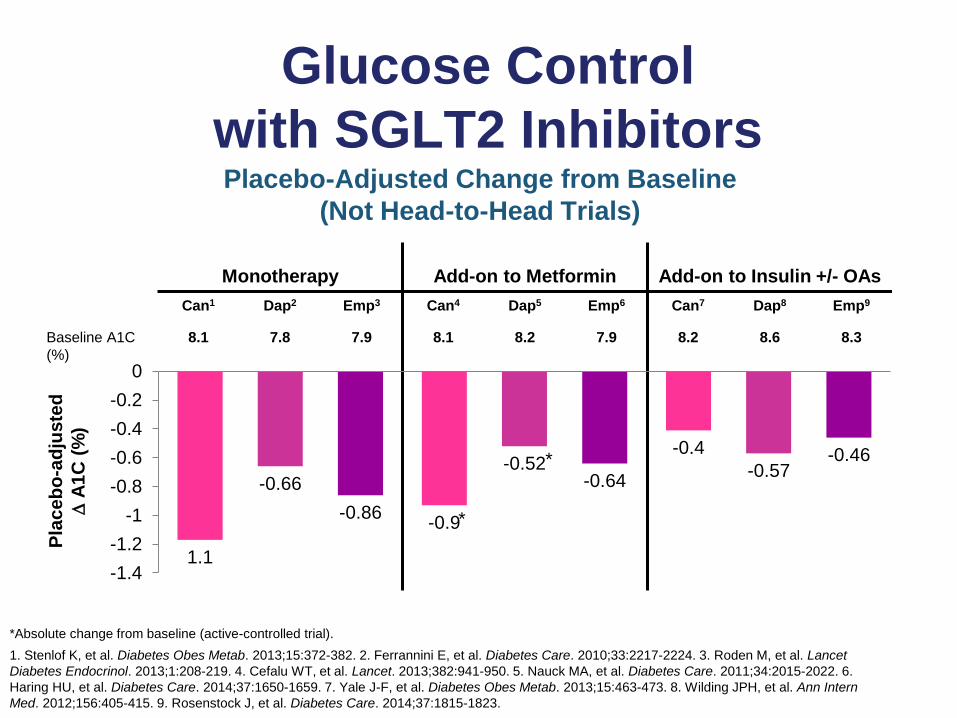
Glucose Control
with SGLT2 InhibitorsPlacebo-Adjusted Change from Baseline
(Not Head-to-Head Trials)
*Absolute change from baseline (active-controlled trial).
1. Stenlof K, et al. Diabetes Obes Metab. 2013;15:372-382. 2. Ferrannini E, et al. Diabetes Care. 2010;33:2217-2224. 3. Roden M, et al. Lancet
Diabetes Endocrinol. 2013;1:208-219. 4. Cefalu WT, et al. Lancet. 2013;382:941-950. 5. Nauck MA, et al. Diabetes Care. 2011;34:2015-2022. 6.
Haring HU, et al. Diabetes Care. 2014;37:1650-1659. 7. Yale J-F, et al. Diabetes Obes Metab. 2013;15:463-473. 8. Wilding JPH, et al. Ann Intern
Med. 2012;156:405-415. 9. Rosenstock J, et al. Diabetes Care. 2014;37:1815-1823.
Monotherapy Add-on to Metformin Add-on to Insulin +/- OAs
Can1 Dap2 Emp3 Can4 Dap5 Emp6 Can7 Dap8 Emp9
Baseline A1C
(%)
8.1 7.8 7.9 8.1 8.2 7.9 8.2 8.6 8.3
Pla
ce
bo
-ad
juste
d
A
1C
(%
)
*
*
1.1
-0.9
-0.4
-0.66-0.52 -0.57
-0.86
-0.64
-0.46
-1.4
-1.2
-1
-0.8
-0.6
-0.4
-0.2
0
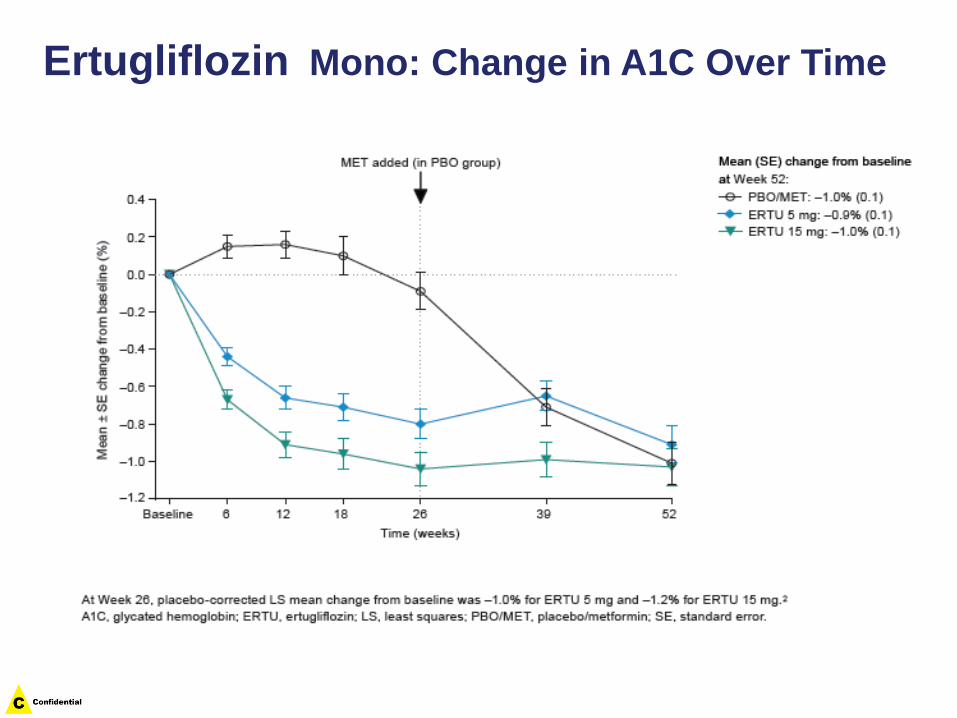
Ertugliflozin Mono: Change in A1C Over Time
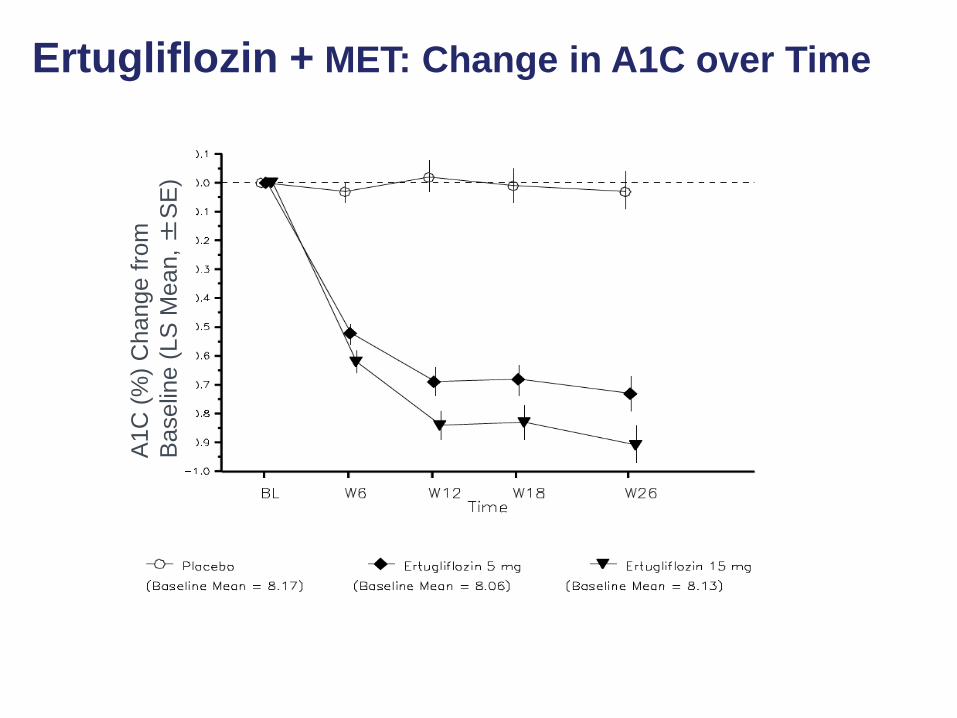
Ertugliflozin + MET: Change in A1C over Time
A1C
(%
) C
hange f
rom
Baselin
e (
LS
Mean, ±
SE
)
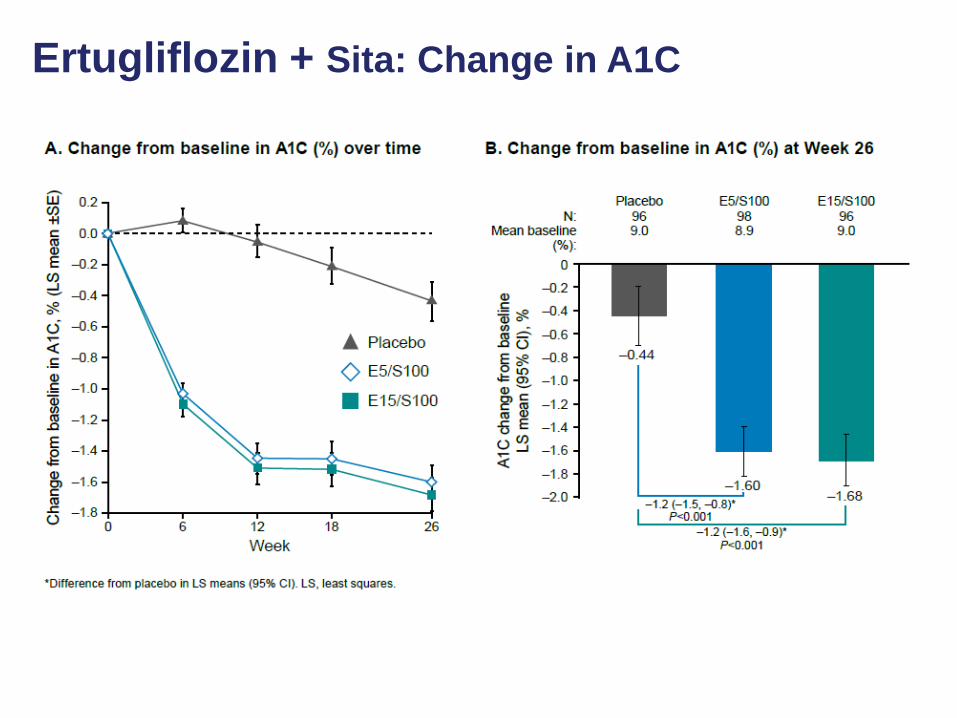
Ertugliflozin + Sita: Change in A1C
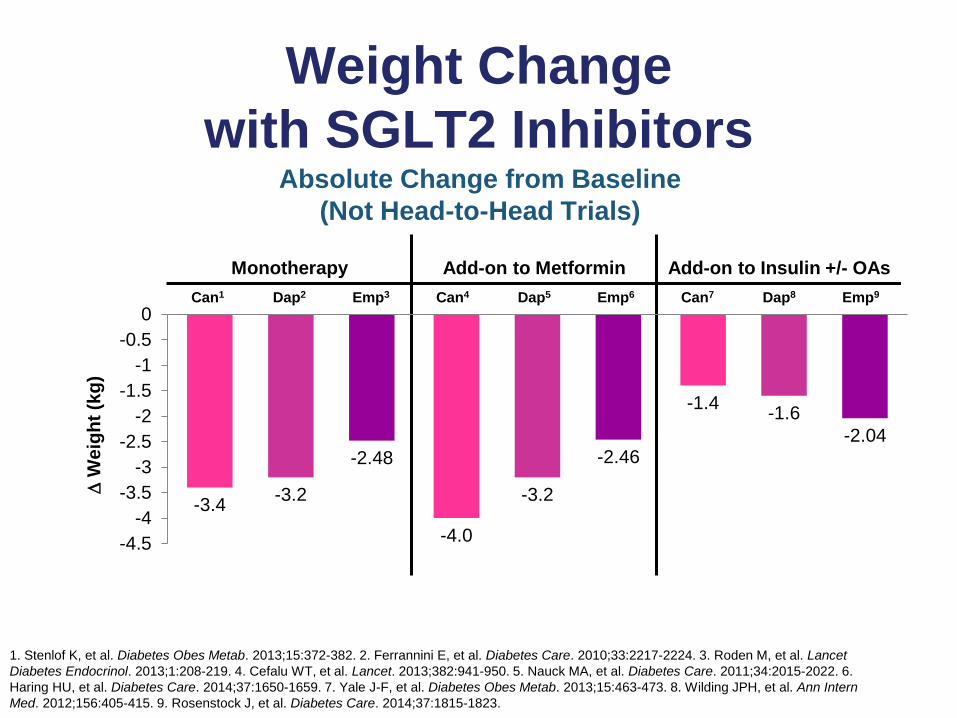
Weight Change
with SGLT2 InhibitorsAbsolute Change from Baseline
(Not Head-to-Head Trials)
W
eig
ht
(kg
)
Monotherapy Add-on to Metformin Add-on to Insulin +/- OAs
Can1 Dap2 Emp3 Can4 Dap5 Emp6 Can7 Dap8 Emp9
-3.4
-4.0
-1.4
-3.2 -3.2
-1.6
-2.48 -2.46-2.04
-4.5
-4
-3.5
-3
-2.5
-2
-1.5
-1
-0.5
0
1. Stenlof K, et al. Diabetes Obes Metab. 2013;15:372-382. 2. Ferrannini E, et al. Diabetes Care. 2010;33:2217-2224. 3. Roden M, et al. Lancet
Diabetes Endocrinol. 2013;1:208-219. 4. Cefalu WT, et al. Lancet. 2013;382:941-950. 5. Nauck MA, et al. Diabetes Care. 2011;34:2015-2022. 6.
Haring HU, et al. Diabetes Care. 2014;37:1650-1659. 7. Yale J-F, et al. Diabetes Obes Metab. 2013;15:463-473. 8. Wilding JPH, et al. Ann Intern
Med. 2012;156:405-415. 9. Rosenstock J, et al. Diabetes Care. 2014;37:1815-1823.
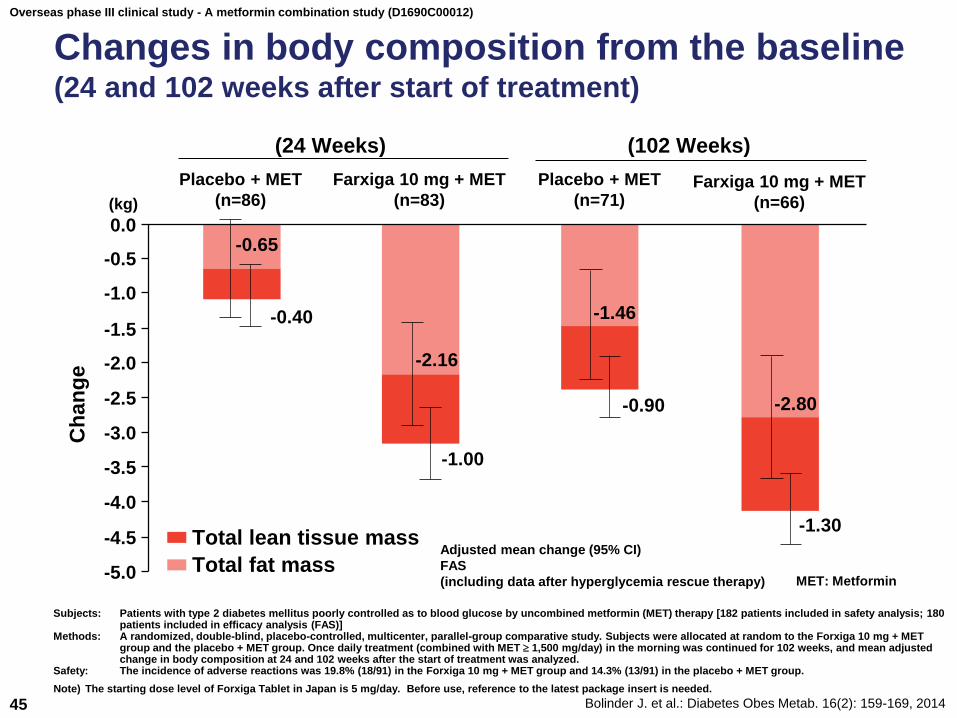
Overseas phase III clinical study - A metformin combination study (D1690C00012)
Changes in body composition from the baseline(24 and 102 weeks after start of treatment)
Bolinder J. et al.: Diabetes Obes Metab. 16(2): 159-169, 201445
-5.0
-4.5
-4.0
-3.5
-2.0
-1.5
-0.5
Ch
an
ge
(24 Weeks)
Placebo + MET
(n=86)
Farxiga 10 mg + MET
(n=83)
(102 Weeks)
Placebo + MET
(n=71)
Total lean tissue mass
Total fat mass
0.0
-1.0
-2.5
-3.0
Farxiga 10 mg + MET
(n=66)
-0.65
-0.40
-2.16
-1.00
-1.46
-0.90 -2.80
-1.30
(kg)
Subjects: Patients with type 2 diabetes mellitus poorly controlled as to blood glucose by uncombined metformin (MET) therapy [182 patients included in safety analysis; 180 patients included in efficacy analysis (FAS)]
Methods: A randomized, double-blind, placebo-controlled, multicenter, parallel-group comparative study. Subjects were allocated at random to the Forxiga 10 mg + MET group and the placebo + MET group. Once daily treatment (combined with MET 1,500 mg/day) in the morning was continued for 102 weeks, and mean adjusted change in body composition at 24 and 102 weeks after the start of treatment was analyzed.
Safety: The incidence of adverse reactions was 19.8% (18/91) in the Forxiga 10 mg + MET group and 14.3% (13/91) in the placebo + MET group.
Adjusted mean change (95% CI)
FAS
(including data after hyperglycemia rescue therapy) MET: Metformin
Note) The starting dose level of Forxiga Tablet in Japan is 5 mg/day. Before use, reference to the latest package insert is needed.
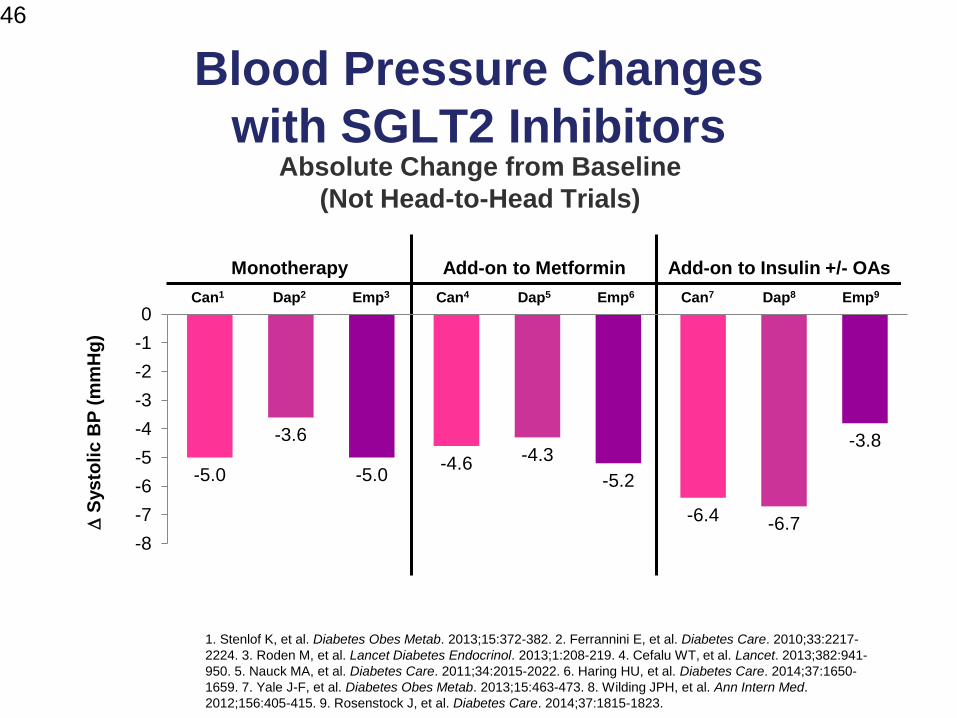
Blood Pressure Changes
with SGLT2 Inhibitors
46
Absolute Change from Baseline
(Not Head-to-Head Trials)
1. Stenlof K, et al. Diabetes Obes Metab. 2013;15:372-382. 2. Ferrannini E, et al. Diabetes Care. 2010;33:2217-
2224. 3. Roden M, et al. Lancet Diabetes Endocrinol. 2013;1:208-219. 4. Cefalu WT, et al. Lancet. 2013;382:941-
950. 5. Nauck MA, et al. Diabetes Care. 2011;34:2015-2022. 6. Haring HU, et al. Diabetes Care. 2014;37:1650-
1659. 7. Yale J-F, et al. Diabetes Obes Metab. 2013;15:463-473. 8. Wilding JPH, et al. Ann Intern Med.
2012;156:405-415. 9. Rosenstock J, et al. Diabetes Care. 2014;37:1815-1823.
Monotherapy Add-on to Metformin Add-on to Insulin +/- OAs
Can1 Dap2 Emp3 Can4 Dap5 Emp6 Can7 Dap8 Emp9
-5.0-4.6
-6.4
-3.6-4.3
-6.7
-5.0 -5.2
-3.8
-8
-7
-6
-5
-4
-3
-2
-1
0
S
ys
toli
c B
P (
mm
Hg
)
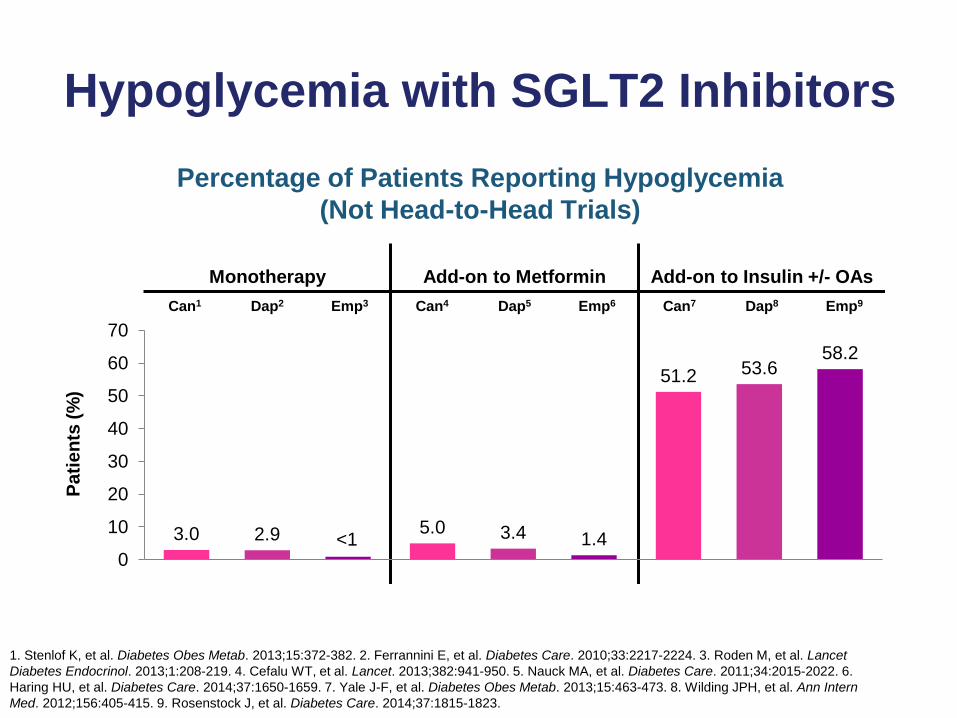
Hypoglycemia with SGLT2 Inhibitors
Percentage of Patients Reporting Hypoglycemia
(Not Head-to-Head Trials)
1. Stenlof K, et al. Diabetes Obes Metab. 2013;15:372-382. 2. Ferrannini E, et al. Diabetes Care. 2010;33:2217-2224. 3. Roden M, et al. Lancet
Diabetes Endocrinol. 2013;1:208-219. 4. Cefalu WT, et al. Lancet. 2013;382:941-950. 5. Nauck MA, et al. Diabetes Care. 2011;34:2015-2022. 6.
Haring HU, et al. Diabetes Care. 2014;37:1650-1659. 7. Yale J-F, et al. Diabetes Obes Metab. 2013;15:463-473. 8. Wilding JPH, et al. Ann Intern
Med. 2012;156:405-415. 9. Rosenstock J, et al. Diabetes Care. 2014;37:1815-1823.
Monotherapy Add-on to Metformin Add-on to Insulin +/- OAs
Can1 Dap2 Emp3 Can4 Dap5 Emp6 Can7 Dap8 Emp9
3.0 5.0
51.2
2.9 3.4
53.6
1.4
58.2
0
10
20
30
40
50
60
70
Pa
tie
nts
(%
)
<1
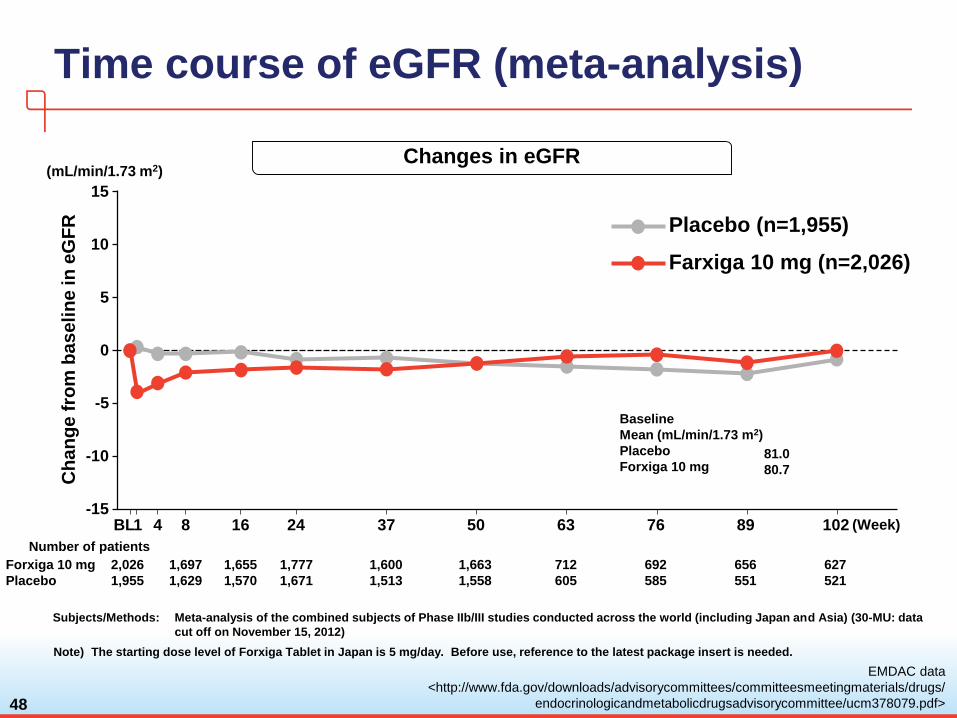
Time course of eGFR (meta-analysis)
48
Changes in eGFR
4 8 16 24 37 501 63 76 89 102 (Week)BL
Number of patients
Placebo (n=1,955)
Ch
an
ge f
rom
baseli
ne in
eG
FR
(mL/min/1.73 m2)
2,026
1,955
1,697
1,629
1,655
1,570
1,777
1,671
1,600
1,513
1,663
1,558
Forxiga 10 mg
Placebo
712
605
692
585
656
551
627
521
10
15
5
0
-5
-10
-15
Farxiga 10 mg (n=2,026)
Baseline
Mean (mL/min/1.73 m2)
Placebo
Forxiga 10 mg81.0
80.7
EMDAC data
<http://www.fda.gov/downloads/advisorycommittees/committeesmeetingmaterials/drugs/
endocrinologicandmetabolicdrugsadvisorycommittee/ucm378079.pdf>
Note) The starting dose level of Forxiga Tablet in Japan is 5 mg/day. Before use, reference to the latest package insert is needed.
Subjects/Methods: Meta-analysis of the combined subjects of Phase IIb/III studies conducted across the world (including Japan and Asia) (30-MU: data
cut off on November 15, 2012)
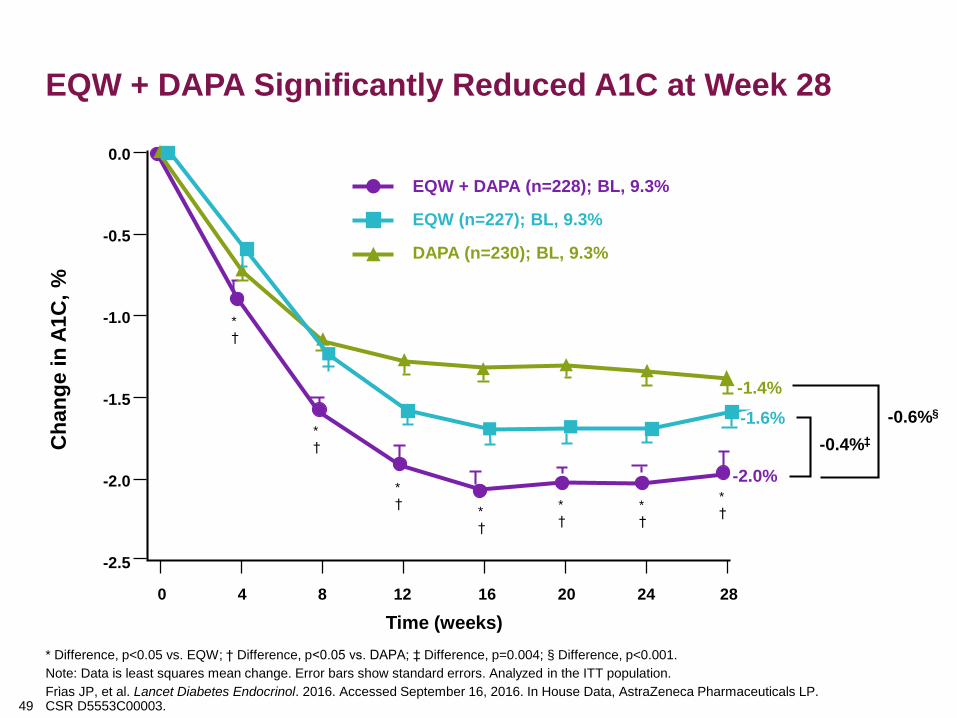
EQW + DAPA Significantly Reduced A1C at Week 28
49
* Difference, p<0.05 vs. EQW; † Difference, p<0.05 vs. DAPA; ‡ Difference, p=0.004; § Difference, p<0.001.
Note: Data is least squares mean change. Error bars show standard errors. Analyzed in the ITT population.
Frὶas JP, et al. Lancet Diabetes Endocrinol. 2016. Accessed September 16, 2016. In House Data, AstraZeneca Pharmaceuticals LP. CSR D5553C00003.
EQW + DAPA (n=228); BL, 9.3%
EQW (n=227); BL, 9.3%
DAPA (n=230); BL, 9.3%
-1.6%
-1.4%
-2.0%
-0.4%‡
-0.6%§
0.0
-0.5
-1.0
-1.5
-2.0
-2.5
0 4 8 12 16 20 24 28
Ch
an
ge i
n A
1C
, %
Time (weeks)
*
†
*
†
*
†*
†
*
†
*
†
*
†
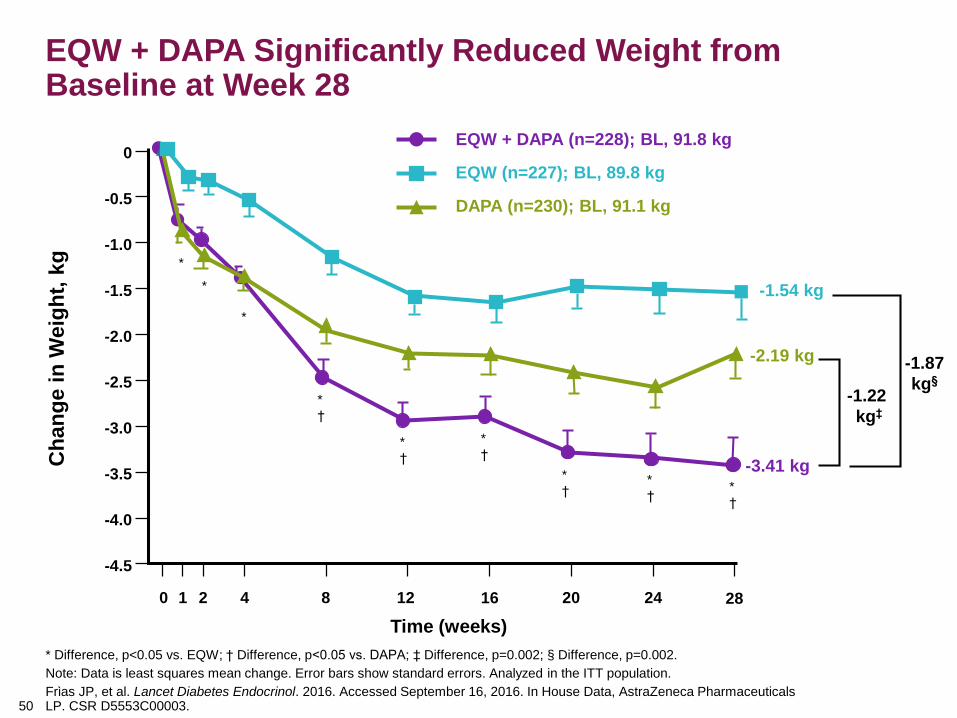
EQW + DAPA Significantly Reduced Weight from Baseline at Week 28
50
* Difference, p<0.05 vs. EQW; † Difference, p<0.05 vs. DAPA; ‡ Difference, p=0.002; § Difference, p=0.002.
Note: Data is least squares mean change. Error bars show standard errors. Analyzed in the ITT population.
Frὶas JP, et al. Lancet Diabetes Endocrinol. 2016. Accessed September 16, 2016. In House Data, AstraZeneca Pharmaceuticals LP. CSR D5553C00003.
-1.54 kg
-2.19 kg
-3.41 kg
-1.22
kg‡
-1.87
kg§
0
-0.5
-1.5
-3.0
-3.5
-4.5
0 4 8 12 16 20 24 28
Ch
an
ge i
n W
eig
ht,
kg
Time (weeks)
-4.0
-2.5
-1.0
1 2
-2.0
*
EQW + DAPA (n=228); BL, 91.8 kg
EQW (n=227); BL, 89.8 kg
DAPA (n=230); BL, 91.1 kg
*
*
*
†
*
†
*
†
*
†*
†*
†
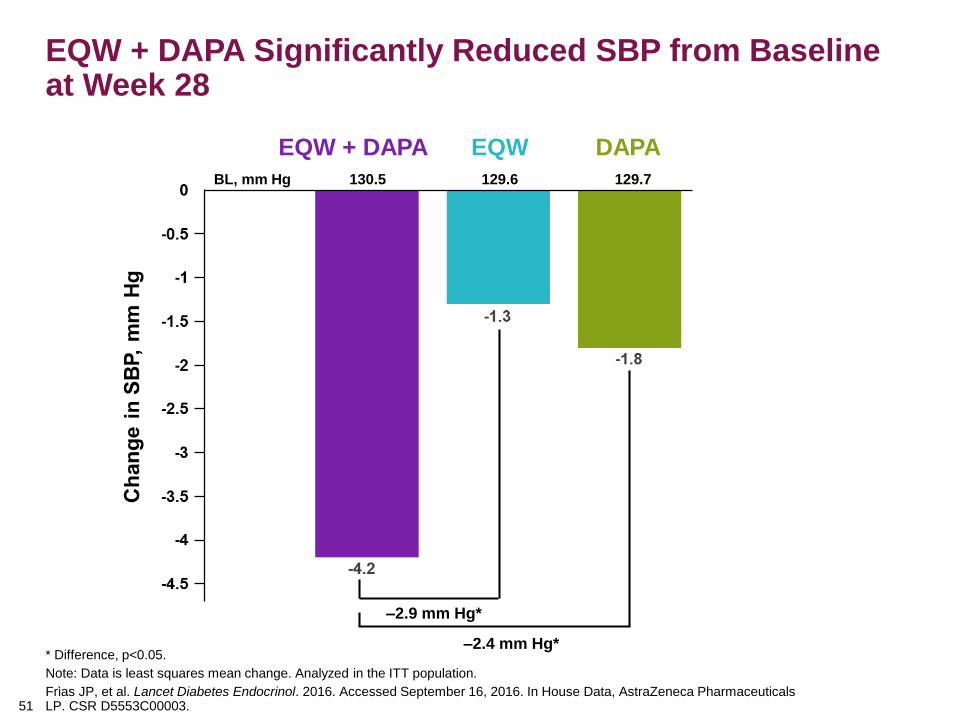
EQW + DAPA Significantly Reduced SBP from Baseline at Week 28
51
* Difference, p<0.05.
Note: Data is least squares mean change. Analyzed in the ITT population.
Frὶas JP, et al. Lancet Diabetes Endocrinol. 2016. Accessed September 16, 2016. In House Data, AstraZeneca Pharmaceuticals LP. CSR D5553C00003.
EQW + DAPA EQW DAPA
–2.9 mm Hg*
–2.4 mm Hg*
BL, mm Hg 130.5 129.6 129.7
Xultophy: combination therapy for the treatment
of type 2 diabetesKEY POINTS Xultophy is an injection combining insulin degludec
with liraglutide for T2D Administered once daily by sc injection,
It is supplied as a 3ml prefilled pen containing 100 units/3.6mg insulin
degludec/liraglutide per ml;
The proportion of patients reaching target HbA1c was higher with
Xultophy than with insulin degludec or liraglutide
Adverse effects are typical of the component drugs, with a lower
incidence of gastrointestinal effects but less weight loss than liraglutide
Soliqua
iGlarLixi, single-injection fixed-ratio combination of GLP1-RA &
Analog Basal Insulin- lixisenatide (Adlyxin) & Glargine (Lantus)"Improved Glucose Control without Increased Hypoglycemia Risk at Any Level of
HbA1c Reduction with Insulin Glargine/Lixisenatide Fixed-Ratio Combination (Soliqua)
vs. Insulin Glargine Alone Both Added On to Metformin in Type 2 Diabetes (T2DM)"
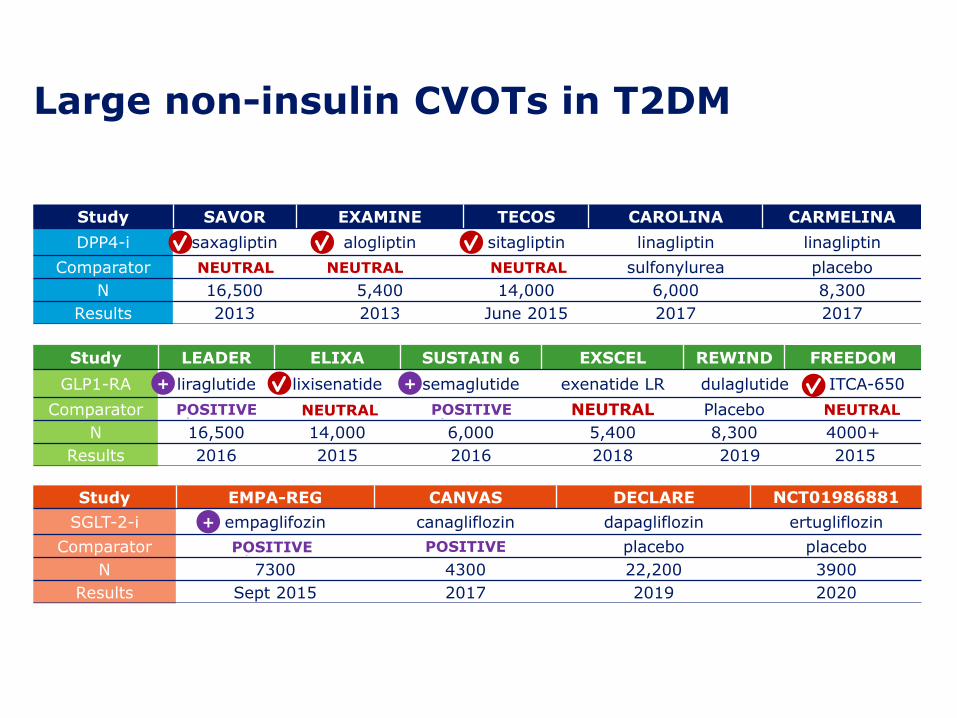
Study SAVOR EXAMINE TECOS CAROLINA CARMELINA
DPP4-i saxagliptin alogliptin sitagliptin linagliptin linagliptin
Comparator placebo placebo placebo sulfonylurea placebo
N 16,500 5,400 14,000 6,000 8,300
Results 2013 2013 June 2015 2017 2017
Study LEADER ELIXA SUSTAIN 6 EXSCEL REWIND FREEDOM
GLP1-RA liraglutide lixisenatide semaglutide exenatide LR dulaglutide ITCA-650
Comparator placebo placebo placebo NEUTRAL Placebo Placebo
N 16,500 14,000 6,000 5,400 8,300 4000+
Results 2016 2015 2016 2018 2019 2015
Study EMPA-REG CANVAS DECLARE NCT01986881
SGLT-2-i empaglifozin canagliflozin dapagliflozin ertugliflozin
Comparator placebo POSITIVE placebo placebo
N 7300 4300 22,200 3900
Results Sept 2015 2017 2019 2020
Large non-insulin CVOTs in T2DM
NEUTRAL NEUTRAL NEUTRAL
NEUTRAL
+ +
NEUTRAL
+
POSITIVE
POSITIVEPOSITIVE
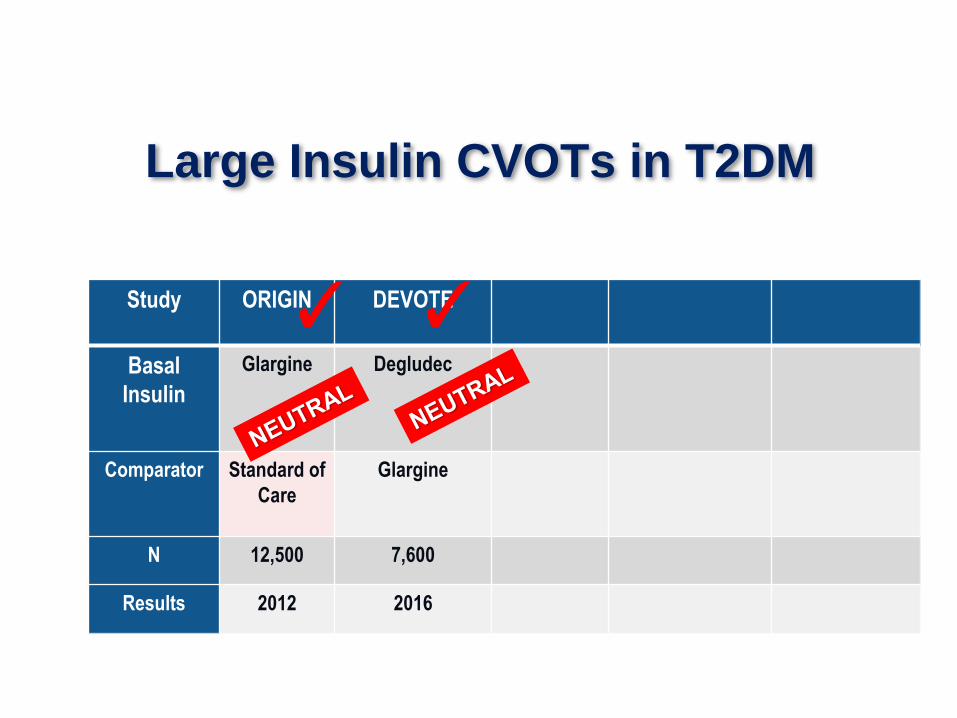
Study ORIGIN DEVOTE
Basal
Insulin
Glargine Degludec
Comparator Standard of
Care
Glargine
N 12,500 7,600
Results 2012 2016
Large Insulin CVOTs in T2DM
✓ ✓
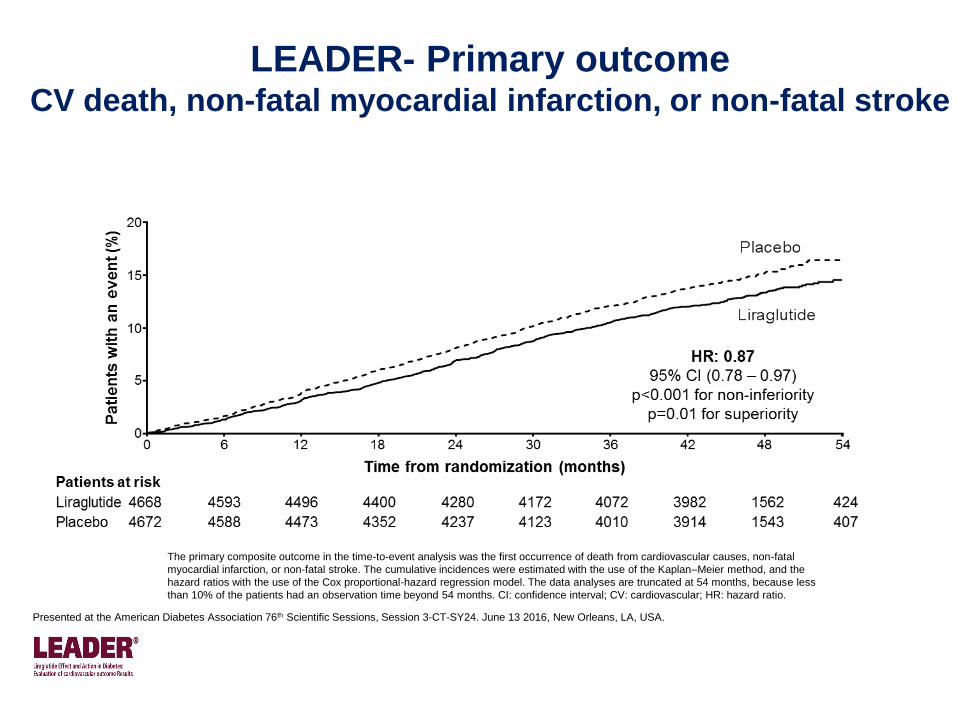
LEADER- Primary outcomeCV death, non-fatal myocardial infarction, or non-fatal stroke
The primary composite outcome in the time-to-event analysis was the first occurrence of death from cardiovascular causes, non-fatal
myocardial infarction, or non-fatal stroke. The cumulative incidences were estimated with the use of the Kaplan–Meier method, and the
hazard ratios with the use of the Cox proportional-hazard regression model. The data analyses are truncated at 54 months, because less
than 10% of the patients had an observation time beyond 54 months. CI: confidence interval; CV: cardiovascular; HR: hazard ratio.
Presented at the American Diabetes Association 76th Scientific Sessions, Session 3-CT-SY24. June 13 2016, New Orleans, LA, USA.
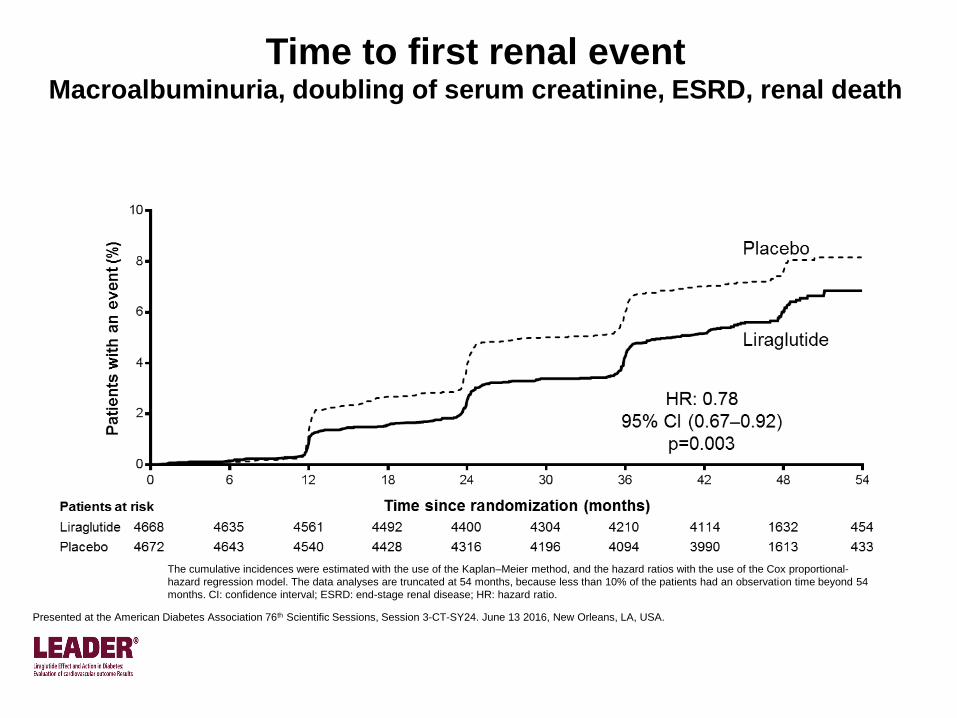
Time to first renal eventMacroalbuminuria, doubling of serum creatinine, ESRD, renal death
The cumulative incidences were estimated with the use of the Kaplan–Meier method, and the hazard ratios with the use of the Cox proportional-
hazard regression model. The data analyses are truncated at 54 months, because less than 10% of the patients had an observation time beyond 54
months. CI: confidence interval; ESRD: end-stage renal disease; HR: hazard ratio.
Presented at the American Diabetes Association 76th Scientific Sessions, Session 3-CT-SY24. June 13 2016, New Orleans, LA, USA.
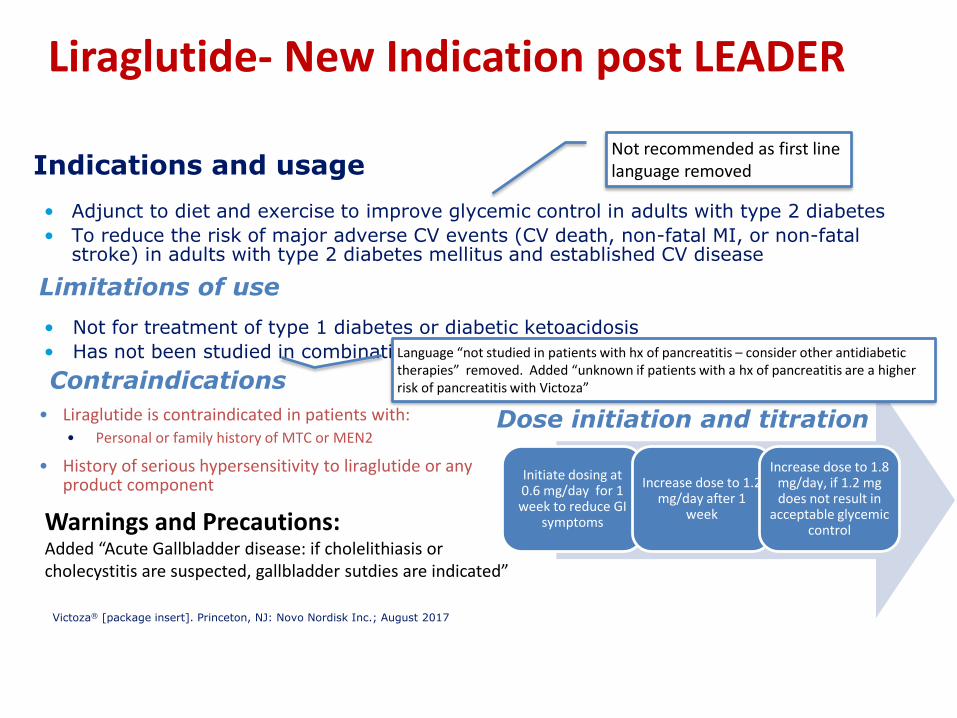
• Adjunct to diet and exercise to improve glycemic control in adults with type 2 diabetes
• To reduce the risk of major adverse CV events (CV death, non-fatal MI, or non-fatal stroke) in adults with type 2 diabetes mellitus and established CV disease
• Not for treatment of type 1 diabetes or diabetic ketoacidosis
• Has not been studied in combination with prandial insulin
Indications and usage
Victoza® [package insert]. Princeton, NJ: Novo Nordisk Inc.; August 2017
Contraindications
• Liraglutide is contraindicated in patients with:• Personal or family history of MTC or MEN2
• History of serious hypersensitivity to liraglutide or any product component
Initiate dosing at 0.6 mg/day for 1 week to reduce GI
symptoms
Increase dose to 1.2 mg/day after 1
week
Increase dose to 1.8 mg/day, if 1.2 mg does not result in
acceptable glycemic control
Dose initiation and titration
Limitations of use
Not recommended as first line language removed
Language “not studied in patients with hx of pancreatitis – consider other antidiabetic therapies” removed. Added “unknown if patients with a hx of pancreatitis are a higher risk of pancreatitis with Victoza”
Warnings and Precautions: Added “Acute Gallbladder disease: if cholelithiasis or cholecystitis are suspected, gallbladder sutdies are indicated”
Liraglutide- New Indication post LEADER
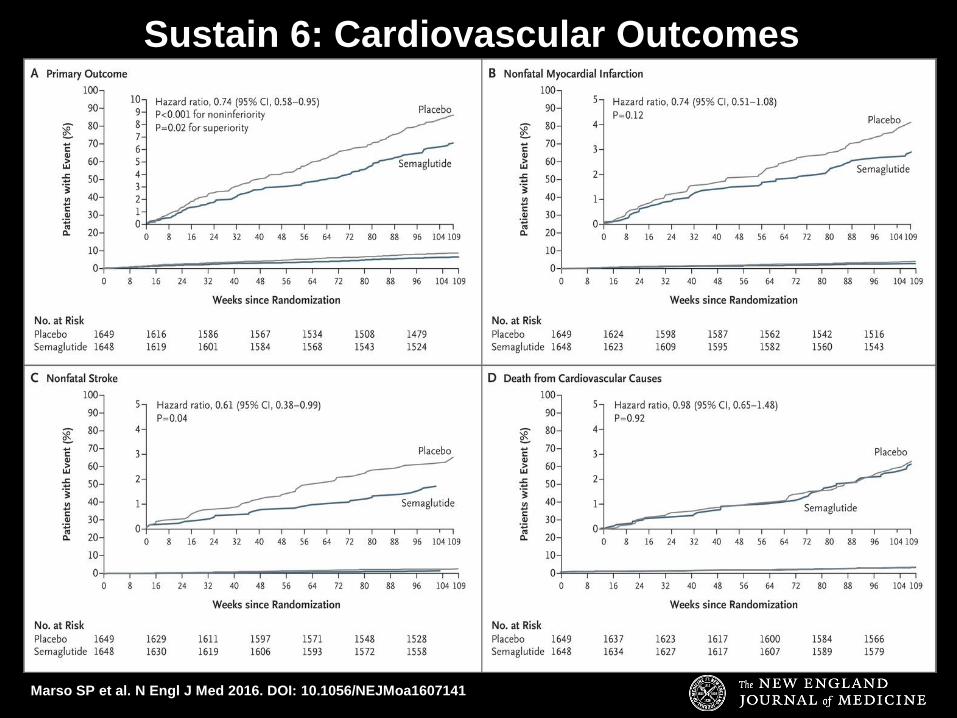
Marso SP et al. N Engl J Med 2016. DOI: 10.1056/NEJMoa1607141
Sustain 6: Cardiovascular Outcomes
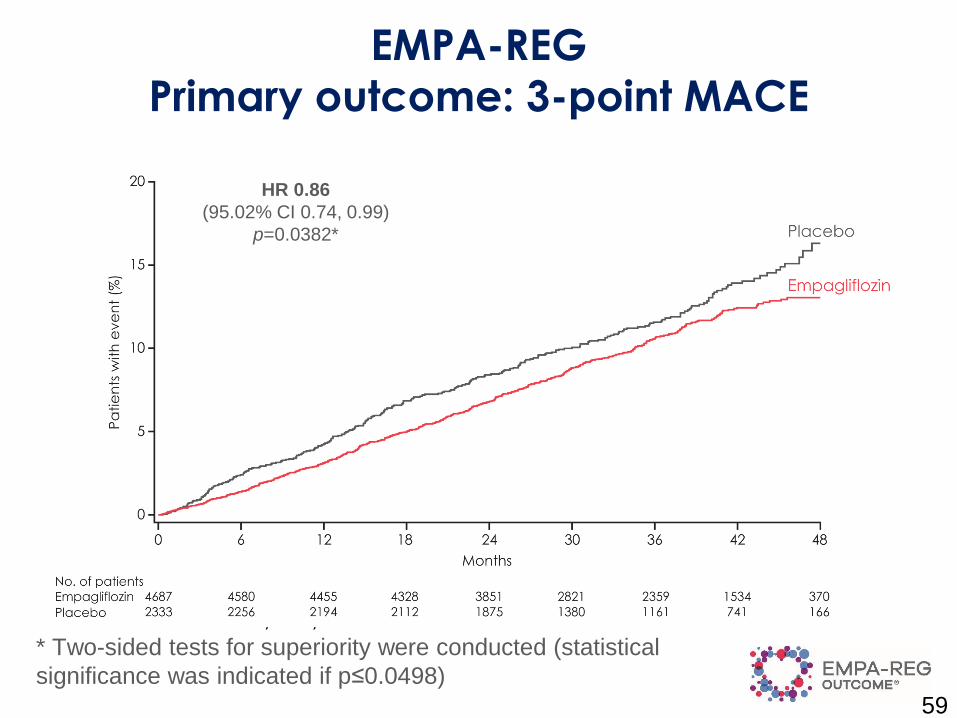
EMPA-REG
Primary outcome: 3-point MACE
59
HR 0.86
(95.02% CI 0.74, 0.99)
p=0.0382*
Cumulative incidence function. MACE, Major Adverse
Cardiovascular Event; HR, hazard ratio.
* Two-sided tests for superiority were conducted (statistical
significance was indicated if p≤0.0498)
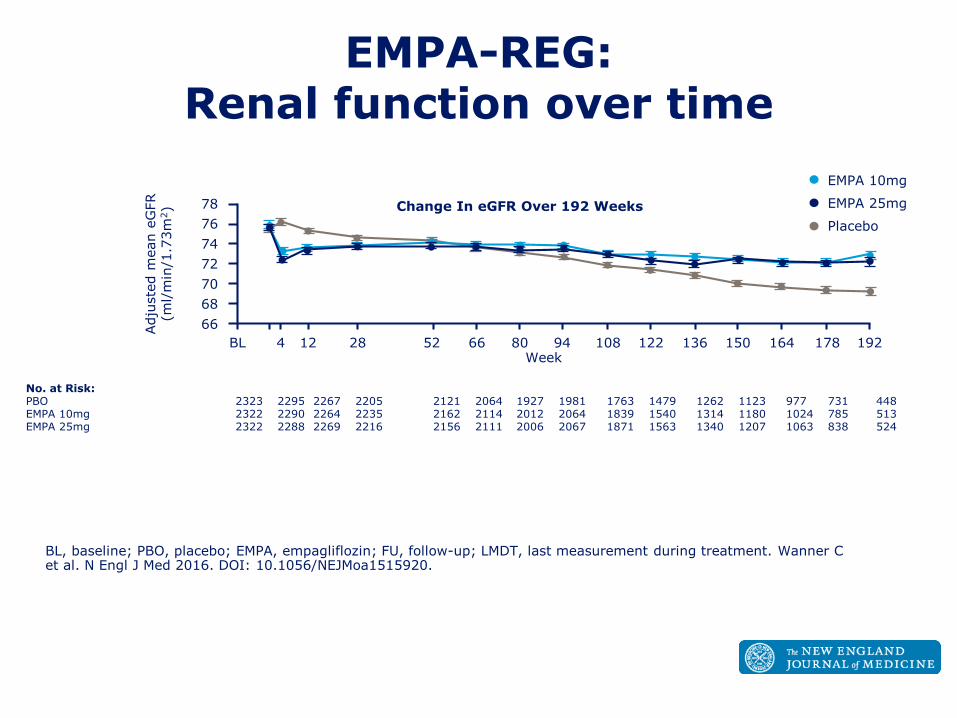
EMPA-REG: Renal function over time
BL, baseline; PBO, placebo; EMPA, empagliflozin; FU, follow-up; LMDT, last measurement during treatment. Wanner C et al. N Engl J Med 2016. DOI: 10.1056/NEJMoa1515920.
78
76
74
72
70
68
66
BL 4 12 28 52 66 80 94 108 122 136 150 164 178 192Week
Adju
ste
d m
ean e
GFR
(ml/
min
/1.7
3m
2) Change In eGFR Over 192 Weeks
No. at Risk:PBO 2323 2295 2267 2205 2121 2064 1927 1981 1763 1479 1262 1123 977 731 448EMPA 10mg 2322 2290 2264 2235 2162 2114 2012 2064 1839 1540 1314 1180 1024 785 513EMPA 25mg 2322 2288 2269 2216 2156 2111 2006 2067 1871 1563 1340 1207 1063 838 524
Placebo
EMPA 10mg
EMPA 25mg
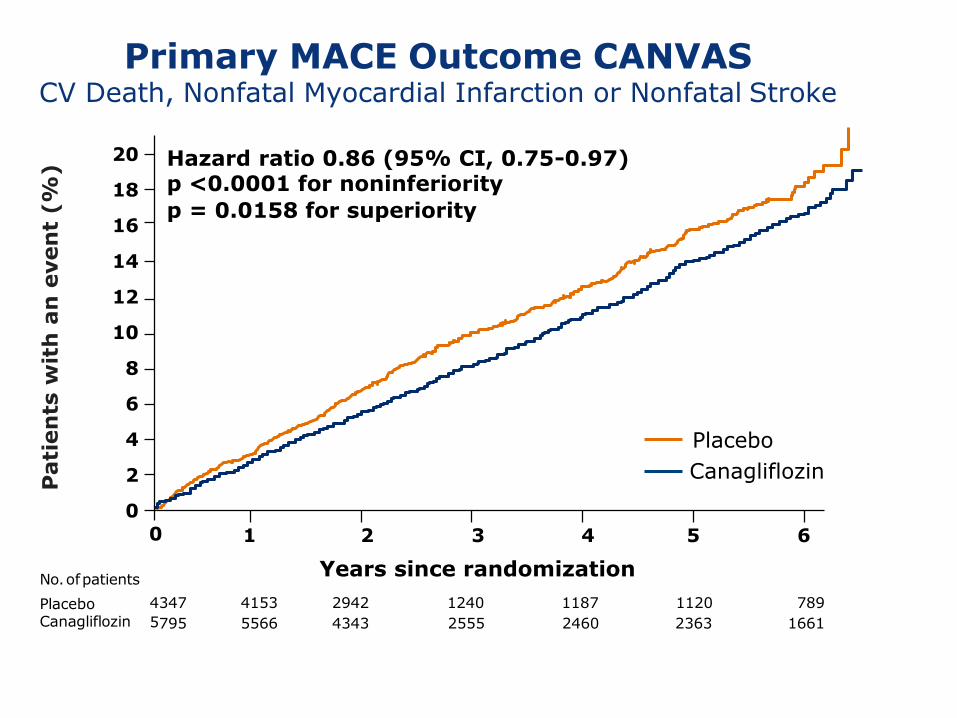
Primary MACE Outcome CANVASCV Death, Nonfatal Myocardial Infarction or Nonfatal Stroke
2 3 4
Years since randomization
5 61
Hazard ratio 0.86 (95% CI, 0.75-0.97) p <0.0001 for noninferiority
p = 0.0158 for superiority
20
18
16
14
12
10
8
6
4
2
0
0
Pati
en
tsw
ith
an
even
t (%
)
Placebo
Canagliflozin
No.ofpatients
Placebo 4
Canagliflozin 5
347 4153 2942 1240 1187 1120 789
795 5566 4343 2555 2460 2363 1661
Intent-to-treat analysis
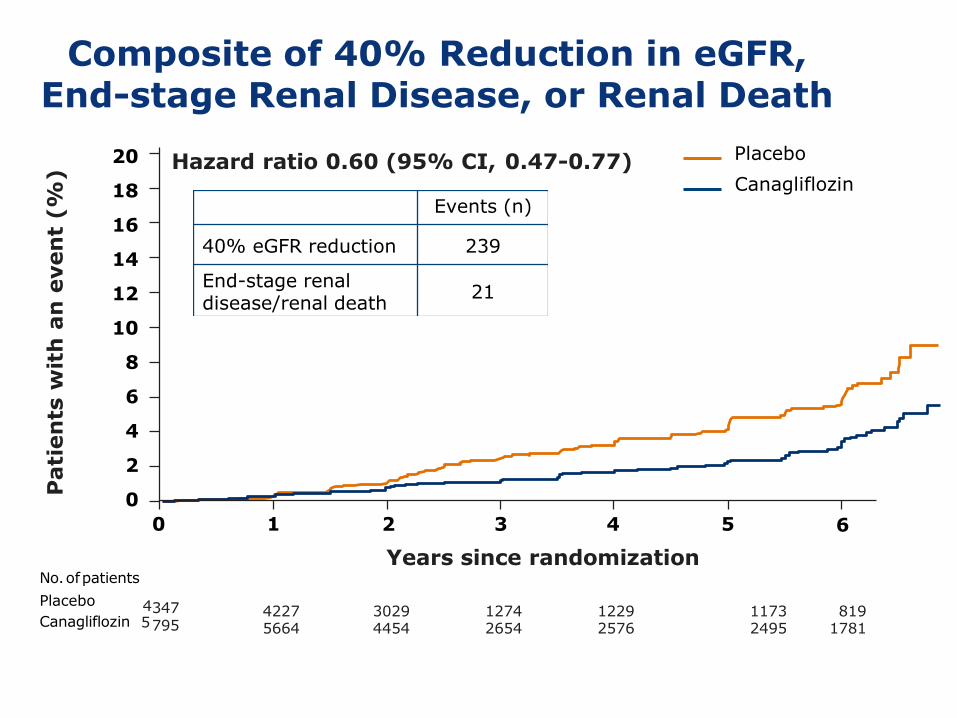
Composite of 40% Reduction in eGFR, End-stage Renal Disease, or Renal Death
4227 3029 1274 1229 1173 8195664 4454 2654 2576 2495 1781
347795
Hazard ratio 0.60 (95% CI, 0.47-0.77)
Events (n)
40% eGFR reduction 239
End-stage renaldisease/renal death
21
Intent-to-treat analysis
No.ofpatients
Placebo 4Canagliflozin 5
0 1 5 6
20
18
16
14
12
10
8
6
4
2
0
2 3 4
Years since randomization
Pati
en
tsw
ith
an
even
t (%
)
Placebo
Canagliflozin
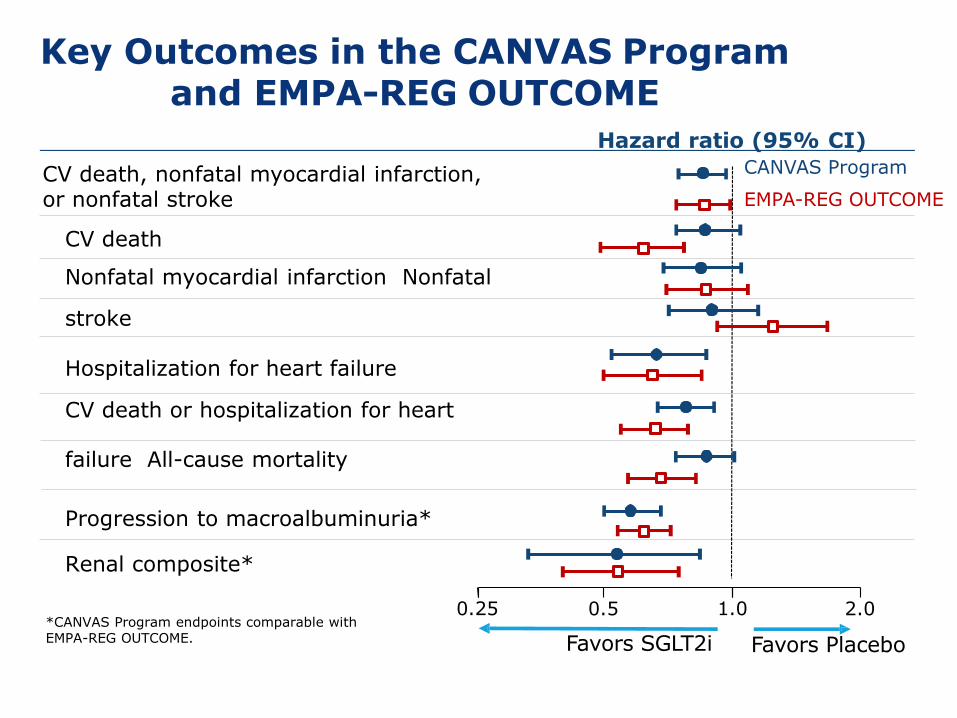
Hazard ratio (95% CI)
1.0 2.0
Favors Placebo
0.5
Favors SGLT2i
CV death, nonfatal myocardial infarction, or nonfatal stroke
Key Outcomes in the CANVAS Programand EMPA-REG OUTCOME
*CANVAS Program endpoints comparable with EMPA-REG OUTCOME.
0.25
Zinman Bet al. N Engl J Med. 2015 ;373(22):2117-2128. Wanner K et al. N Engl J Med. 2016;375(4):323-334.
CANVAS Program
EMPA-REG OUTCOME
CV death
Nonfatal myocardial infarction Nonfatal
stroke
Hospitalization for heart failure
CV death or hospitalization for heart
failure All-cause mortality
Progression to macroalbuminuria*
Renal composite*
Kosiborod M et al. Circulation. 2017; doi.org/10.1161/CIRCULATIONAHA.117.029190
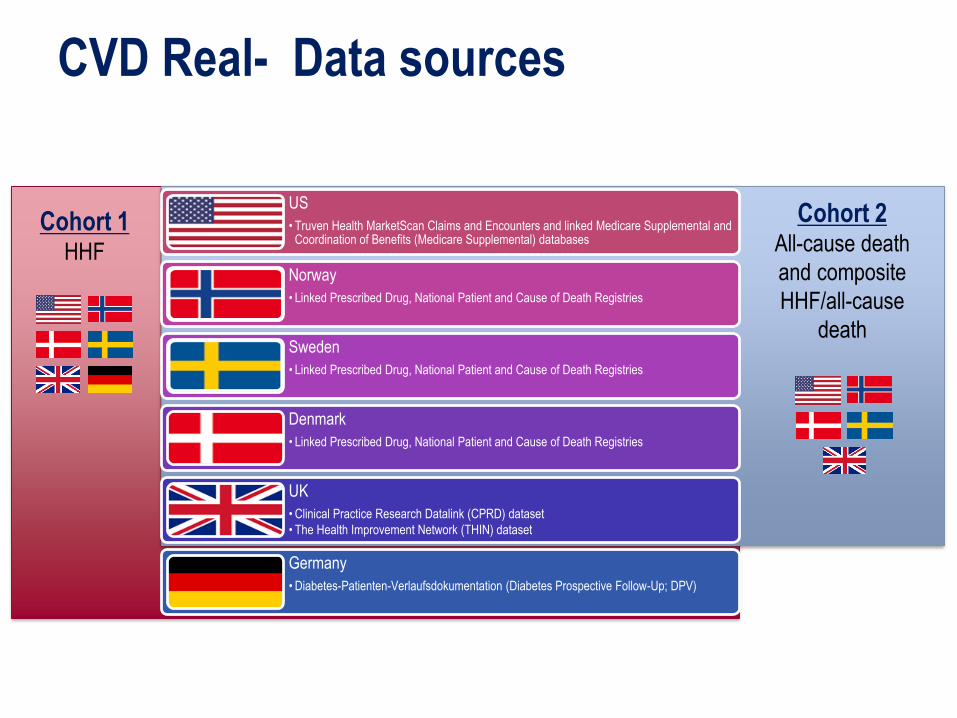
CVD Real- Data sources
Cohort 2All-cause death
and composite
HHF/all-cause
death
Cohort 1HHF
US
• Truven Health MarketScan Claims and Encounters and linked Medicare Supplemental and Coordination of Benefits (Medicare Supplemental) databases
Norway
• Linked Prescribed Drug, National Patient and Cause of Death Registries
Sweden
• Linked Prescribed Drug, National Patient and Cause of Death Registries
Denmark
• Linked Prescribed Drug, National Patient and Cause of Death Registries
UK
• Clinical Practice Research Datalink (CPRD) dataset
• The Health Improvement Network (THIN) dataset
Germany
• Diabetes-Patienten-Verlaufsdokumentation (Diabetes Prospective Follow-Up; DPV)
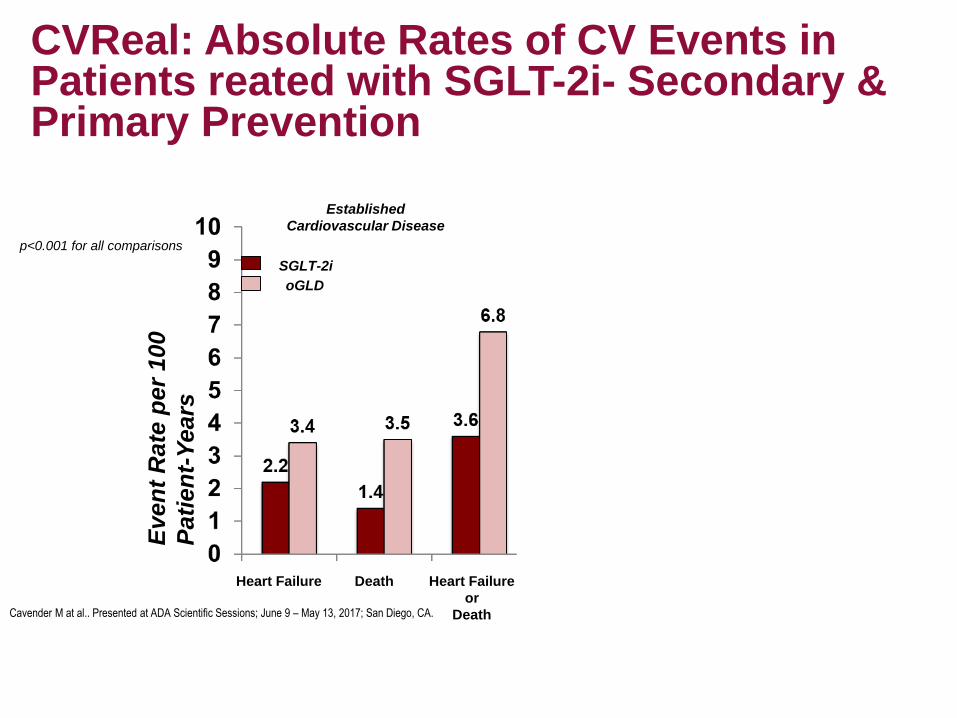
Even
t R
ate
per
100
Pati
en
t-Y
ears
Established
Cardiovascular Disease
Heart Failure Heart Failure Heart Failure
or
Death
Heart Failure
or
Death
Death Death
No Known
Cardiovascular Disease
p<0.001 for all comparisons
SGLT-2i
oGLDSGLT-2i
oGLD
CVReal: Absolute Rates of CV Events in Patients reated with SGLT-2i- Secondary & Primary Prevention
Cavender M at al.. Presented at ADA Scientific Sessions; June 9 – May 13, 2017; San Diego, CA.
Summary: DM Contemporary Care
• Identify individual treatment goals
• Institute personalized comprehensive care for people with diabetes
▪Start intensive lifestyle modification for glycemic control while concomitantly starting medications
▪Choose medications based on safety, efficacy and characteristics
▪Monitor every three months intensify/advance treatment as needed
• Per the AACE Algorithm Consider GLP1ra and SGLT2i as first options with metformin based on safety efficacy in reducing glucose and positive effect on CV risk parameters especially weight and blood pressure
66

THANK YOU QUESTIONS?