Embed Size (px)
Citation preview

BCT Management Services Cost Allocation Process January 17, 2011
ADVISORY SERVICES
Submitted By: Gordon S. Gunn, CA, CISA, CMC [email protected]

Disclaimer KPMG LLP, the audit, tax and advisory firm (kpmg.ca), a Canadian limited liability partnership established under the laws of Ontario, is the Canadian member firm of KPMG International Cooperative (“KPMG International”). KPMG International’s member firms have 140,000 professionals, including more than 7,900 partners, in 146 countries.
The independent member firms of the KPMG network are affiliated with KPMG International, a Swiss entity. Each KPMG firm is a legally distinct and separate entity, and describes itself as such.
© 2010 KPMG LLP, a Canadian limited liability partnership and a member firm of the KPMG network of independent member firms affiliated with KPMG International Cooperative (“KPMG International”), a Swiss entity. All rights reserved. Printed in Canada.
Table of Contents
Executive Summary 1
Background 1 Key Findings and Conclusions 1 Key Recommendations 3
Background 5
BC Transit 5 Regional Transit System (RTS) 5 Evolving Mandate 6 BCT Management Services 6 Historical Cost Analysis 7 Legal and Regulatory Environment 10 Cost Allocation Process 11
Scope and Objectives 14
Objectives 14 Scope 14
Findings, Conclusions and Recommendations 15
Process Efficacy 15 Process Maturity 16 Regulatory Constraint 17 Recommendations 17
Appendix A – BCT Management Services 19 Appendix B – Process Flowcharts 26 Appendix C – Reference Materials 29 Appendix D - Detailed Findings, Conclusions and Recommendations 32
Process Governance 32 Estimating Management Service Costs 33 Applying Cost Drivers 34 Allocating Costs to Regional Transit Systems 37 Final Cost Allocations 39 Other Issues 39

Page 1
Executive Summary
Background
British Columbia Transit (“BCT”) is the provincial crown agency charged with coordinating the
delivery of public transportation throughout British Columbia (outside Metro Vancouver). BCT
manages and operates the Victoria Regional Transit System (“VRTS”), and plans, funds,
manages, markets, and contracts for transit systems in more than 50 British Columbia local
governments in the Regional Transit System (“RTS”).
BCT provides a wide range of management services that benefit all of the regional transit
systems in the province. The types of management services offered by BCT have evolved
over time in response to changes in strategic and operational priorities. In recent years, a shift
towards a shared services model has resulted in increased coordination and a greater range of
shared services.
All costs associated with the provision of management services, both for the VRTS and for the
RTS are initially accounted for in cost centres of the VRTS. The BCT Management Services
Cost Allocation process (the “Process”) is used annually to identify and allocate shared
services costs from the VRTS cost centres to the 81 individual systems within the RTS.
BCT engaged KPMG to conduct an independent review of the Process to determine whether
it is appropriately designed and implemented to meet the needs of the organization and to
provide recommendations for enhancement and/or modifications with respect to the
governance and/or efficacy of the existing process.
The attached report presents our detailed findings, conclusions and recommendations with
respect to the Process. In this Executive Summary, we present our key findings, conclusions
and recommendations.
Key Findings and Conclusions
Based upon our review, we have identified the following key findings and conclusions with
respect to the Process.
Since 2003/04, BCT shared service costs have grown at 13.7% per annum, a faster rate
than the increase in Direct Operating Expenses (DOE), which grew at 10.6% per annum.
The increase in shared service costs reflects an internal trend towards increasing the
range and extent of shared management services.
The Process has evolved over time, reflecting a gradual shift from an incremental cost
approach to a shared services approach. In the incremental approach, only those costs

Page 2
incremental to the needs of the VRTS were identified and allocated to the RTS. In the
shared services approach, all shared service costs are identified and allocated to the
respective systems based upon the general use of services. This shift in approach has
resulted in increased cost allocations to the RTS in recent years.
While shared service costs were increasing over the past eight years, the sharing of
these costs between the VRTS and RTS has not been consistent. As shown in the
adjacent chart, the portion of the
increases allocated between the
systems varied significantly each
year. We found some indications
to suggest that allocations to the
RTS were understated between
2004/05 – 2007/08, which required
a dramatic catch-up to occur in the
past three years. It is our
conclusion that the Process may
have been biased towards
understating the management
service costs to the RTS, at the expense of the VRTS. It is our conclusion that recent
changes to the Process have reduced, but not eliminated, this potential for bias.
There are opportunities to enhance the maturity of the Process. Process maturity reflects
the level of standardization and repeatability of a process. The following diagram reflects
our assessment of the current maturity of the process and our assessment of how
mature the process should be, given its importance to BCT.
0 1 2 3 4 5
Non-Existent Initial Repeatable Defined Managed Optimized
Current State Assessment Future State
Process Maturity
There are a number of opportunities to enhance the standardization and repeatability of
the Process. Cost allocation is an estimation process and no cost allocation methodology
is perfect. The selection of an appropriate cost allocation methodology should be based
upon values and principles appropriate to the organization. In assessing the Process, we
concluded that the Process reflects a preference for practicality over equity, and
externalities over economic efficiency.

Page 3
The Process currently reflects a balance between four competing values. In the absence
of explicit value statements, we have assumed that this balance represents the
organization’s values for the
Process. While opportunities
exist to adjust this balance, trade-
offs must be considered in
pursuing these opportunities. For
example, the equity and
economic efficiency of the
Process could be enhanced by
using more specific cost drivers,
but this would be achieved at the
expense of practicality. While it
is possible to enhance the cost
drivers used in the Process, it is likely that costly changes would be required to
information systems and business processes in order to provide the necessary data on
cost drivers.
The cost allocations to the RTS are approaching the maximum limit (8% of DOE) set in
the British Columbia Transit Regulation (the “Regulation”). The cap is both a real and
psychological constraint on the Process. As BCT continues to expand its range of
management services, the cap may soon pose a significant constraint on the Process.
Key Recommendations
To address our key findings and conclusions, we offer the following recommendations.
To enhance the maturity of the BCT Management Services Cost Allocation process,
we recommend that BCT:
Formally document the Process as a BCT policy or procedure;
Formally acknowledge ownership of the Process;
Document the underlying values guiding the Process;
Have cost drivers annually reviewed and signed off by Cost Centre managers; and
Document a process for the ongoing maintenance of the policy or procedure.
To enhance the efficacy of the Process, we recommend that BCT:
Clarify whether the cost allocations should be based upon the preliminary budget estimates, final budget estimates or actual final costs;
Consider whether cost allocations should be performed at the Cost Centre or Account level;
Consider whether cost drivers should be more reflective of economic efficiencies;
Review the appropriateness of the current cost drivers;
Equity
Practicality
ExternalitiesEconomic Efficiency BCT
Diagram 1BCT Management Services Cost Allocation Process
A 2‐Dimensional Values Continuum
Page 4
Provide guidance on calculation rounding; and
Document any established processes for using a tiered-approach in applying the cost allocations to individual regional transit systems.
We recommend that BCT consider the need for changes to Sections 8(1)(a)(iv) and
8(1)(b)(iv) of the British Columbia Transit Regulation with respect to the 8% cap
placed on the BCT Management Services cost allocation to municipally-operated
systems.

Page 5
Background
BC Transit
British Columbia Transit (“BCT”) is the provincial crown agency charged with coordinating the
delivery of public transportation throughout British Columbia (outside Metro Vancouver). The
corporation's mandate, as set out in the British Columbia Transit Act, is:
"to plan, acquire, construct or cause to be constructed public passenger
transportation systems and rail systems that support regional growth strategies,
official community plans, and the economic development of transit service areas",
[and] "to provide for the maintenance and operation of those systems".
BCT manages and operates the Victoria Regional Transit System (“VRTS”), and plans, funds,
manages, markets, and contracts for transit systems in 57 British Columbia local governments
in the Regional Transit System (“RTS”).
The scope of BCT operations encompasses the following:
57 local government partners, the Victoria Regional Transit Commission and regional
hospital districts;
Contracts with 27 private management companies and 14 non-profit agencies;
Over 50 million passengers carried annually;
More than 1.5 million people served in B.C.;
81 transit systems – conventional, custom and paratransit;
Fleet of 1,043 conventional and double-deck buses, minibuses and vans; and
$294 million annual operating budget.
Regional Transit System (RTS)
The RTS was first established in 1979. In partnership with local government, this program
provides for planning, marketing, fleet management, funding and contracting for transit
services in BC that are outside of Metro Vancouver and Greater Victoria.
The RTS has evolved since its inception in 1979. Growth in B.C. communities has been
matched by the growth in the number of transit systems from 13 in 1979 to 81 systems (25
conventional, 17 Custom and 39 para-transit systems) at present. The RTS has initiated and
developed services to improve mobility and accessibility in BC communities. The first door-to-
door service (handyDART) for persons with disabilities began in 1981. Now all buses
Page 6
purchased are fully accessible. These services provide mobility to seniors and persons with a
disability. Transit service to rural areas and small towns has been developed with innovative
approaches to service delivery.
Finally, the RTS is responding to the increasing role expected of transit in our cities. The link
between transit and land use planning is reflected in transit service in the larger regions.
Working with local partners to provide a transit service that fulfils the needs of the community
and ensuring an effective use of public funding are key objectives for transit today.
Evolving Mandate
BCT’s current Strategic Plan supports the Provincial Transit Master Plan and highlights the
evolution of the organization’s public mandate. This evolution is having a significant impact on
the level of shared management services provided by BCT. The Strategic Plan notes the
following changes to the organization’s mandate:
Improving community social, economic, and financial sustainability through the provision
of effective transit while simultaneously reducing transportation costs, energy
consumption, and social costs;
Leading provincial public transit climate change initiatives by increasing the proportion of
people who use public transit as their primary means to get around;
Supporting rural and First Nations communities by enabling residents to connect to each
other and link to education, health, and other services and daily needs; and
Improving the inclusiveness of communities by providing a range of public transit services
and amenities designed to meet standards of universal accessibility. These services
enable people to grow older while remaining in their own homes and communities for as
long as possible.
In considering the impact of the evolution of the mandate, BCT management has identified
the need to revise legislation, governance structures, and revenue constraints.
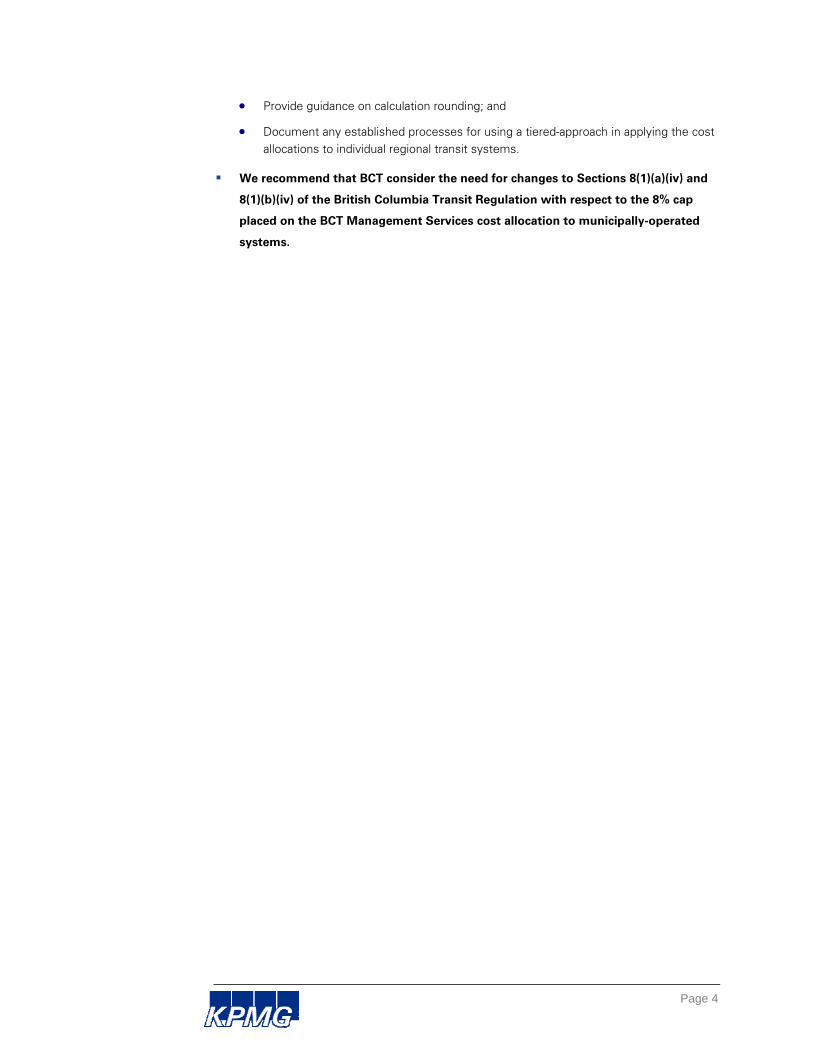
BCT Management Services
BCT provides a wide range of management services that benefit all of the regional transit
systems in the province. The full range of shared management services is described in
Appendix A to this report.
The types of shared management services offered by BCT have evolved over time in
response to changes in strategic and operational priorities. In recent years, a shift towards a
shared services model has resulted in increased coordination and an increase in the provision
of shared services.
In most regional transit systems, service is provided through a partnership between BCT, local
government, and a transit management company. Under this partnership model, BC Transit
provides funding, planning, marketing, fleet management, and contract administration services

Page 7
for each system. Sponsoring local governments provide the remaining portion of funding (less
passenger fares), approve service levels and fare structures.
A contracted transit management company operates the service, including hiring and training
drivers, providing front-line customer service, and maintaining vehicles. A range of private and
non-profit companies operate BC Transit’s services. In some locations—the Regional District
of Nanaimo, City of Nelson, City of Powell River, and the Sunshine Coast Regional District—
the sponsoring local government operates the system.
In the case of the VRTS, BC Transit operates the conventional service, and a private transit
management company operates handyDART services through contract.
BCT’s operation of the Victoria conventional system provides the organization with further
efficiencies through the sharing of services. This in-house operation is also a forum for
developing operational practices that can be shared with other communities.
BCT’s collaborative, shared-services partnership model offers value by:
Pooling expertise and best practices in areas such as planning and financial monitoring;
Lowering costs through bulk purchase of supplies and assets, such as fuel and vehicles;
Providing a framework to oversee and invest in transit on a provincial scale rather than on
a less collaborative municipality by municipality basis common elsewhere;
Supporting operational efficiency through private sector contracts for the operation of
many of our systems; and
Providing access to senior government and other funding sourcing.
Historical Cost Analysis
The following tables draw upon management information to present an historical overview of
the BCT Management Services Cost Allocation.
Chart 1 shows the growth in
VRTS Direct Costs and Shared
Service Costs over the past
eight years. Direct Costs grew
74% over the eight years, a
growth rate of 9.2%/year.
Shared Service costs grew by
110% or 13.7%/year during this
period.
$-
$10,000,000
$20,000,000
$30,000,000
$40,000,000
$50,000,000
$60,000,000
$70,000,000
03/04 04/05 05/06 06/07 07/08 08/09 09/10 10/11
Chart 1VRTS Direct Costs + Shared Service
Costs (Before Allocation)
Direct Costs Management Service Costs
Page 8
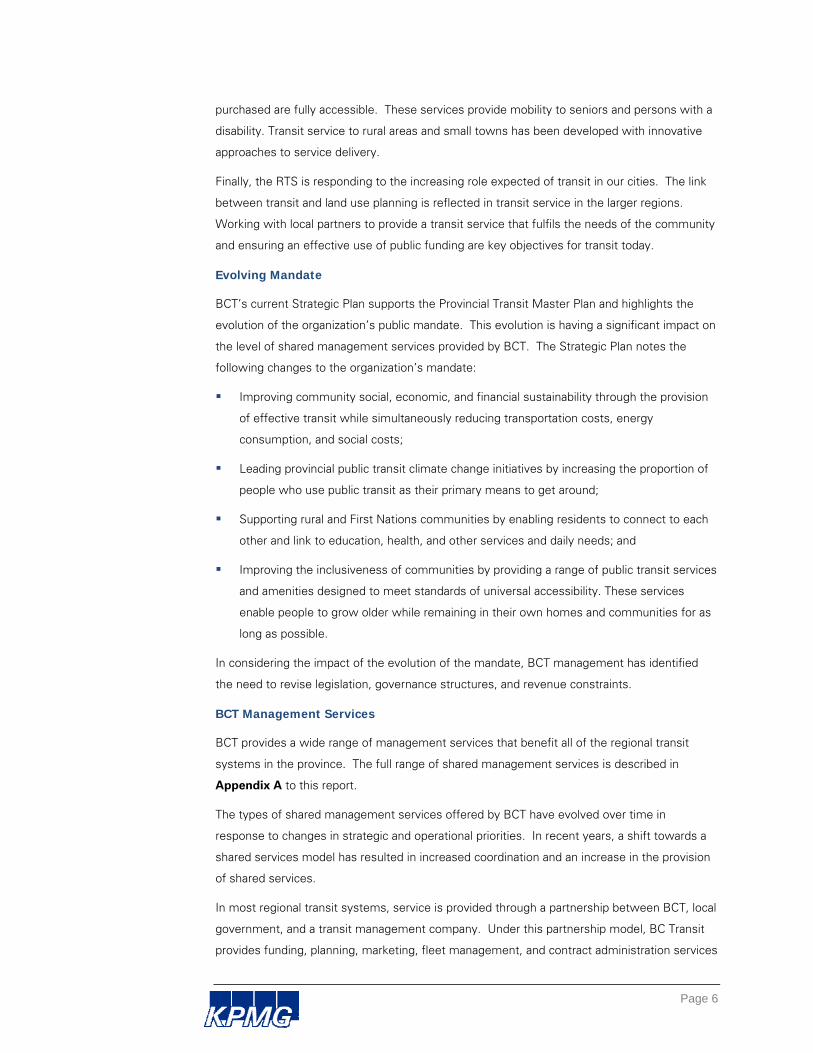
Chart 2 reflects the total BCT
shared service costs over the
past eight years. The range and
costs of BCT shared
management services have
grown significantly, increasing
from $10.8 million in 2003/04 to
$22.6 million by 2010/11.
In Chart 3, we can see that the
allocation of shared service
costs to both the VRTS and the
RTS grew over the period. The
VRTS allocation grew by 100%
over the eight years, compared
to a growth of 136% in the RTS
allocation. Increases to the RTS
were modest in the first four
years (13%), with the significant
portion of the increase occurring
thereafter.
Chart 4 reflects the percentage
of total shared service costs
allocated to the VRTS and the
RTS. For the VRTS, the
allocation ranged from 67% to
71% while the allocations to the
RTS ranged from 23% to 32%.
$10,000,000
$12,000,000
$14,000,000
$16,000,000
$18,000,000
$20,000,000
$22,000,000
$24,000,000
Chart 2BCT Shared Service Costs
2003/04 - 2010/11
$-$2,000,000 $4,000,000 $6,000,000 $8,000,000
$10,000,000 $12,000,000 $14,000,000 $16,000,000 $18,000,000
Chart 3Allocation of Shared Service Costs
Allocation of Management Service Costs to RTSP
Allocation of Management Service Costs to VRTS
20.00%
30.00%
40.00%
50.00%
60.00%
70.00%
80.00%
Chart 4Allocation of Shared Service Costs
% of Shared Service Costs Allocated to RTSP
% of Shared Service Costs Allocated to VRTS
Page 9
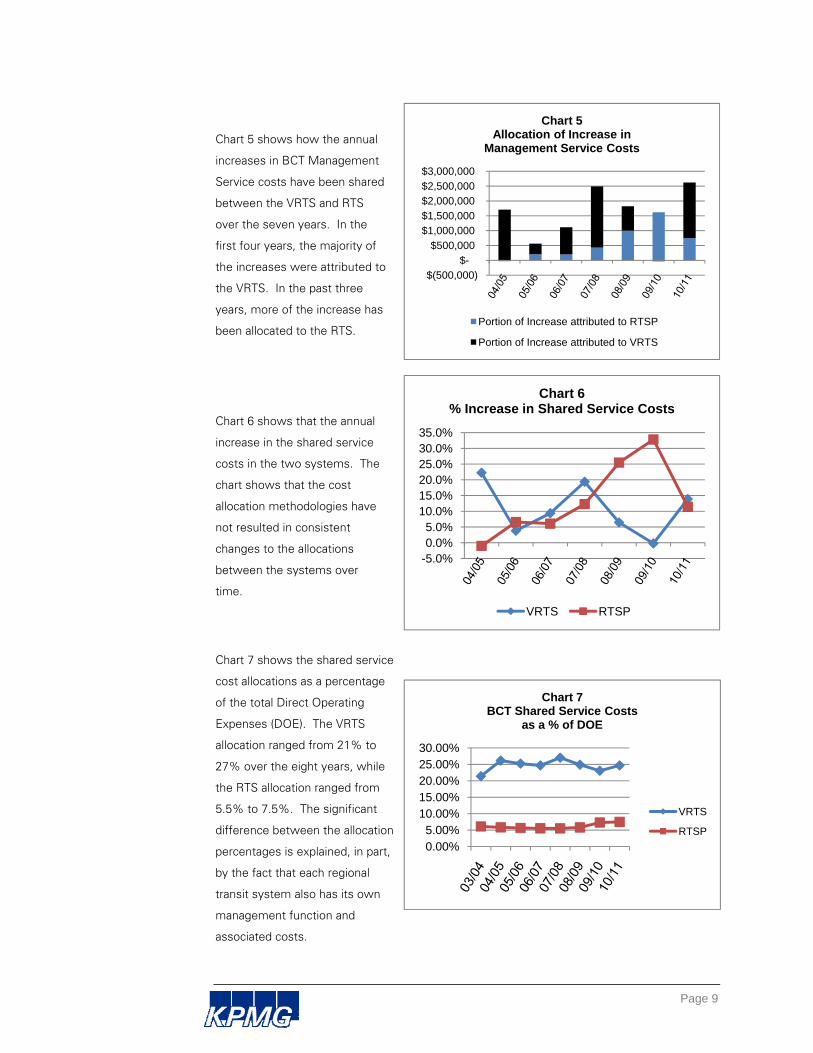
Chart 5 shows how the annual
increases in BCT Management
Service costs have been shared
between the VRTS and RTS
over the seven years. In the
first four years, the majority of
the increases were attributed to
the VRTS. In the past three
years, more of the increase has
been allocated to the RTS.
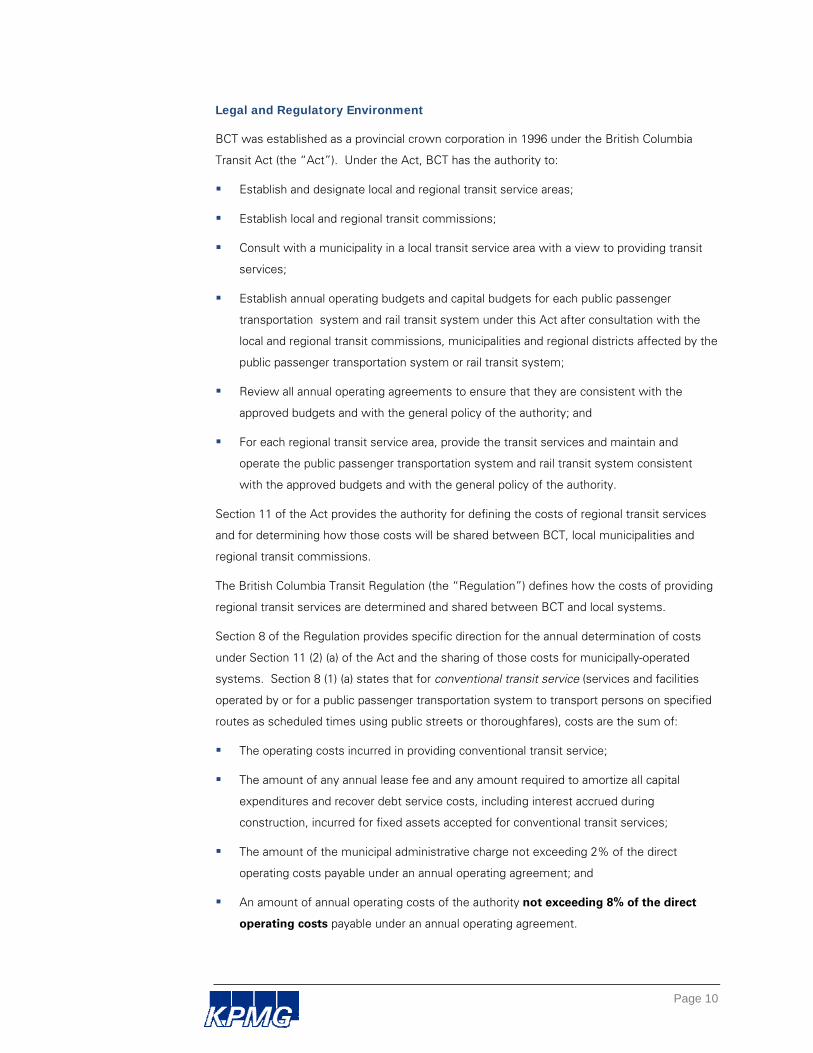
Chart 6 shows that the annual
increase in the shared service
costs in the two systems. The
chart shows that the cost
allocation methodologies have
not resulted in consistent
changes to the allocations
between the systems over
time.
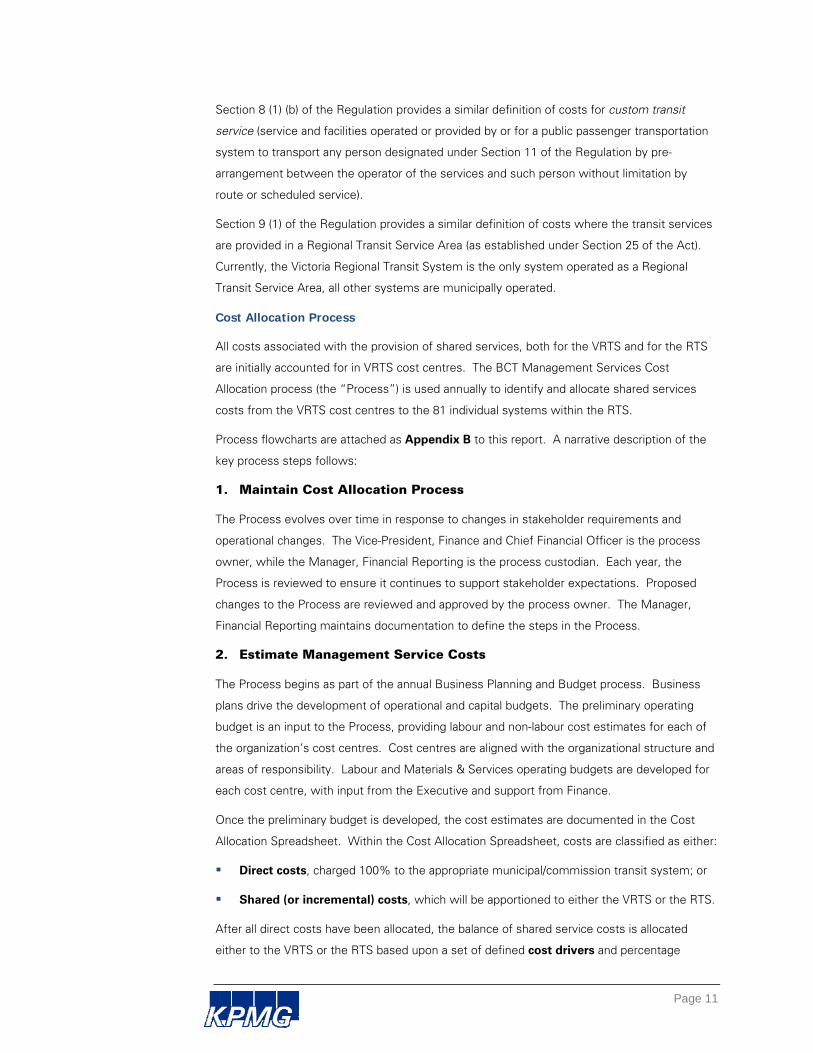
Chart 7 shows the shared service
cost allocations as a percentage
of the total Direct Operating
Expenses (DOE). The VRTS
allocation ranged from 21% to
27% over the eight years, while
the RTS allocation ranged from
5.5% to 7.5%. The significant
difference between the allocation
percentages is explained, in part,
by the fact that each regional
transit system also has its own
management function and
associated costs.
$(500,000)
$-
$500,000
$1,000,000
$1,500,000
$2,000,000
$2,500,000
$3,000,000
Chart 5Allocation of Increase in
Management Service Costs
Portion of Increase attributed to RTSP
Portion of Increase attributed to VRTS
-5.0%0.0%5.0%
10.0%15.0%20.0%25.0%30.0%35.0%
Chart 6% Increase in Shared Service Costs
VRTS RTSP
0.00%5.00%
10.00%15.00%20.00%25.00%30.00%
Chart 7BCT Shared Service Costs
as a % of DOE
VRTS
RTSP
Page 10
Legal and Regulatory Environment
BCT was established as a provincial crown corporation in 1996 under the British Columbia
Transit Act (the “Act”). Under the Act, BCT has the authority to:
Establish and designate local and regional transit service areas;
Establish local and regional transit commissions;
Consult with a municipality in a local transit service area with a view to providing transit
services;
Establish annual operating budgets and capital budgets for each public passenger
transportation system and rail transit system under this Act after consultation with the
local and regional transit commissions, municipalities and regional districts affected by the
public passenger transportation system or rail transit system;
Review all annual operating agreements to ensure that they are consistent with the
approved budgets and with the general policy of the authority; and
For each regional transit service area, provide the transit services and maintain and
operate the public passenger transportation system and rail transit system consistent
with the approved budgets and with the general policy of the authority.
Section 11 of the Act provides the authority for defining the costs of regional transit services
and for determining how those costs will be shared between BCT, local municipalities and
regional transit commissions.
The British Columbia Transit Regulation (the “Regulation”) defines how the costs of providing
regional transit services are determined and shared between BCT and local systems.
Section 8 of the Regulation provides specific direction for the annual determination of costs
under Section 11 (2) (a) of the Act and the sharing of those costs for municipally-operated
systems. Section 8 (1) (a) states that for conventional transit service (services and facilities
operated by or for a public passenger transportation system to transport persons on specified
routes as scheduled times using public streets or thoroughfares), costs are the sum of:
The operating costs incurred in providing conventional transit service;
The amount of any annual lease fee and any amount required to amortize all capital
expenditures and recover debt service costs, including interest accrued during
construction, incurred for fixed assets accepted for conventional transit services;
The amount of the municipal administrative charge not exceeding 2% of the direct
operating costs payable under an annual operating agreement; and
An amount of annual operating costs of the authority not exceeding 8% of the direct
operating costs payable under an annual operating agreement.
Page 11
Section 8 (1) (b) of the Regulation provides a similar definition of costs for custom transit
service (service and facilities operated or provided by or for a public passenger transportation
system to transport any person designated under Section 11 of the Regulation by pre-
arrangement between the operator of the services and such person without limitation by
route or scheduled service).
Section 9 (1) of the Regulation provides a similar definition of costs where the transit services
are provided in a Regional Transit Service Area (as established under Section 25 of the Act).
Currently, the Victoria Regional Transit System is the only system operated as a Regional
Transit Service Area, all other systems are municipally operated.
Cost Allocation Process
All costs associated with the provision of shared services, both for the VRTS and for the RTS
are initially accounted for in VRTS cost centres. The BCT Management Services Cost
Allocation process (the “Process”) is used annually to identify and allocate shared services
costs from the VRTS cost centres to the 81 individual systems within the RTS.
Process flowcharts are attached as Appendix B to this report. A narrative description of the
key process steps follows:
1. Maintain Cost Allocation Process
The Process evolves over time in response to changes in stakeholder requirements and
operational changes. The Vice-President, Finance and Chief Financial Officer is the process
owner, while the Manager, Financial Reporting is the process custodian. Each year, the
Process is reviewed to ensure it continues to support stakeholder expectations. Proposed
changes to the Process are reviewed and approved by the process owner. The Manager,
Financial Reporting maintains documentation to define the steps in the Process.
2. Estimate Management Service Costs
The Process begins as part of the annual Business Planning and Budget process. Business
plans drive the development of operational and capital budgets. The preliminary operating
budget is an input to the Process, providing labour and non-labour cost estimates for each of
the organization’s cost centres. Cost centres are aligned with the organizational structure and
areas of responsibility. Labour and Materials & Services operating budgets are developed for
each cost centre, with input from the Executive and support from Finance.
Once the preliminary budget is developed, the cost estimates are documented in the Cost
Allocation Spreadsheet. Within the Cost Allocation Spreadsheet, costs are classified as either:
Direct costs, charged 100% to the appropriate municipal/commission transit system; or
Shared (or incremental) costs, which will be apportioned to either the VRTS or the RTS.
After all direct costs have been allocated, the balance of shared service costs is allocated
either to the VRTS or the RTS based upon a set of defined cost drivers and percentage
Page 12
allocations. The role of cost drivers within an Activity Based Costing system is explained in
Appendix C. A "cost driver" is the unit of an activity that causes the change of an activity
cost. A cost driver is any activity that causes a cost to be incurred. The portion of shared
service costs charged to the RTS is referred to as the “BCT Management Services Cost
Allocation”.
3. Gather and Apply Cost Drivers
BCT has identified a set of cost drivers which it feels are an appropriate basis for cost
allocation. For the 2010/11 cost allocation, the primary cost drivers utilized were:
The number of BCT staff providing management services (full-time equivalents); and
The number of fleet vehicles.
In addition to the use of cost drivers, some allocations are based upon total direct operating
costs, “use of assets” costs, and total costs (total direct operating costs plus “use of assets”
costs. Finally, some costs are allocated based upon management estimates of the
percentage split of staff resources based on the time spent supporting the VRTS and the RTS.
Each year, the cost drivers are reviewed to ensure that the drivers remain appropriate for cost
allocation purposes. Once the cost drivers are confirmed, current values for each driver are
determined and input to the Cost Allocation Spreadsheet.
4. Review and Finalize Cost Allocations
Once the cost drivers and cost estimates are entered to the Cost Allocation Spreadsheet, the
cost allocations to the VRTS and RTS are automatically calculated. Once the total cost
allocations are determined, they are reviewed by Finance staff and the Chief Financial Officer.
After the review, a preliminary cost allocation is presented to Executive for approval as part of
the overall budget process.
The review considers whether the cost allocations are within the 8% limit established in the
Regulation.
5. Approve Management Services Cost Allocation
The preliminary cost allocation is reviewed and approved by Executive as part of the annual
budgeting process. The allocations are incorporated into the annual operating budget for each
regional system, identified as the BCT Management Services charge.
6. Record Cost Allocations
Once approved, the preliminary cost allocation is broken down into monthly charges and
allocated to regional transit systems by journal voucher.

Page 13
7. Monitor and Adjust Cost Allocations
Throughout the year, Finance staff monitor actual costs against budgeted costs. During a
fiscal year, it is possible that new shared service initiatives may be introduced or other
operational changes may occur which result in a variance between actual and budgeted
shared service costs. When material differences are identified between actual and budgeted
shared services costs, Finance staff will consider the need for an adjustment to the
preliminary cost allocation. If required, a final cost allocation will be determined and additional
charges to regional systems will be initiated.

Page 14
Scope and Objectives
Objectives
The objectives of the project were to:
To conduct an independent review of the BCT Management Services Cost Allocation
process to determine whether it is appropriately designed and implemented to meet the
needs of the organization;
To provide recommendations for enhancement and/or modifications of the BCT
Management Services Cost Allocation process with respect to the governance and/or
efficacy of the existing process.
Scope
The project scope was to review the Process based upon the methodology used in the
2010/11 cost allocation.
Page 15
Findings, Conclusions and Recommendations
In this section, we present our key findings, conclusions and recommendations from the
review of the BCT Management Services Cost Allocation process. Our detailed findings,
conclusions and recommendations are documented in Appendix D. We considered the
appropriate evaluation criteria for the review, the maturity of the underlying process and the
identification of recommendations for enhancing the Process.
Process Efficacy
The primary objective of our review was to determine whether the Process is appropriately
designed and implemented to meet the needs of the organization. We understand that the
general purpose of the Process is to allocate the shared management service costs of BCT in
accordance with Section 8(1) of the BC Transit Regulation. However, the Regulation is not
prescriptive with regards to how the Process is to function, nor is there a formal policy or
procedural document in place that identifies more specific objectives or requirements for the
Process. As a result, we could not draw upon any formal BCT documentation to assist us in
defining evaluation criteria.
As noted in Appendix C, the typical criteria used to evaluate alternative cost attribution
methodologies and cost recovery processes include the following:
Equitythe costs allocated should be equitable in that costs borne by each program or
service should relate to their share of both direct and common costs based on a causal
relationship to the level of activity of the user or user group.
Practicalitythe attribution of costs should be relatively easy to determine and be
flexible enough to accommodate new services or changes in the environment.
Economic Efficiencycosts should be allocated on the basis of causality to the extent
possible.
Externalitiesan attribution of costs to each program or service regardless of their use
of specific systems to the extent that significant benefits are accrued to all members
from these systems.
We applied these typical criteria to the Process and reached the following conclusions with
respect to process efficacy:
The Process reflects each of the values above. The Process reflects an attempt to be
equitable to the VRTS, the RTS and to the individual regional transit systems. At the

Page 16
same time, the Process is a practical approach to cost allocation, drawing upon available
information and is easily applied. The Process considers the need for cost drivers to be
employed as a basis for causality but also reflects that some of the shared services
provided are of a system-wide benefit.
There is a trade-off between equity and practicality. Equity could be enhanced through
changes to processes and systems, but at the expense of practicality. Significant
changes to systems and processes might be required to gather more precise cost driver
information. We concluded that the current Process reflects a slight preference for
practicality over equity.
There is also a trade-off between economic efficiency and externalities. The Process
reflects that while some management services are best attributed based upon a causal
relationship, others are better attributed on the basis of general value to the overall
system. We concluded that the current Process reflects a slight preference for attributing
costs on their overall value to the system versus a more direct causal basis.
It is our experience in the public
sector context that the values
reflected in a process or service
need to be understood against
multiple dimensions to reflect
the complexity of ethical and
value considerations. A useful
tool for reflecting these
dimensions is a Values
Continuum. In the adjacent
diagram, we present a 2-
dimentional values continuum for
the Process. This diagram
reflects our assessment that the
Process is practical and efficient, and is based more on the general value of management
services to the organization than on the individual costing of those services.
Process Maturity
A second evaluation method we applied to the Process was the Capability Maturity Model
(CMM), developed by the Software Engineering Institute (SEI) in the mid-1980’s. While
originally designed to evaluate software development processes, CMM can be used to assess
any process against a scale of process maturity levels, according to its standardization in the
subject area being assessed. The six maturity levels are described in Appendix C.
Diagram 2 reflects our assessment of the maturity of the Process. Our assessment took into
consideration the following findings:
Equity
Practicality
ExternalitiesEconomic Efficiency BCT
Diagram 1BCT Management Services Cost Allocation Process
A 2‐Dimensional Values Continuum
Page 17
While process governance is generally understood, it is not formalized;
The Process is not formally documented, either as a corporate policy or procedure;
Management’s objectives for the process are understood, but nor formally documented;
and
Some steps in the Process involve the use of judgment;
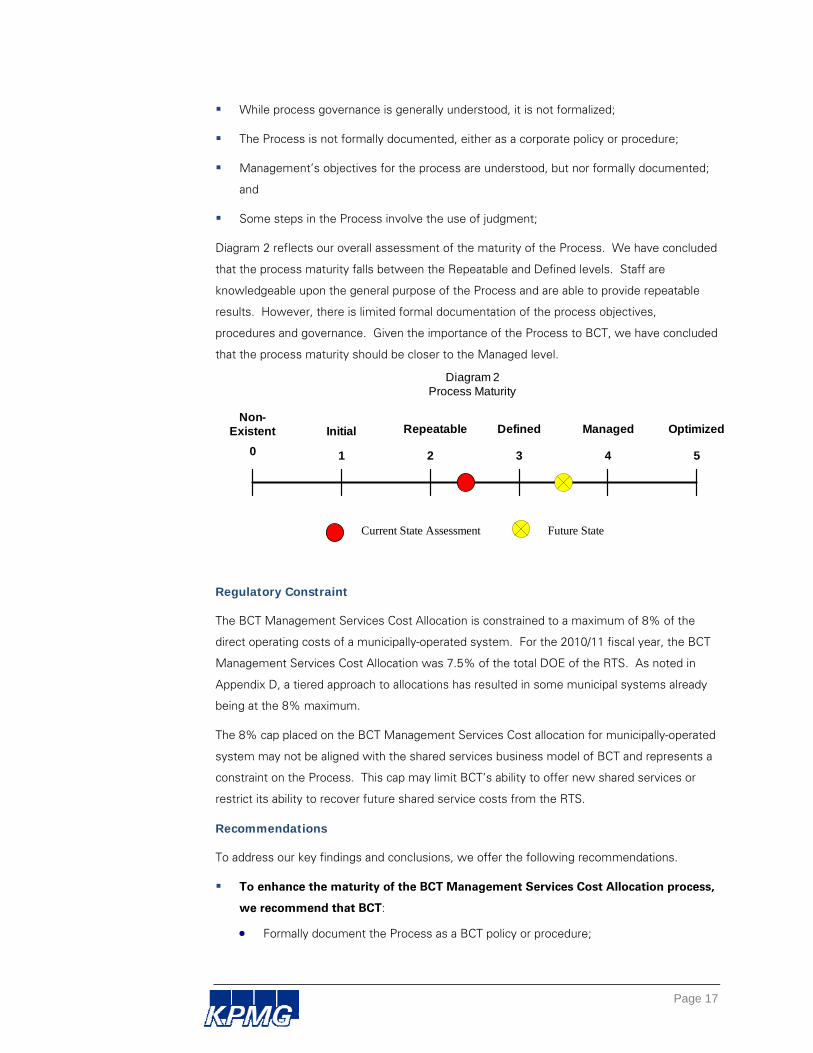
Diagram 2 reflects our overall assessment of the maturity of the Process. We have concluded
that the process maturity falls between the Repeatable and Defined levels. Staff are
knowledgeable upon the general purpose of the Process and are able to provide repeatable
results. However, there is limited formal documentation of the process objectives,
procedures and governance. Given the importance of the Process to BCT, we have concluded
that the process maturity should be closer to the Managed level.
0 1 2 3 4 5
Non-Existent Initial Repeatable Defined Managed Optimized
Current State Assessment Future State
Diagram 2Process Maturity
Regulatory Constraint
The BCT Management Services Cost Allocation is constrained to a maximum of 8% of the
direct operating costs of a municipally-operated system. For the 2010/11 fiscal year, the BCT
Management Services Cost Allocation was 7.5% of the total DOE of the RTS. As noted in
Appendix D, a tiered approach to allocations has resulted in some municipal systems already
being at the 8% maximum.
The 8% cap placed on the BCT Management Services Cost allocation for municipally-operated
system may not be aligned with the shared services business model of BCT and represents a
constraint on the Process. This cap may limit BCT’s ability to offer new shared services or
restrict its ability to recover future shared service costs from the RTS.
Recommendations
To address our key findings and conclusions, we offer the following recommendations.
To enhance the maturity of the BCT Management Services Cost Allocation process,
we recommend that BCT:
Formally document the Process as a BCT policy or procedure;
Page 18
Formally acknowledge ownership of the Process;
Document the underlying values guiding the Process;
Have cost drivers annually reviewed and signed off by Cost Centre managers; and
Document a process for the ongoing maintenance of the policy or procedure.
To enhance the efficacy of the Process, we recommend that BCT:
Clarify whether the cost allocations should be based upon the preliminary budget estimates, final budget estimates or actual final costs;
Consider whether cost allocations should be performed at the Cost Centre or Account level;
Consider whether cost drivers should be more reflective of economic efficiencies;
Review the appropriateness of the current cost drivers;
Provide guidance on calculation rounding; and
Document any established processes for using a tiered-approach in applying the cost allocations to individual regional transit systems.
We recommend that BCT consider the need for changes to Sections 8(1)(a)(iv) and
8(1)(b)(iv) of the British Columbia Transit Regulation with respect to the 8% cap
placed on the BCT Management Services cost allocation to municipally-operated
systems.

Page 19
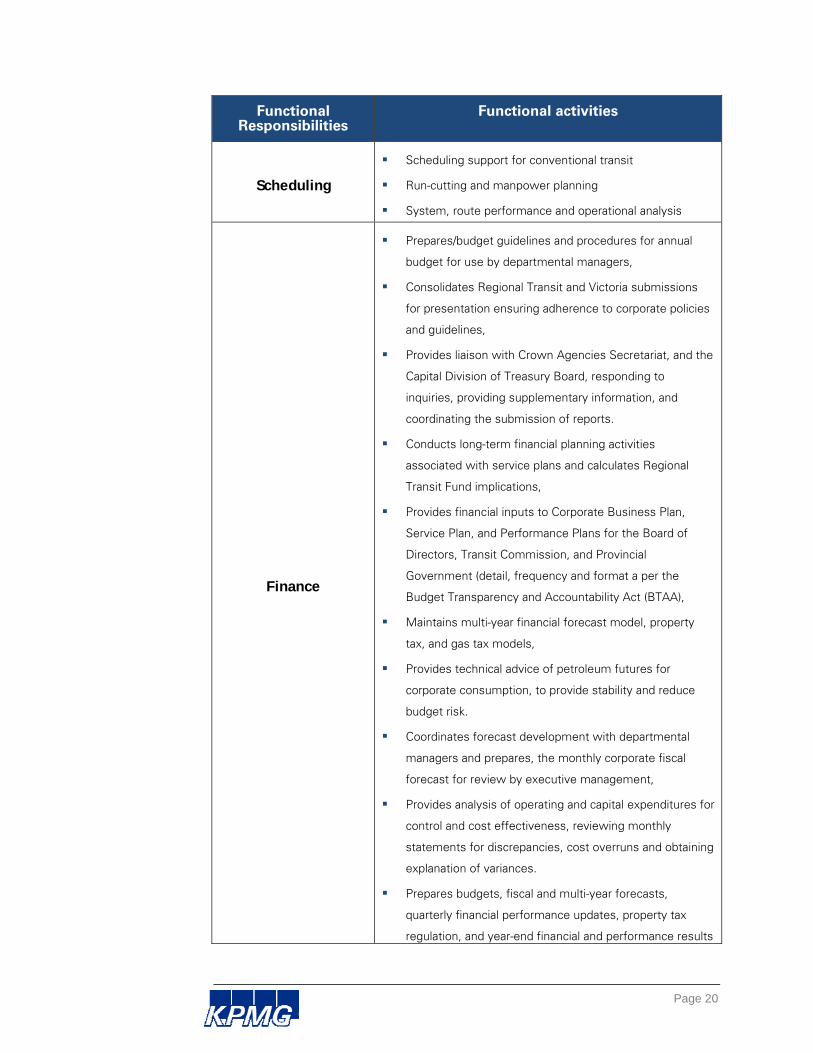
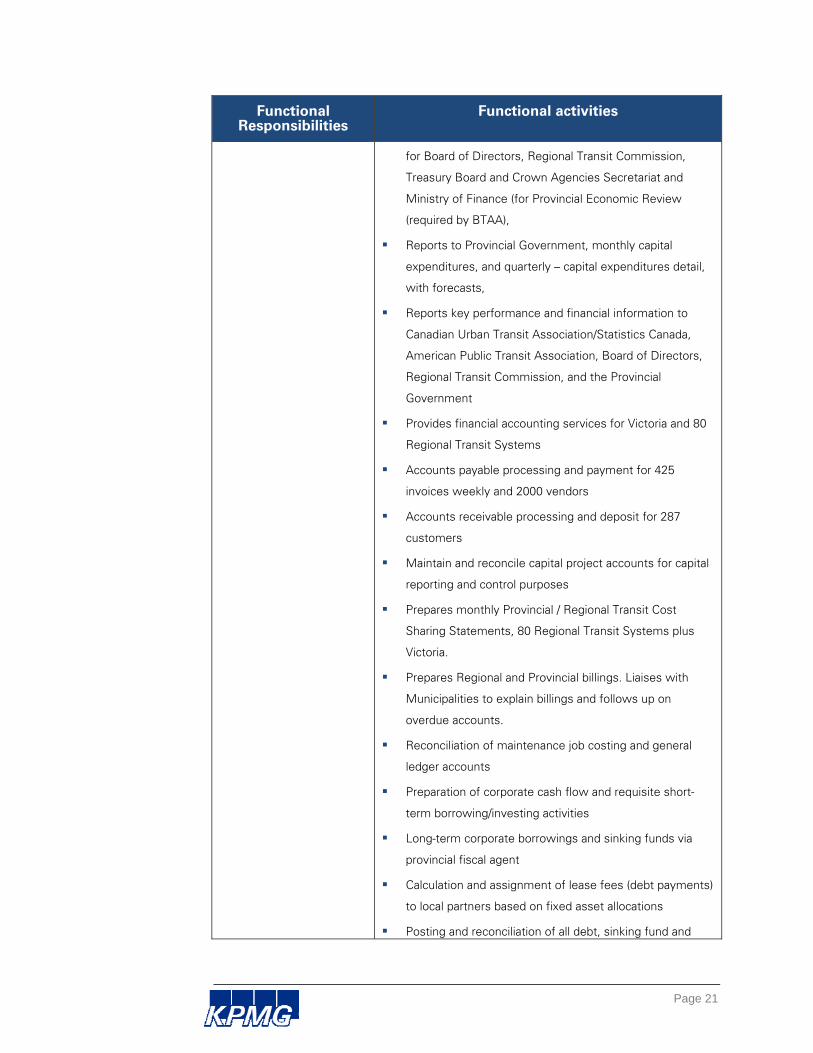
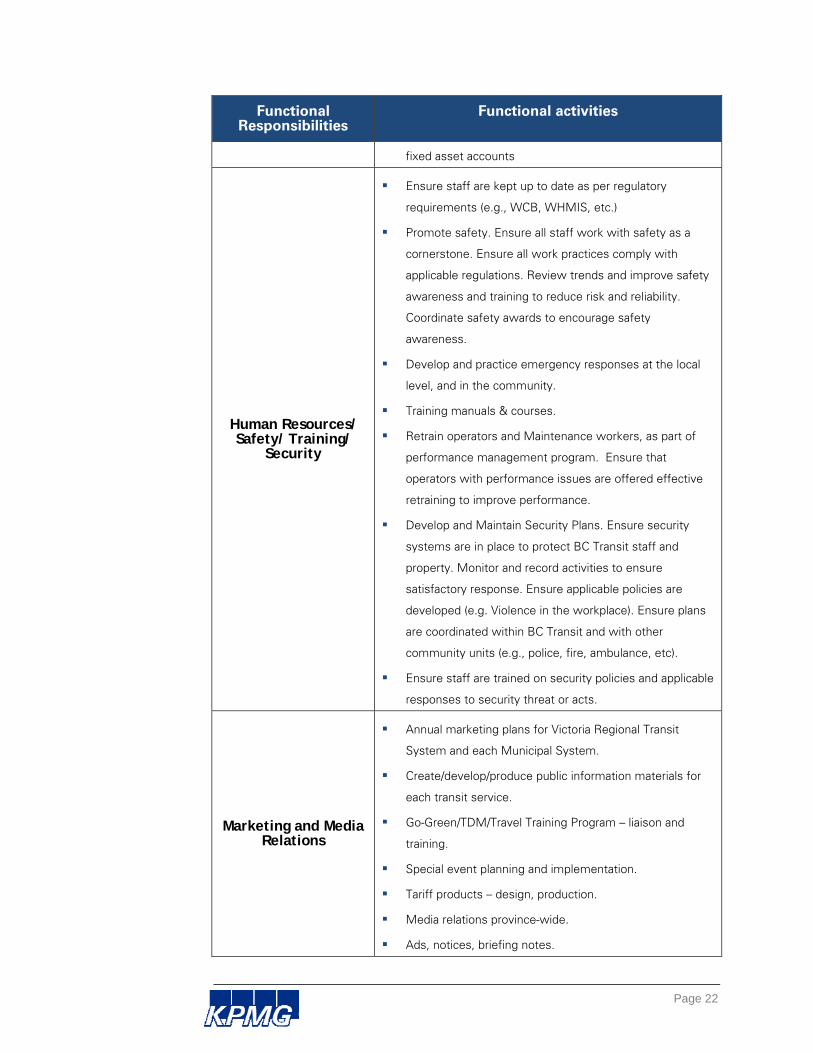
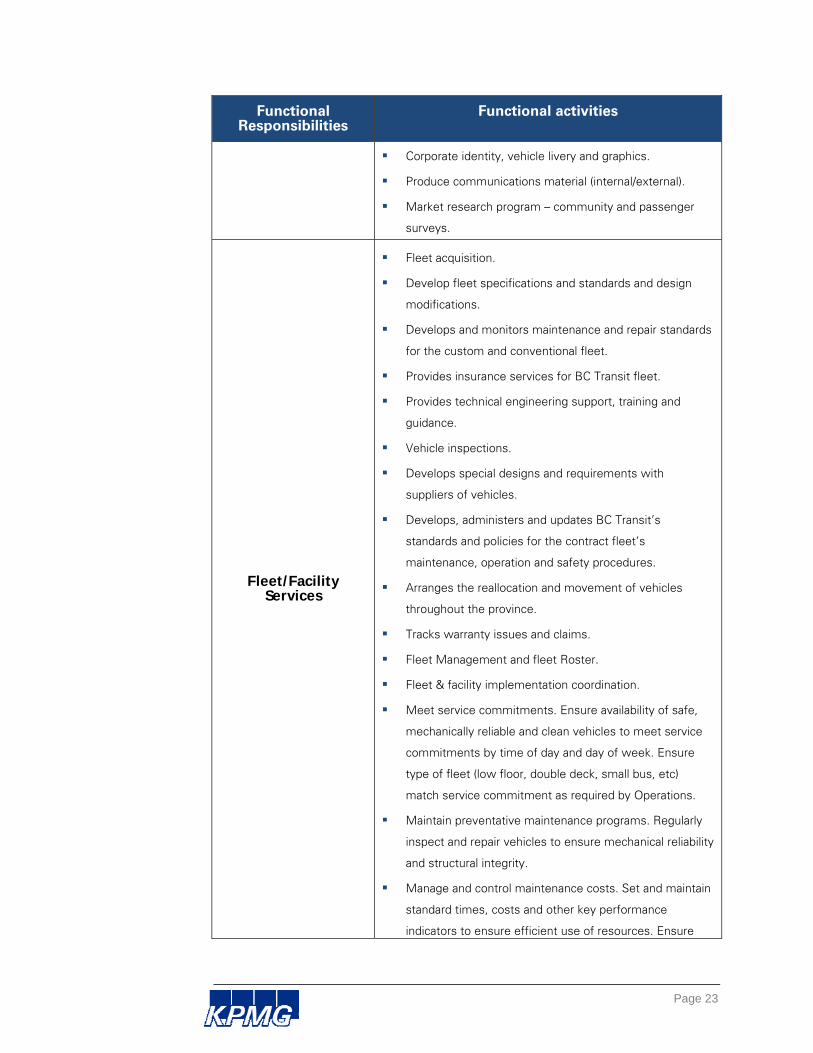
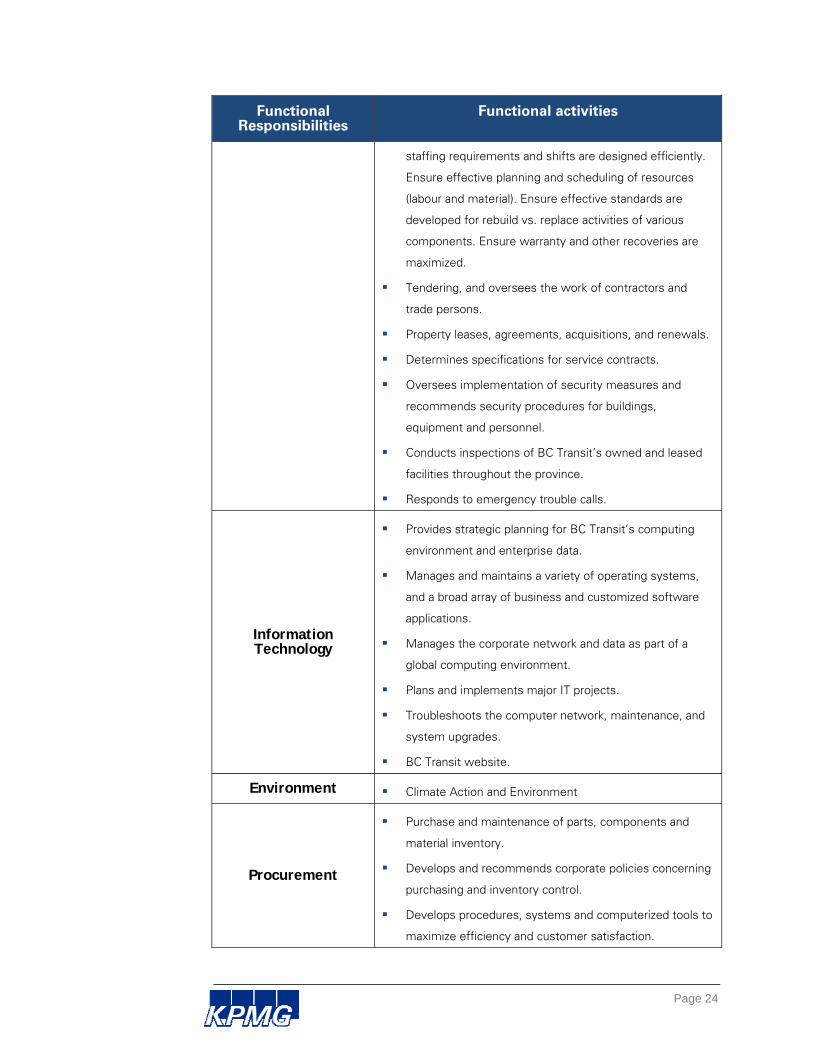
Appendix A – BCT Management Services
The following table is maintained by BCT management to track the range of services provided
to regional transit systems. This version does not reflect some services that have been added
in the past year.
Functional Responsibilities
Functional activities
Planning/Operations
Establish local transit objectives w/ local gov’t.
Market research & analysis
Strategic Plan
3 - 5 Year Performance/Service Plan
Plan, tariff preparation
Contract partner liaison
Stakeholder and public liaison
Service & tariff implementation responsibility
Policy & service concept development
Ridership monitoring
KPI monitoring
Local government & BCT Board reporting
Service audit program management
Response to incidents, major events, accidents and
extreme weather or other external issues.
Answer calls from the public, answering questions related
to schedules, service and policy
Monitor service to customer.
Provide ongoing direction, guidance and support to
operator
handyDART dispatching support
Operational guidelines (accessibility, etc.)
Surveys, counts, analyses
Fleet requirements
Page 20
Functional Responsibilities
Functional activities
Scheduling
Scheduling support for conventional transit
Run-cutting and manpower planning
System, route performance and operational analysis
Finance
Prepares/budget guidelines and procedures for annual
budget for use by departmental managers,
Consolidates Regional Transit and Victoria submissions
for presentation ensuring adherence to corporate policies
and guidelines,
Provides liaison with Crown Agencies Secretariat, and the
Capital Division of Treasury Board, responding to
inquiries, providing supplementary information, and
coordinating the submission of reports.
Conducts long-term financial planning activities
associated with service plans and calculates Regional
Transit Fund implications,
Provides financial inputs to Corporate Business Plan,
Service Plan, and Performance Plans for the Board of
Directors, Transit Commission, and Provincial
Government (detail, frequency and format a per the
Budget Transparency and Accountability Act (BTAA),
Maintains multi-year financial forecast model, property
tax, and gas tax models,
Provides technical advice of petroleum futures for
corporate consumption, to provide stability and reduce
budget risk.
Coordinates forecast development with departmental
managers and prepares, the monthly corporate fiscal
forecast for review by executive management,
Provides analysis of operating and capital expenditures for
control and cost effectiveness, reviewing monthly
statements for discrepancies, cost overruns and obtaining
explanation of variances.
Prepares budgets, fiscal and multi-year forecasts,
quarterly financial performance updates, property tax
regulation, and year-end financial and performance results
Page 21
Functional Responsibilities
Functional activities
for Board of Directors, Regional Transit Commission,
Treasury Board and Crown Agencies Secretariat and
Ministry of Finance (for Provincial Economic Review
(required by BTAA),
Reports to Provincial Government, monthly capital
expenditures, and quarterly – capital expenditures detail,
with forecasts,
Reports key performance and financial information to
Canadian Urban Transit Association/Statistics Canada,
American Public Transit Association, Board of Directors,
Regional Transit Commission, and the Provincial
Government
Provides financial accounting services for Victoria and 80
Regional Transit Systems
Accounts payable processing and payment for 425
invoices weekly and 2000 vendors
Accounts receivable processing and deposit for 287
customers
Maintain and reconcile capital project accounts for capital
reporting and control purposes
Prepares monthly Provincial / Regional Transit Cost
Sharing Statements, 80 Regional Transit Systems plus
Victoria.
Prepares Regional and Provincial billings. Liaises with
Municipalities to explain billings and follows up on
overdue accounts.
Reconciliation of maintenance job costing and general
ledger accounts
Preparation of corporate cash flow and requisite short-
term borrowing/investing activities
Long-term corporate borrowings and sinking funds via
provincial fiscal agent
Calculation and assignment of lease fees (debt payments)
to local partners based on fixed asset allocations
Posting and reconciliation of all debt, sinking fund and
Page 22
Functional Responsibilities
Functional activities
fixed asset accounts
Human Resources/ Safety/ Training/
Security
Ensure staff are kept up to date as per regulatory
requirements (e.g., WCB, WHMIS, etc.)
Promote safety. Ensure all staff work with safety as a
cornerstone. Ensure all work practices comply with
applicable regulations. Review trends and improve safety
awareness and training to reduce risk and reliability.
Coordinate safety awards to encourage safety
awareness.
Develop and practice emergency responses at the local
level, and in the community.
Training manuals & courses.
Retrain operators and Maintenance workers, as part of
performance management program. Ensure that
operators with performance issues are offered effective
retraining to improve performance.
Develop and Maintain Security Plans. Ensure security
systems are in place to protect BC Transit staff and
property. Monitor and record activities to ensure
satisfactory response. Ensure applicable policies are
developed (e.g. Violence in the workplace). Ensure plans
are coordinated within BC Transit and with other
community units (e.g., police, fire, ambulance, etc).
Ensure staff are trained on security policies and applicable
responses to security threat or acts.
Marketing and Media Relations
Annual marketing plans for Victoria Regional Transit
System and each Municipal System.
Create/develop/produce public information materials for
each transit service.
Go-Green/TDM/Travel Training Program – liaison and
training.
Special event planning and implementation.
Tariff products – design, production.
Media relations province-wide.
Ads, notices, briefing notes.
Page 23
Functional Responsibilities
Functional activities
Corporate identity, vehicle livery and graphics.
Produce communications material (internal/external).
Market research program – community and passenger
surveys.
Fleet/Facility Services
Fleet acquisition.
Develop fleet specifications and standards and design
modifications.
Develops and monitors maintenance and repair standards
for the custom and conventional fleet.
Provides insurance services for BC Transit fleet.
Provides technical engineering support, training and
guidance.
Vehicle inspections.
Develops special designs and requirements with
suppliers of vehicles.
Develops, administers and updates BC Transit’s
standards and policies for the contract fleet’s
maintenance, operation and safety procedures.
Arranges the reallocation and movement of vehicles
throughout the province.
Tracks warranty issues and claims.
Fleet Management and fleet Roster.
Fleet & facility implementation coordination.
Meet service commitments. Ensure availability of safe,
mechanically reliable and clean vehicles to meet service
commitments by time of day and day of week. Ensure
type of fleet (low floor, double deck, small bus, etc)
match service commitment as required by Operations.
Maintain preventative maintenance programs. Regularly
inspect and repair vehicles to ensure mechanical reliability
and structural integrity.
Manage and control maintenance costs. Set and maintain
standard times, costs and other key performance
indicators to ensure efficient use of resources. Ensure
Page 24
Functional Responsibilities
Functional activities
staffing requirements and shifts are designed efficiently.
Ensure effective planning and scheduling of resources
(labour and material). Ensure effective standards are
developed for rebuild vs. replace activities of various
components. Ensure warranty and other recoveries are
maximized.
Tendering, and oversees the work of contractors and
trade persons.
Property leases, agreements, acquisitions, and renewals.
Determines specifications for service contracts.
Oversees implementation of security measures and
recommends security procedures for buildings,
equipment and personnel.
Conducts inspections of BC Transit’s owned and leased
facilities throughout the province.
Responds to emergency trouble calls.
Information Technology
Provides strategic planning for BC Transit’s computing
environment and enterprise data.
Manages and maintains a variety of operating systems,
and a broad array of business and customized software
applications.
Manages the corporate network and data as part of a
global computing environment.
Plans and implements major IT projects.
Troubleshoots the computer network, maintenance, and
system upgrades.
BC Transit website.
Environment Climate Action and Environment
Procurement
Purchase and maintenance of parts, components and
material inventory.
Develops and recommends corporate policies concerning
purchasing and inventory control.
Develops procedures, systems and computerized tools to
maximize efficiency and customer satisfaction.
Page 25
Functional Responsibilities
Functional activities
Manages the computerized materials management
program.
Sets inventory levels, determines method of disposal of
obsolete and surplus items.
Directs the acquisition of parts, materials and services.
Controls the receipt storage, issue and shipment of parts
and materials.
Oversees or designs tender documents and monitors
progress of tenders.
Liaises with suppliers and users concerning quality and
timeliness of service, new products, incorrect shipments
etc.
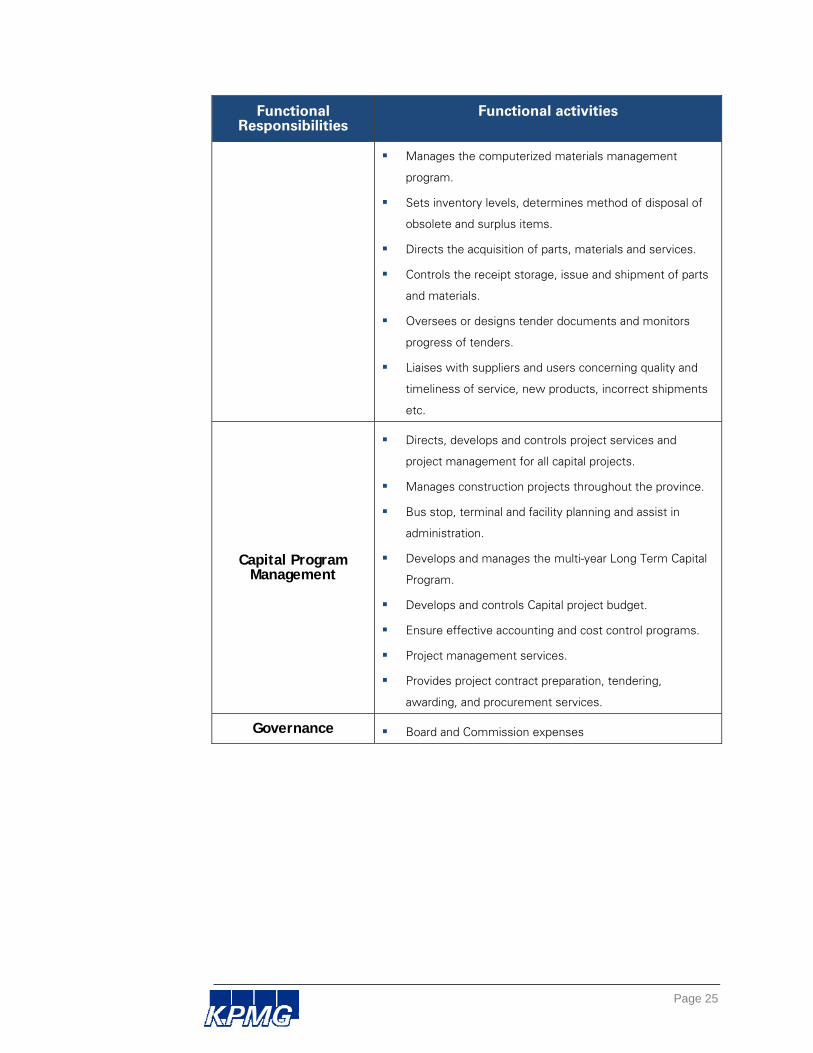
Capital Program Management
Directs, develops and controls project services and
project management for all capital projects.
Manages construction projects throughout the province.
Bus stop, terminal and facility planning and assist in
administration.
Develops and manages the multi-year Long Term Capital
Program.
Develops and controls Capital project budget.
Ensure effective accounting and cost control programs.
Project management services.
Provides project contract preparation, tendering,
awarding, and procurement services.
Governance Board and Commission expenses
Page 26
Appendix B – Process Flowcharts

Page 27
ProposedMS Cost
Allocation
Preliminary Operating
Budget
BCT Management Services Cost Allocation Process
1 Maintain Cost Allocation Process
2 Estimate ManagementService Costs
3 Gather and ApplyCost Drivers
4 Review and FinalizeCost Allocations
Ma
nag
er, F
inan
cial
Pla
nni
ng
Chi
ef F
ina
ncia
l Off
ice
rE
xecu
tive
Start
1.1Initiate Annual
ReviewOf Cost Allocation
Process
ChangeRequired ?
Finish
No
1.2Analyze
requirements and propose
change
Yes
1.3Review and
ApproveChange
Approved
No
1.4Update
Documentation of Process
Yes
2.1Develop
Preliminary Annual Budget
Start
2.2Record
Preliminary Budget
Preliminary Operating
Budget
Update asPreliminary
BudgetChanges
Cost Allocation
Spreadsheet
2.3Allocate
Incremental (Direct) Costs
2.4Allocate
Shared ServiceCosts
Start
3.1Gather
Relevant Cost Driver
Information
3.2Review and
Validate Cost Driver
Information
3.3Record Cost
Drivers
Cost Allocation
Spreadsheet
4.1Review and
Adjust Cost
Allocations
Cost Allocation
Spreadsheet
4.2Review and
Approve Cost Allocations
IterativeReviewProcess
Cost Allocation
Spreadsheet
To2

Page 28
BCT Admin % Breakdown
Spreadsheet
BCT Admin % Breakdown
Spreadsheet
BCT Management Services Cost Allocation Process
5 Approve Management ServicesCost Allocation
6 Record CostAllocations
7 Monitor and Adjust Cost Allocations
Re-performPeriodically
Ma
nag
er, F
inan
cia
l Rep
ortin
gC
hief
Fin
anc
ial O
ffic
er
Exe
cutiv
e
From1
ProposedMS Cost
Allocation
5.2Review and
Approve Cost Allocations
5.1Submit Cost
Allocations for Approval
Approved?
No,Revise
6.1Allocate Costs to each RTS
Yes
6.2Review and
Approve RTS Cost
Allocations
Approved?
No, Revise
6.3Prepare and Post Journal
Vouchers
Yes
GeneralLedger
Finish
Start
7.1Monitor Actual Costs against
Budget
7.2Identify Material
Changes in Shared Service
Costs
Adjustment Required?
Finish
No
Reperform
7.3Identify
Additional Shared Service
Costs
Yes
7.4Prepare
Allocation Adjustment to
RTS
Adjustment to Cost
Allocations
7.5Review and
Approve RTS Allocation
Adjustment
7.6Review and
Approve Cost Allocations
Approved?
6.3Prepare and Post Journal
Vouchers
GeneralLedger
Finish
YesNo
Finance Finance
Page 29
Appendix C – Reference Materials
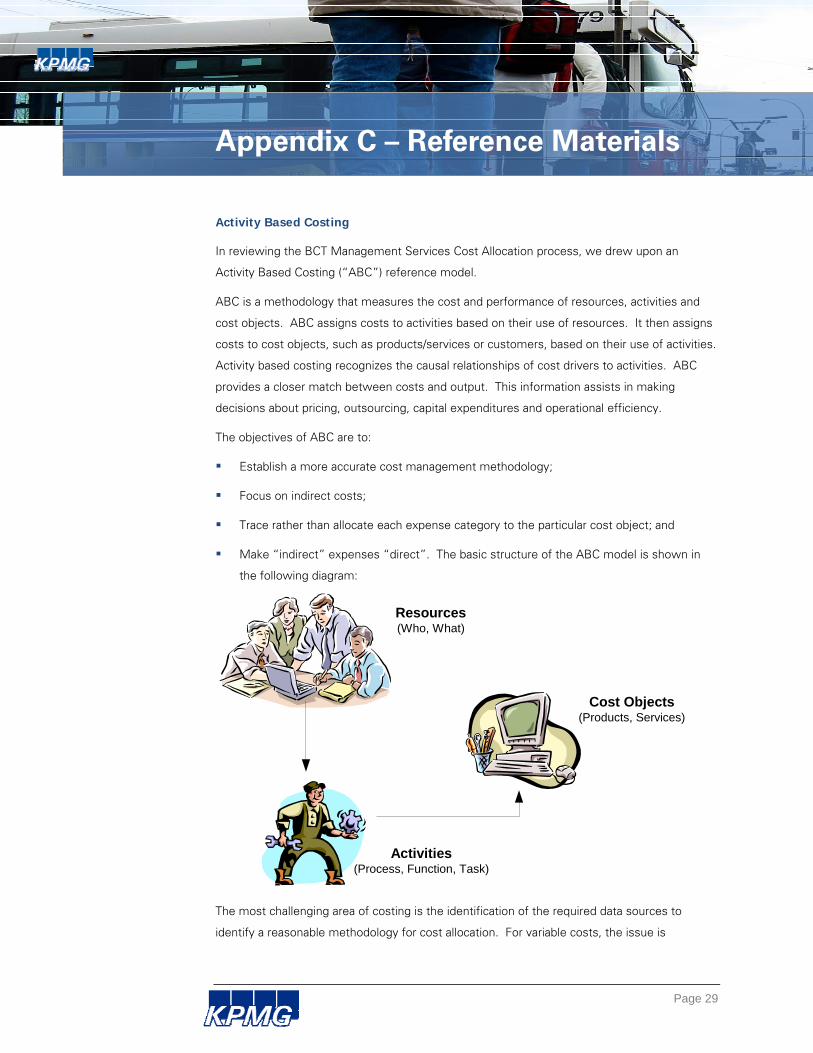
Activity Based Costing
In reviewing the BCT Management Services Cost Allocation process, we drew upon an
Activity Based Costing (“ABC”) reference model.
ABC is a methodology that measures the cost and performance of resources, activities and
cost objects. ABC assigns costs to activities based on their use of resources. It then assigns
costs to cost objects, such as products/services or customers, based on their use of activities.
Activity based costing recognizes the causal relationships of cost drivers to activities. ABC
provides a closer match between costs and output. This information assists in making
decisions about pricing, outsourcing, capital expenditures and operational efficiency.
The objectives of ABC are to:
Establish a more accurate cost management methodology;
Focus on indirect costs;
Trace rather than allocate each expense category to the particular cost object; and
Make “indirect” expenses “direct”. The basic structure of the ABC model is shown in
the following diagram:
Resources(Who, What)
Cost Objects(Products, Services)
Activities(Process, Function, Task)
The most challenging area of costing is the identification of the required data sources to
identify a reasonable methodology for cost allocation. For variable costs, the issue is

Page 30
determining the cost driver or activity to which there is the highest coefficient of variability,
and performing a study of the activities involved in providing the service to determine the
extent of variability.
In allocating full costs down to the service line or service level, one must determine the
methodology that will be used to allocate fixed costs to each service line or service.
Organizations use a variety of proxies for this including the number of people in each service
line or service, the total service line or service costs before fixed common costs, space
utilization, or the complexity of the service line/service provided.
The typical criteria used to evaluate alternative cost attribution methodologies and cost
recovery processes include the following:
Equitythe costs allocated should be equitable in that costs borne by each program or
service should relate to their share of both direct and common costs based on a causal
relationship to the level of activity of the user or user group.
Economic Efficiencycosts should be allocated on the basis of causality to the extent
possible.
Externalitiesan attribution of costs to each program or service regardless of their use
of specific systems to the extent that significant benefits are accrued to all members
from these systems.
Practicalitythe attribution of costs should be relatively easy to determine and be
flexible enough to accommodate new services or changes in the environment.
Capability Maturity Model
The maturity levels in the Capability Maturity Model are:
Level 0 – Non-Existent—No process is in place.
Level 1 – Initial—Processes are usually ad hoc and the organization usually does not
provide a stable environment. Success in these organizations depends on the
competence and heroics of the people in the organization and not on the use of proven
processes. In spite of this ad hoc, chaotic environment, maturity level 1 organizations
often produce products and services that work; however, they frequently exceed the
budget and schedule of their projects. Organizations are characterized by a tendency to
over commit, abandon processes in the time of crisis, and not be able to repeat their past
successes again.
Level 2 - Repeatable—Project successes are repeatable.
Level 3 - Defined—The process is established and improved over time. The
organization’s management establishes process objectives based on the organization’s
set of standard processes and ensures that these objectives are appropriately addressed.
A critical distinction between level 2 and level 3 is the scope of standards, process
Page 31
descriptions, and procedures. At level 2, the standards, process descriptions, and
procedures may be quite different in each specific instance of the process (for example,
on a particular project). At level 3, the standards, process descriptions, and procedures for
a project are tailored from the organization’s set of standard processes to suit a particular
project or organizational unit.
Level 4 - Managed—Using precise measurements, management can effectively control
the process. In particular, management can identify ways to adjust and adapt the process
without measurable losses of quality or deviations from specifications. At this level
organization set a quantitative quality goal for both process and process maintenance. A
critical distinction between maturity level 3 and maturity level 4 is the predictability of
process performance. At maturity level 4, the performance of processes is controlled
using statistical and other quantitative techniques, and is quantitatively predictable. At
maturity level 3, processes are only qualitatively predictable.
Level 5 - Optimizing—Focusing on continually improving process performance through
both incremental and innovative improvements. Quantitative process-improvement
objectives are established, continually revised to reflect changing business objectives,
and used as criteria in managing process improvement. The effects of deployed process
improvements are measured and evaluated against the quantitative process-improvement
objectives. Process improvements to address common causes of process variation and
measurably improve the organization’s processes are identified, evaluated, and deployed.
A critical distinction between maturity level 4 and maturity level 5 is the type of process
variation addressed. At maturity level 4, processes are concerned with addressing special
causes of process variation and providing statistical predictability of the results. Though
processes may produce predictable results, the results may be insufficient to achieve the
established objectives. At maturity level 5, processes are concerned with addressing
common causes of process variation and changing the process (that is, shifting the mean
of the process performance) to improve process performance (while maintaining
statistical probability) to achieve the established quantitative process-improvement
objectives.
Page 32
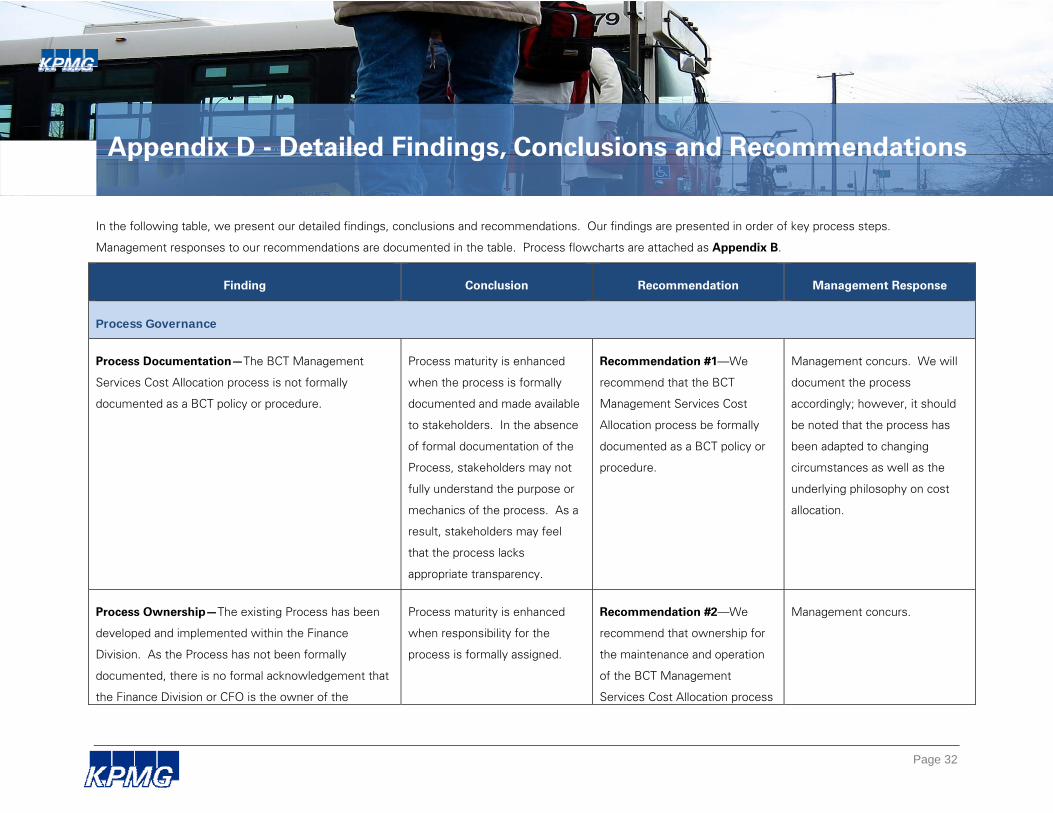
Appendix D - Detailed Findings, Conclusions and Recommendations
In the following table, we present our detailed findings, conclusions and recommendations. Our findings are presented in order of key process steps.
Management responses to our recommendations are documented in the table. Process flowcharts are attached as Appendix B.
Finding Conclusion Recommendation Management Response
Process Governance
Process Documentation—The BCT Management
Services Cost Allocation process is not formally
documented as a BCT policy or procedure.
Process maturity is enhanced
when the process is formally
documented and made available
to stakeholders. In the absence
of formal documentation of the
Process, stakeholders may not
fully understand the purpose or
mechanics of the process. As a
result, stakeholders may feel
that the process lacks
appropriate transparency.
Recommendation #1—We
recommend that the BCT
Management Services Cost
Allocation process be formally
documented as a BCT policy or
procedure.
Management concurs. We will
document the process
accordingly; however, it should
be noted that the process has
been adapted to changing
circumstances as well as the
underlying philosophy on cost
allocation.
Process Ownership—The existing Process has been
developed and implemented within the Finance
Division. As the Process has not been formally
documented, there is no formal acknowledgement that
the Finance Division or CFO is the owner of the
Process maturity is enhanced
when responsibility for the
process is formally assigned.
Recommendation #2—We
recommend that ownership for
the maintenance and operation
of the BCT Management
Services Cost Allocation process
Management concurs.
Page 33
Finding Conclusion Recommendation Management Response
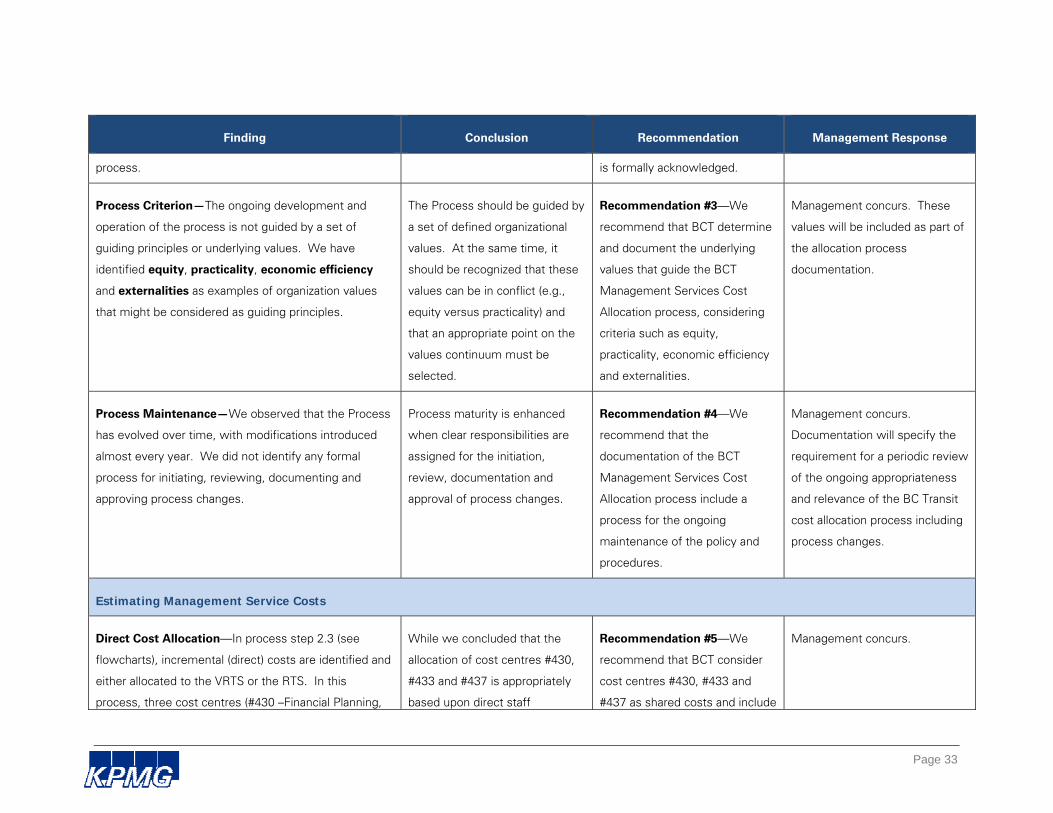
process. is formally acknowledged.
Process Criterion—The ongoing development and
operation of the process is not guided by a set of
guiding principles or underlying values. We have
identified equity, practicality, economic efficiency
and externalities as examples of organization values
that might be considered as guiding principles.
The Process should be guided by
a set of defined organizational
values. At the same time, it
should be recognized that these
values can be in conflict (e.g.,
equity versus practicality) and
that an appropriate point on the
values continuum must be
selected.
Recommendation #3—We
recommend that BCT determine
and document the underlying
values that guide the BCT
Management Services Cost
Allocation process, considering
criteria such as equity,
practicality, economic efficiency
and externalities.
Management concurs. These
values will be included as part of
the allocation process
documentation.
Process Maintenance—We observed that the Process
has evolved over time, with modifications introduced
almost every year. We did not identify any formal
process for initiating, reviewing, documenting and
approving process changes.
Process maturity is enhanced
when clear responsibilities are
assigned for the initiation,
review, documentation and
approval of process changes.
Recommendation #4—We
recommend that the
documentation of the BCT
Management Services Cost
Allocation process include a
process for the ongoing
maintenance of the policy and
procedures.
Management concurs.
Documentation will specify the
requirement for a periodic review
of the ongoing appropriateness
and relevance of the BC Transit
cost allocation process including
process changes.
Estimating Management Service Costs
Direct Cost Allocation—In process step 2.3 (see
flowcharts), incremental (direct) costs are identified and
either allocated to the VRTS or the RTS. In this
process, three cost centres (#430 –Financial Planning,
While we concluded that the
allocation of cost centres #430,
#433 and #437 is appropriately
based upon direct staff
Recommendation #5—We
recommend that BCT consider
cost centres #430, #433 and
#437 as shared costs and include
Management concurs.

Page 34
Finding Conclusion Recommendation Management Response
#433-Supply Services and #437-Inventory Stores) are
allocated between the VRTS and RTS based upon the
direct assignment of staff to those systems.
assignments, we also concluded
that it could simply the process
to initially treat these costs as
shared costs and apply the same
drivers in process step 3.3.
the allocated as part of the
shared services allocation.
Use of Preliminary Budget Estimates—The
determination of the Preliminary Cost Allocation is part
of BCT’s annual budget process. Budget development
is an iterative process that can go through many
versions before finalization.
For the 2010/11 allocation process, we noted that the
Preliminary Cost Allocation was not based upon the
final budget. Process documentation does not
comment on which version of the budget is to be used
for the cost allocation.
In the absence of clear rules for
which version of the operating
budget is used in the cost
allocation process, it is possible
that the Process will generate
variable results depending on the
staff involved.
As budgeting is an iterative
process, guidance should be
provided to staff on how the
Preliminary Cost Allocation
should be finalized within the
budget process.
Recommendation #6—We
recommend that the
documentation of the BCT
Management Services Cost
Allocation process include
guidance with respect to
finalizing the Preliminary Cost
Allocation during the budget
process.
Management agrees that to the
extent possible, final budgets
will be used; however, timing
may dictate that preliminary
budgets are used to meet
municipal budget timelines.
Applying Cost Drivers
Rounding—For the 2010/11 calculation, we observed
that the calculated allocation to the RTS of $7,386,292
was rounded down to $7.3 million in the final budget.
In other years, we observed both rounding up and
In the absence of clear rules for
rounding in the cost allocation
calculations, it is possible that
the Process will generate
Recommendation #7—We
recommend that specific rules
for rounding of calculations
within the Process be
Management agrees that
rounding rules will be included as
part of the documentation of the
process. Rounding differences
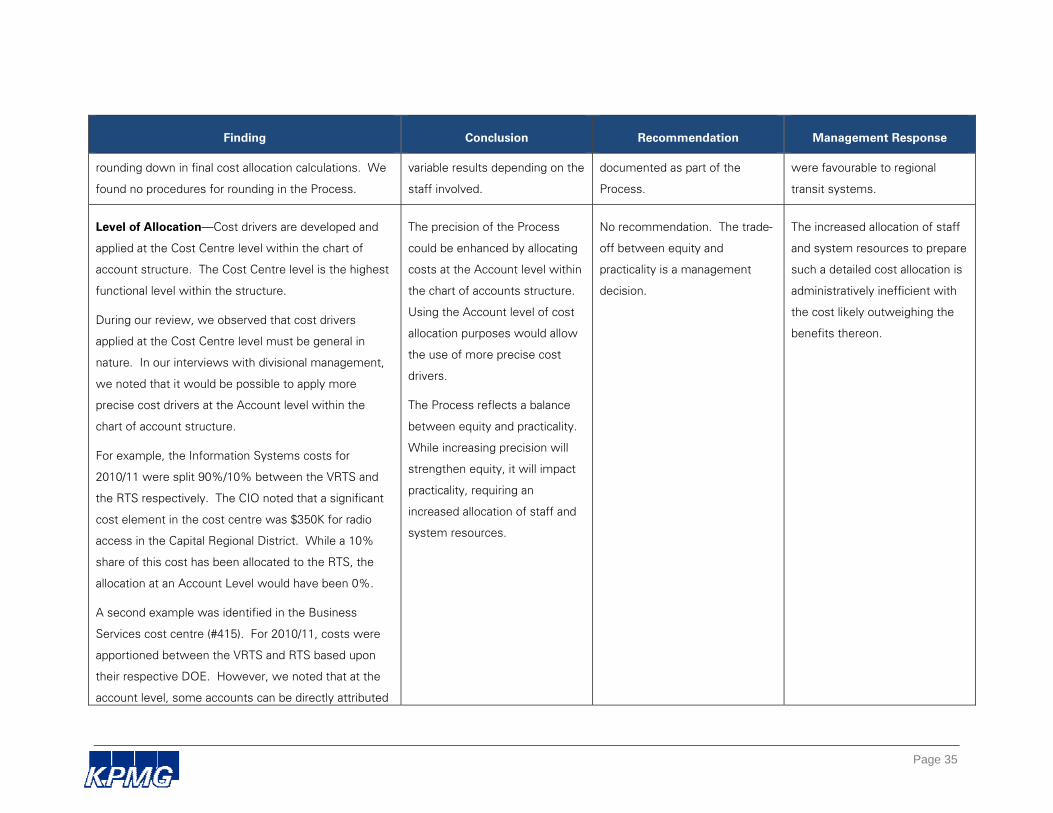
Page 35
Finding Conclusion Recommendation Management Response
rounding down in final cost allocation calculations. We
found no procedures for rounding in the Process.
variable results depending on the
staff involved.
documented as part of the
Process.
were favourable to regional
transit systems.
Level of Allocation—Cost drivers are developed and
applied at the Cost Centre level within the chart of
account structure. The Cost Centre level is the highest
functional level within the structure.
During our review, we observed that cost drivers
applied at the Cost Centre level must be general in
nature. In our interviews with divisional management,
we noted that it would be possible to apply more
precise cost drivers at the Account level within the
chart of account structure.
For example, the Information Systems costs for
2010/11 were split 90%/10% between the VRTS and
the RTS respectively. The CIO noted that a significant
cost element in the cost centre was $350K for radio
access in the Capital Regional District. While a 10%
share of this cost has been allocated to the RTS, the
allocation at an Account Level would have been 0%.
A second example was identified in the Business
Services cost centre (#415). For 2010/11, costs were
apportioned between the VRTS and RTS based upon
their respective DOE. However, we noted that at the
account level, some accounts can be directly attributed
The precision of the Process
could be enhanced by allocating
costs at the Account level within
the chart of accounts structure.
Using the Account level of cost
allocation purposes would allow
the use of more precise cost
drivers.
The Process reflects a balance
between equity and practicality.
While increasing precision will
strengthen equity, it will impact
practicality, requiring an
increased allocation of staff and
system resources.
No recommendation. The trade-
off between equity and
practicality is a management
decision.
The increased allocation of staff
and system resources to prepare
such a detailed cost allocation is
administratively inefficient with
the cost likely outweighing the
benefits thereon.

Page 36
Finding Conclusion Recommendation Management Response
to the VRTS.
Cost Drivers—Several cost drivers (e.g., number of
fleet vehicles is a cost driver for Vehicle Asset
Management and Fleet Maintenance Management)
have been developed within the Process to drive the
allocation of shared service costs. The use of
appropriate cost drivers is an important element of any
allocation methodology.
The existing cost drivers are of a
very general nature and in some
cases represent allocations on a
functional basis. It is possible for
more detailed cost drivers to be
developed and applied that could
enhance the equity of the
Process. For example, the costs
of Financial Planning are
allocated based upon an
estimate of the staff resources
servicing either the VRTS or the
RTS. An alternative approach
would be to identify the key
financial planning services
provided (budgets prepared,
financial statements produced,
etc.) and allocate the costs
based upon those more detailed
drivers.
The costs to implement a more
detailed set of cost drivers could
significantly impact the staff and
system resources required to
No recommendation. The trade-
off between equity and
practicality is a management
decision.
Management believes that
although using detailed cost
drivers or other measures such
as time tracking would increase
accuracy, this effort would
create administrative burden and
further increase administrative
costs.

Page 37
Finding Conclusion Recommendation Management Response
support the Process.
Appropriate Cost Drivers—Some cost drivers used in
the Process may not be the most appropriate drivers for
cost allocation purposes. For example, Safety and
Training costs (Cost centre #150) are allocated based
upon an estimated split of the number of shared
services staff supporting each system. A more
appropriate allocation might be to base the allocation on
the number of direct operating staff being trained.
Another example would be the Climate Action and
Environment costs (Cost centre #475), which is also
currently based upon the estimated split of the number
of shared services staff supporting each system. A
more appropriate cost driver might be the allocation of
staff within the Climate Action group serving either the
VRTS or RTS.
The Process would be enhanced
if the choice of cost drivers were
reviewed annually by cost centre
managers.
Recommendation #8—We
recommend that cost drivers
used in the Process be reviewed
and approved annually by cost
centre managers.
Management concurs and will
review cost drivers for
appropriateness as part of the
periodic review of the
appropriateness and relevance of
the Process.
Allocating Costs to Regional Transit Systems
Allocating Costs to Individual Systems—Once the
overall BCT Management Services Cost Allocation to
the RTS is approved, the amount must be broken down
and applied to individual transit systems. In general,
the cost allocation is applied to individual transit
systems based upon their DOE compared to the total
While the use of the DOE of
individual systems is used to
allocated management service
costs to individual systems, it is
not the only reasonable cost
driver that could be used. While
Recommendation #9—We
recommend that, if the tiered
approach to applying
management service costs to
individual systems is retained, it
be documented as part of the
Management concurs with the
recommendation on the
documentation of the process
and supports the tiered concept
as every system has a portion of
fixed costs associated with it.

Page 38
Finding Conclusion Recommendation Management Response
DOE for the RTS. The use of the DOE of individual
transit systems as the basis for cost allocation to those
systems is not mandated by the Legislation or
Regulation.
We noted that while the average rate of management
service costs to DOE in 2010/11 was 7.5%, the range
of percentages applied to individual systems was
7.15% to 8.00%. As management service cost
allocations were increasing significantly over the past
several years, management chose a tiered approach in
applying increases. Small systems were allowed to
increase at a higher rate than larger systems. Smaller
systems have now reached the maximum level of 8%
of DOE, meaning that future increases will likely be
allocated largely to the higher tiered systems.
The tiers used for the 2010/11 cost allocation were as
follows:
TDOC Range
Tier From To Cost
Allocation %
1 $ - $ 500,000 8.00%
2 $ 500,001 $ 1,000,000 7.95%
3 $ 1,000,000 $ 2,000,000 7.90%
4 $ 2,000,001 $ 6,000,000 7.45%
5 $ 6,000,001 $ 8,000,000 7.35%
different cost drivers could be
employed, is our conclusion that
the use of DOE as the cost
driver is both practical and
reasonable.
The use of a tiered approach to
applying management service
costs to individual systems has
resulted in variability in the
impact on individual transit
systems. Smaller systems
contributed a higher proportion
of the increases over the past
two years than larger systems.
As the smaller systems have
now reached the maximum cap
of 8%, larger systems will have
to contribute the majority of
future increases.
While the tiered approach may
have been a reasonable
approach to transitioning
individual systems to a higher
management service cost
allocation, it is not clear that the
Process. We also recommend
that consideration be given to
phasing out the use of the tiered
approach.
Therefore, it is management’s
view that a cost allocation
method based purely on direct
operating expenses is not the
most equitable approach even
though it may be administratively
more efficient.

Page 39
Finding Conclusion Recommendation Management Response
6 $ 8,000,001 $10,000,000 7.25%
7 $10,000,001 7.15%
approach is equitable for
continued use in the Process.
Final Cost Allocations
Actual versus Budget—The preliminary cost
allocations are based upon BCT’s preliminary budget.
Actual costs incurred in a year will vary from budget. If
actual costs are materially different than the preliminary
budget, management will consider the need for a year-
end adjustment to the BCT Management Services
allocation. There appears to be significant judgment
applied in considering whether a year-end adjustment
will be applied.
The absence of a formal step in
the Process to adjust the BCT
Management Services allocation
based upon actual expenditures
reduces the precision of the
allocations.
Recommendation #10—We
recommend that BCT consider
the need for a year-end
adjustment to the BCT
Management Services cost
allocation to reflect actual
expenditures.
Use of budget figures provides
predictability. If there is a
significant difference between
actual and budgeted
expenditures, management
would consider adjusting the
allocations. Historically, this
difference has not been
significant.
Other Issues
Management Services Cap—The BCT Management
Services Cost Allocation is constrained to a maximum
of 8% of the direct operating costs of a municipally-
operated system. For the 2010/11 fiscal year, the BCT
Management Services Cost Allocation was 7.5% of the
total DOE of the RTS. As noted earlier, a tiered
approach to allocations has resulted in some municipal
systems already being at the 8% maximum.
The 8% cap placed on the BCT
Management Services Cost
allocation for municipally-
operated system may not be
aligned with the shared services
business model of BCT and
represent an artificial constraint
on the Process.
Recommendation #11—We
recommend that BCT consider
the need for changes to the
Regulation to accommodate
growth in the provision of shared
management services.
Management concurs.