Embed Size (px)
Citation preview

A2: Climate Analysis & Graphic Interpretation 1 ARCH 3/431
INTRODUCTION Before developing architectural design concepts for a particular site and building program, a thorough consideration of the climatic conditions for the surrounding region is critical. This will allow the designer to identify appropriate environmental responses for comfort indoors and outdoors as well as optimize energy performance. In this series of exercises related to climate, you will learn the basic constituents of a complete climatic data set and develop graphical representations that communicate the distinctive features leading to climate-adapted design. OBJECTIVES Upon completing this exercise each student will have demonstrated the ability to select and document appropriate data for climatic factors important to architectural design, translate numerical climate data into useful graphical formats that can be easily understood by members of an architectural design team as well as your client. Your summary will identify climatic features that influence human comfort and energy efficiency of buildings designed for the given region. OUTCOME This exercise will be used to generate graphical and written presentation of climate data intended to convey to a non-architectural audience a picture of climate conditions that are influential to a building’s design. A 1.) Climate Summary and 2.) Appendix will illustrate the climatic features that give your location its unique character and will provide the supporting documentation to support your analysis. METHODOLOGY Begin by collecting the data needed to analyze your site and assemble this as an appendix to your summary. Then create a graphically illustrated climate summary synthesizing the information collected for your appendix. APPENDIX 1. Based on one of the climate regions (tropical (hot humid), desert (hot arid), or temperate/cold, pick a climate city that
is typical of those conditions. Verify that data is available for that city by checking the sites linked in the course website or the most current ASHRAE Handbook of Fundamentals. You can also try collecting climate data from a comprehensive (but DOS formatted) data set, the ISMCS CD-ROM available from your discussion section instructor.
2. Find each of the climate data items identified on the attached list (page 4) for your city. Do not copy data by hand
since errors frequently occur in the transcription process. Instead, you will need to make photocopies (or printouts if data is from the Internet) of the original data source. Highlight the data on the photocopy/printout that pertain only to your climate city.
3. Compile your original data sheets to form the Appendix. This is a collection of the raw climatic data. All data
should be photocopies or printouts. The final version of the Climate Data Appendix should have: • a table of contents with page numbers that correspond to the data sheets • the data sheets with all relevant data highlighted for your climate city
ARCHITECTURE 331/431 Environmental Control Systems A2: Climate Analysis and Graphic Interpretation
A2: Climate Analysis & Graphic Interpretation 2 ARCH 3/431
CLIMATE SUMMARY This is a graphic synthesis of the climate data presented in a graphically clear and compelling format, easily understood by a non-architectural audience. It should be presented in 8-1/2” x 11” or 11” x 17” format. This is the kind of information that should accompany almost every future design studio presentation. 1. Climate Narrative: Provide a brief written
description of the climate for a typical year. 2. Locator Map: Provide a map showing the location being described.
3. Iconic Images and Diagrams: Provide images and diagrams showing the character of the buildings that are characteristic of this climate, not necessarily of this particular locale. Also, create diagrams that convey some of the architectural strategies appropriate for this climate.
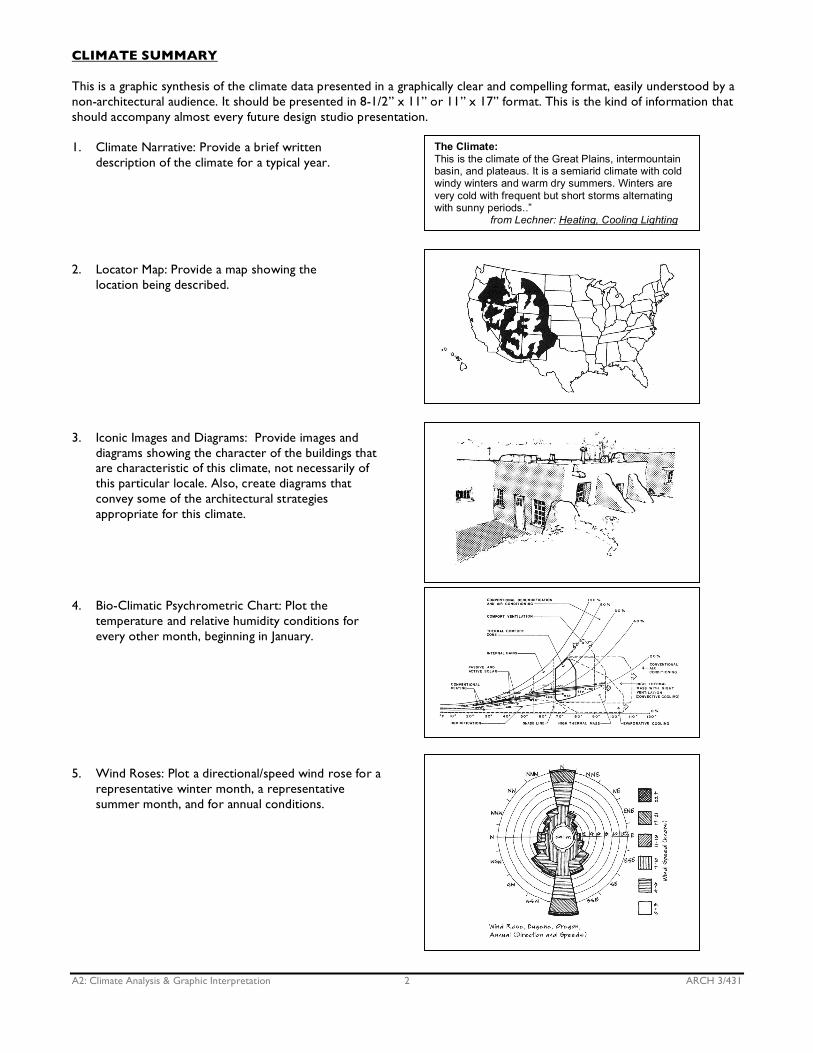
4. Bio-Climatic Psychrometric Chart: Plot the
temperature and relative humidity conditions for every other month, beginning in January.
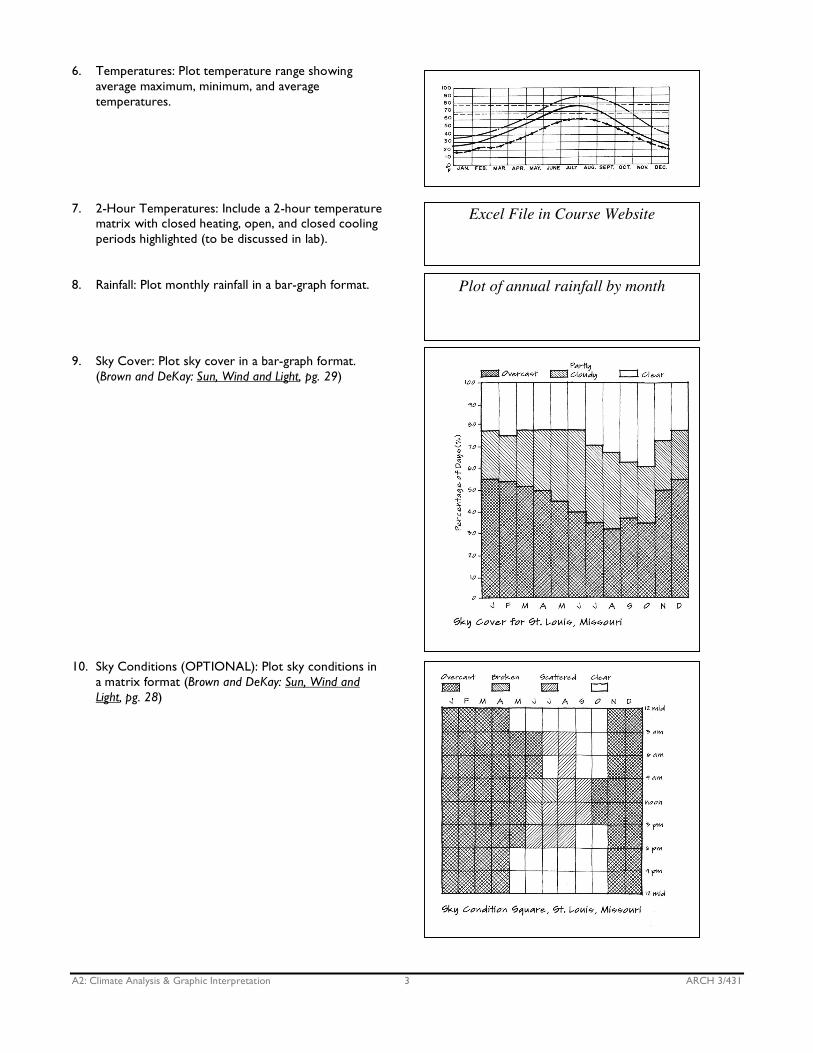
5. Wind Roses: Plot a directional/speed wind rose for a
representative winter month, a representative summer month, and for annual conditions.
The Climate: This is the climate of the Great Plains, intermountain basin, and plateaus. It is a semiarid climate with cold windy winters and warm dry summers. Winters are very cold with frequent but short storms alternating with sunny periods..” from Lechner: Heating, Cooling Lighting
A2: Climate Analysis & Graphic Interpretation 3 ARCH 3/431
6. Temperatures: Plot temperature range showing
average maximum, minimum, and average temperatures.
7. 2-Hour Temperatures: Include a 2-hour temperature matrix with closed heating, open, and closed cooling periods highlighted (to be discussed in lab).
8. Rainfall: Plot monthly rainfall in a bar-graph format.
9. Sky Cover: Plot sky cover in a bar-graph format. (Brown and DeKay: Sun, Wind and Light, pg. 29)
10. Sky Conditions (OPTIONAL): Plot sky conditions in a matrix format (Brown and DeKay: Sun, Wind and Light, pg. 28)
Excel File in Course Website
Plot of annual rainfall by month
A2: Climate Analysis & Graphic Interpretation 4 ARCH 3/431
You can create other charts and graphs using Excel or other digital tools, or by hand, to represent this information or any additional information about the climate.
SUPPLEMENTAL INFORMATION APPENDIX: Checklist for Climate Data Note: You may be able to satisfy many of these items with a single source of data, either from the www.wrcc.dri.edu website or the ISMCS CD available from your lab instructor.
Average daily minimum and maximum temperatures by month (12 months). [wrcc ISMCS CD]
Average daily minimum and maximum relative humidity by month (12 months). [wrcc or ISMCS CD]
Average wind speed and prevailing directions: Winter, Summer, and Annual. [wrcc or ISMCS CD]
Average precipitation (rain and snow) per month (12 months). [wrcc or ISMCS CD]
Climatic narrative describing phenomena not apparent in the numerical data such as tornadoes, thunderstorms,
hurricanes, monsoons, etc.
Sky conditions (12 months). [ISMCS CD]
Average solar radiation by month (12 months). [http://rredc.nrel.gov/solar/]
Degree days heating by month (base 18 C (65F)) (12 months and annual). [wrcc ISMCS CD]
Degree days cooling by month (base 18 C (65F)) (12 months and annual). [wrcc or ISMCS CD]
Winter Design dry bulb temperature (97.5% or 99% condition). [MEEB appendix A]
Summer Design dry bulb and wet bulb temperatures (~2% condition). [MEEB appendix A]
Latitude, longitude, and elevation above sea level.
Geographical Maps (to orient the reader to global location).
Photos and images (to show the physical features of the location). INSTRUCTIONS FOR TRANSFERRING DATA FROM WEBSITE TO SPREADSHEET FORMAT
• Go to http:///www.wrcc.dri.edu/climsum.html • Click the link for: Local Climate Data (LCD) Summaries for Western U.S. (June 20, 1997) • Click on the city either on the map or on the list of cities • “Save As” an HTML Source document (options at the bottom of the window) to a file on your hard drive. • Open Excel • Open the HTML Source document in Excel • Highlight the chart and notes at the bottom • Set the Print Area • Go to “Page Setup” and in the “Page” tab select “Fit to 1 page wide by 1 page tall”; in the “Margins” tab, select
“Center on page horizontally”. • Save this Excel file • Print this summary
NOTE: You can copy or drag many of the tables and charts from climate data into Word and Excel documents.
A2: Climate Analysis & Graphic Interpretation 5 ARCH 3/431
INSTRUCTIONS FOR OBTAINING CLIMATE DATA (TXT FILES) FROM ISMCS CD-ROM – Part 1
1. Insert ISMCS CD in the CD drive of a Windows-based PC computer. (The program will not run on a Mac.) [IF THE
ISMCS SOFTWARE IS ALREADY INSTALLED ON YOUR COMPUTER, double click on the ISMCS icon and proceed to step 4.]
2. Double click on the Compact Disc icon "ISMCSV3". 3. Double click on the application "CDRSY". This will run the program from the CD. 4. The first screen you will see is a title screen followed by a map of the world with a white locator rectangle within the
boundary. (Note: If you accidentally zoom in on the map and no longer see your geographical region, you need to restore the world view. Go to F2 MAP followed by the "Map Control Option" and center the map at a longitude outside the current view and then typing "Y" to reset the "full globe view".)
5. Type F4 SELECT followed by the number "3" which will allow you to choose the item by city name. 6. The list of stations will appear with a blinking cursor in [brackets] near the bottom of the list. Start typing the name of
the cities. The brackets will only accept up to four characters of the city name. You will notice the list of stations changes with each new character that you type narrowing the search.
7. Make sure the correct city is highlighted in the station list above. If not, you can use the arrow keys to highlight the
correct city. 8. Hit the return key (with your city name highlighted) to bring up the index screen for your location called "Station
Tables". 9. Highlight the data table "Station Climatic Summary" and hit the return key. 10. When you see the climate data, type F2-Output. When prompted with "Enter output File for Table", type a file name
followed by the return key. The file will be placed on the C: drive. Hit the ESC key twice to get back to the index "Station Tables".
11. If your location has more than one summary repeat Steps 8.-9. with a new file name. 12. Repeat Steps 8.-9. for the "Climate Narrative". 13. Highlight the data table "Wind Dir vs. Speed by Hr Month" on the index. Hit return. This takes you to a second level
index. with many wind files. 14. You will save three files: JANALL.LST, JULALL.LST, and ANNALL.LST. One by one, highlight the file name using the
arrow keys and hit the return key to display the screen. 15. Repeat Step 9. to save the data to a file. At the end of this process you should have a Climate Summary (one or two files), a Climate Narrative, and three Wind vs. Direction files (for Jan, Jul, and Annual).

A2: Climate Analysis & Graphic Interpretation 6 ARCH 3/431
INSTRUCTIONS FOR USING CONVERTING THE CLIMATE TXT FILES – Part 2 1. Launch MSWord. 2. Go to the drive where you saved the files and open the Climate Summary file. Remember that it is a txt file and you
will have to change the "Files of type:" at the bottom of the window to "All Files" otherwise it won't show up in the list. 3. The screen will look jumbled because of all of the long lines of text. To correct this, go to File-Page Set up and Paper
Size to change to Landscape format. 4. Then, go to Edit-Select All to highlight the entire document. 5. Change the font size to 8 point. This should make the document display properly with all of the numbers in the right
columns. 6. Choose File-Save As and save the file as a MSWord document. Keep the text file since you can use it for creating an
Excel version for charts and graphs. 7. Print a copy of the file. 8. Repeat Steps 2.-7. for the other files. You do not need to change the font size on the Climate Narrative, however. PART THREE (OPTIONAL) INSTRUCTIONS FOR USING CONVERTING WORD FILES TO EXCEL 1. Launch Word. Highlight the rows that contain the climate data starting with Jan. Copy to the clipboard. 2. Launch Excel. Paste the Word clipboard into Excel. Notice how all cells go into the first column of each row. 3. With the first column highlighted, go to Data-Text to Columns. Either "Delimited" or "Fixed Width" will work.
Choose Next on the each of the following screens until the last screen when you choose Finish. You will notice that numbers will appear to the right in the columns and alphabetical characters appear to the left. Unfortunately, the headers are too random to get them properly formatted in the file. Use your MSWord file to be sure you know which #'s correspond to which data.