Embed Size (px)
Citation preview
FISCALANALYSISINITIATIVE
A YEAR OR MORE:The high CosT of Long-Term UnempLoymenT

FISCALANALYSISINITIATIVE
Pew Charitable trusts
The pew Charitable Trusts is driven by the power of knowledge to solve today’s mostchallenging problems. pew applies a rigorous, analytical approach to improve public policy,
inform the public and stimulate civic life. We partner with a diverse range of donors, public andprivate organizations and concerned citizens who share our commitment to fact-based solutions
and goal-driven investments to improve society.
PEW ECONOMIC POLICY GROUPPew FisCal analysis initiative
The pew fiscal Analysis initiative is a division of the pew economic policy group,which promotes policies and practices that strengthen the U.s. economy. The fiscal Analysisinitiative seeks to increase fiscal accountability, responsibility and transparency by providing
independent and unbiased information to policy makers and the public as they considerthe major policy issues facing our nation. Together with outside experts from across the
political spectrum, the initiative will provide new analysis and more accessible informationto inform the debate on these issues.
team members
ingrid schroeder, Director, pew fiscal Analysis initiativescott s. Greenberger, senior officer
sarah nolan, senior Associateernest tedeschi, senior Associate
Douglas walton, Associateevgeni Dobrev, Administrative Associate
John morton, managing Director, pew economic policy groupDouglas hamilton, Deputy Director, pew economic policy group
aCknowleDGements
scott s. greenberger and Douglas Walton wrote this report with researchassistance from evgeni Dobrev and background analysis from sarah nolan.
The report was reviewed by all team members, Joanna Breslow, pete Janhunen,samantha Lasky, Lucy nombo, Jeremy ratner and scott Winship.
Design expertise was provided by Do good Design.
This report benefited from the insights and expertise of two external reviewers:gary Burtless of the Brookings institution and Donald marron of georgetown University.
These experts provided feedback and guidance during the development of the report.Although pew’s outside reviewers provided considerable assistance, they are not responsible
for the content of this report.
for additional information on the pew economic policy group and thefiscal Analysis initiative, please visit www.pewtrusts.org or email us at
This report is intended for educational and informational purposes.
©April 2010

1 exeCutive summary
2 introDuCtion
2 overview oF Current unemPloymentanD lonG-term unemPloyment
FiGure 1: long-term unemployment, January 1948–march 2010
5 CharaCteristiCs oF the lonG-term unemPloyeD
FiGure 2: overall unemployment rate, by ageFiGure 3: unemployed for one year or more, by ageFiGure 4: unemployed for one year or more, by ageFiGure 5: overall unemployment rate, by educationFiGure 6: unemployed for one year or more, by educationFiGure 7: unemployed for one year or more, by education
7 the FisCal imPaCt oF lonG-term unemPloyment
FiGure 8: Federal spending on unemployment benefits,Cobra and snaP, 2007–2010
10 the Possible PersistenCeoF lonG-term unemPloyment
FiGure 9: reasons for unemployment, January 1967–march 2010
11 summary anD ConClusions
12 aPPenDix tables
table 1: unemployment by agetable 2: unemployment by educationtable 3: unemployment by industrytable 4: unemployment by occupation
16 notes
C O N T E N T S :
A YEAR OR MORE:The high CosT of Long-Term UnempLoymenT

exeCutive summaryThe federal government defines “long-term unemployment” as a joblessperiod of six months or longer. in march 2010, over 44 percent of unemployedAmericans met or exceeded that standard—the highest rate since World War ii.1
in contrast, during the severe recession of the early 1980s, the percentage ofworkers unemployed for six months or longer peaked at 26 percent in 1983.2
The media have reported the historically high six-month unemployment figure,but a new study by the pew fiscal Analysis initiative goes further by calculating thepercentage of people who have been unemployed for a year or more. This analysisfurther illuminates the extent of the country’s long-term unemployment problemand its impact on the nation’s fiscal condition.
According to pew’s analysis of Current population survey (Cps) datafrom December 2009, 23 percent of the nearly 15 million Americanswho are unemployed have been jobless for a year or more.3 That percentagetranslates into 3.4 million people, roughly equivalent to the populationof the state of Connecticut.
Long-term unemployment cuts across nearly every industry and occupation.even in fields with overall unemployment rates that are relatively low, workerswho are unemployed are remaining so for a long time.
Long-term unemployment is occurring among people of all ages. Whileworkers 55 or older are less likely to become unemployed, those who doare more likely to stay unemployed for a long period of time. nearly 30percent of unemployed people 55 or older have been jobless for a yearor longer—a higher rate than any other age group.4
once a person is out of work, a high level of education provides only limitedprotection against a long period of unemployment. Twenty-one percentof unemployed workers with a bachelor’s degree have been without workfor a year or longer, compared to 27 percent of unemployed high schoolgraduates and 23 percent of unemployed high school drop-outs.5
in the current fiscal year, federal spending on unemployment benefits isprojected to be five times greater than it was in each of the years immediatelypreceding the recession. in each fiscal year between 2005 and 2007, annualfederal spending on unemployment insurance ranged between $31 and$33 billion.6 federal spending on unemployment benefits could reach$168 billion in fiscal year 2010, of which $81 billion represents spendingon regular benefits. The remaining $87 billion represents the cost of additionalunemployment aid that Congress has approved (or is poised to approve)to help people who have been out of work for six months or longer.7
A YEAR OR MORE: The high CosT of Long-Term UnempLoymenT |
Pew Economic Policy Group: FISCAL ANALYSIS INITIATIVE
1
A YEAR OR MORE:The high CosT of Long-Term UnempLoymenT
introDuCtionA high rate of long-term unemployment has significant implications for families,government budgets and the country’s overall economic and social health.
for individuals, the likelihood of finding a job declines as the length of unemploymentincreases. people who are unemployed for a long time can lose their job skills. A longunemployment spell can mark them as undesirable, making it more difficult to competeagainst other job candidates.8 Cps data suggests that workers who are jobless for thelongest duration incur the largest reductions in weekly earnings upon returning to work.9
Long-term unemployment also has had a significant impact on the federal budget.To help the millions of people who are stuck on the unemployment rolls, Congresshas approved extending unemployment benefits beyond the normal 26-week limit.Those extensions cost nearly $44 billion in fiscal year 2009 alone.10 The federalgovernment also has increased food assistance and paid for a greater share ofhealth-care coverage for those who have been without work for a long time.since people pay less in income taxes when they are out of work, long-termunemployment also has reduced federal revenue. for the economy as a whole,unemployment corresponds with lost output: When labor is underutilized,the nation produces fewer goods and services than it is capable of producing.
if the current recovery follows the pattern set by the last two, hiring will remainsluggish for some time. Job losses continued for nearly two years after the 2001downturn, and overall employment numbers did not return to pre-recession highsuntil 2005. The Congressional Budget office (CBo) projects that the unemploymentrate will remain above 9 percent through 2011 and that the rate will not decline to5 percent—the so-called natural rate of unemployment—until 2016.11
pew investigates the populations most affected by long-term unemployment througha new lens by looking at workers who have been unemployed for a year or more andevaluating the fiscal and economic effects.
overview oF Current unemPloymentanD lonG-term unemPloyment
The United states is in the midst of one of its worst periods of unemployment sincethe end of the World War ii. The unemployment rate during this recession peakedat 10.1 percent in october 2009, nearly reaching the post-war record of 10.8 percentset in December 1982.12 According to the Bureau of Labor statistics (BLs), the overallunemployment rate was 9.7 percent in march 2010. This means there were about15 million people who were actively searching for employment but were unsuccessful.13
in february 2010, 13 states and the District of Columbia had an unemployment ratehigher than 10 percent, and six states (California, florida, michigan, nevada,rhode island, and south Carolina) had a rate of at least 12 percent.14
Pew Economic Policy Group: FISCAL ANALYSIS INITIATIVE
| A YEAR OR MORE: The high CosT of Long-Term UnempLoymenT2
Those figures do not capture the full scope of the problem, since they do not includepeople who became discouraged and stopped seeking employment, people whodecided to retire early rather than keep searching and young people who have delayedtheir entry into the work force. The figures also exclude people who would preferfull-time employment but have been forced to accept part-time work instead. Whenthose workers are counted in the calculation, the unemployment rate in march 2010becomes 16.9 percent.15 This is commonly known as the “underemployment” rate.in the aftermath of the 2001 recession, the comparable rate peaked at 10.4 percent.16
from the start of the recession through June 2009—when employment stoppedcontracting sharply—payroll employment fell by 6.4 million.17 The cumulativedecline of 5.2 percent during this period is the steepest drop in six decades.18
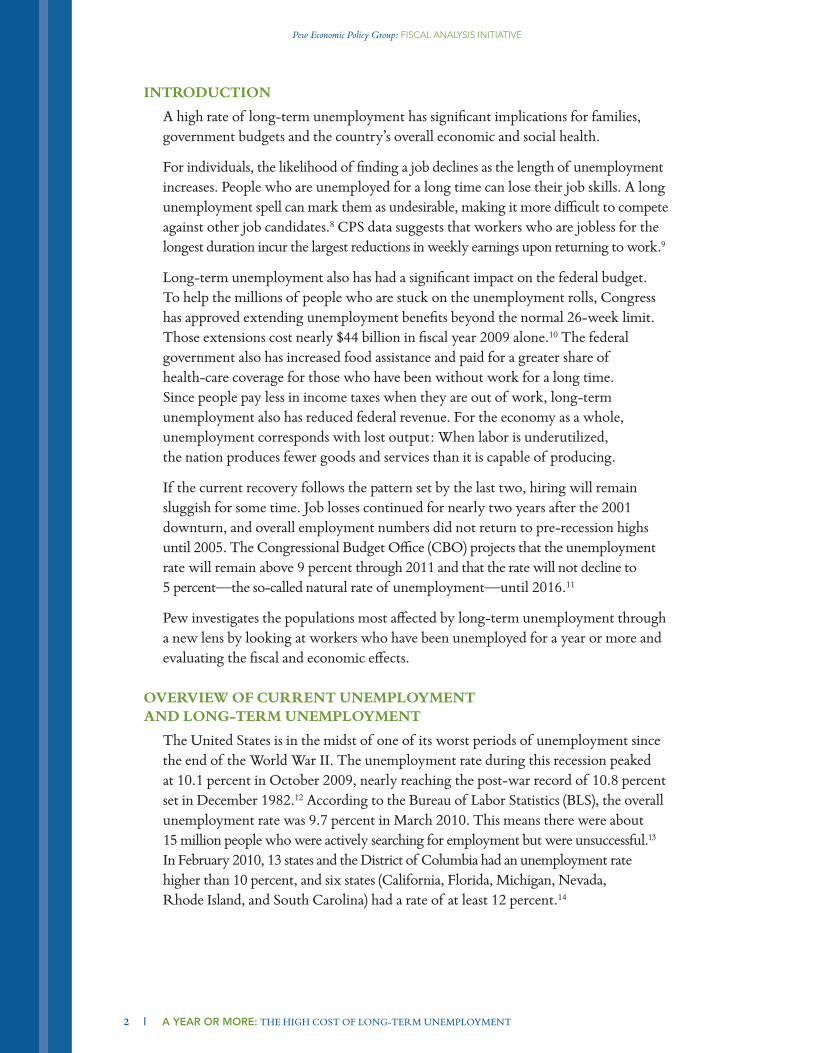
in addition to the high level of overall unemployment, this recession has beencharacterized by the long periods of time that many people have remained on theunemployment rolls. The federal government defines “long-term unemployment”as a jobless period of six months or longer. in march 2010, over 44 percent ofunemployed Americans met or exceeded that standard—the highest rate since WorldWar ii.19 in contrast, during the severe recession of the early 1980s, the percentageof workers unemployed for six months or longer peaked at 26 percent in 1983.20
The high long-term unemployment rate represents the continuation of a decades-long trend, one that has worsened after downturns but has persisted even duringperiods of growth. in march 2004, at its most recent peak, the percentage of peoplewho had been unemployed for at least six months was 23.4 percent. in november2007, the last month of economic expansion before the current recession, 19.5percent of the unemployed had been jobless for at least six months (see figure 1).21
pew’s analysis further illuminates this problem by calculating the percentage of people whohave been unemployed for a year or more. in December 2009, nearly three and a halfmillion Americans, or 23 percent of the unemployed, had been jobless for a year or longer.22
A YEAR OR MORE: The high CosT of Long-Term UnempLoymenT |
Pew Economic Policy Group: FISCAL ANALYSIS INITIATIVE
3
FiGure 1: long-term unemployment, January 1948–march 2010Percentage of Total Unemployed
45403530252015105
Source: Pew analysis using data from the Bureau of Labor Statistics and the Current Population SurveyNotes: Six-month numbers are seasonally adjusted; one-year numbers are not seasonally adjusted; shaded barsdenote recessions; data for one-year unemployment became available in 1994 and is shown through December 2009
1948
1951
1954
1957
1960
1963
1966
1969
1972
1975
1978
1981
1984
1987
1990
1993
1996
1999
2002
2005
2008
2010
Six months or more One year or more
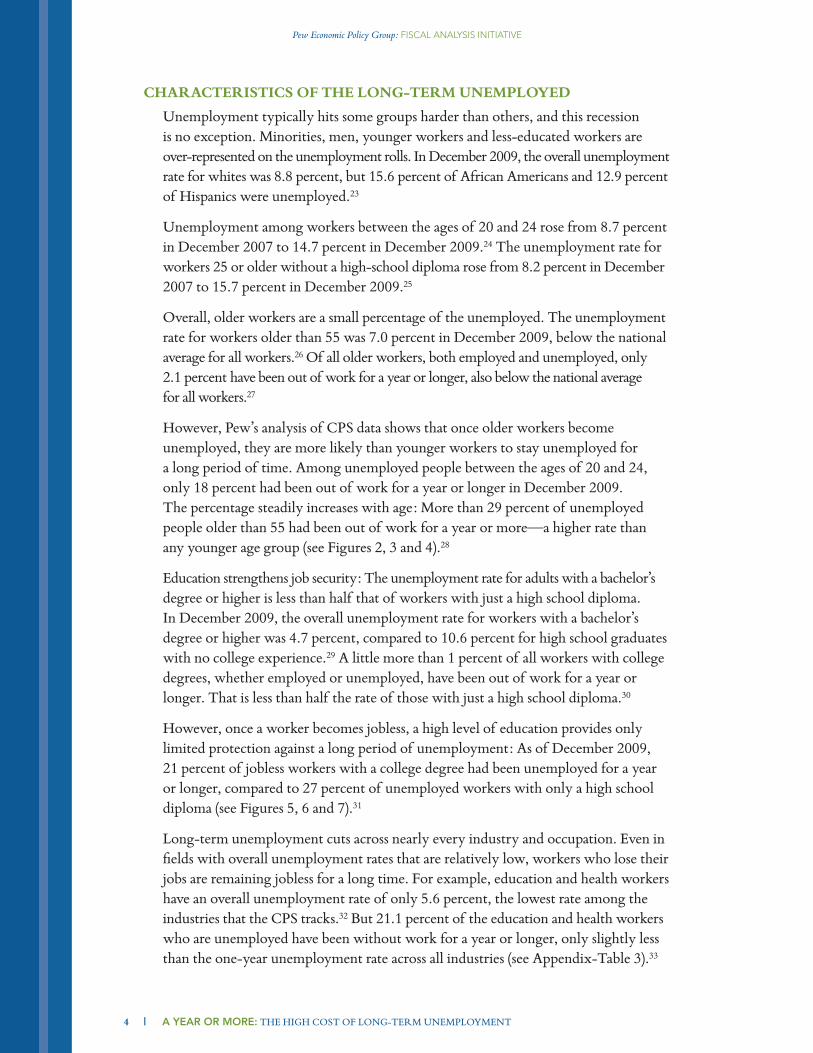
CharaCteristiCs oF the lonG-term unemPloyeDUnemployment typically hits some groups harder than others, and this recessionis no exception. minorities, men, younger workers and less-educated workers areover-represented on the unemployment rolls. in December 2009, the overall unemploymentrate for whites was 8.8 percent, but 15.6 percent of African Americans and 12.9 percentof hispanics were unemployed.23
Unemployment among workers between the ages of 20 and 24 rose from 8.7 percentin December 2007 to 14.7 percent in December 2009.24 The unemployment rate forworkers 25 or older without a high-school diploma rose from 8.2 percent in December2007 to 15.7 percent in December 2009.25
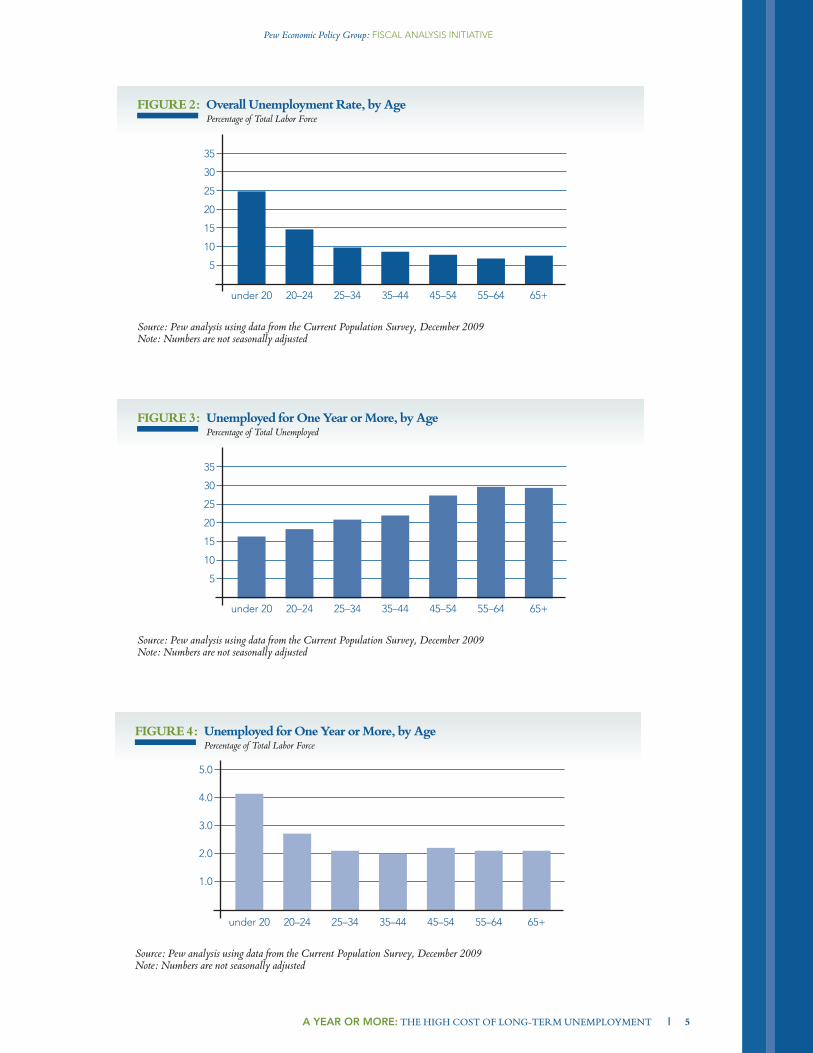
overall, older workers are a small percentage of the unemployed. The unemploymentrate for workers older than 55 was 7.0 percent in December 2009, below the nationalaverage for all workers.26 of all older workers, both employed and unemployed, only2.1 percent have been out of work for a year or longer, also below the national averagefor all workers.27
however, pew’s analysis of Cps data shows that once older workers becomeunemployed, they are more likely than younger workers to stay unemployed fora long period of time. Among unemployed people between the ages of 20 and 24,only 18 percent had been out of work for a year or longer in December 2009.The percentage steadily increases with age: more than 29 percent of unemployedpeople older than 55 had been out of work for a year or more—a higher rate thanany younger age group (see figures 2, 3 and 4).28
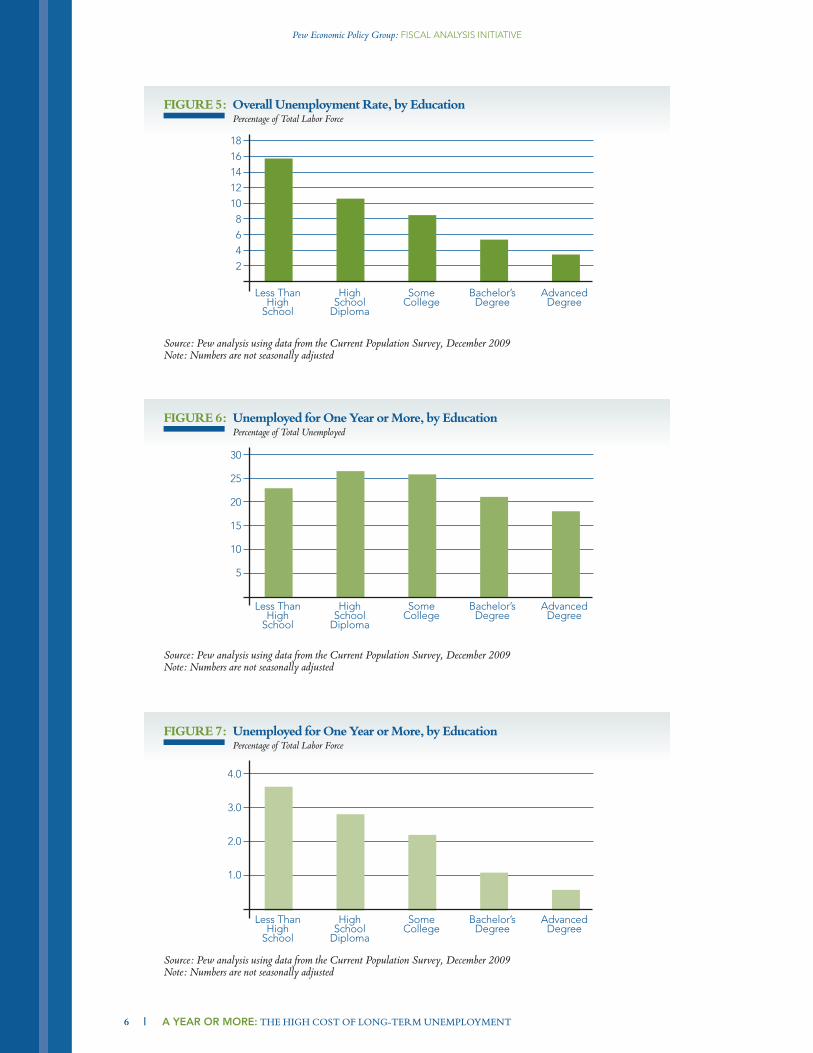
education strengthens job security: The unemployment rate for adults with a bachelor’sdegree or higher is less than half that of workers with just a high school diploma.in December 2009, the overall unemployment rate for workers with a bachelor’sdegree or higher was 4.7 percent, compared to 10.6 percent for high school graduateswith no college experience.29 A little more than 1 percent of all workers with collegedegrees, whether employed or unemployed, have been out of work for a year orlonger. That is less than half the rate of those with just a high school diploma.30
however, once a worker becomes jobless, a high level of education provides onlylimited protection against a long period of unemployment: As of December 2009,21 percent of jobless workers with a college degree had been unemployed for a yearor longer, compared to 27 percent of unemployed workers with only a high schooldiploma (see figures 5, 6 and 7).31
Long-term unemployment cuts across nearly every industry and occupation. even infields with overall unemployment rates that are relatively low, workers who lose theirjobs are remaining jobless for a long time. for example, education and health workershave an overall unemployment rate of only 5.6 percent, the lowest rate among theindustries that the Cps tracks.32 But 21.1 percent of the education and health workerswho are unemployed have been without work for a year or longer, only slightly lessthan the one-year unemployment rate across all industries (see Appendix-Table 3).33
Pew Economic Policy Group: FISCAL ANALYSIS INITIATIVE
| A YEAR OR MORE: The high CosT of Long-Term UnempLoymenT4
A YEAR OR MORE: The high CosT of Long-Term UnempLoymenT |
Pew Economic Policy Group: FISCAL ANALYSIS INITIATIVE
5
FiGure 3: unemployed for one year or more, by agePercentage of Total Unemployed
35
30
25
20
15
10
5
under 20 20–24 25–34 35–44 45–54 65+55–64
Source: Pew analysis using data from the Current Population Survey, December 2009Note: Numbers are not seasonally adjusted
FiGure 2: overall unemployment rate, by agePercentage of Total Labor Force
35
30
25
20
15
10
5
under 20 20–24 25–34 35–44 45–54 65+55–64
Source: Pew analysis using data from the Current Population Survey, December 2009Note: Numbers are not seasonally adjusted
FiGure 4: unemployed for one year or more, by agePercentage of Total Labor Force
5.0
4.0
3.0
2.0
1.0
under 20 20–24 25–34 35–44 45–54 65+55–64
Source: Pew analysis using data from the Current Population Survey, December 2009Note: Numbers are not seasonally adjusted
Pew Economic Policy Group: FISCAL ANALYSIS INITIATIVE
| A YEAR OR MORE: The high CosT of Long-Term UnempLoymenT6
FiGure 6: unemployed for one year or more, by educationPercentage of Total Unemployed
30
25
20
15
10
5
Less ThanHighSchool
HighSchoolDiploma
SomeCollege
Bachelor’sDegree
AdvancedDegree
Source: Pew analysis using data from the Current Population Survey, December 2009Note: Numbers are not seasonally adjusted
FiGure 5: overall unemployment rate, by educationPercentage of Total Labor Force
18
16
14
12
10
8
6
4
2
Less ThanHighSchool
HighSchoolDiploma
SomeCollege
Bachelor’sDegree
AdvancedDegree
Source: Pew analysis using data from the Current Population Survey, December 2009Note: Numbers are not seasonally adjusted
FiGure 7: unemployed for one year or more, by educationPercentage of Total Labor Force
4.0
3.0
2.0
1.0
Less ThanHighSchool
HighSchoolDiploma
SomeCollege
Bachelor’sDegree
AdvancedDegree
Source: Pew analysis using data from the Current Population Survey, December 2009Note: Numbers are not seasonally adjusted

A YEAR OR MORE: The high CosT of Long-Term UnempLoymenT |
Pew Economic Policy Group: FISCAL ANALYSIS INITIATIVE
7
the FisCal imPaCt oF lonG-term unemPloymentA high rate of long-term unemployment has had a direct impact on the federalbudget by prompting the extension of normal unemployment benefits, ratcheting upspending on other government safety-net programs and by reducing taxable wages.
The standard mechanism for providing unemployment compensation is the federal-stateUnemployment insurance (Ui) program, which provides unemployment insurancefor a maximum of 26 weeks.34 The benefits vary by state, but weekly benefits generallyreplace between 50 and 70 percent of wages.35 state Ui taxes levied on employerspay for most of these benefits. in 1970, Congress created the extended Benefits program,which provides an additional 13 weeks of benefits during times of high unemployment,with the option to extend to 20 weeks when the jobless rate is especially high.36 statespay for half of this program with Ui taxes and the federal government covers theother half using revenue from federal Unemployment Taxes.37
A third program, the emergency Unemployment Compensation program, is a temporaryextension of benefits that Congress approved in 2008. This program offers differentlevels of benefits based in part on state unemployment rates.38
in each fiscal year between 2005 and 2007, annual federal spending on unemploymentinsurance ranged between $31 and $33 billion.39 in fiscal year 2008, however, it roseto $43 billion40 and reached $119 billion in fiscal year 2009.41 federal spending onunemployment benefits could reach $168 billion in fiscal year 2010, a more thanfivefold increase from the years immediately preceding the recession.42
regular Ui benefits account for $81 billion of that $168 billion. The remaining$87 billion represents the cost of additional unemployment aid that Congress has approved(or is poised to approve) to address the problem of long-term unemployment.43
This extra spending is the result of a series of steps Congress has taken to helpthe unemployed:
Congress approved the first extensions to emergency UnemploymentCompensation benefits in early 2008. By the end of that year, anunemployed worker could receive benefits of up to 79 weeks in stateswith unemployment rates above 6 percent, and up to 66 weeks in stateswith rates below that threshold.44
The American recovery and reinvestment Act of 2009 (ArrA),enacted in february 2009, included another extension of benefits. Thefederal government agreed to cover 100 percent of extended Benefitsprogram costs, increase weekly benefits by $25 and provide an additional$7 billion to states to encourage them to liberalize their Ui eligibility rules.ArrA also exempted the first $2,400 of unemployment benefits fromfederal income taxes for the 2009 tax year.45 Altogether, the unemploymentassistance in ArrA cost $27 billion in fiscal year 2009 and is projectedto cost $31 billion in fiscal year 2010, according to CBo.46
Congress approved additional extensions of benefits in 2009. The Worker,homeownership, and Business Assistance Act extended Ui benefits forone week in all states, an additional 13 weeks in states with 6 percentunemployment and an additional six weeks in states with unemploymentrates above 8.5 percent. CBo estimated these extensions would cost thefederal government an additional $3 billion in fiscal year 2010.47 By theend of 2009, unemployed individuals in many states were eligible for upto 99 weeks of unemployment compensation through the various programsand extensions.
in early 2010, Congress approved extending unemployment benefitsthrough the beginning of April 2010.48 CBo estimates that this extensionwill cost about $7 billion in 2010.49 finally, the house and senate haveapproved legislation that would extend benefit eligibility through theend of 2010. This measure, which has not yet become law, wouldcost an additional $24 billion in 2010, according to CBo.50
The federal government has provided additional aid to unemployed workers byhelping them pay for health insurance under the Consolidated omnibus Budgetreconciliation Act (CoBrA). generally, CoBrA allows people who lose theirhealth coverage when they lose their jobs to continue to pay group rates for insurance,though they must cover the entire cost of the premiums themselves. Under ArrA,the federal government agreed to pay 65 percent of health insurance premiums for aperiod of up to nine months for workers laid off between september 2008 and theend of 2009. Congress later extended this period to 15 months.51 According toCBo, the CoBrA provision in ArrA cost about $14.3 billion in fiscal year 2009and will cost $9.2 billion in fiscal year 2010.52 A proposed extension through theend of 2010 would cost an additional $6 billion.53
high unemployment also has contributed to a sharp spike in the number of individualsand families receiving food assistance. spending on the supplemental nutritionAssistance program (snAp), formerly known as food stamps, rose from $35 billionin fiscal year 200754 to $56 billion in fiscal year 2009. CBo estimates that the programwill cost $71 billion in fiscal year 2010.55 figure 8 illustrates the cumulative effectof the increases in unemployment benefits and selected federal aid.
Long-term unemployment also affects the federal budget on the other side of the fiscalledger by reducing income tax revenue and the amount of money flowing into theunemployment insurance pool. Ui benefits are taxable, but people on the unemploymentrolls are receiving only a fraction of the income they would be getting if they wereworking. As a result, they are paying only a fraction of the taxes.
The recession has caused a precipitous decline in federal income tax receipts. most ofthe decline is not due to unemployment; much of it is due to lower wages for workerswho still have their jobs, as well as the tax cuts in the various stimulus acts passed in2009. nevertheless, rising unemployment—along with its corresponding reductionin personal income—has contributed to the decline.
Pew Economic Policy Group: FISCAL ANALYSIS INITIATIVE
| A YEAR OR MORE: The high CosT of Long-Term UnempLoymenT8

Consider a hypothetical worker earning $50,000 in 2009. After a personalexemption of $3,650 and a standard deduction of $5,700, he would owe $6,356 infederal income taxes (excluding all other credits and deductions). But if the workerlost his job on July 1 and received Ui benefits that replaced half of his wages for theremainder of the year, his annual income would decline to about $37,500. ArrAexempts the first $2,400 of Ui benefits from taxes. With the personal exemption andstandard deduction, he would only owe $3,449 in income taxes—$2,907 less thanif he had been employed for the entire year.
moreover, a spell of long-term unemployment can depress a person’s wages in futurejobs. When a worker is out of a job, he or she loses out on the opportunity to gainwork experience and accumulate skills. This “unemployment scarring” can havea dramatic effect on future income. one study found that on average, U.s. workerswho lost a full-time job between 2001 and 2003 and found a new job by the timethey were interviewed in 2004 earned about 17 percent less per week than theywould have earned if they had retained their old job.56
many media reports have focused on the human toll of long-term unemployment,particularly its impact on individuals and families. far less attention has been paid tothe fiscal impact of this problem. it has been substantial: The government has spenttens of billions of dollars to help the unemployed, and it is likely to spend billionsmore before the economy fully recovers.
A YEAR OR MORE: The high CosT of Long-Term UnempLoymenT |
Pew Economic Policy Group: FISCAL ANALYSIS INITIATIVE
9
FiGure 8: Federal spending on unemployment benefits, Cobra and snaP, 2007–2010In Billions of Dollars
300
250
200
150
100
50
2007 2008 2009 Projected2010
Source: Pew analysis using data from the Congressional Budget Office and the Joint Committee on TaxationNotes: COBRA = Consolidated Omnibus Budget Reconciliation Act of 1986SNAP = Supplemental Nutrition Assistance ProgramUI = Unemployment Insurance
Regular UI BenefitsAdditional UI BenefitsSupplemental Nutrition Assistance Program (SNAP)COBRA Premium ReductionTax Exclusion for Unemployment Benefits
the Possible PersistenCe oF lonG-term unemPloymentThere are several reasons to believe that the high rate of long-term unemploymentwill persist for some time.
first, during the recent recession average weekly hours worked in the private sectorfell sharply to a level significantly below that of previous recessions. As the economyrecovers, firms may respond by boosting the hours of existing workers, rather thanhiring new ones.57
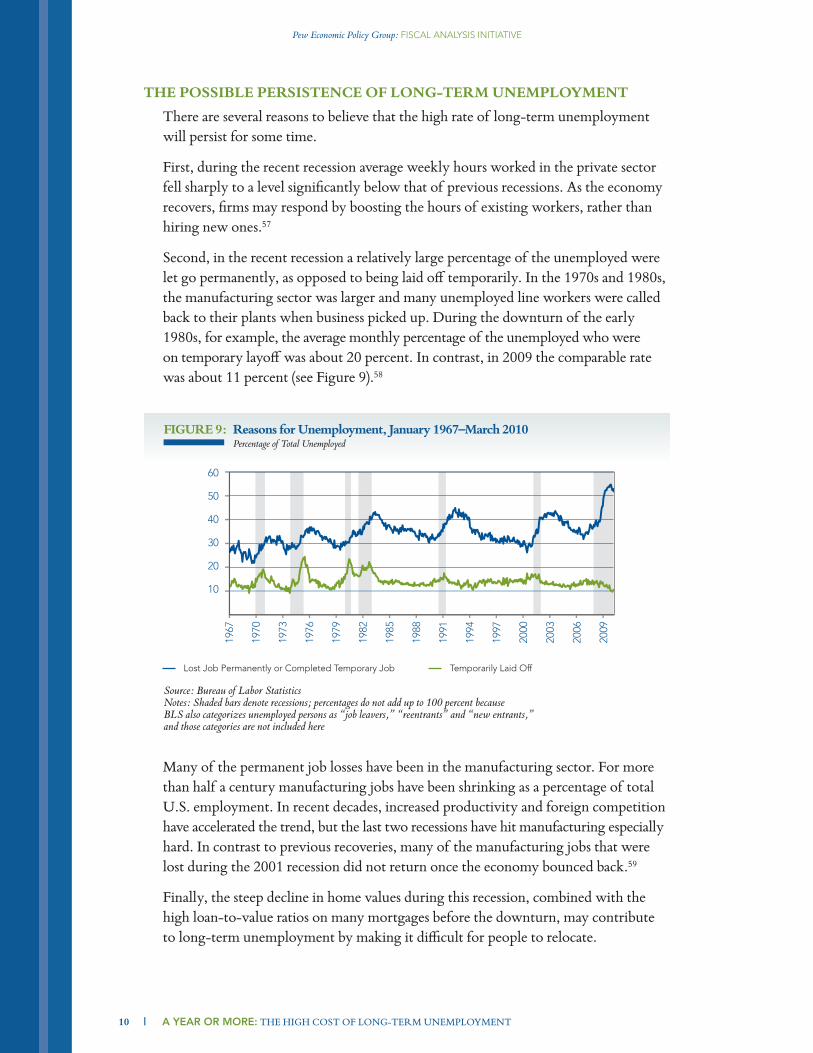
second, in the recent recession a relatively large percentage of the unemployed werelet go permanently, as opposed to being laid off temporarily. in the 1970s and 1980s,the manufacturing sector was larger and many unemployed line workers were calledback to their plants when business picked up. During the downturn of the early1980s, for example, the average monthly percentage of the unemployed who wereon temporary layoff was about 20 percent. in contrast, in 2009 the comparable ratewas about 11 percent (see figure 9).58
many of the permanent job losses have been in the manufacturing sector. for morethan half a century manufacturing jobs have been shrinking as a percentage of totalU.s. employment. in recent decades, increased productivity and foreign competitionhave accelerated the trend, but the last two recessions have hit manufacturing especiallyhard. in contrast to previous recoveries, many of the manufacturing jobs that werelost during the 2001 recession did not return once the economy bounced back.59
finally, the steep decline in home values during this recession, combined with thehigh loan-to-value ratios on many mortgages before the downturn, may contributeto long-term unemployment by making it difficult for people to relocate.
Pew Economic Policy Group: FISCAL ANALYSIS INITIATIVE
| A YEAR OR MORE: The high CosT of Long-Term UnempLoymenT10
FiGure 9: reasons for unemployment, January 1967–march 2010Percentage of Total Unemployed
60
50
40
30
20
10
Source: Bureau of Labor StatisticsNotes: Shaded bars denote recessions; percentages do not add up to 100 percent becauseBLS also categorizes unemployed persons as “job leavers,” “reentrants” and “new entrants,”and those categories are not included here
1967
1970
1973
1976
1979
1982
1985
1988
1991
1994
1997
2000
2003
2006
2009
Temporarily Laid OffLost Job Permanently or Completed Temporary Job
many Americans owe more on their mortgages than their houses are worth: in the fourthquarter of 2009, more than 11.3 million, or 24 percent, of all residential propertieswith mortgages had negative equity.60 These homeowners will lose money on the saleof their homes, which could make it difficult for them to move to an area with betterjob prospects.
in many respects this recession is unprecedented and thus forecasting the recovery isparticularly difficult. however, if the recovery from this recession follows the patternset by the last two, gross Domestic product (gDp) and job growth will be sluggish forsome time. gDp rose by only 2.6 percent in the four quarters following the recessionof 1990-1991, and there was little job growth. The recovery from the 2001 recessionwas even slower. in the six quarters following that downturn, real gDp grew by2.1 percent and employment declined by more than one million.61
summary anD ConClusionsThe nation’s long-term unemployment rate is historically high, and it has had asubstantial impact on families, government budgets and the country’s overall economichealth. pew’s finding that nearly a quarter of the unemployed have been out of workfor a year or more casts new light on the extent of the problem.
federal spending on unemployment benefits could reach $168 billion in fiscal year2010, more than five times the cost of benefits in the years immediately precedingthe downturn.62 more than half of that amount represents the cost of extendedbenefits. The federal government’s decision to help unemployed workers pay for healthinsurance cost an additional $14.3 billion in fiscal year 2009, and could cost as much as$15 billion in fiscal year 2010.63 The high long-term unemployment rate also hasspurred increased spending on other government safety-net programs andcontributed to a decline in federal tax receipts.
The country may have to contend with a high rate of long-term unemployment forsome time. in the 1970s and 1980s, many workers were laid off temporarily and rehiredonce business picked up again. many of those who lost their jobs in the recent recessionwere let go permanently and will not be called back once the economy improves.
Long-term unemployment cuts across nearly every industry and occupation. evenin fields with overall unemployment rates that are relatively low, workers who becomeunemployed are remaining jobless for long periods of time. Workers older than 55 andthose who are highly educated are less likely to become unemployed, but many ofthem are experiencing long jobless spells once they become unemployed.
in conclusion, long-term unemployment is affecting millions of American families,government budgets and the economy as a whole. policy makers have sought to helpthe long-term jobless by extending unemployment benefits and other safety-net programs.Despite increasing fiscal restraints, they will be under pressure to take additionalaction before the recovery takes hold and the long-term unemployment rate returnsto a lower level.
A YEAR OR MORE: The high CosT of Long-Term UnempLoymenT |
Pew Economic Policy Group: FISCAL ANALYSIS INITIATIVE
11
Pew Economic Policy Group: FISCAL ANALYSIS INITIATIVE
| A YEAR OR MORE: The high CosT of Long-Term UnempLoymenT12
under 20 20-24 25-34 35-44 45-54 55-64 65+ total
IN THOUSANDS
Employed 4,272 12,343 29,875 30,831 33,325 21,114 6,193 137,953
Unemployed
Less than 26 weeks 1,039 1,463 1,993 1,790 1,516 774 268 8,844
27-51 weeks 141 268 592 530 591 339 71 2,532
52 weeks or more 231 390 681 661 793 468 141 3,364
Total 1,412 2,120 3,267 2,981 2,900 1,581 479 14,740
Labor Force 5,684 14,463 33,141 33,812 36,225 22,695 6,672 152,693
AS PERCENTAGE OF LABOR FORCE
Unemployed
Less than 26 weeks 18.3 10.1 6.0 5.3 4.2 3.4 4.0 5.8
27-51 weeks 2.5 1.9 1.8 1.6 1.6 1.5 1.1 1.7
52 weeks or more 4.1 2.7 2.1 2.0 2.2 2.1 2.1 2.2
AS PERCENTAGE OF UNEMPLOYED
Unemployed
Less than 26 weeks 73.6 69.0 61.0 60.0 52.3 49.0 55.9 60.0
27-51 weeks 10.0 12.6 18.1 17.8 20.4 21.4 14.8 17.2
52 weeks or more 16.4 18.4 20.9 22.2 27.3 29.6 29.3 22.8
APPENDIX TABLES
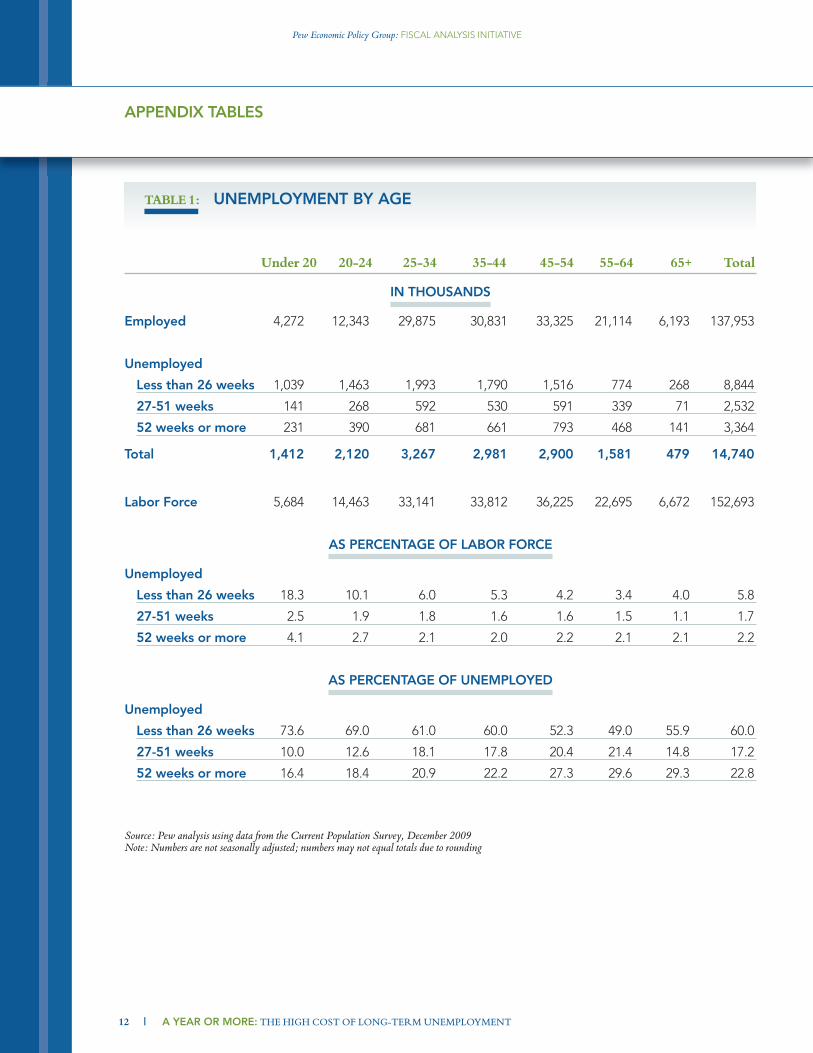
table 1: UNEMPLOYMENT BY AGE
Source: Pew analysis using data from the Current Population Survey, December 2009Note: Numbers are not seasonally adjusted; numbers may not equal totals due to rounding

A YEAR OR MORE: The high CosT of Long-Term UnempLoymenT |
Pew Economic Policy Group: FISCAL ANALYSIS INITIATIVE
13
IN THOUSANDS
Employed 10,123 33,803 33,660 28,131 15,620 16,615 137,953
Unemployed
Less than 26 weeks 1,164 2,236 1,684 912 347 2,502 8,844
27-51 weeks 296 708 644 352 123 409 2,532
52 weeks or more 432 1,062 808 338 104 621 3,364
Total 1,892 4,005 3,135 1,602 574 3,532 14,740
Labor Force 12,015 37,808 36,796 29,733 16,194 20,147 152,693
AS PERCENTAGE OF LABOR FORCE
Unemployed
Less than 26 weeks 9.7 5.9 4.6 3.1 2.1 12.4 5.8
27-51 weeks 2.5 1.9 1.7 1.2 0.8 2.0 1.7
52 weeks or more 3.6 2.8 2.2 1.1 0.6 3.1 2.2
AS PERCENTAGE OF UNEMPLOYED
Unemployed
Less than 26 weeks 61.5 55.8 53.7 56.9 60.4 70.8 60.0
27-51 weeks 15.7 17.7 20.5 22.0 21.5 11.6 17.2
52 weeks or more 22.9 26.5 25.8 21.1 18.1 17.6 22.8
table 2: UNEMPLOYMENT BY EDUCATION
Source: Pew analysis using data from the Current Population Survey, December 2009Notes: Education data only includes workers age 25 and over; “Other” includes individuals under age 25;numbers are not seasonally adjusted; numbers may not equal totals due to rounding
less thanhigh school
high schoolDiploma
someCollege
bachelor’sDegree
advancedDegree other total

Pew Economic Policy Group: FISCAL ANALYSIS INITIATIVE
| A YEAR OR MORE: The high CosT of Long-Term UnempLoymenT14
INTH
OUSA
NDS
Employed
1,189
667
6,956
12,878
18,523
5,425
2,755
8,624
12,907
20,081
11,301
5,758
30,889
137,953
Unemployed
Lessthan
26weeks
251
511,266
882
1,097
295
149
368
887
745
1,093
286
1,474
8,844
27-51weeks
1624
364
406
301
109
36141
277
188
245
94330
2,532
52weeks
ormore
2515
414
460
453
135
71157
321
250
285
133
646
3,364
Total
292
892,044
1,747
1,851
539
256
665
1,486
1,183
1,624
513
2,451
14,740
LaborForce
1,481
756
9,000
14,625
20,374
5,964
3,011
9,289
14,393
21,265
12,924
6,271
33,340
152,693
ASPERCENTA
GEOFLA
BORFO
RCE
Unemployed
Lessthan
26weeks
17.0
6.7
14.1
6.0
5.4
4.9
4.9
4.0
6.2
3.5
8.5
4.6
4.4
5.8
27-51weeks
1.1
3.2
4.0
2.8
1.5
1.8
1.2
1.5
1.9
0.9
1.9
1.5
1.0
1.7
52weeks
ormore
1.7
2.0
4.6
3.1
2.2
2.3
2.3
1.7
2.2
1.2
2.2
2.1
1.9
2.2
ASPERCENTA
GEOFUNEMPLO
YED
Unemployed
Lessthan
26weeks
85.9
56.7
62.0
50.5
59.3
54.7
58.2
55.3
59.7
63.0
67.3
55.7
60.2
60.0
27-51weeks
5.6
26.8
17.8
23.2
16.3
20.2
14.2
21.2
18.7
15.9
15.1
18.3
13.5
17.2
52weeks
ormore
8.5
16.5
20.2
26.3
24.5
25.0
27.6
23.5
21.6
21.1
17.6
26.0
26.4
22.8
table 3: UNEMPLOYMENT BY INDUSTRY
Source:PewanalysisusingdatafromtheCurrentPopulationSurvey,December2009
Note:Numbersarenotseasonallyadjusted;numbersmaynotequaltotalsduetorounding
Constructi
onman
ufacturin
g wholes
ale
&retailt
rade tran
sportatio
n
&utilitie
sinform
ation
Financia
l
activitie
sProfes
sional
&business
education
&health
leisure
&hospita
lityother
service
other
total
mining
agricultu
re,
Forestry
&Fishing
A YEAR OR MORE: The high CosT of Long-Term UnempLoymenT |
Pew Economic Policy Group: FISCAL ANALYSIS INITIATIVE
15
IN THOUSANDS
Employed 52,131 24,216 33,296 869 11,748 15,692 - 137,953
Unemployed
Less than 26 weeks 1,413 1,829 1,853 204 1,565 1,345 634 8,844
27-51 weeks 515 352 595 15 454 442 160 2,532
52 weeks or more 581 566 736 23 542 638 278 3,364
Total 2,509 2,747 3,184 242 2,560 2,425 1,072 14,740
Labor Force 54,640 26,963 36,480 1,111 14,309 18,117 1,072 152,693
AS PERCENTAGE OF LABOR FORCE
Unemployed
Less than 26 weeks 2.6 6.8 5.1 18.3 10.9 7.4 5.8
27-51 weeks 0.9 1.3 1.6 1.4 3.2 2.4 1.7
52 weeks or more 1.1 2.1 2.0 2.1 3.8 3.5 2.2
AS PERCENTAGE OF UNEMPLOYED
Unemployed
Less than 26 weeks 56.3 66.6 58.2 84.3 61.1 55.5 60.0
27-51 weeks 20.5 12.8 18.7 6.3 17.7 18.2 17.2
52 weeks or more 23.1 20.6 23.1 9.5 21.2 26.3 22.8
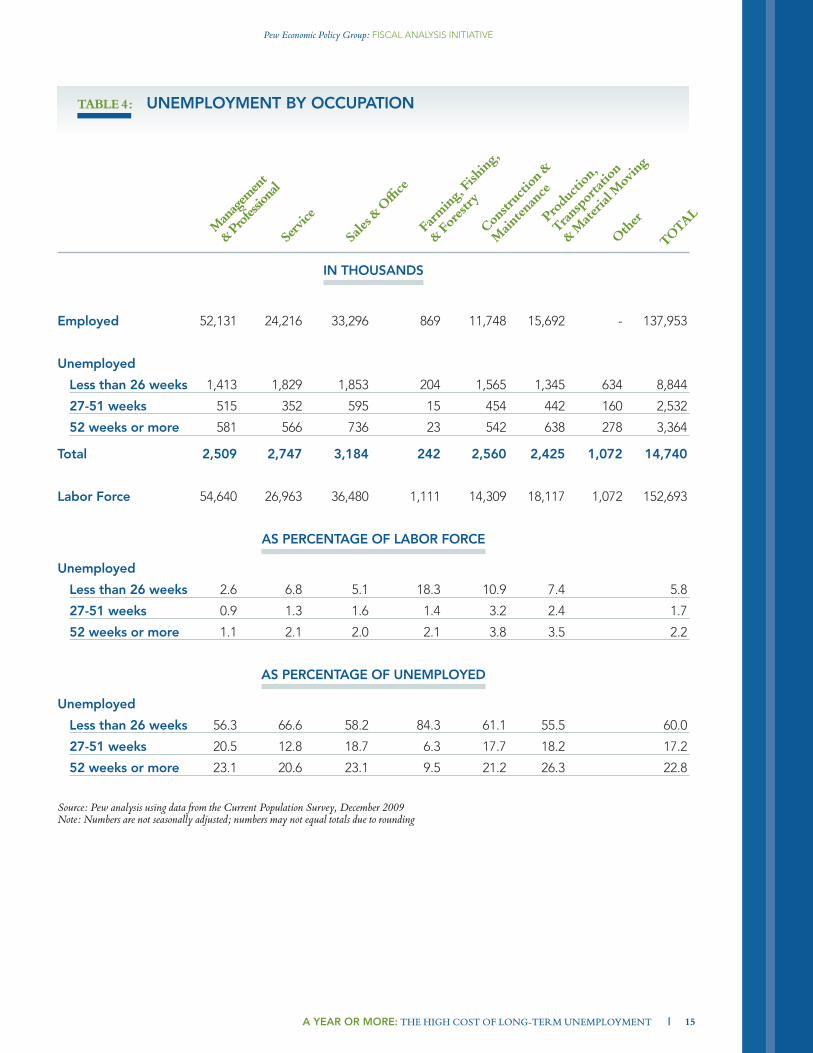
table 4: UNEMPLOYMENT BY OCCUPATION
Source: Pew analysis using data from the Current Population Survey, December 2009Note: Numbers are not seasonally adjusted; numbers may not equal totals due to rounding
manag
emen
t
&Professio
nal
service
sales &
office
Farming, Fish
ing,
&Fores
try
Constructi
on &
main
tenan
ce
Producti
on,
transp
ortatio
n
&m
ateria
l moving
other
total
1 U.s. Department of Labor, Bureau of Labor statistics, The Employment Situation, Table A-12(march 2010). This rate is seasonally adjusted. The Department of Labor only begankeeping unemployment records in their current form in 1948. however, the overallunemployment rate in the immediate post-World War ii period was low: in both 1946and 1947, it was 3.9 percent.
2 U.s. Department of Labor, Bureau of Labor statistics,Historical Data, Table A-12.The recession of the early 1980s lasted for 16 months.
3 pew calculation from the Current population survey in December 2009. The Cps data arenot seasonally adjusted. The December figures are used because there are only small differencesin December between the seasonally adjusted and non-seasonally adjusted measures of theshare of unemployed workers who have been without a job for six months or longer.other recent months present qualitatively similar results.
4 Ibid.5 Ibid.6 Congressional Budget office, The Budget and Economic Outlook (september 2008), p. 8;
(August 2007), p. 12; (August 2006), p. 12.7 The estimate for regular benefits is from: Congressional Budget office,AnAnalysis ofthe President’s Budgetary Proposals for Fiscal Year 2011 (march 2010), supplemental Data onUnemployment Compensation.The estimate for additional unemployment benefits is from three sources. The estimatefor the cost of benefit eligibility through february is from: Congressional Budget office,AnAnalysis of the President’s Budgetary Proposals for Fiscal Year 2011 (march 2010), supplementalData on Unemployment Compensation. The estimate for the cost of extending benefiteligibility through April 5, 2010 is from: Congressional Budget office,H.R. 4691, TemporaryExtension Act of 2010, as introduced on February 25, 2010. finally, the estimate for the projectedcost of a bill extending benefit eligibility through the end of 2010, which the house andsenate have passed separately, but which had not yet become law at the time of publication,is from: Congressional Budget office, Budgetary Effects of the AmericanWorkers, State, andBusiness Relief Act of 2010, H.R. 4213, as passed by the Senate onMarch 10, 2010.
8 Christopher A. pissarides, “Loss of skill During Unemployment and the persistence of employmentshocks,” The Quarterly Journal of Economics,Vol. 107, no. 4, (november 1992), p. 1381.
9 Congressional Budget office, Long-TermUnemployment (october 2007), p. 11.10 Congressional Budget office, The Budget and Economic Outlook: Fiscal Years 2010 to 2020
( January 2010), p. 5. This figure includes $27 billion from the American recoveryand reinvestment Act and $17 billion for other extensions.
11 Congressional Budget office, The Budget and Economic Outlook: Fiscal Years 2010 to 2020( January 2010), p. 25.
12 U.s. Department of Labor, Bureau of Labor statistics, The Employment Situation(november 2009) andHistorical Data.
13 U.s. Department of Labor, Bureau of Labor statistics, The Employment Situation(march 2010).
14 U.s. Department of Labor, Bureau of Labor statistics, Regional and State Employmentand Unemployment Summary (march 2010).
15 U.s. Department of Labor, Bureau of Labor statistics, The Employment Situation, Table A-15(march 2010).
Pew Economic Policy Group: FISCAL ANALYSIS INITIATIVE
| A YEAR OR MORE: The high CosT of Long-Term UnempLoymenT16
NOTES

16 Ibid., Historical Data, Table A-15 (seasonally adjusted). The Bureau of Labor statistics begantracking this statistic in its current form in 1994.
17 U.s. Department of Labor, Bureau of Labor statistics, The Employment Situation.( January 2010), p. 2.
18 Congressional Budget office, The Budget and Economic Outlook: Fiscal Years 2010 to 2020( January 2010), p. 34.
19 U.s. Department of Labor, Bureau of Labor statistics, The Employment Situation, Table A-12(march 2010). This rate is seasonally adjusted.
20 U.s. Department of Labor, Bureau of Labor statistics,Historical Data, Table A-12.21 21 U.s. Department of Labor, Bureau of Labor statistics, The Employment Situation,
Table A-12 (november 2007 and march 2004).22 pew calculation using data from the Current population survey, December 2009.23 U.s. Department of Labor, Bureau of Labor statistics,The Employment Situation, (December
2009). All of the unemployment rates in this section are not seasonally adjusted, to beconsistent with the one-year calculation.
24 U.s. Department of Labor, Bureau of Labor statistics,TheEmployment Situation,historical Database.
25 U.s. Department of Labor, Bureau of Labor statistics, The Employment Situation,Table A-4 (December 2009 and December 2007).
26 U.s. Department of Labor, Bureau of Labor statistics, The Employment Situation,Table A-4 (December 2009).
27 pew calculation using data from the Current population survey, December 2009.28 Ibid.29 U.s. Department of Labor, Bureau of Labor statistics, The Employment Situation,
Table A-4 (December 2009).30 pew calculation using data from the Current population survey, December 2009.31 Ibid.32 U.s. Department of Labor, Bureau of Labor statistics, The Employment Situation,
Table A-14 (December 2009).33 pew calculation using data from the Current population survey, December 2009.34 U.s. Department of Labor, State Unemployment Insurance Benefits Fact Sheet (updated
January 13, 2010).35 U.s. Department of Labor, employment and Training Administration,Comparison of StateUnemployment Insurance Laws, Table 3-5 (updated January 1, 2009).
36 U.s. Department of Labor,UnemploymentExtendedBenefits Fact Sheet (updated november 19, 2009).37 Congressional research service, Temporary Programs to Extend Unemployment Compensation
(updated January 24, 2003), p. 1.38 U.s. Department of Labor, Emergency Unemployment Compensation 2008 (EUC) Program
(accessed at http://www.ows.doleta.gov/unemploy/pdf/euc08.pdf ).39 Congressional Budget office, The Budget and Economic Outlook (september 2008),
p. 8; (August 2007), p. 12; (August 2006), p. 12.40 Congressional Budget office,TheBudget andEconomicOutlook (August 2009), p. 18.41 Congressional Budget office, The Budget and Economic Outlook: Fiscal Years 2010 to 2020
( January 2010), pp. 4.42 see note 7.43 Ibid.44 Congressional Budget office,H.R. 6867, Unemployment Compensation ExtensionAct of 2008 (December 22, 2008).
A YEAR OR MORE: The high CosT of Long-Term UnempLoymenT |
Pew Economic Policy Group: FISCAL ANALYSIS INITIATIVE
17

45 U.s. Department of Labor, Information Related to the American Recovery and ReinvestmentAct of 2009. Accessed at http://www.dol.gov/recovery/implement.htm.
46 Congressional Budget office,The Budget and Economic Outlook: Fiscal Years 2010 to 2020( January 2010), p. 96.
47 Ibid., p. 9.48 United states Congress, Temporary Extension Act of 2010 (march 2, 2010).
see http://frwebgate.access.gpo.gov/cgi-bin/getdoc.cgi?dbname=111_cong_public_laws&docid=f:publ144.111.
49 Congressional Budget office,H.R. 4691, Temporary Extension Act of 2010, as introducedon February 25, 2010.
50 Congressional Budget office, Budgetary Effects of the AmericanWorkers, State, and Business ReliefAct of 2010, H.R. 4213 as passed by the senate on march 10, 2010.
51 U.s. Department of Labor, Fact Sheet: COBRA Premium Reduction.52 Congressional Budget office,H.R. 1, American Recovery and Reinvestment Act of 2009, Title
iii, health insurance Assistance (february 13, 2009), p. 4. in subsequent reports, (see TheBudget and Economic Outlook: Fiscal Years 2010 to 2020, Appendix ACBo confirmed the accuracyof the 2009 cost estimate.
53 Congressional Budget office,H.R. 4691, the Temporary Extension Act of 2010. As introducedon february 25, 2010. Joint Committee on Taxation. estimated revenue effects of therevenue provisions Contained in the American Workers, state, and Business relief Actof 2010 (march 10, 2010), p. 5.
54 Congressional Budget office, The Budget and Economic Outlook: Fiscal Years 2008 to 2018,( January 2008), p. 56.
55 Congressional Budget office,Analysis of the President’s Budgetary Proposals for Fiscal Year 2011,(march 2010); supplemental Table on mandatory spending.
56 henry s. farber, “What Do We Know About Job Loss in the United states? evidence fromthe Displaced Workers survey 1984-2004,” Economic Perspectives, federal reserve Bank ofChicago, vol. 29, no. 2 (2005), p. 25.
57 Congressional Budget office, Policies for Increasing Economic Growth and Employment in 2010and 2011 ( January 2010), p. 9.
58 U.s. Department of Labor, Bureau of Labor statistics,Historical Data, Table A-11.59 Congressional Budget office, Factors Underlying the Decline inManufacturing Employment Since2000 (December 23, 2008), p. 1.
60 These numbers come from a report released on february 23, 2010 by first AmericanCoreLogic. The estimate is based on 47 million properties with a mortgage, which accountsfor over 85 percent of all mortgages in the U.s.
61 Congressional Budget office, The Budget and Economic Outlook: Fiscal Years 2010 to 2020( January 2010), p. 34.
62 see note 7.63 Congressional Budget office,H.R. 1, American Recovery and Reinvestment Act of 2009, Title
iii, health insurance Assistance (february 13, 2009), p. 4. Congressional Budget office,H.R. 4691, Temporary Extension Act of 2010, as introduced on February 25, 2010. JointCommittee on Taxation, Estimated Revenue Effects of the Revenue Provisions Contained in theAmericanWorkers, State, and Business Relief Act of 2010 (march 10, 2010), p. 5.
Pew Economic Policy Group: FISCAL ANALYSIS INITIATIVE
| A YEAR OR MORE: The high CosT of Long-Term UnempLoymenT18

FISCALANALYSISINITIATIVE


![OntheCharacteristicsandReasons ofLong …johnh/PAPERS/Quan10a.pdfworks]: Internetworking GeneralTerms ... devices such as the Slingbox [14]. Computer-to-computer ... exploring how](https://img.pdfslide.us/doc/110x75/5ae940737f8b9a6d4f9083d4/onthecharacteristicsandreasons-oflong-johnhpapers-internetworking-generalterms.jpg)