Embed Size (px)
DESCRIPTION
Walkability study carried out in Hong Kong with field walakbility survey, pedestrian interviews providing insights into one of the best walkable cities of Asia
Citation preview
WWWAAALLLKKKAAABBBIIILLLIIITTTYYY IIINNN AAASSSIIIAAANNN CCCIIITTTIIIEEESSS
2010
PPPrrrooofff... WWW...TTT HHHuuunnnggg
RRR...SSS...AAA RRRaaannnsssiiinnnggghhheee
AAA... MMMaaannnaaannndddhhhaaarrr
TTThhheee HHHooonnnggg KKKooonnnggg PPPooolllyyyttteeeccchhhnnniiiccc UUUnnniiivvveeerrrsssiiitttyyy
MMMaaarrrccchhh 222000111000
AAA WWWaaalllkkkaaabbbiiillliiitttyyy SSSuuurrrvvveeeyyy iiinnn HHHooonnnggg KKKooonnnggg
2 | P a g e
CONTENTS
Page
Summary 3
Acknowledgements 3
1.0 Introduction 4
2.0 Objectives of the Study 5
3.0 Methodology 5
3.1 Field Walkability Survey 5
3.2 Selection of field walkability survey areas 5
3.3 Pedestrian Interview Survey 6
4.0 Data Collection and Analysis 7
5.0 Results and Discussion 9
6.0 Conclusion 18
7.0 References 19
8.0 ANNEXURES
i. Field Walkability Survey Form 21
ii. Field Survey Data Collection Guidelines 22
iii. Field Walkability Survey Area Maps 38
iv. Pedestrian Preference Survey Forms (English & Chinese) 62
v. Results of the Pedestrian Preference Survey -Mean Test
(by Social economic profile) 64
vi. Results of the Pedestrian Preference Survey- ANOVA by
Groups 113
vii. Results of the Pedestrian Preference Survey- Traffic
Mode Count Frequency 141
viii. Results of the Pedestrian Preference Survey- Single mode
of transport (walking) 180
ix. Results of the Pedestrian Preference Survey- Frequency
Analysis by Age Groups 190
x. Results of the Pedestrian Preference Survey- Frequency
Analysis by Household Income 200
SUMMARY
A walkability survey was conducted in Hong Kong as a first step towards helping city planners
understand scope and extent of existing pedestrian conditions and to identify specific pedestrian-
related shortcomings. The methodology for the survey was taken from The Global Walkability
Index (GWI) and Asian Development Bank/ Clean Air for Asian Cities (CAI-Asia) and improved
slightly to suit the local situation in Hong Kong.
It is found that very few elderly (>60 year old) walk from home for their daily travel and not willing
to walk long distance to access a transport. More than fifty percentage of people are satisfied with
the existing pedestrian facilities in the city and those who are not happy feel the need of
improvements in street lighting; clean, weather proof and wider foot paths; reducing road traffic
and speed; removal of obstacles along the walking paths and more crossing points. Elderly prefers
to have more ground level crossings as they do not prefer to walk either subways or elevated
walkways and are not willing to walk long distance to access the crossing points. They further
prefer to have less vehicle traffic on the roads that makes them feel safer and easier to cross the
road.
Among the nine variables that were evaluated in the field observational survey, walkways in
Commercial areas have the best infrastructures and level of service, including provision of facilities
for disables. Apart from commercial areas, all other surveyed areas scored very low in the provision
of facilities for disables. There are plenty rooms for improvements in this aspect in majority areas
of Hong Kong.
ACKNOWLEDGEMENTS
This study is supported by the Hong Kong Polytechnic University under Clean Air and Blue Skies
Project- Phase II, Clean Air Initiatives for Asian Cities (CAI-Asia). We would like to extend our
sincere gratitude to Christine Lee for her immense support from the very beginning of the study to
the end. We also like to appreciate Bert Fabian, Glynda Bathan and all the members from Clean
Air Initiatives for Asian Cities (CAI-Asia). Lastly, a special thanks to the students of Polytechnic
University for conducting the surveys.
4 | P a g e
1.0 INTRODUCTION
In the conventional transportation planning practices suggest that personal motor vehicle travel is
far more important than walking, representing about fifty times as many person-miles as non-
motorized travel. From a conventional planning perspective, walking (the activity) is a minor mode
of travel, and walkability deserves only modest public support. However with the rapid urban air
pollution, in modern sustainable mobility management strategies walking is becoming a major
green transportation mode among all the developed and developing countries. The many research
studies, found that Social and physical environmental factors are influence and correlates with
walking behaviors of the people. Walking is the physical activity behavior that is currently the main
focus of environmental and policy initiatives in public health (Owen et al, 2004).
Different agencies and personnel have developed several methodologies to assess walkability in
locations and cities during past decades. But due to lack of relevant data, those indexes did not able
to capture the issues related to pedestrian infrastructures (Eva, et al, 2007). This GWI was
developed by Holly Krambeck, a Master‟s Degree Candidate, of Massachusetts Institute of
Technology and sponsored by the World Bank. The CAI ASIA Center, Philippines initiated this
assessment of GWI among the Asian cities during last few years. So far, this GWI has been
conducted as a pilot studies in the Asian cities of Karachchi, Bangkok, Manila, etc. A pilot study
was carried out prior to the actual surveys, and we made some improvements in the original survey
methodologies in order to suit the local situation and with the objective of future cross country
comparisons. In this end we selected the GWI methodology to assess walkability related issues in
the major cities of Hong Kong. The GWI methodology comprises mainly three components,
namely the Field Walkability Survey, the Pedestrian Interview Survey and the
Government/Stakeholder Survey. However only the Field Walkability Survey and the
Government/Stakeholder Survey results will use to calculate GWI and Pedestrian Interview Survey
is conducted to find out the overall perception of Hong Kong pedestrian facilities, travel behaviors
with socio economic backgrounds and their opinions and expectations about the development of
existing pedestrian facilities.
The „walkability‟ of a community may be conceptualized as the extent to which characteristics of
the built environment and land use may or may not be conducive to residents in the area walking for
either leisure, exercise or recreation, to access services, or to travel to work (Eva et al, 2007). There
are many definitions and ways to consider “walkability”. It can be simply define as the overall
support for pedestrian travel in an area. But, although a significant number of trips are made by
foot in developing cities, pedestrian infrastructure, amenities, and services are often neglected in
municipal planning and budgets (Fang 2005). Because the most developing countries cities do not
make pedestrian planning a priority and there are few incentives for them to do so. Therefore the
major rationale behind the walkability is assessment of the quality of the walking facilities available
in the cities. In this regard the Walkability Index comprises of three components: safety and
security, convenience, and degree of policy support. The expectations from these components are to
determine the relative safety and security of the walking environment, to reflect the relative
convenience and attractiveness of the pedestrian network and to find out the degree to which the
municipal government or policy supports improvements in pedestrian infrastructure and related
services accordingly.
5 | P a g e
2.0 OBJECTIVES OF THE STUDY
The main objective of the conducting the walkability index survey in Hong Kong is to identify
specific pedestrian-related shortcomings, and recommendations for next steps to improve pedestrian
conditions and provide city officials with an incentive to address walkability issues. The Global
Walkability Index (GWI) is a comparative study which to rank cities across the world based on the
safety, security, and convenience of their pedestrian environments that helping city planners
understand the scope and extent of local pedestrian conditions relative to other cities. Therefore this
would be a positive step towards improving the quality of the pedestrian environment.
Specifically, the study aims to:
1. Generate awareness of walkability as an important issue in developing cities;
2. Help city planners understand scope and extent of local pedestrian conditions, relative to other
cities.
3. Understand pedestrian opinion on existing pedestrian facilities in the city.
3.0 METHODOLOGY
3.1 Field Walkability Survey
After studying of the Global Walkability Index (GWI) development report of Holly Krambeck, CAI
ASIA/ADB and World Bank guidelines on walkability surveys we conducted 5-6 pilot field surveys
in selected stretches (Whampoa Garden, Nathan Street, etc). The main objective of this survey was
got familiarized and to do field testing of the ratings system provided by CAI ASIA/ADB and
World Bank for different levels of services (LOS) in pedestrian walkways (Annex1) prior to the
actual survey began.
According to the actual field observations and experience obtained through the pilot surveys it was
decided to change the field survey rating descriptions and examples to well suit with the local
condition in Hong Kong. The Hong Kong field walkability survey rating description was developed
considering both of the CAIASIA/ADB and World Bank rating description and no any significant
changes were made and used same field walkability suvey form for the data collection (Annex 1 &
2).
3.2 Selection of field walkability survey areas
According to the GWI guidelines the field observational surveys are to be carried out in the areas
such as commercial, residential, educational, public transport terminals etc. However, in Hong
Kong has mixed land use types and difficult to demarcate as commercial, residential, educational
center. Therefore to have a good representation ten (10) biggest centers of attraction in six types of
land use mixes in urban areas like housing state, educational center, public transport terminals were
6 | P a g e
identified and the most popular commuting pedestrian routes at each of these ten locations were
selected. At least two routes at each location were surveyed.
The centers and the survey routes were then traced out using Google map for reference (Annex 2).
The pilot field survey was conducted in the selected areas prior to the real survey to find out if the
routes selected from the map represent the actual situation. After the pilot survey, some routes
which were not often used by the pedestrian were discarded and selected another most commuting
route for the survey. Similar changes were done for the other areas as well. The students from
Polytechnic University conducted survey in ten areas which were later categorized into six different
area types. The following table 1 shows the name of the top ten centers of attraction and the area
type.
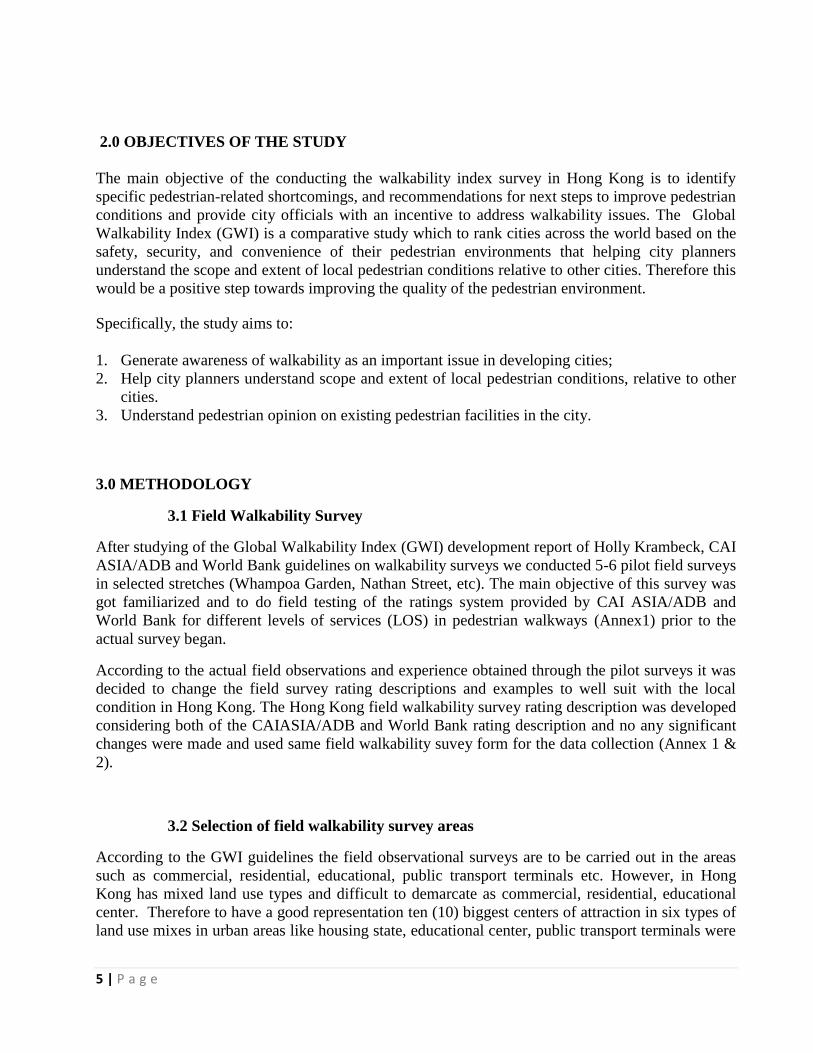
Table 1: Field observational surveys areas
S.N. Name of the Area Area Type
1 Whampoa Garden Residential Area
2 Parc Oasis
6 Hong Kong cultural center Commercial Area
7 Hong Kong Convention and Exhibition Center
8 Kwung Tong Industrial Area
3 Ladies‟s Street Shopping Area
4 Fa Yuen Street
5 Temple Street
9 Hong Kong Central Library Commercial Educational Area
10 Baptist University Residential Educational Area
3.3 Pedestrian Interview Survey
Interviewer administrative questionnaire survey was carried out with random sampling for 1029
students/workers at selected busy streets to identify the pedestrian preference in Hong Kong. A
questionnaire was designed to find out the overall perception of Hong Kong pedestrian facilities
and travel habit. Demographic information was also ascertained for statistical analysis purposes.
A pilot study was carried out in the Polytechnic University premises using CAI ASIA/ADB
questionnaire prior to the actual survey, and necessary changes in the questionnaire were made
accordingly to suite to the local situation. The questionnaire was first written in English and later
translated to Chinese (Annex 3). Interviewers distributed the questionnaires and conducted face to
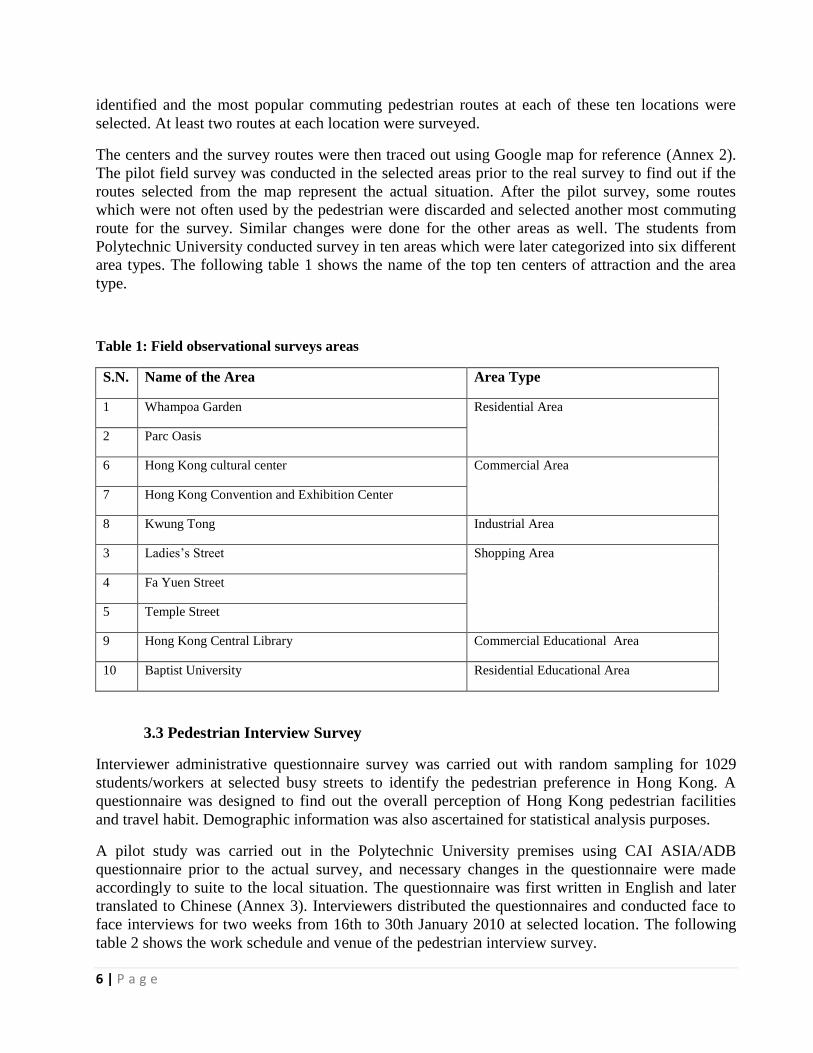
face interviews for two weeks from 16th to 30th January 2010 at selected location. The following
table 2 shows the work schedule and venue of the pedestrian interview survey.
7 | P a g e
Table 2: Pedestrian interview work schedule
4.0 DATA COLLECTION AND ANALYSIS
The pedestrian interview survey involves designing a questionnaire to find out the people‟s
perception of pedestrian facilities. The survey, was targeted the workers and students as potential
interviewees. By reference to the statistical report (Hong Kong Census and Statistics Department
annual reports 2009), there were 3, 497, 000 active workers and 478, 173 students. We decided to
use simple random sampling method for the survey. In pilot study, 48 samples were obtained and
the maximum variance of questions in the questionnaire was 1.2642. After calculation, around 1030
samples were needed for estimating the population mean with a bound on the error of estimation
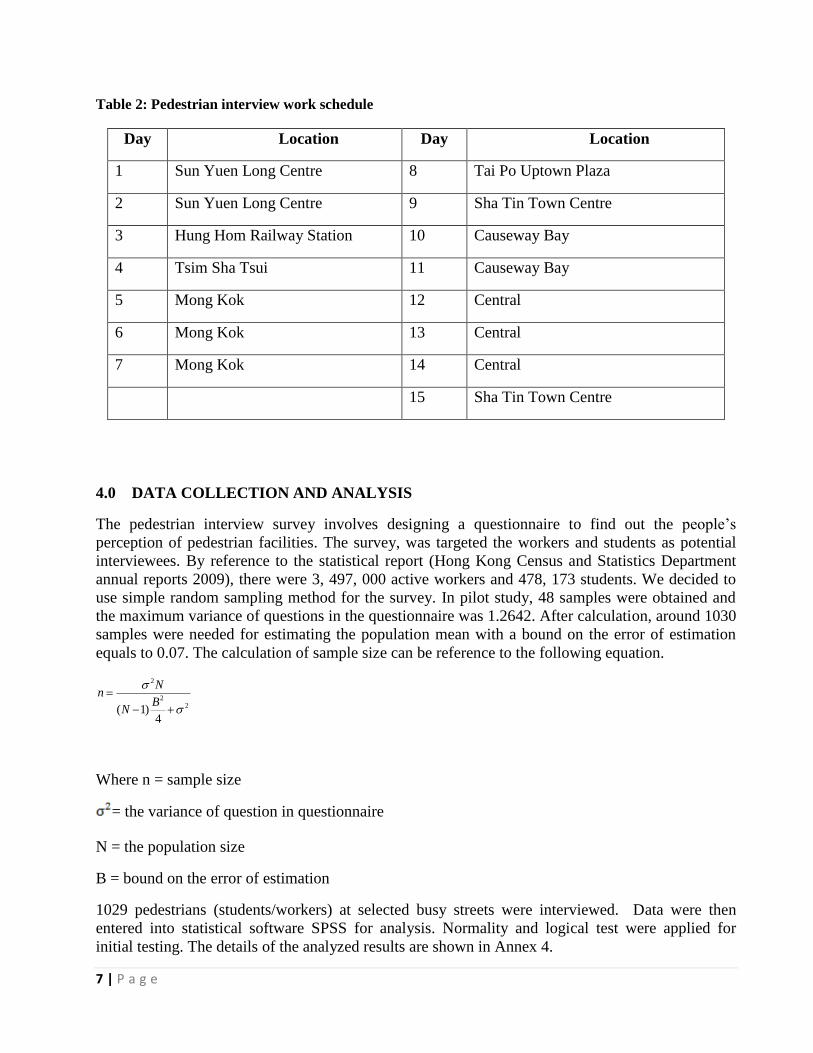
equals to 0.07. The calculation of sample size can be reference to the following equation.
2
22( 1)
4
Nn
BN
Where n = sample size
= the variance of question in questionnaire
N = the population size
B = bound on the error of estimation
1029 pedestrians (students/workers) at selected busy streets were interviewed. Data were then
entered into statistical software SPSS for analysis. Normality and logical test were applied for
initial testing. The details of the analyzed results are shown in Annex 4.
Day Location Day Location
1 Sun Yuen Long Centre 8 Tai Po Uptown Plaza
2 Sun Yuen Long Centre 9 Sha Tin Town Centre
3 Hung Hom Railway Station 10 Causeway Bay
4 Tsim Sha Tsui 11 Causeway Bay
5 Mong Kok 12 Central
6 Mong Kok 13 Central
7 Mong Kok 14 Central
15 Sha Tin Town Centre
8 | P a g e
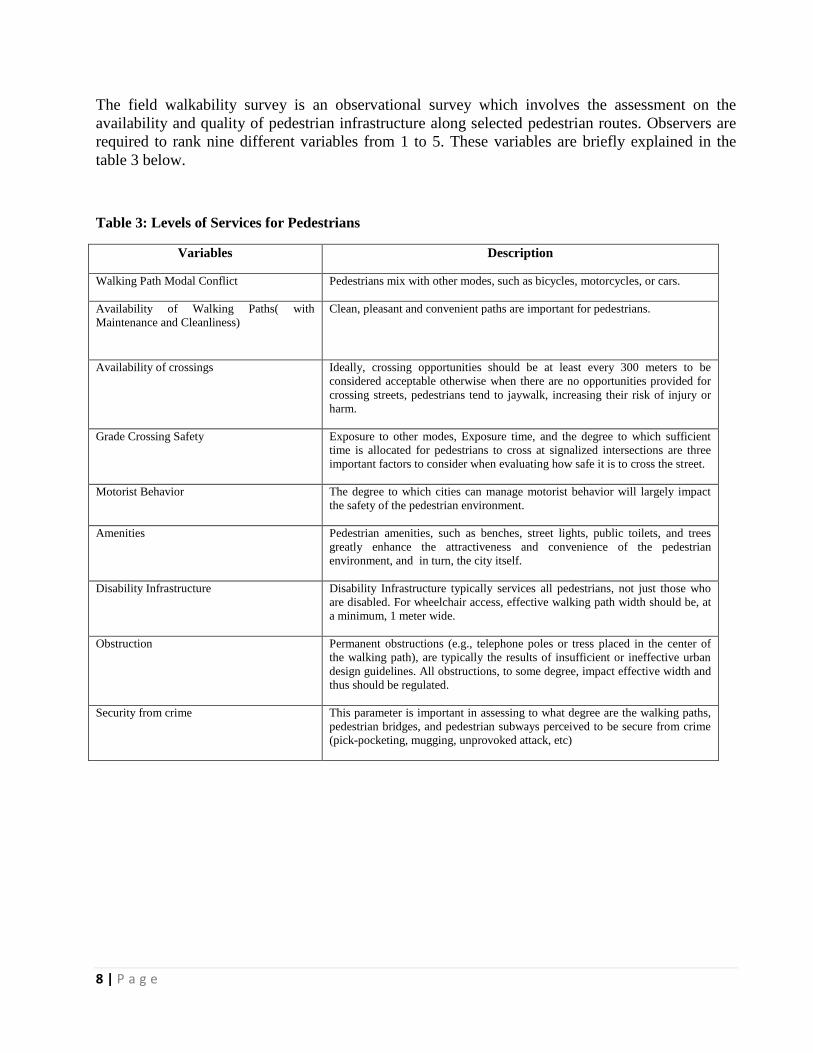
The field walkability survey is an observational survey which involves the assessment on the
availability and quality of pedestrian infrastructure along selected pedestrian routes. Observers are
required to rank nine different variables from 1 to 5. These variables are briefly explained in the
table 3 below.
Table 3: Levels of Services for Pedestrians
Variables Description
Walking Path Modal Conflict Pedestrians mix with other modes, such as bicycles, motorcycles, or cars.
Availability of Walking Paths( with
Maintenance and Cleanliness)
Clean, pleasant and convenient paths are important for pedestrians.
Availability of crossings Ideally, crossing opportunities should be at least every 300 meters to be
considered acceptable otherwise when there are no opportunities provided for
crossing streets, pedestrians tend to jaywalk, increasing their risk of injury or
harm.
Grade Crossing Safety Exposure to other modes, Exposure time, and the degree to which sufficient
time is allocated for pedestrians to cross at signalized intersections are three
important factors to consider when evaluating how safe it is to cross the street.
Motorist Behavior The degree to which cities can manage motorist behavior will largely impact
the safety of the pedestrian environment.
Amenities Pedestrian amenities, such as benches, street lights, public toilets, and trees
greatly enhance the attractiveness and convenience of the pedestrian
environment, and in turn, the city itself.
Disability Infrastructure Disability Infrastructure typically services all pedestrians, not just those who
are disabled. For wheelchair access, effective walking path width should be, at
a minimum, 1 meter wide.
Obstruction Permanent obstructions (e.g., telephone poles or tress placed in the center of
the walking path), are typically the results of insufficient or ineffective urban
design guidelines. All obstructions, to some degree, impact effective width and
thus should be regulated.
Security from crime This parameter is important in assessing to what degree are the walking paths,
pedestrian bridges, and pedestrian subways perceived to be secure from crime
(pick-pocketing, mugging, unprovoked attack, etc)
9 | P a g e
5.0 RESULTS AND DISCUSSION
A. Pedestrian Preference Survey Results
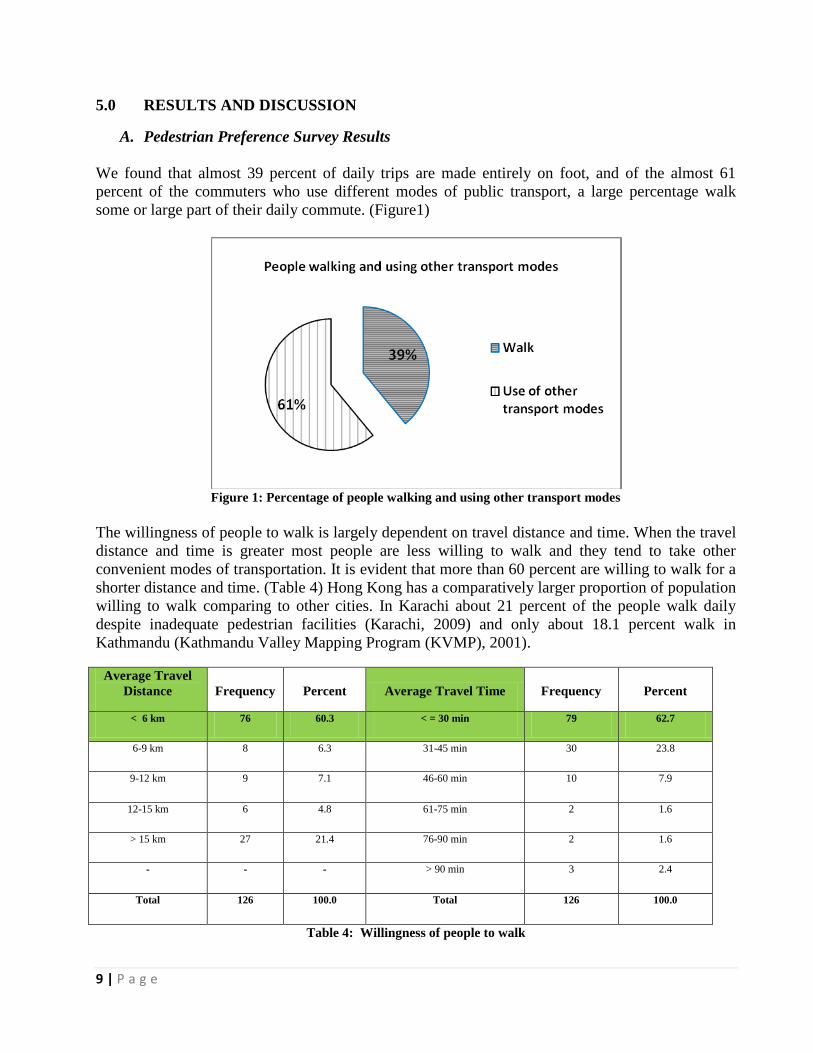
We found that almost 39 percent of daily trips are made entirely on foot, and of the almost 61
percent of the commuters who use different modes of public transport, a large percentage walk
some or large part of their daily commute. (Figure1)
Figure 1: Percentage of people walking and using other transport modes
The willingness of people to walk is largely dependent on travel distance and time. When the travel
distance and time is greater most people are less willing to walk and they tend to take other
convenient modes of transportation. It is evident that more than 60 percent are willing to walk for a
shorter distance and time. (Table 4) Hong Kong has a comparatively larger proportion of population
willing to walk comparing to other cities. In Karachi about 21 percent of the people walk daily
despite inadequate pedestrian facilities (Karachi, 2009) and only about 18.1 percent walk in
Kathmandu (Kathmandu Valley Mapping Program (KVMP), 2001).
Average Travel
Distance Frequency Percent Average Travel Time Frequency Percent
< 6 km 76 60.3 < = 30 min 79 62.7
6-9 km 8 6.3 31-45 min 30 23.8
9-12 km 9 7.1 46-60 min 10 7.9
12-15 km 6 4.8 61-75 min 2 1.6
> 15 km 27 21.4 76-90 min 2 1.6
- - - > 90 min 3 2.4
Total 126 100.0 Total 126 100.0
Table 4: Willingness of people to walk
10 | P a g e
However, the recent study conducted by the Clean Energy Nepal (CEN)/Clean Air Network Nepal
(CANN) to 305 pedestrians in Kathmandu showed that 88.9 percent of commuters‟ daily trips are
made entirely on foot. About 45.8 percent of the pedestrians in Kathmandu feel that the situation of
existing pedestrians‟ facilities in the city is in its worst condition (Cabrido Charina, 2010). Mumbai
has 55% of its population walking regularly. The study of 30 Indian cities shows that on an average,
almost 40% of all trips in urban India still do not involve motorized vehicles. (Pandit A, Bhasin R
& Suri M, 2009).
Also according to the walkability survey completed in Colombo in March 2010 by the University of
Moratuwa, 21% of the pedestrian feel that the pedestrian facilities in Colombo is in fair while 16%
think the facilities are good. Only 16% of the respondents feel that the existing facilities are not
good and only 4% feel that the facilities in the city is in its worst condition. However 44% of the
survey respondents are willing to shift from walking to other mode of transports.
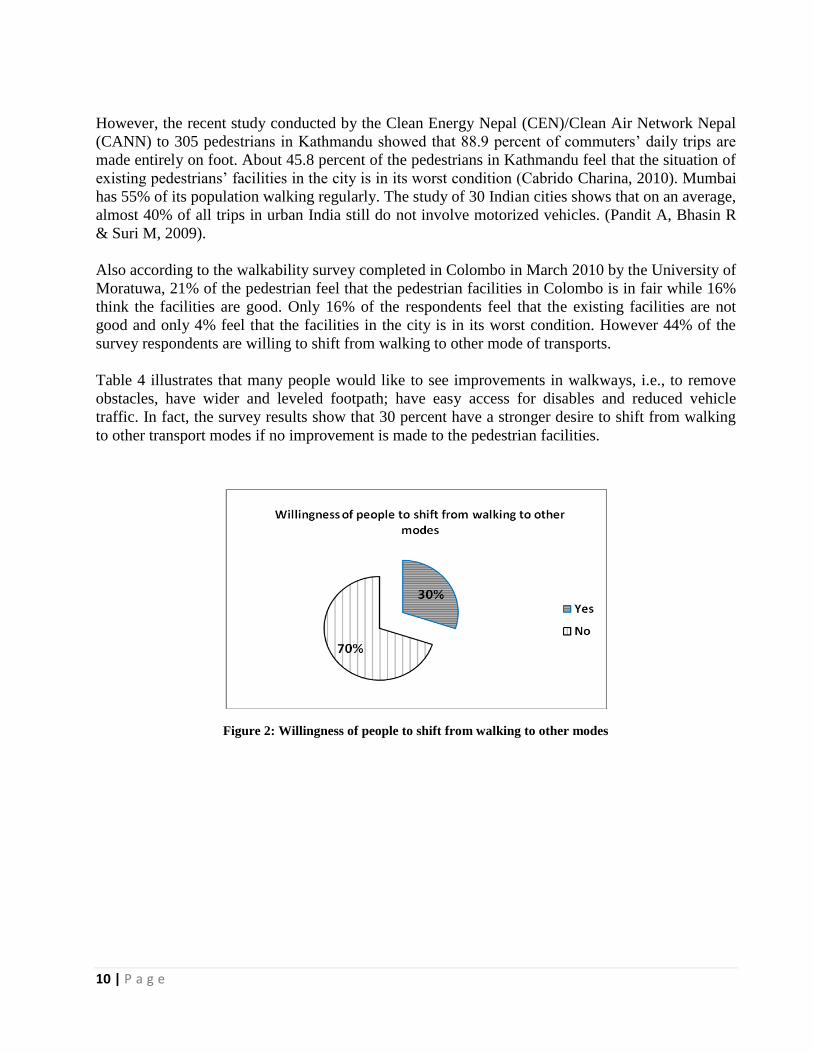
Table 4 illustrates that many people would like to see improvements in walkways, i.e., to remove
obstacles, have wider and leveled footpath; have easy access for disables and reduced vehicle
traffic. In fact, the survey results show that 30 percent have a stronger desire to shift from walking
to other transport modes if no improvement is made to the pedestrian facilities.
Figure 2: Willingness of people to shift from walking to other modes
11 | P a g e
Rank
Easy
access
Improved
street
lighting
Wider
footpaths
Level
footpaths
Clean
sidewalks
Reduced
traffic
Reduced
speed
Remove
obstacles
More
crossing pt
Weather
proof
1 64 113 32 51 36 49 76 21 33 90
2 162 243 152 161 142 170 224 140 104 141
3 325 396 305 367 312 336 435 357 324 304
4 297 204 338 312 298 287 200 305 349 270
5 175 64 194 129 232 174 84 198 207 211
Table 5: Pedestrians major preferences of walking facility improvements; Rank 1= Least Wanted; Rank 5= Most wanted
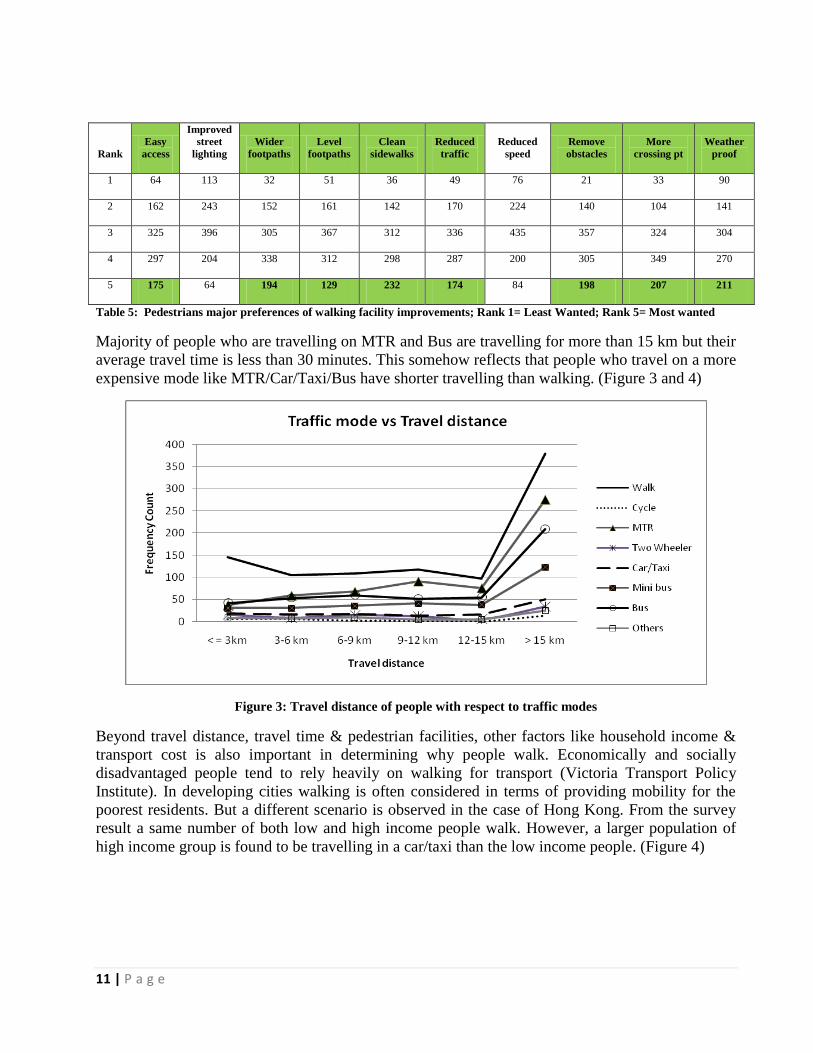
Majority of people who are travelling on MTR and Bus are travelling for more than 15 km but their
average travel time is less than 30 minutes. This somehow reflects that people who travel on a more
expensive mode like MTR/Car/Taxi/Bus have shorter travelling than walking. (Figure 3 and 4)
Figure 3: Travel distance of people with respect to traffic modes
Beyond travel distance, travel time & pedestrian facilities, other factors like household income &
transport cost is also important in determining why people walk. Economically and socially
disadvantaged people tend to rely heavily on walking for transport (Victoria Transport Policy
Institute). In developing cities walking is often considered in terms of providing mobility for the
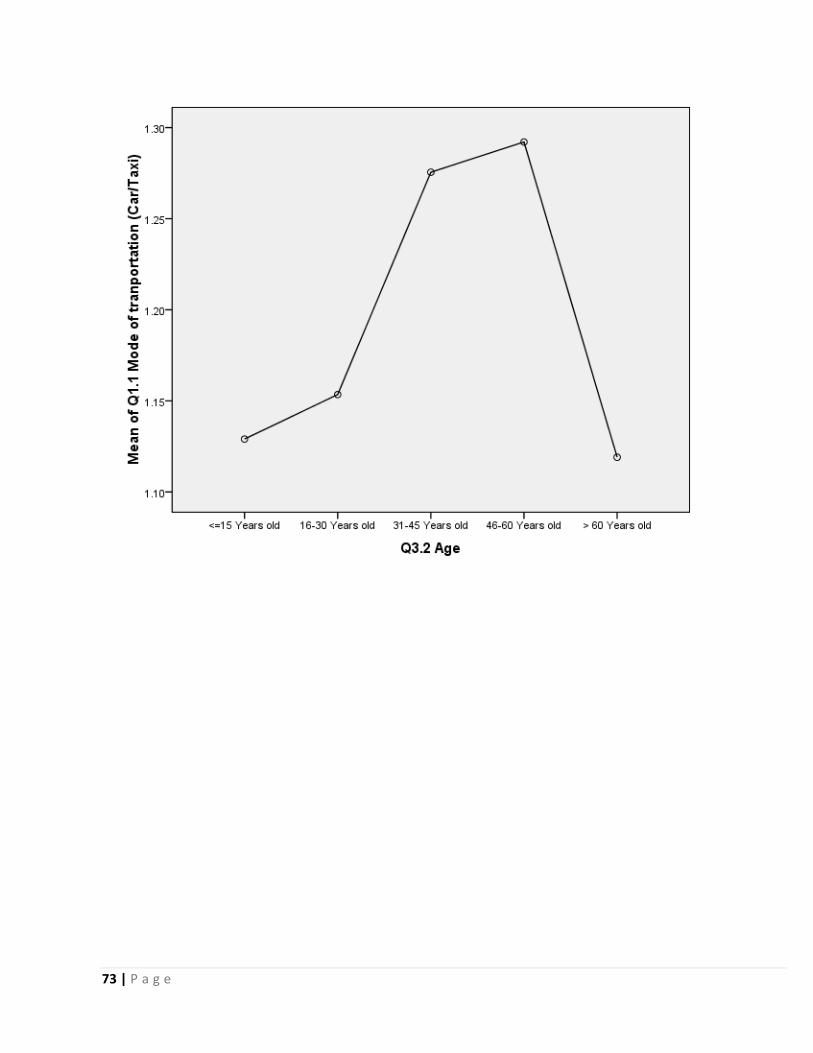
poorest residents. But a different scenario is observed in the case of Hong Kong. From the survey
result a same number of both low and high income people walk. However, a larger population of
high income group is found to be travelling in a car/taxi than the low income people. (Figure 4)
12 | P a g e
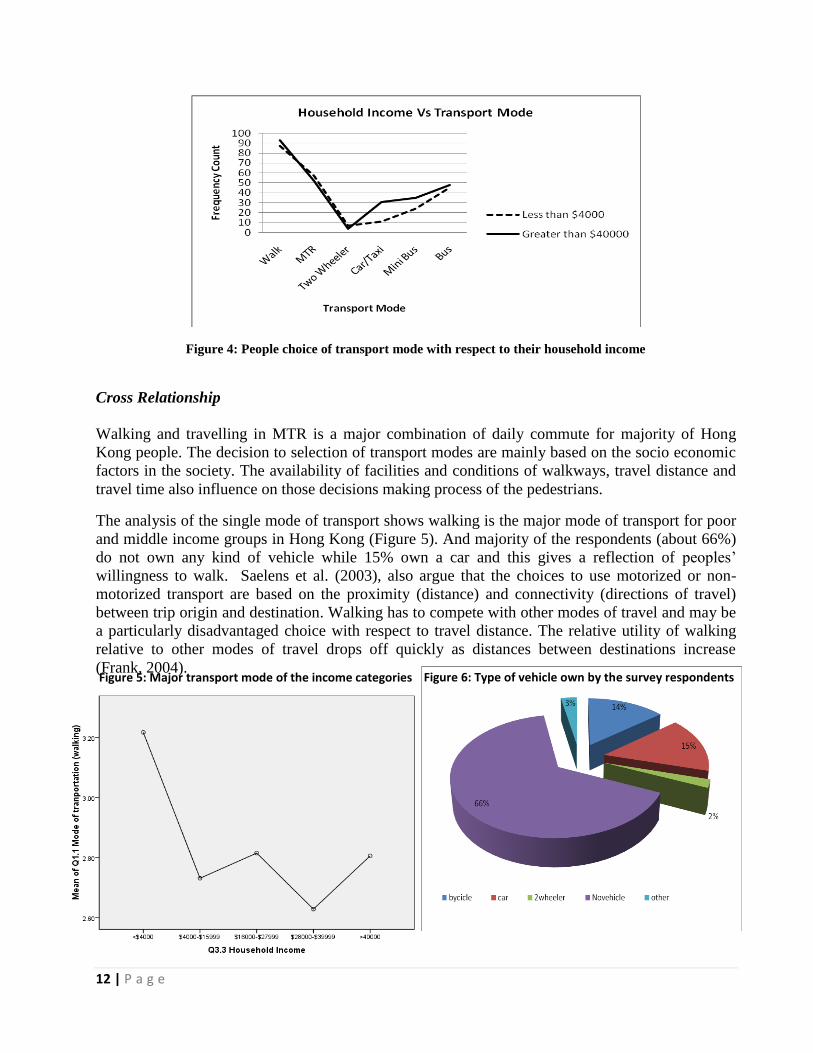
Figure 4: People choice of transport mode with respect to their household income
Cross Relationship
Walking and travelling in MTR is a major combination of daily commute for majority of Hong
Kong people. The decision to selection of transport modes are mainly based on the socio economic
factors in the society. The availability of facilities and conditions of walkways, travel distance and
travel time also influence on those decisions making process of the pedestrians.
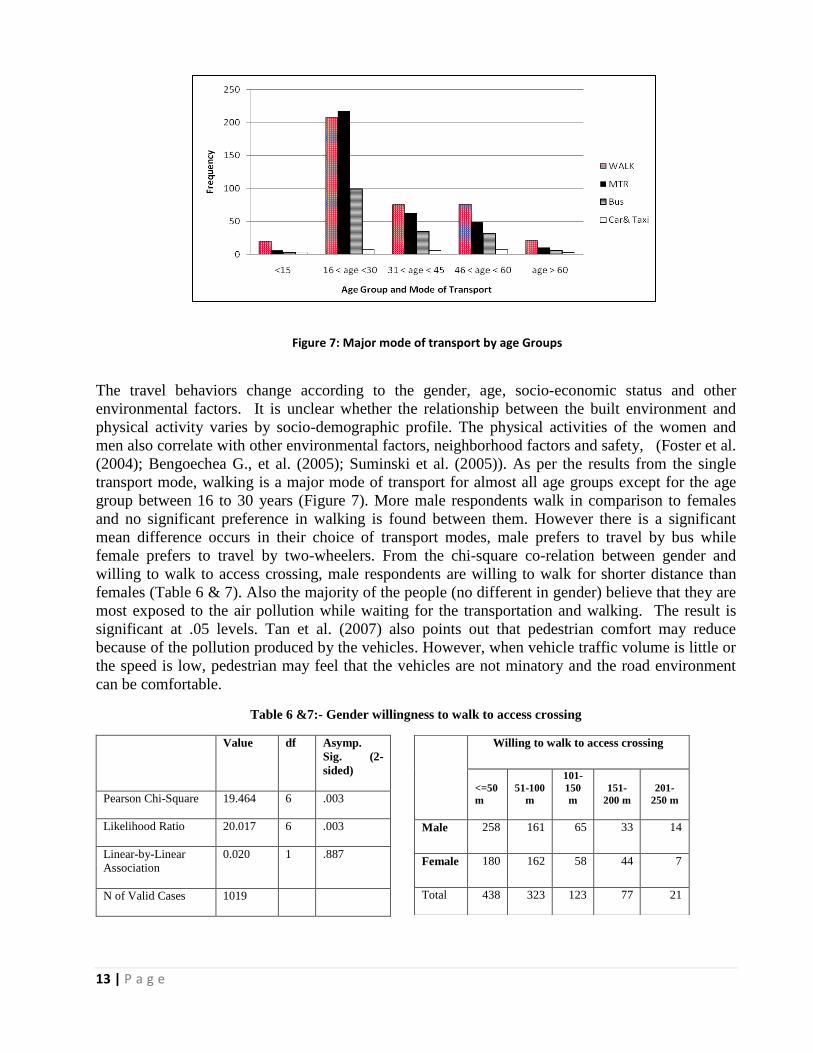
The analysis of the single mode of transport shows walking is the major mode of transport for poor
and middle income groups in Hong Kong (Figure 5). And majority of the respondents (about 66%)
do not own any kind of vehicle while 15% own a car and this gives a reflection of peoples‟
willingness to walk. Saelens et al. (2003), also argue that the choices to use motorized or non-
motorized transport are based on the proximity (distance) and connectivity (directions of travel)
between trip origin and destination. Walking has to compete with other modes of travel and may be
a particularly disadvantaged choice with respect to travel distance. The relative utility of walking
relative to other modes of travel drops off quickly as distances between destinations increase
(Frank, 2004).
Figure 5: Major transport mode of the income categories Figure 6: Type of vehicle own by the survey respondents
13 | P a g e
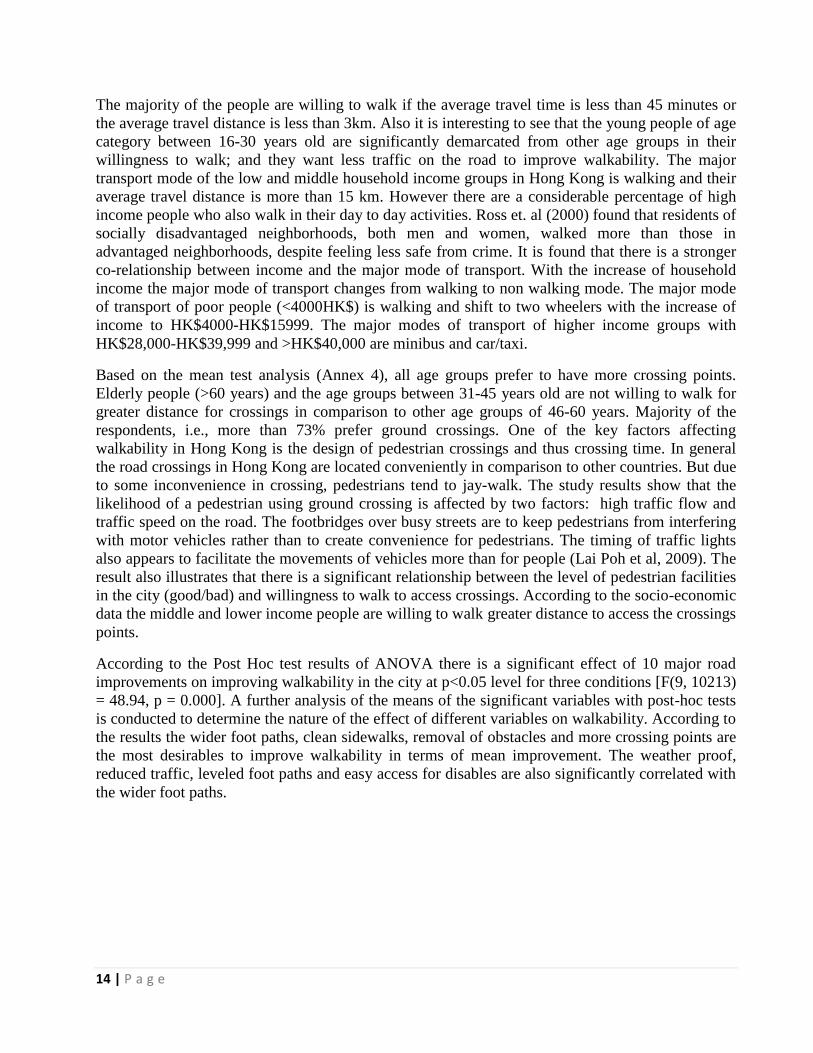
The travel behaviors change according to the gender, age, socio-economic status and other
environmental factors. It is unclear whether the relationship between the built environment and
physical activity varies by socio-demographic profile. The physical activities of the women and
men also correlate with other environmental factors, neighborhood factors and safety, (Foster et al.
(2004); Bengoechea G., et al. (2005); Suminski et al. (2005)). As per the results from the single
transport mode, walking is a major mode of transport for almost all age groups except for the age
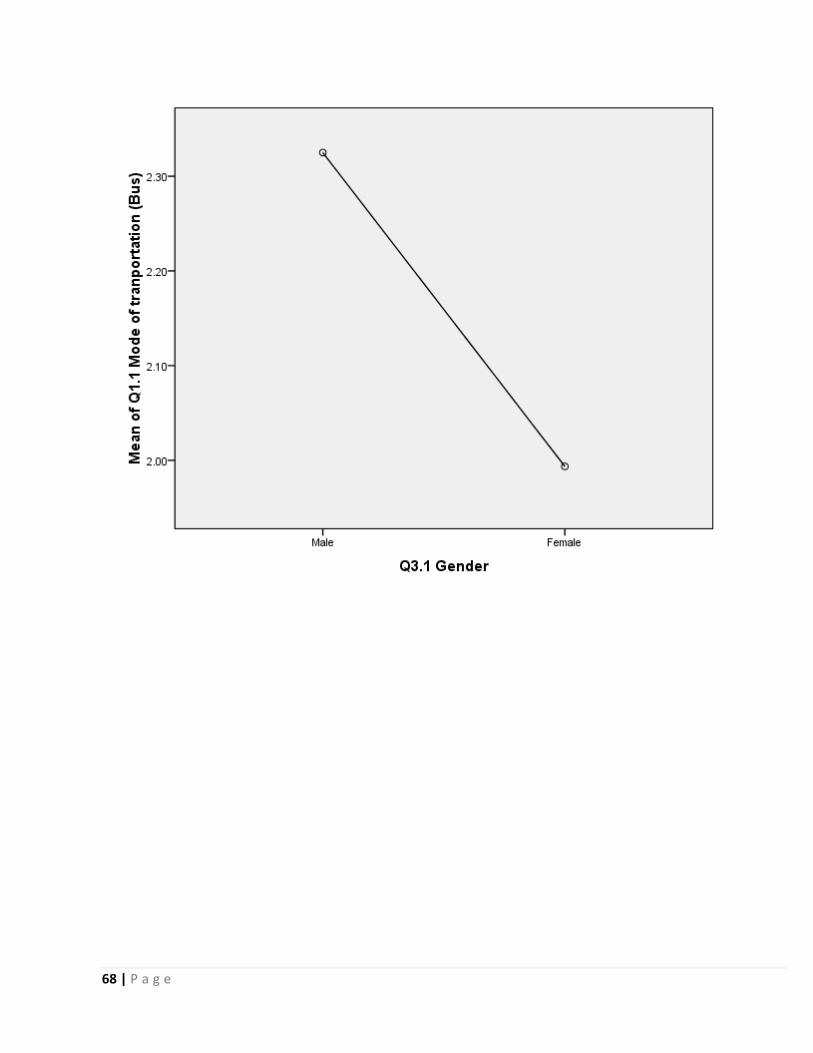
group between 16 to 30 years (Figure 7). More male respondents walk in comparison to females
and no significant preference in walking is found between them. However there is a significant
mean difference occurs in their choice of transport modes, male prefers to travel by bus while
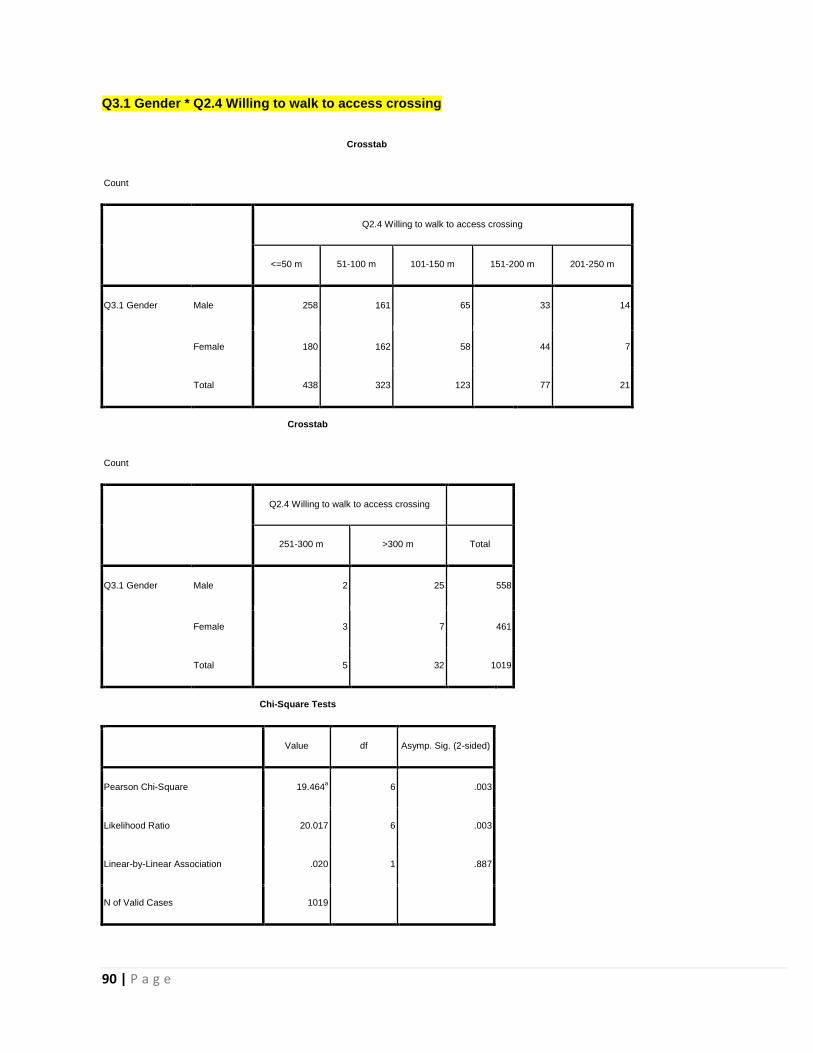
female prefers to travel by two-wheelers. From the chi-square co-relation between gender and
willing to walk to access crossing, male respondents are willing to walk for shorter distance than
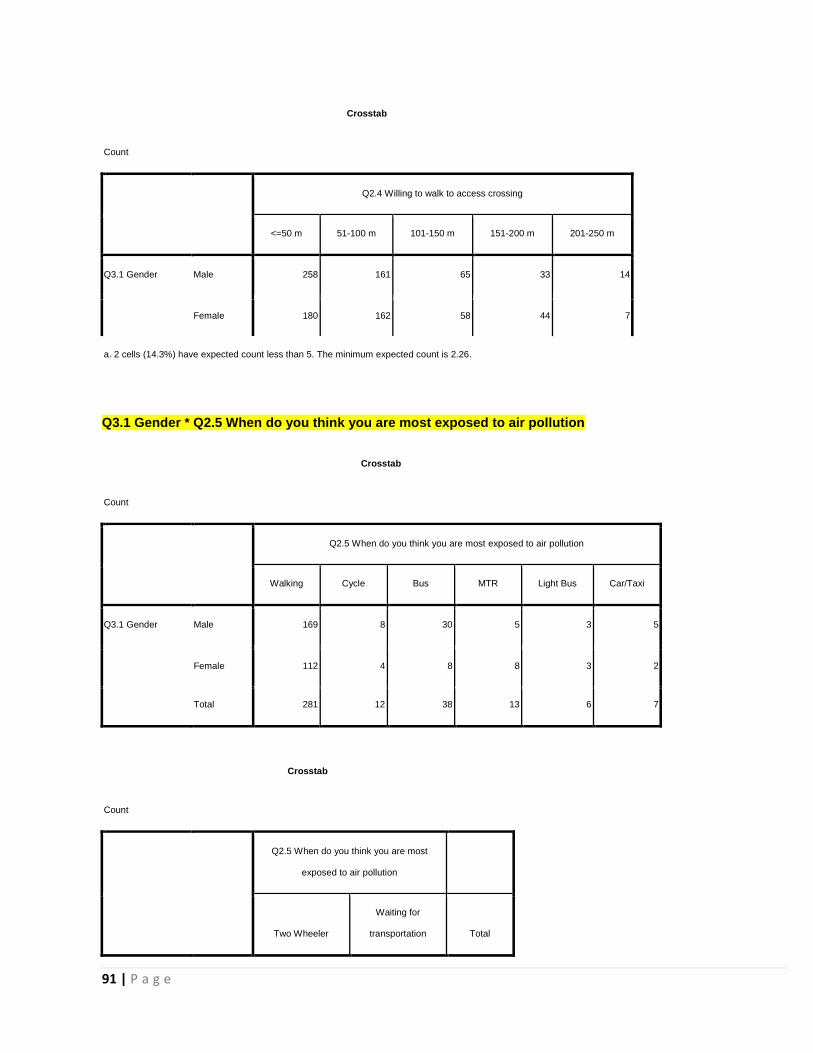
females (Table 6 & 7). Also the majority of the people (no different in gender) believe that they are
most exposed to the air pollution while waiting for the transportation and walking. The result is
significant at .05 levels. Tan et al. (2007) also points out that pedestrian comfort may reduce
because of the pollution produced by the vehicles. However, when vehicle traffic volume is little or
the speed is low, pedestrian may feel that the vehicles are not minatory and the road environment
can be comfortable.
Table 6 &7:- Gender willingness to walk to access crossing
Value df Asymp.
Sig. (2-
sided)
Pearson Chi-Square 19.464 6 .003
Likelihood Ratio 20.017 6 .003
Linear-by-Linear
Association
0.020 1 .887
N of Valid Cases 1019
Willing to walk to access crossing
<=50
m
51-100
m
101-
150
m
151-
200 m
201-
250 m
Male 258 161 65 33 14
Female 180 162 58 44 7
Total 438 323 123 77 21
Figure 8: Major mode of transport by age Groups
Figure 7: Major mode of transport by age Groups
14 | P a g e
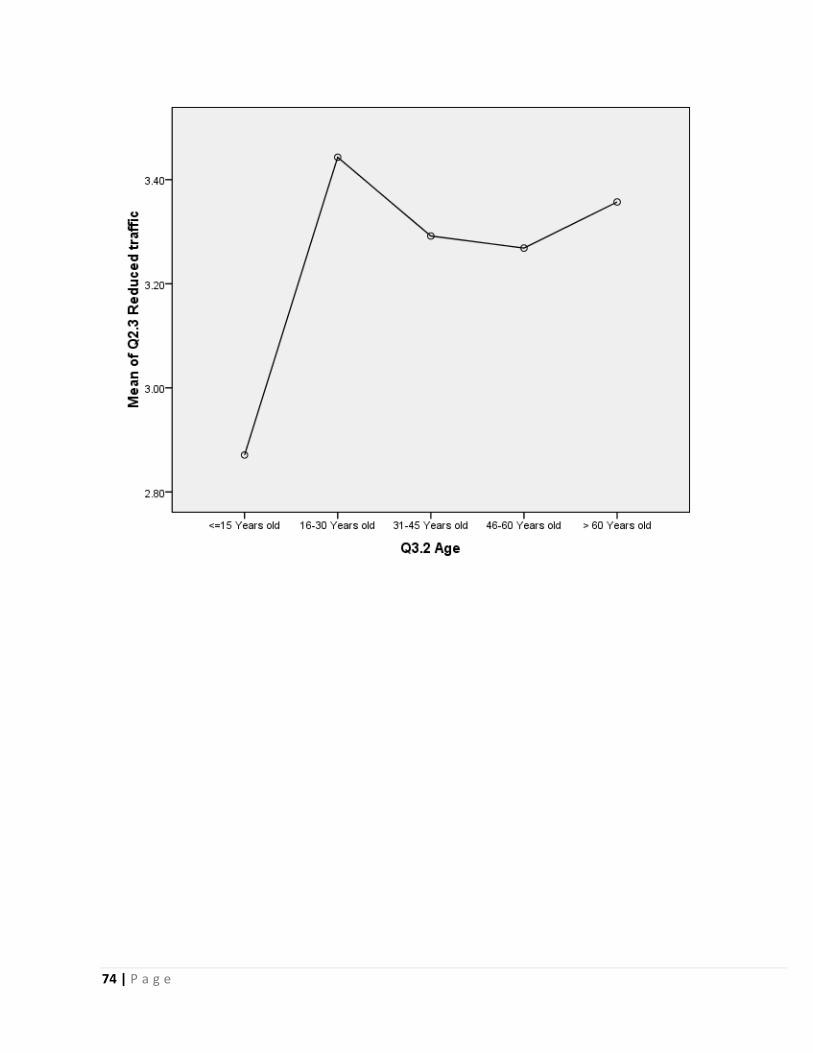
The majority of the people are willing to walk if the average travel time is less than 45 minutes or
the average travel distance is less than 3km. Also it is interesting to see that the young people of age
category between 16-30 years old are significantly demarcated from other age groups in their
willingness to walk; and they want less traffic on the road to improve walkability. The major
transport mode of the low and middle household income groups in Hong Kong is walking and their
average travel distance is more than 15 km. However there are a considerable percentage of high
income people who also walk in their day to day activities. Ross et. al (2000) found that residents of
socially disadvantaged neighborhoods, both men and women, walked more than those in
advantaged neighborhoods, despite feeling less safe from crime. It is found that there is a stronger
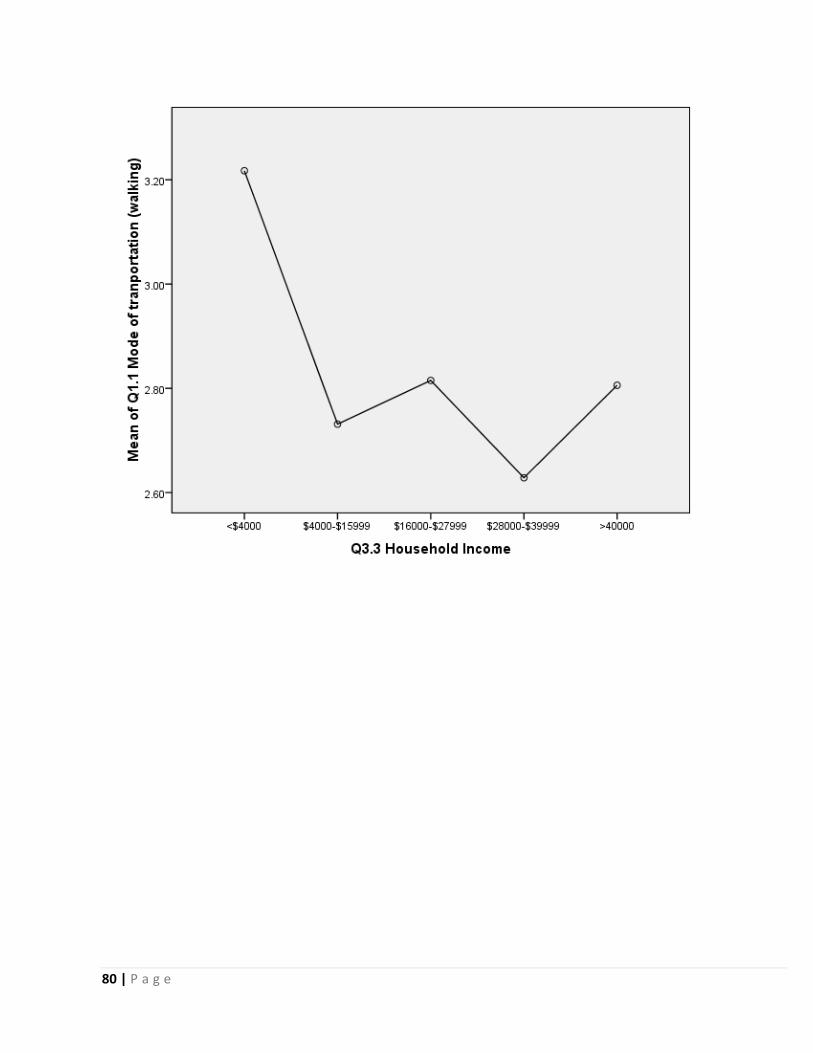
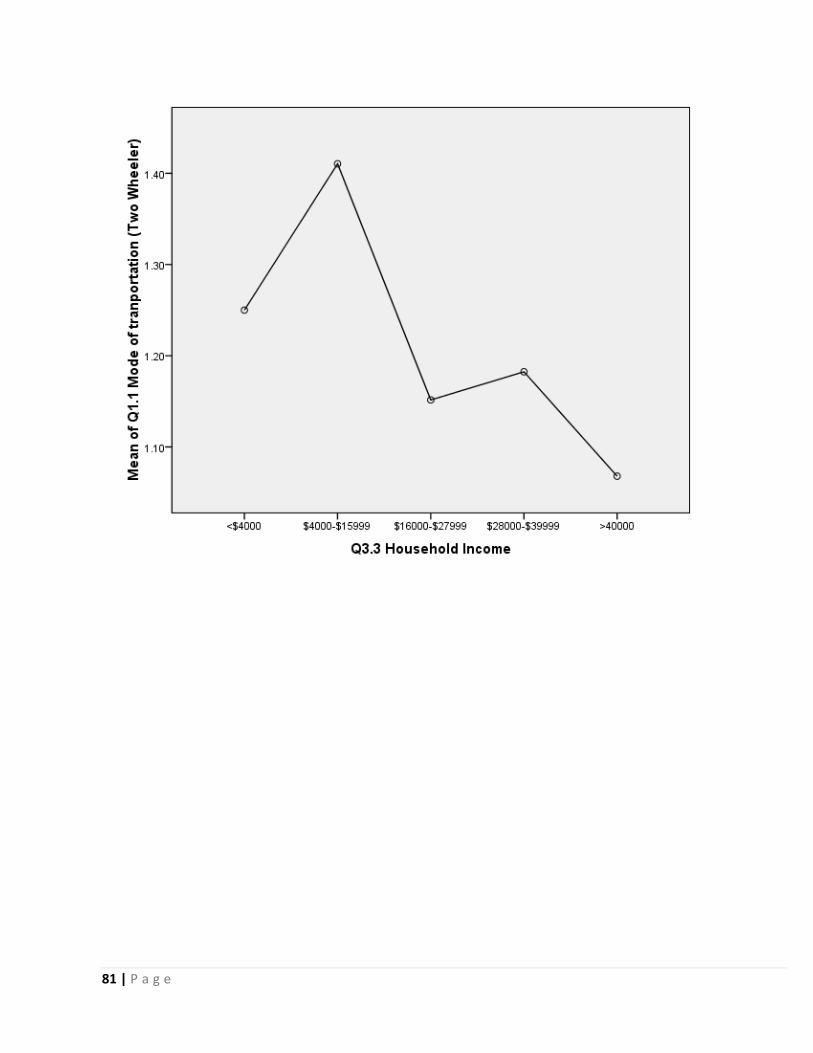
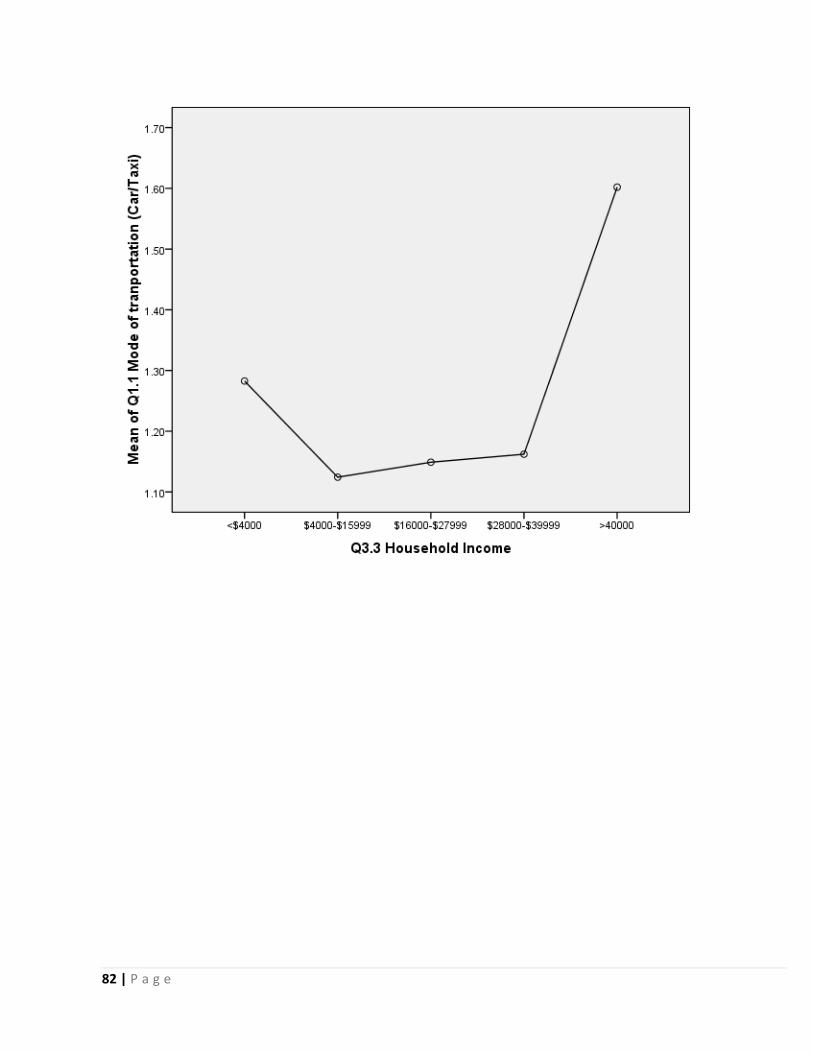
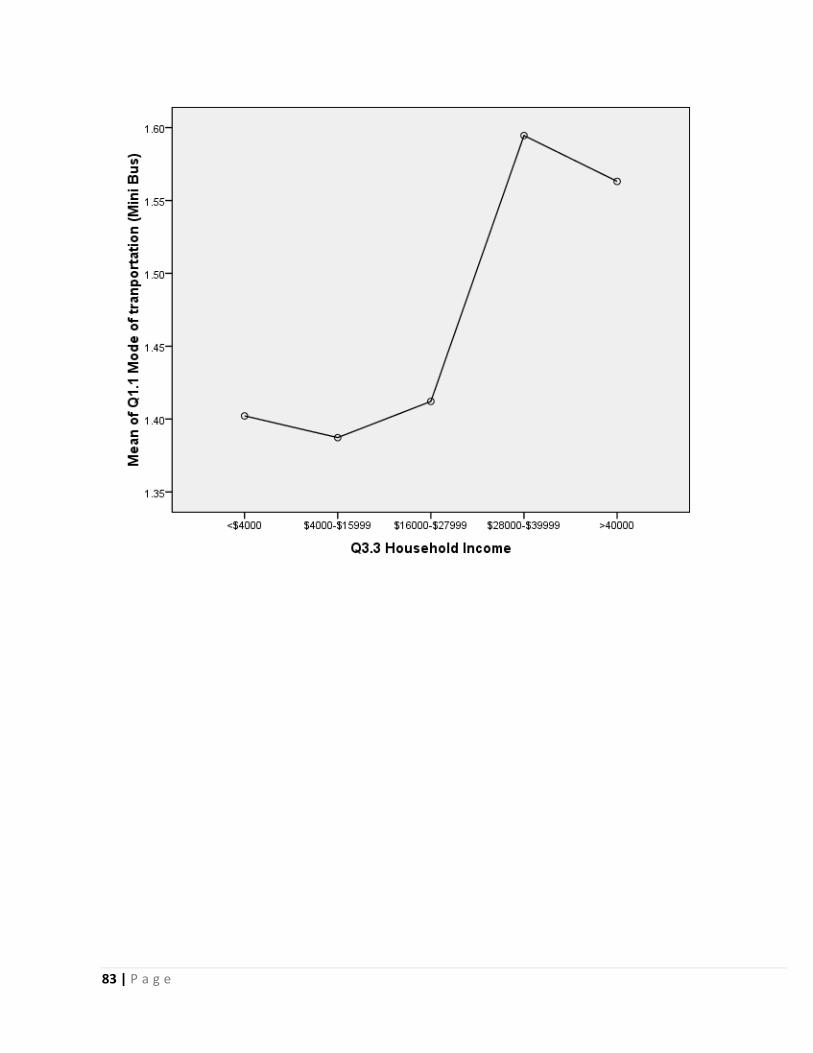
co-relationship between income and the major mode of transport. With the increase of household
income the major mode of transport changes from walking to non walking mode. The major mode
of transport of poor people (<4000HK$) is walking and shift to two wheelers with the increase of
income to HK$4000-HK$15999. The major modes of transport of higher income groups with
HK$28,000-HK$39,999 and >HK$40,000 are minibus and car/taxi.
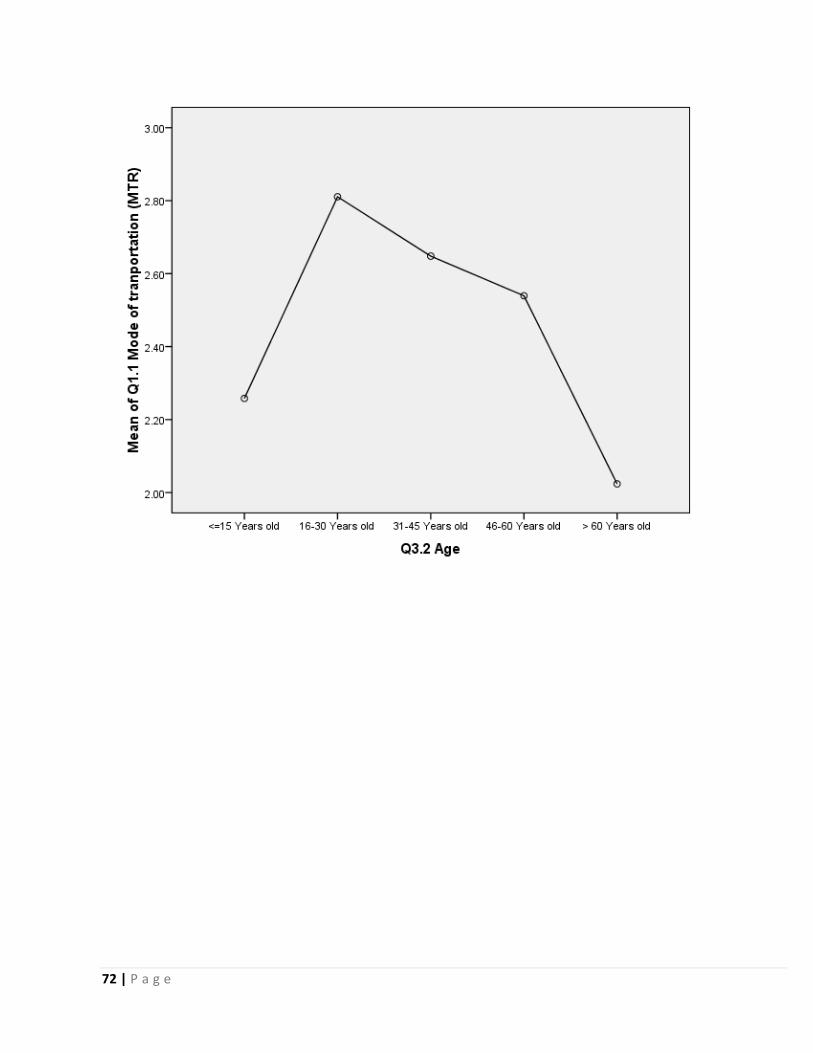
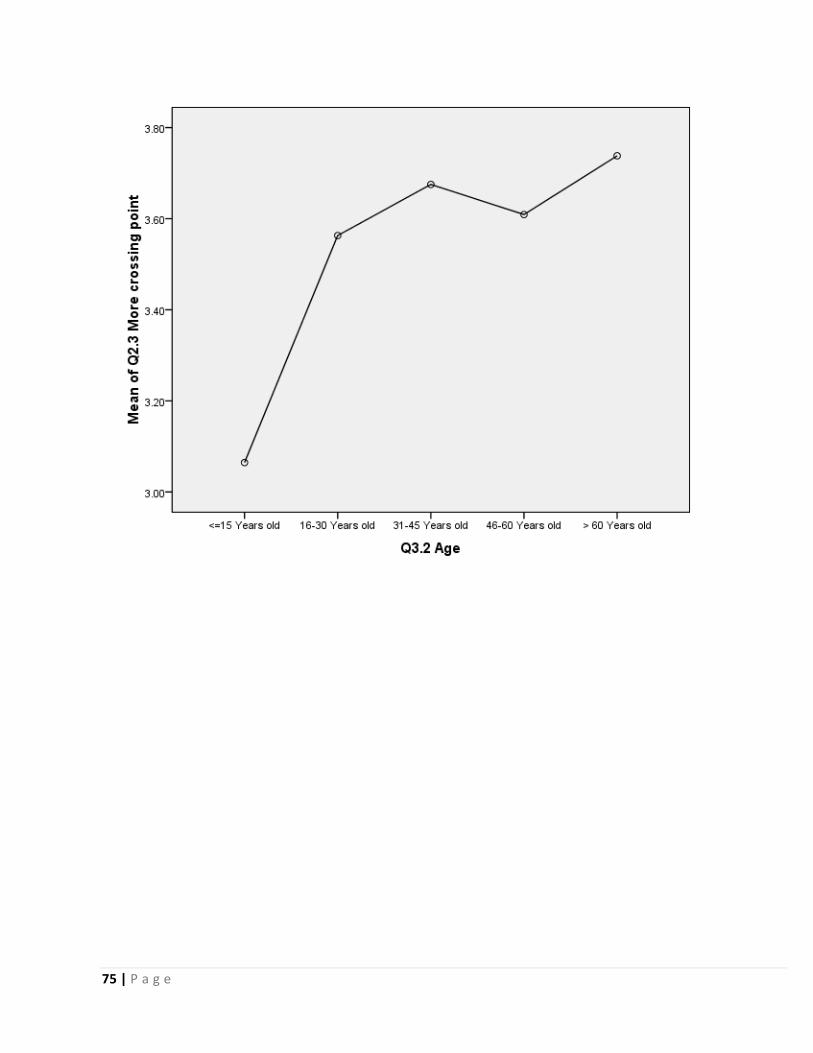
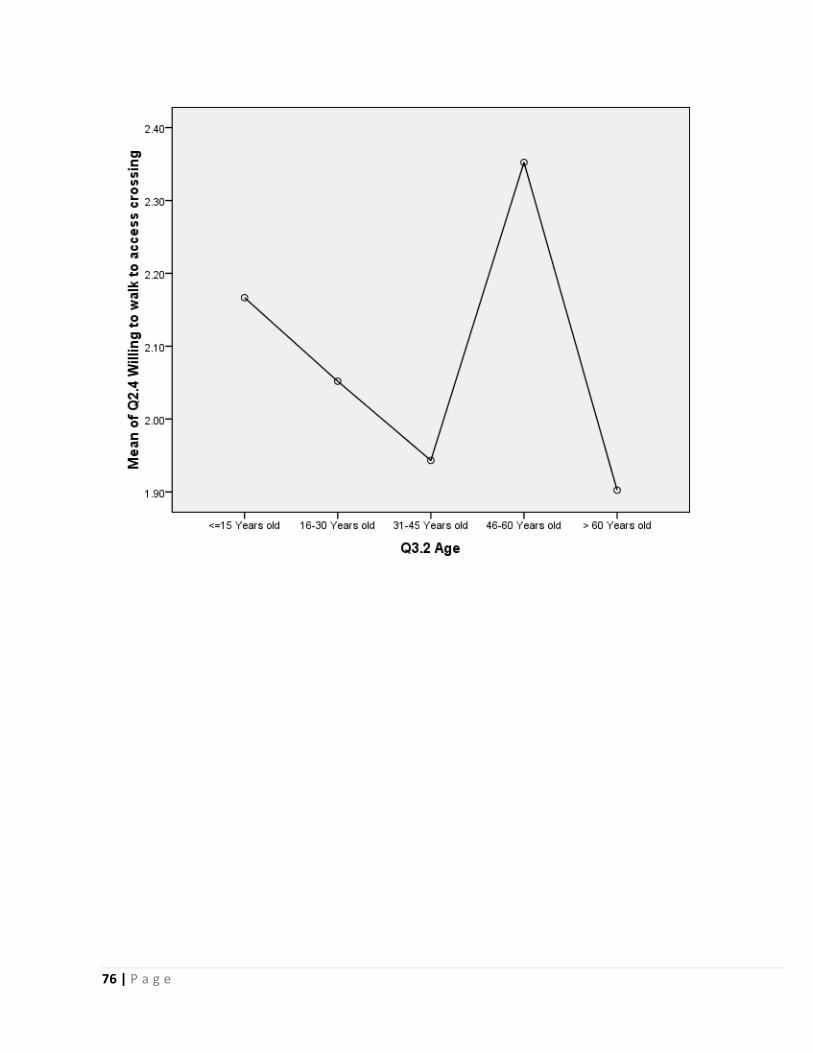
Based on the mean test analysis (Annex 4), all age groups prefer to have more crossing points.
Elderly people (>60 years) and the age groups between 31-45 years old are not willing to walk for
greater distance for crossings in comparison to other age groups of 46-60 years. Majority of the
respondents, i.e., more than 73% prefer ground crossings. One of the key factors affecting
walkability in Hong Kong is the design of pedestrian crossings and thus crossing time. In general
the road crossings in Hong Kong are located conveniently in comparison to other countries. But due
to some inconvenience in crossing, pedestrians tend to jay-walk. The study results show that the
likelihood of a pedestrian using ground crossing is affected by two factors: high traffic flow and
traffic speed on the road. The footbridges over busy streets are to keep pedestrians from interfering
with motor vehicles rather than to create convenience for pedestrians. The timing of traffic lights
also appears to facilitate the movements of vehicles more than for people (Lai Poh et al, 2009). The
result also illustrates that there is a significant relationship between the level of pedestrian facilities
in the city (good/bad) and willingness to walk to access crossings. According to the socio-economic
data the middle and lower income people are willing to walk greater distance to access the crossings
points.
According to the Post Hoc test results of ANOVA there is a significant effect of 10 major road
improvements on improving walkability in the city at p<0.05 level for three conditions [F(9, 10213)
= 48.94, p = 0.000]. A further analysis of the means of the significant variables with post-hoc tests
is conducted to determine the nature of the effect of different variables on walkability. According to
the results the wider foot paths, clean sidewalks, removal of obstacles and more crossing points are
the most desirables to improve walkability in terms of mean improvement. The weather proof,
reduced traffic, leveled foot paths and easy access for disables are also significantly correlated with
the wider foot paths.
15 | P a g e
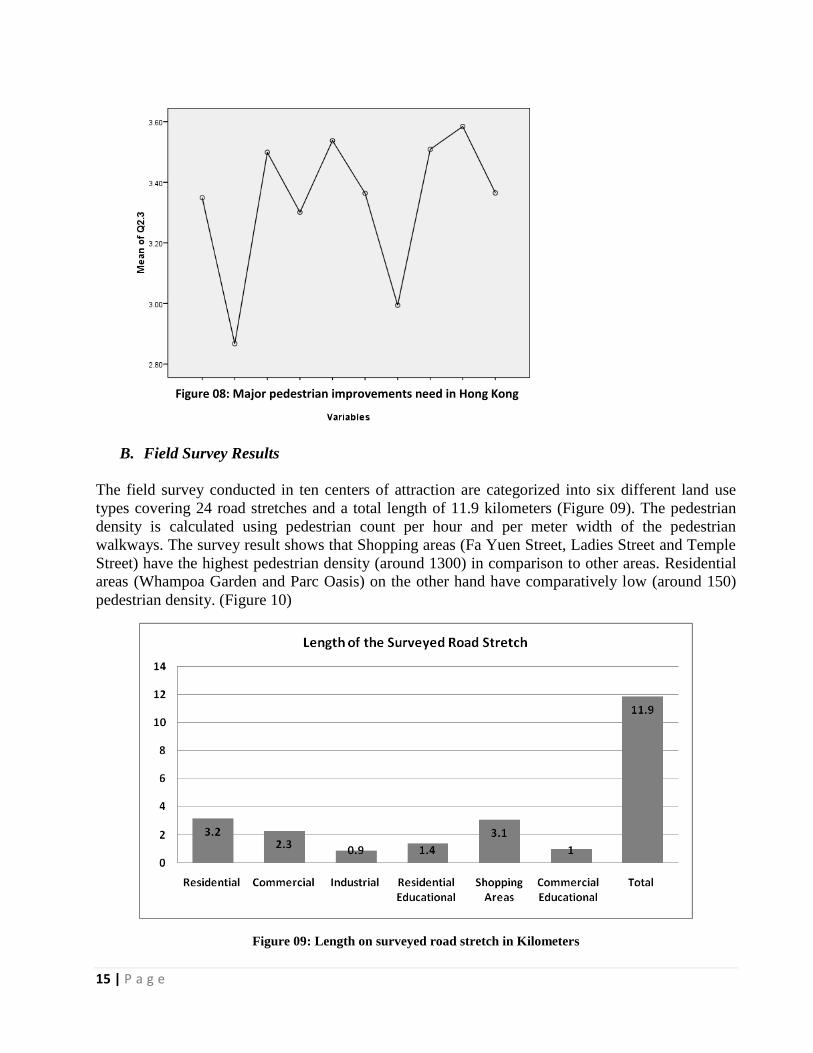
B. Field Survey Results
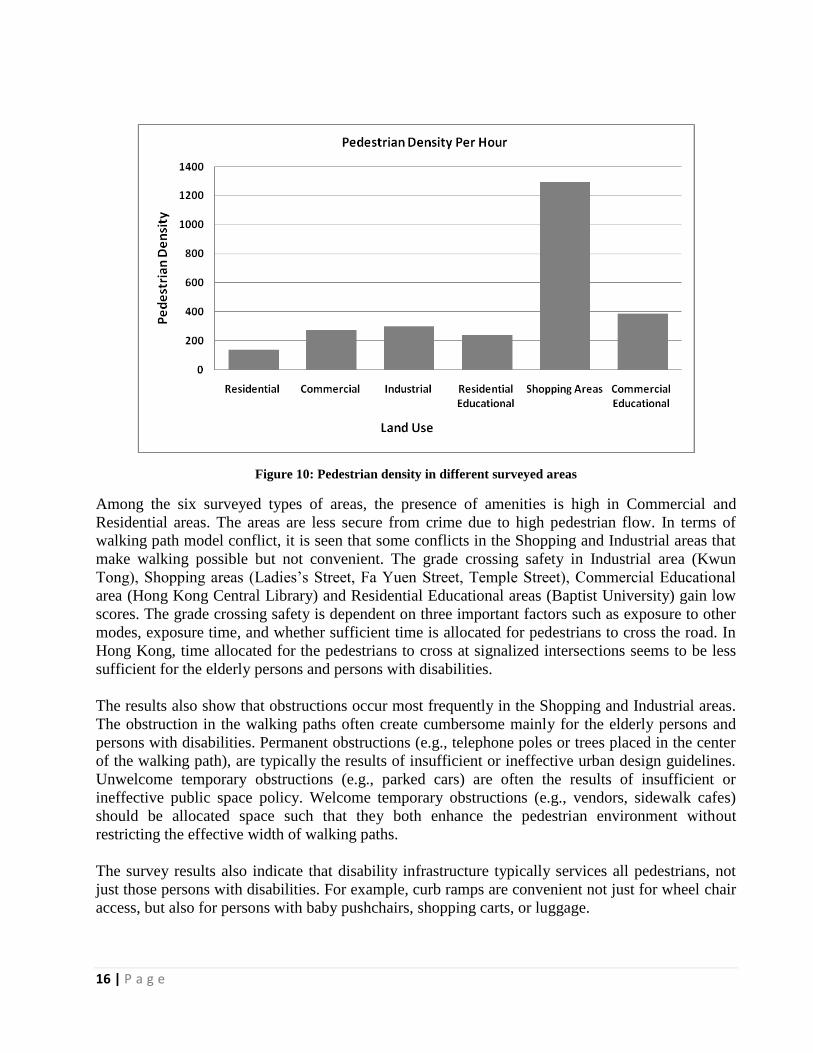
The field survey conducted in ten centers of attraction are categorized into six different land use
types covering 24 road stretches and a total length of 11.9 kilometers (Figure 09). The pedestrian
density is calculated using pedestrian count per hour and per meter width of the pedestrian
walkways. The survey result shows that Shopping areas (Fa Yuen Street, Ladies Street and Temple
Street) have the highest pedestrian density (around 1300) in comparison to other areas. Residential
areas (Whampoa Garden and Parc Oasis) on the other hand have comparatively low (around 150)
pedestrian density. (Figure 10)
Figure 09: Length on surveyed road stretch in Kilometers
Figure 08: Major pedestrian improvements need in Hong Kong
16 | P a g e
Figure 10: Pedestrian density in different surveyed areas
Among the six surveyed types of areas, the presence of amenities is high in Commercial and
Residential areas. The areas are less secure from crime due to high pedestrian flow. In terms of
walking path model conflict, it is seen that some conflicts in the Shopping and Industrial areas that
make walking possible but not convenient. The grade crossing safety in Industrial area (Kwun
Tong), Shopping areas (Ladies‟s Street, Fa Yuen Street, Temple Street), Commercial Educational
area (Hong Kong Central Library) and Residential Educational areas (Baptist University) gain low
scores. The grade crossing safety is dependent on three important factors such as exposure to other
modes, exposure time, and whether sufficient time is allocated for pedestrians to cross the road. In
Hong Kong, time allocated for the pedestrians to cross at signalized intersections seems to be less
sufficient for the elderly persons and persons with disabilities.
The results also show that obstructions occur most frequently in the Shopping and Industrial areas.
The obstruction in the walking paths often create cumbersome mainly for the elderly persons and
persons with disabilities. Permanent obstructions (e.g., telephone poles or trees placed in the center
of the walking path), are typically the results of insufficient or ineffective urban design guidelines.
Unwelcome temporary obstructions (e.g., parked cars) are often the results of insufficient or
ineffective public space policy. Welcome temporary obstructions (e.g., vendors, sidewalk cafes)
should be allocated space such that they both enhance the pedestrian environment without
restricting the effective width of walking paths.
The survey results also indicate that disability infrastructure typically services all pedestrians, not
just those persons with disabilities. For example, curb ramps are convenient not just for wheel chair
access, but also for persons with baby pushchairs, shopping carts, or luggage.
17 | P a g e
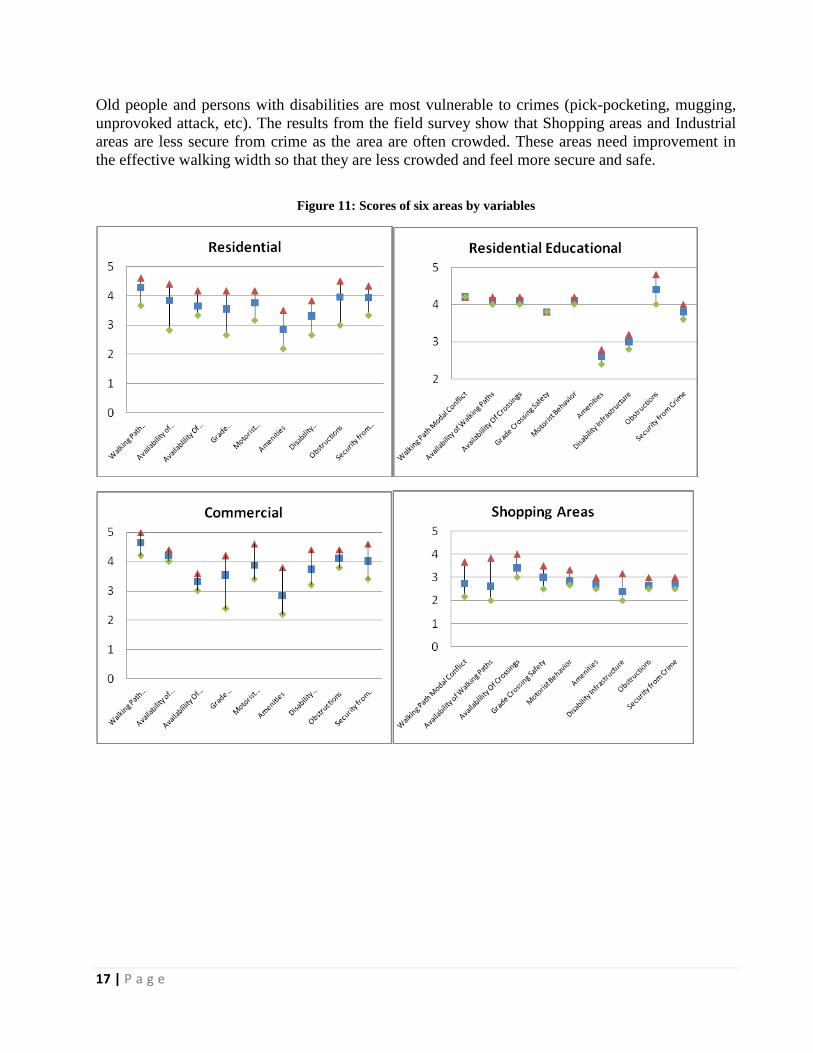
Old people and persons with disabilities are most vulnerable to crimes (pick-pocketing, mugging,
unprovoked attack, etc). The results from the field survey show that Shopping areas and Industrial
areas are less secure from crime as the area are often crowded. These areas need improvement in
the effective walking width so that they are less crowded and feel more secure and safe.
Figure 11: Scores of six areas by variables
18 | P a g e
6.0 CONCLUSION
Based on the pedestrian interview survey results, almost 39 percent of daily trips are made entirely
on foot in Hong Kong. 70 percent of the people are willing to walk with the existing pedestrian
facilities; however 30 percent have a stronger desire to shift from walking to other transport modes
if no improvements made in the pedestrian facilities. They want city to improve street lighting,
clean and wider foot paths, reduce traffic and speed; removal of obstacles from walkways, more
crossing points and weather proof sidewalk. These factors are very important in determining
pedestrians‟ decision to shift from walking to other modes if no improvements are done. MTR is
their first choice of other transport mode if they shift from walking.
About 66 percent of the respondents do not own any kind of vehicle and the major transport mode
for most people are walking, MTR and Bus. Walking is the major transport mode for low and
middle income groups but there are a considerable percentage of high income people who also walk
in their daily commute. Male respondents are found to be walking more in comparison to females
and middle aged people between 16-30 years old are significantly demarcated from other age
groups in their willingness to walk. Many people believe that they are most exposed to the air
pollution while waiting for the transportation and walking.
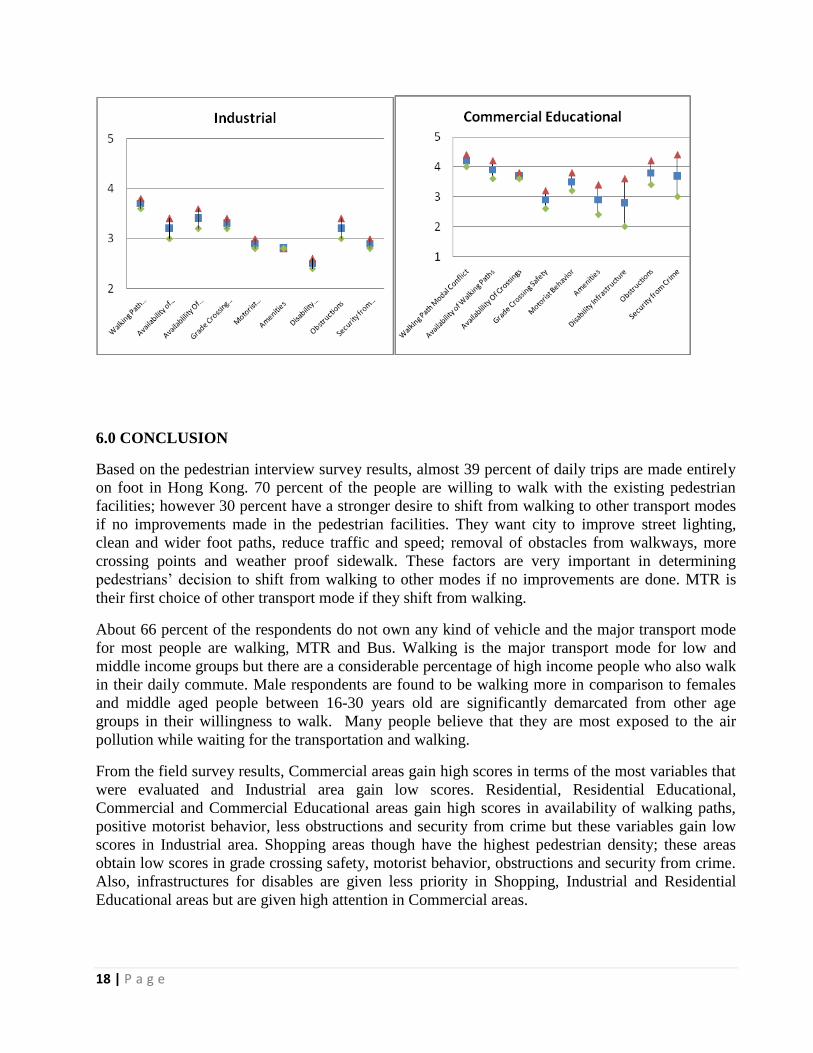
From the field survey results, Commercial areas gain high scores in terms of the most variables that
were evaluated and Industrial area gain low scores. Residential, Residential Educational,
Commercial and Commercial Educational areas gain high scores in availability of walking paths,
positive motorist behavior, less obstructions and security from crime but these variables gain low
scores in Industrial area. Shopping areas though have the highest pedestrian density; these areas
obtain low scores in grade crossing safety, motorist behavior, obstructions and security from crime.
Also, infrastructures for disables are given less priority in Shopping, Industrial and Residential
Educational areas but are given high attention in Commercial areas.
19 | P a g e
7.0 REFERENCES
1. Litmen, T.A, (2009), Economic Value of Walkability, Victoria Transport Policy Institute,
USA
2. Saelens BE, Sallis JF, Frank LD (2003) Environmental correlates of walking and cycling:
Findings from the transportation, urban design, and planning literatures. Annals of
Behavioral Medicine 25(2):80-91
3. Sallis JF, Frank LD, Saelens BE, Kraft MK (2004) Active transportation and physical
activity: opportunities for collaboration on transportation and public health. Transportation
Research Part A, 38:249-268
4. Eva Lesliea, Ester Cerinb, Lorinne duToitc, Neville Owenc and Adrian Baumand (2007),
Objectively Assessing ‘Walkability’ of Local Communities: Using GIS to Identify the
Relevant Environmental Attributes,
5. Billie Giles-Corti, and Robert J. Donovan, (2003), Relative Influences of Individual, Social
Environmental, and Physical Environmental Correlates of Walking, Vol 93, No. 9,
American Journal of Public Health 1583-1589
6. Holly Krambeck, THE GLOBAL WALKABILITY INDEX:TALK THE WALK AND
WALK THE TALK 1, Master‟s Degree Candidate (February 2006) Massachusetts Institute
of Technology Dept. of Civil and Environmental Engineering & Dept. Urban Studies and
Planning, Cambridge, Massachusetts, USA.
7. Karachi (2009), A Preliminary survey of Pedestrian Infrastructure in four areas of Karachi /
http://www.cleanairnet.org/caiasia/1412/articles-60499_Arif.pdf)
8. Cabrido Charina, (2010), Walkability in Asian Cities: Assessment of Pedestrian
Infrastructures and Services in Four Areas of Kathmandu City.
9. Pandit A, Bhasin R, Suri M (2009)/
http://timesofindia.indiatimes.com/city/ahmedabad/Ahmedabad-2nd-in-walkability-
index/articleshow/5058499.cms
10. McFadden, D.L., (1978), Quantitative methods for analyzing travel behaviour of
individuals: some recent developments. In: D. Hensher and P. Stopher, eds. Behavioural
travel modelling. London: Croom Helm, pp: 279–318.
11. Frank, L.D., (2004), Economic determinants of urban form: resulting trade-offs between
active and sedentary forms of travel. Am. J. Prev. Med. 27 (3S), pp: 146–153.
12. Ross, R., Freeman, J.A., et al., (2000), Exercise alone is an effective strategy for reducing
obesity and related comorbidities. Exerc. Sport Sci. Rev. 28 (4), pp: 165–170.
13. Foster, C., Hillsdon, M., et al., (2004), Environmental perceptions and walking in English
adults. J. Epidemiol. Community Health 58 (11), pp: 924–928.
14. Bengoechea, G., Spence, E., et al., (2005), Gender differences in perceived environmental
correlates of physical activity. Int. J. Behav. Nutr. Phys. Act. 2, 12.
15. Suminski, R.R., Poston, W.S., et al., (2005), Features of the neighborhood environment and
walking by U.S. adults. Am. J. Prev. Med. 28 (2), pp 149–155.
16. Lai, P.C., Wong, M., Chan, M.H., Wong, W.C., Low, C.T., (2009), An ecological study of
physical environmental risk factors for elderly falls in an urban setting of Hong Kong,
Science of the Total Environment, 407, pp 6157–6165
17. Parker, M.J., Twemlow, T.R., Pryor, G.A., (1996), Environmental hazards and hip
fractures., Age Ageing, 25(4), pp: 322–325.
20 | P a g e
18. Southworth, M., (2005), Designing the walkability city. J Urban Planning Development,
131(4), pp: 246–257.
19. Ayres, T.J., Kelkar, R., (2006), Sidewalk potential trip points: a method for characterizing
walkways. Int J Ind Ergon, 36, pp: 1031–1035.
20. TAN, D., WANG, W., LU, J., BIAN, Y., (2007), Research on Methods of Assessing
Pedestrian Level of Service for Sidewalk, Journal of Transportation Systems Engineering
and Information Technology, Volume 7, Issue 5
21 | P a g e
ANNEX 1
WALKABILITY IN ASIAN CITIES
FIELD SURVEY
City: Survey Area Name
Direction (L/R) Area Type Peak Hour Yes No
Survey Team Names
Surveyed Road Stretch 1 2 3 4 5 6 7 8 9 10
1. Walking Path Modal Conflict
2. Availability Of Walking Paths (with Maintenance and Cleanliness)
3. Availability Of Crossings
4. Grade Crossing Safety
5. Motorist Behavior
6. Amenities
7. Disability Infrastructure
8. Obstructions
9. Security from Crime
10. Pedestrian count
11. Length of surveyed stretch (Km)
General Description of Area Rough Sketch
22 | P a g e
ANNEX 2
Field Survey Data Collection Guidelines (Hong Kong)
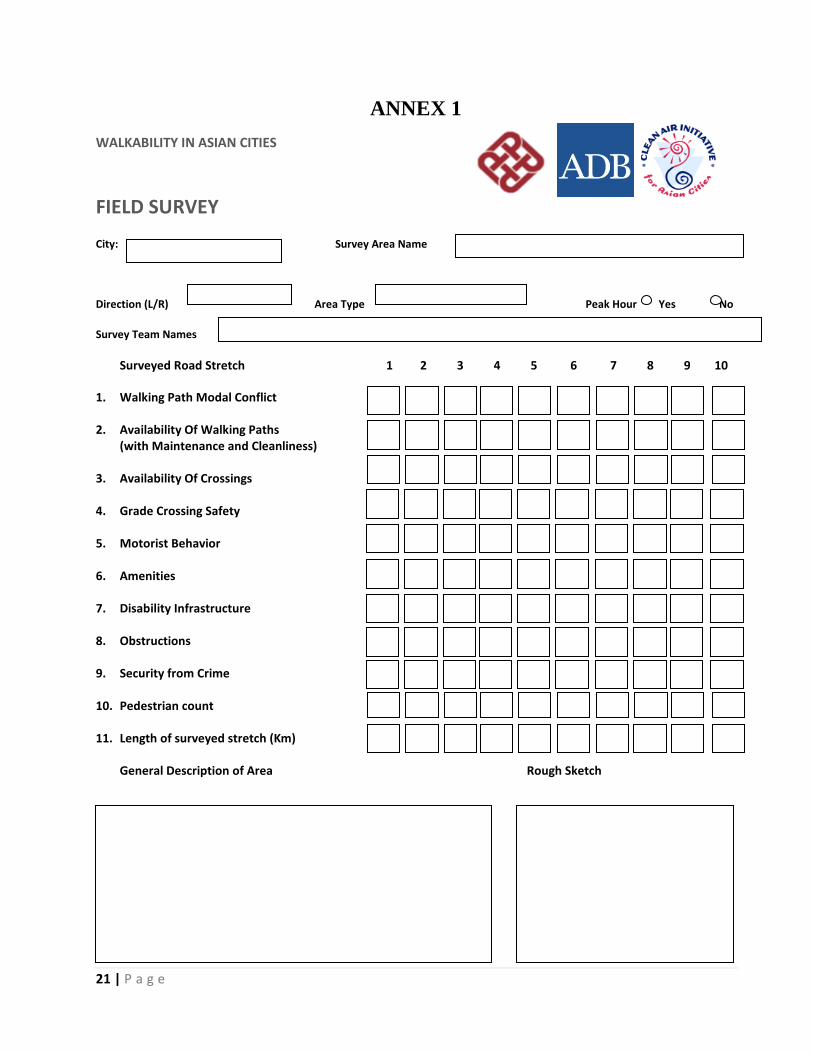
1. Walking Path Modal Conflict
Rating Description Example
1. Significant conflict that makes walking impossible
2 Significant conflicts that makes walking possible, but dangerous and inconvenient.
23 | P a g e
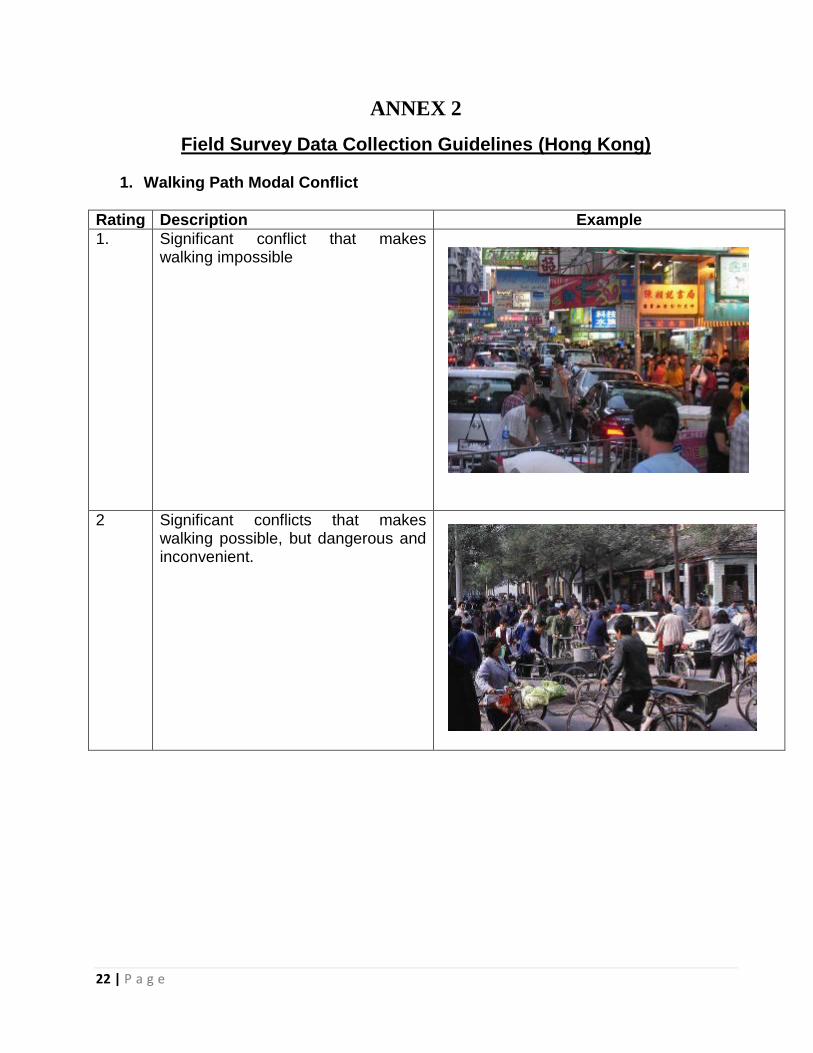
3 Some conflict – walking is possible, but not convenient
4 Minimal conflict, mostly between pedestrians and non-motorized vehicles
5 No conflict between pedestrians and other modes
24 | P a g e
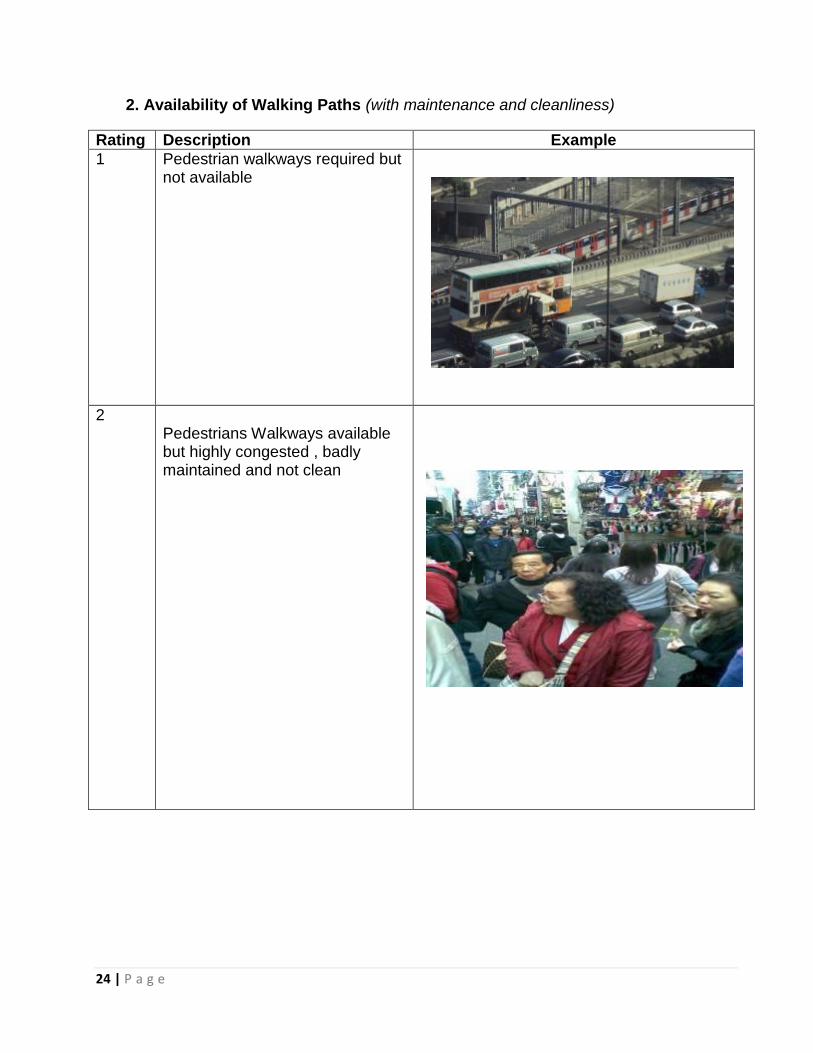
2. Availability of Walking Paths (with maintenance and cleanliness)
Rating Description Example
1 Pedestrian walkways required but not available
2 Pedestrians Walkways available but highly congested , badly maintained and not clean
25 | P a g e
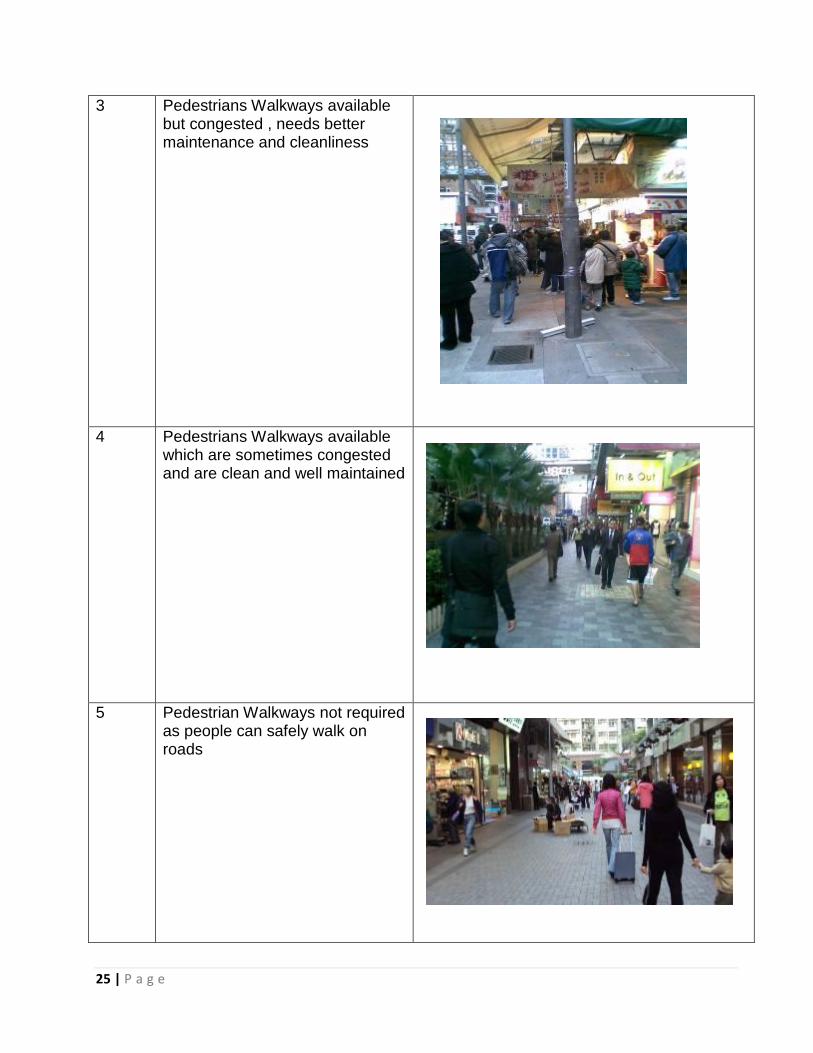
3 Pedestrians Walkways available but congested , needs better maintenance and cleanliness
4 Pedestrians Walkways available which are sometimes congested and are clean and well maintained
5 Pedestrian Walkways not required as people can safely walk on roads
26 | P a g e
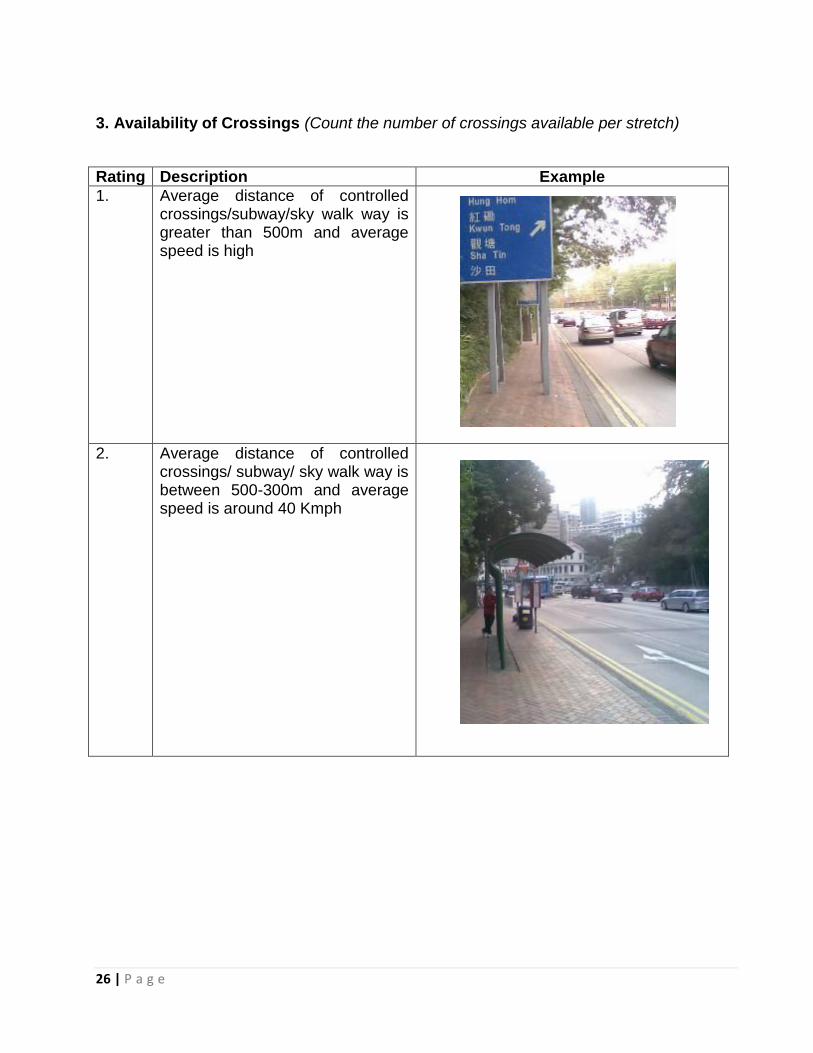
3. Availability of Crossings (Count the number of crossings available per stretch)
Rating Description Example
1. Average distance of controlled crossings/subway/sky walk way is greater than 500m and average speed is high
2. Average distance of controlled crossings/ subway/ sky walk way is between 500-300m and average speed is around 40 Kmph
27 | P a g e
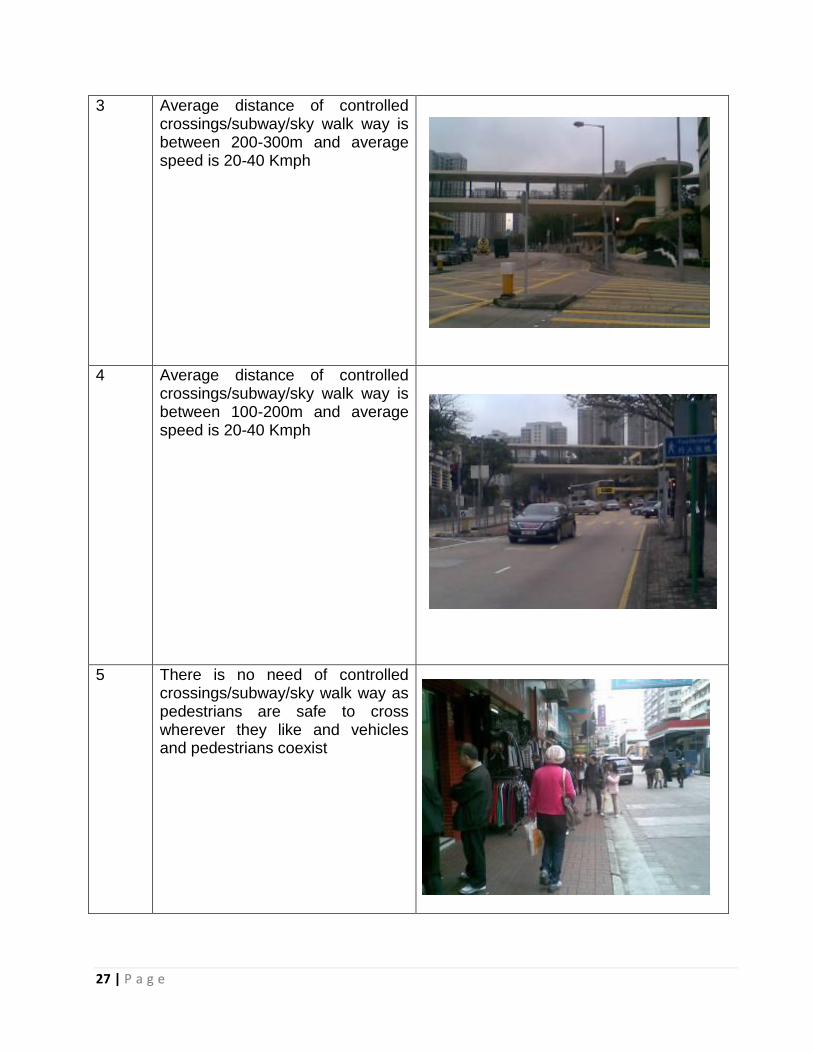
3 Average distance of controlled crossings/subway/sky walk way is between 200-300m and average speed is 20-40 Kmph
4 Average distance of controlled crossings/subway/sky walk way is between 100-200m and average speed is 20-40 Kmph
5 There is no need of controlled crossings/subway/sky walk way as pedestrians are safe to cross wherever they like and vehicles and pedestrians coexist
28 | P a g e
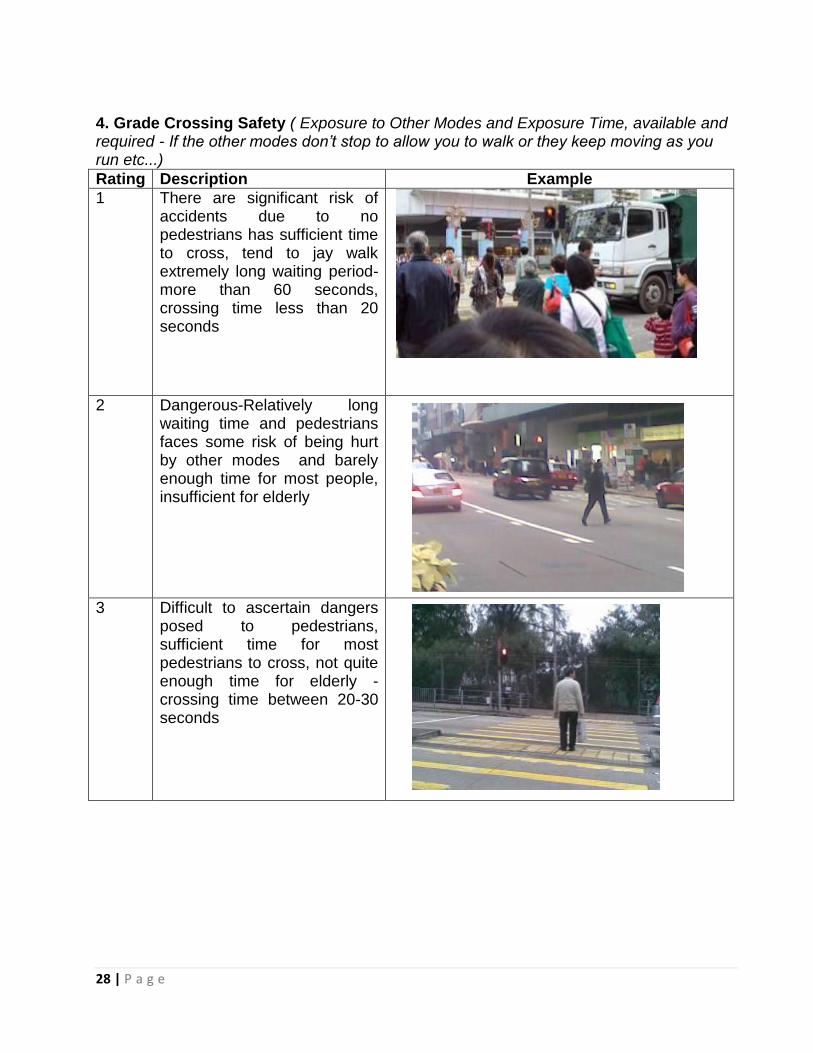
4. Grade Crossing Safety ( Exposure to Other Modes and Exposure Time, available and required - If the other modes don’t stop to allow you to walk or they keep moving as you run etc...)
Rating Description Example
1 There are significant risk of accidents due to no pedestrians has sufficient time to cross, tend to jay walk extremely long waiting period- more than 60 seconds, crossing time less than 20 seconds
2 Dangerous-Relatively long waiting time and pedestrians faces some risk of being hurt by other modes and barely enough time for most people, insufficient for elderly
3 Difficult to ascertain dangers posed to pedestrians, sufficient time for most pedestrians to cross, not quite enough time for elderly - crossing time between 20-30 seconds
29 | P a g e
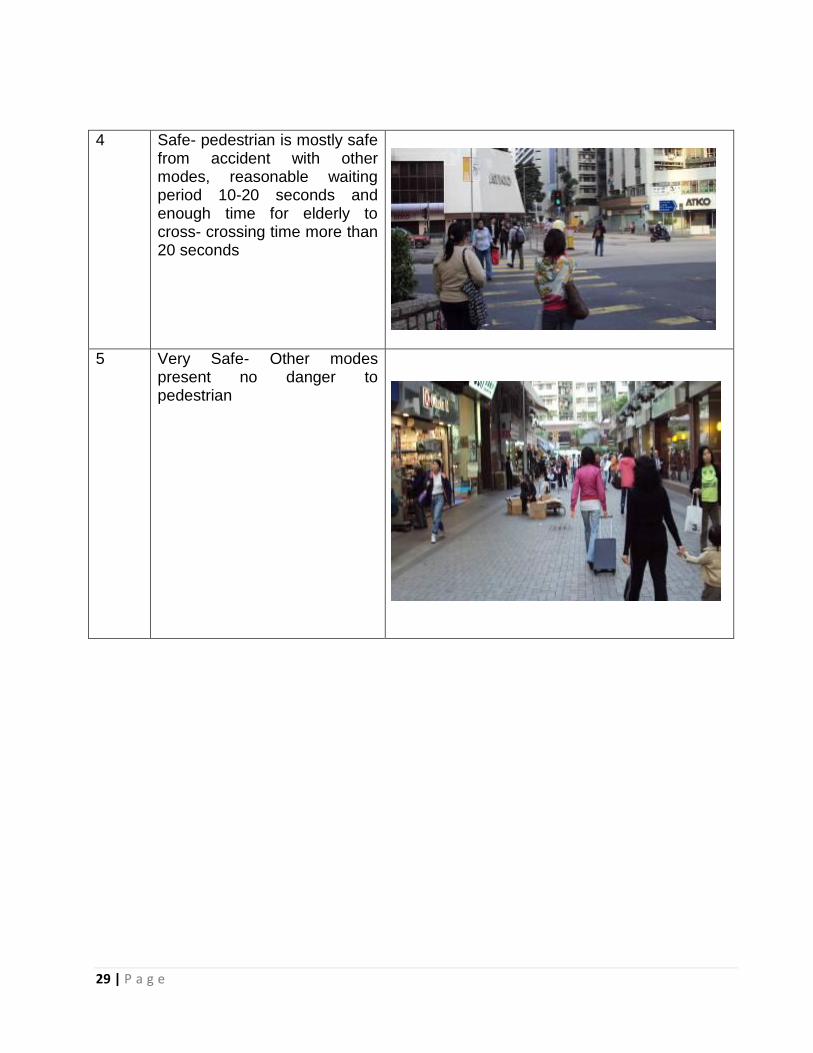
4 Safe- pedestrian is mostly safe from accident with other modes, reasonable waiting period 10-20 seconds and enough time for elderly to cross- crossing time more than 20 seconds
5 Very Safe- Other modes present no danger to pedestrian
30 | P a g e
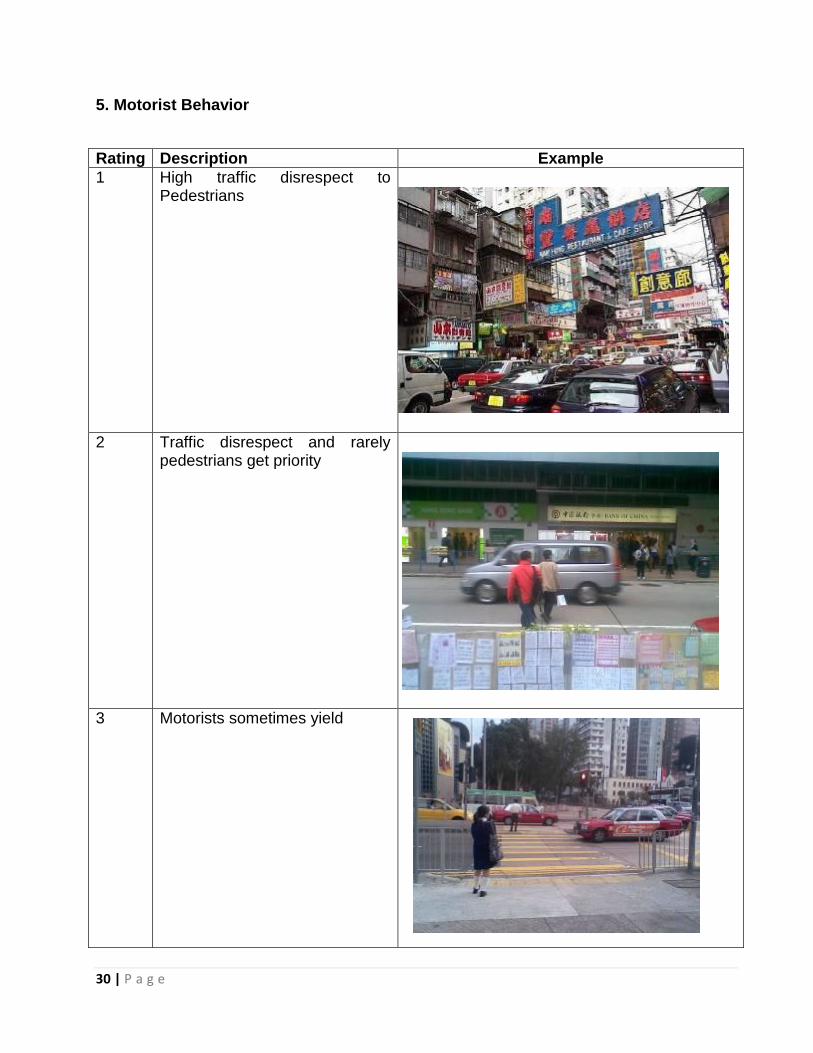
5. Motorist Behavior
Rating Description Example
1 High traffic disrespect to Pedestrians
2 Traffic disrespect and rarely pedestrians get priority
3 Motorists sometimes yield
31 | P a g e
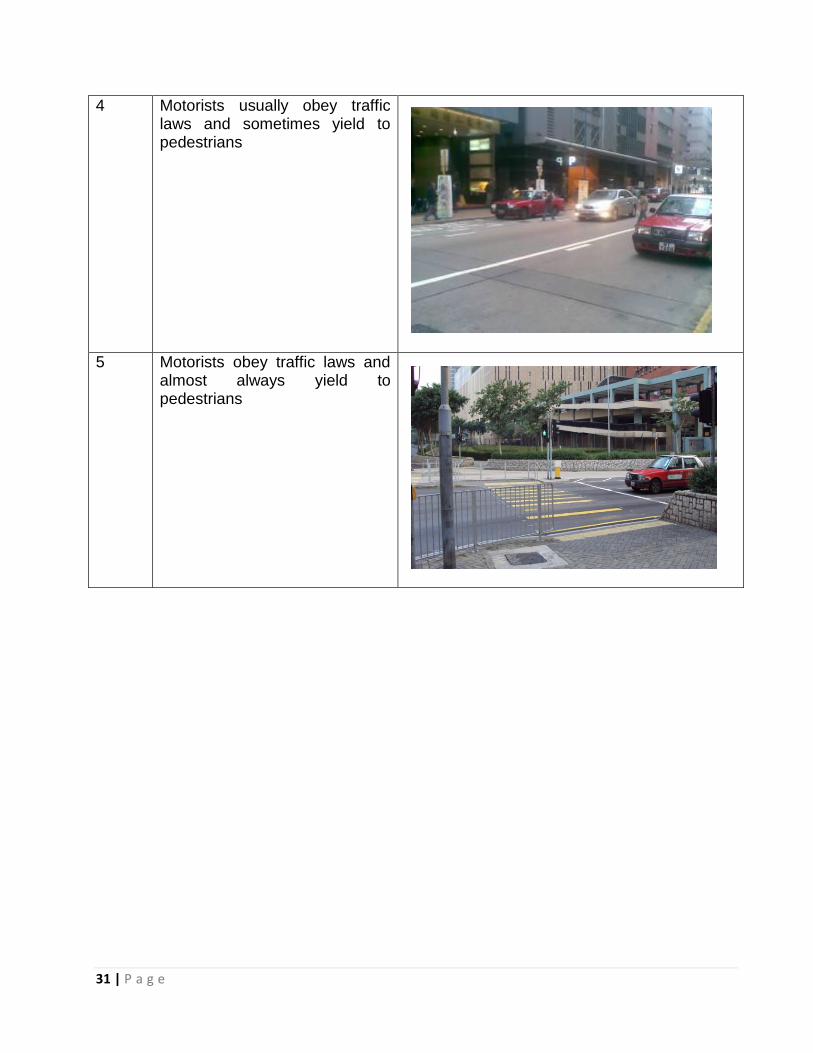
4 Motorists usually obey traffic laws and sometimes yield to pedestrians
5 Motorists obey traffic laws and almost always yield to pedestrians
32 | P a g e
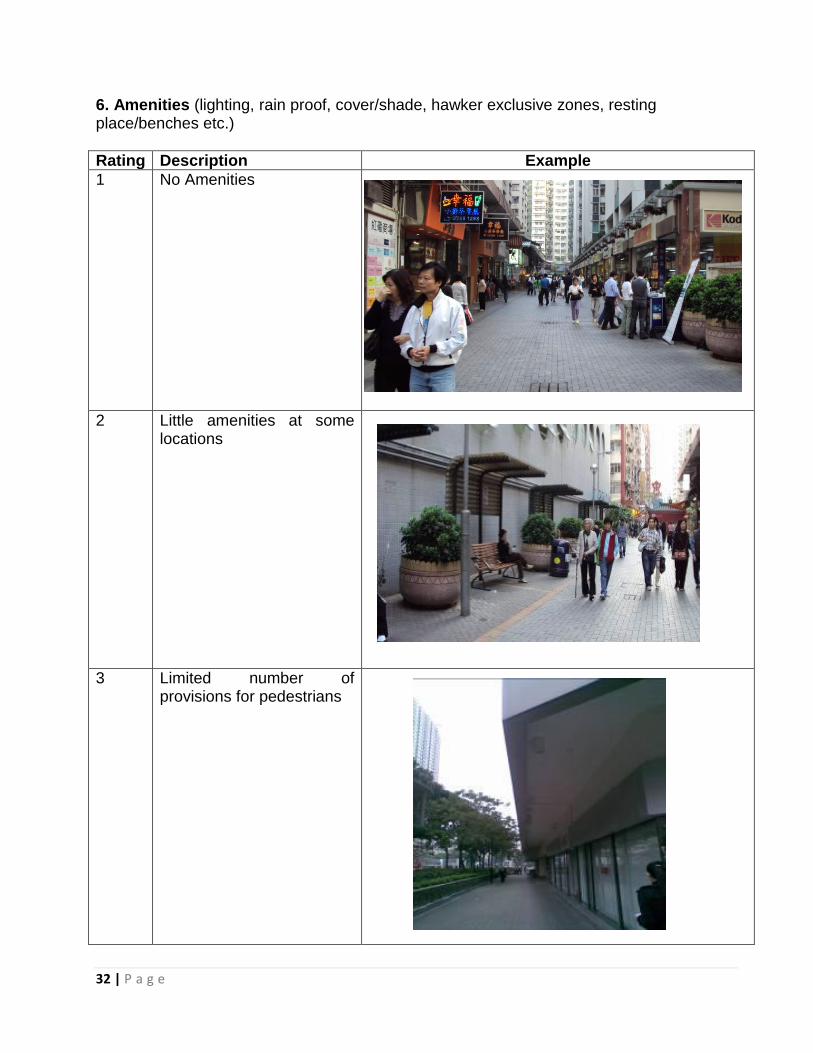
6. Amenities (lighting, rain proof, cover/shade, hawker exclusive zones, resting place/benches etc.)
Rating Description Example
1 No Amenities
2 Little amenities at some locations
3 Limited number of provisions for pedestrians
33 | P a g e
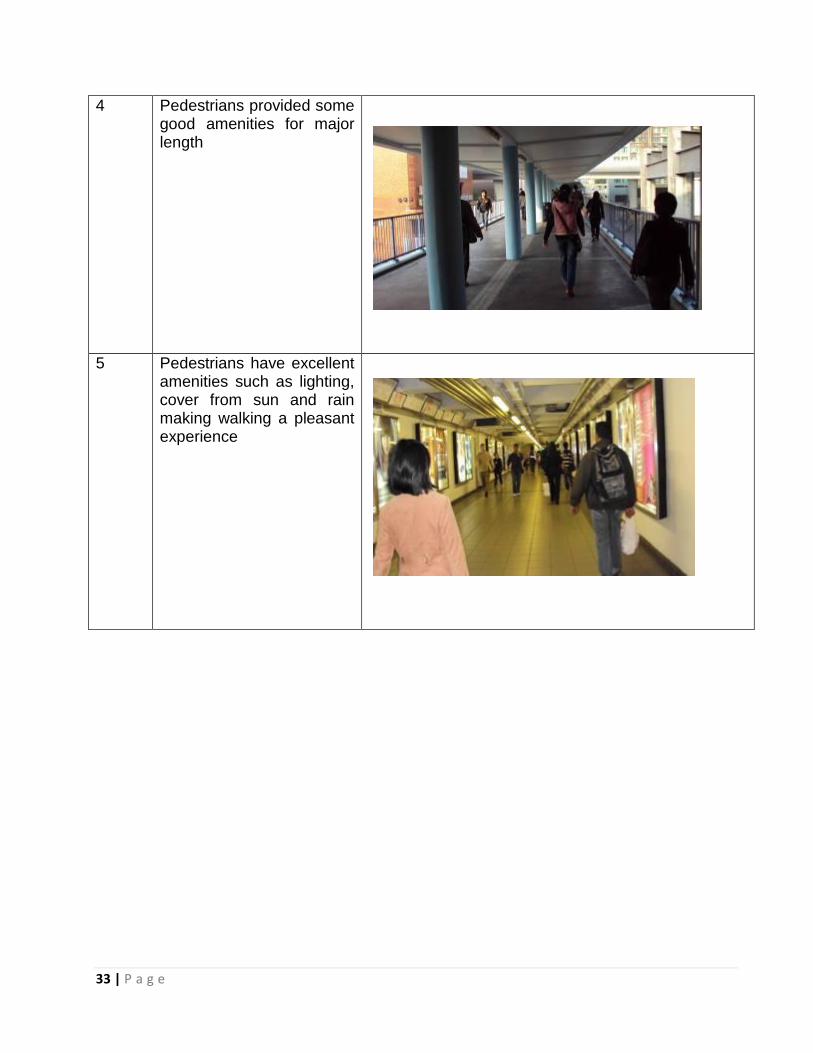
4 Pedestrians provided some good amenities for major length
5 Pedestrians have excellent amenities such as lighting, cover from sun and rain making walking a pleasant experience
34 | P a g e
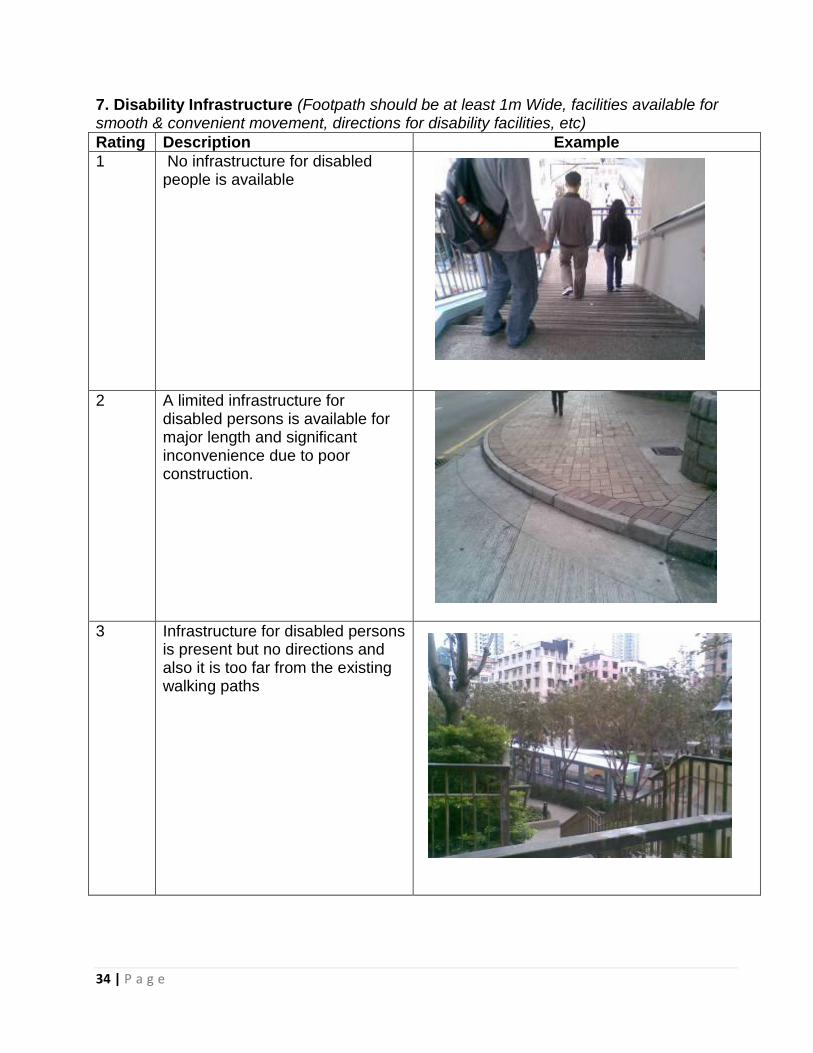
7. Disability Infrastructure (Footpath should be at least 1m Wide, facilities available for smooth & convenient movement, directions for disability facilities, etc)
Rating Description Example
1 No infrastructure for disabled people is available
2 A limited infrastructure for disabled persons is available for major length and significant inconvenience due to poor construction.
3 Infrastructure for disabled persons is present but no directions and also it is too far from the existing walking paths
35 | P a g e
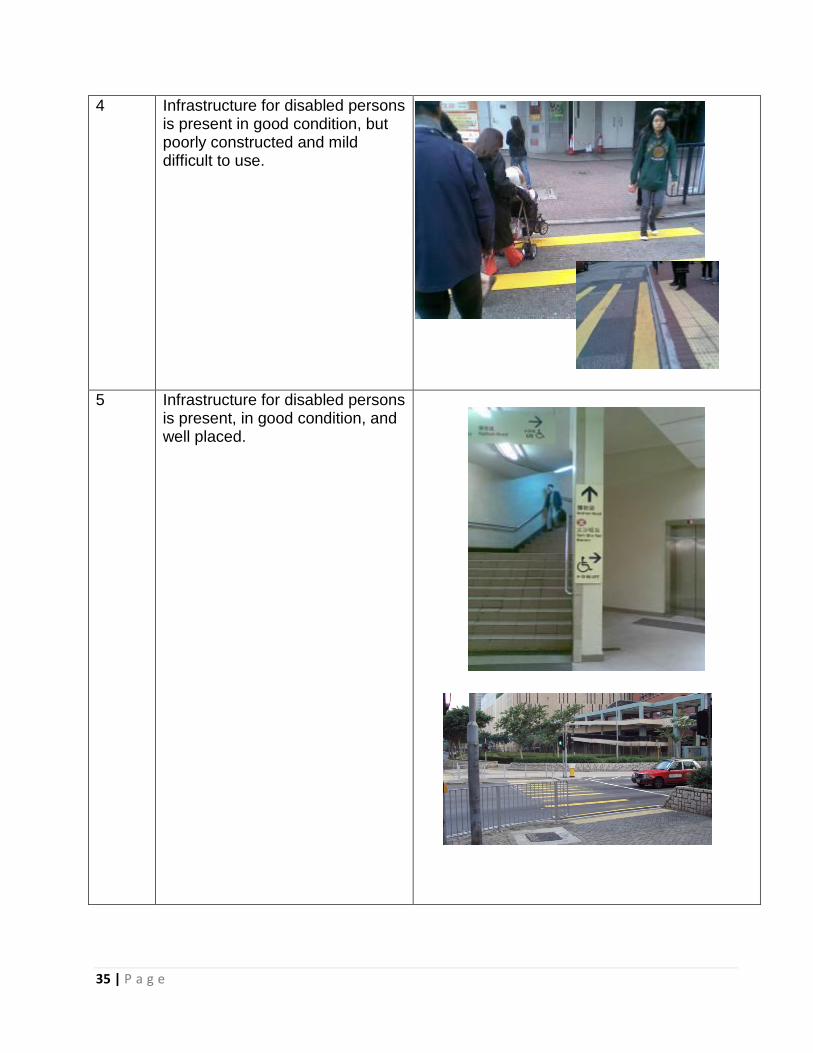
4 Infrastructure for disabled persons is present in good condition, but poorly constructed and mild difficult to use.
5 Infrastructure for disabled persons is present, in good condition, and well placed.
36 | P a g e
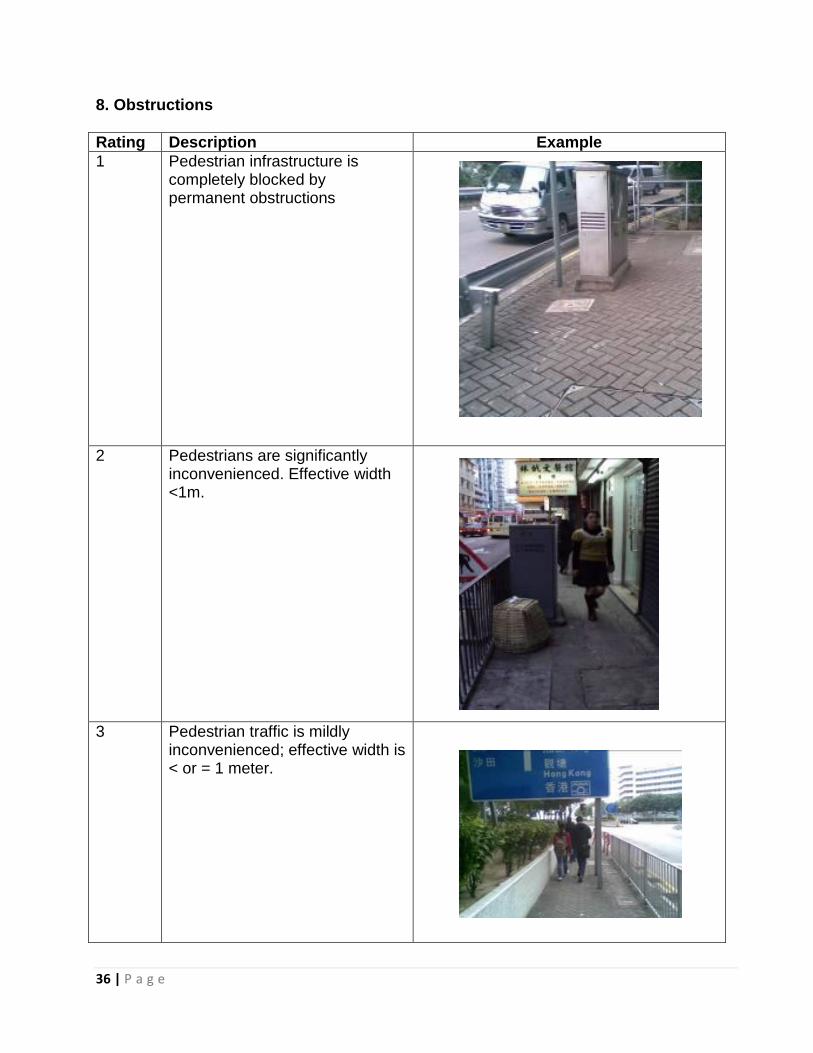
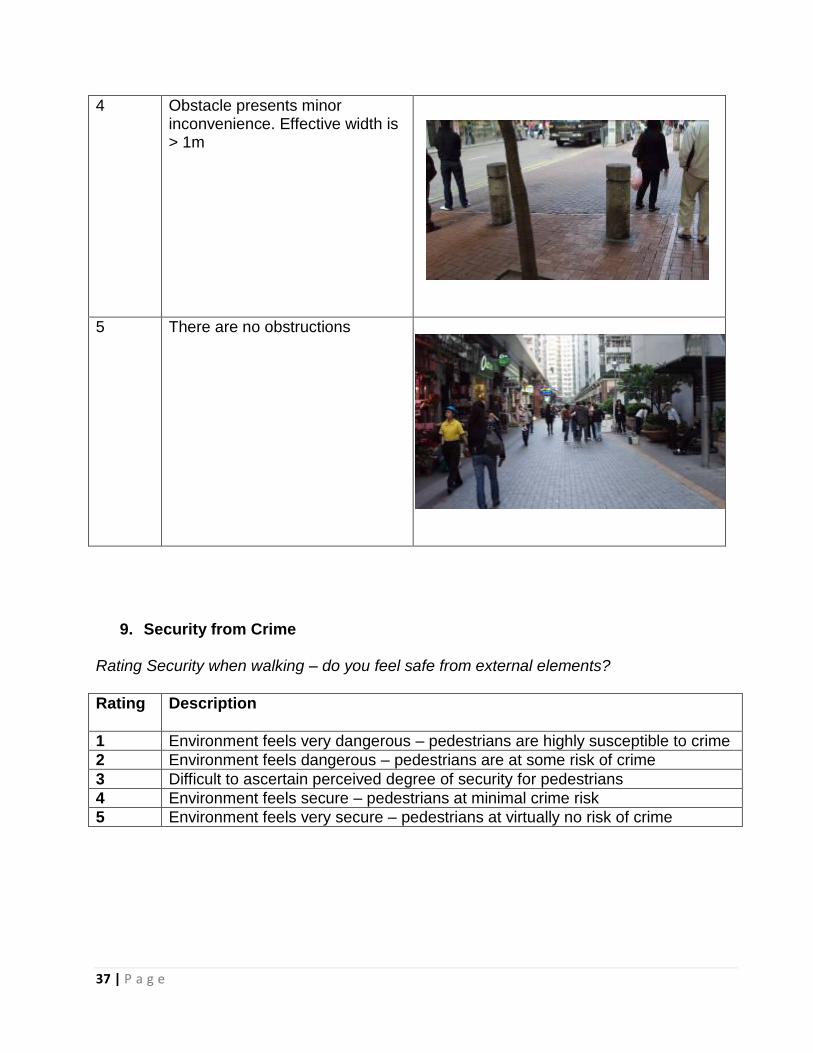
8. Obstructions
Rating Description Example
1 Pedestrian infrastructure is completely blocked by permanent obstructions
2 Pedestrians are significantly inconvenienced. Effective width <1m.
3 Pedestrian traffic is mildly inconvenienced; effective width is < or = 1 meter.
37 | P a g e
4 Obstacle presents minor inconvenience. Effective width is > 1m
5 There are no obstructions
9. Security from Crime
Rating Security when walking – do you feel safe from external elements?
Rating
Description
1 Environment feels very dangerous – pedestrians are highly susceptible to crime
2 Environment feels dangerous – pedestrians are at some risk of crime
3 Difficult to ascertain perceived degree of security for pedestrians
4 Environment feels secure – pedestrians at minimal crime risk
5 Environment feels very secure – pedestrians at virtually no risk of crime
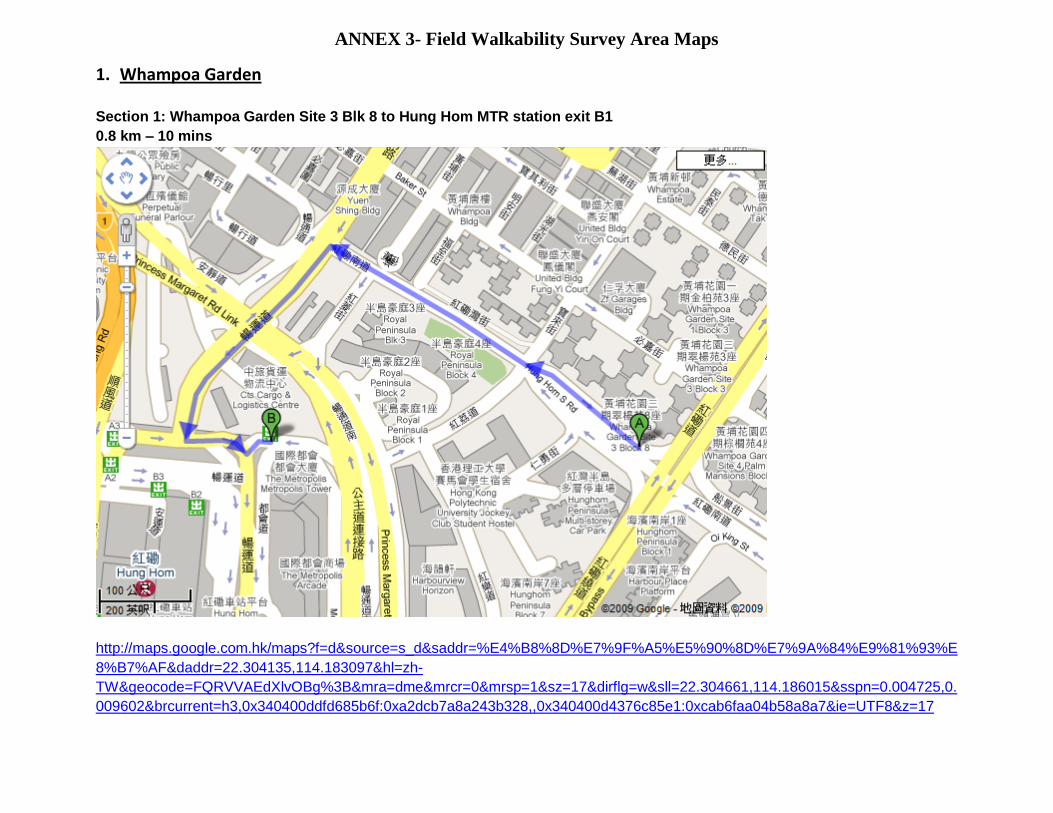
ANNEX 3- Field Walkability Survey Area Maps
1. Whampoa Garden
Section 1: Whampoa Garden Site 3 Blk 8 to Hung Hom MTR station exit B1
0.8 km – 10 mins
http://maps.google.com.hk/maps?f=d&source=s_d&saddr=%E4%B8%8D%E7%9F%A5%E5%90%8D%E7%9A%84%E9%81%93%E
8%B7%AF&daddr=22.304135,114.183097&hl=zh-
TW&geocode=FQRVVAEdXlvOBg%3B&mra=dme&mrcr=0&mrsp=1&sz=17&dirflg=w&sll=22.304661,114.186015&sspn=0.004725,0.
009602&brcurrent=h3,0x340400ddfd685b6f:0xa2dcb7a8a243b328,,0x340400d4376c85e1:0xcab6faa04b58a8a7&ie=UTF8&z=17
39 | P a g e
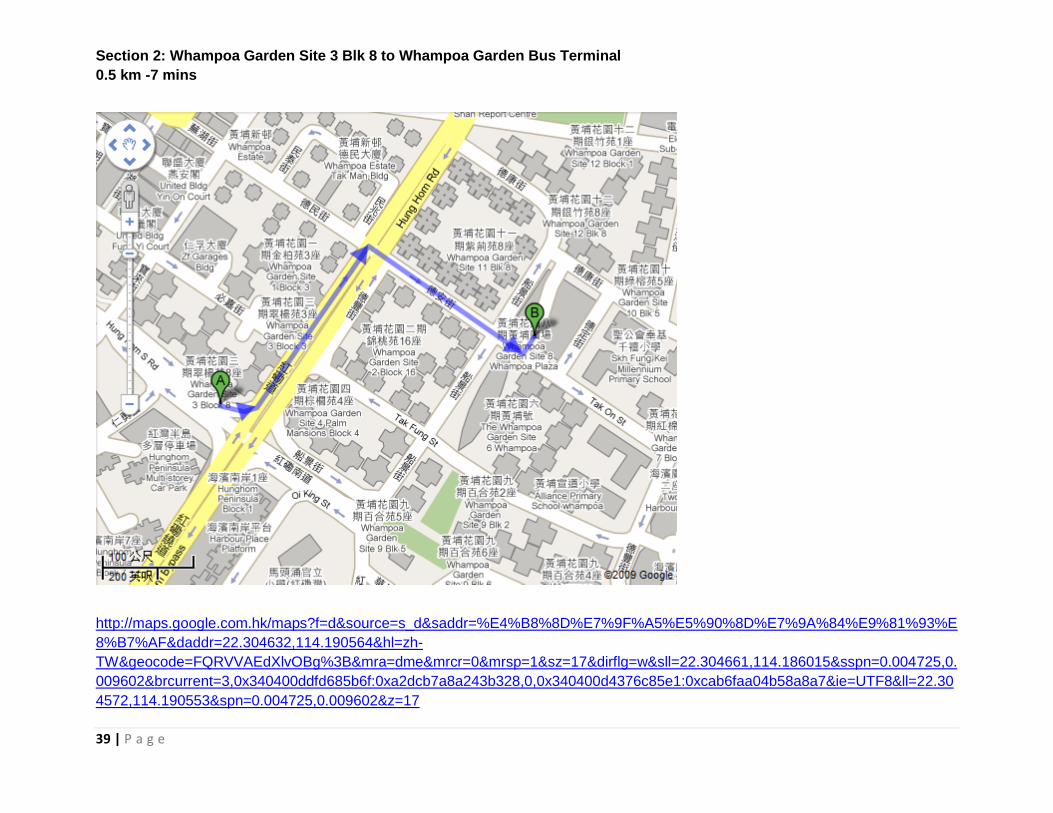
Section 2: Whampoa Garden Site 3 Blk 8 to Whampoa Garden Bus Terminal
0.5 km -7 mins
http://maps.google.com.hk/maps?f=d&source=s_d&saddr=%E4%B8%8D%E7%9F%A5%E5%90%8D%E7%9A%84%E9%81%93%E
8%B7%AF&daddr=22.304632,114.190564&hl=zh-
TW&geocode=FQRVVAEdXlvOBg%3B&mra=dme&mrcr=0&mrsp=1&sz=17&dirflg=w&sll=22.304661,114.186015&sspn=0.004725,0.
009602&brcurrent=3,0x340400ddfd685b6f:0xa2dcb7a8a243b328,0,0x340400d4376c85e1:0xcab6faa04b58a8a7&ie=UTF8&ll=22.30
4572,114.190553&spn=0.004725,0.009602&z=17
40 | P a g e
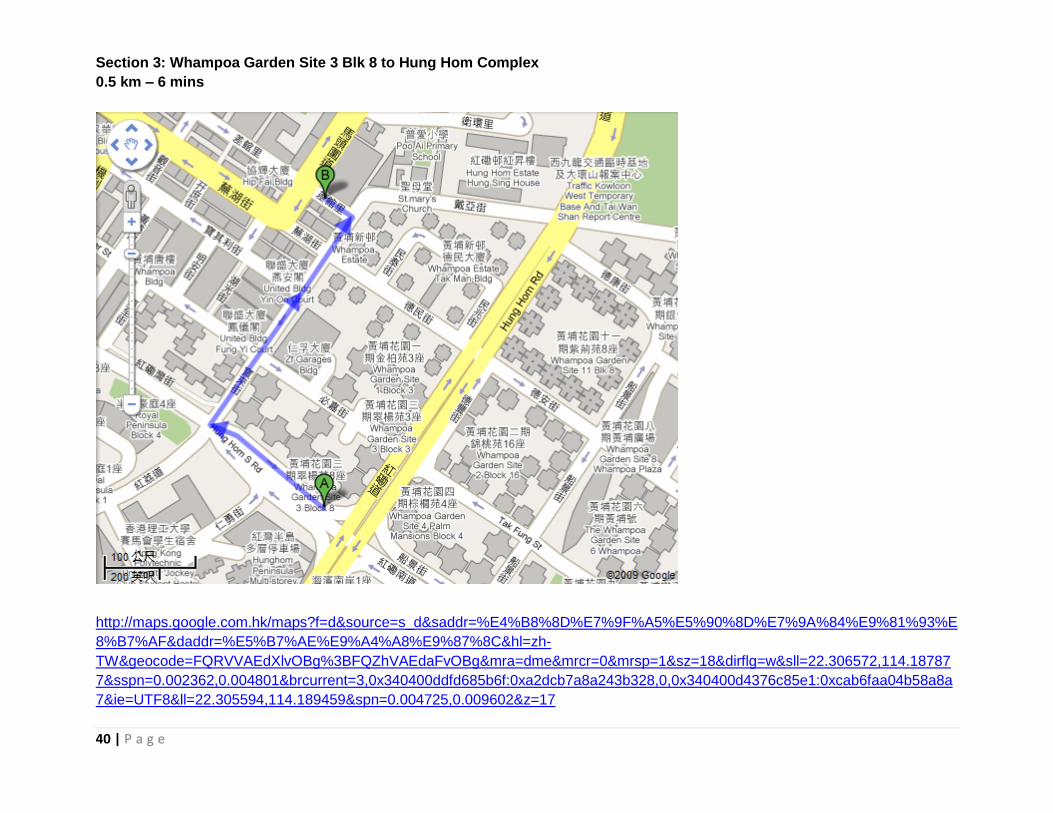
Section 3: Whampoa Garden Site 3 Blk 8 to Hung Hom Complex
0.5 km – 6 mins
http://maps.google.com.hk/maps?f=d&source=s_d&saddr=%E4%B8%8D%E7%9F%A5%E5%90%8D%E7%9A%84%E9%81%93%E
8%B7%AF&daddr=%E5%B7%AE%E9%A4%A8%E9%87%8C&hl=zh-
TW&geocode=FQRVVAEdXlvOBg%3BFQZhVAEdaFvOBg&mra=dme&mrcr=0&mrsp=1&sz=18&dirflg=w&sll=22.306572,114.18787
7&sspn=0.002362,0.004801&brcurrent=3,0x340400ddfd685b6f:0xa2dcb7a8a243b328,0,0x340400d4376c85e1:0xcab6faa04b58a8a
7&ie=UTF8&ll=22.305594,114.189459&spn=0.004725,0.009602&z=17
41 | P a g e
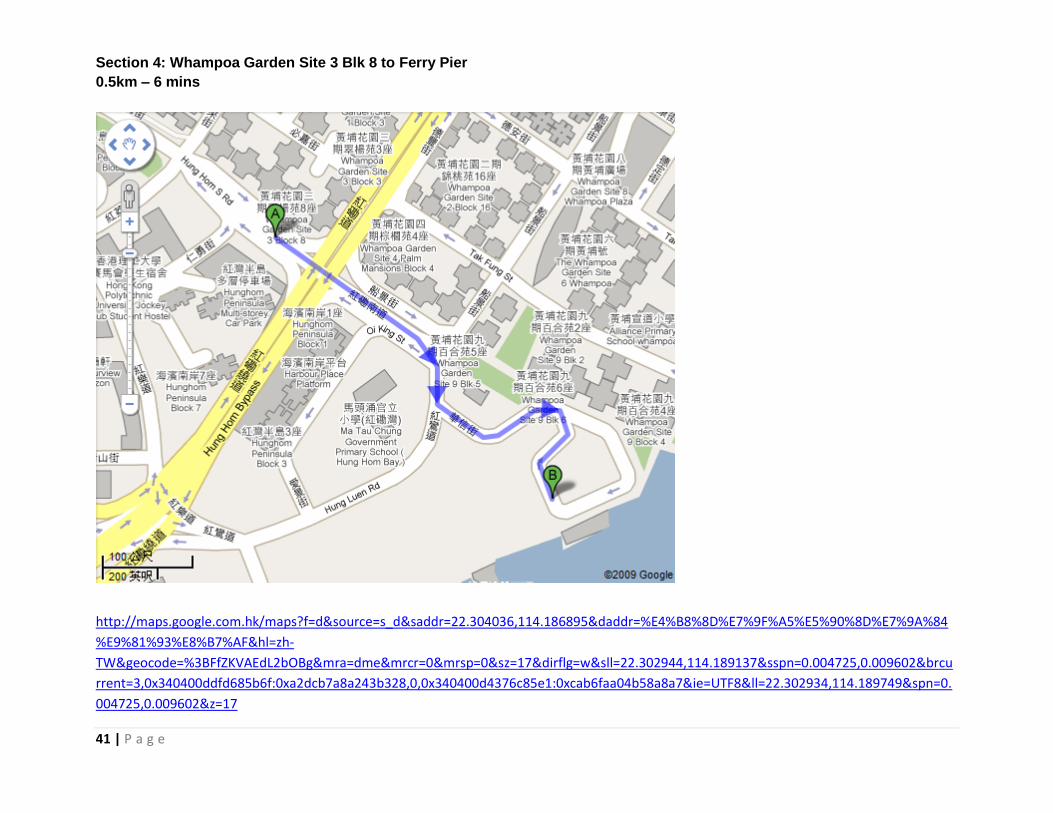
Section 4: Whampoa Garden Site 3 Blk 8 to Ferry Pier
0.5km – 6 mins
http://maps.google.com.hk/maps?f=d&source=s_d&saddr=22.304036,114.186895&daddr=%E4%B8%8D%E7%9F%A5%E5%90%8D%E7%9A%84
%E9%81%93%E8%B7%AF&hl=zh-
TW&geocode=%3BFfZKVAEdL2bOBg&mra=dme&mrcr=0&mrsp=0&sz=17&dirflg=w&sll=22.302944,114.189137&sspn=0.004725,0.009602&brcu
rrent=3,0x340400ddfd685b6f:0xa2dcb7a8a243b328,0,0x340400d4376c85e1:0xcab6faa04b58a8a7&ie=UTF8&ll=22.302934,114.189749&spn=0.
004725,0.009602&z=17
42 | P a g e
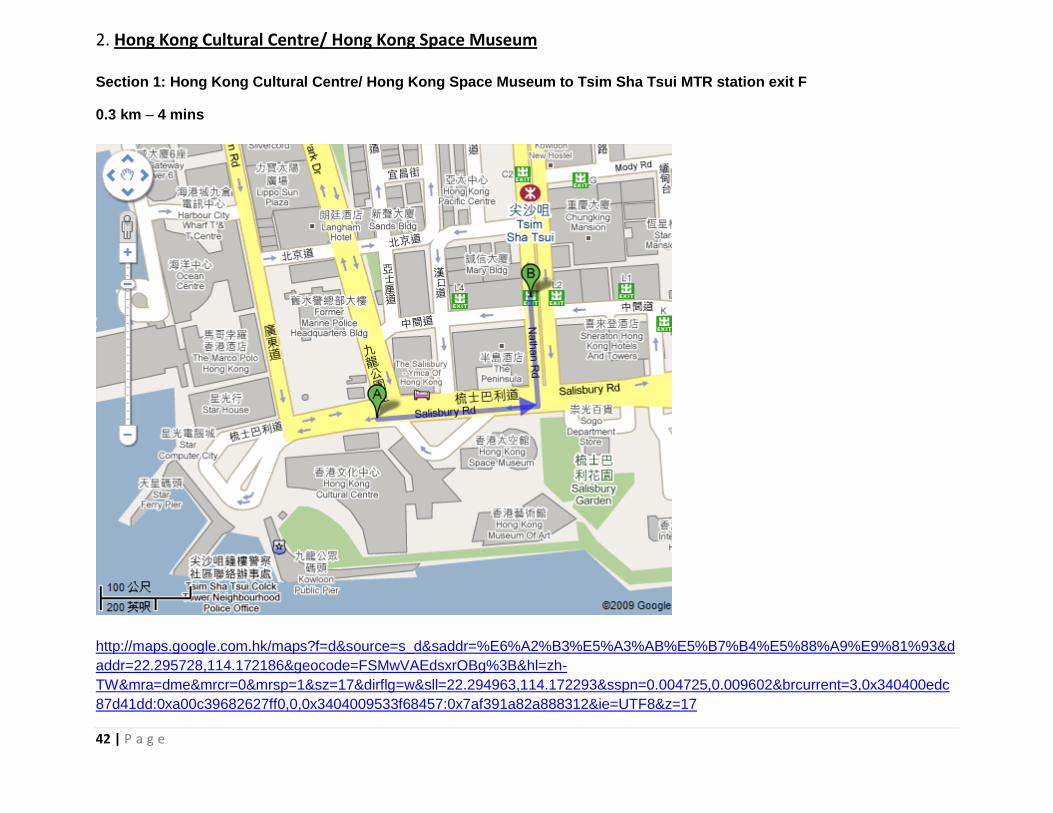
2. Hong Kong Cultural Centre/ Hong Kong Space Museum
Section 1: Hong Kong Cultural Centre/ Hong Kong Space Museum to Tsim Sha Tsui MTR station exit F
0.3 km – 4 mins
http://maps.google.com.hk/maps?f=d&source=s_d&saddr=%E6%A2%B3%E5%A3%AB%E5%B7%B4%E5%88%A9%E9%81%93&d
addr=22.295728,114.172186&geocode=FSMwVAEdsxrOBg%3B&hl=zh-
TW&mra=dme&mrcr=0&mrsp=1&sz=17&dirflg=w&sll=22.294963,114.172293&sspn=0.004725,0.009602&brcurrent=3,0x340400edc
87d41dd:0xa00c39682627ff0,0,0x3404009533f68457:0x7af391a82a888312&ie=UTF8&z=17
43 | P a g e
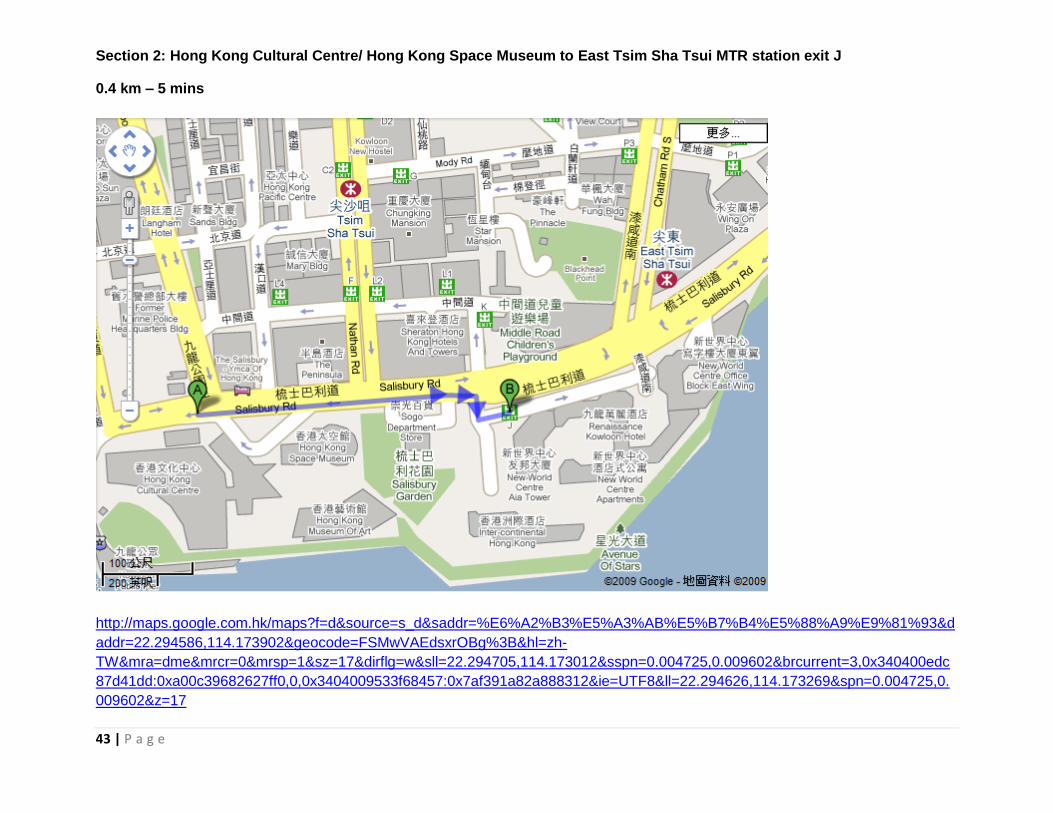
Section 2: Hong Kong Cultural Centre/ Hong Kong Space Museum to East Tsim Sha Tsui MTR station exit J
0.4 km – 5 mins
http://maps.google.com.hk/maps?f=d&source=s_d&saddr=%E6%A2%B3%E5%A3%AB%E5%B7%B4%E5%88%A9%E9%81%93&d
addr=22.294586,114.173902&geocode=FSMwVAEdsxrOBg%3B&hl=zh-
TW&mra=dme&mrcr=0&mrsp=1&sz=17&dirflg=w&sll=22.294705,114.173012&sspn=0.004725,0.009602&brcurrent=3,0x340400edc
87d41dd:0xa00c39682627ff0,0,0x3404009533f68457:0x7af391a82a888312&ie=UTF8&ll=22.294626,114.173269&spn=0.004725,0.
009602&z=17
44 | P a g e
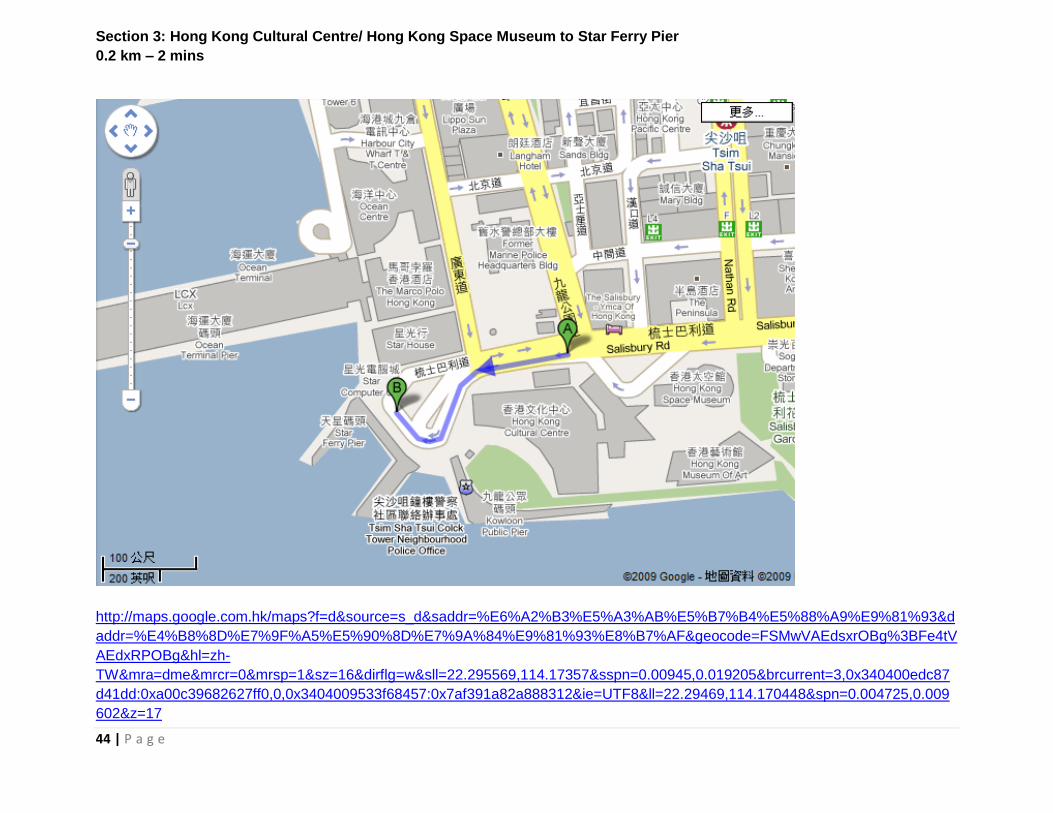
Section 3: Hong Kong Cultural Centre/ Hong Kong Space Museum to Star Ferry Pier
0.2 km – 2 mins
http://maps.google.com.hk/maps?f=d&source=s_d&saddr=%E6%A2%B3%E5%A3%AB%E5%B7%B4%E5%88%A9%E9%81%93&d
addr=%E4%B8%8D%E7%9F%A5%E5%90%8D%E7%9A%84%E9%81%93%E8%B7%AF&geocode=FSMwVAEdsxrOBg%3BFe4tV
AEdxRPOBg&hl=zh-
TW&mra=dme&mrcr=0&mrsp=1&sz=16&dirflg=w&sll=22.295569,114.17357&sspn=0.00945,0.019205&brcurrent=3,0x340400edc87
d41dd:0xa00c39682627ff0,0,0x3404009533f68457:0x7af391a82a888312&ie=UTF8&ll=22.29469,114.170448&spn=0.004725,0.009
602&z=17
45 | P a g e
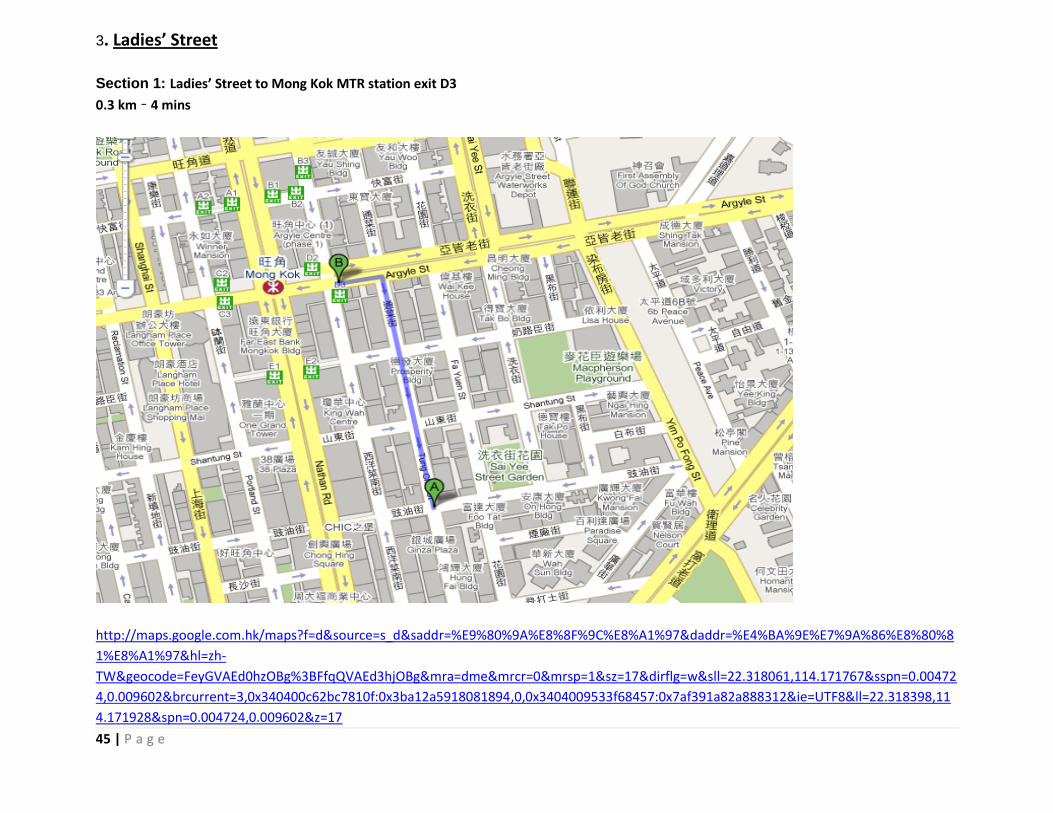
3. Ladies’ Street
Section 1: Ladies’ Street to Mong Kok MTR station exit D3
0.3 km – 4 mins
http://maps.google.com.hk/maps?f=d&source=s_d&saddr=%E9%80%9A%E8%8F%9C%E8%A1%97&daddr=%E4%BA%9E%E7%9A%86%E8%80%8
1%E8%A1%97&hl=zh-
TW&geocode=FeyGVAEd0hzOBg%3BFfqQVAEd3hjOBg&mra=dme&mrcr=0&mrsp=1&sz=17&dirflg=w&sll=22.318061,114.171767&sspn=0.00472
4,0.009602&brcurrent=3,0x340400c62bc7810f:0x3ba12a5918081894,0,0x3404009533f68457:0x7af391a82a888312&ie=UTF8&ll=22.318398,11
4.171928&spn=0.004724,0.009602&z=17
46 | P a g e
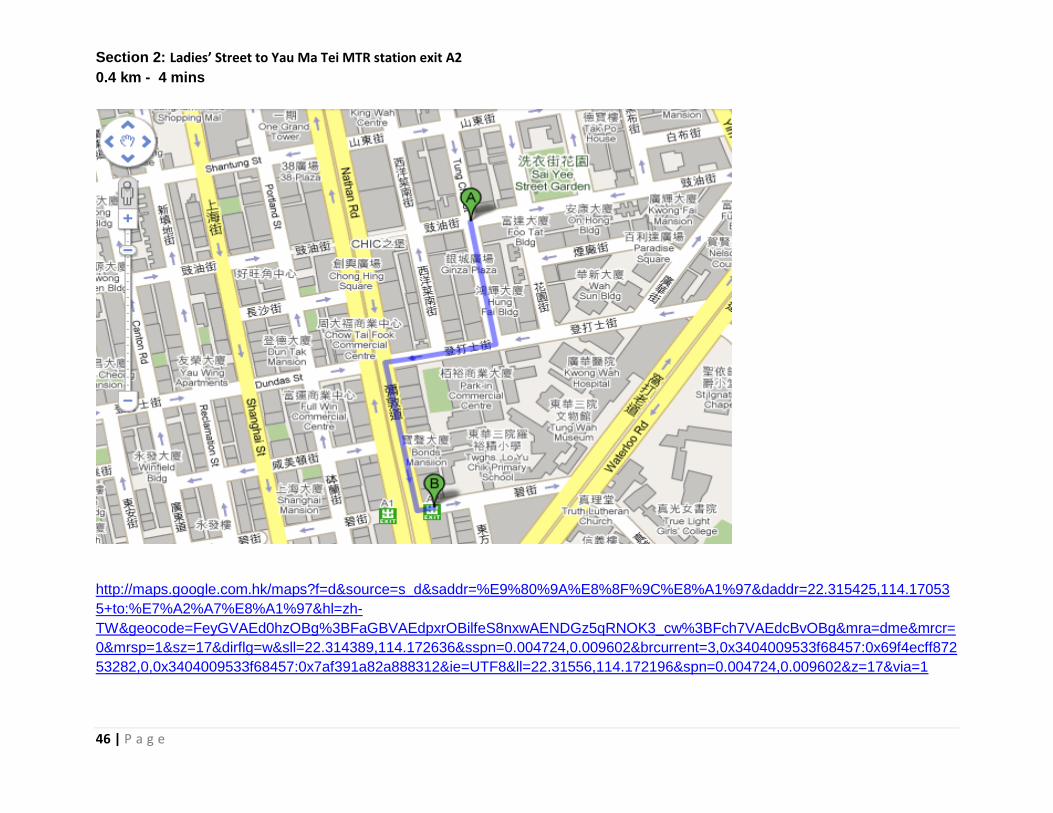
Section 2: Ladies’ Street to Yau Ma Tei MTR station exit A2
0.4 km - 4 mins
http://maps.google.com.hk/maps?f=d&source=s_d&saddr=%E9%80%9A%E8%8F%9C%E8%A1%97&daddr=22.315425,114.17053
5+to:%E7%A2%A7%E8%A1%97&hl=zh-
TW&geocode=FeyGVAEd0hzOBg%3BFaGBVAEdpxrOBilfeS8nxwAENDGz5qRNOK3_cw%3BFch7VAEdcBvOBg&mra=dme&mrcr=
0&mrsp=1&sz=17&dirflg=w&sll=22.314389,114.172636&sspn=0.004724,0.009602&brcurrent=3,0x3404009533f68457:0x69f4ecff872
53282,0,0x3404009533f68457:0x7af391a82a888312&ie=UTF8&ll=22.31556,114.172196&spn=0.004724,0.009602&z=17&via=1
47 | P a g e
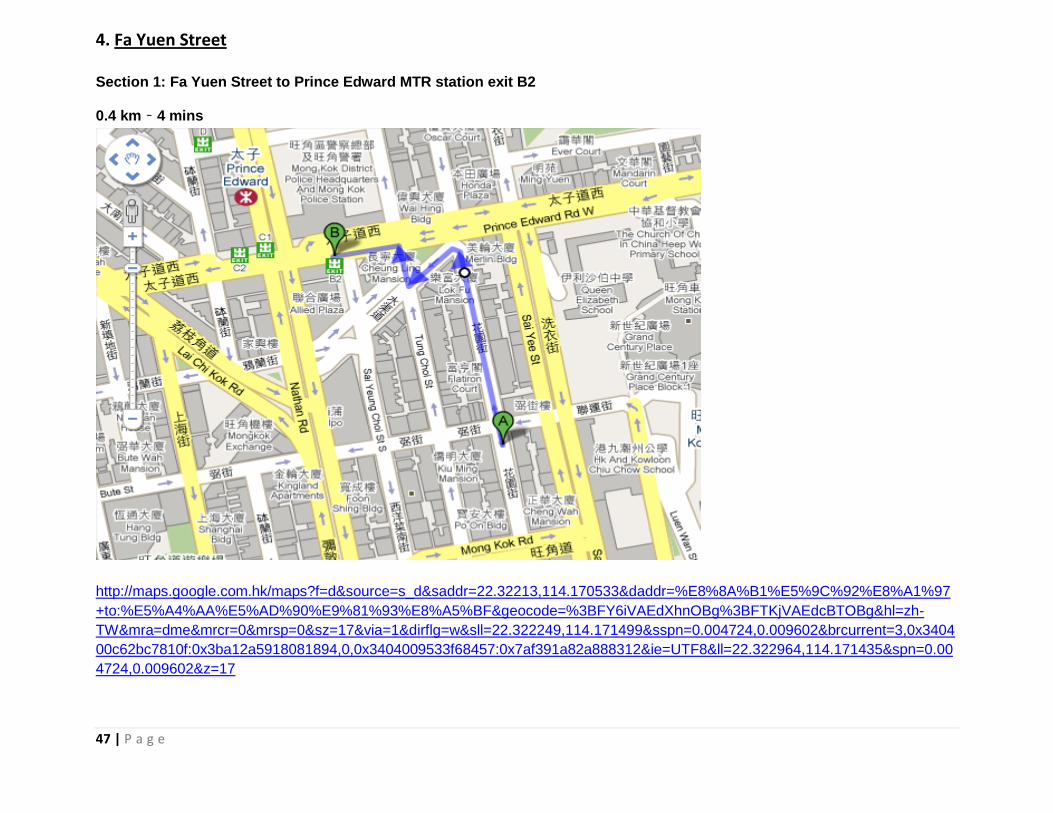
4. Fa Yuen Street
Section 1: Fa Yuen Street to Prince Edward MTR station exit B2
0.4 km – 4 mins
http://maps.google.com.hk/maps?f=d&source=s_d&saddr=22.32213,114.170533&daddr=%E8%8A%B1%E5%9C%92%E8%A1%97
+to:%E5%A4%AA%E5%AD%90%E9%81%93%E8%A5%BF&geocode=%3BFY6iVAEdXhnOBg%3BFTKjVAEdcBTOBg&hl=zh-
TW&mra=dme&mrcr=0&mrsp=0&sz=17&via=1&dirflg=w&sll=22.322249,114.171499&sspn=0.004724,0.009602&brcurrent=3,0x3404
00c62bc7810f:0x3ba12a5918081894,0,0x3404009533f68457:0x7af391a82a888312&ie=UTF8&ll=22.322964,114.171435&spn=0.00
4724,0.009602&z=17
48 | P a g e
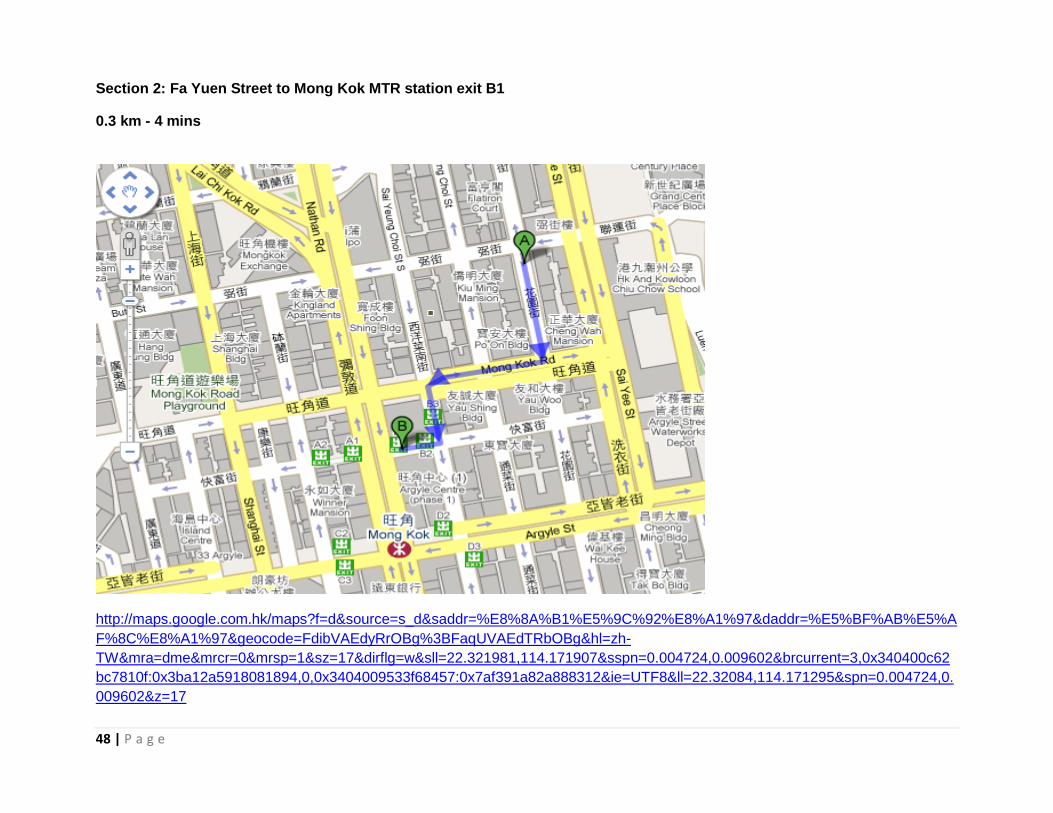
Section 2: Fa Yuen Street to Mong Kok MTR station exit B1
0.3 km - 4 mins
http://maps.google.com.hk/maps?f=d&source=s_d&saddr=%E8%8A%B1%E5%9C%92%E8%A1%97&daddr=%E5%BF%AB%E5%A
F%8C%E8%A1%97&geocode=FdibVAEdyRrOBg%3BFaqUVAEdTRbOBg&hl=zh-
TW&mra=dme&mrcr=0&mrsp=1&sz=17&dirflg=w&sll=22.321981,114.171907&sspn=0.004724,0.009602&brcurrent=3,0x340400c62
bc7810f:0x3ba12a5918081894,0,0x3404009533f68457:0x7af391a82a888312&ie=UTF8&ll=22.32084,114.171295&spn=0.004724,0.
009602&z=17
49 | P a g e
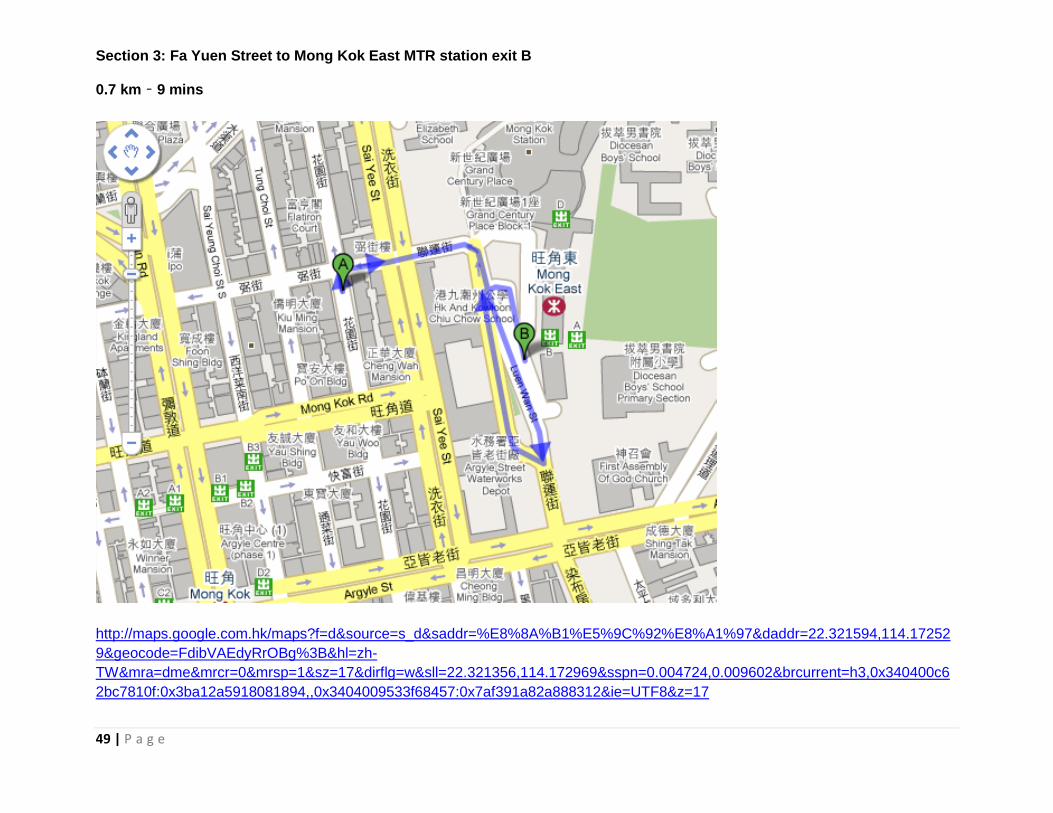
Section 3: Fa Yuen Street to Mong Kok East MTR station exit B
0.7 km – 9 mins
http://maps.google.com.hk/maps?f=d&source=s_d&saddr=%E8%8A%B1%E5%9C%92%E8%A1%97&daddr=22.321594,114.17252
9&geocode=FdibVAEdyRrOBg%3B&hl=zh-
TW&mra=dme&mrcr=0&mrsp=1&sz=17&dirflg=w&sll=22.321356,114.172969&sspn=0.004724,0.009602&brcurrent=h3,0x340400c6
2bc7810f:0x3ba12a5918081894,,0x3404009533f68457:0x7af391a82a888312&ie=UTF8&z=17
50 | P a g e
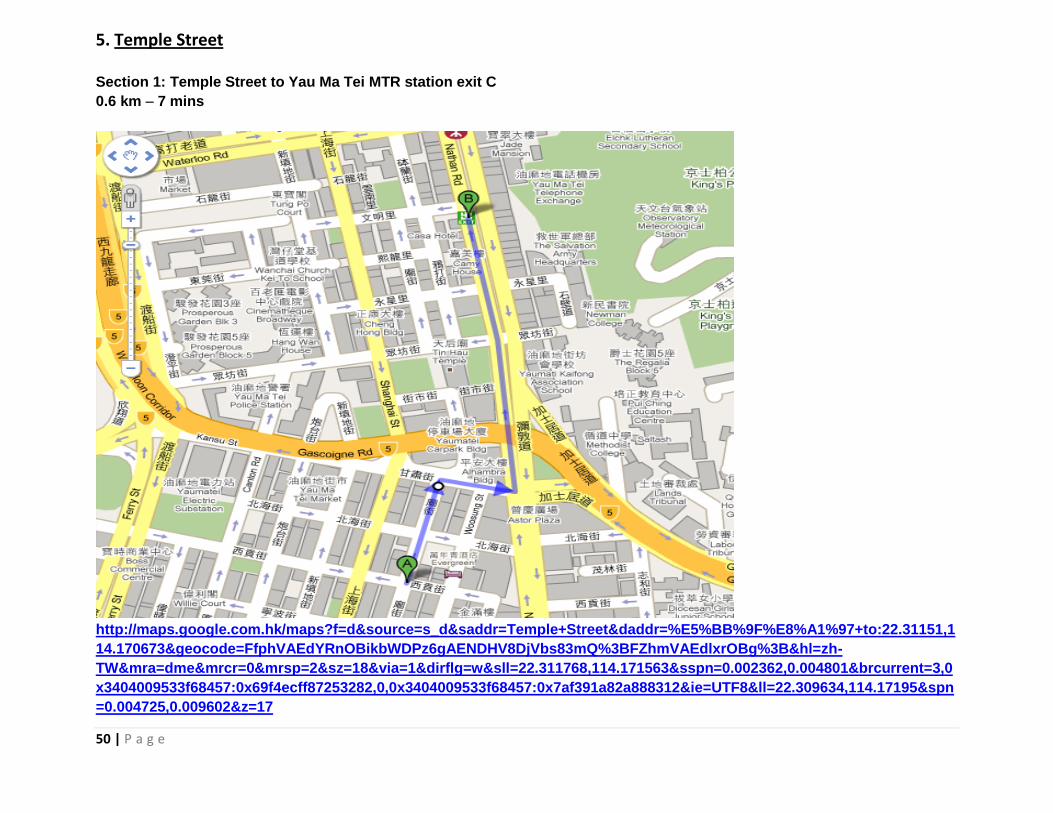
5. Temple Street
Section 1: Temple Street to Yau Ma Tei MTR station exit C
0.6 km – 7 mins
http://maps.google.com.hk/maps?f=d&source=s_d&saddr=Temple+Street&daddr=%E5%BB%9F%E8%A1%97+to:22.31151,1
14.170673&geocode=FfphVAEdYRnOBikbWDPz6gAENDHV8DjVbs83mQ%3BFZhmVAEdlxrOBg%3B&hl=zh-
TW&mra=dme&mrcr=0&mrsp=2&sz=18&via=1&dirflg=w&sll=22.311768,114.171563&sspn=0.002362,0.004801&brcurrent=3,0
x3404009533f68457:0x69f4ecff87253282,0,0x3404009533f68457:0x7af391a82a888312&ie=UTF8&ll=22.309634,114.17195&spn
=0.004725,0.009602&z=17
51 | P a g e
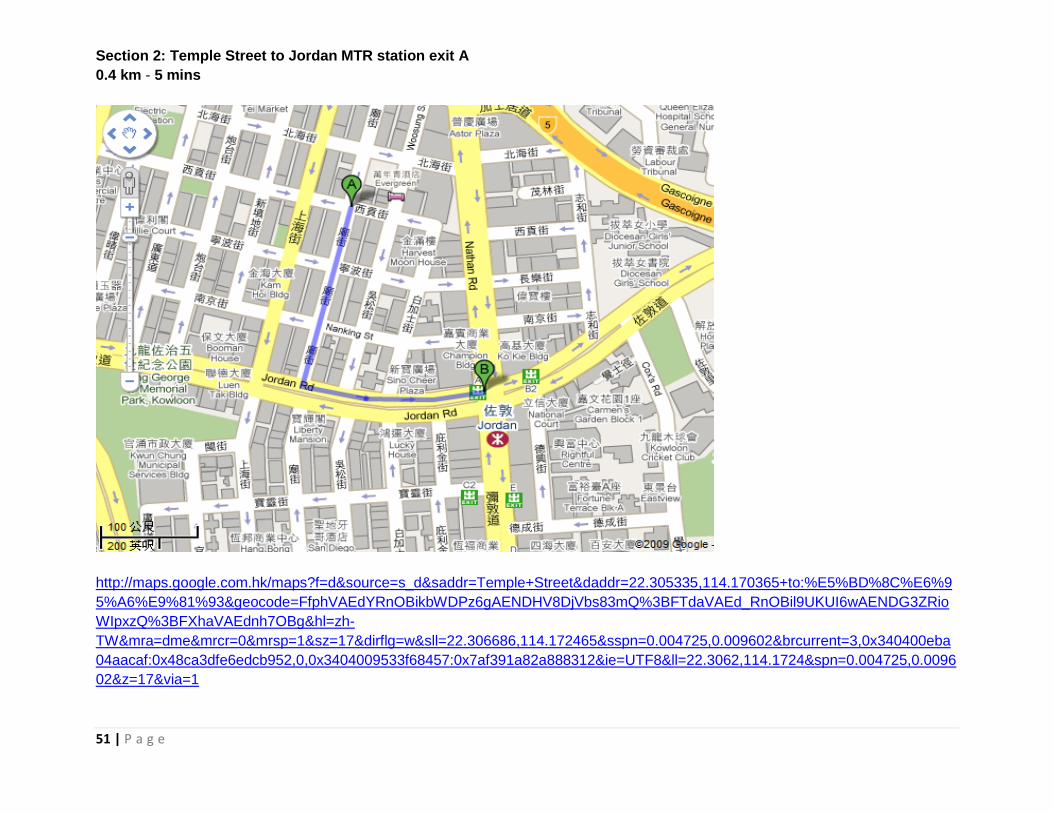
Section 2: Temple Street to Jordan MTR station exit A
0.4 km - 5 mins
http://maps.google.com.hk/maps?f=d&source=s_d&saddr=Temple+Street&daddr=22.305335,114.170365+to:%E5%BD%8C%E6%9
5%A6%E9%81%93&geocode=FfphVAEdYRnOBikbWDPz6gAENDHV8DjVbs83mQ%3BFTdaVAEd_RnOBil9UKUI6wAENDG3ZRio
WIpxzQ%3BFXhaVAEdnh7OBg&hl=zh-
TW&mra=dme&mrcr=0&mrsp=1&sz=17&dirflg=w&sll=22.306686,114.172465&sspn=0.004725,0.009602&brcurrent=3,0x340400eba
04aacaf:0x48ca3dfe6edcb952,0,0x3404009533f68457:0x7af391a82a888312&ie=UTF8&ll=22.3062,114.1724&spn=0.004725,0.0096
02&z=17&via=1
52 | P a g e
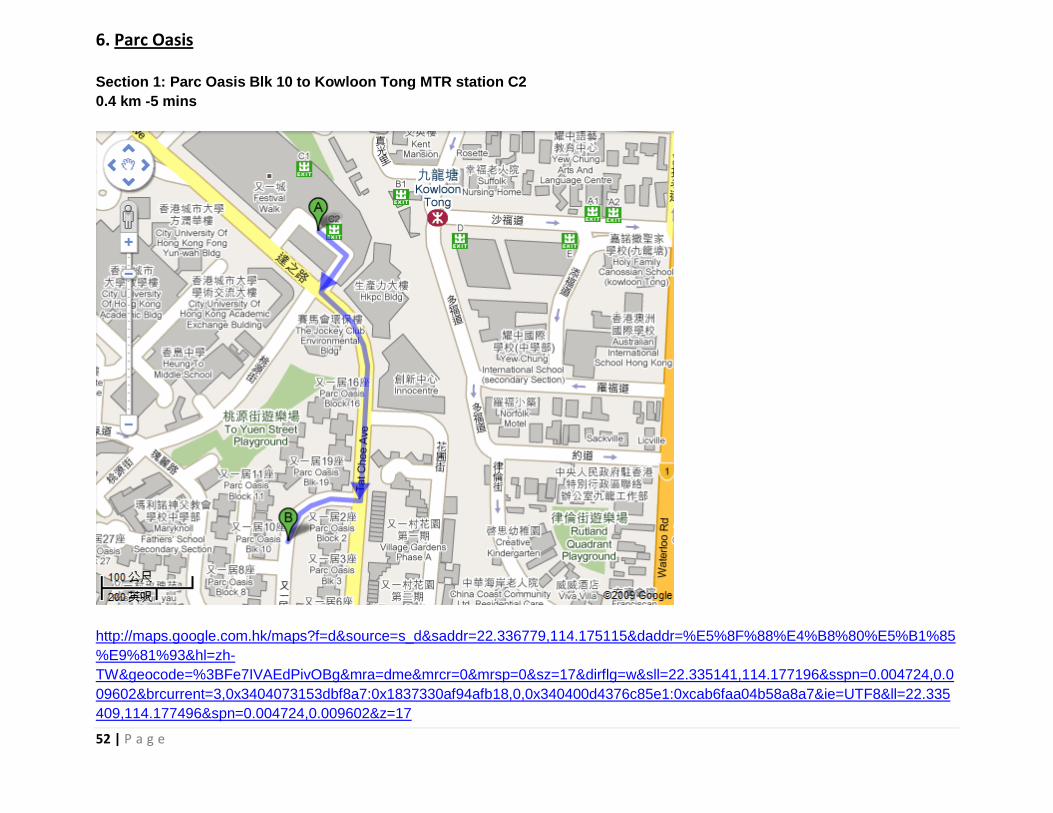
6. Parc Oasis
Section 1: Parc Oasis Blk 10 to Kowloon Tong MTR station C2
0.4 km -5 mins
http://maps.google.com.hk/maps?f=d&source=s_d&saddr=22.336779,114.175115&daddr=%E5%8F%88%E4%B8%80%E5%B1%85
%E9%81%93&hl=zh-
TW&geocode=%3BFe7IVAEdPivOBg&mra=dme&mrcr=0&mrsp=0&sz=17&dirflg=w&sll=22.335141,114.177196&sspn=0.004724,0.0
09602&brcurrent=3,0x3404073153dbf8a7:0x1837330af94afb18,0,0x340400d4376c85e1:0xcab6faa04b58a8a7&ie=UTF8&ll=22.335
409,114.177496&spn=0.004724,0.009602&z=17
53 | P a g e
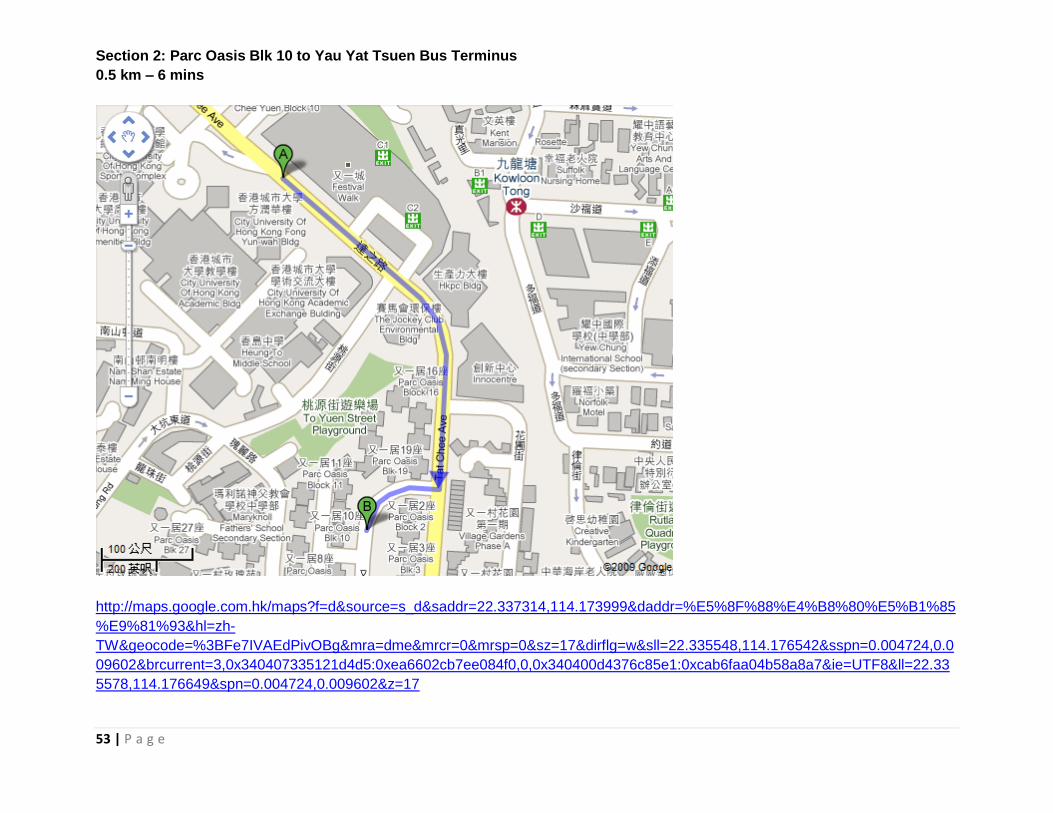
Section 2: Parc Oasis Blk 10 to Yau Yat Tsuen Bus Terminus
0.5 km – 6 mins
http://maps.google.com.hk/maps?f=d&source=s_d&saddr=22.337314,114.173999&daddr=%E5%8F%88%E4%B8%80%E5%B1%85
%E9%81%93&hl=zh-
TW&geocode=%3BFe7IVAEdPivOBg&mra=dme&mrcr=0&mrsp=0&sz=17&dirflg=w&sll=22.335548,114.176542&sspn=0.004724,0.0
09602&brcurrent=3,0x340407335121d4d5:0xea6602cb7ee084f0,0,0x340400d4376c85e1:0xcab6faa04b58a8a7&ie=UTF8&ll=22.33
5578,114.176649&spn=0.004724,0.009602&z=17
54 | P a g e
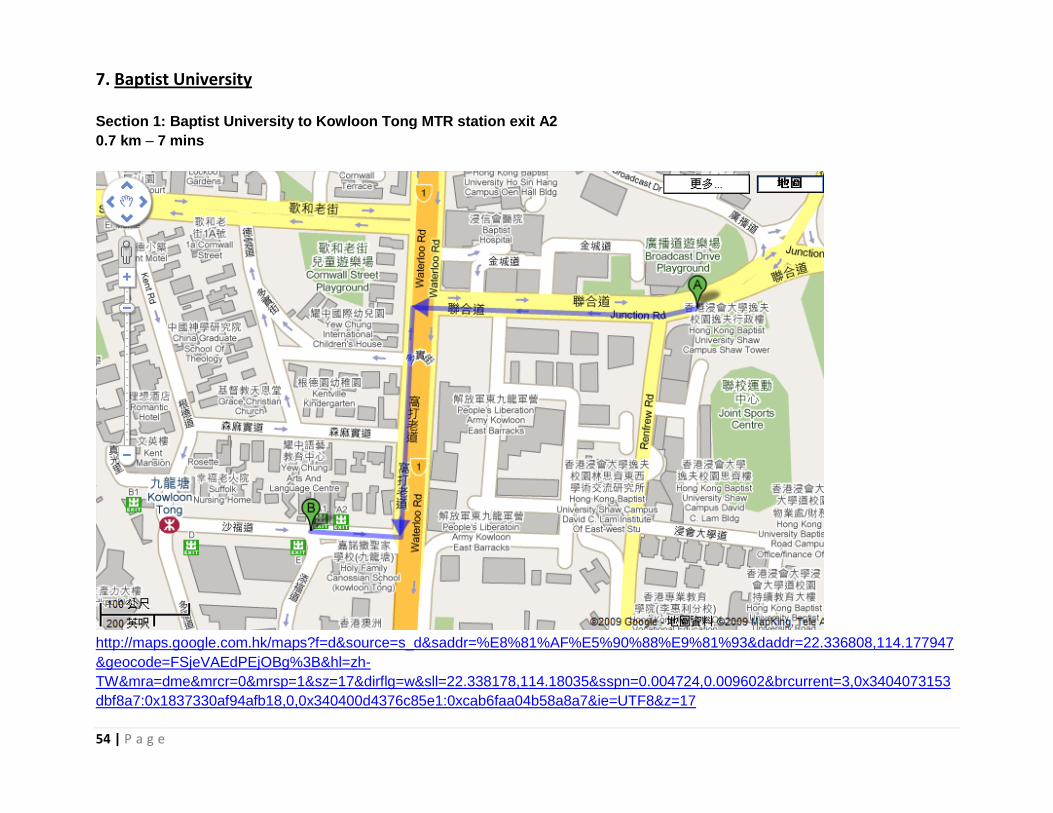
7. Baptist University
Section 1: Baptist University to Kowloon Tong MTR station exit A2
0.7 km – 7 mins
http://maps.google.com.hk/maps?f=d&source=s_d&saddr=%E8%81%AF%E5%90%88%E9%81%93&daddr=22.336808,114.177947
&geocode=FSjeVAEdPEjOBg%3B&hl=zh-
TW&mra=dme&mrcr=0&mrsp=1&sz=17&dirflg=w&sll=22.338178,114.18035&sspn=0.004724,0.009602&brcurrent=3,0x3404073153
dbf8a7:0x1837330af94afb18,0,0x340400d4376c85e1:0xcab6faa04b58a8a7&ie=UTF8&z=17
55 | P a g e
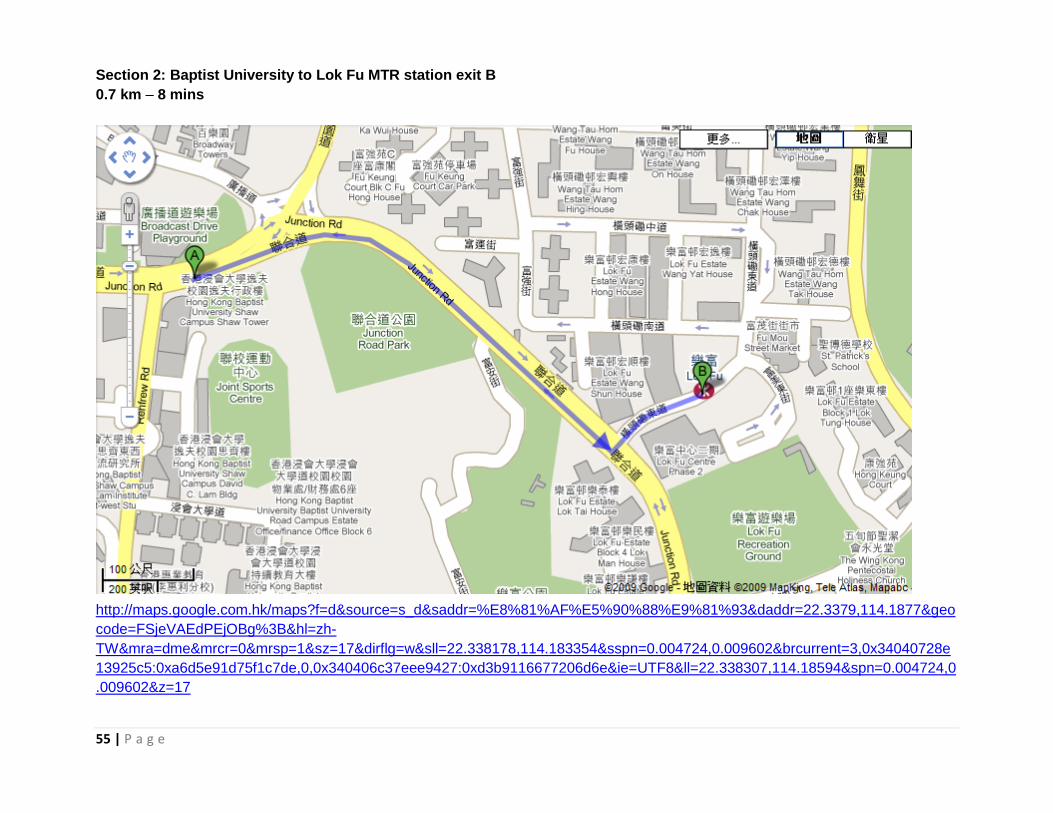
Section 2: Baptist University to Lok Fu MTR station exit B
0.7 km – 8 mins
http://maps.google.com.hk/maps?f=d&source=s_d&saddr=%E8%81%AF%E5%90%88%E9%81%93&daddr=22.3379,114.1877&geo
code=FSjeVAEdPEjOBg%3B&hl=zh-
TW&mra=dme&mrcr=0&mrsp=1&sz=17&dirflg=w&sll=22.338178,114.183354&sspn=0.004724,0.009602&brcurrent=3,0x34040728e
13925c5:0xa6d5e91d75f1c7de,0,0x340406c37eee9427:0xd3b9116677206d6e&ie=UTF8&ll=22.338307,114.18594&spn=0.004724,0
.009602&z=17
56 | P a g e
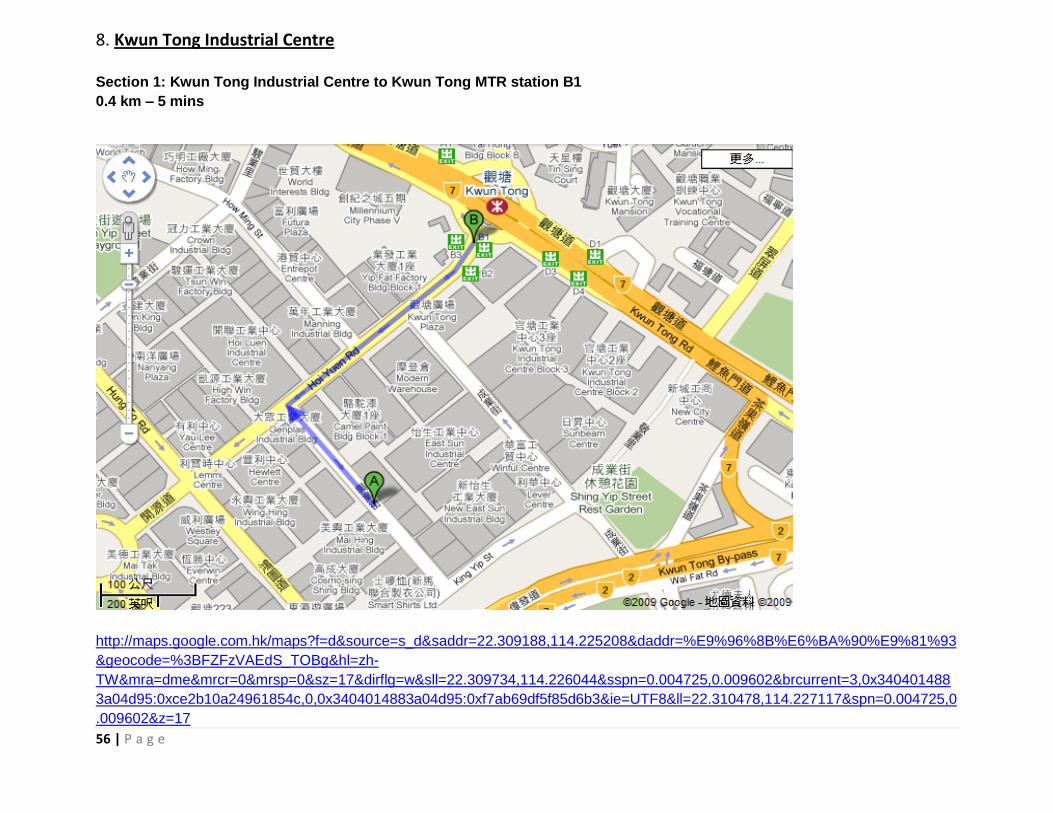
8. Kwun Tong Industrial Centre
Section 1: Kwun Tong Industrial Centre to Kwun Tong MTR station B1
0.4 km – 5 mins
http://maps.google.com.hk/maps?f=d&source=s_d&saddr=22.309188,114.225208&daddr=%E9%96%8B%E6%BA%90%E9%81%93
&geocode=%3BFZFzVAEdS_TOBg&hl=zh-
TW&mra=dme&mrcr=0&mrsp=0&sz=17&dirflg=w&sll=22.309734,114.226044&sspn=0.004725,0.009602&brcurrent=3,0x340401488
3a04d95:0xce2b10a24961854c,0,0x3404014883a04d95:0xf7ab69df5f85d6b3&ie=UTF8&ll=22.310478,114.227117&spn=0.004725,0
.009602&z=17
57 | P a g e
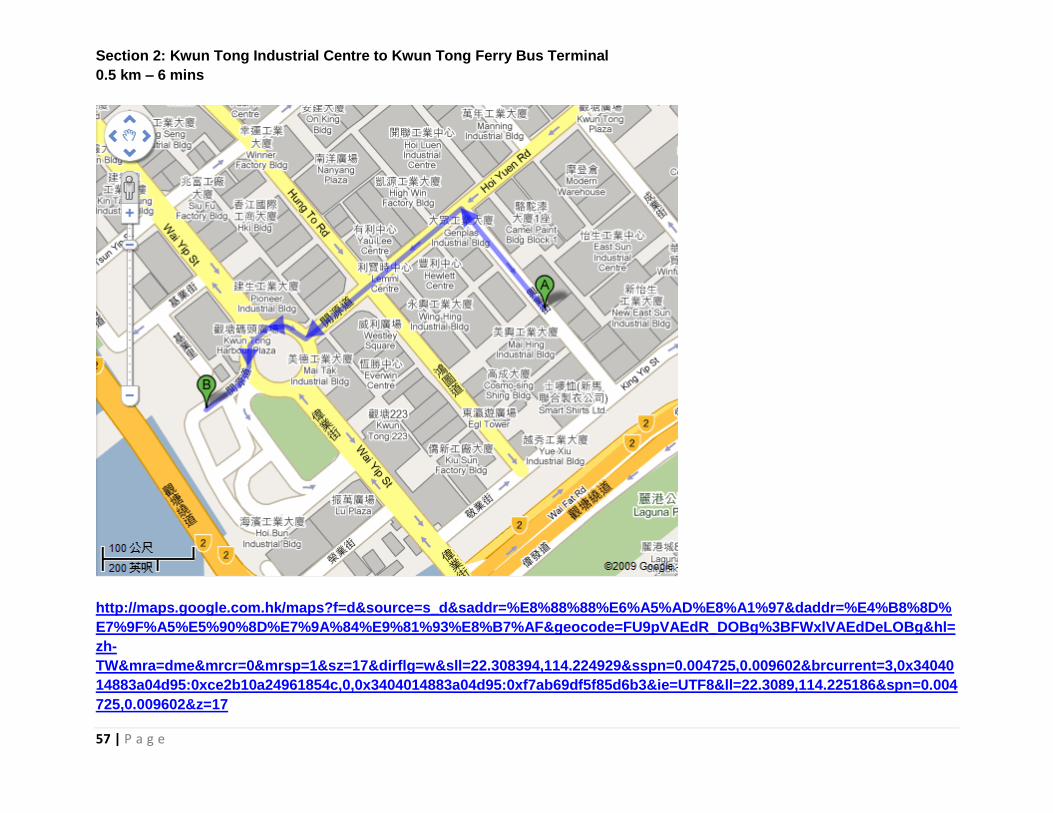
Section 2: Kwun Tong Industrial Centre to Kwun Tong Ferry Bus Terminal
0.5 km – 6 mins
http://maps.google.com.hk/maps?f=d&source=s_d&saddr=%E8%88%88%E6%A5%AD%E8%A1%97&daddr=%E4%B8%8D%
E7%9F%A5%E5%90%8D%E7%9A%84%E9%81%93%E8%B7%AF&geocode=FU9pVAEdR_DOBg%3BFWxlVAEdDeLOBg&hl=
zh-
TW&mra=dme&mrcr=0&mrsp=1&sz=17&dirflg=w&sll=22.308394,114.224929&sspn=0.004725,0.009602&brcurrent=3,0x34040
14883a04d95:0xce2b10a24961854c,0,0x3404014883a04d95:0xf7ab69df5f85d6b3&ie=UTF8&ll=22.3089,114.225186&spn=0.004
725,0.009602&z=17
58 | P a g e
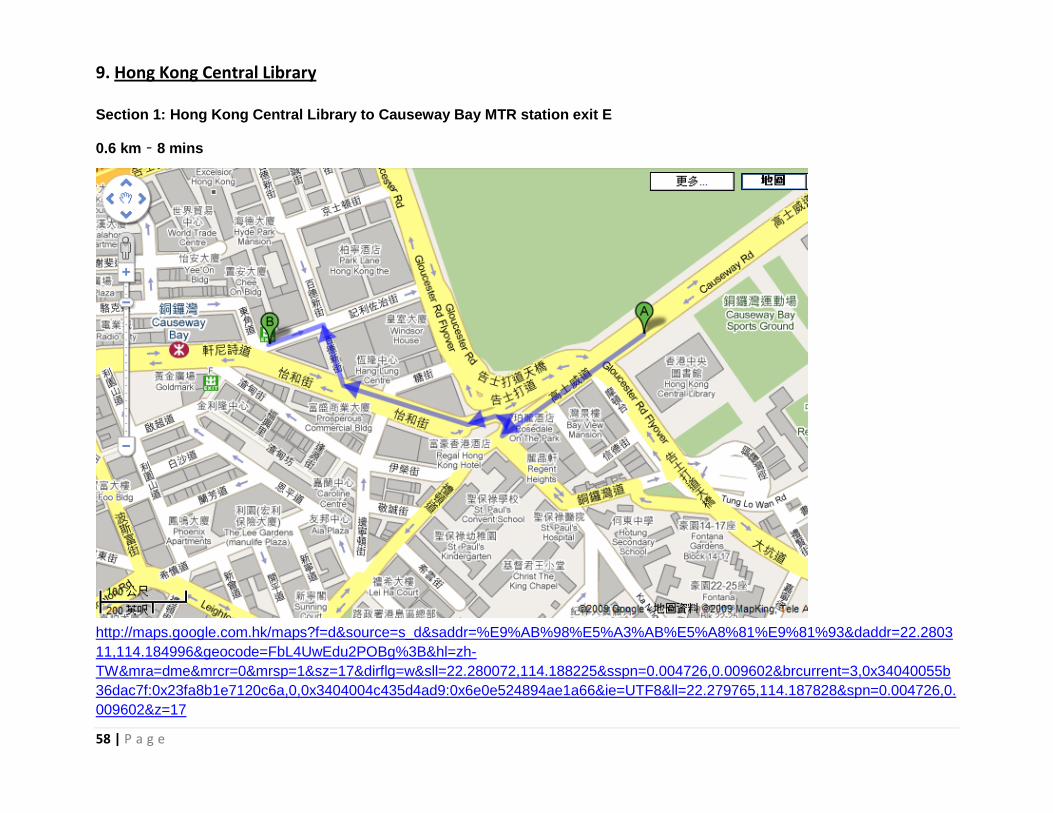
9. Hong Kong Central Library
Section 1: Hong Kong Central Library to Causeway Bay MTR station exit E
0.6 km – 8 mins
http://maps.google.com.hk/maps?f=d&source=s_d&saddr=%E9%AB%98%E5%A3%AB%E5%A8%81%E9%81%93&daddr=22.2803
11,114.184996&geocode=FbL4UwEdu2POBg%3B&hl=zh-
TW&mra=dme&mrcr=0&mrsp=1&sz=17&dirflg=w&sll=22.280072,114.188225&sspn=0.004726,0.009602&brcurrent=3,0x34040055b
36dac7f:0x23fa8b1e7120c6a,0,0x3404004c435d4ad9:0x6e0e524894ae1a66&ie=UTF8&ll=22.279765,114.187828&spn=0.004726,0.
009602&z=17
59 | P a g e
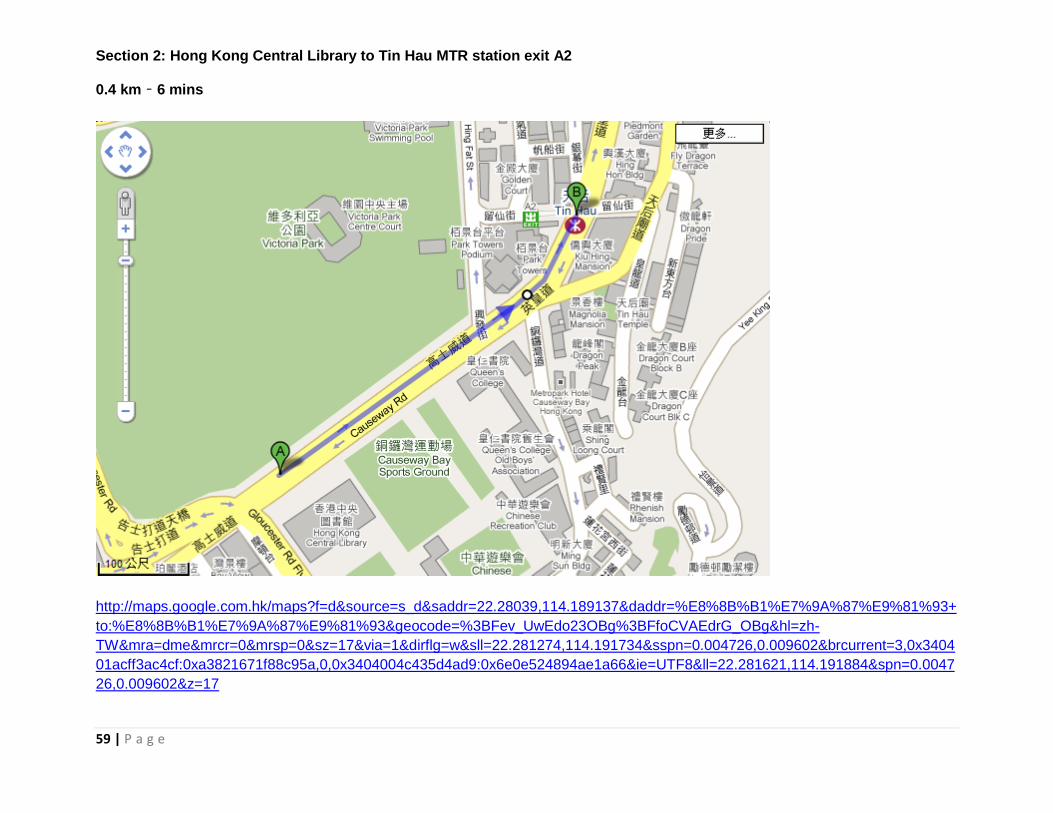
Section 2: Hong Kong Central Library to Tin Hau MTR station exit A2
0.4 km – 6 mins
http://maps.google.com.hk/maps?f=d&source=s_d&saddr=22.28039,114.189137&daddr=%E8%8B%B1%E7%9A%87%E9%81%93+
to:%E8%8B%B1%E7%9A%87%E9%81%93&geocode=%3BFev_UwEdo23OBg%3BFfoCVAEdrG_OBg&hl=zh-
TW&mra=dme&mrcr=0&mrsp=0&sz=17&via=1&dirflg=w&sll=22.281274,114.191734&sspn=0.004726,0.009602&brcurrent=3,0x3404
01acff3ac4cf:0xa3821671f88c95a,0,0x3404004c435d4ad9:0x6e0e524894ae1a66&ie=UTF8&ll=22.281621,114.191884&spn=0.0047
26,0.009602&z=17
60 | P a g e
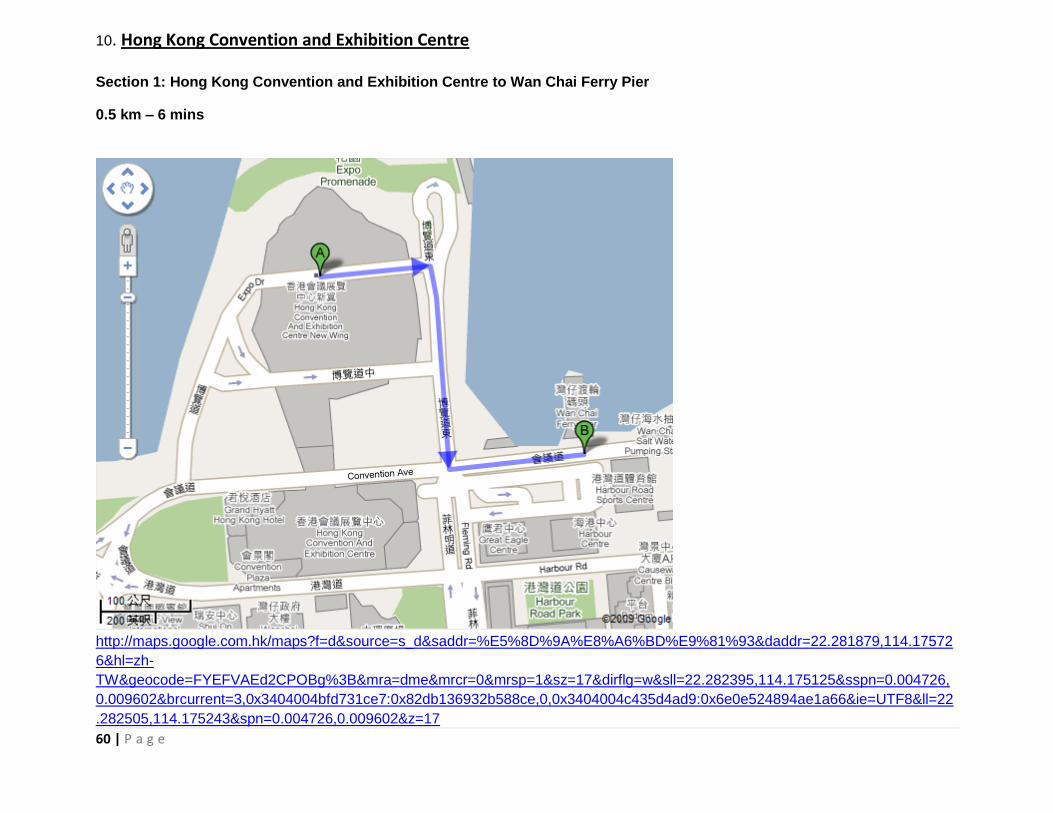
10. Hong Kong Convention and Exhibition Centre
Section 1: Hong Kong Convention and Exhibition Centre to Wan Chai Ferry Pier
0.5 km – 6 mins
http://maps.google.com.hk/maps?f=d&source=s_d&saddr=%E5%8D%9A%E8%A6%BD%E9%81%93&daddr=22.281879,114.17572
6&hl=zh-
TW&geocode=FYEFVAEd2CPOBg%3B&mra=dme&mrcr=0&mrsp=1&sz=17&dirflg=w&sll=22.282395,114.175125&sspn=0.004726,
0.009602&brcurrent=3,0x3404004bfd731ce7:0x82db136932b588ce,0,0x3404004c435d4ad9:0x6e0e524894ae1a66&ie=UTF8&ll=22
.282505,114.175243&spn=0.004726,0.009602&z=17
61 | P a g e
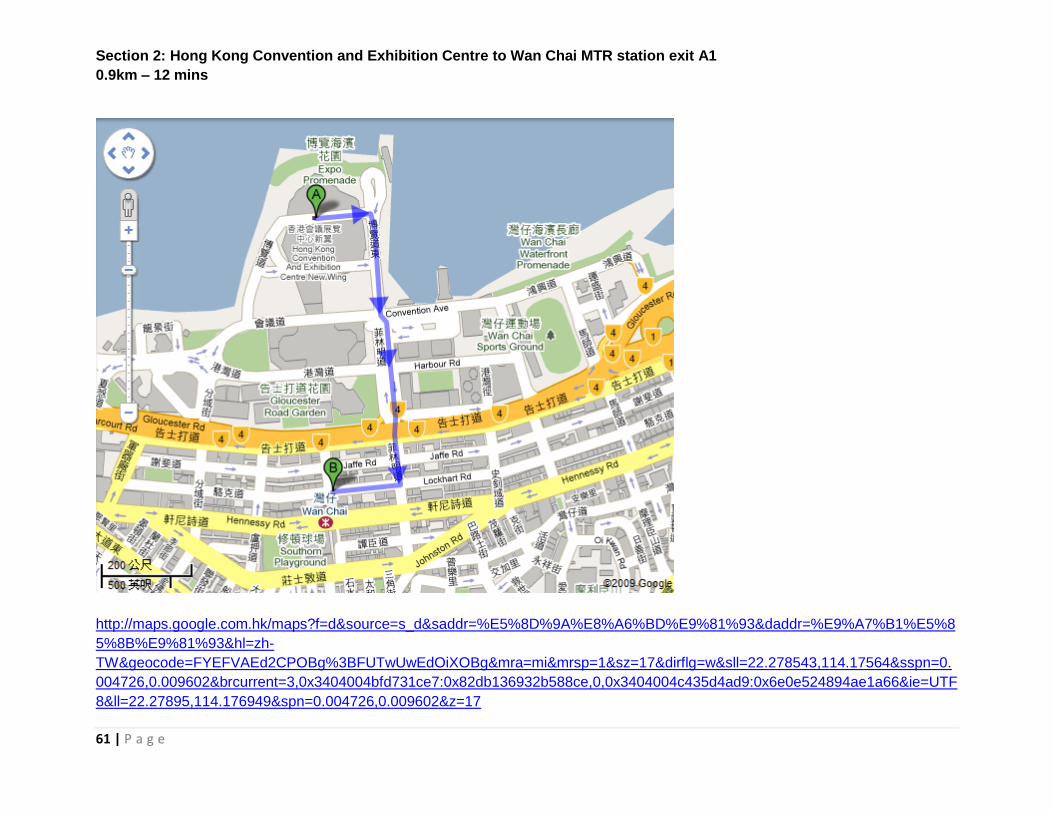
Section 2: Hong Kong Convention and Exhibition Centre to Wan Chai MTR station exit A1
0.9km – 12 mins
http://maps.google.com.hk/maps?f=d&source=s_d&saddr=%E5%8D%9A%E8%A6%BD%E9%81%93&daddr=%E9%A7%B1%E5%8
5%8B%E9%81%93&hl=zh-
TW&geocode=FYEFVAEd2CPOBg%3BFUTwUwEdOiXOBg&mra=mi&mrsp=1&sz=17&dirflg=w&sll=22.278543,114.17564&sspn=0.
004726,0.009602&brcurrent=3,0x3404004bfd731ce7:0x82db136932b588ce,0,0x3404004c435d4ad9:0x6e0e524894ae1a66&ie=UTF
8&ll=22.27895,114.176949&spn=0.004726,0.009602&z=17
62 | P a g e
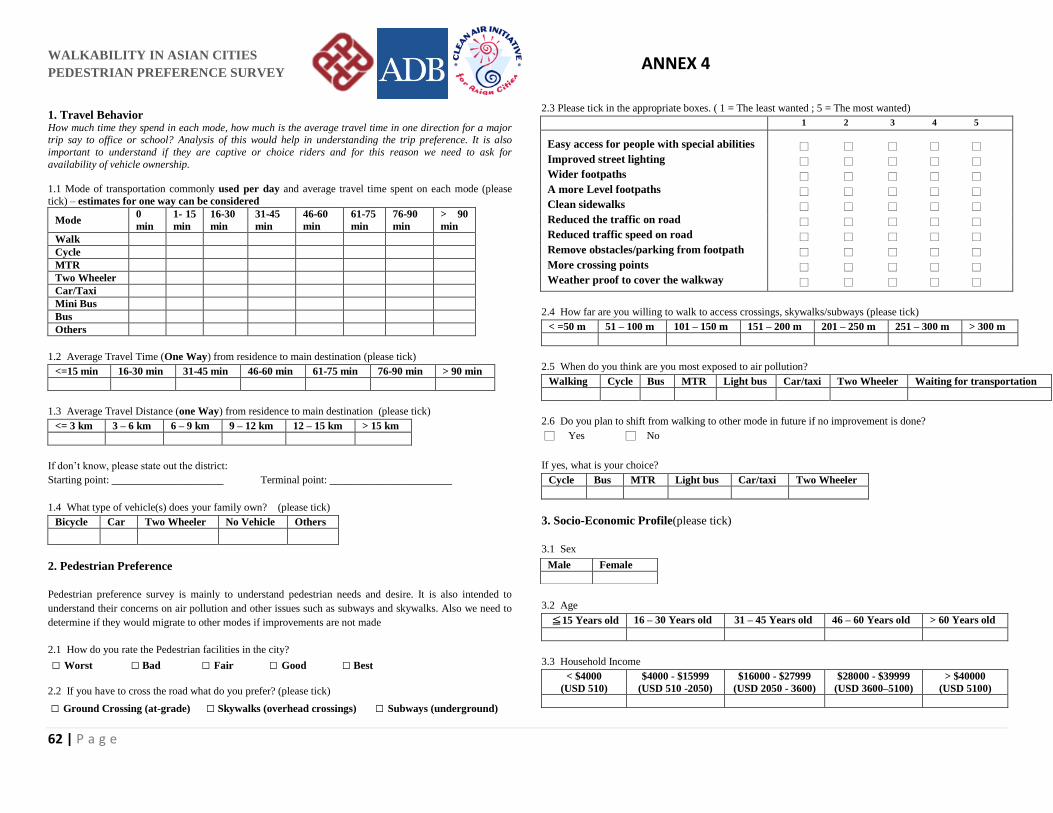
WALKABILITY IN ASIAN CITIES
PEDESTRIAN PREFERENCE SURVEY
1. Travel Behavior How much time they spend in each mode, how much is the average travel time in one direction for a major trip say to office or school? Analysis of this would help in understanding the trip preference. It is also
important to understand if they are captive or choice riders and for this reason we need to ask for
availability of vehicle ownership.
1.1 Mode of transportation commonly used per day and average travel time spent on each mode (please
tick) – estimates for one way can be considered
Mode 0
min
1- 15
min
16-30
min
31-45
min
46-60
min
61-75
min
76-90
min
> 90
min
Walk
Cycle
MTR
Two Wheeler
Car/Taxi
Mini Bus
Bus
Others
1.2 Average Travel Time (One Way) from residence to main destination (please tick)
<=15 min 16-30 min 31-45 min 46-60 min 61-75 min 76-90 min > 90 min
1.3 Average Travel Distance (one Way) from residence to main destination (please tick)
<= 3 km 3 – 6 km 6 – 9 km 9 – 12 km 12 – 15 km > 15 km
If don’t know, please state out the district:
Starting point: _____________________ Terminal point: _______________________
1.4 What type of vehicle(s) does your family own? (please tick)
Bicycle Car Two Wheeler No Vehicle Others
2. Pedestrian Preference
Pedestrian preference survey is mainly to understand pedestrian needs and desire. It is also intended to
understand their concerns on air pollution and other issues such as subways and skywalks. Also we need to
determine if they would migrate to other modes if improvements are not made
2.1 How do you rate the Pedestrian facilities in the city?
□ Worst □ Bad □ Fair □ Good □ Best
2.2 If you have to cross the road what do you prefer? (please tick)
□ Ground Crossing (at-grade) □ Skywalks (overhead crossings) □ Subways (underground)
2.3 Please tick in the appropriate boxes. ( 1 = The least wanted ; 5 = The most wanted)
1 2 3 4 5
Easy access for people with special abilities □ □ □ □ □
Improved street lighting □ □ □ □ □
Wider footpaths □ □ □ □ □
A more Level footpaths □ □ □ □ □
Clean sidewalks □ □ □ □ □
Reduced the traffic on road □ □ □ □ □
Reduced traffic speed on road □ □ □ □ □
Remove obstacles/parking from footpath □ □ □ □ □
More crossing points □ □ □ □ □
Weather proof to cover the walkway □ □ □ □ □
2.4 How far are you willing to walk to access crossings, skywalks/subways (please tick)
< =50 m 51 – 100 m 101 – 150 m 151 – 200 m 201 – 250 m 251 – 300 m > 300 m
2.5 When do you think are you most exposed to air pollution?
Walking Cycle Bus MTR Light bus Car/taxi Two Wheeler Waiting for transportation
2.6 Do you plan to shift from walking to other mode in future if no improvement is done?
□ Yes □ No
If yes, what is your choice?
Cycle Bus MTR Light bus Car/taxi Two Wheeler
3. Socio-Economic Profile(please tick)
3.1 Sex
3.2 Age
≦15 Years old 16 – 30 Years old 31 – 45 Years old 46 – 60 Years old > 60 Years old
3.3 Household Income
< $4000
(USD 510)
$4000 - $15999
(USD 510 -2050)
$16000 - $27999
(USD 2050 - 3600)
$28000 - $39999
(USD 3600–5100)
> $40000
(USD 5100)
Male Female
ANNEX 4
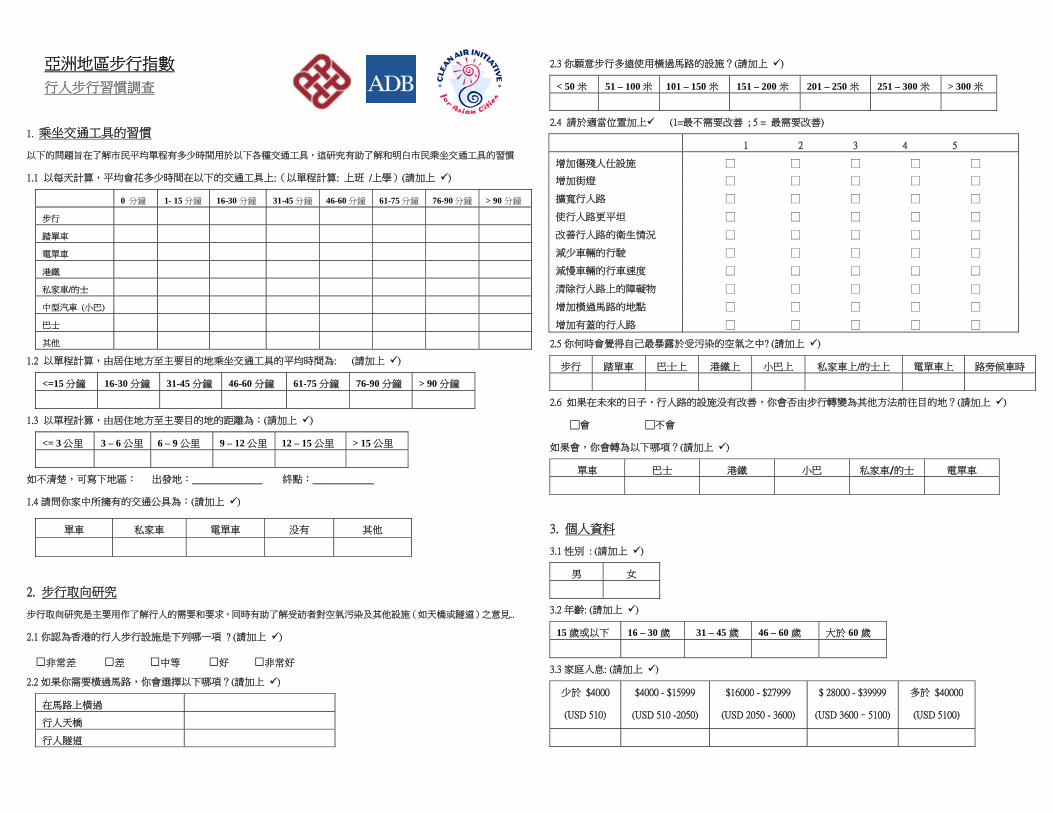
亞洲地區步行指數
行人步行習慣調查
1. 乘坐交通工具的習慣
以下的問題旨在了解市民平均單程有多少時間用於以下各種交通工具,這研究有助了解和明白市民乘坐交通工具的習慣
1.1 以每天計算,平均會花多少時間在以下的交通工具上:(以單程計算: 上班 /上學)(請加上 )
0 分鐘 1- 15 分鐘 16-30 分鐘 31-45 分鐘 46-60 分鐘 61-75 分鐘 76-90 分鐘 > 90 分鐘
步行
踏單車
電單車
港鐵
私家車/的士
中型汽車 (小巴)
巴士
其他
1.2 以單程計算,由居住地方至主要目的地乘坐交通工具的平均時間為: (請加上 )
<=15 分鐘 16-30 分鐘 31-45 分鐘 46-60 分鐘 61-75 分鐘 76-90 分鐘 > 90 分鐘
1.3 以單程計算,由居住地方至主要目的地的距離為:(請加上 )
<= 3 公里 3 – 6 公里 6 – 9 公里 9 – 12 公里 12 – 15 公里 > 15 公里
如不清楚,可寫下地區: 出發地:_______________ 終點:_____________
1.4 請問你家中所擁有的交通公具為:(請加上 )
2. 步行取向研究
步行取向研究是主要用作了解行人的需要和要求,同時有助了解受訪者對空氣污染及其他設施(如天橋或隧道)之意見..
2.1 你認為香港的行人步行設施是下列哪一項 ? (請加上 )
□非常差 □差 □中等 □好 □非常好
2.2 如果你需要橫過馬路,你會選擇以下哪項?(請加上 )
在馬路上橫過
行人天橋
行人隧道
2.3 你願意步行多遠使用橫過馬路的設施?(請加上 )
< 50 米 51 – 100 米 101 – 150 米 151 – 200 米 201 – 250 米 251 – 300 米 > 300 米
2.4 請於適當位置加上 (1=最不需要改善 ; 5 = 最需要改善)
1 2 3 4 5
增加傷殘人仕設施 □ □ □ □ □
增加街燈 □ □ □ □ □
擴寬行人路 □ □ □ □ □
使行人路更平坦 □ □ □ □ □
改善行人路的衛生情況 □ □ □ □ □
減少車輛的行駛 □ □ □ □ □
減慢車輛的行車速度 □ □ □ □ □
清除行人路上的障礙物 □ □ □ □ □
增加橫過馬路的地點 □ □ □ □ □
增加有蓋的行人路 □ □ □ □ □
2.5 你何時會覺得自己最暴露於受污染的空氣之中? (請加上 )
步行 踏單車 巴士上 港鐵上 小巴上 私家車上/的士上 電單車上 路旁候車時
2.6 如果在未來的日子,行人路的設施没有改善,你會否由步行轉變為其他方法前往目的地?(請加上 )
□會 □不會
如果會,你會轉為以下哪項?(請加上 )
單車 巴士 港鐵 小巴 私家車/的士 電單車
3. 個人資料
3.1 性別 : (請加上 )
男 女
3.2 年齡: (請加上 )
15 歲或以下 16 – 30 歲 31 – 45 歲 46 – 60 歲 大於 60 歲
3.3 家庭入息: (請加上 )
少於 $4000
(USD 510)
$4000 - $15999
(USD 510 -2050)
$16000 - $27999
(USD 2050 - 3600)
$ 28000 - $39999
(USD 3600–5100)
多於 $40000
(USD 5100)
單車 私家車 電單車 没有 其他
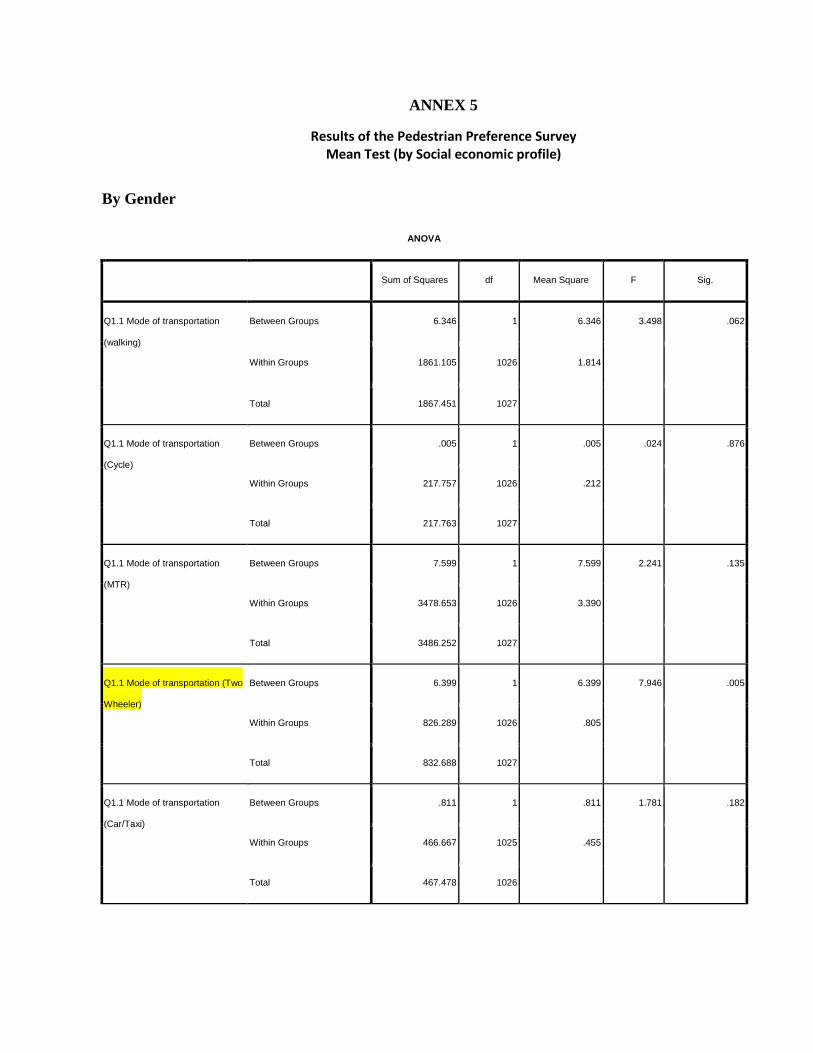
ANNEX 5
Results of the Pedestrian Preference Survey Mean Test (by Social economic profile)
By Gender
ANOVA
Sum of Squares df Mean Square F Sig.
Q1.1 Mode of transportation
(walking)
Between Groups 6.346 1 6.346 3.498 .062
Within Groups 1861.105 1026 1.814
Total 1867.451 1027
Q1.1 Mode of transportation
(Cycle)
Between Groups .005 1 .005 .024 .876
Within Groups 217.757 1026 .212
Total 217.763 1027
Q1.1 Mode of transportation
(MTR)
Between Groups 7.599 1 7.599 2.241 .135
Within Groups 3478.653 1026 3.390
Total 3486.252 1027
Q1.1 Mode of transportation (Two
Wheeler)
Between Groups 6.399 1 6.399 7.946 .005
Within Groups 826.289 1026 .805
Total 832.688 1027
Q1.1 Mode of transportation
(Car/Taxi)
Between Groups .811 1 .811 1.781 .182
Within Groups 466.667 1025 .455
Total 467.478 1026
65 | P a g e
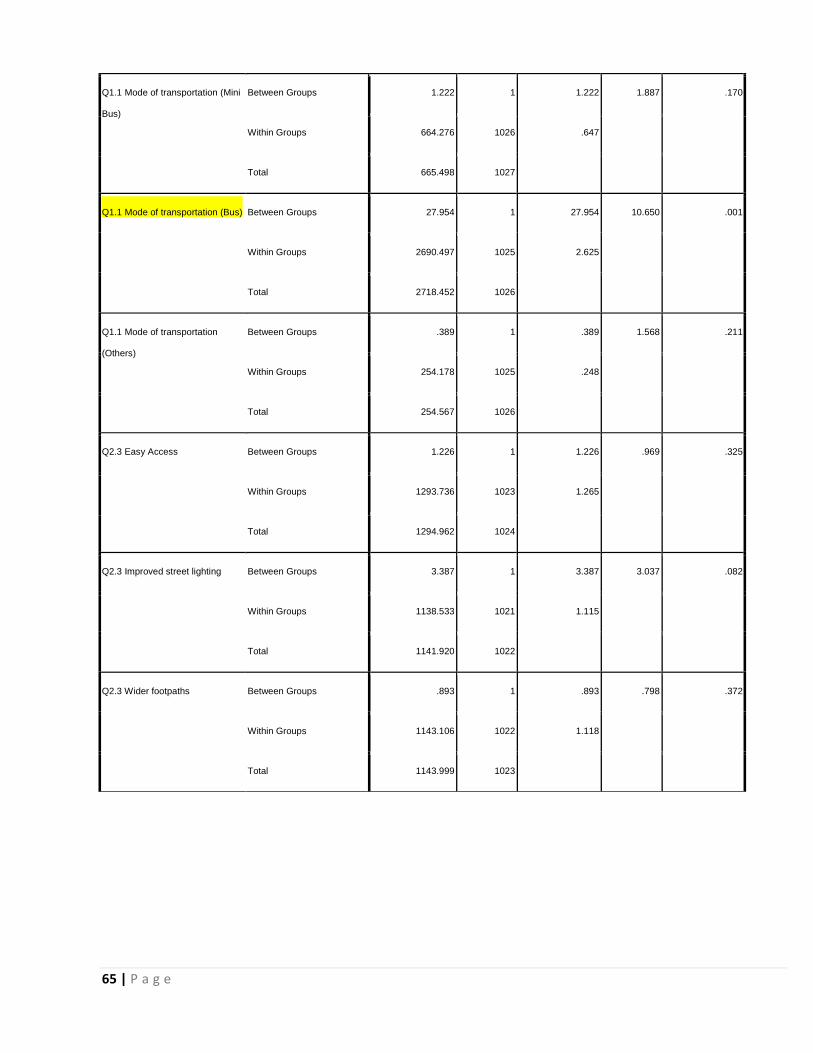
Q1.1 Mode of transportation (Mini
Bus)
Between Groups 1.222 1 1.222 1.887 .170
Within Groups 664.276 1026 .647
Total 665.498 1027
Q1.1 Mode of transportation (Bus) Between Groups 27.954 1 27.954 10.650 .001
Within Groups 2690.497 1025 2.625
Total 2718.452 1026
Q1.1 Mode of transportation
(Others)
Between Groups .389 1 .389 1.568 .211
Within Groups 254.178 1025 .248
Total 254.567 1026
Q2.3 Easy Access Between Groups 1.226 1 1.226 .969 .325
Within Groups 1293.736 1023 1.265
Total 1294.962 1024
Q2.3 Improved street lighting Between Groups 3.387 1 3.387 3.037 .082
Within Groups 1138.533 1021 1.115
Total 1141.920 1022
Q2.3 Wider footpaths Between Groups .893 1 .893 .798 .372
Within Groups 1143.106 1022 1.118
Total 1143.999 1023
66 | P a g e
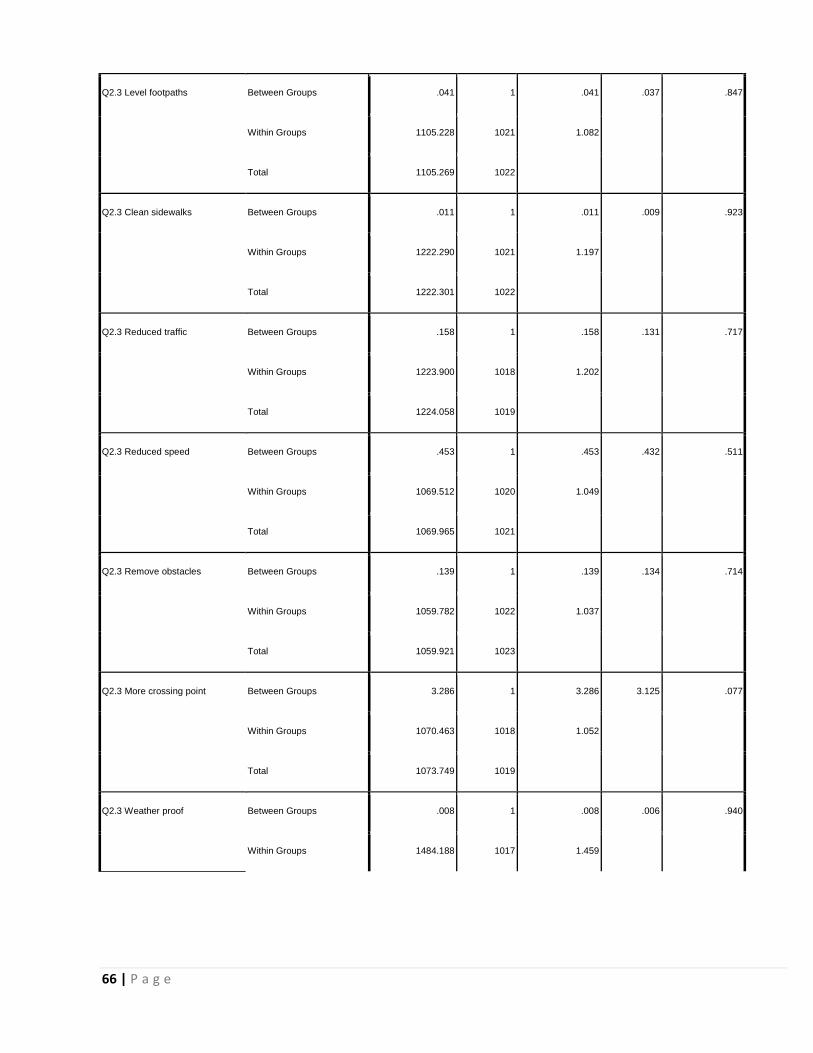
Q2.3 Level footpaths Between Groups .041 1 .041 .037 .847
Within Groups 1105.228 1021 1.082
Total 1105.269 1022
Q2.3 Clean sidewalks Between Groups .011 1 .011 .009 .923
Within Groups 1222.290 1021 1.197
Total 1222.301 1022
Q2.3 Reduced traffic Between Groups .158 1 .158 .131 .717
Within Groups 1223.900 1018 1.202
Total 1224.058 1019
Q2.3 Reduced speed Between Groups .453 1 .453 .432 .511
Within Groups 1069.512 1020 1.049
Total 1069.965 1021
Q2.3 Remove obstacles Between Groups .139 1 .139 .134 .714
Within Groups 1059.782 1022 1.037
Total 1059.921 1023
Q2.3 More crossing point Between Groups 3.286 1 3.286 3.125 .077
Within Groups 1070.463 1018 1.052
Total 1073.749 1019
Q2.3 Weather proof Between Groups .008 1 .008 .006 .940
Within Groups 1484.188 1017 1.459
67 | P a g e
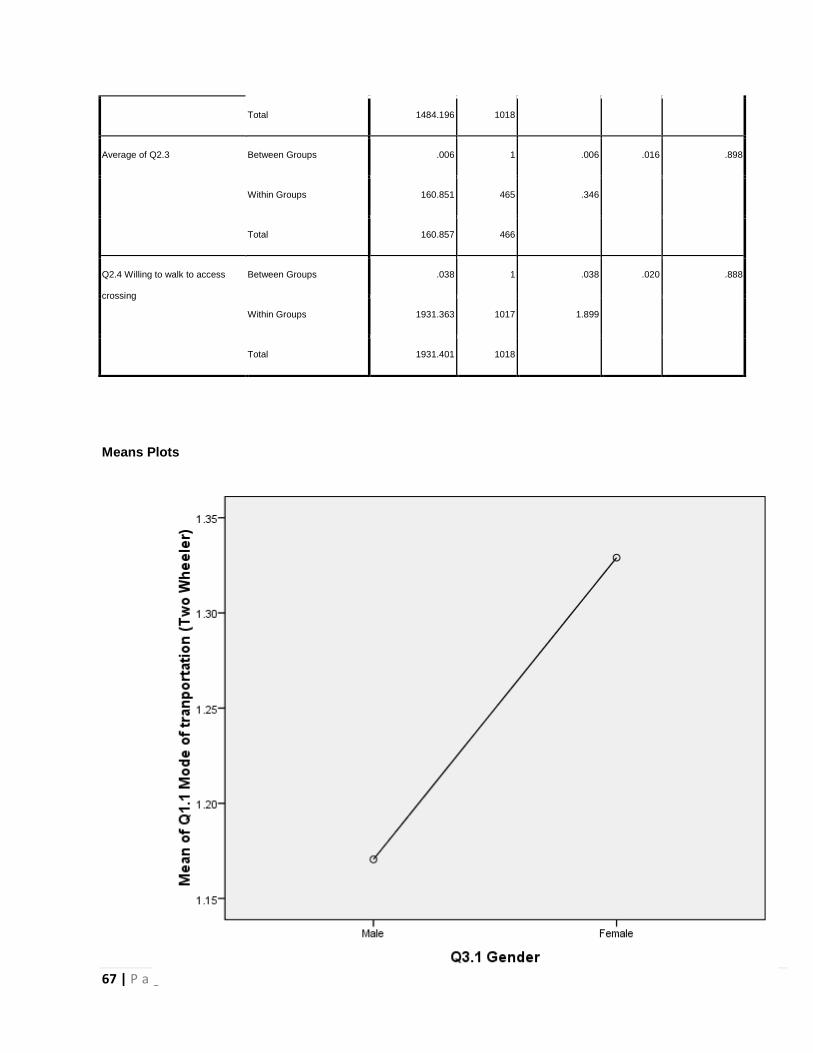
Means Plots
Total 1484.196 1018
Average of Q2.3 Between Groups .006 1 .006 .016 .898
Within Groups 160.851 465 .346
Total 160.857 466
Q2.4 Willing to walk to access
crossing
Between Groups .038 1 .038 .020 .888
Within Groups 1931.363 1017 1.899
Total 1931.401 1018
68 | P a g e
69 | P a g e
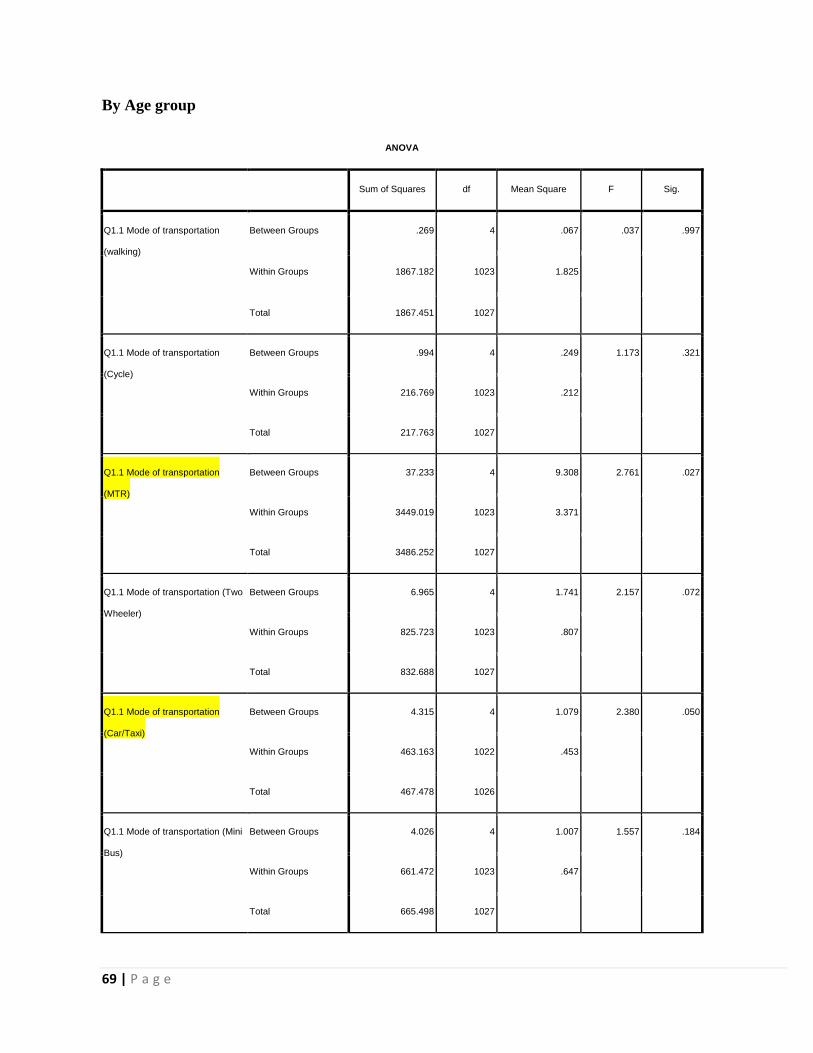
By Age group
ANOVA
Sum of Squares df Mean Square F Sig.
Q1.1 Mode of transportation
(walking)
Between Groups .269 4 .067 .037 .997
Within Groups 1867.182 1023 1.825
Total 1867.451 1027
Q1.1 Mode of transportation
(Cycle)
Between Groups .994 4 .249 1.173 .321
Within Groups 216.769 1023 .212
Total 217.763 1027
Q1.1 Mode of transportation
(MTR)
Between Groups 37.233 4 9.308 2.761 .027
Within Groups 3449.019 1023 3.371
Total 3486.252 1027
Q1.1 Mode of transportation (Two
Wheeler)
Between Groups 6.965 4 1.741 2.157 .072
Within Groups 825.723 1023 .807
Total 832.688 1027
Q1.1 Mode of transportation
(Car/Taxi)
Between Groups 4.315 4 1.079 2.380 .050
Within Groups 463.163 1022 .453
Total 467.478 1026
Q1.1 Mode of transportation (Mini
Bus)
Between Groups 4.026 4 1.007 1.557 .184
Within Groups 661.472 1023 .647
Total 665.498 1027
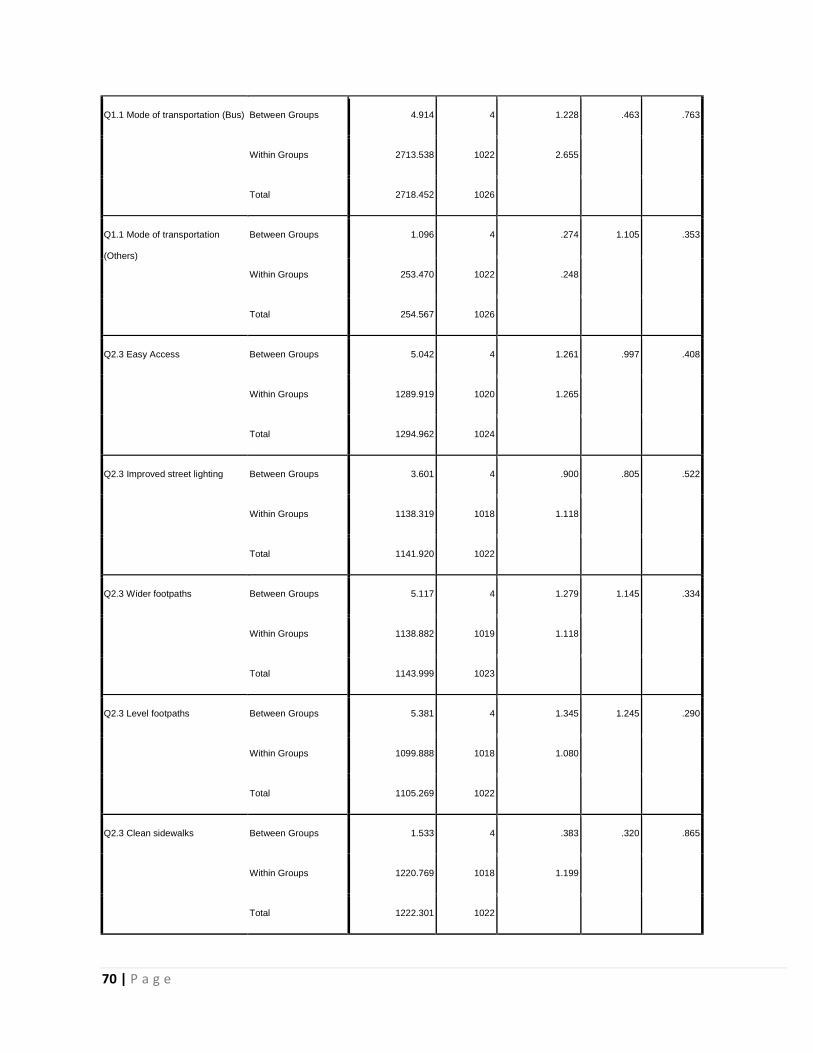
70 | P a g e
Q1.1 Mode of transportation (Bus) Between Groups 4.914 4 1.228 .463 .763
Within Groups 2713.538 1022 2.655
Total 2718.452 1026
Q1.1 Mode of transportation
(Others)
Between Groups 1.096 4 .274 1.105 .353
Within Groups 253.470 1022 .248
Total 254.567 1026
Q2.3 Easy Access Between Groups 5.042 4 1.261 .997 .408
Within Groups 1289.919 1020 1.265
Total 1294.962 1024
Q2.3 Improved street lighting Between Groups 3.601 4 .900 .805 .522
Within Groups 1138.319 1018 1.118
Total 1141.920 1022
Q2.3 Wider footpaths Between Groups 5.117 4 1.279 1.145 .334
Within Groups 1138.882 1019 1.118
Total 1143.999 1023
Q2.3 Level footpaths Between Groups 5.381 4 1.345 1.245 .290
Within Groups 1099.888 1018 1.080
Total 1105.269 1022
Q2.3 Clean sidewalks Between Groups 1.533 4 .383 .320 .865
Within Groups 1220.769 1018 1.199
Total 1222.301 1022
71 | P a g e
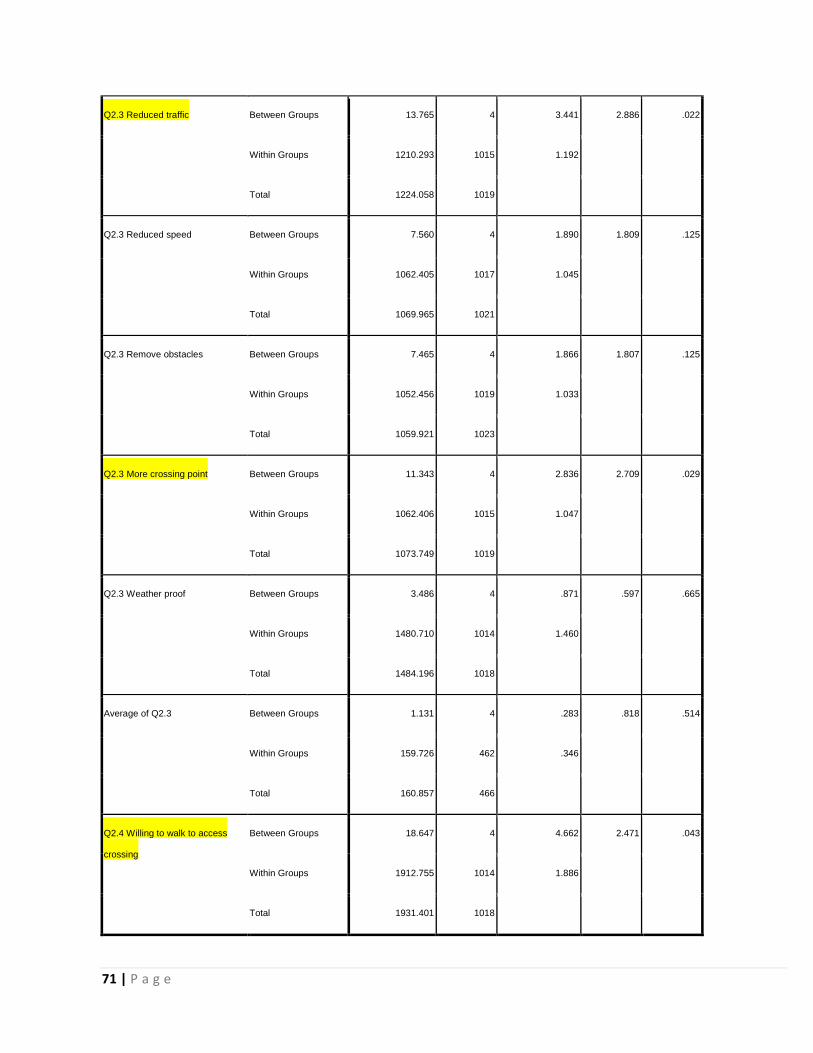
Q2.3 Reduced traffic Between Groups 13.765 4 3.441 2.886 .022
Within Groups 1210.293 1015 1.192
Total 1224.058 1019
Q2.3 Reduced speed Between Groups 7.560 4 1.890 1.809 .125
Within Groups 1062.405 1017 1.045
Total 1069.965 1021
Q2.3 Remove obstacles Between Groups 7.465 4 1.866 1.807 .125
Within Groups 1052.456 1019 1.033
Total 1059.921 1023
Q2.3 More crossing point Between Groups 11.343 4 2.836 2.709 .029
Within Groups 1062.406 1015 1.047
Total 1073.749 1019
Q2.3 Weather proof Between Groups 3.486 4 .871 .597 .665
Within Groups 1480.710 1014 1.460
Total 1484.196 1018
Average of Q2.3 Between Groups 1.131 4 .283 .818 .514
Within Groups 159.726 462 .346
Total 160.857 466
Q2.4 Willing to walk to access
crossing
Between Groups 18.647 4 4.662 2.471 .043
Within Groups 1912.755 1014 1.886
Total 1931.401 1018
72 | P a g e
73 | P a g e
74 | P a g e
75 | P a g e
76 | P a g e
77 | P a g e
By Household income
ANOVA
Sum of Squares df Mean Square F Sig.
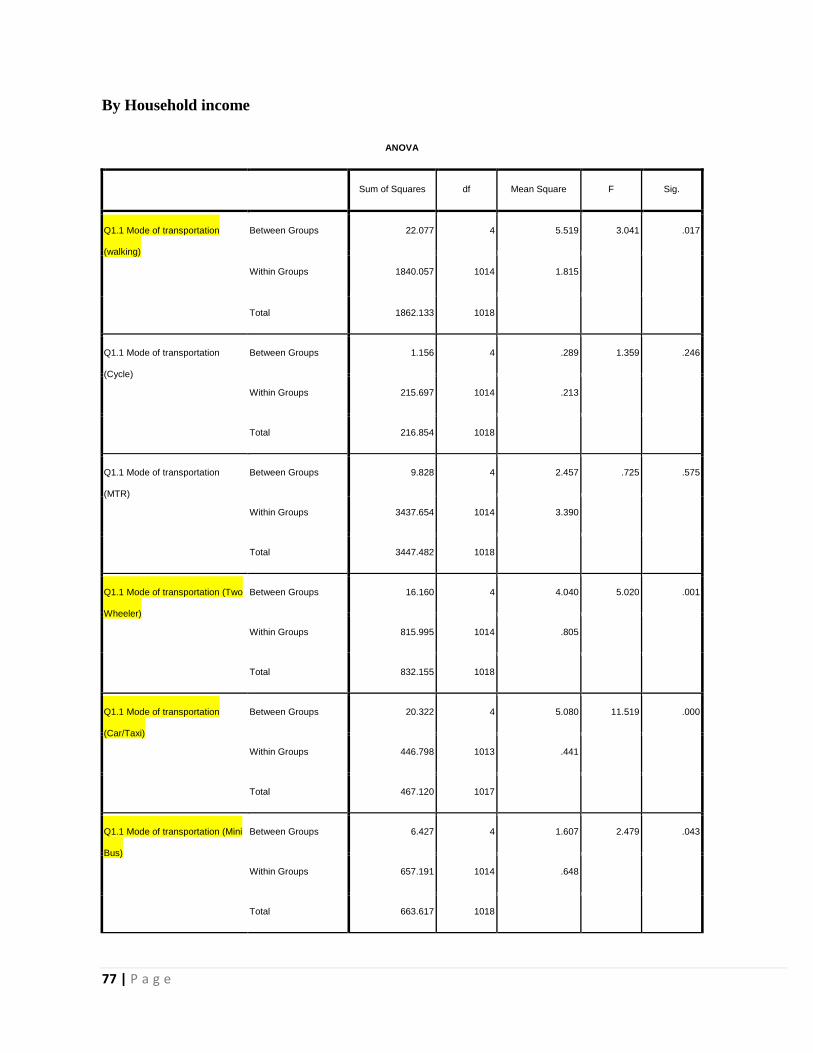
Q1.1 Mode of transportation
(walking)
Between Groups 22.077 4 5.519 3.041 .017
Within Groups 1840.057 1014 1.815
Total 1862.133 1018
Q1.1 Mode of transportation
(Cycle)
Between Groups 1.156 4 .289 1.359 .246
Within Groups 215.697 1014 .213
Total 216.854 1018
Q1.1 Mode of transportation
(MTR)
Between Groups 9.828 4 2.457 .725 .575
Within Groups 3437.654 1014 3.390
Total 3447.482 1018
Q1.1 Mode of transportation (Two
Wheeler)
Between Groups 16.160 4 4.040 5.020 .001
Within Groups 815.995 1014 .805
Total 832.155 1018
Q1.1 Mode of transportation
(Car/Taxi)
Between Groups 20.322 4 5.080 11.519 .000
Within Groups 446.798 1013 .441
Total 467.120 1017
Q1.1 Mode of transportation (Mini
Bus)
Between Groups 6.427 4 1.607 2.479 .043
Within Groups 657.191 1014 .648
Total 663.617 1018
78 | P a g e
Q1.1 Mode of transportation (Bus) Between Groups 11.764 4 2.941 1.105 .353
Within Groups 2695.517 1013 2.661
Total 2707.281 1017
Q1.1 Mode of transportation
(Others)
Between Groups .494 4 .124 .493 .741
Within Groups 253.962 1013 .251
Total 254.457 1017
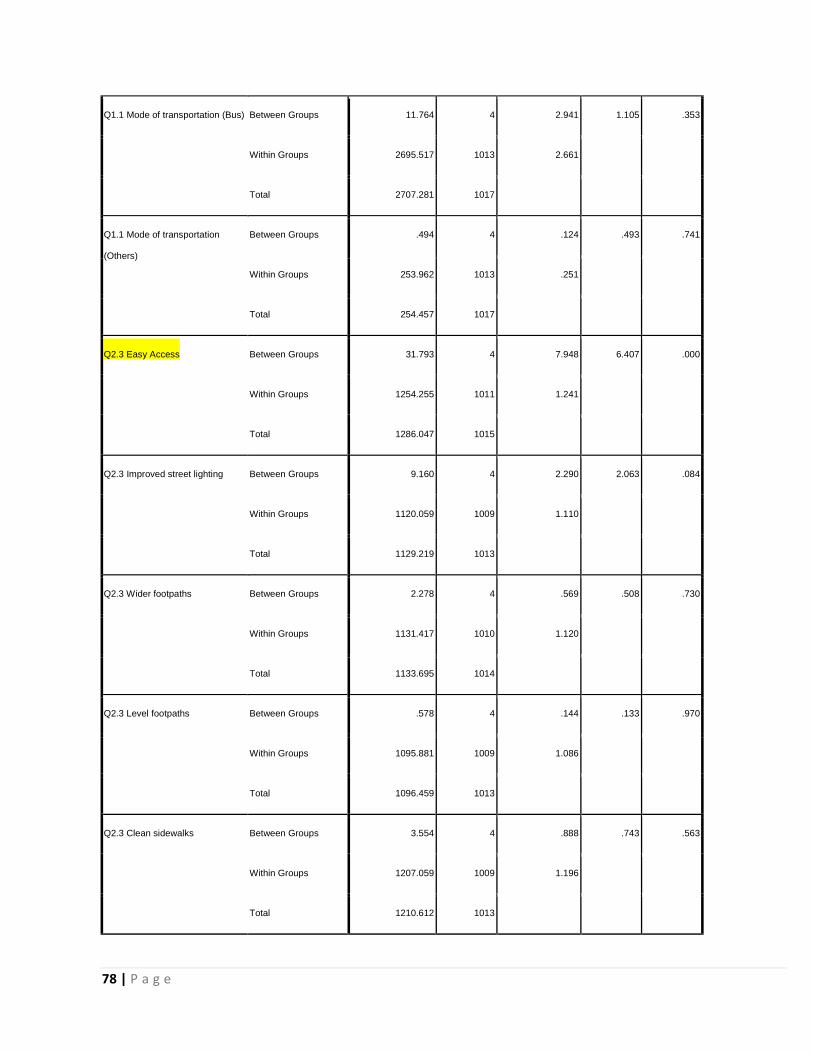
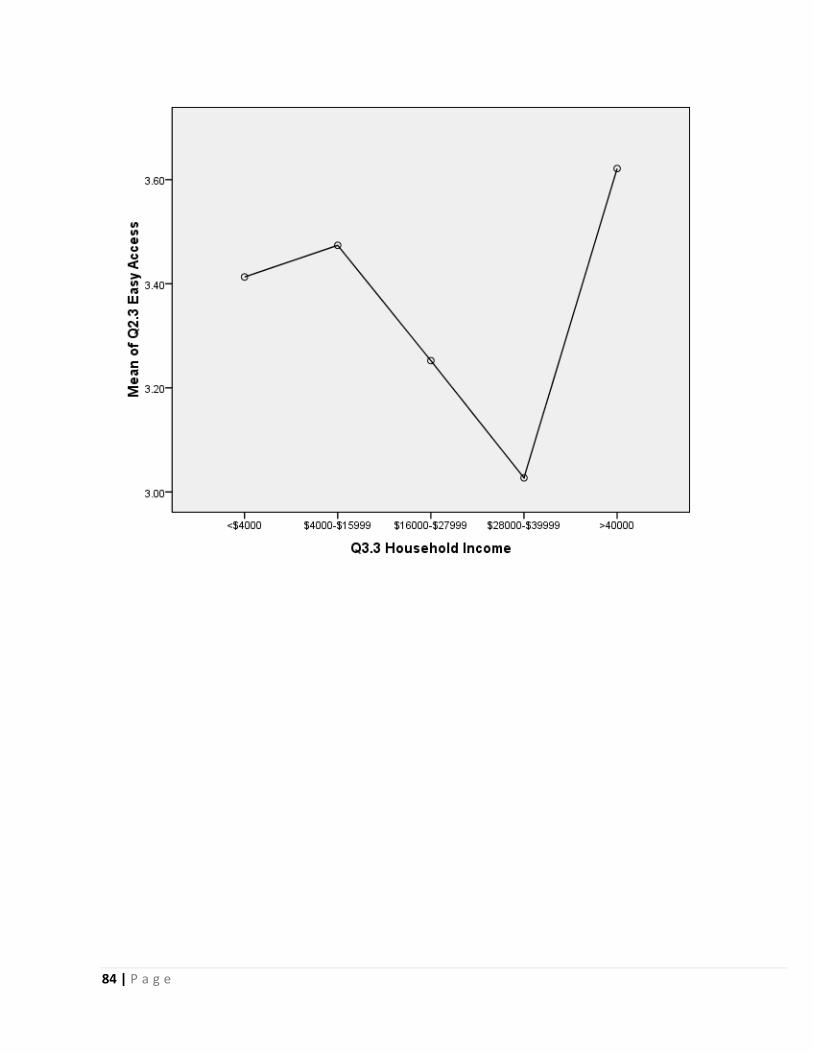
Q2.3 Easy Access Between Groups 31.793 4 7.948 6.407 .000
Within Groups 1254.255 1011 1.241
Total 1286.047 1015
Q2.3 Improved street lighting Between Groups 9.160 4 2.290 2.063 .084
Within Groups 1120.059 1009 1.110
Total 1129.219 1013
Q2.3 Wider footpaths Between Groups 2.278 4 .569 .508 .730
Within Groups 1131.417 1010 1.120
Total 1133.695 1014
Q2.3 Level footpaths Between Groups .578 4 .144 .133 .970
Within Groups 1095.881 1009 1.086
Total 1096.459 1013
Q2.3 Clean sidewalks Between Groups 3.554 4 .888 .743 .563
Within Groups 1207.059 1009 1.196
Total 1210.612 1013
79 | P a g e
Q2.3 Reduced traffic Between Groups 4.956 4 1.239 1.031 .390
Within Groups 1208.854 1006 1.202
Total 1213.810 1010
Q2.3 Reduced speed Between Groups 4.008 4 1.002 .961 .428
Within Groups 1050.913 1008 1.043
Total 1054.920 1012
Q2.3 Remove obstacles Between Groups 6.703 4 1.676 1.623 .166
Within Groups 1043.035 1010 1.033
Total 1049.738 1014
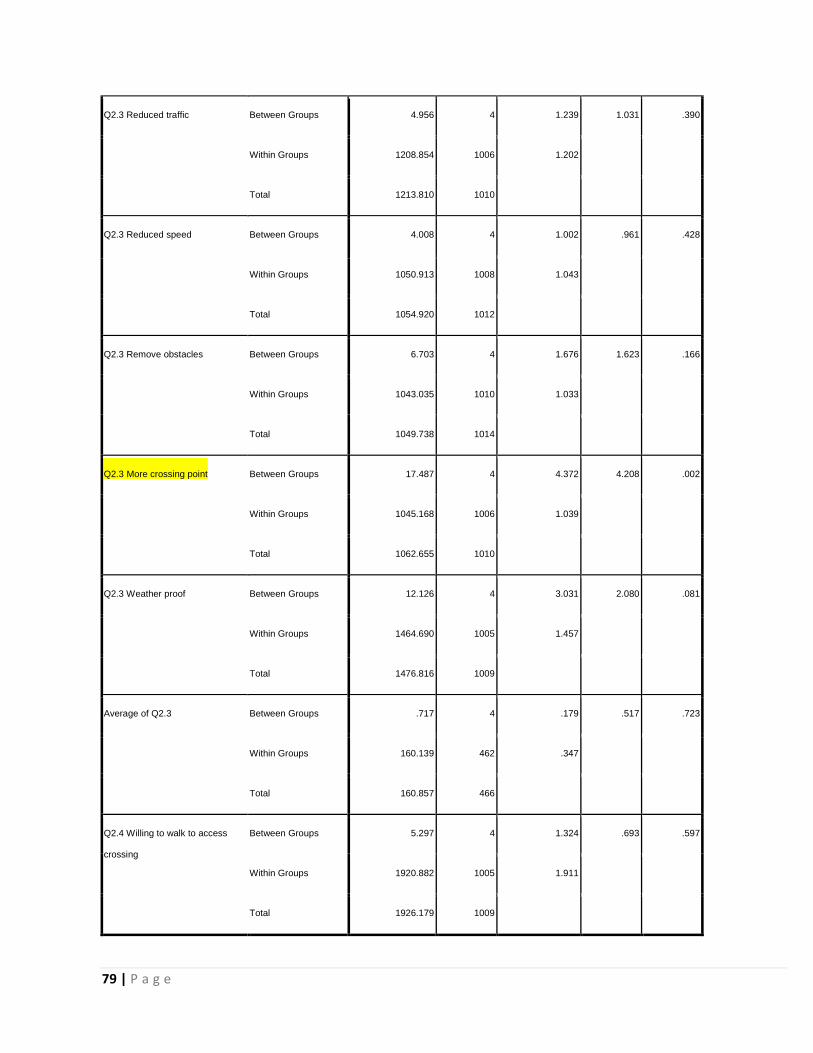
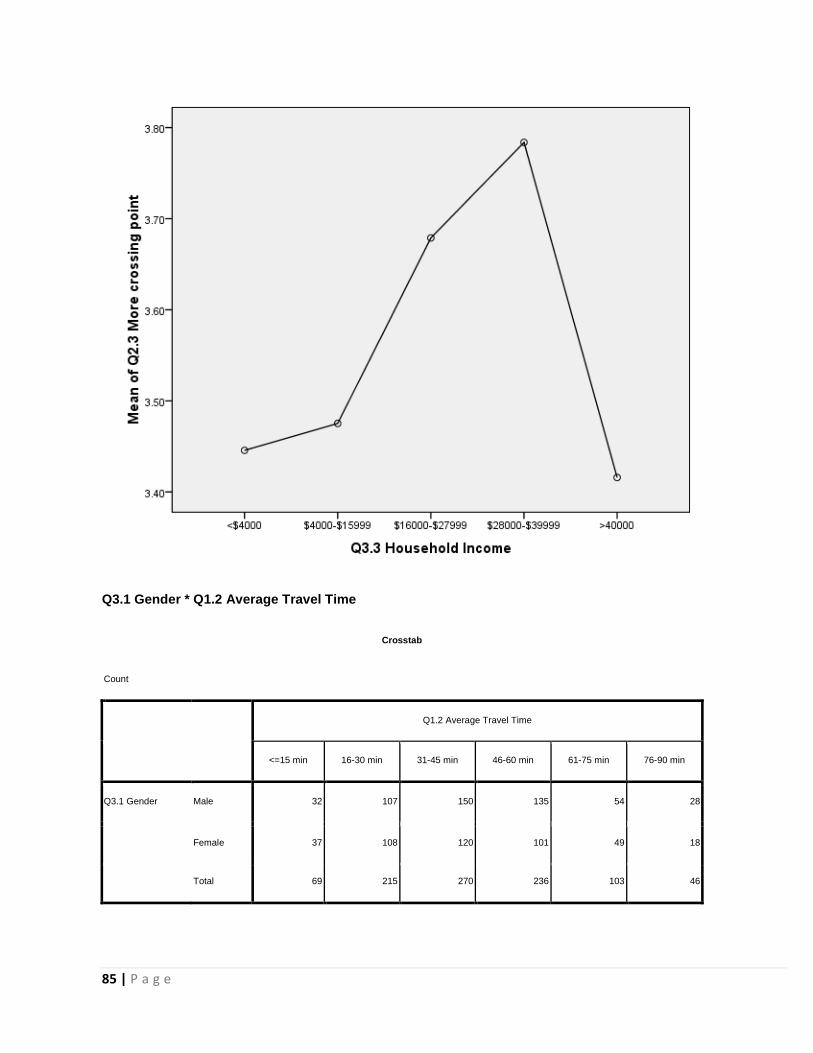
Q2.3 More crossing point Between Groups 17.487 4 4.372 4.208 .002
Within Groups 1045.168 1006 1.039
Total 1062.655 1010
Q2.3 Weather proof Between Groups 12.126 4 3.031 2.080 .081
Within Groups 1464.690 1005 1.457
Total 1476.816 1009
Average of Q2.3 Between Groups .717 4 .179 .517 .723
Within Groups 160.139 462 .347
Total 160.857 466
Q2.4 Willing to walk to access
crossing
Between Groups 5.297 4 1.324 .693 .597
Within Groups 1920.882 1005 1.911
Total 1926.179 1009
80 | P a g e
81 | P a g e
82 | P a g e
83 | P a g e
84 | P a g e
85 | P a g e
Q3.1 Gender * Q1.2 Average Travel Time
Crosstab
Count
Q1.2 Average Travel Time
<=15 min 16-30 min 31-45 min 46-60 min 61-75 min 76-90 min
Q3.1 Gender Male 32 107 150 135 54 28
Female 37 108 120 101 49 18
Total 69 215 270 236 103 46
86 | P a g e
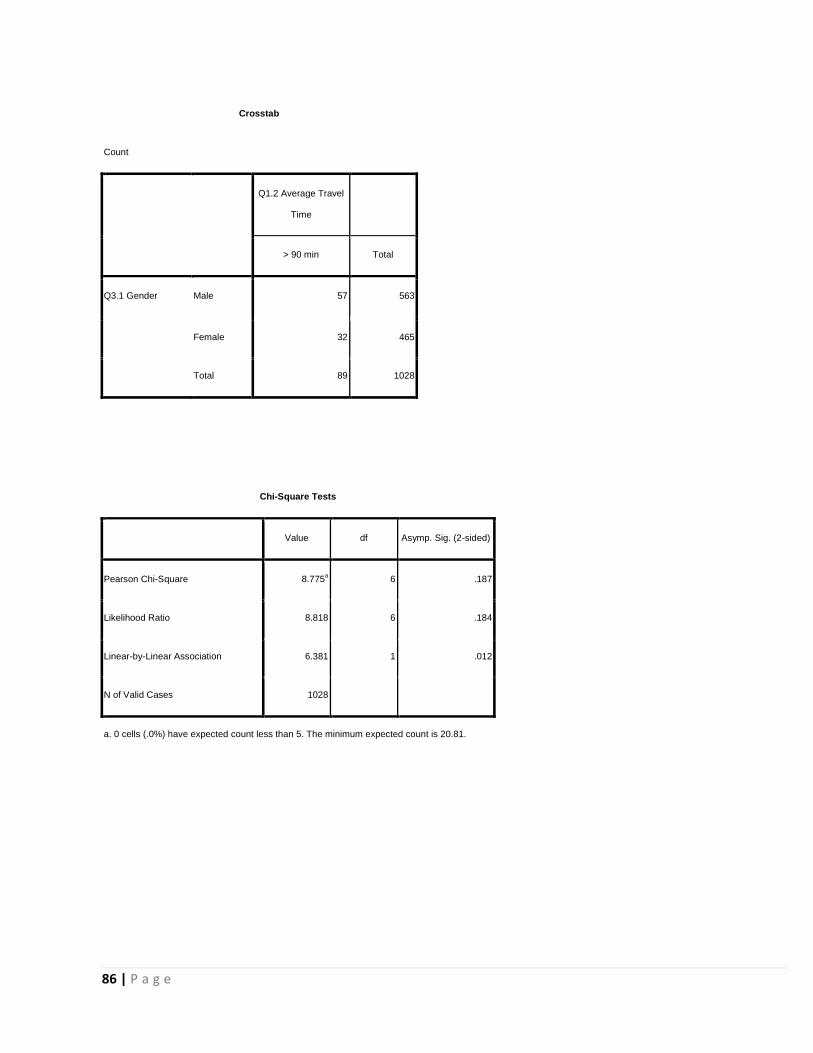
Crosstab
Count
Q1.2 Average Travel
Time
> 90 min Total
Q3.1 Gender Male 57 563
Female 32 465
Total 89 1028
Chi-Square Tests
Value df Asymp. Sig. (2-sided)
Pearson Chi-Square 8.775a 6 .187
Likelihood Ratio 8.818 6 .184
Linear-by-Linear Association 6.381 1 .012
N of Valid Cases 1028
a. 0 cells (.0%) have expected count less than 5. The minimum expected count is 20.81.
87 | P a g e
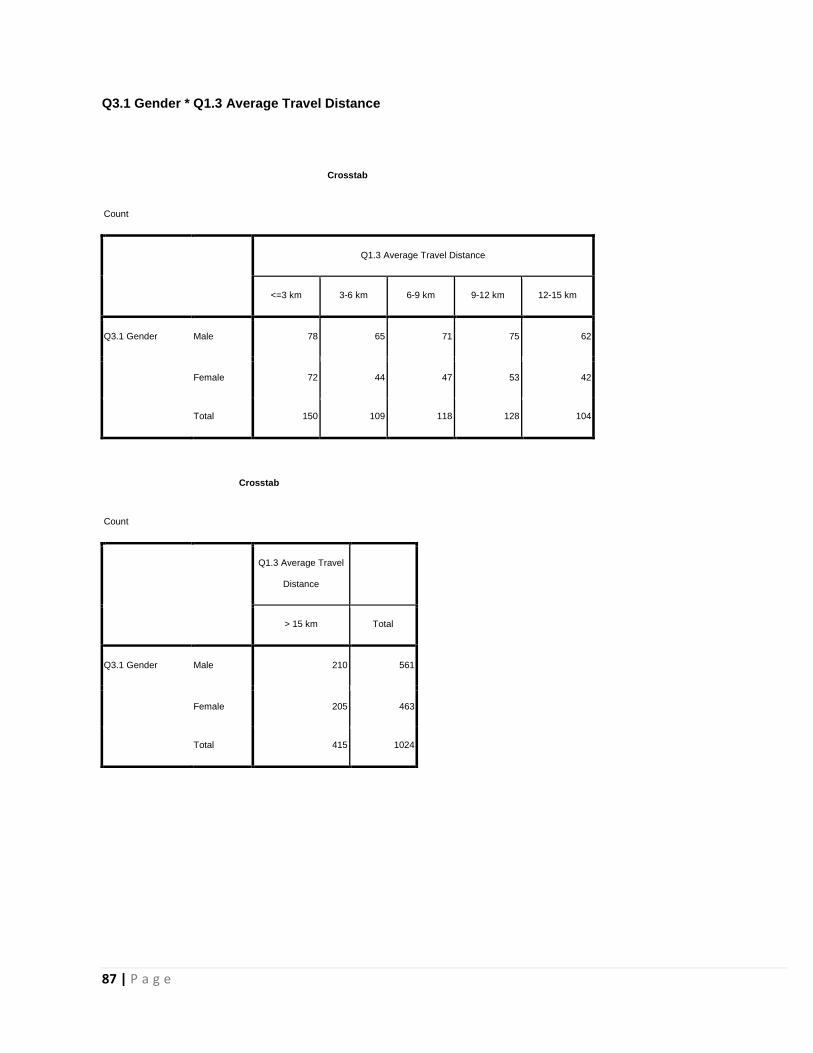
Q3.1 Gender * Q1.3 Average Travel Distance
Crosstab
Count
Q1.3 Average Travel Distance
<=3 km 3-6 km 6-9 km 9-12 km 12-15 km
Q3.1 Gender Male 78 65 71 75 62
Female 72 44 47 53 42
Total 150 109 118 128 104
Crosstab
Count
Q1.3 Average Travel
Distance
> 15 km Total
Q3.1 Gender Male 210 561
Female 205 463
Total 415 1024
88 | P a g e
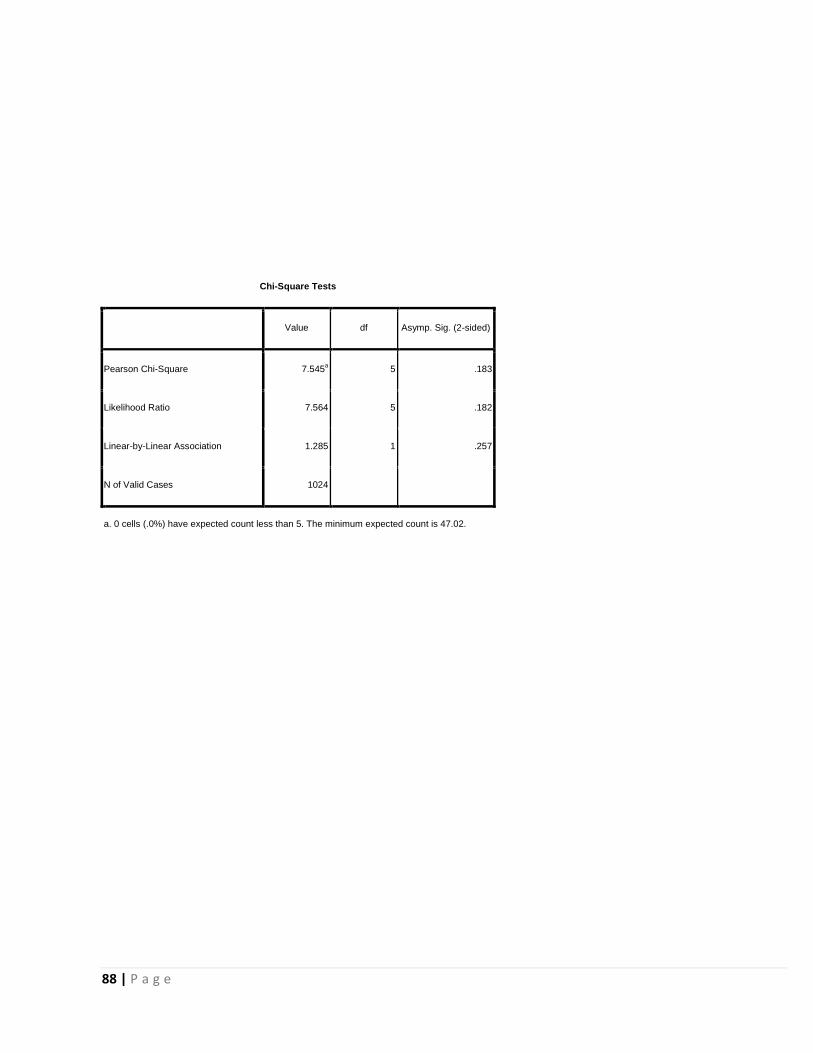
Chi-Square Tests
Value df Asymp. Sig. (2-sided)
Pearson Chi-Square 7.545a 5 .183
Likelihood Ratio 7.564 5 .182
Linear-by-Linear Association 1.285 1 .257
N of Valid Cases 1024
a. 0 cells (.0%) have expected count less than 5. The minimum expected count is 47.02.
89 | P a g e
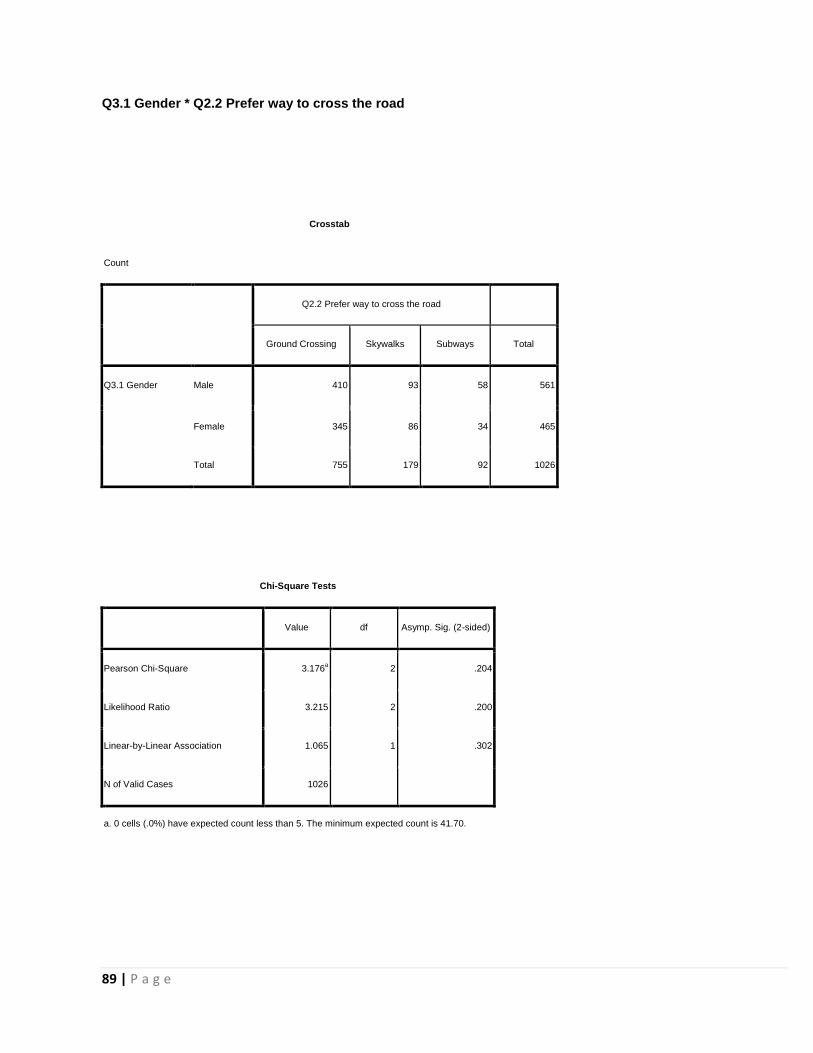
Q3.1 Gender * Q2.2 Prefer way to cross the road
Crosstab
Count
Q2.2 Prefer way to cross the road
Ground Crossing Skywalks Subways Total
Q3.1 Gender Male 410 93 58 561
Female 345 86 34 465
Total 755 179 92 1026
Chi-Square Tests
Value df Asymp. Sig. (2-sided)
Pearson Chi-Square 3.176a 2 .204
Likelihood Ratio 3.215 2 .200
Linear-by-Linear Association 1.065 1 .302
N of Valid Cases 1026
a. 0 cells (.0%) have expected count less than 5. The minimum expected count is 41.70.
90 | P a g e
Q3.1 Gender * Q2.4 Willing to walk to access crossing
Crosstab
Count
Q2.4 Willing to walk to access crossing
<=50 m 51-100 m 101-150 m 151-200 m 201-250 m
Q3.1 Gender Male 258 161 65 33 14
Female 180 162 58 44 7
Total 438 323 123 77 21
Crosstab
Count
Q2.4 Willing to walk to access crossing
251-300 m >300 m Total
Q3.1 Gender Male 2 25 558
Female 3 7 461
Total 5 32 1019
Chi-Square Tests
Value df Asymp. Sig. (2-sided)
Pearson Chi-Square 19.464a 6 .003
Likelihood Ratio 20.017 6 .003
Linear-by-Linear Association .020 1 .887
N of Valid Cases 1019
91 | P a g e
Crosstab
Count
Q2.4 Willing to walk to access crossing
<=50 m 51-100 m 101-150 m 151-200 m 201-250 m
Q3.1 Gender Male 258 161 65 33 14
Female 180 162 58 44 7
a. 2 cells (14.3%) have expected count less than 5. The minimum expected count is 2.26.
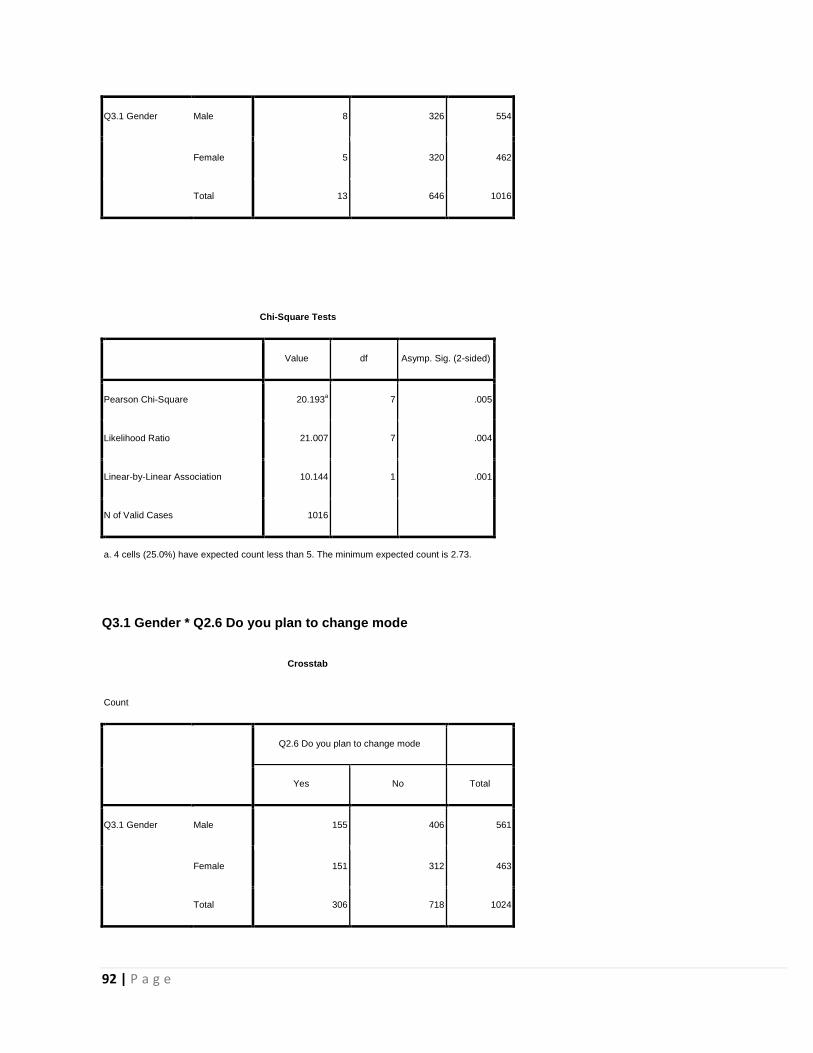
Q3.1 Gender * Q2.5 When do you think you are most exposed to air pollution
Crosstab
Count
Q2.5 When do you think you are most exposed to air pollution
Walking Cycle Bus MTR Light Bus Car/Taxi
Q3.1 Gender Male 169 8 30 5 3 5
Female 112 4 8 8 3 2
Total 281 12 38 13 6 7
Crosstab
Count
Q2.5 When do you think you are most
exposed to air pollution
Two Wheeler
Waiting for
transportation Total
92 | P a g e
Q3.1 Gender Male 8 326 554
Female 5 320 462
Total 13 646 1016
Chi-Square Tests
Value df Asymp. Sig. (2-sided)
Pearson Chi-Square 20.193a 7 .005
Likelihood Ratio 21.007 7 .004
Linear-by-Linear Association 10.144 1 .001
N of Valid Cases 1016
a. 4 cells (25.0%) have expected count less than 5. The minimum expected count is 2.73.
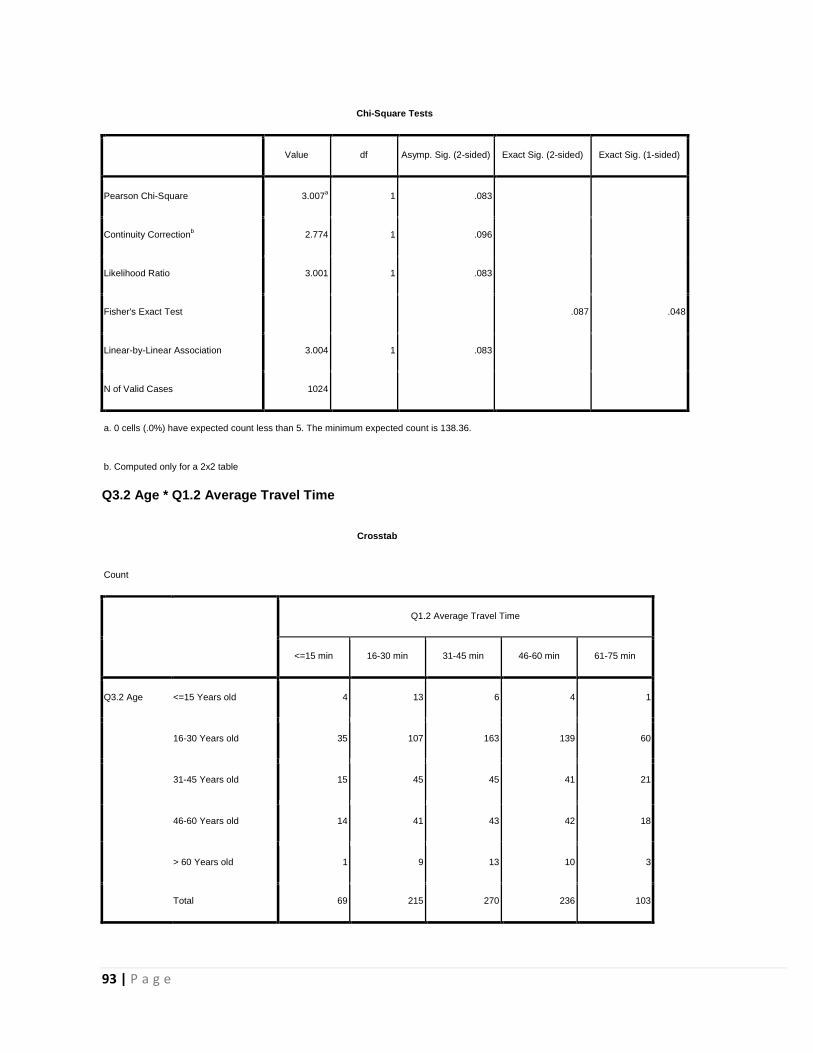
Q3.1 Gender * Q2.6 Do you plan to change mode
Crosstab
Count
Q2.6 Do you plan to change mode
Yes No Total
Q3.1 Gender Male 155 406 561
Female 151 312 463
Total 306 718 1024
93 | P a g e
Chi-Square Tests
Value df Asymp. Sig. (2-sided) Exact Sig. (2-sided) Exact Sig. (1-sided)
Pearson Chi-Square 3.007a 1 .083
Continuity Correctionb 2.774 1 .096
Likelihood Ratio 3.001 1 .083
Fisher's Exact Test
.087 .048
Linear-by-Linear Association 3.004 1 .083
N of Valid Cases 1024
a. 0 cells (.0%) have expected count less than 5. The minimum expected count is 138.36.
b. Computed only for a 2x2 table
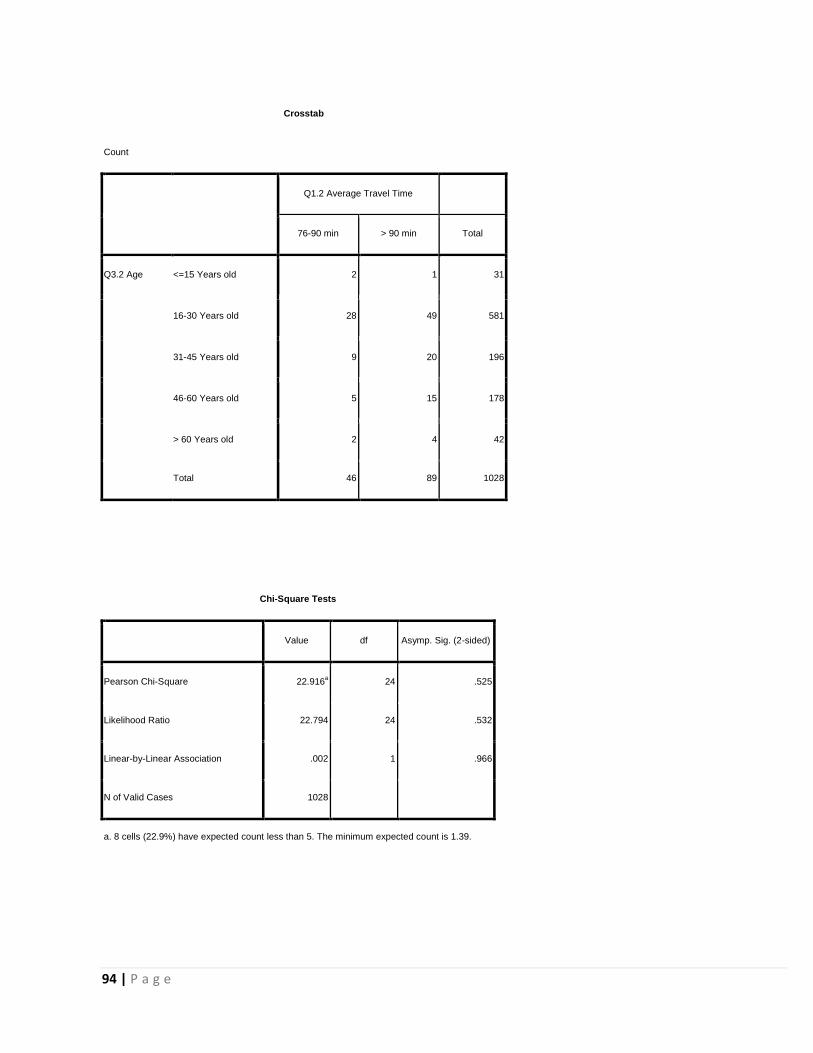
Q3.2 Age * Q1.2 Average Travel Time
Crosstab
Count
Q1.2 Average Travel Time
<=15 min 16-30 min 31-45 min 46-60 min 61-75 min
Q3.2 Age <=15 Years old 4 13 6 4 1
16-30 Years old 35 107 163 139 60
31-45 Years old 15 45 45 41 21
46-60 Years old 14 41 43 42 18
> 60 Years old 1 9 13 10 3
Total 69 215 270 236 103
94 | P a g e
Crosstab
Count
Q1.2 Average Travel Time
76-90 min > 90 min Total
Q3.2 Age <=15 Years old 2 1 31
16-30 Years old 28 49 581
31-45 Years old 9 20 196
46-60 Years old 5 15 178
> 60 Years old 2 4 42
Total 46 89 1028
Chi-Square Tests
Value df Asymp. Sig. (2-sided)
Pearson Chi-Square 22.916a 24 .525
Likelihood Ratio 22.794 24 .532
Linear-by-Linear Association .002 1 .966
N of Valid Cases 1028
a. 8 cells (22.9%) have expected count less than 5. The minimum expected count is 1.39.
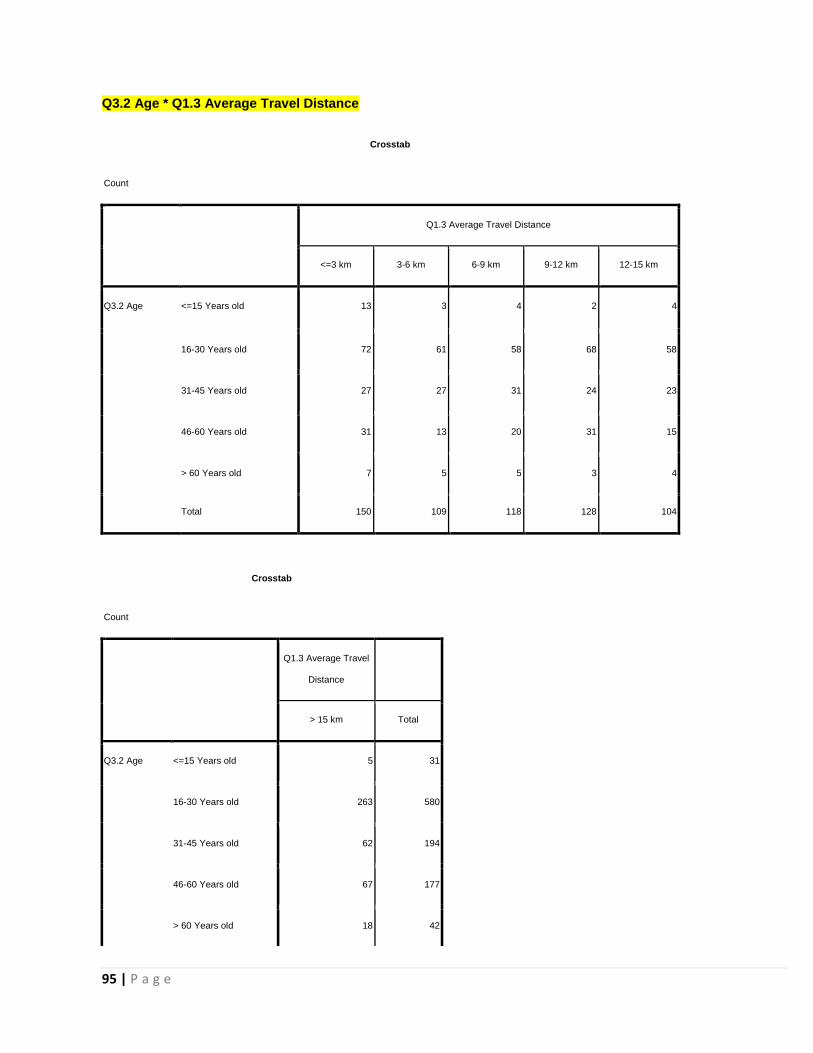
95 | P a g e
Q3.2 Age * Q1.3 Average Travel Distance
Crosstab
Count
Q1.3 Average Travel Distance
<=3 km 3-6 km 6-9 km 9-12 km 12-15 km
Q3.2 Age <=15 Years old 13 3 4 2 4
16-30 Years old 72 61 58 68 58
31-45 Years old 27 27 31 24 23
46-60 Years old 31 13 20 31 15
> 60 Years old 7 5 5 3 4
Total 150 109 118 128 104
Crosstab
Count
Q1.3 Average Travel
Distance
> 15 km Total
Q3.2 Age <=15 Years old 5 31
16-30 Years old 263 580
31-45 Years old 62 194
46-60 Years old 67 177
> 60 Years old 18 42
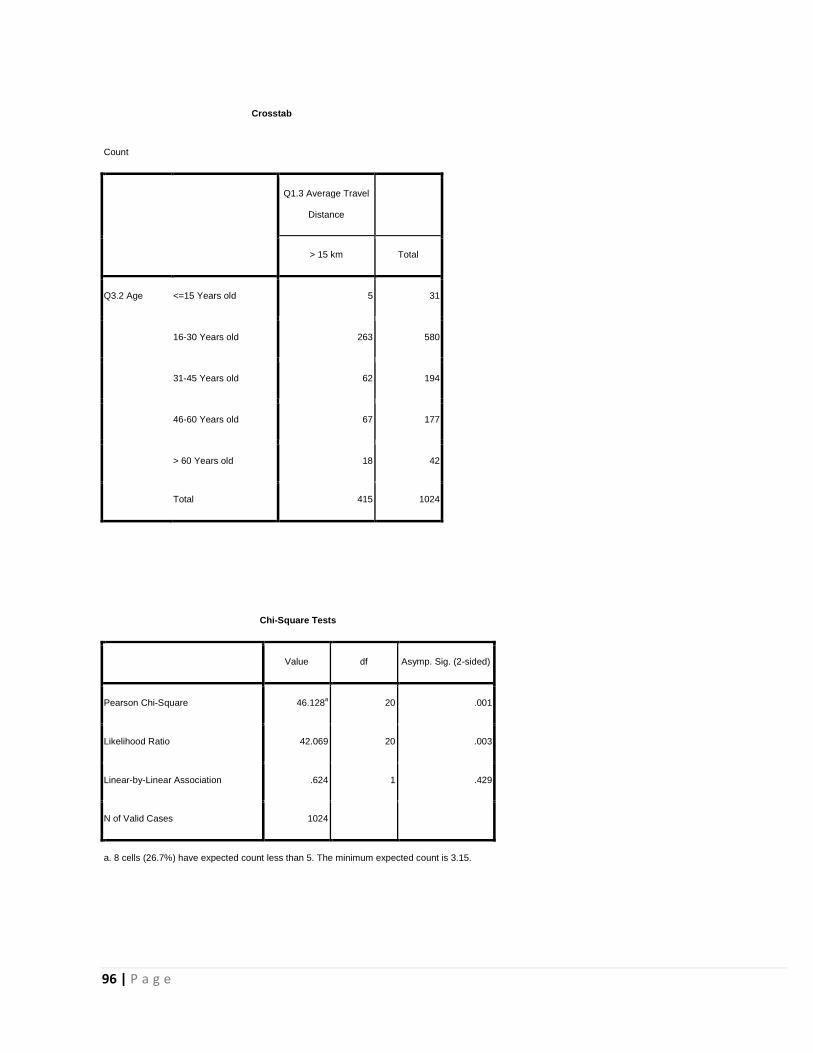
96 | P a g e
Crosstab
Count
Q1.3 Average Travel
Distance
> 15 km Total
Q3.2 Age <=15 Years old 5 31
16-30 Years old 263 580
31-45 Years old 62 194
46-60 Years old 67 177
> 60 Years old 18 42
Total 415 1024
Chi-Square Tests
Value df Asymp. Sig. (2-sided)
Pearson Chi-Square 46.128a 20 .001
Likelihood Ratio 42.069 20 .003
Linear-by-Linear Association .624 1 .429
N of Valid Cases 1024
a. 8 cells (26.7%) have expected count less than 5. The minimum expected count is 3.15.
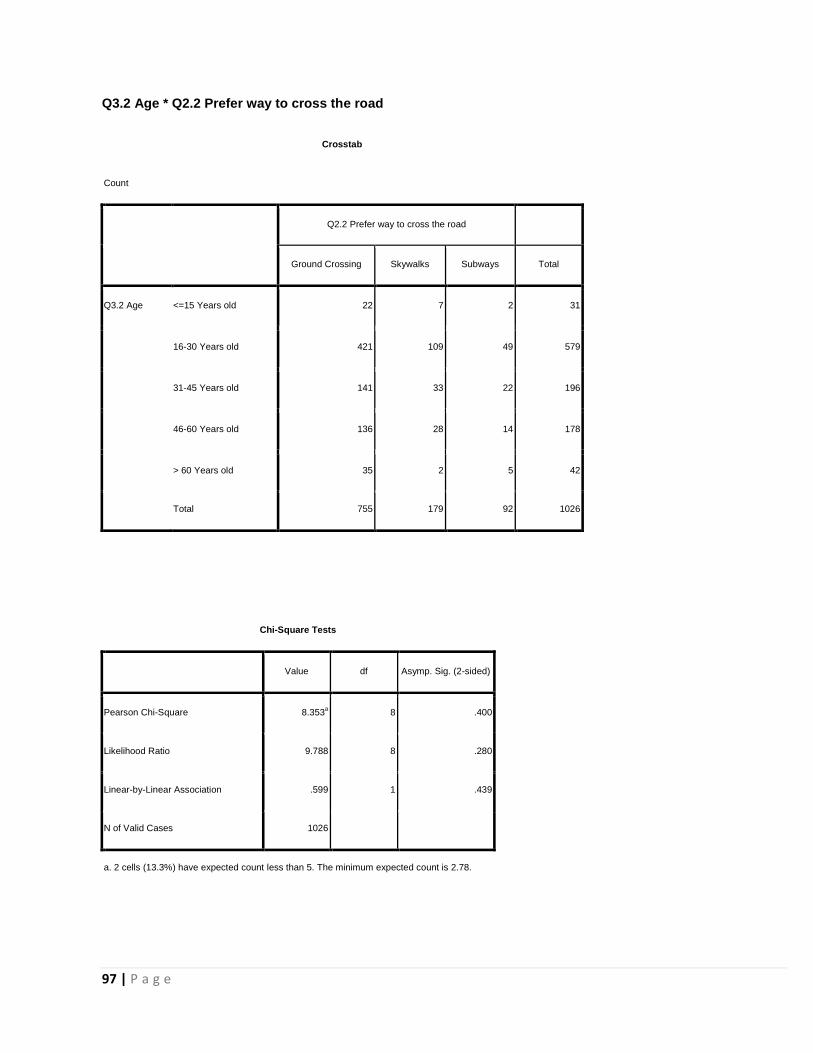
97 | P a g e
Q3.2 Age * Q2.2 Prefer way to cross the road
Crosstab
Count
Q2.2 Prefer way to cross the road
Ground Crossing Skywalks Subways Total
Q3.2 Age <=15 Years old 22 7 2 31
16-30 Years old 421 109 49 579
31-45 Years old 141 33 22 196
46-60 Years old 136 28 14 178
> 60 Years old 35 2 5 42
Total 755 179 92 1026
Chi-Square Tests
Value df Asymp. Sig. (2-sided)
Pearson Chi-Square 8.353a 8 .400
Likelihood Ratio 9.788 8 .280
Linear-by-Linear Association .599 1 .439
N of Valid Cases 1026
a. 2 cells (13.3%) have expected count less than 5. The minimum expected count is 2.78.

98 | P a g e
Q3.2 Age * Q2.4 Willing to walk to access crossing
Crosstab
Count
Q2.4 Willing to walk to access crossing
<=50 m 51-100 m 101-150 m 151-200 m 201-250 m
Q3.2 Age <=15 Years old 13 9 4 2 0
16-30 Years old 254 178 71 47 10
31-45 Years old 94 59 22 8 4
46-60 Years old 58 63 22 18 6
> 60 Years old 19 14 4 2 1
Total 438 323 123 77 21
Crosstab
Count
Q2.4 Willing to walk to access crossing
251-300 m >300 m Total
Q3.2 Age <=15 Years old 0 2 30
16-30 Years old 1 17 578
31-45 Years old 2 5 194
46-60 Years old 1 8 176
> 60 Years old 1 0 41
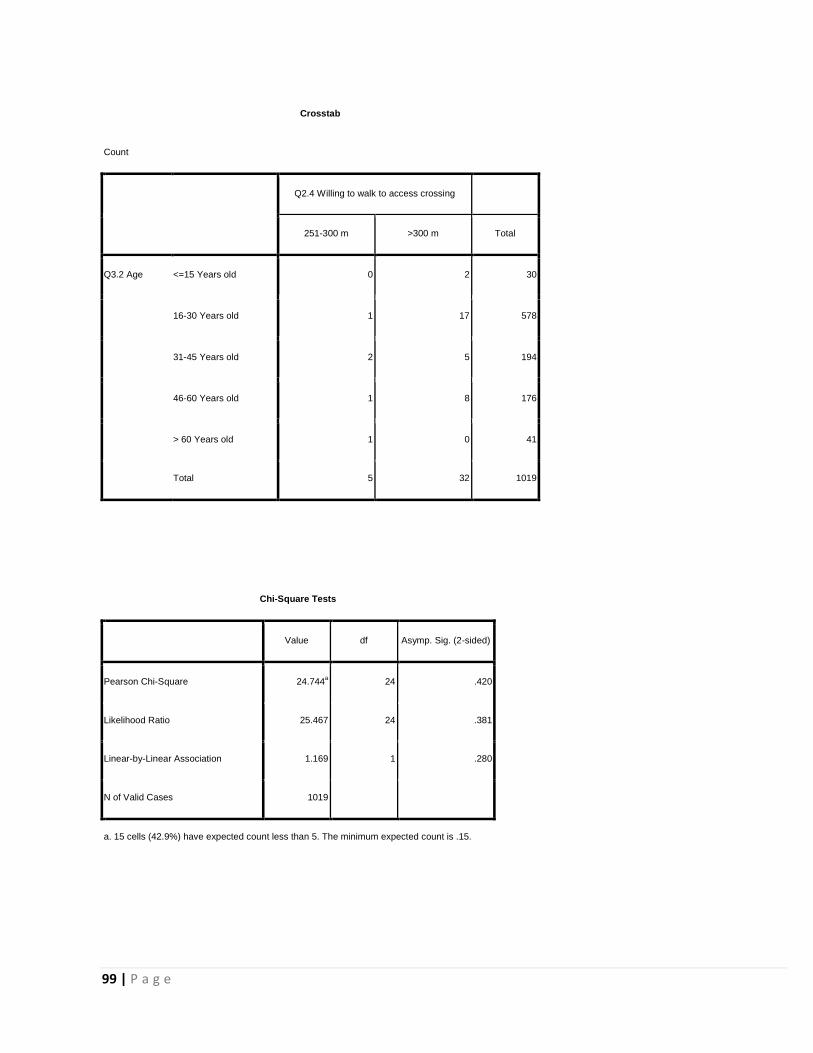
99 | P a g e
Crosstab
Count
Q2.4 Willing to walk to access crossing
251-300 m >300 m Total
Q3.2 Age <=15 Years old 0 2 30
16-30 Years old 1 17 578
31-45 Years old 2 5 194
46-60 Years old 1 8 176
> 60 Years old 1 0 41
Total 5 32 1019
Chi-Square Tests
Value df Asymp. Sig. (2-sided)
Pearson Chi-Square 24.744a 24 .420
Likelihood Ratio 25.467 24 .381
Linear-by-Linear Association 1.169 1 .280
N of Valid Cases 1019
a. 15 cells (42.9%) have expected count less than 5. The minimum expected count is .15.
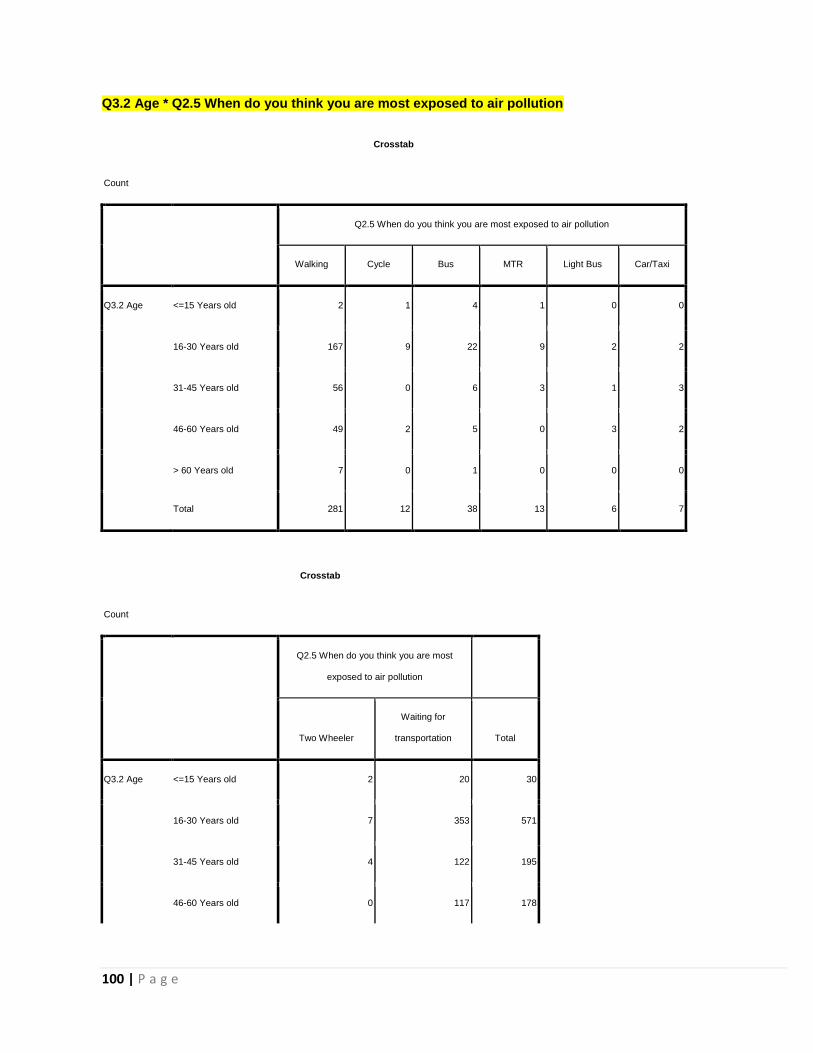
100 | P a g e
Q3.2 Age * Q2.5 When do you think you are most exposed to air pollution
Crosstab
Count
Q2.5 When do you think you are most exposed to air pollution
Walking Cycle Bus MTR Light Bus Car/Taxi
Q3.2 Age <=15 Years old 2 1 4 1 0 0
16-30 Years old 167 9 22 9 2 2
31-45 Years old 56 0 6 3 1 3
46-60 Years old 49 2 5 0 3 2
> 60 Years old 7 0 1 0 0 0
Total 281 12 38 13 6 7
Crosstab
Count
Q2.5 When do you think you are most
exposed to air pollution
Two Wheeler
Waiting for
transportation Total
Q3.2 Age <=15 Years old 2 20 30
16-30 Years old 7 353 571
31-45 Years old 4 122 195
46-60 Years old 0 117 178
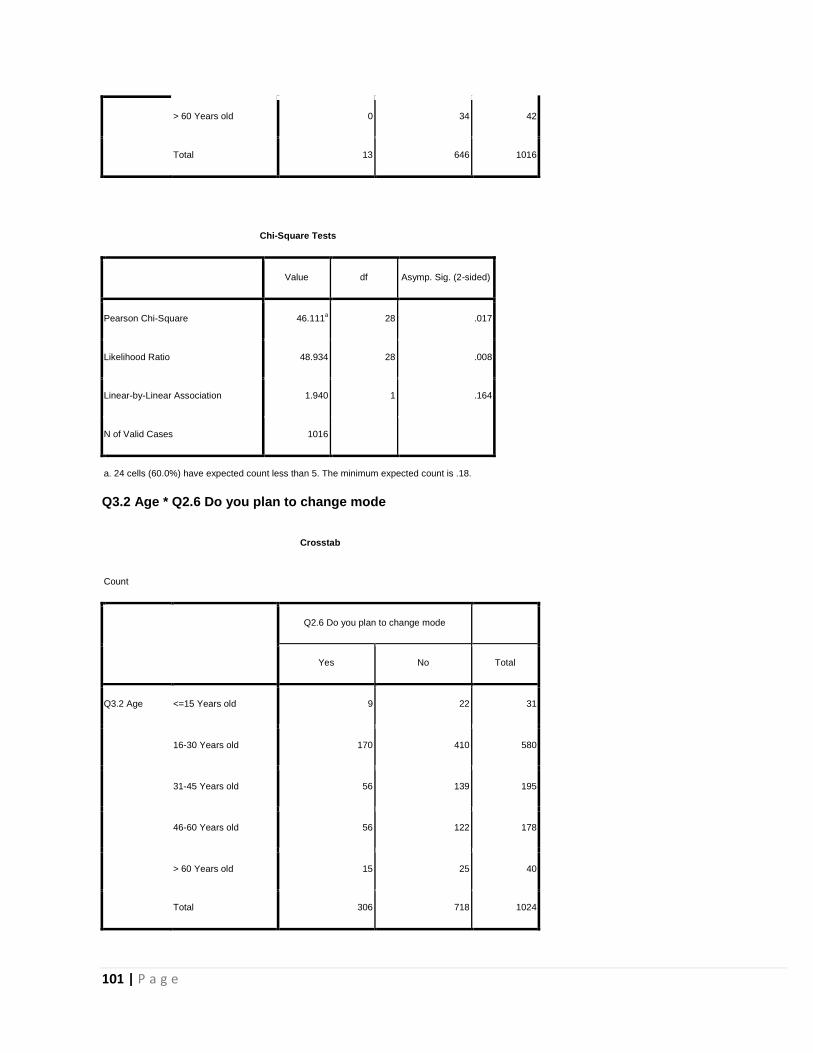
101 | P a g e
> 60 Years old 0 34 42
Total 13 646 1016
Chi-Square Tests
Value df Asymp. Sig. (2-sided)
Pearson Chi-Square 46.111a 28 .017
Likelihood Ratio 48.934 28 .008
Linear-by-Linear Association 1.940 1 .164
N of Valid Cases 1016
a. 24 cells (60.0%) have expected count less than 5. The minimum expected count is .18.
Q3.2 Age * Q2.6 Do you plan to change mode
Crosstab
Count
Q2.6 Do you plan to change mode
Yes No Total
Q3.2 Age <=15 Years old 9 22 31
16-30 Years old 170 410 580
31-45 Years old 56 139 195
46-60 Years old 56 122 178
> 60 Years old 15 25 40
Total 306 718 1024
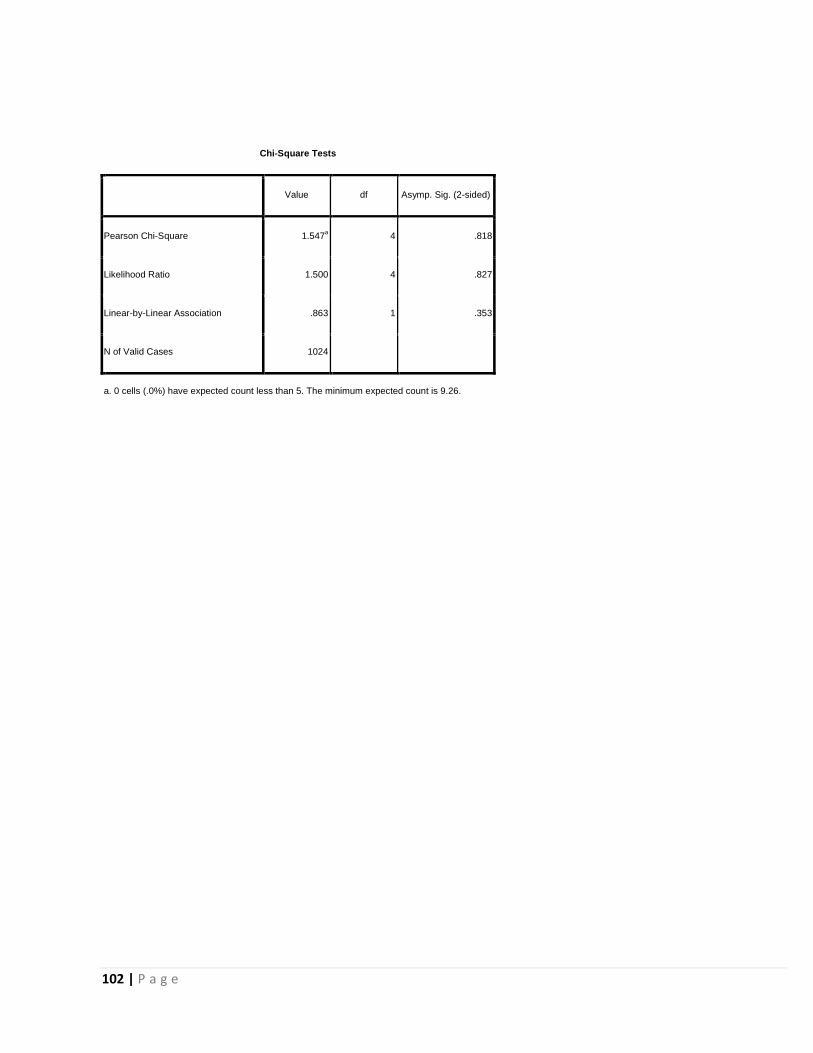
102 | P a g e
Chi-Square Tests
Value df Asymp. Sig. (2-sided)
Pearson Chi-Square 1.547a 4 .818
Likelihood Ratio 1.500 4 .827
Linear-by-Linear Association .863 1 .353
N of Valid Cases 1024
a. 0 cells (.0%) have expected count less than 5. The minimum expected count is 9.26.
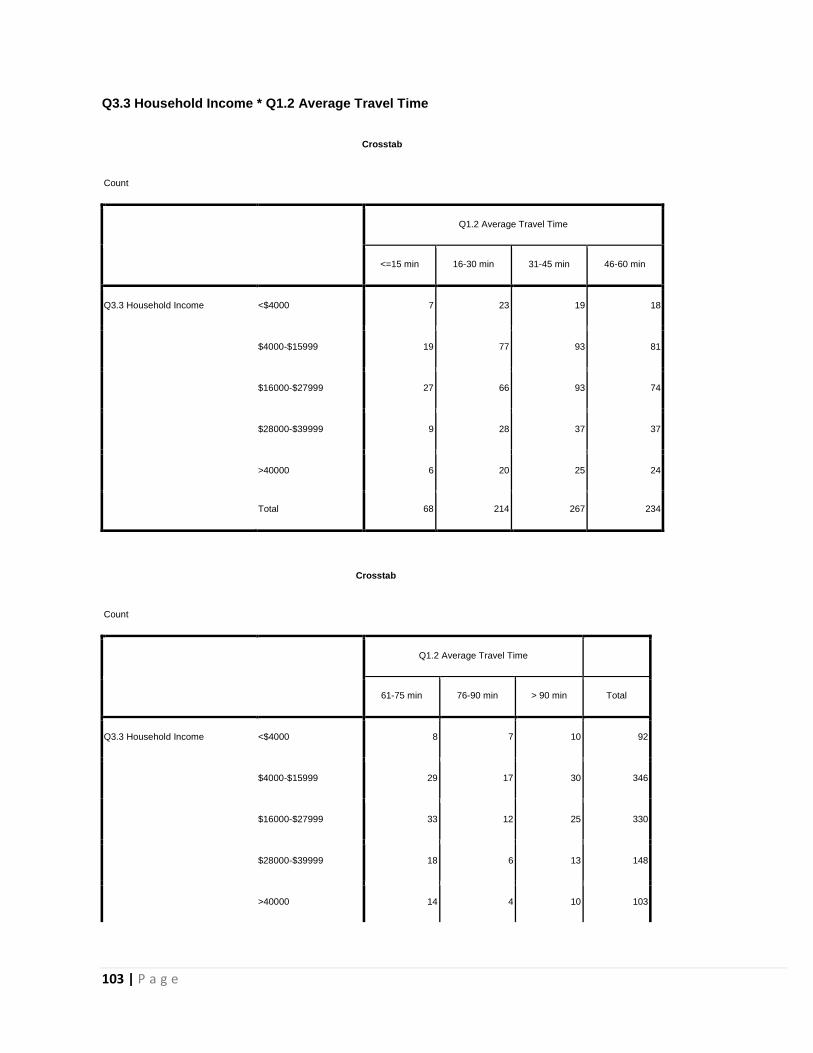
103 | P a g e
Q3.3 Household Income * Q1.2 Average Travel Time
Crosstab
Count
Q1.2 Average Travel Time
<=15 min 16-30 min 31-45 min 46-60 min
Q3.3 Household Income <$4000 7 23 19 18
$4000-$15999 19 77 93 81
$16000-$27999 27 66 93 74
$28000-$39999 9 28 37 37
>40000 6 20 25 24
Total 68 214 267 234
Crosstab
Count
Q1.2 Average Travel Time
61-75 min 76-90 min > 90 min Total
Q3.3 Household Income <$4000 8 7 10 92
$4000-$15999 29 17 30 346
$16000-$27999 33 12 25 330
$28000-$39999 18 6 13 148
>40000 14 4 10 103
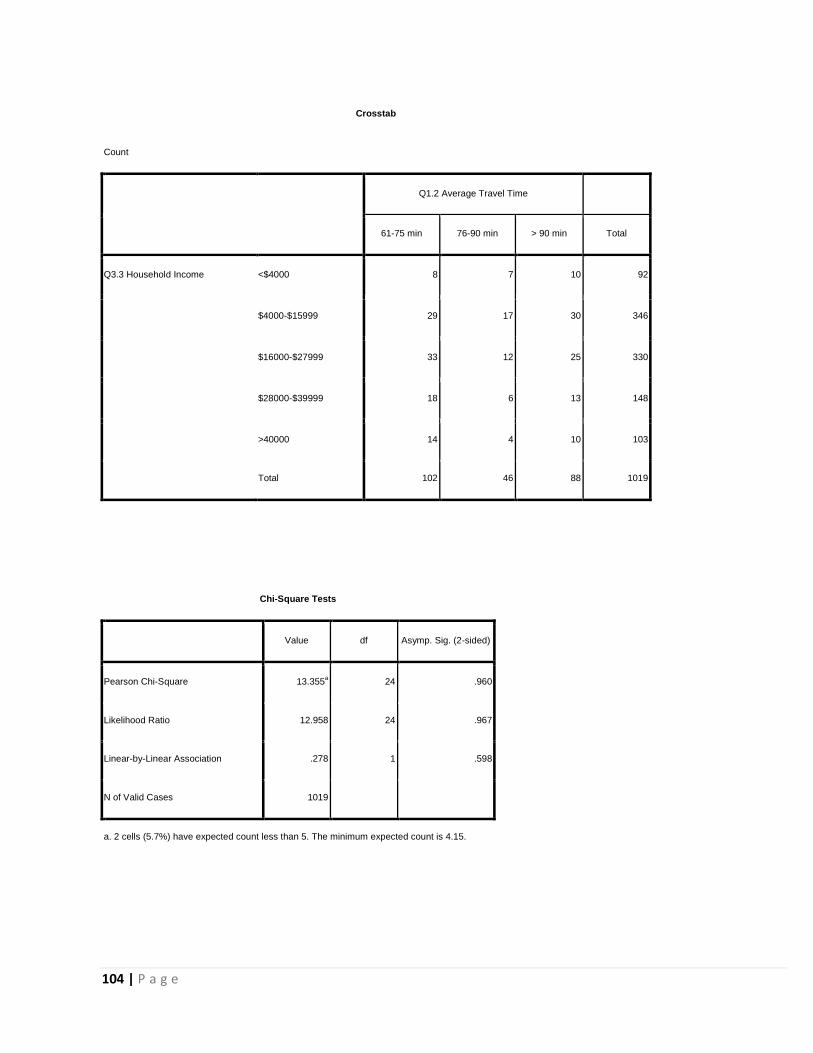
104 | P a g e
Crosstab
Count
Q1.2 Average Travel Time
61-75 min 76-90 min > 90 min Total
Q3.3 Household Income <$4000 8 7 10 92
$4000-$15999 29 17 30 346
$16000-$27999 33 12 25 330
$28000-$39999 18 6 13 148
>40000 14 4 10 103
Total 102 46 88 1019
Chi-Square Tests
Value df Asymp. Sig. (2-sided)
Pearson Chi-Square 13.355a 24 .960
Likelihood Ratio 12.958 24 .967
Linear-by-Linear Association .278 1 .598
N of Valid Cases 1019
a. 2 cells (5.7%) have expected count less than 5. The minimum expected count is 4.15.
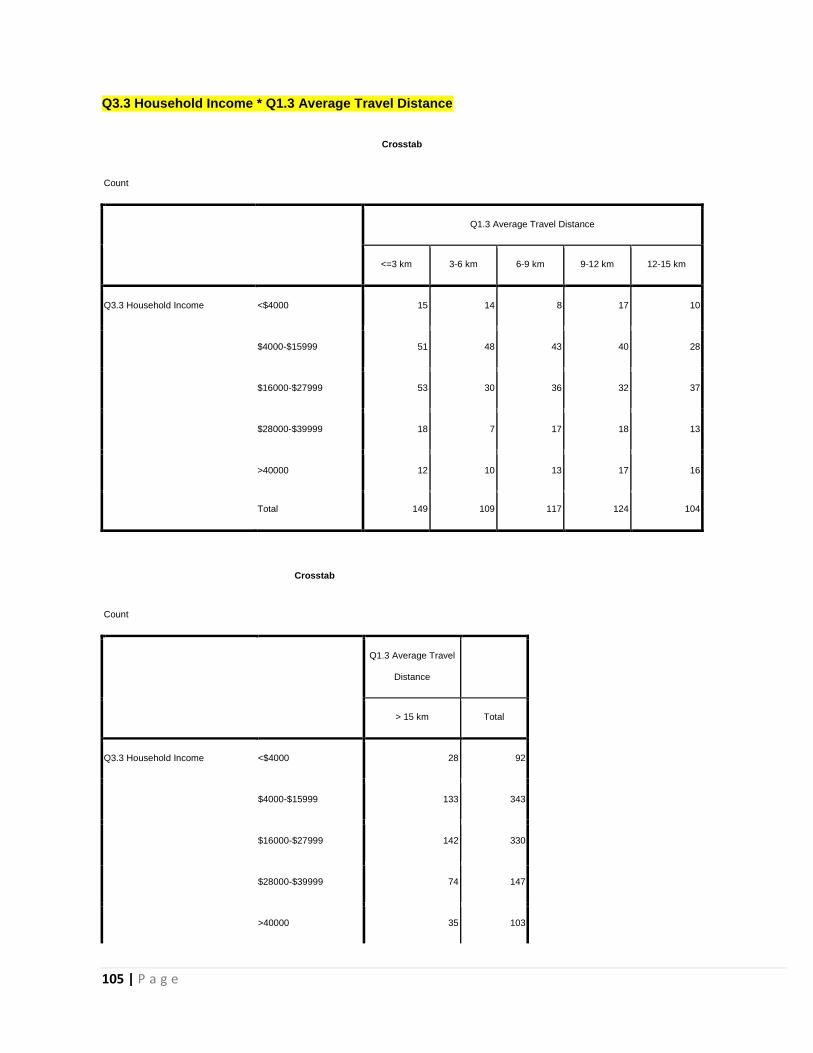
105 | P a g e
Q3.3 Household Income * Q1.3 Average Travel Distance
Crosstab
Count
Q1.3 Average Travel Distance
<=3 km 3-6 km 6-9 km 9-12 km 12-15 km
Q3.3 Household Income <$4000 15 14 8 17 10
$4000-$15999 51 48 43 40 28
$16000-$27999 53 30 36 32 37
$28000-$39999 18 7 17 18 13
>40000 12 10 13 17 16
Total 149 109 117 124 104
Crosstab
Count
Q1.3 Average Travel
Distance
> 15 km Total
Q3.3 Household Income <$4000 28 92
$4000-$15999 133 343
$16000-$27999 142 330
$28000-$39999 74 147
>40000 35 103
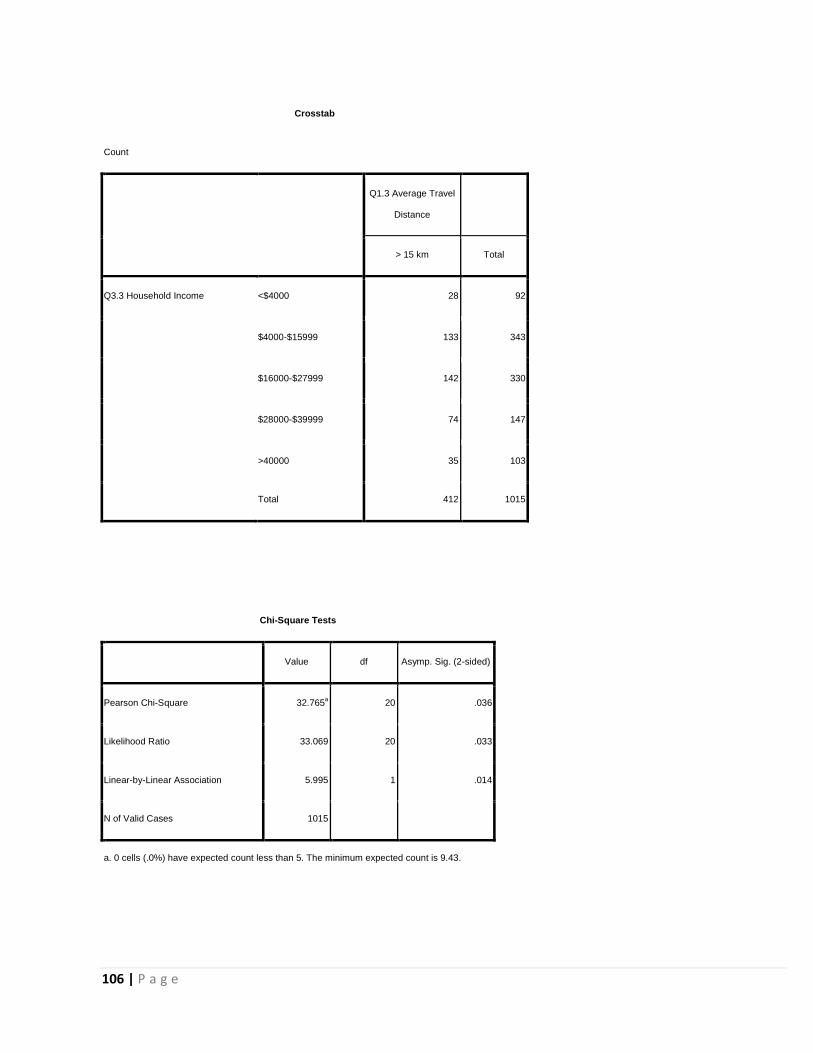
106 | P a g e
Crosstab
Count
Q1.3 Average Travel
Distance
> 15 km Total
Q3.3 Household Income <$4000 28 92
$4000-$15999 133 343
$16000-$27999 142 330
$28000-$39999 74 147
>40000 35 103
Total 412 1015
Chi-Square Tests
Value df Asymp. Sig. (2-sided)
Pearson Chi-Square 32.765a 20 .036
Likelihood Ratio 33.069 20 .033
Linear-by-Linear Association 5.995 1 .014
N of Valid Cases 1015
a. 0 cells (.0%) have expected count less than 5. The minimum expected count is 9.43.
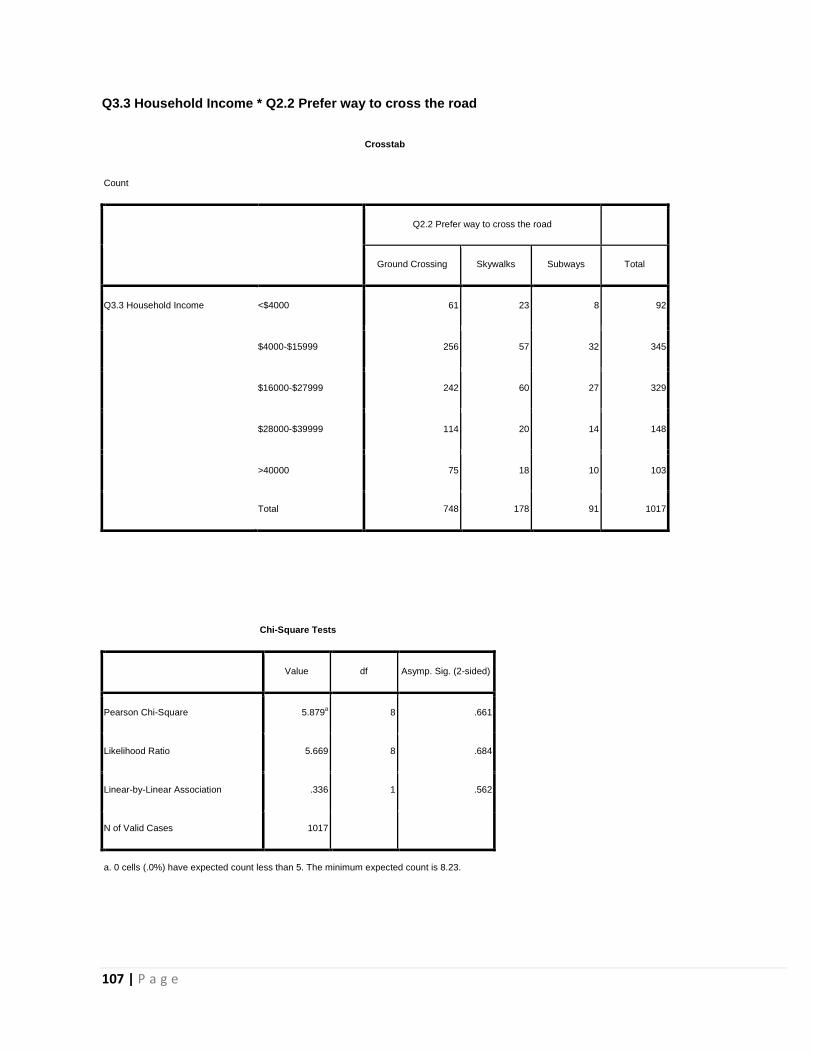
107 | P a g e
Q3.3 Household Income * Q2.2 Prefer way to cross the road
Crosstab
Count
Q2.2 Prefer way to cross the road
Ground Crossing Skywalks Subways Total
Q3.3 Household Income <$4000 61 23 8 92
$4000-$15999 256 57 32 345
$16000-$27999 242 60 27 329
$28000-$39999 114 20 14 148
>40000 75 18 10 103
Total 748 178 91 1017
Chi-Square Tests
Value df Asymp. Sig. (2-sided)
Pearson Chi-Square 5.879a 8 .661
Likelihood Ratio 5.669 8 .684
Linear-by-Linear Association .336 1 .562
N of Valid Cases 1017
a. 0 cells (.0%) have expected count less than 5. The minimum expected count is 8.23.
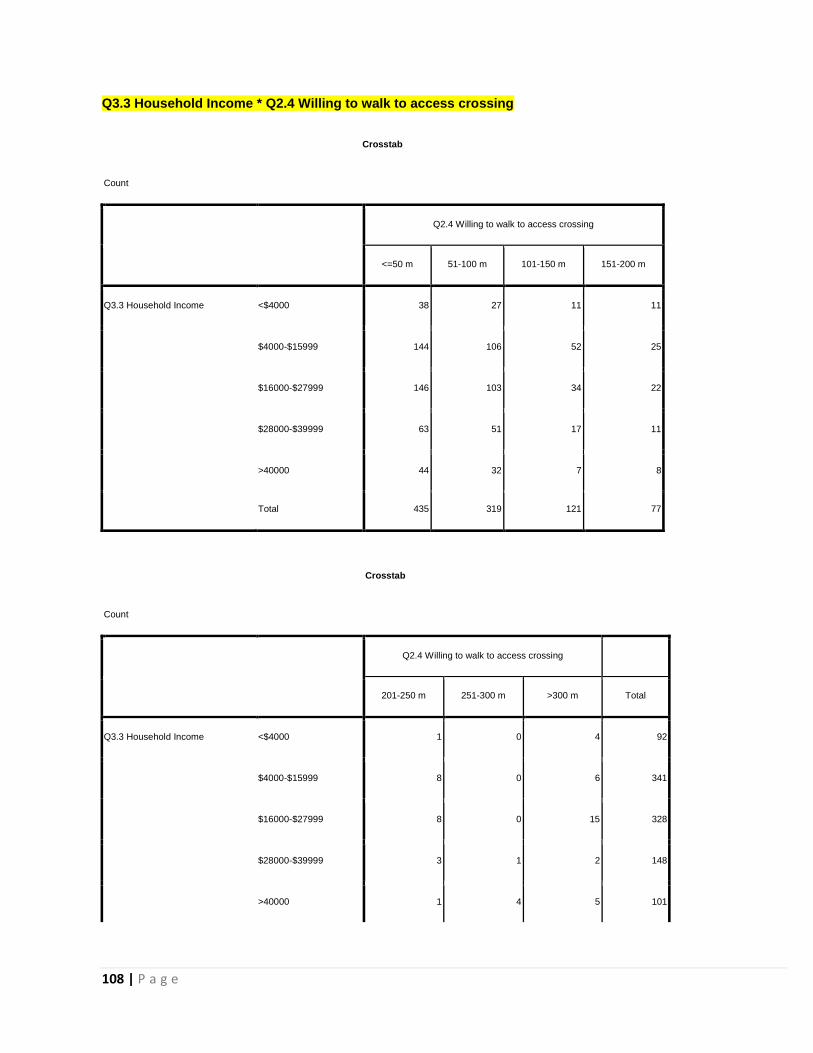
108 | P a g e
Q3.3 Household Income * Q2.4 Willing to walk to access crossing
Crosstab
Count
Q2.4 Willing to walk to access crossing
<=50 m 51-100 m 101-150 m 151-200 m
Q3.3 Household Income <$4000 38 27 11 11
$4000-$15999 144 106 52 25
$16000-$27999 146 103 34 22
$28000-$39999 63 51 17 11
>40000 44 32 7 8
Total 435 319 121 77
Crosstab
Count
Q2.4 Willing to walk to access crossing
201-250 m 251-300 m >300 m Total
Q3.3 Household Income <$4000 1 0 4 92
$4000-$15999 8 0 6 341
$16000-$27999 8 0 15 328
$28000-$39999 3 1 2 148
>40000 1 4 5 101
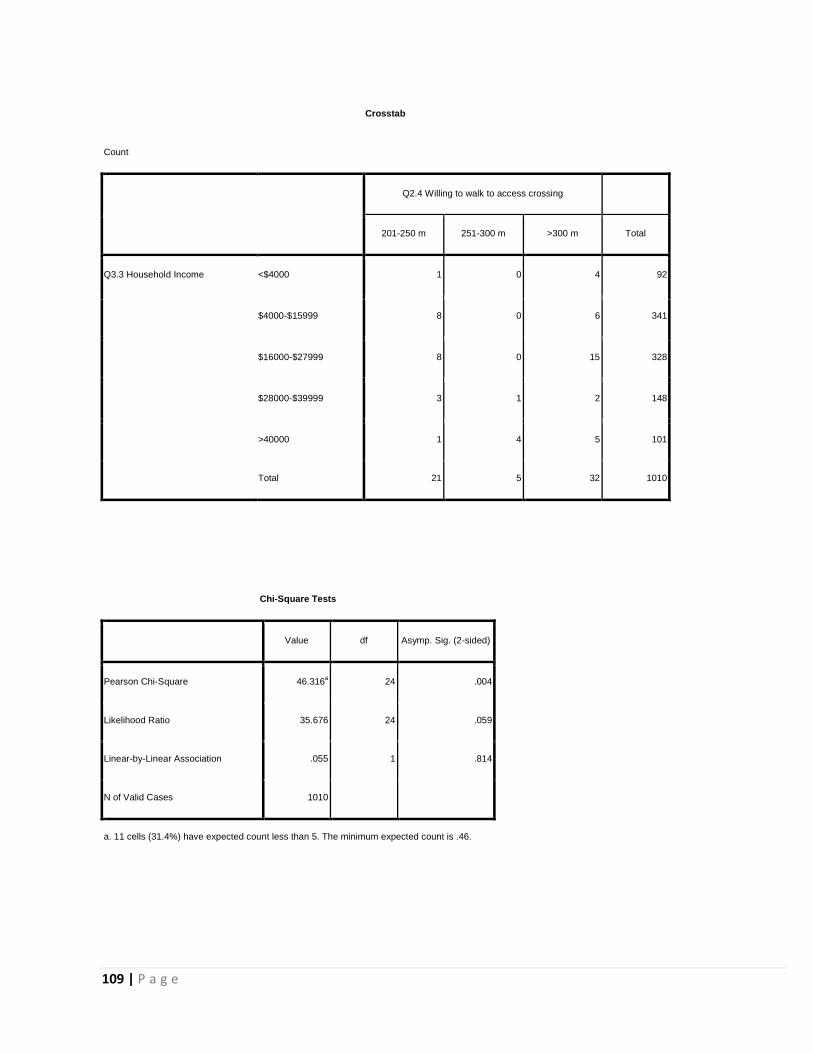
109 | P a g e
Crosstab
Count
Q2.4 Willing to walk to access crossing
201-250 m 251-300 m >300 m Total
Q3.3 Household Income <$4000 1 0 4 92
$4000-$15999 8 0 6 341
$16000-$27999 8 0 15 328
$28000-$39999 3 1 2 148
>40000 1 4 5 101
Total 21 5 32 1010
Chi-Square Tests
Value df Asymp. Sig. (2-sided)
Pearson Chi-Square 46.316a 24 .004
Likelihood Ratio 35.676 24 .059
Linear-by-Linear Association .055 1 .814
N of Valid Cases 1010
a. 11 cells (31.4%) have expected count less than 5. The minimum expected count is .46.
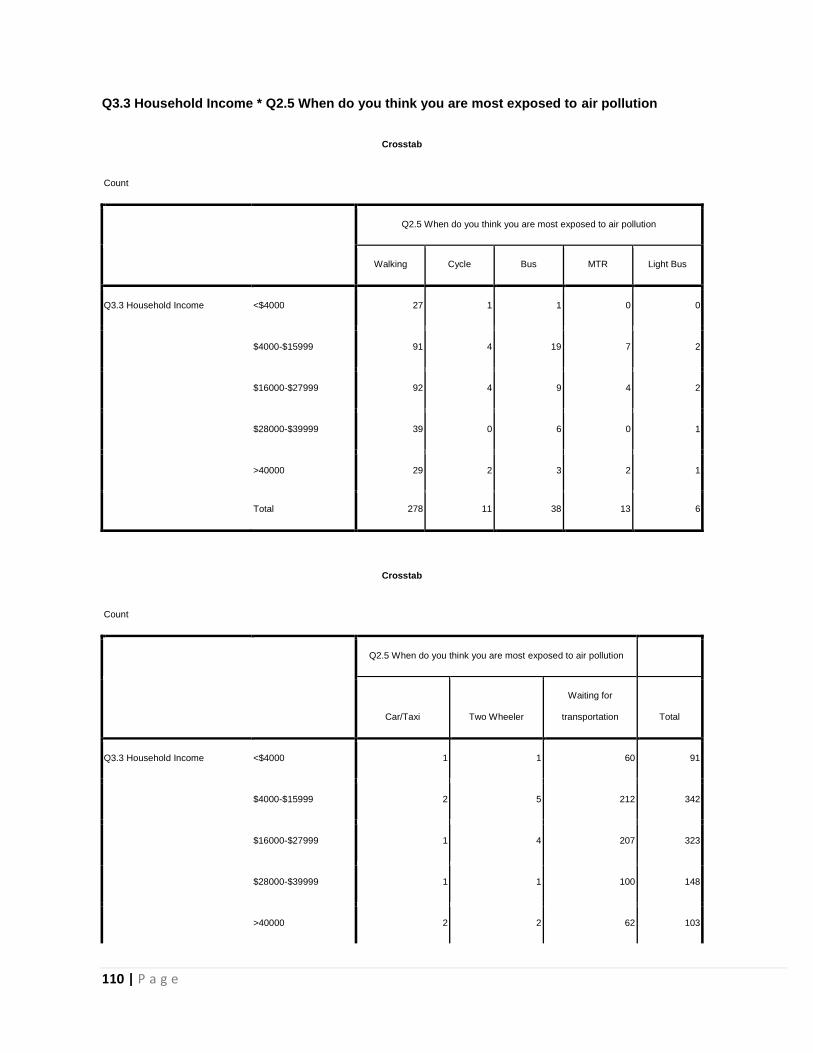
110 | P a g e
Q3.3 Household Income * Q2.5 When do you think you are most exposed to air pollution
Crosstab
Count
Q2.5 When do you think you are most exposed to air pollution
Walking Cycle Bus MTR Light Bus
Q3.3 Household Income <$4000 27 1 1 0 0
$4000-$15999 91 4 19 7 2
$16000-$27999 92 4 9 4 2
$28000-$39999 39 0 6 0 1
>40000 29 2 3 2 1
Total 278 11 38 13 6
Crosstab
Count
Q2.5 When do you think you are most exposed to air pollution
Car/Taxi Two Wheeler
Waiting for
transportation Total
Q3.3 Household Income <$4000 1 1 60 91
$4000-$15999 2 5 212 342
$16000-$27999 1 4 207 323
$28000-$39999 1 1 100 148
>40000 2 2 62 103
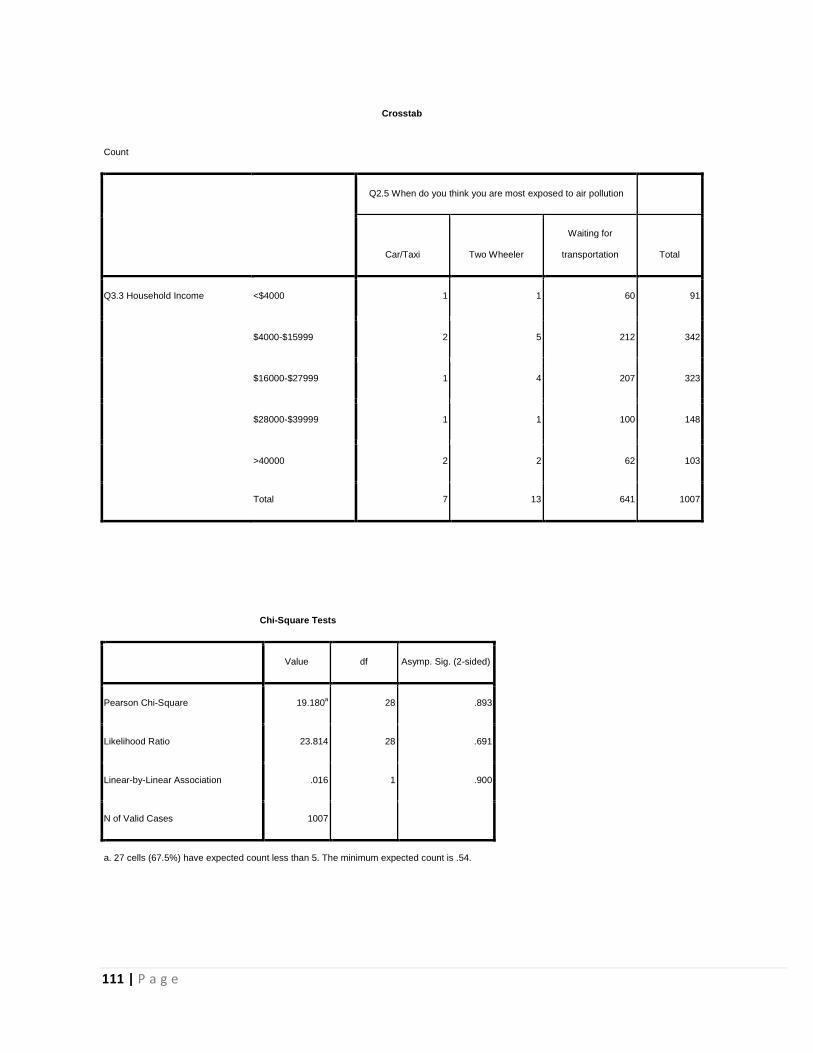
111 | P a g e
Crosstab
Count
Q2.5 When do you think you are most exposed to air pollution
Car/Taxi Two Wheeler
Waiting for
transportation Total
Q3.3 Household Income <$4000 1 1 60 91
$4000-$15999 2 5 212 342
$16000-$27999 1 4 207 323
$28000-$39999 1 1 100 148
>40000 2 2 62 103
Total 7 13 641 1007
Chi-Square Tests
Value df Asymp. Sig. (2-sided)
Pearson Chi-Square 19.180a 28 .893
Likelihood Ratio 23.814 28 .691
Linear-by-Linear Association .016 1 .900
N of Valid Cases 1007
a. 27 cells (67.5%) have expected count less than 5. The minimum expected count is .54.
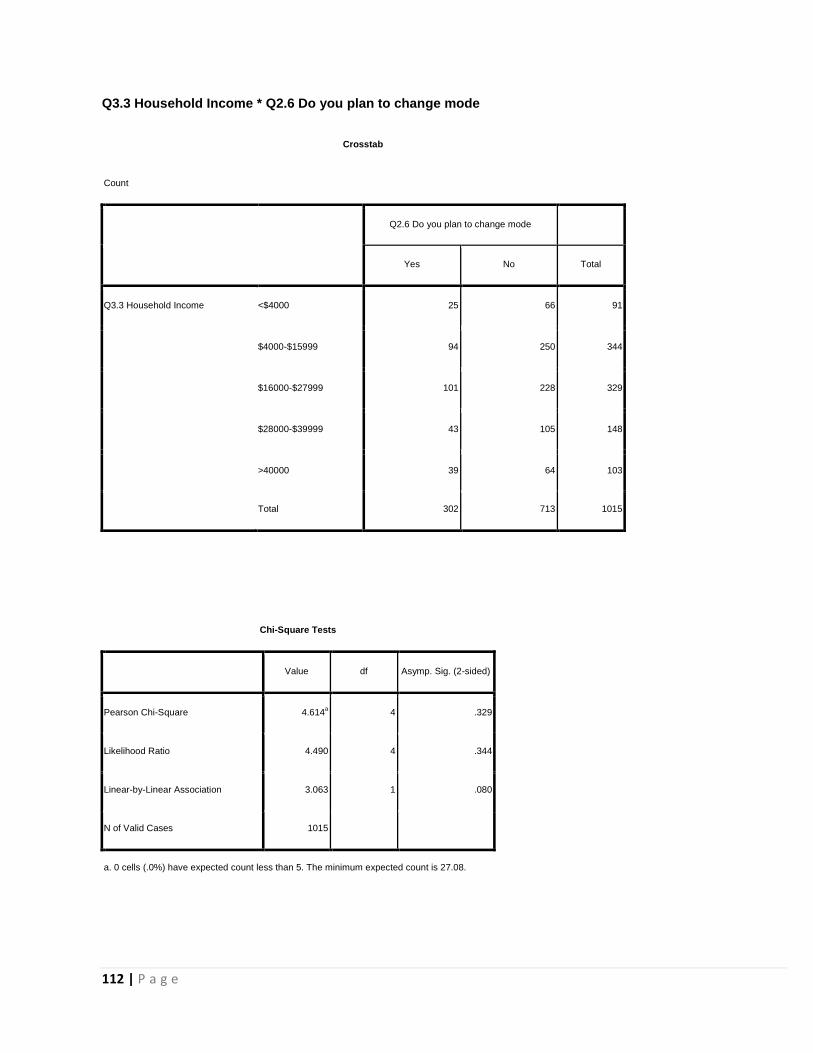
112 | P a g e
Q3.3 Household Income * Q2.6 Do you plan to change mode
Crosstab
Count
Q2.6 Do you plan to change mode
Yes No Total
Q3.3 Household Income <$4000 25 66 91
$4000-$15999 94 250 344
$16000-$27999 101 228 329
$28000-$39999 43 105 148
>40000 39 64 103
Total 302 713 1015
Chi-Square Tests
Value df Asymp. Sig. (2-sided)
Pearson Chi-Square 4.614a 4 .329
Likelihood Ratio 4.490 4 .344
Linear-by-Linear Association 3.063 1 .080
N of Valid Cases 1015
a. 0 cells (.0%) have expected count less than 5. The minimum expected count is 27.08.
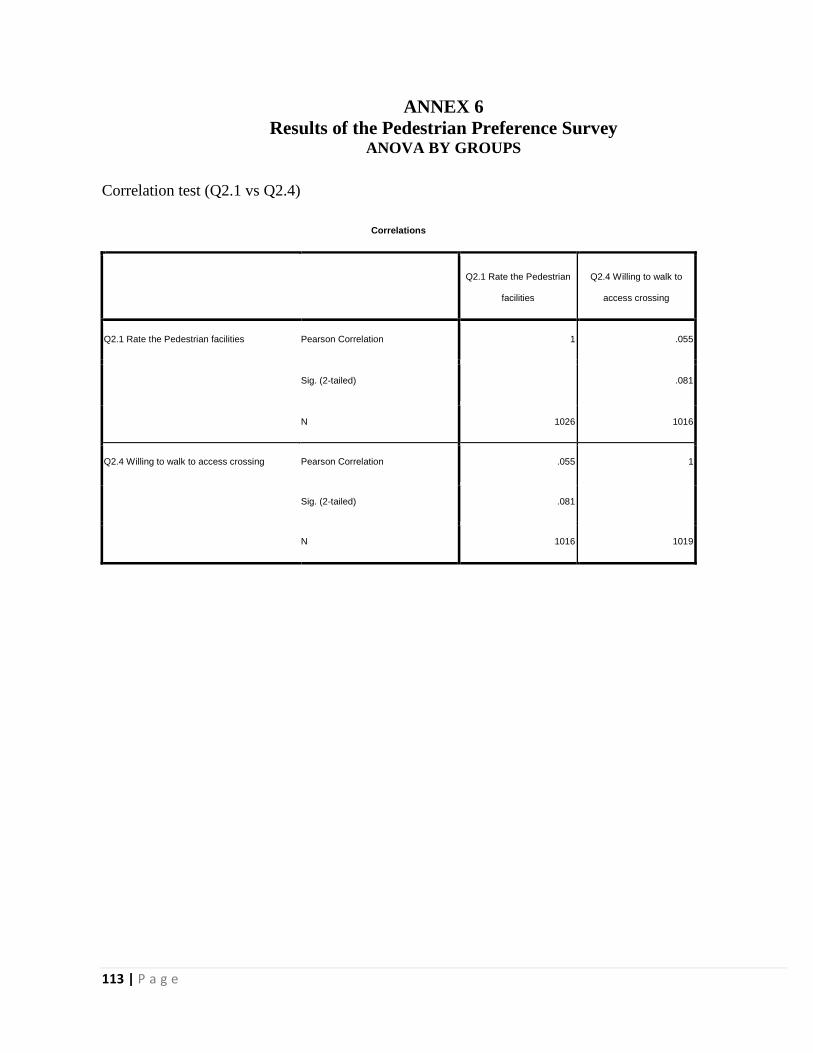
113 | P a g e
ANNEX 6
Results of the Pedestrian Preference Survey ANOVA BY GROUPS
Correlation test (Q2.1 vs Q2.4)
Correlations
Q2.1 Rate the Pedestrian
facilities
Q2.4 Willing to walk to
access crossing
Q2.1 Rate the Pedestrian facilities Pearson Correlation 1 .055
Sig. (2-tailed)
.081
N 1026 1016
Q2.4 Willing to walk to access crossing Pearson Correlation .055 1
Sig. (2-tailed) .081
N 1016 1019
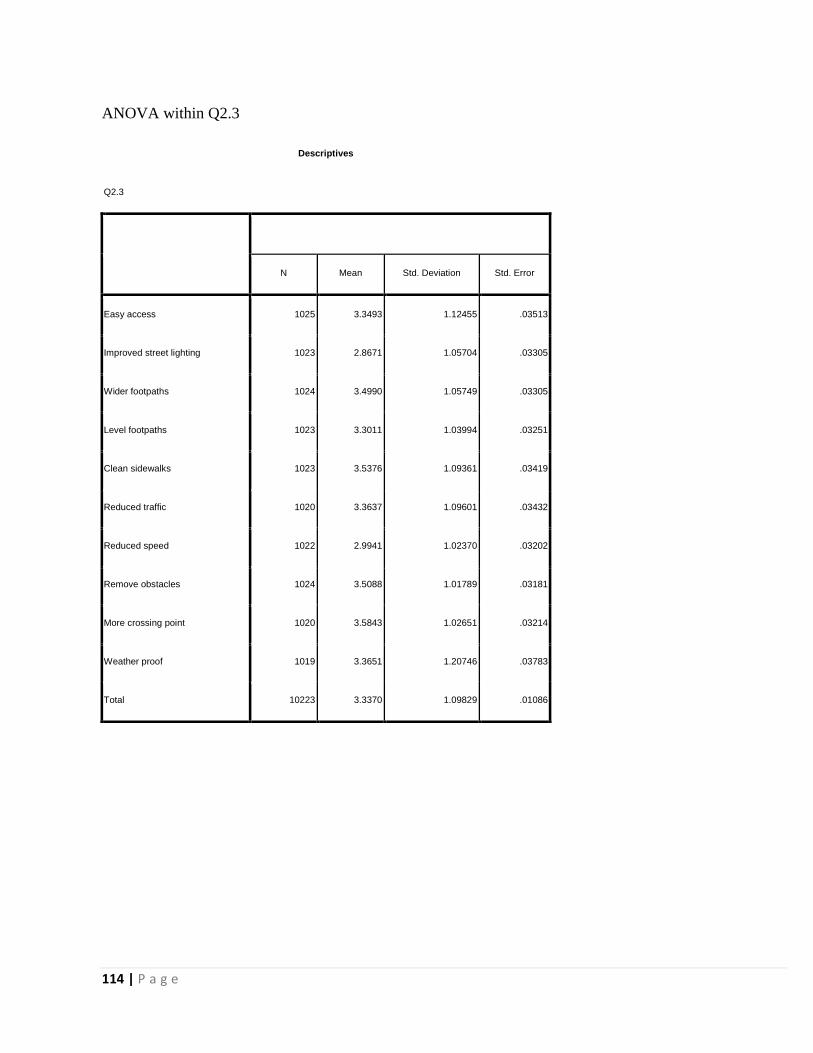
114 | P a g e
ANOVA within Q2.3
Descriptives
Q2.3
N Mean Std. Deviation Std. Error
Easy access 1025 3.3493 1.12455 .03513
Improved street lighting 1023 2.8671 1.05704 .03305
Wider footpaths 1024 3.4990 1.05749 .03305
Level footpaths 1023 3.3011 1.03994 .03251
Clean sidewalks 1023 3.5376 1.09361 .03419
Reduced traffic 1020 3.3637 1.09601 .03432
Reduced speed 1022 2.9941 1.02370 .03202
Remove obstacles 1024 3.5088 1.01789 .03181
More crossing point 1020 3.5843 1.02651 .03214
Weather proof 1019 3.3651 1.20746 .03783
Total 10223 3.3370 1.09829 .01086
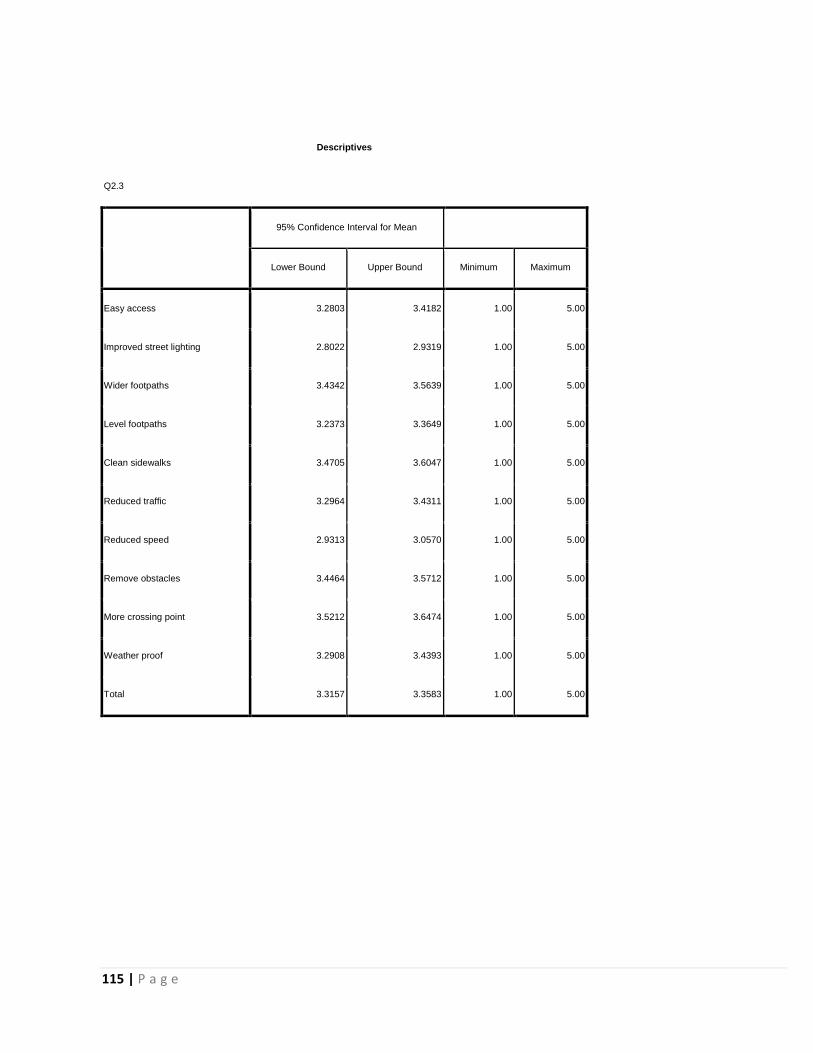
115 | P a g e
Descriptives
Q2.3
95% Confidence Interval for Mean
Lower Bound Upper Bound Minimum Maximum
Easy access 3.2803 3.4182 1.00 5.00
Improved street lighting 2.8022 2.9319 1.00 5.00
Wider footpaths 3.4342 3.5639 1.00 5.00
Level footpaths 3.2373 3.3649 1.00 5.00
Clean sidewalks 3.4705 3.6047 1.00 5.00
Reduced traffic 3.2964 3.4311 1.00 5.00
Reduced speed 2.9313 3.0570 1.00 5.00
Remove obstacles 3.4464 3.5712 1.00 5.00
More crossing point 3.5212 3.6474 1.00 5.00
Weather proof 3.2908 3.4393 1.00 5.00
Total 3.3157 3.3583 1.00 5.00
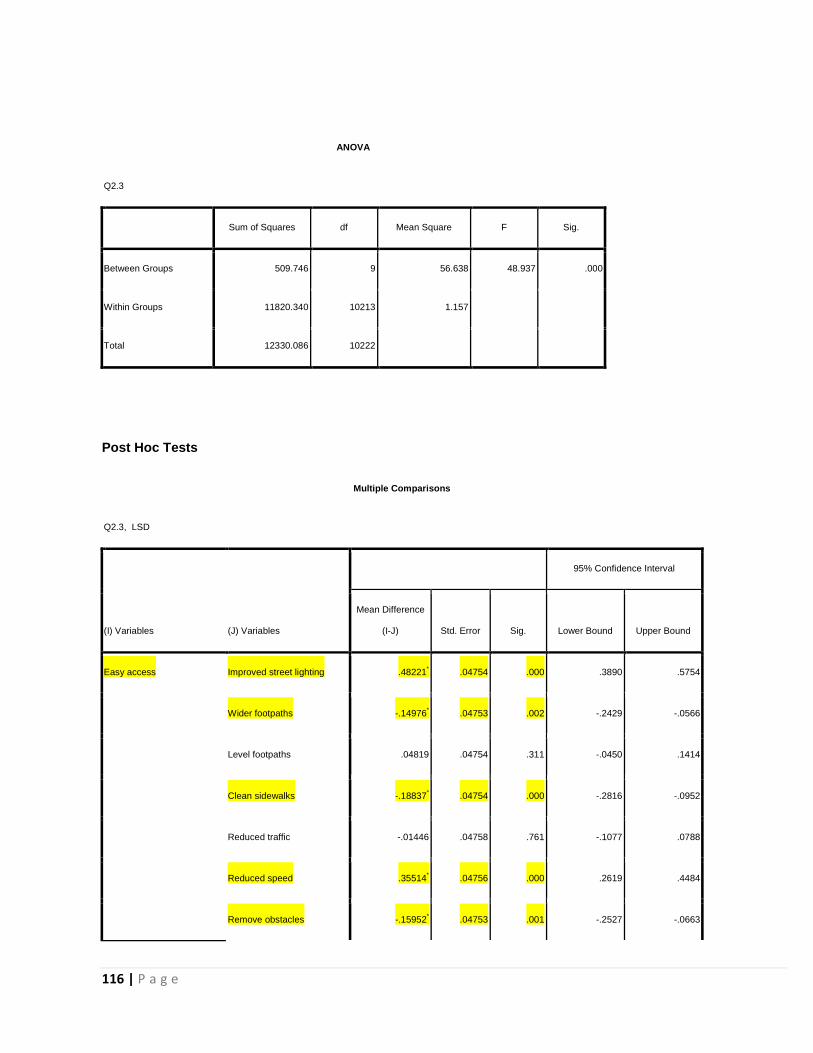
116 | P a g e
ANOVA
Q2.3
Sum of Squares df Mean Square F Sig.
Between Groups 509.746 9 56.638 48.937 .000
Within Groups 11820.340 10213 1.157
Total 12330.086 10222
Post Hoc Tests
Multiple Comparisons
Q2.3, LSD
(I) Variables (J) Variables
95% Confidence Interval
Mean Difference
(I-J) Std. Error Sig. Lower Bound Upper Bound
Easy access Improved street lighting .48221* .04754 .000 .3890 .5754
Wider footpaths -.14976* .04753 .002 -.2429 -.0566
Level footpaths .04819 .04754 .311 -.0450 .1414
Clean sidewalks -.18837* .04754 .000 -.2816 -.0952
Reduced traffic -.01446 .04758 .761 -.1077 .0788
Reduced speed .35514* .04756 .000 .2619 .4484
Remove obstacles -.15952* .04753 .001 -.2527 -.0663
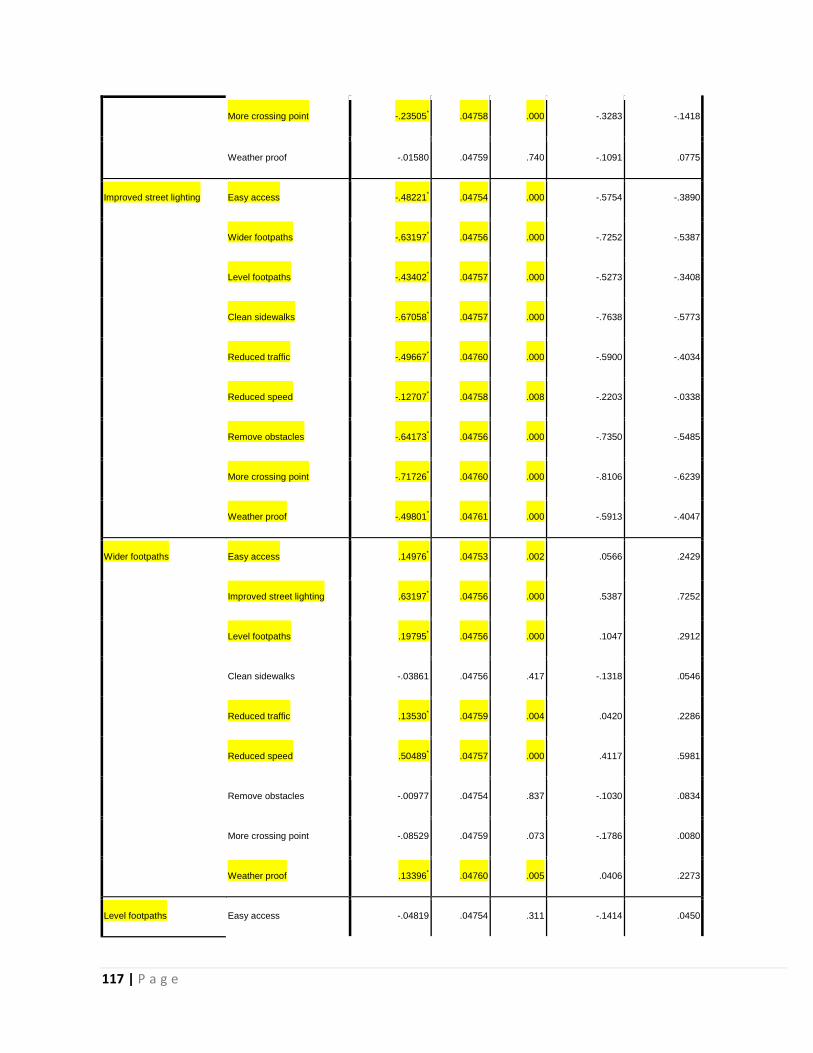
117 | P a g e
More crossing point -.23505* .04758 .000 -.3283 -.1418
Weather proof -.01580 .04759 .740 -.1091 .0775
Improved street lighting Easy access -.48221* .04754 .000 -.5754 -.3890
Wider footpaths -.63197* .04756 .000 -.7252 -.5387
Level footpaths -.43402* .04757 .000 -.5273 -.3408
Clean sidewalks -.67058* .04757 .000 -.7638 -.5773
Reduced traffic -.49667* .04760 .000 -.5900 -.4034
Reduced speed -.12707* .04758 .008 -.2203 -.0338
Remove obstacles -.64173* .04756 .000 -.7350 -.5485
More crossing point -.71726* .04760 .000 -.8106 -.6239
Weather proof -.49801* .04761 .000 -.5913 -.4047
Wider footpaths Easy access .14976* .04753 .002 .0566 .2429
Improved street lighting .63197* .04756 .000 .5387 .7252
Level footpaths .19795* .04756 .000 .1047 .2912
Clean sidewalks -.03861 .04756 .417 -.1318 .0546
Reduced traffic .13530* .04759 .004 .0420 .2286
Reduced speed .50489* .04757 .000 .4117 .5981
Remove obstacles -.00977 .04754 .837 -.1030 .0834
More crossing point -.08529 .04759 .073 -.1786 .0080
Weather proof .13396* .04760 .005 .0406 .2273
Level footpaths Easy access -.04819 .04754 .311 -.1414 .0450
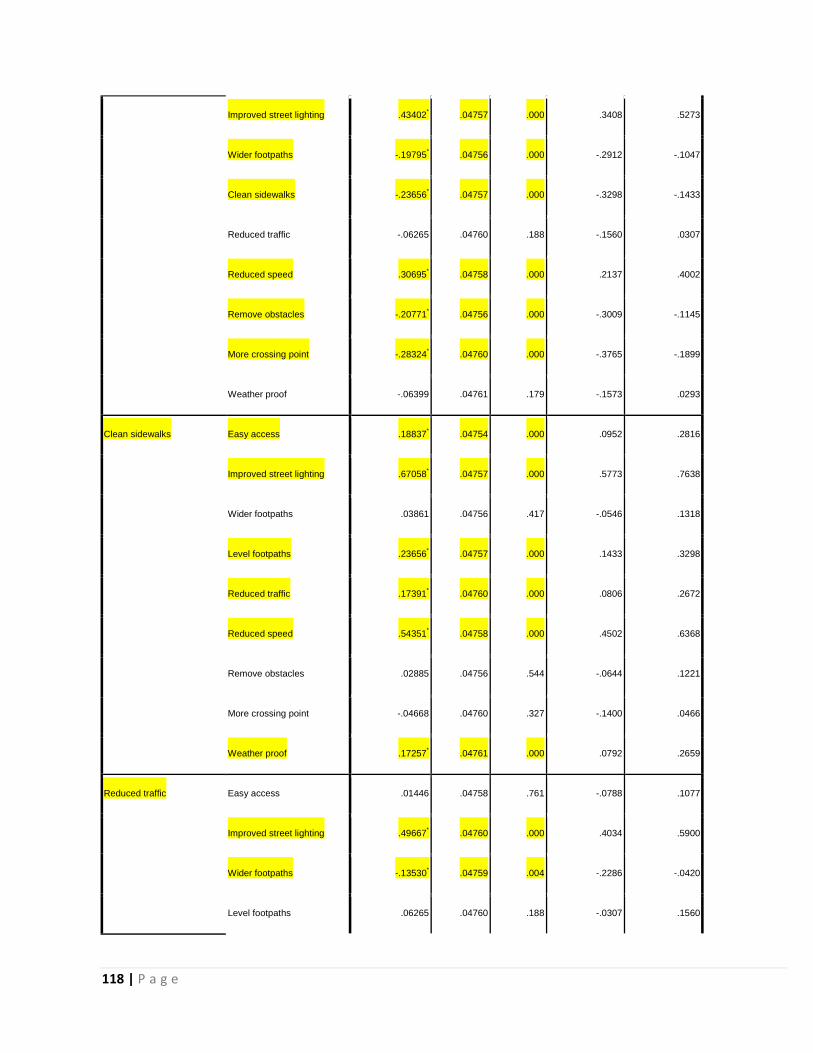
118 | P a g e
Improved street lighting .43402* .04757 .000 .3408 .5273
Wider footpaths -.19795* .04756 .000 -.2912 -.1047
Clean sidewalks -.23656* .04757 .000 -.3298 -.1433
Reduced traffic -.06265 .04760 .188 -.1560 .0307
Reduced speed .30695* .04758 .000 .2137 .4002
Remove obstacles -.20771* .04756 .000 -.3009 -.1145
More crossing point -.28324* .04760 .000 -.3765 -.1899
Weather proof -.06399 .04761 .179 -.1573 .0293
Clean sidewalks Easy access .18837* .04754 .000 .0952 .2816
Improved street lighting .67058* .04757 .000 .5773 .7638
Wider footpaths .03861 .04756 .417 -.0546 .1318
Level footpaths .23656* .04757 .000 .1433 .3298
Reduced traffic .17391* .04760 .000 .0806 .2672
Reduced speed .54351* .04758 .000 .4502 .6368
Remove obstacles .02885 .04756 .544 -.0644 .1221
More crossing point -.04668 .04760 .327 -.1400 .0466
Weather proof .17257* .04761 .000 .0792 .2659
Reduced traffic Easy access .01446 .04758 .761 -.0788 .1077
Improved street lighting .49667* .04760 .000 .4034 .5900
Wider footpaths -.13530* .04759 .004 -.2286 -.0420
Level footpaths .06265 .04760 .188 -.0307 .1560
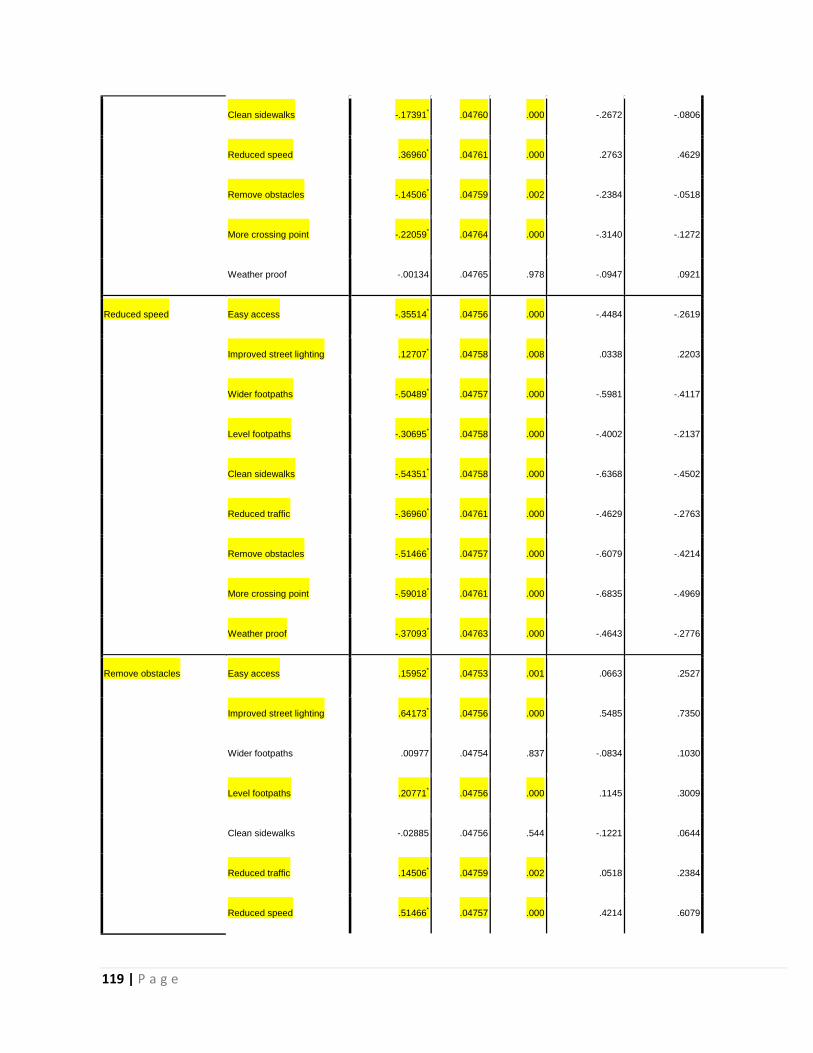
119 | P a g e
Clean sidewalks -.17391* .04760 .000 -.2672 -.0806
Reduced speed .36960* .04761 .000 .2763 .4629
Remove obstacles -.14506* .04759 .002 -.2384 -.0518
More crossing point -.22059* .04764 .000 -.3140 -.1272
Weather proof -.00134 .04765 .978 -.0947 .0921
Reduced speed Easy access -.35514* .04756 .000 -.4484 -.2619
Improved street lighting .12707* .04758 .008 .0338 .2203
Wider footpaths -.50489* .04757 .000 -.5981 -.4117
Level footpaths -.30695* .04758 .000 -.4002 -.2137
Clean sidewalks -.54351* .04758 .000 -.6368 -.4502
Reduced traffic -.36960* .04761 .000 -.4629 -.2763
Remove obstacles -.51466* .04757 .000 -.6079 -.4214
More crossing point -.59018* .04761 .000 -.6835 -.4969
Weather proof -.37093* .04763 .000 -.4643 -.2776
Remove obstacles Easy access .15952* .04753 .001 .0663 .2527
Improved street lighting .64173* .04756 .000 .5485 .7350
Wider footpaths .00977 .04754 .837 -.0834 .1030
Level footpaths .20771* .04756 .000 .1145 .3009
Clean sidewalks -.02885 .04756 .544 -.1221 .0644
Reduced traffic .14506* .04759 .002 .0518 .2384
Reduced speed .51466* .04757 .000 .4214 .6079
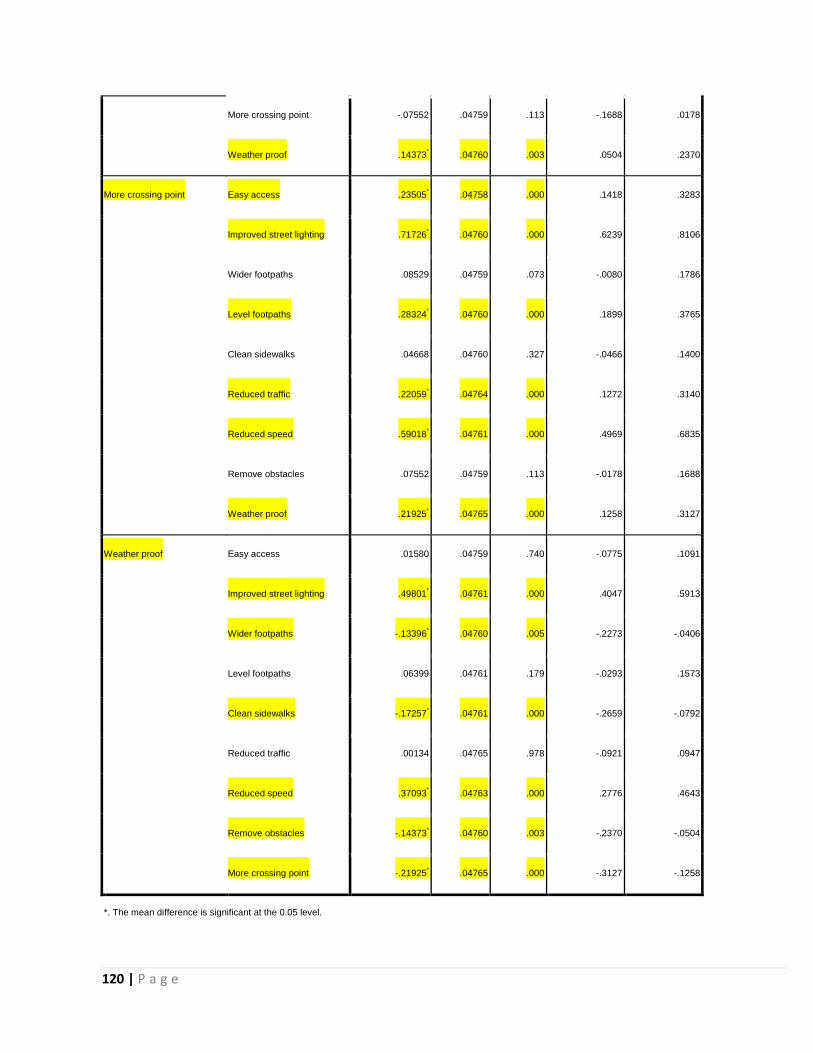
120 | P a g e
More crossing point -.07552 .04759 .113 -.1688 .0178
Weather proof .14373* .04760 .003 .0504 .2370
More crossing point Easy access .23505* .04758 .000 .1418 .3283
Improved street lighting .71726* .04760 .000 .6239 .8106
Wider footpaths .08529 .04759 .073 -.0080 .1786
Level footpaths .28324* .04760 .000 .1899 .3765
Clean sidewalks .04668 .04760 .327 -.0466 .1400
Reduced traffic .22059* .04764 .000 .1272 .3140
Reduced speed .59018* .04761 .000 .4969 .6835
Remove obstacles .07552 .04759 .113 -.0178 .1688
Weather proof .21925* .04765 .000 .1258 .3127
Weather proof Easy access .01580 .04759 .740 -.0775 .1091
Improved street lighting .49801* .04761 .000 .4047 .5913
Wider footpaths -.13396* .04760 .005 -.2273 -.0406
Level footpaths .06399 .04761 .179 -.0293 .1573
Clean sidewalks -.17257* .04761 .000 -.2659 -.0792
Reduced traffic .00134 .04765 .978 -.0921 .0947
Reduced speed .37093* .04763 .000 .2776 .4643
Remove obstacles -.14373* .04760 .003 -.2370 -.0504
More crossing point -.21925* .04765 .000 -.3127 -.1258
*. The mean difference is significant at the 0.05 level.
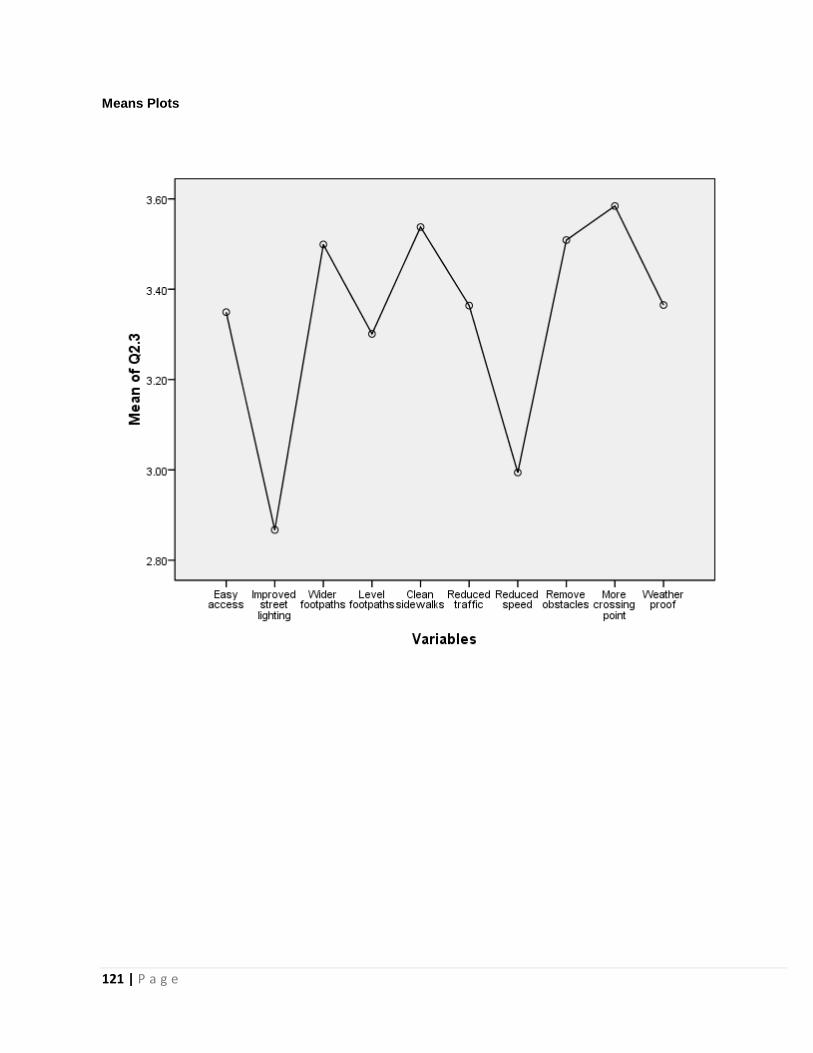
121 | P a g e
Means Plots
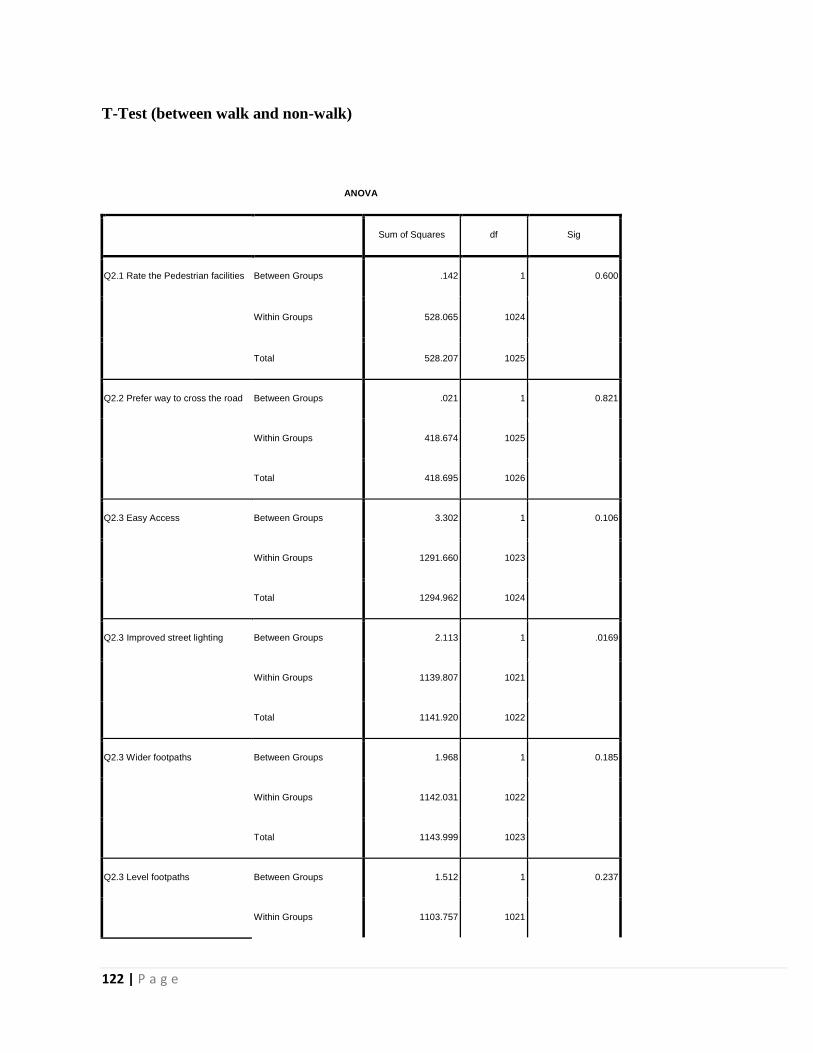
122 | P a g e
T-Test (between walk and non-walk)
ANOVA
Sum of Squares df Sig
Q2.1 Rate the Pedestrian facilities Between Groups .142 1 0.600
Within Groups 528.065 1024
Total 528.207 1025
Q2.2 Prefer way to cross the road Between Groups .021 1 0.821
Within Groups 418.674 1025
Total 418.695 1026
Q2.3 Easy Access Between Groups 3.302 1 0.106
Within Groups 1291.660 1023
Total 1294.962 1024
Q2.3 Improved street lighting Between Groups 2.113 1 .0169
Within Groups 1139.807 1021
Total 1141.920 1022
Q2.3 Wider footpaths Between Groups 1.968 1 0.185
Within Groups 1142.031 1022
Total 1143.999 1023
Q2.3 Level footpaths Between Groups 1.512 1 0.237
Within Groups 1103.757 1021
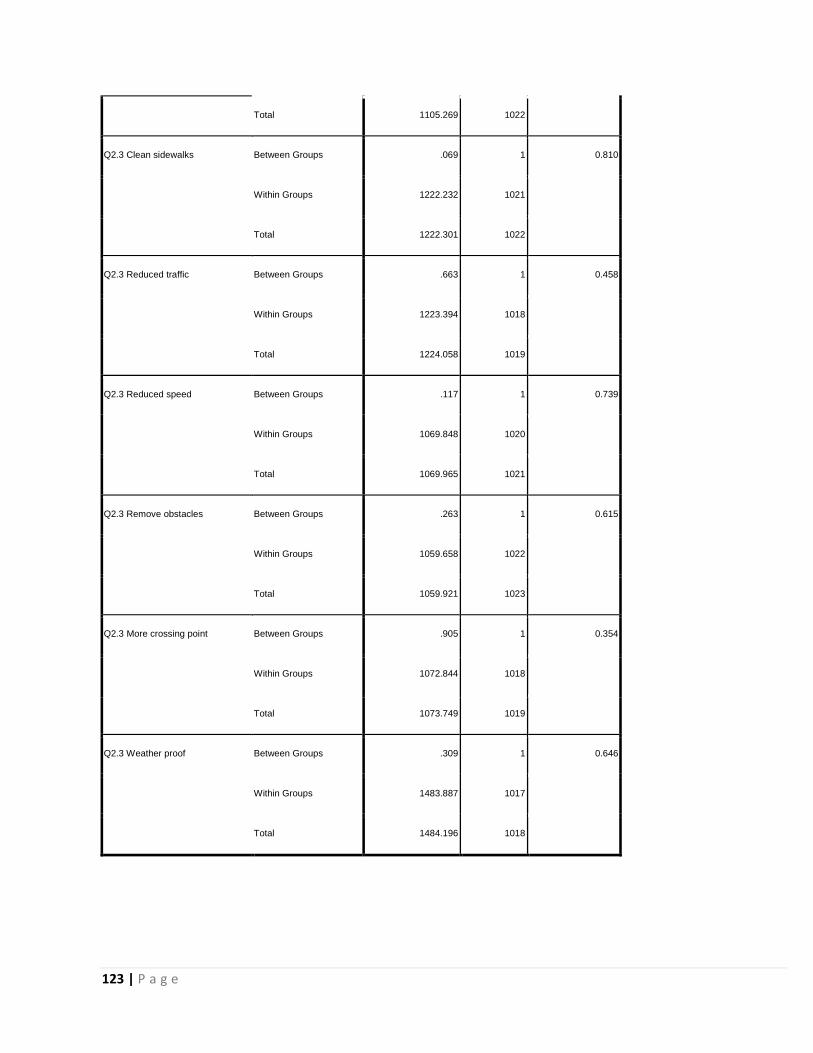
123 | P a g e
Total 1105.269 1022
Q2.3 Clean sidewalks Between Groups .069 1 0.810
Within Groups 1222.232 1021
Total 1222.301 1022
Q2.3 Reduced traffic Between Groups .663 1 0.458
Within Groups 1223.394 1018
Total 1224.058 1019
Q2.3 Reduced speed Between Groups .117 1 0.739
Within Groups 1069.848 1020
Total 1069.965 1021
Q2.3 Remove obstacles Between Groups .263 1 0.615
Within Groups 1059.658 1022
Total 1059.921 1023
Q2.3 More crossing point Between Groups .905 1 0.354
Within Groups 1072.844 1018
Total 1073.749 1019
Q2.3 Weather proof Between Groups .309 1 0.646
Within Groups 1483.887 1017
Total 1484.196 1018
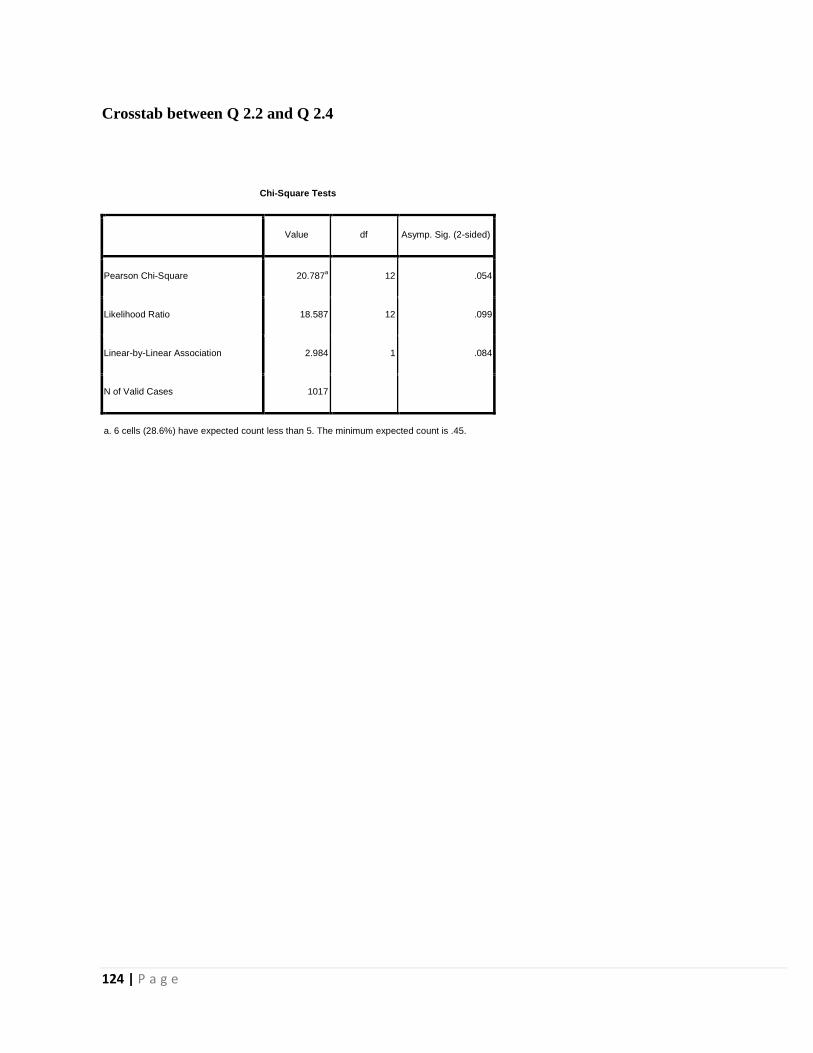
124 | P a g e
Crosstab between Q 2.2 and Q 2.4
Chi-Square Tests
Value df Asymp. Sig. (2-sided)
Pearson Chi-Square 20.787a 12 .054
Likelihood Ratio 18.587 12 .099
Linear-by-Linear Association 2.984 1 .084
N of Valid Cases 1017
a. 6 cells (28.6%) have expected count less than 5. The minimum expected count is .45.
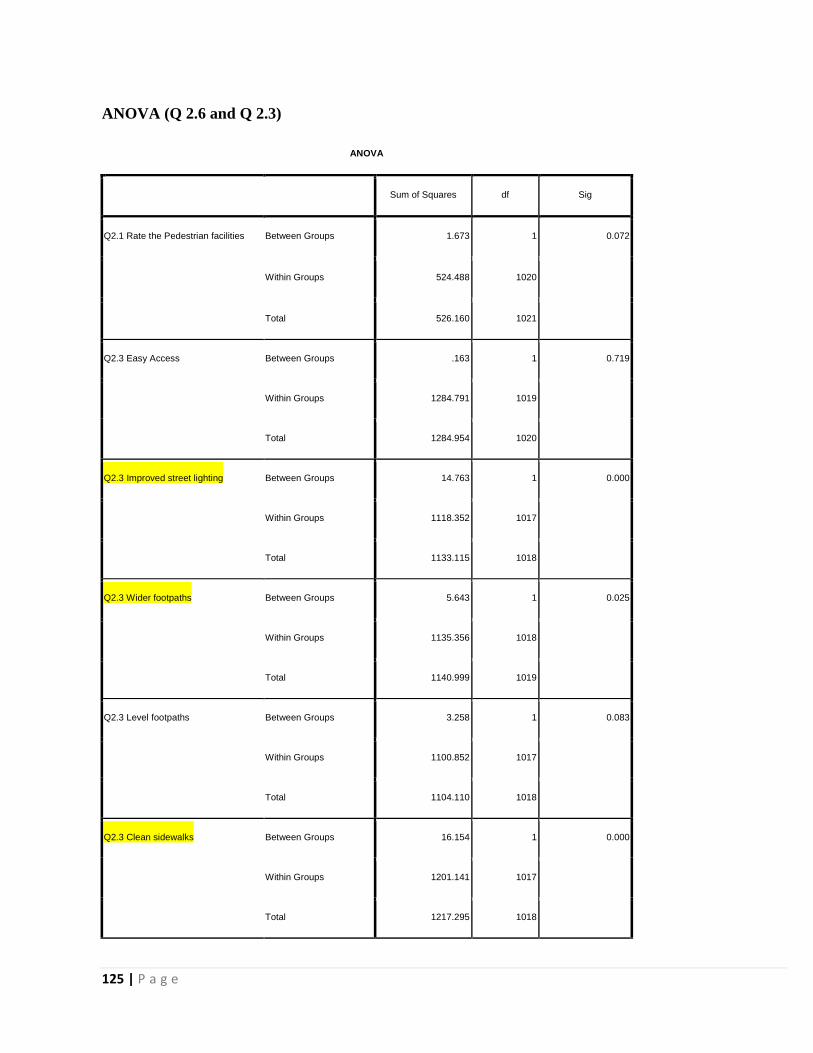
125 | P a g e
ANOVA (Q 2.6 and Q 2.3)
ANOVA
Sum of Squares df Sig
Q2.1 Rate the Pedestrian facilities Between Groups 1.673 1 0.072
Within Groups 524.488 1020
Total 526.160 1021
Q2.3 Easy Access Between Groups .163 1 0.719
Within Groups 1284.791 1019
Total 1284.954 1020
Q2.3 Improved street lighting Between Groups 14.763 1 0.000
Within Groups 1118.352 1017
Total 1133.115 1018
Q2.3 Wider footpaths Between Groups 5.643 1 0.025
Within Groups 1135.356 1018
Total 1140.999 1019
Q2.3 Level footpaths Between Groups 3.258 1 0.083
Within Groups 1100.852 1017
Total 1104.110 1018
Q2.3 Clean sidewalks Between Groups 16.154 1 0.000
Within Groups 1201.141 1017
Total 1217.295 1018
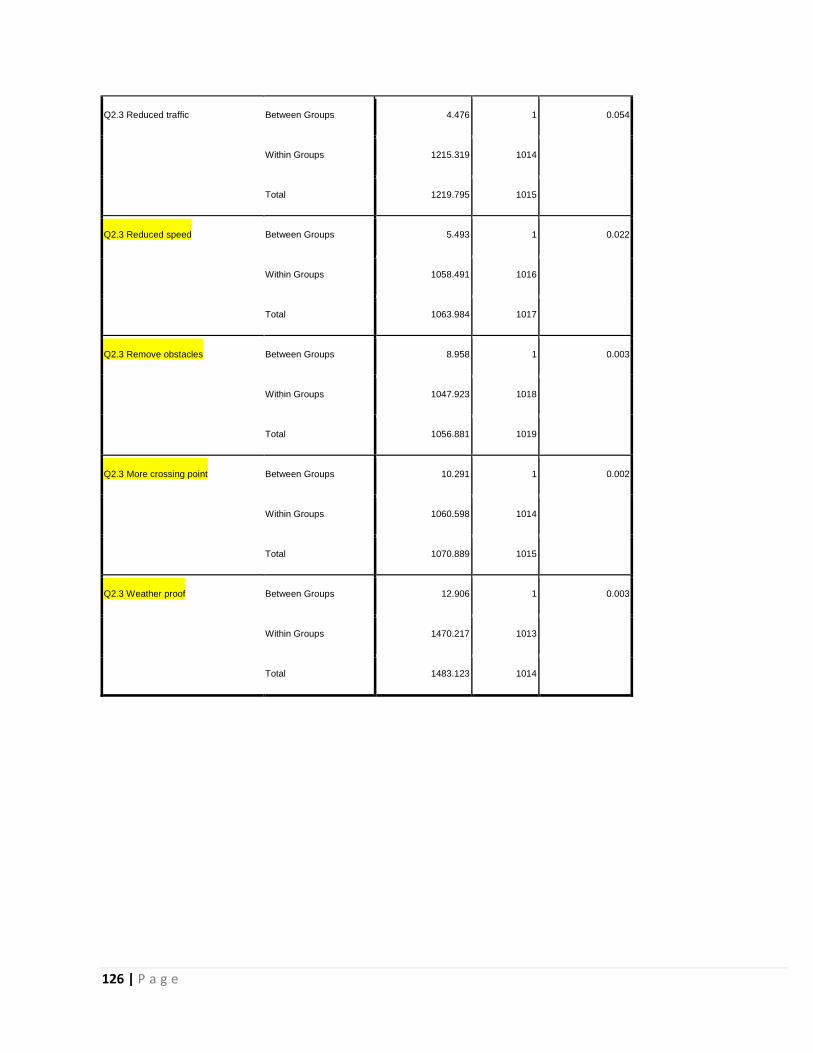
126 | P a g e
Q2.3 Reduced traffic Between Groups 4.476 1 0.054
Within Groups 1215.319 1014
Total 1219.795 1015
Q2.3 Reduced speed Between Groups 5.493 1 0.022
Within Groups 1058.491 1016
Total 1063.984 1017
Q2.3 Remove obstacles Between Groups 8.958 1 0.003
Within Groups 1047.923 1018
Total 1056.881 1019
Q2.3 More crossing point Between Groups 10.291 1 0.002
Within Groups 1060.598 1014
Total 1070.889 1015
Q2.3 Weather proof Between Groups 12.906 1 0.003
Within Groups 1470.217 1013
Total 1483.123 1014
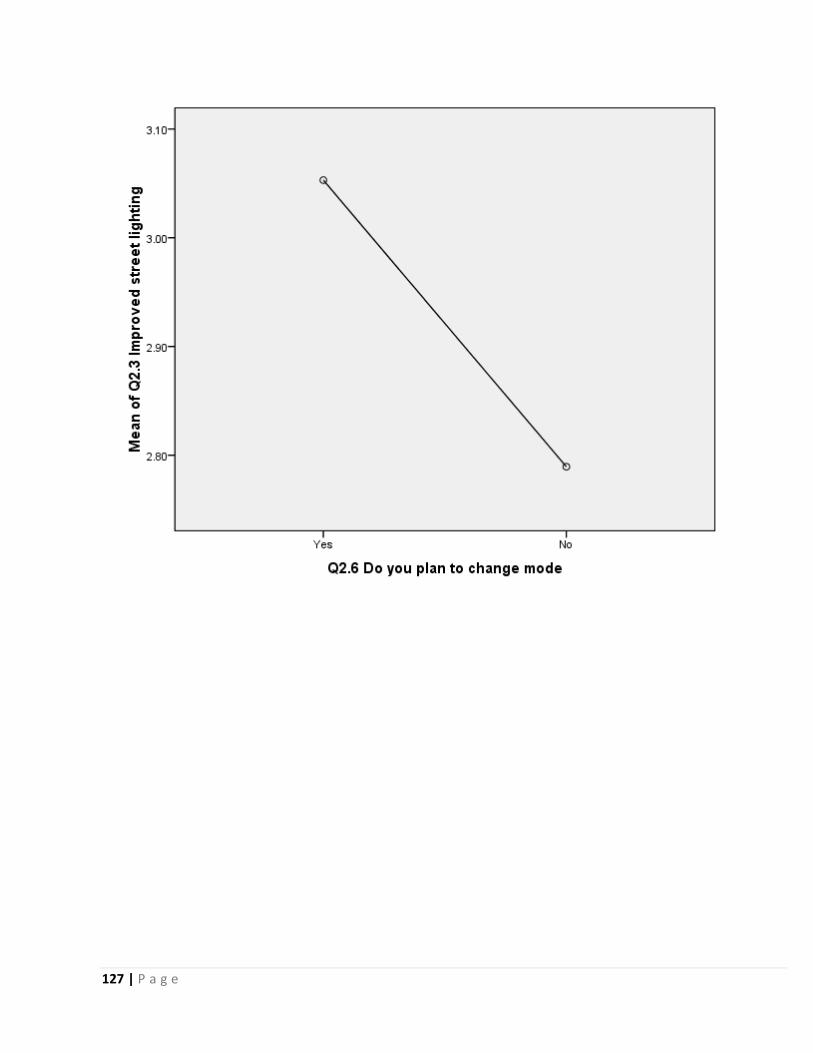
127 | P a g e

128 | P a g e

129 | P a g e
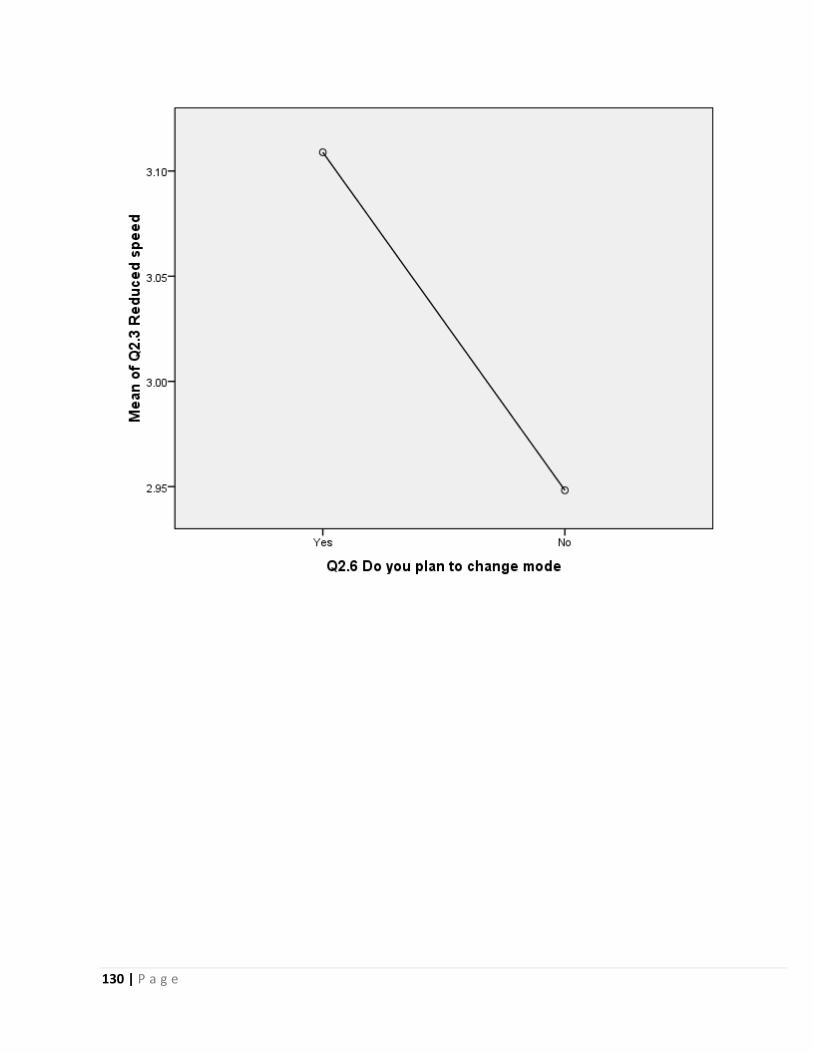
130 | P a g e

131 | P a g e
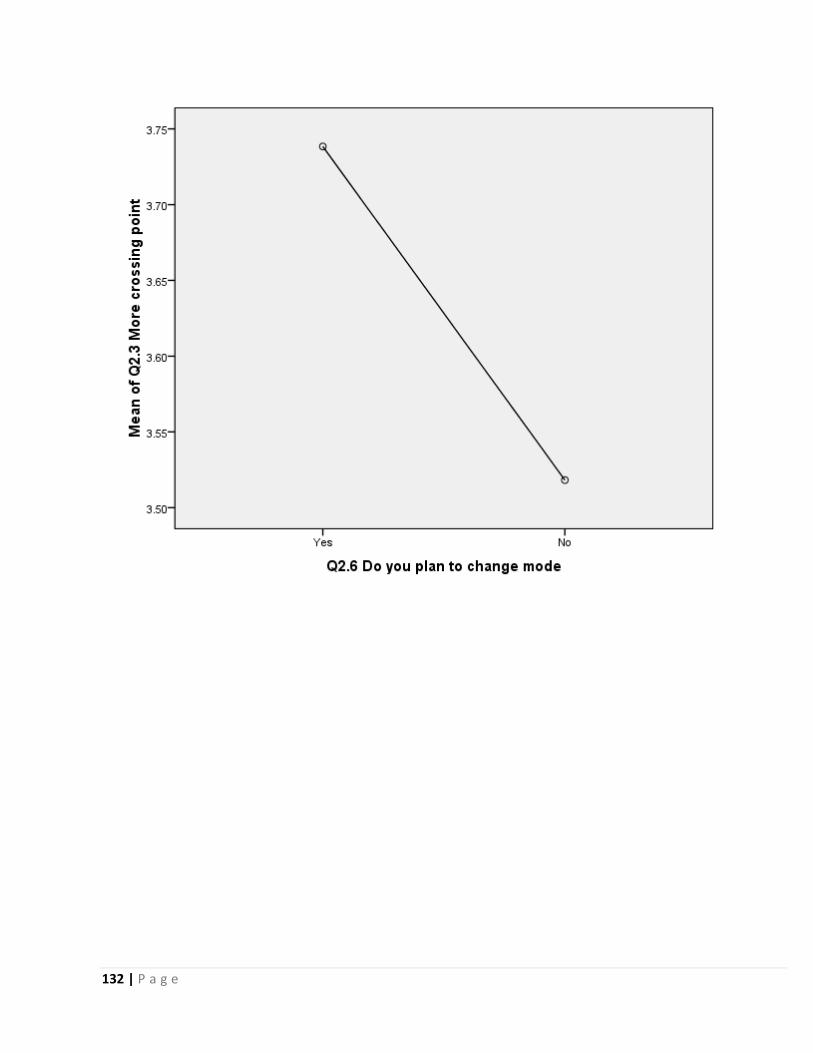
132 | P a g e
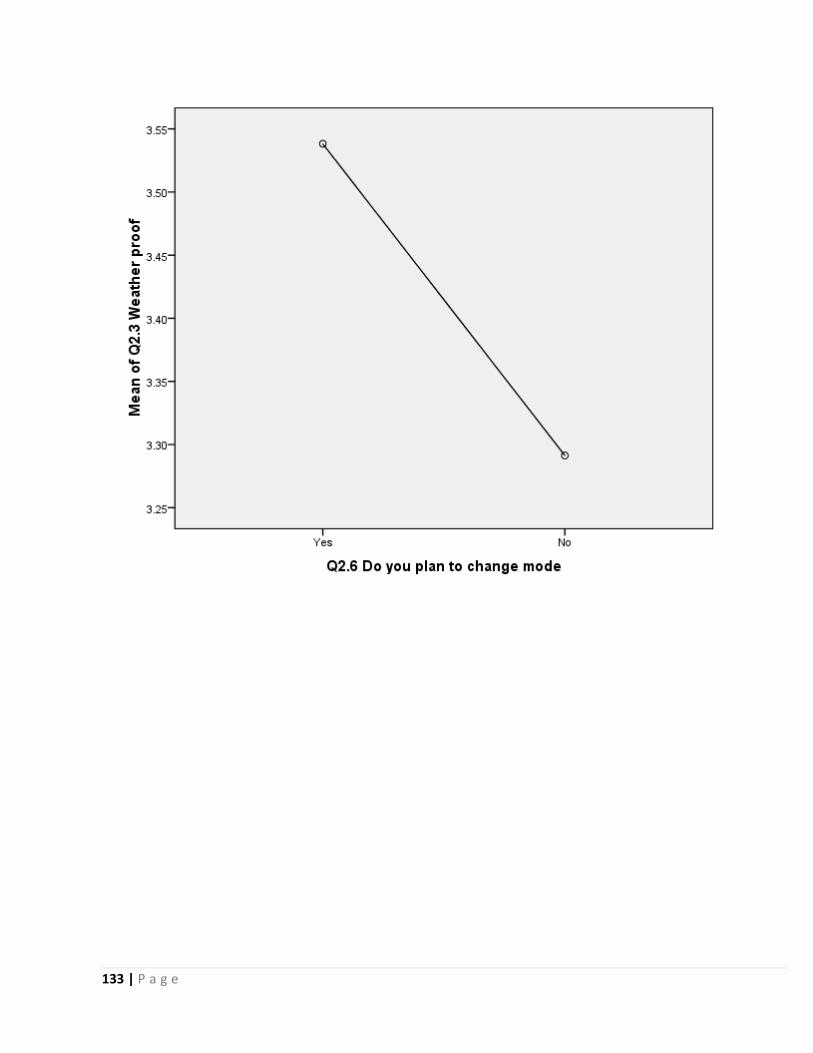
133 | P a g e
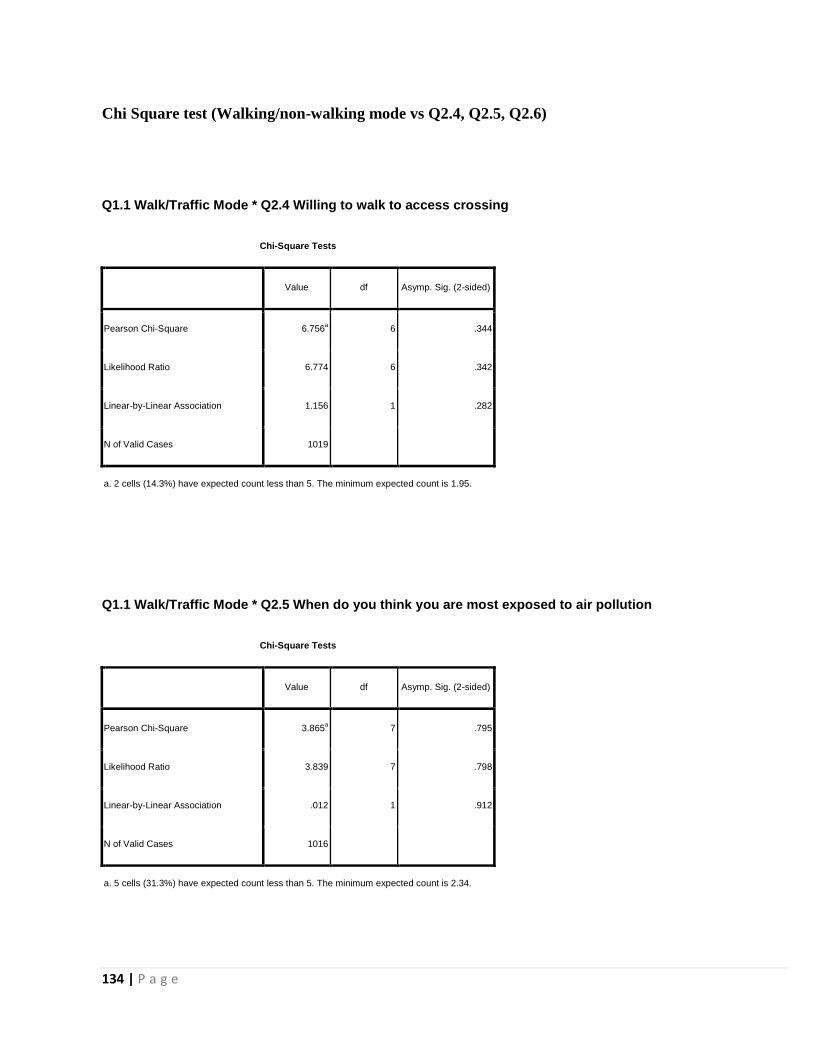
134 | P a g e
Chi Square test (Walking/non-walking mode vs Q2.4, Q2.5, Q2.6)
Q1.1 Walk/Traffic Mode * Q2.4 Willing to walk to access crossing
Chi-Square Tests
Value df Asymp. Sig. (2-sided)
Pearson Chi-Square 6.756a 6 .344
Likelihood Ratio 6.774 6 .342
Linear-by-Linear Association 1.156 1 .282
N of Valid Cases 1019
a. 2 cells (14.3%) have expected count less than 5. The minimum expected count is 1.95.
Q1.1 Walk/Traffic Mode * Q2.5 When do you think you are most exposed to air pollution
Chi-Square Tests
Value df Asymp. Sig. (2-sided)
Pearson Chi-Square 3.865a 7 .795
Likelihood Ratio 3.839 7 .798
Linear-by-Linear Association .012 1 .912
N of Valid Cases 1016
a. 5 cells (31.3%) have expected count less than 5. The minimum expected count is 2.34.
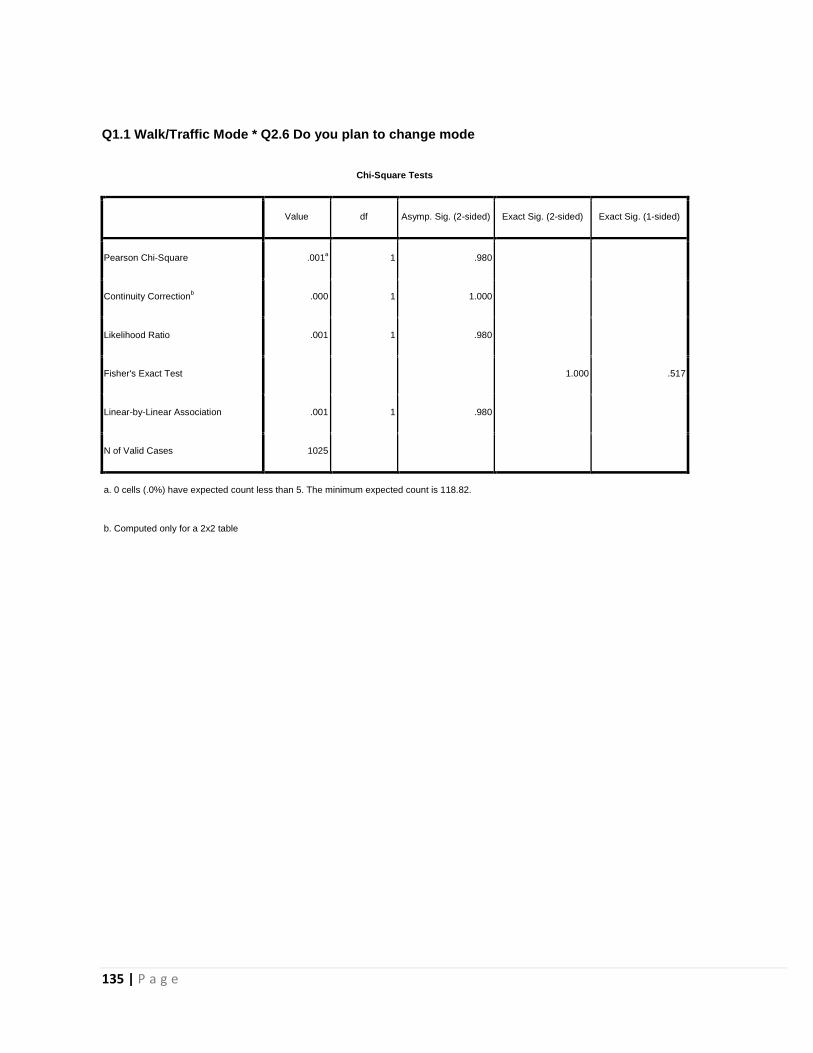
135 | P a g e
Q1.1 Walk/Traffic Mode * Q2.6 Do you plan to change mode
Chi-Square Tests
Value df Asymp. Sig. (2-sided) Exact Sig. (2-sided) Exact Sig. (1-sided)
Pearson Chi-Square .001a 1 .980
Continuity Correctionb .000 1 1.000
Likelihood Ratio .001 1 .980
Fisher's Exact Test
1.000 .517
Linear-by-Linear Association .001 1 .980
N of Valid Cases 1025
a. 0 cells (.0%) have expected count less than 5. The minimum expected count is 118.82.
b. Computed only for a 2x2 table
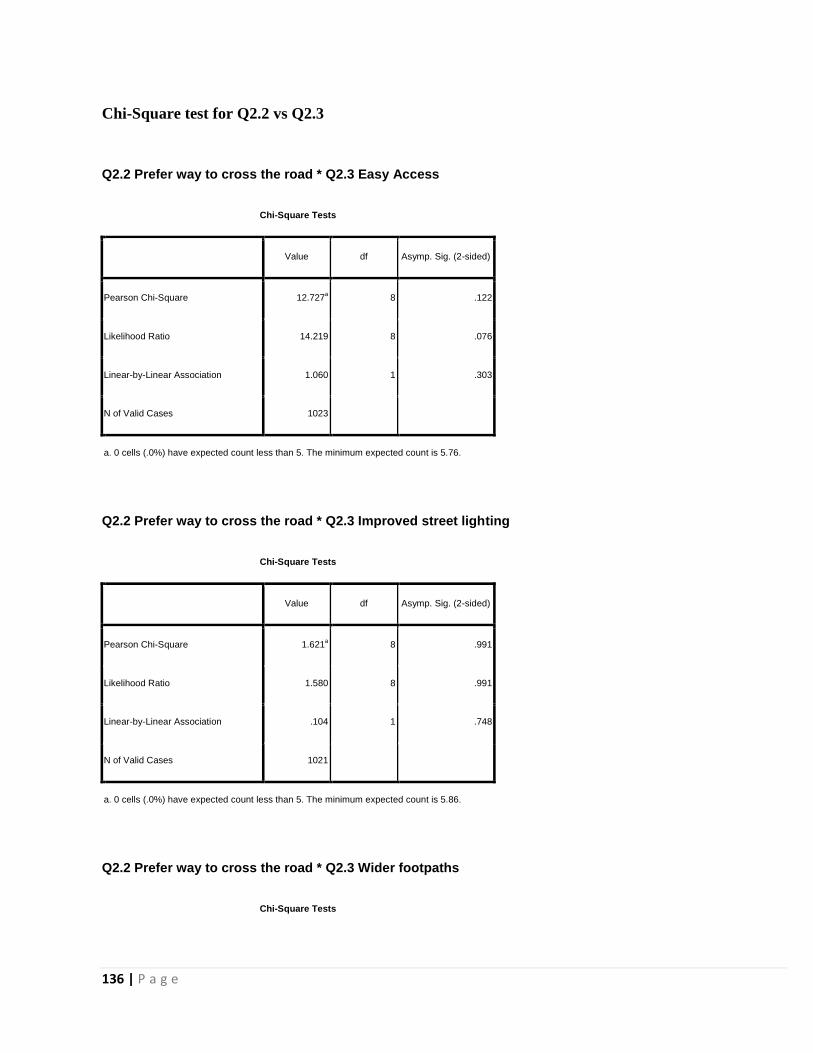
136 | P a g e
Chi-Square test for Q2.2 vs Q2.3
Q2.2 Prefer way to cross the road * Q2.3 Easy Access
Chi-Square Tests
Value df Asymp. Sig. (2-sided)
Pearson Chi-Square 12.727a 8 .122
Likelihood Ratio 14.219 8 .076
Linear-by-Linear Association 1.060 1 .303
N of Valid Cases 1023
a. 0 cells (.0%) have expected count less than 5. The minimum expected count is 5.76.
Q2.2 Prefer way to cross the road * Q2.3 Improved street lighting
Chi-Square Tests
Value df Asymp. Sig. (2-sided)
Pearson Chi-Square 1.621a 8 .991
Likelihood Ratio 1.580 8 .991
Linear-by-Linear Association .104 1 .748
N of Valid Cases 1021
a. 0 cells (.0%) have expected count less than 5. The minimum expected count is 5.86.
Q2.2 Prefer way to cross the road * Q2.3 Wider footpaths
Chi-Square Tests
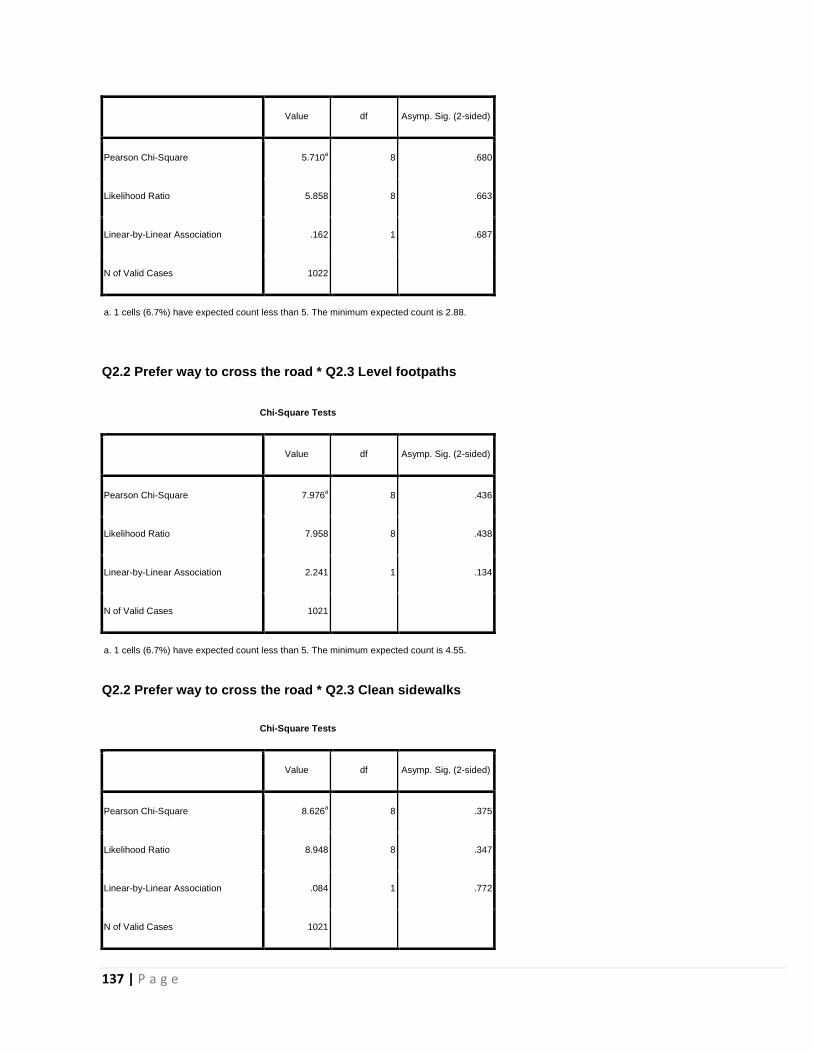
137 | P a g e
Value df Asymp. Sig. (2-sided)
Pearson Chi-Square 5.710a 8 .680
Likelihood Ratio 5.858 8 .663
Linear-by-Linear Association .162 1 .687
N of Valid Cases 1022
a. 1 cells (6.7%) have expected count less than 5. The minimum expected count is 2.88.
Q2.2 Prefer way to cross the road * Q2.3 Level footpaths
Chi-Square Tests
Value df Asymp. Sig. (2-sided)
Pearson Chi-Square 7.976a 8 .436
Likelihood Ratio 7.958 8 .438
Linear-by-Linear Association 2.241 1 .134
N of Valid Cases 1021
a. 1 cells (6.7%) have expected count less than 5. The minimum expected count is 4.55.
Q2.2 Prefer way to cross the road * Q2.3 Clean sidewalks
Chi-Square Tests
Value df Asymp. Sig. (2-sided)
Pearson Chi-Square 8.626a 8 .375
Likelihood Ratio 8.948 8 .347
Linear-by-Linear Association .084 1 .772
N of Valid Cases 1021
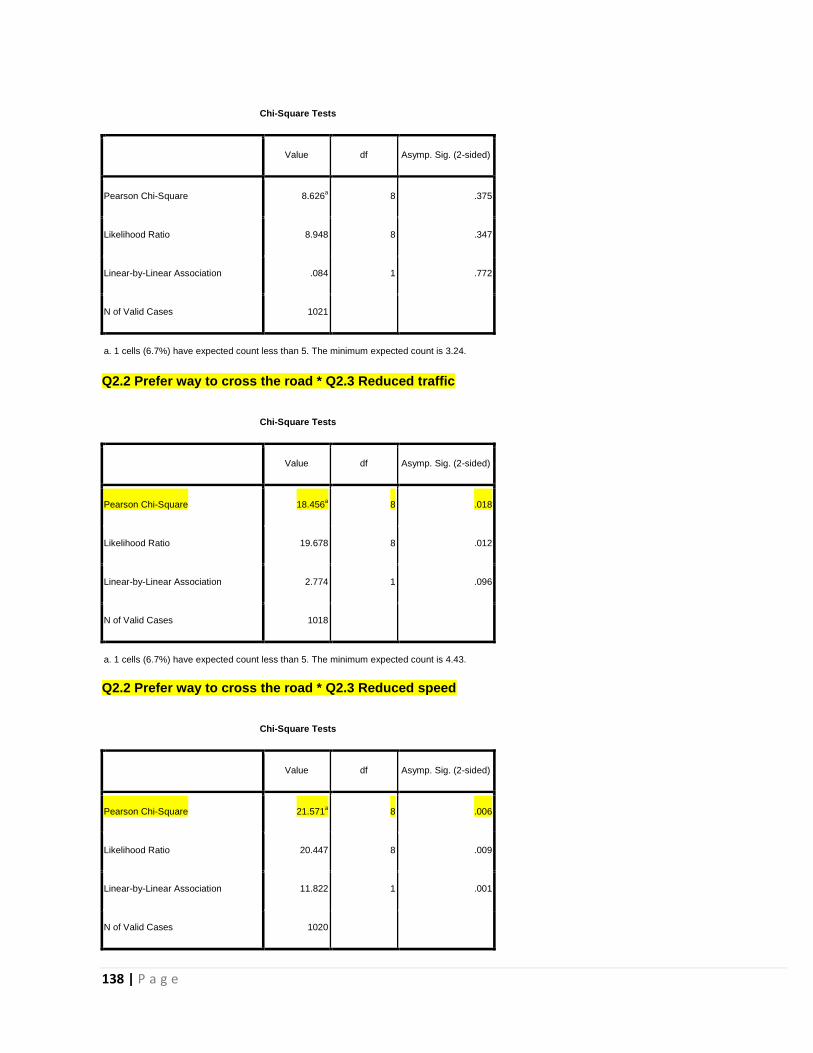
138 | P a g e
Chi-Square Tests
Value df Asymp. Sig. (2-sided)
Pearson Chi-Square 8.626a 8 .375
Likelihood Ratio 8.948 8 .347
Linear-by-Linear Association .084 1 .772
N of Valid Cases 1021
a. 1 cells (6.7%) have expected count less than 5. The minimum expected count is 3.24.
Q2.2 Prefer way to cross the road * Q2.3 Reduced traffic
Chi-Square Tests
Value df Asymp. Sig. (2-sided)
Pearson Chi-Square 18.456a 8 .018
Likelihood Ratio 19.678 8 .012
Linear-by-Linear Association 2.774 1 .096
N of Valid Cases 1018
a. 1 cells (6.7%) have expected count less than 5. The minimum expected count is 4.43.
Q2.2 Prefer way to cross the road * Q2.3 Reduced speed
Chi-Square Tests
Value df Asymp. Sig. (2-sided)
Pearson Chi-Square 21.571a 8 .006
Likelihood Ratio 20.447 8 .009
Linear-by-Linear Association 11.822 1 .001
N of Valid Cases 1020
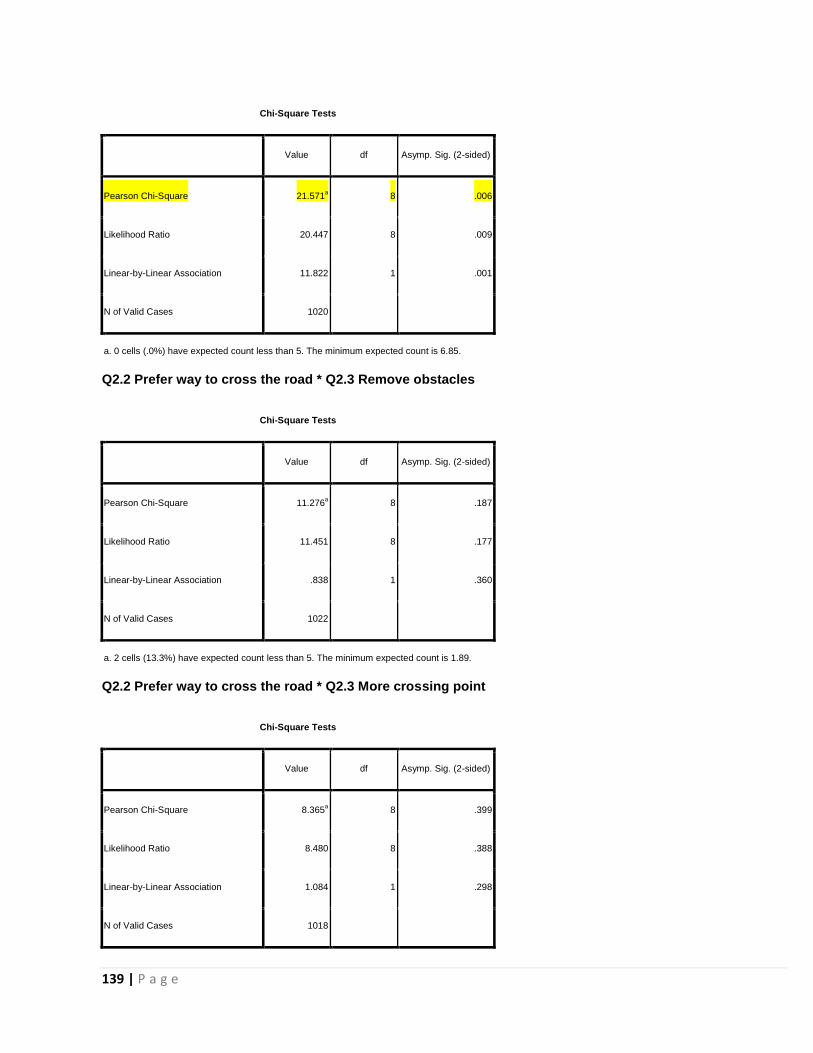
139 | P a g e
Chi-Square Tests
Value df Asymp. Sig. (2-sided)
Pearson Chi-Square 21.571a 8 .006
Likelihood Ratio 20.447 8 .009
Linear-by-Linear Association 11.822 1 .001
N of Valid Cases 1020
a. 0 cells (.0%) have expected count less than 5. The minimum expected count is 6.85.
Q2.2 Prefer way to cross the road * Q2.3 Remove obstacles
Chi-Square Tests
Value df Asymp. Sig. (2-sided)
Pearson Chi-Square 11.276a 8 .187
Likelihood Ratio 11.451 8 .177
Linear-by-Linear Association .838 1 .360
N of Valid Cases 1022
a. 2 cells (13.3%) have expected count less than 5. The minimum expected count is 1.89.
Q2.2 Prefer way to cross the road * Q2.3 More crossing point
Chi-Square Tests
Value df Asymp. Sig. (2-sided)
Pearson Chi-Square 8.365a 8 .399
Likelihood Ratio 8.480 8 .388
Linear-by-Linear Association 1.084 1 .298
N of Valid Cases 1018
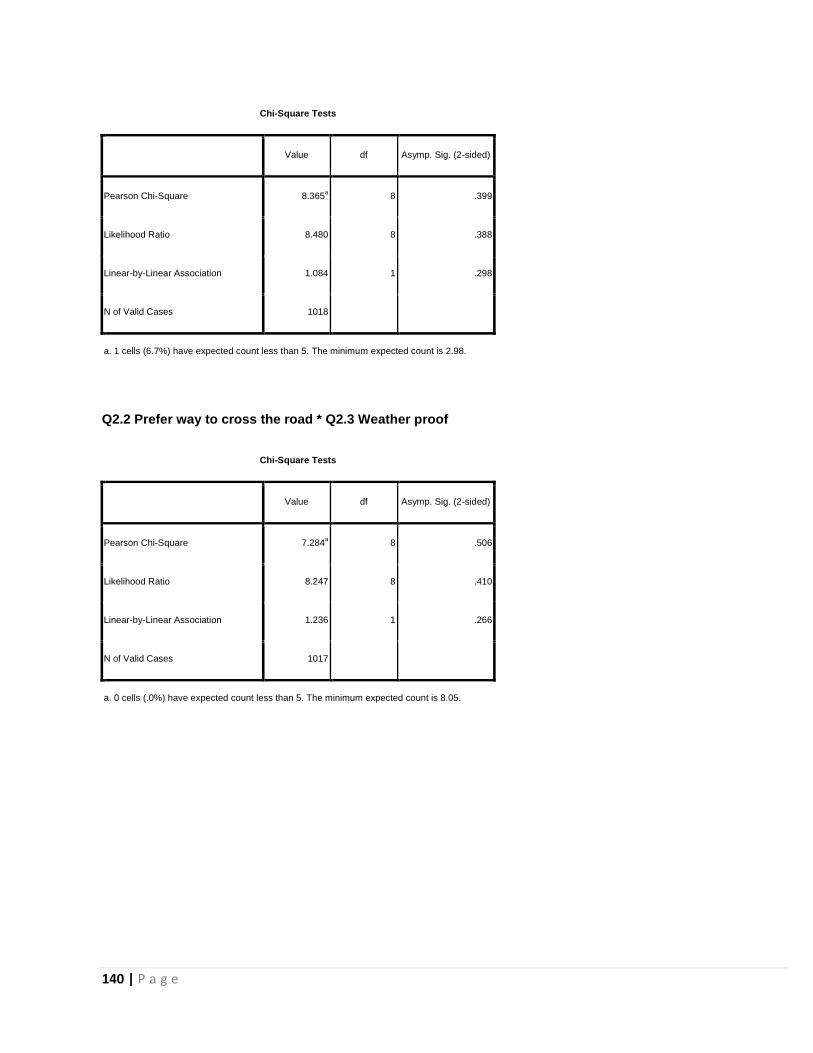
140 | P a g e
Chi-Square Tests
Value df Asymp. Sig. (2-sided)
Pearson Chi-Square 8.365a 8 .399
Likelihood Ratio 8.480 8 .388
Linear-by-Linear Association 1.084 1 .298
N of Valid Cases 1018
a. 1 cells (6.7%) have expected count less than 5. The minimum expected count is 2.98.
Q2.2 Prefer way to cross the road * Q2.3 Weather proof
Chi-Square Tests
Value df Asymp. Sig. (2-sided)
Pearson Chi-Square 7.284a 8 .506
Likelihood Ratio 8.247 8 .410
Linear-by-Linear Association 1.236 1 .266
N of Valid Cases 1017
a. 0 cells (.0%) have expected count less than 5. The minimum expected count is 8.05.
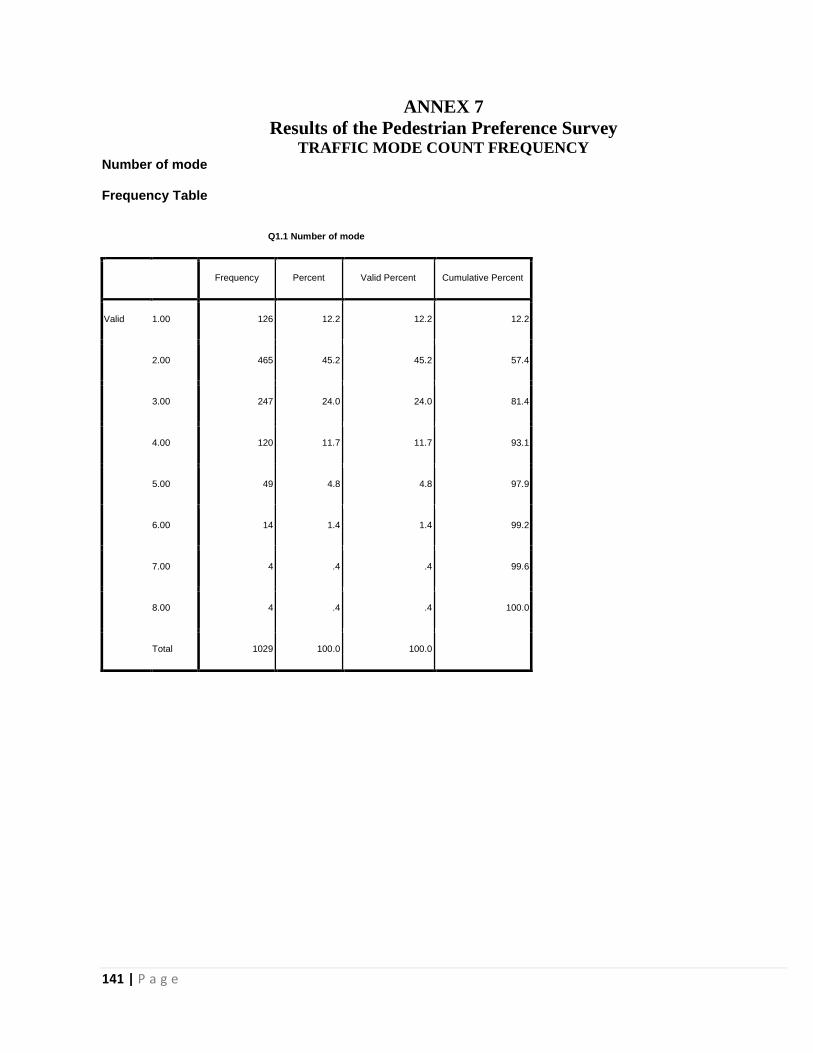
141 | P a g e
ANNEX 7
Results of the Pedestrian Preference Survey TRAFFIC MODE COUNT FREQUENCY
Number of mode
Frequency Table
Q1.1 Number of mode
Frequency Percent Valid Percent Cumulative Percent
Valid 1.00 126 12.2 12.2 12.2
2.00 465 45.2 45.2 57.4
3.00 247 24.0 24.0 81.4
4.00 120 11.7 11.7 93.1
5.00 49 4.8 4.8 97.9
6.00 14 1.4 1.4 99.2
7.00 4 .4 .4 99.6
8.00 4 .4 .4 100.0
Total 1029 100.0 100.0
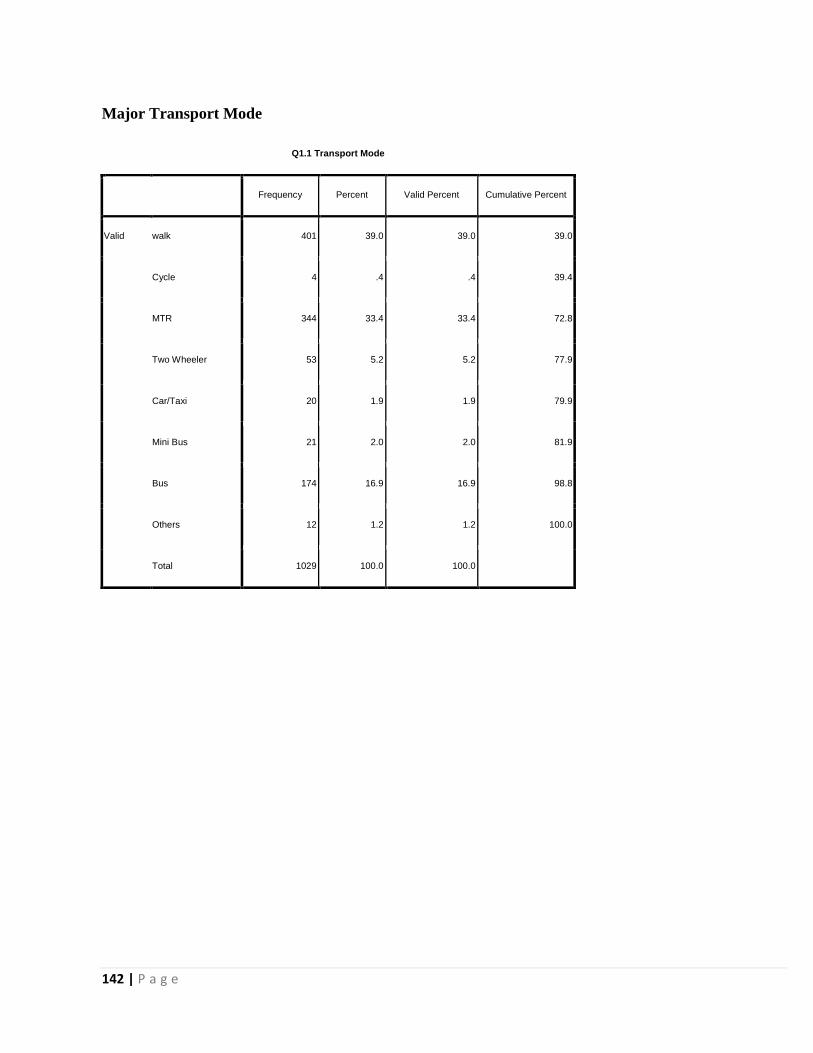
142 | P a g e
Major Transport Mode
Q1.1 Transport Mode
Frequency Percent Valid Percent Cumulative Percent
Valid walk 401 39.0 39.0 39.0
Cycle 4 .4 .4 39.4
MTR 344 33.4 33.4 72.8
Two Wheeler 53 5.2 5.2 77.9
Car/Taxi 20 1.9 1.9 79.9
Mini Bus 21 2.0 2.0 81.9
Bus 174 16.9 16.9 98.8
Others 12 1.2 1.2 100.0
Total 1029 100.0 100.0
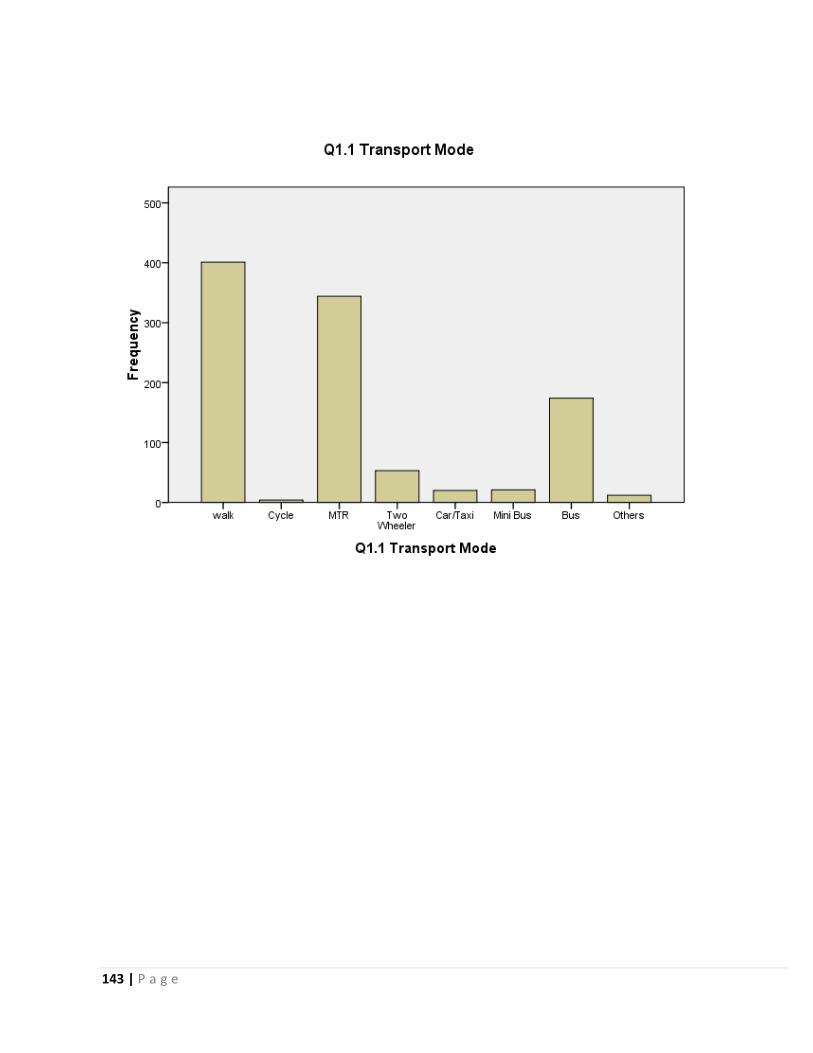
143 | P a g e
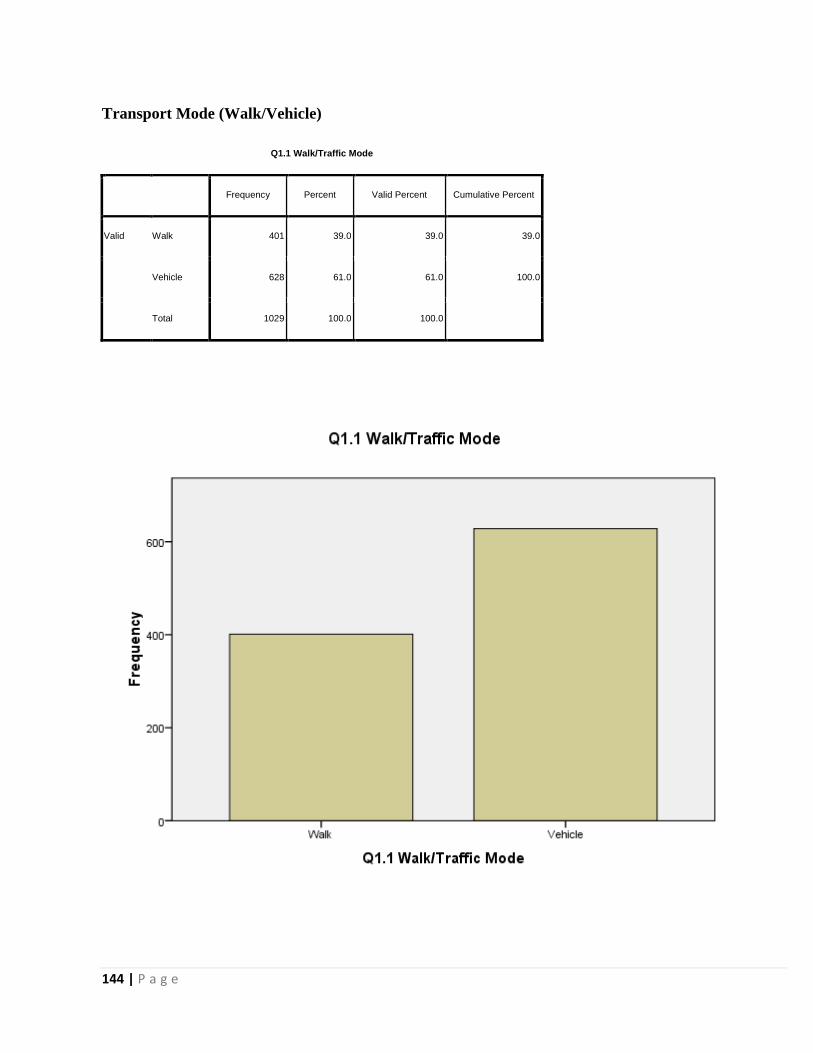
144 | P a g e
Transport Mode (Walk/Vehicle)
Q1.1 Walk/Traffic Mode
Frequency Percent Valid Percent Cumulative Percent
Valid Walk 401 39.0 39.0 39.0
Vehicle 628 61.0 61.0 100.0
Total 1029 100.0 100.0
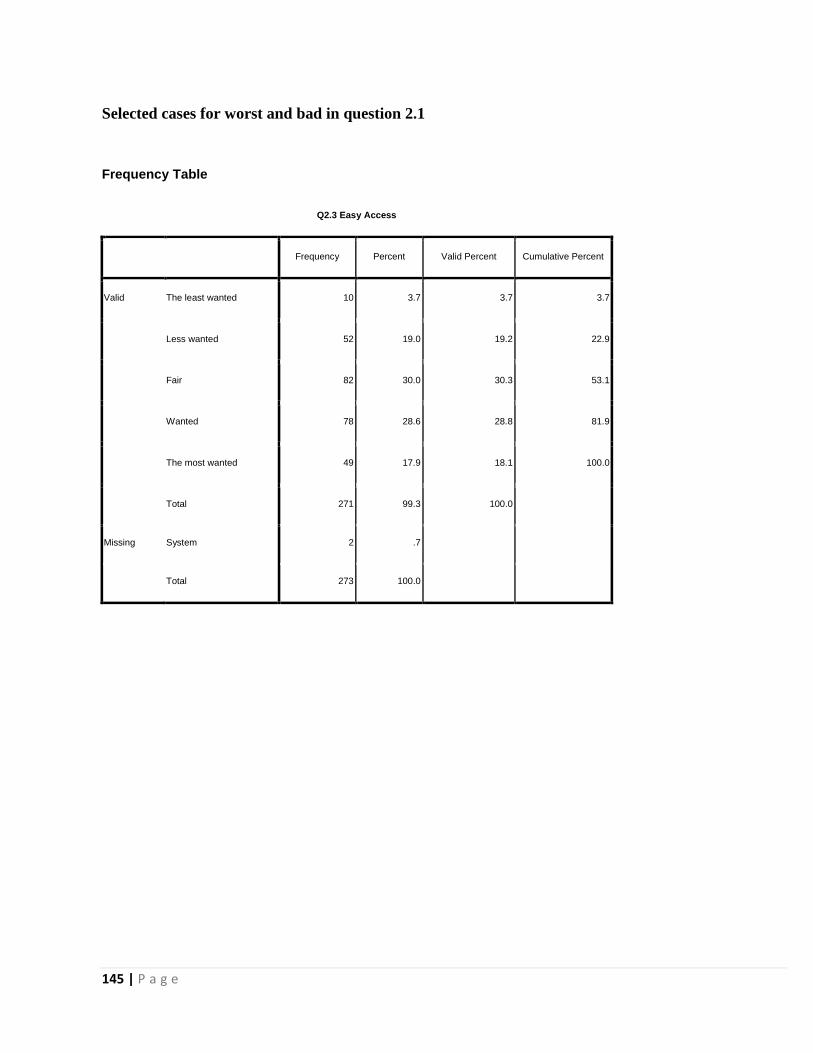
145 | P a g e
Selected cases for worst and bad in question 2.1
Frequency Table
Q2.3 Easy Access
Frequency Percent Valid Percent Cumulative Percent
Valid The least wanted 10 3.7 3.7 3.7
Less wanted 52 19.0 19.2 22.9
Fair 82 30.0 30.3 53.1
Wanted 78 28.6 28.8 81.9
The most wanted 49 17.9 18.1 100.0
Total 271 99.3 100.0
Missing System 2 .7
Total 273 100.0
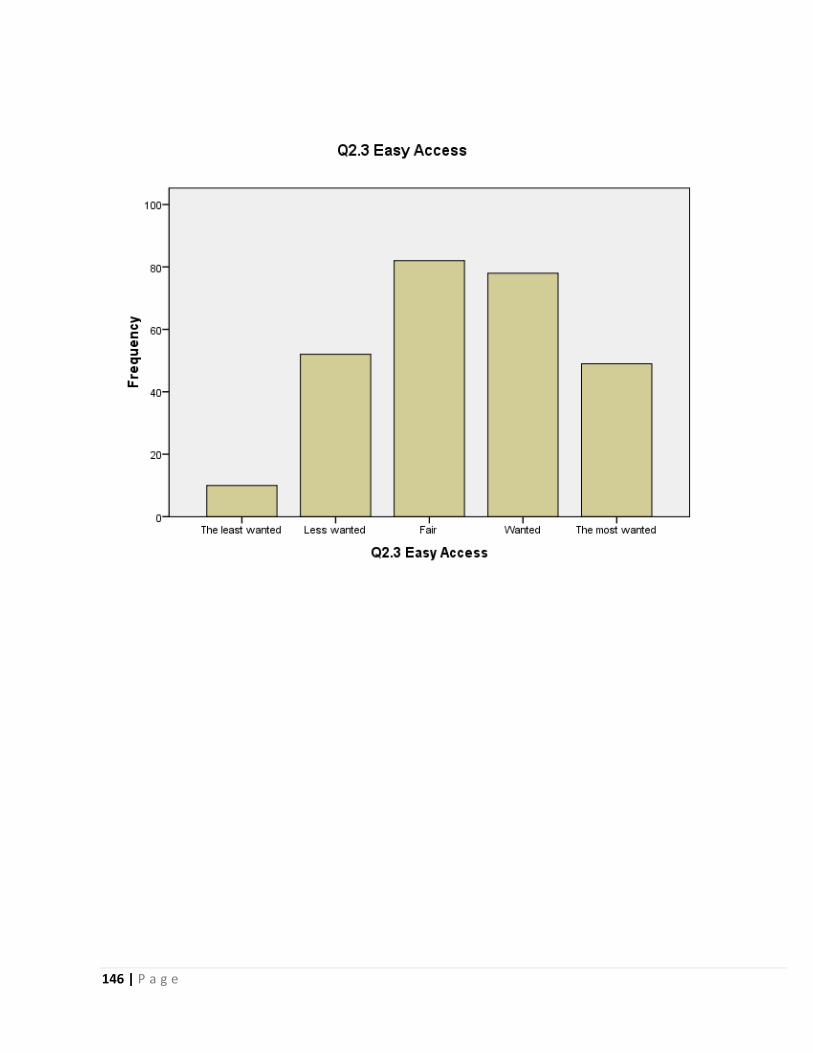
146 | P a g e
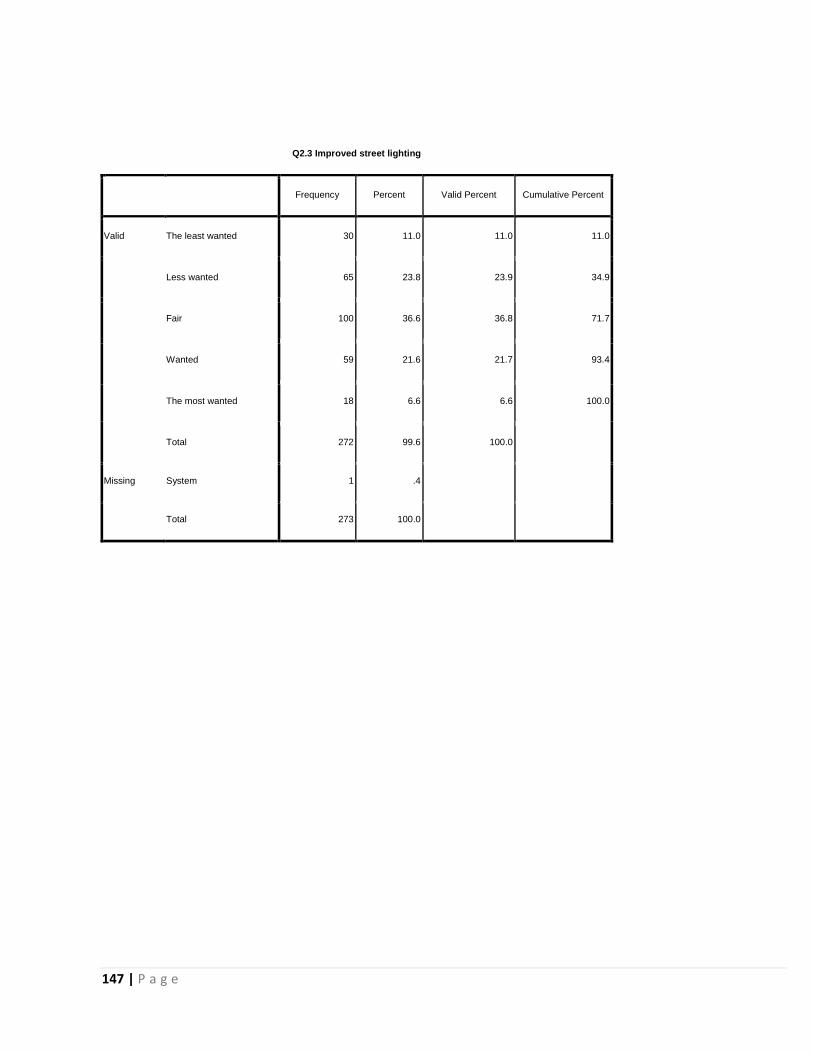
147 | P a g e
Q2.3 Improved street lighting
Frequency Percent Valid Percent Cumulative Percent
Valid The least wanted 30 11.0 11.0 11.0
Less wanted 65 23.8 23.9 34.9
Fair 100 36.6 36.8 71.7
Wanted 59 21.6 21.7 93.4
The most wanted 18 6.6 6.6 100.0
Total 272 99.6 100.0
Missing System 1 .4
Total 273 100.0
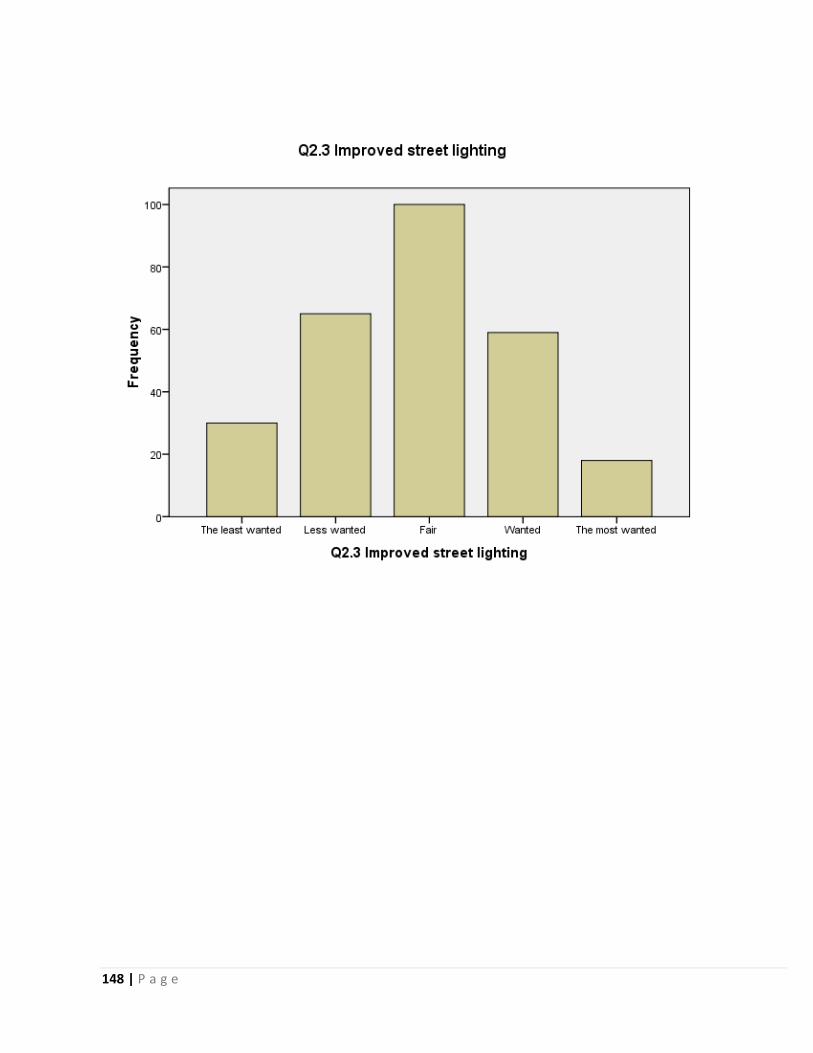
148 | P a g e
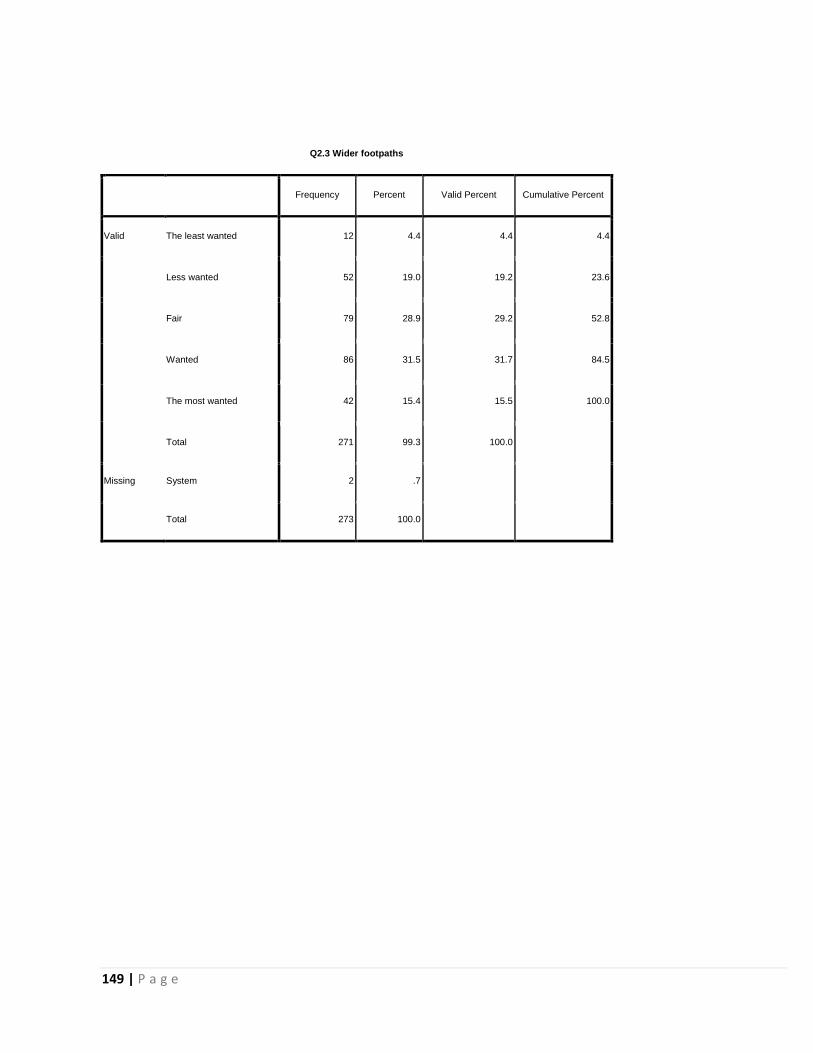
149 | P a g e
Q2.3 Wider footpaths
Frequency Percent Valid Percent Cumulative Percent
Valid The least wanted 12 4.4 4.4 4.4
Less wanted 52 19.0 19.2 23.6
Fair 79 28.9 29.2 52.8
Wanted 86 31.5 31.7 84.5
The most wanted 42 15.4 15.5 100.0
Total 271 99.3 100.0
Missing System 2 .7
Total 273 100.0
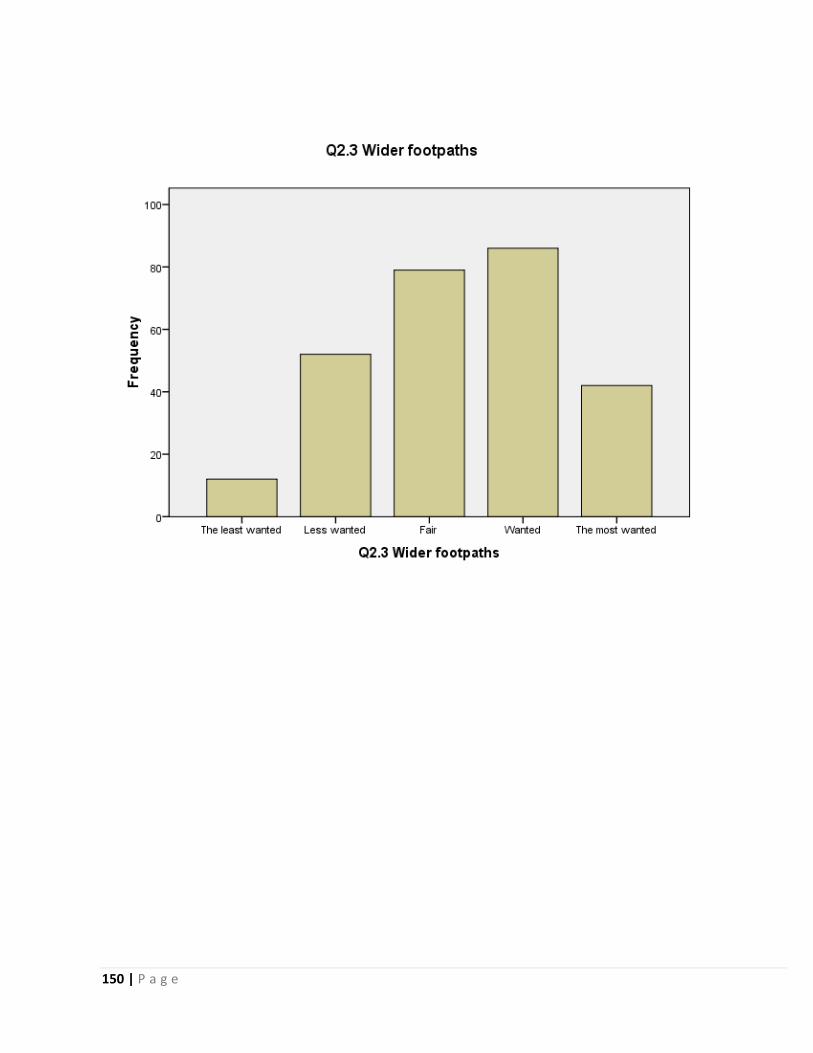
150 | P a g e

151 | P a g e
Q2.3 Level footpaths
Frequency Percent Valid Percent Cumulative Percent
Valid The least wanted 20 7.3 7.4 7.4
Less wanted 68 24.9 25.0 32.4
Fair 91 33.3 33.5 65.8
Wanted 68 24.9 25.0 90.8
The most wanted 25 9.2 9.2 100.0
Total 272 99.6 100.0
Missing System 1 .4
Total 273 100.0
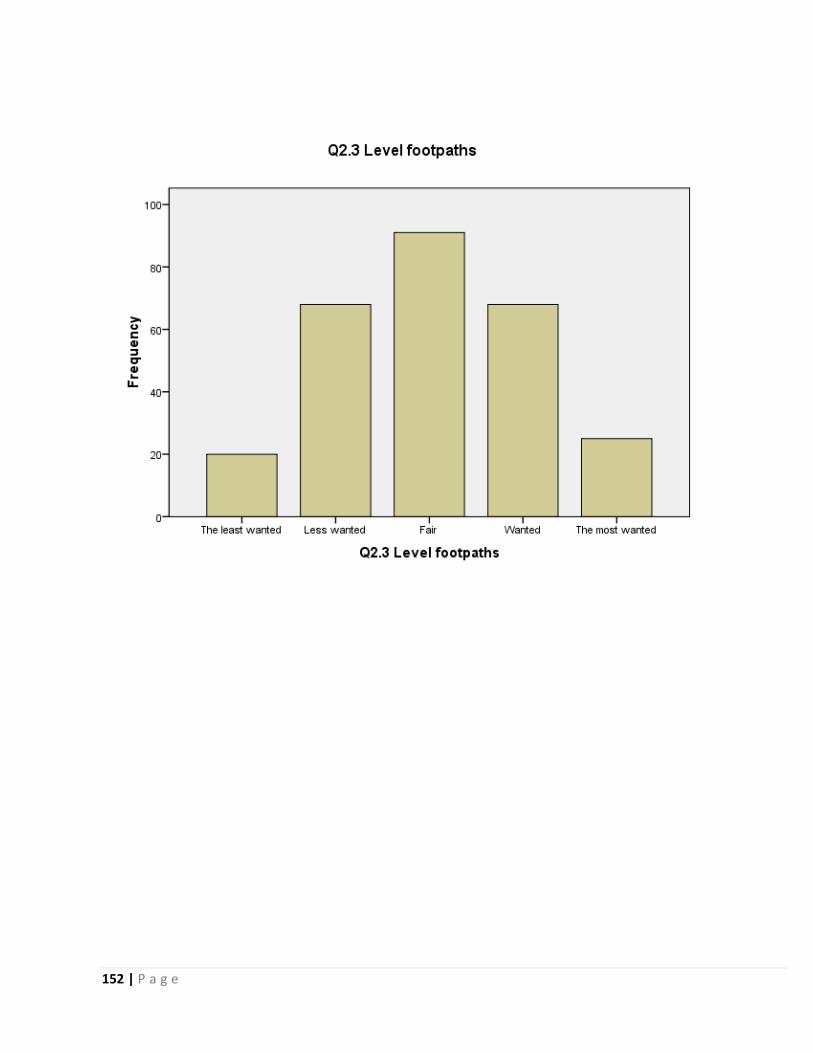
152 | P a g e
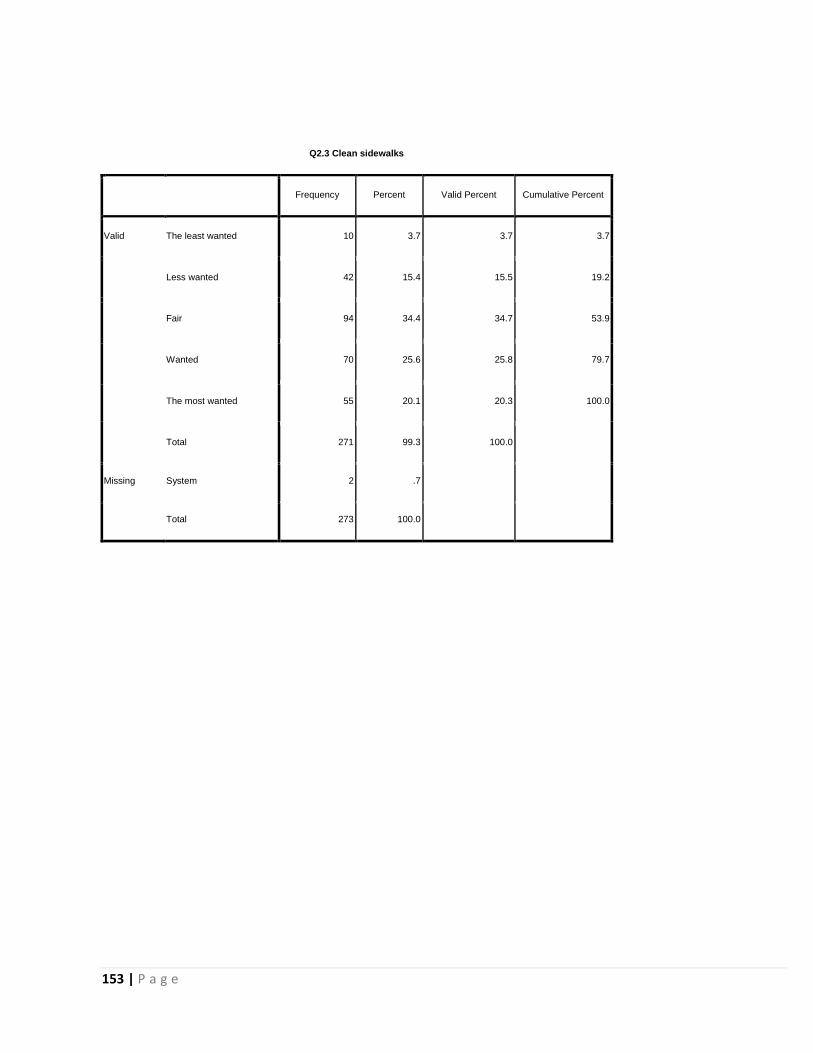
153 | P a g e
Q2.3 Clean sidewalks
Frequency Percent Valid Percent Cumulative Percent
Valid The least wanted 10 3.7 3.7 3.7
Less wanted 42 15.4 15.5 19.2
Fair 94 34.4 34.7 53.9
Wanted 70 25.6 25.8 79.7
The most wanted 55 20.1 20.3 100.0
Total 271 99.3 100.0
Missing System 2 .7
Total 273 100.0
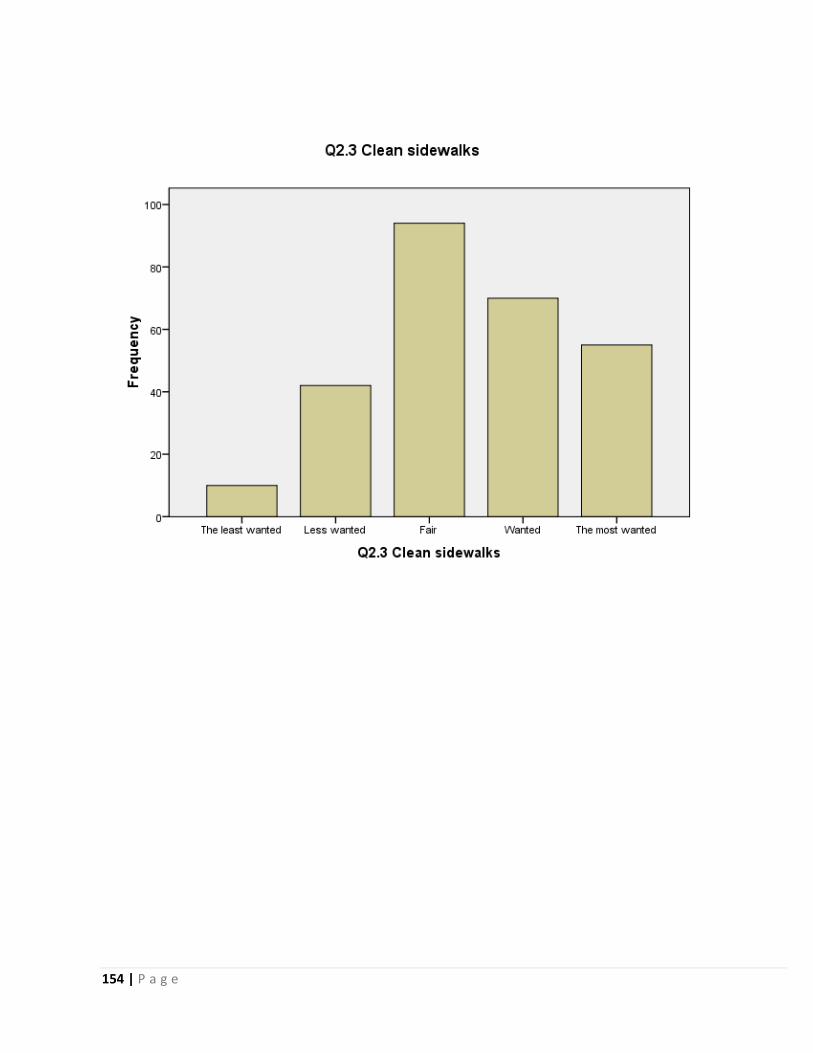
154 | P a g e

155 | P a g e
Q2.3 Reduced traffic
Frequency Percent Valid Percent Cumulative Percent
Valid The least wanted 13 4.8 4.8 4.8
Less wanted 61 22.3 22.6 27.4
Fair 80 29.3 29.6 57.0
Wanted 70 25.6 25.9 83.0
The most wanted 46 16.8 17.0 100.0
Total 270 98.9 100.0
Missing System 3 1.1
Total 273 100.0
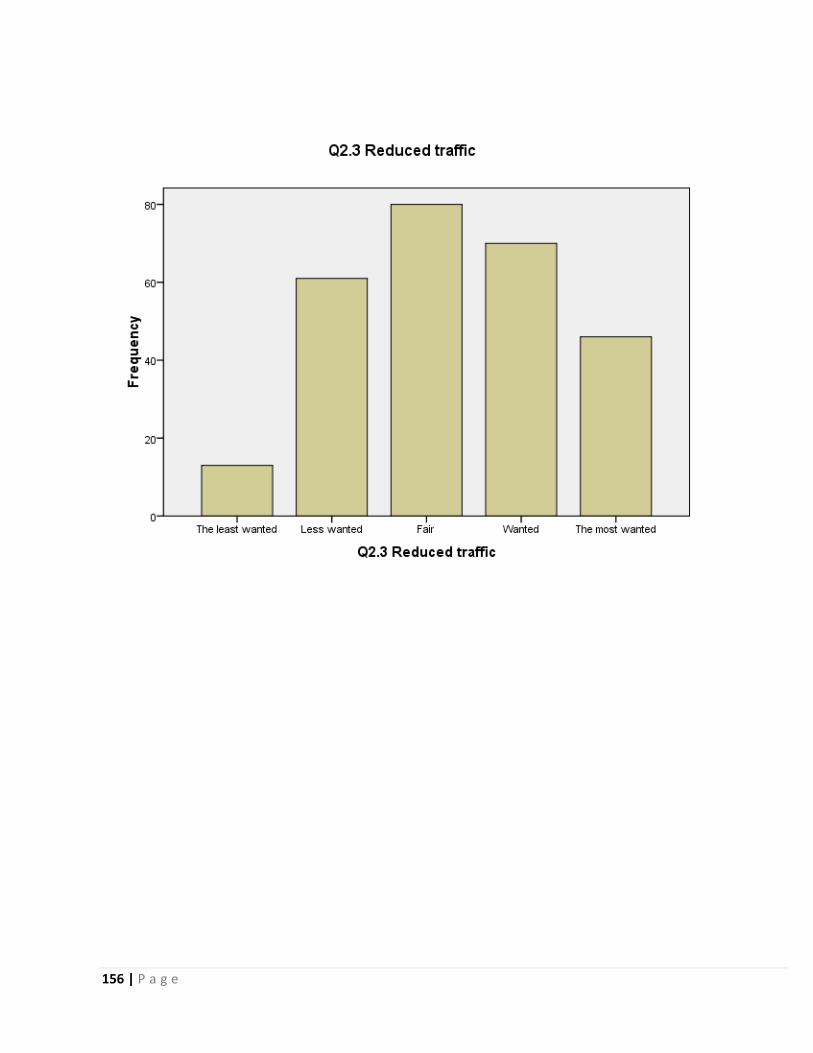
156 | P a g e

157 | P a g e
Q2.3 Reduced speed
Frequency Percent Valid Percent Cumulative Percent
Valid The least wanted 27 9.9 10.0 10.0
Less wanted 74 27.1 27.4 37.4
Fair 109 39.9 40.4 77.8
Wanted 43 15.8 15.9 93.7
The most wanted 17 6.2 6.3 100.0
Total 270 98.9 100.0
Missing System 3 1.1
Total 273 100.0
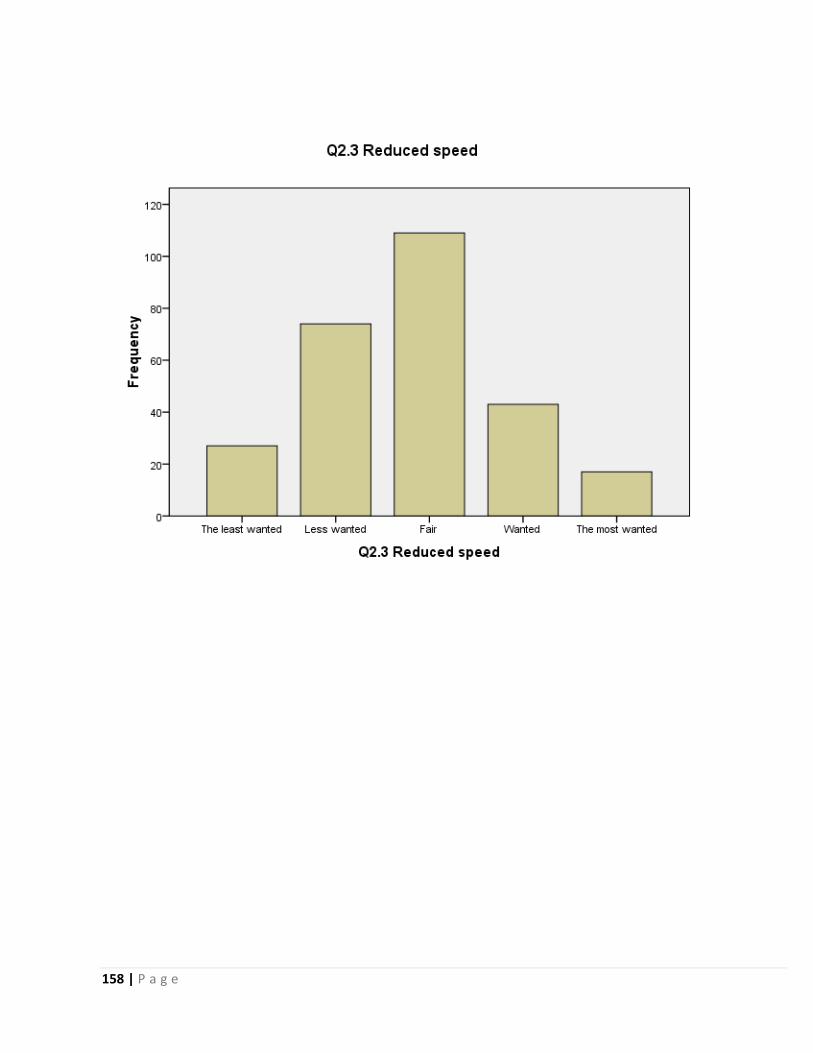
158 | P a g e

159 | P a g e
Q2.3 Remove obstacles
Frequency Percent Valid Percent Cumulative Percent
Valid The least wanted 7 2.6 2.6 2.6
Less wanted 53 19.4 19.6 22.2
Fair 100 36.6 37.0 59.3
Wanted 66 24.2 24.4 83.7
The most wanted 44 16.1 16.3 100.0
Total 270 98.9 100.0
Missing System 3 1.1
Total 273 100.0
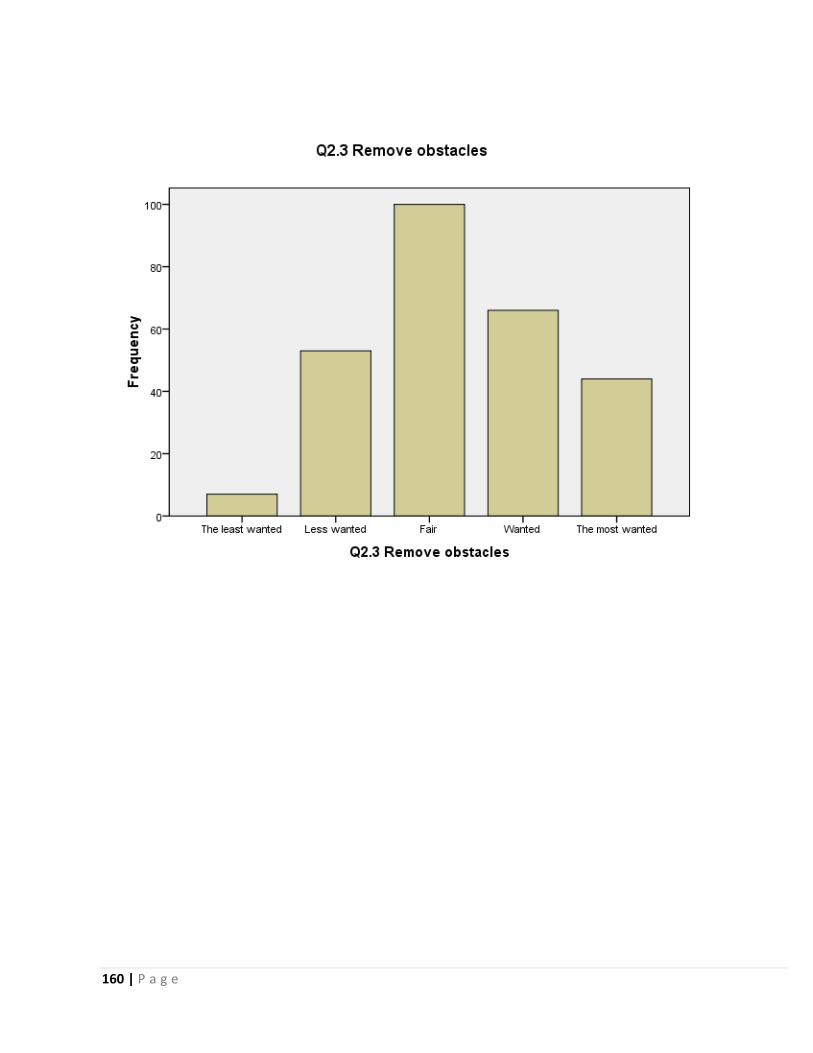
160 | P a g e

161 | P a g e
Q2.3 More crossing point
Frequency Percent Valid Percent Cumulative Percent
Valid The least wanted 9 3.3 3.3 3.3
Less wanted 31 11.4 11.4 14.8
Fair 97 35.5 35.8 50.6
Wanted 80 29.3 29.5 80.1
The most wanted 54 19.8 19.9 100.0
Total 271 99.3 100.0
Missing System 2 .7
Total 273 100.0
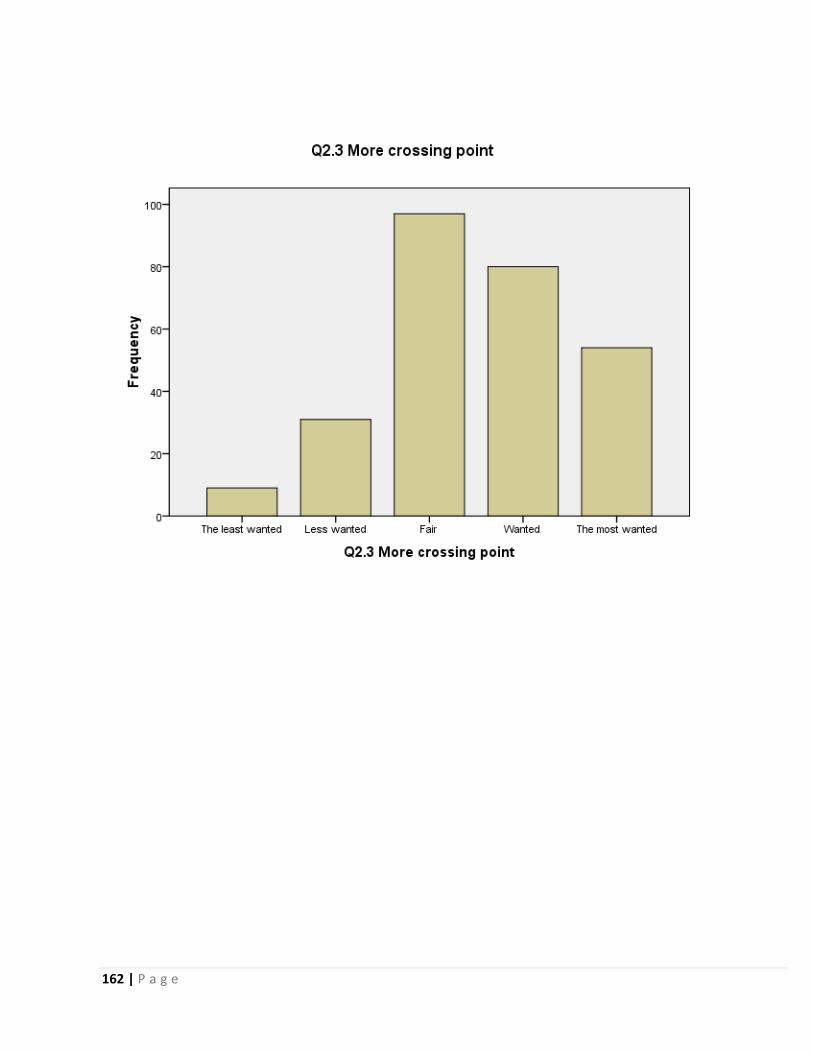
162 | P a g e

163 | P a g e
Q2.3 Weather proof
Frequency Percent Valid Percent Cumulative Percent
Valid The least wanted 31 11.4 11.5 11.5
Less wanted 35 12.8 13.0 24.4
Fair 84 30.8 31.1 55.6
Wanted 69 25.3 25.6 81.1
The most wanted 51 18.7 18.9 100.0
Total 270 98.9 100.0
Missing System 3 1.1
Total 273 100.0
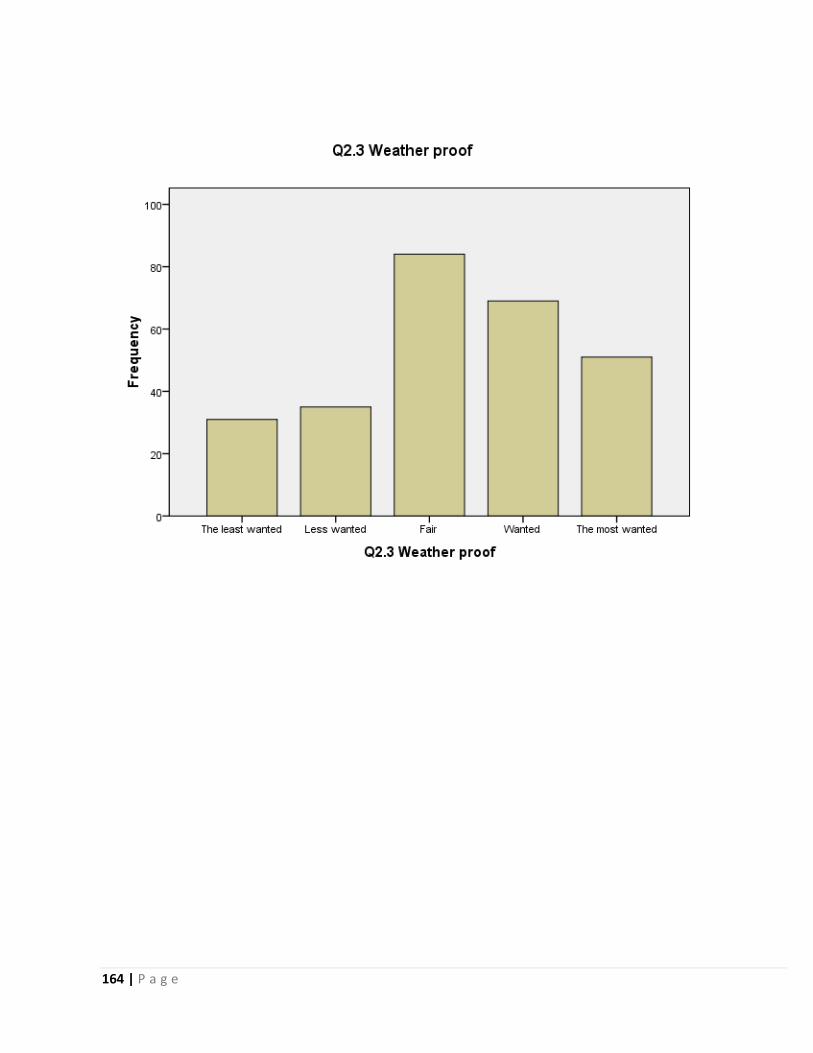
164 | P a g e
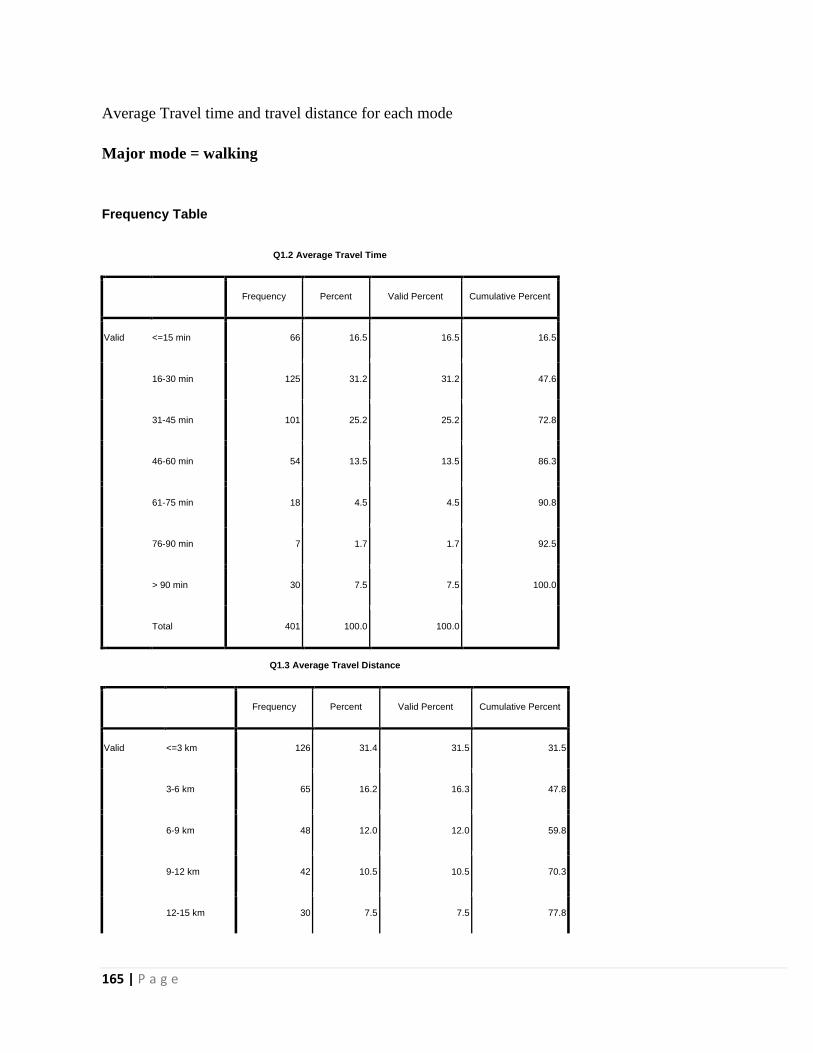
165 | P a g e
Average Travel time and travel distance for each mode
Major mode = walking
Frequency Table
Q1.2 Average Travel Time
Frequency Percent Valid Percent Cumulative Percent
Valid <=15 min 66 16.5 16.5 16.5
16-30 min 125 31.2 31.2 47.6
31-45 min 101 25.2 25.2 72.8
46-60 min 54 13.5 13.5 86.3
61-75 min 18 4.5 4.5 90.8
76-90 min 7 1.7 1.7 92.5
> 90 min 30 7.5 7.5 100.0
Total 401 100.0 100.0
Q1.3 Average Travel Distance
Frequency Percent Valid Percent Cumulative Percent
Valid <=3 km 126 31.4 31.5 31.5
3-6 km 65 16.2 16.3 47.8
6-9 km 48 12.0 12.0 59.8
9-12 km 42 10.5 10.5 70.3
12-15 km 30 7.5 7.5 77.8
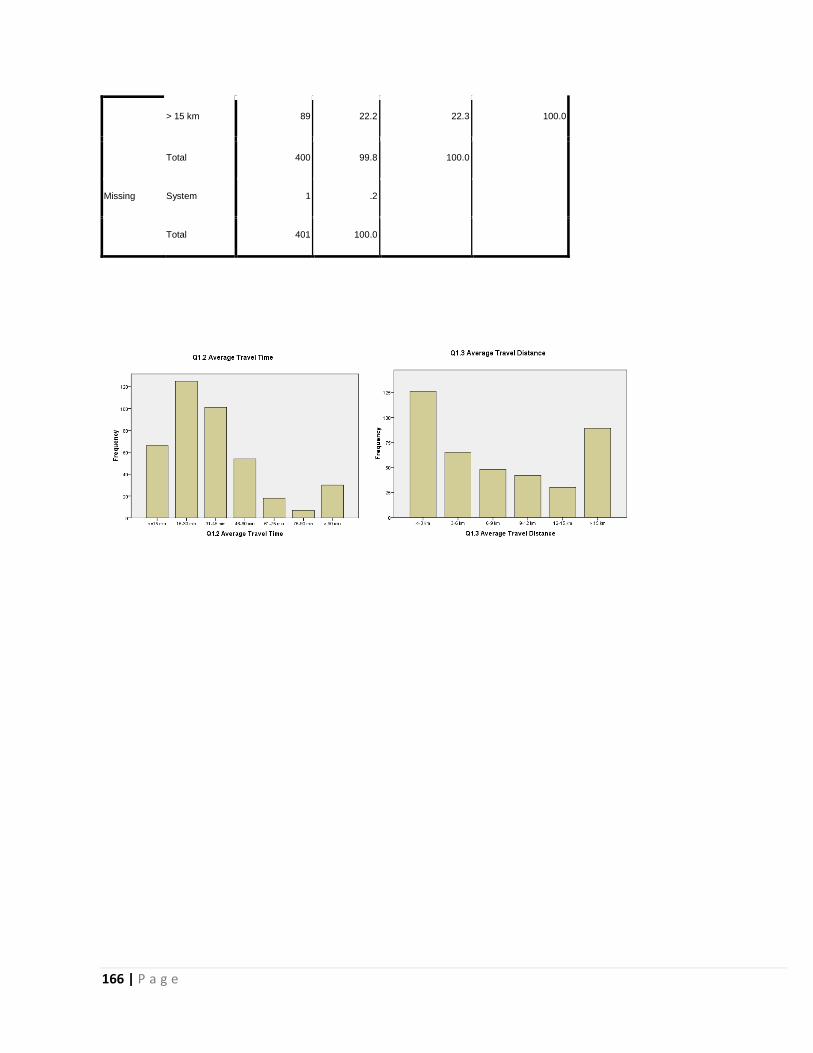
166 | P a g e
> 15 km 89 22.2 22.3 100.0
Total 400 99.8 100.0
Missing System 1 .2
Total 401 100.0
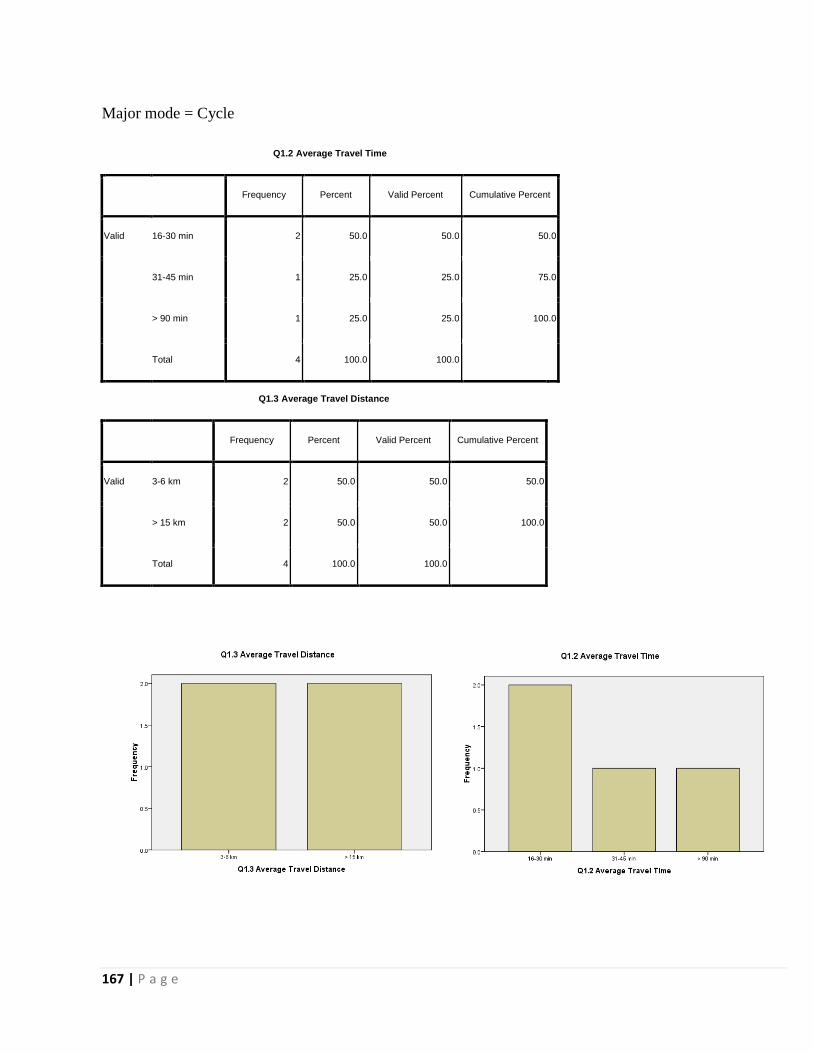
167 | P a g e
Major mode = Cycle
Q1.2 Average Travel Time
Frequency Percent Valid Percent Cumulative Percent
Valid 16-30 min 2 50.0 50.0 50.0
31-45 min 1 25.0 25.0 75.0
> 90 min 1 25.0 25.0 100.0
Total 4 100.0 100.0
Q1.3 Average Travel Distance
Frequency Percent Valid Percent Cumulative Percent
Valid 3-6 km 2 50.0 50.0 50.0
> 15 km 2 50.0 50.0 100.0
Total 4 100.0 100.0
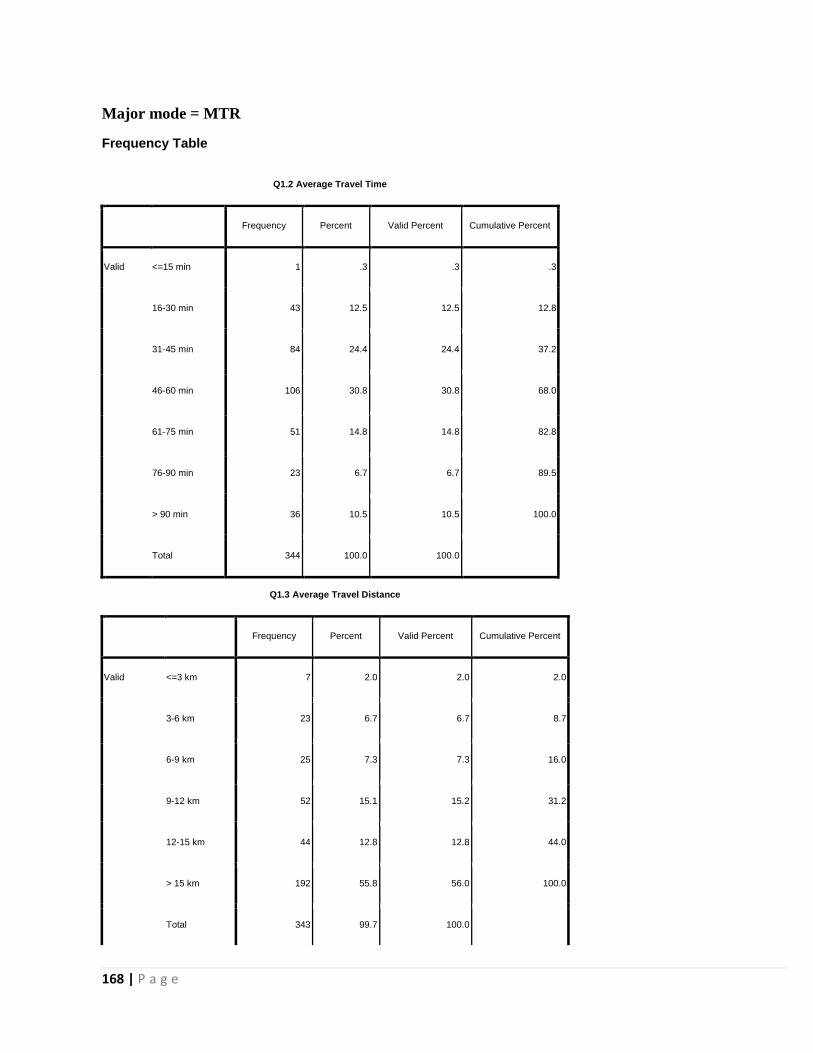
168 | P a g e
Major mode = MTR
Frequency Table
Q1.2 Average Travel Time
Frequency Percent Valid Percent Cumulative Percent
Valid <=15 min 1 .3 .3 .3
16-30 min 43 12.5 12.5 12.8
31-45 min 84 24.4 24.4 37.2
46-60 min 106 30.8 30.8 68.0
61-75 min 51 14.8 14.8 82.8
76-90 min 23 6.7 6.7 89.5
> 90 min 36 10.5 10.5 100.0
Total 344 100.0 100.0
Q1.3 Average Travel Distance
Frequency Percent Valid Percent Cumulative Percent
Valid <=3 km 7 2.0 2.0 2.0
3-6 km 23 6.7 6.7 8.7
6-9 km 25 7.3 7.3 16.0
9-12 km 52 15.1 15.2 31.2
12-15 km 44 12.8 12.8 44.0
> 15 km 192 55.8 56.0 100.0
Total 343 99.7 100.0
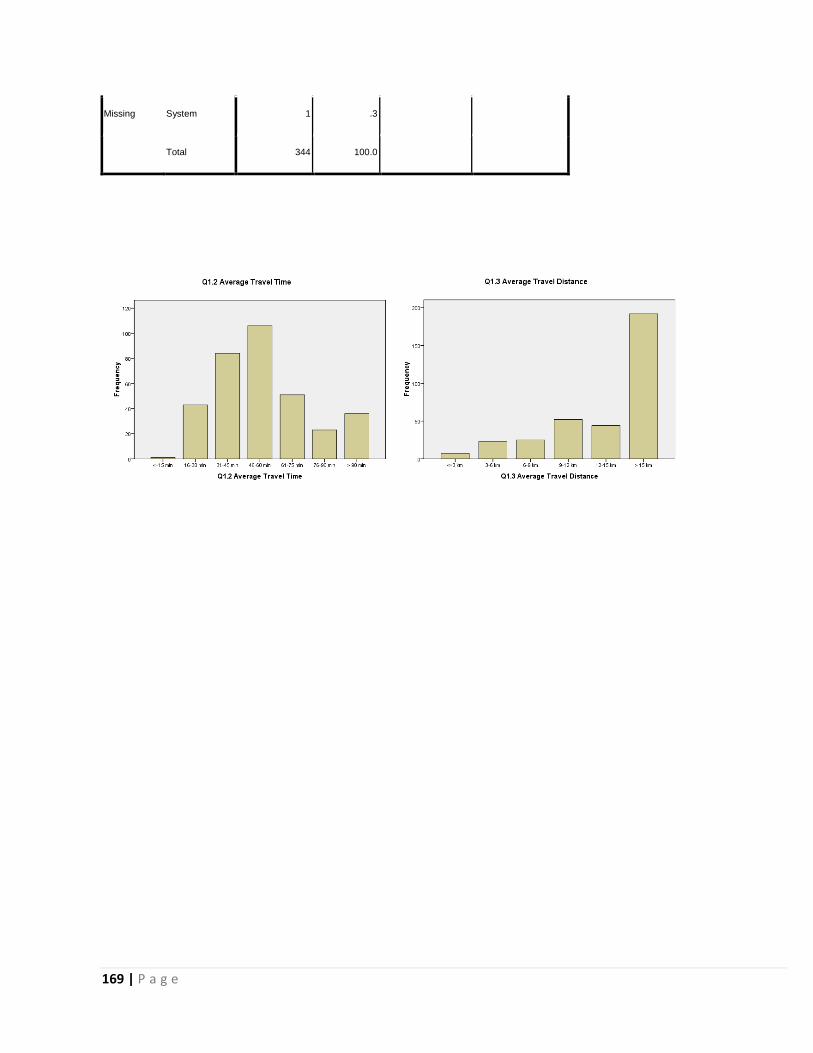
169 | P a g e
Missing System 1 .3
Total 344 100.0
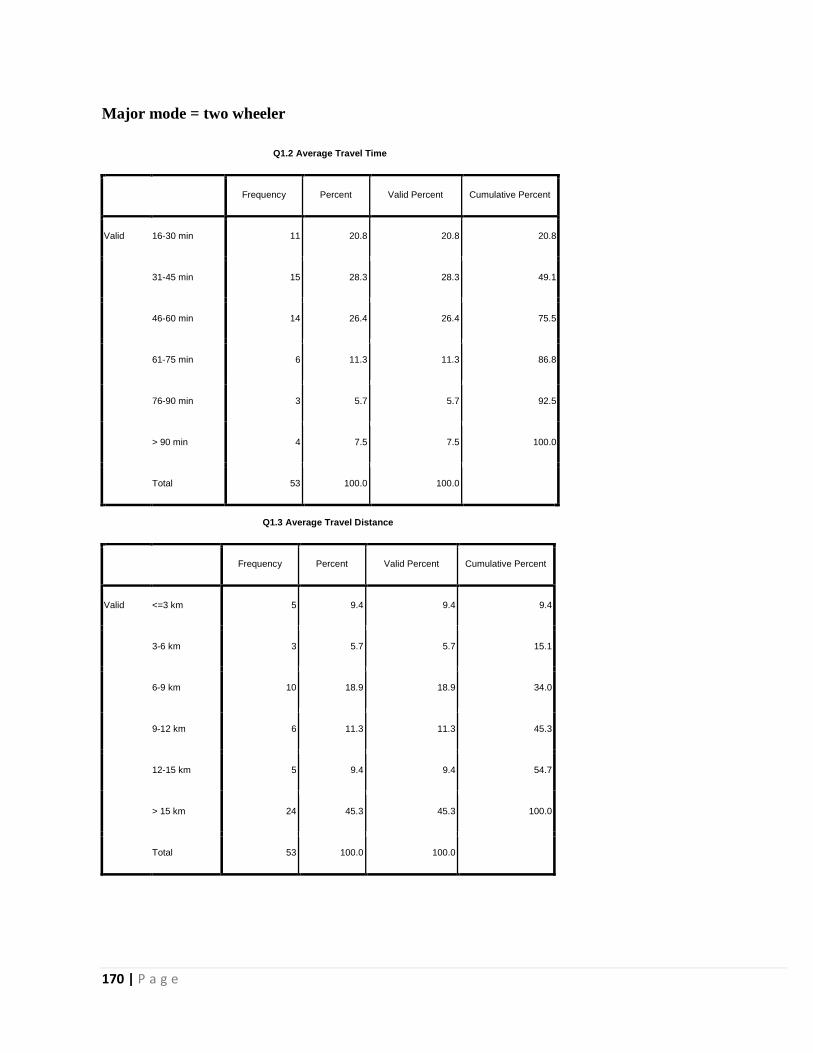
170 | P a g e
Major mode = two wheeler
Q1.2 Average Travel Time
Frequency Percent Valid Percent Cumulative Percent
Valid 16-30 min 11 20.8 20.8 20.8
31-45 min 15 28.3 28.3 49.1
46-60 min 14 26.4 26.4 75.5
61-75 min 6 11.3 11.3 86.8
76-90 min 3 5.7 5.7 92.5
> 90 min 4 7.5 7.5 100.0
Total 53 100.0 100.0
Q1.3 Average Travel Distance
Frequency Percent Valid Percent Cumulative Percent
Valid <=3 km 5 9.4 9.4 9.4
3-6 km 3 5.7 5.7 15.1
6-9 km 10 18.9 18.9 34.0
9-12 km 6 11.3 11.3 45.3
12-15 km 5 9.4 9.4 54.7
> 15 km 24 45.3 45.3 100.0
Total 53 100.0 100.0
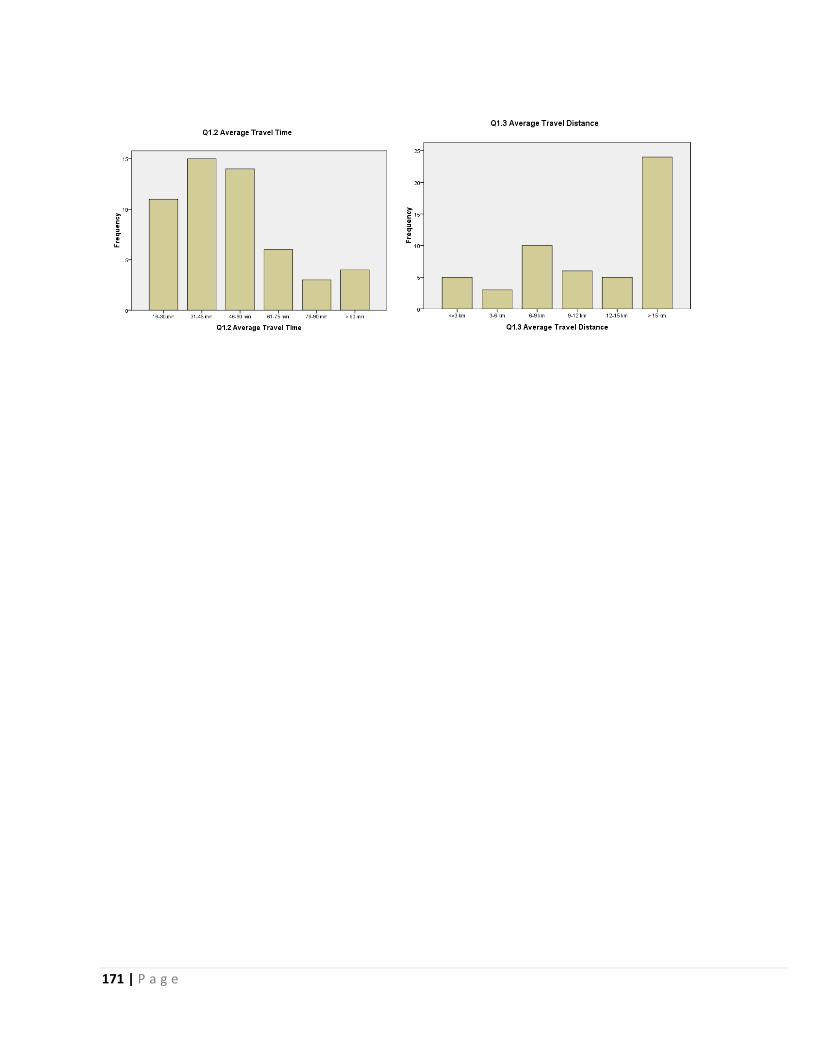
171 | P a g e
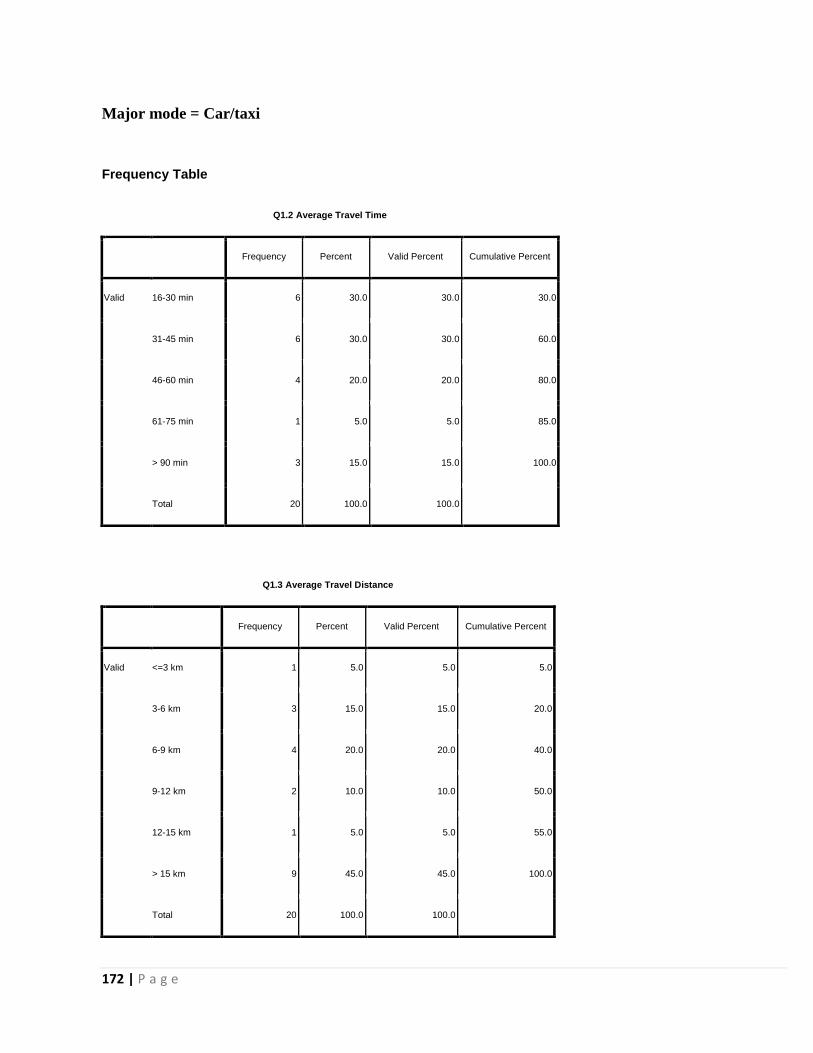
172 | P a g e
Major mode = Car/taxi
Frequency Table
Q1.2 Average Travel Time
Frequency Percent Valid Percent Cumulative Percent
Valid 16-30 min 6 30.0 30.0 30.0
31-45 min 6 30.0 30.0 60.0
46-60 min 4 20.0 20.0 80.0
61-75 min 1 5.0 5.0 85.0
> 90 min 3 15.0 15.0 100.0
Total 20 100.0 100.0
Q1.3 Average Travel Distance
Frequency Percent Valid Percent Cumulative Percent
Valid <=3 km 1 5.0 5.0 5.0
3-6 km 3 15.0 15.0 20.0
6-9 km 4 20.0 20.0 40.0
9-12 km 2 10.0 10.0 50.0
12-15 km 1 5.0 5.0 55.0
> 15 km 9 45.0 45.0 100.0
Total 20 100.0 100.0
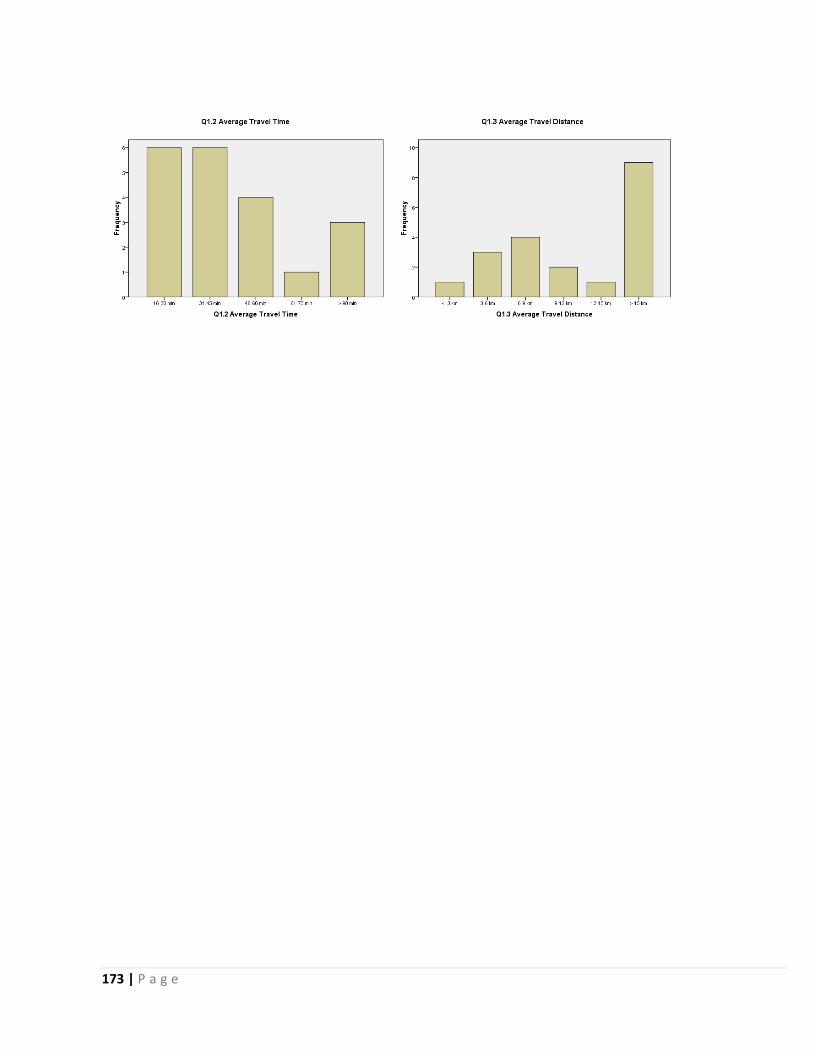
173 | P a g e
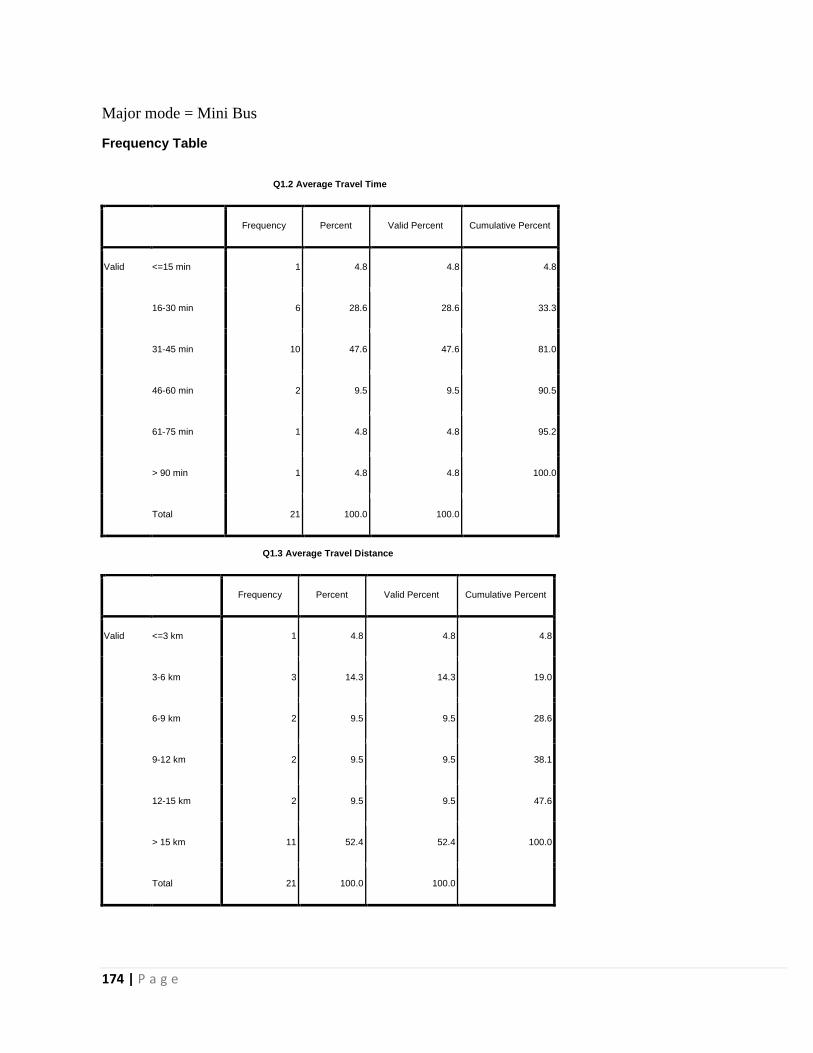
174 | P a g e
Major mode = Mini Bus
Frequency Table
Q1.2 Average Travel Time
Frequency Percent Valid Percent Cumulative Percent
Valid <=15 min 1 4.8 4.8 4.8
16-30 min 6 28.6 28.6 33.3
31-45 min 10 47.6 47.6 81.0
46-60 min 2 9.5 9.5 90.5
61-75 min 1 4.8 4.8 95.2
> 90 min 1 4.8 4.8 100.0
Total 21 100.0 100.0
Q1.3 Average Travel Distance
Frequency Percent Valid Percent Cumulative Percent
Valid <=3 km 1 4.8 4.8 4.8
3-6 km 3 14.3 14.3 19.0
6-9 km 2 9.5 9.5 28.6
9-12 km 2 9.5 9.5 38.1
12-15 km 2 9.5 9.5 47.6
> 15 km 11 52.4 52.4 100.0
Total 21 100.0 100.0
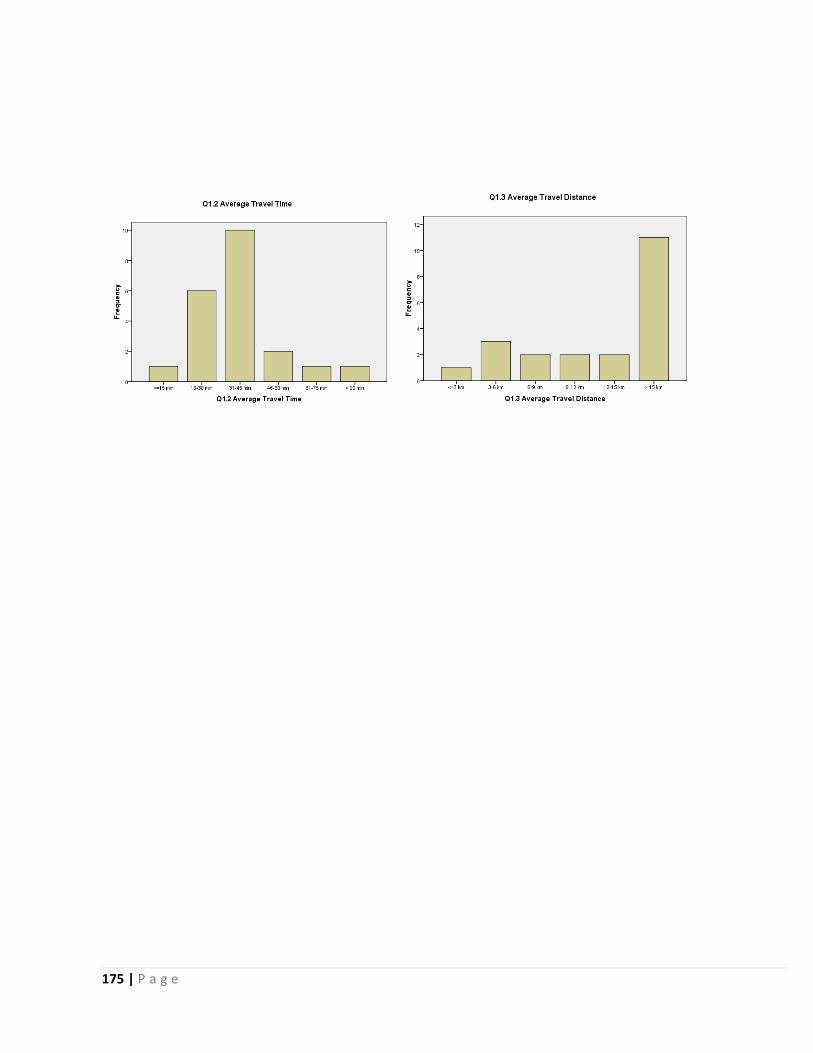
175 | P a g e

176 | P a g e
Major mode = Bus
Frequency Table
Q1.2 Average Travel Time
Frequency Percent Valid Percent Cumulative Percent
Valid <=15 min 2 1.1 1.1 1.1
16-30 min 19 10.9 10.9 12.1
31-45 min 48 27.6 27.6 39.7
46-60 min 54 31.0 31.0 70.7
61-75 min 25 14.4 14.4 85.1
76-90 min 12 6.9 6.9 92.0
> 90 min 14 8.0 8.0 100.0
Total 174 100.0 100.0
Q1.3 Average Travel Distance
Frequency Percent Valid Percent Cumulative Percent
Valid <=3 km 9 5.2 5.2 5.2
3-6 km 11 6.3 6.4 11.6
6-9 km 26 14.9 15.1 26.7
9-12 km 23 13.2 13.4 40.1
12-15 km 20 11.5 11.6 51.7
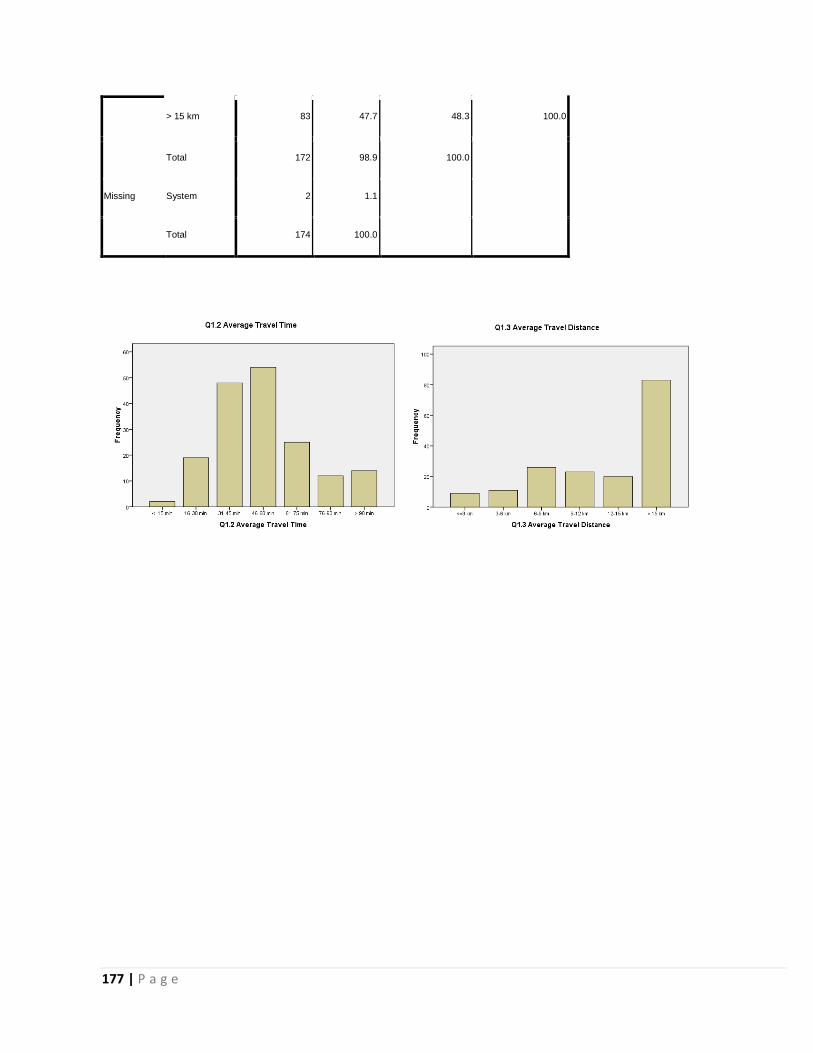
177 | P a g e
> 15 km 83 47.7 48.3 100.0
Total 172 98.9 100.0
Missing System 2 1.1
Total 174 100.0
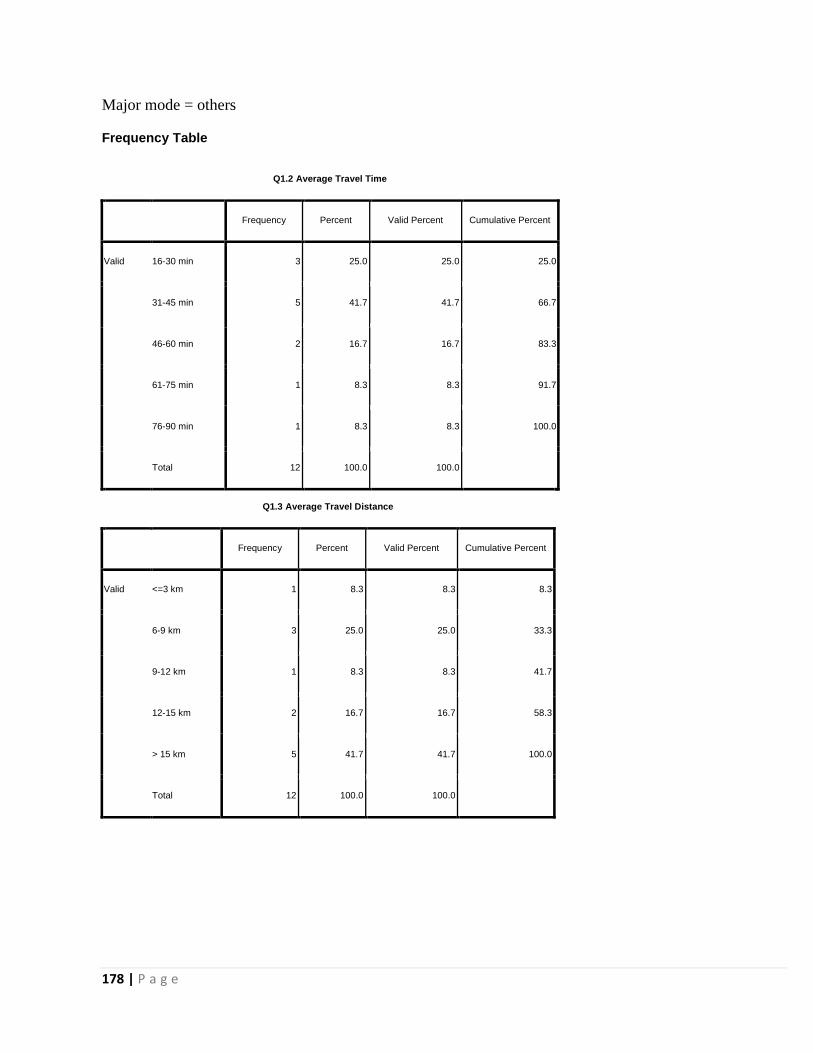
178 | P a g e
Major mode = others
Frequency Table
Q1.2 Average Travel Time
Frequency Percent Valid Percent Cumulative Percent
Valid 16-30 min 3 25.0 25.0 25.0
31-45 min 5 41.7 41.7 66.7
46-60 min 2 16.7 16.7 83.3
61-75 min 1 8.3 8.3 91.7
76-90 min 1 8.3 8.3 100.0
Total 12 100.0 100.0
Q1.3 Average Travel Distance
Frequency Percent Valid Percent Cumulative Percent
Valid <=3 km 1 8.3 8.3 8.3
6-9 km 3 25.0 25.0 33.3
9-12 km 1 8.3 8.3 41.7
12-15 km 2 16.7 16.7 58.3
> 15 km 5 41.7 41.7 100.0
Total 12 100.0 100.0
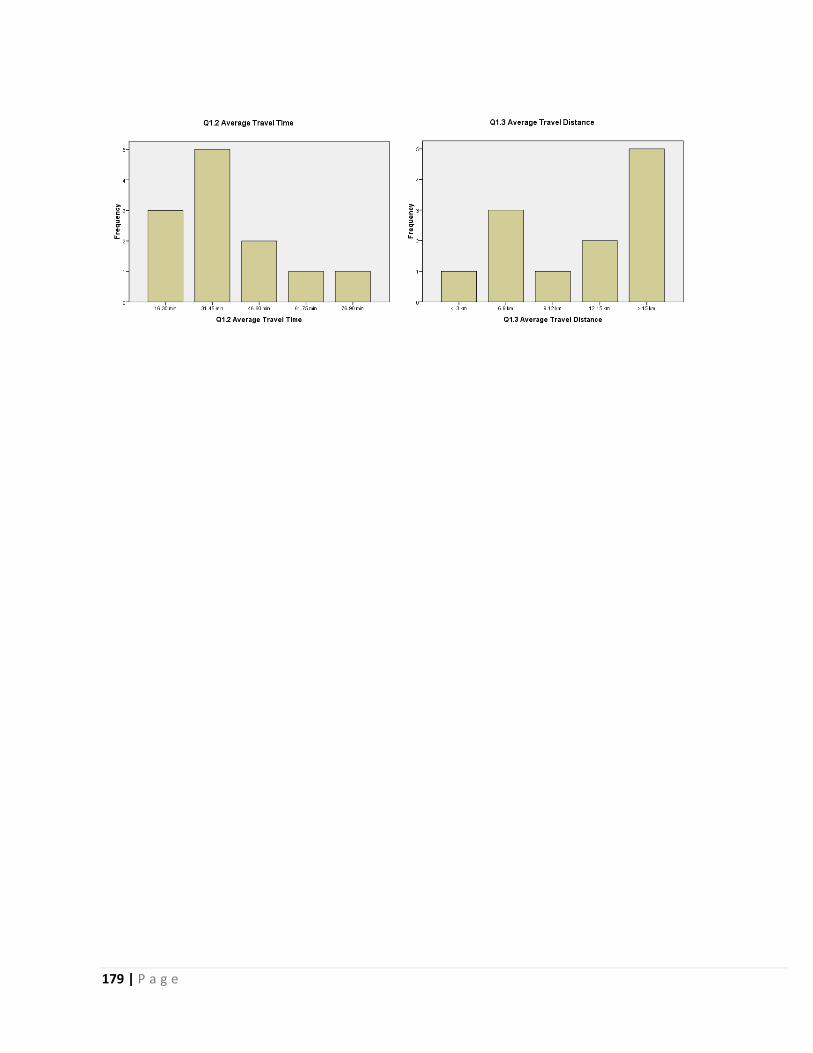
179 | P a g e
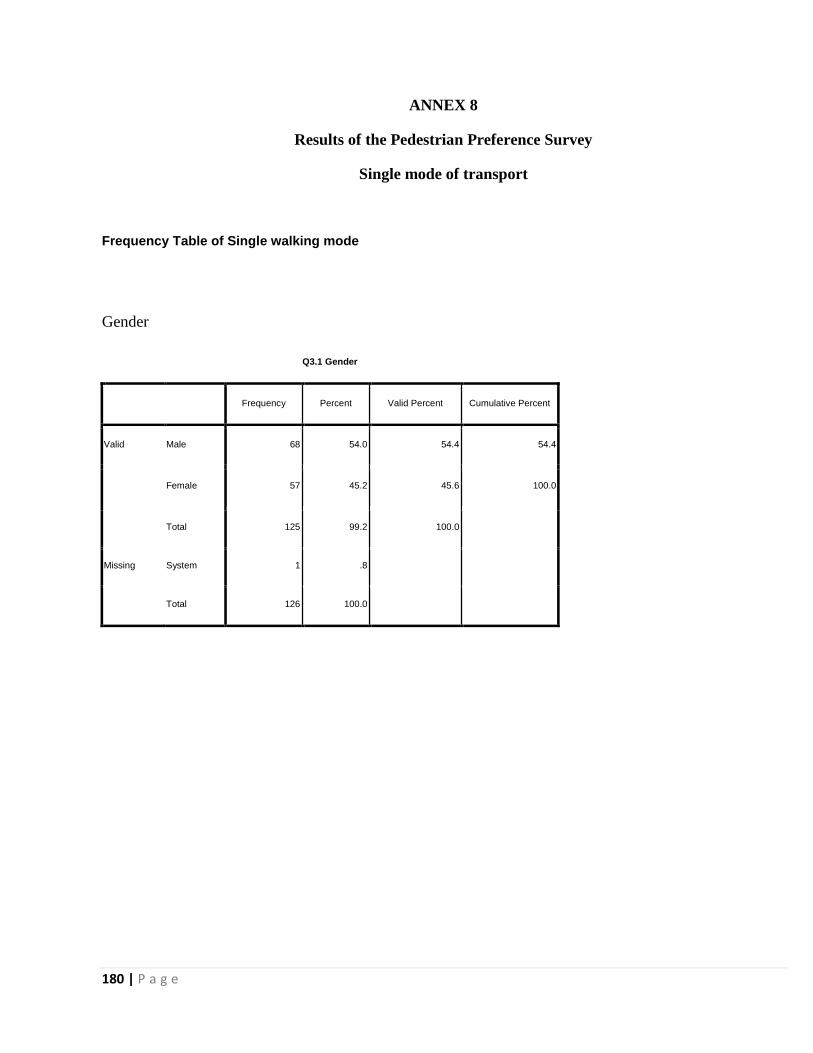
180 | P a g e
ANNEX 8
Results of the Pedestrian Preference Survey
Single mode of transport
Frequency Table of Single walking mode
Gender
Q3.1 Gender
Frequency Percent Valid Percent Cumulative Percent
Valid Male 68 54.0 54.4 54.4
Female 57 45.2 45.6 100.0
Total 125 99.2 100.0
Missing System 1 .8
Total 126 100.0
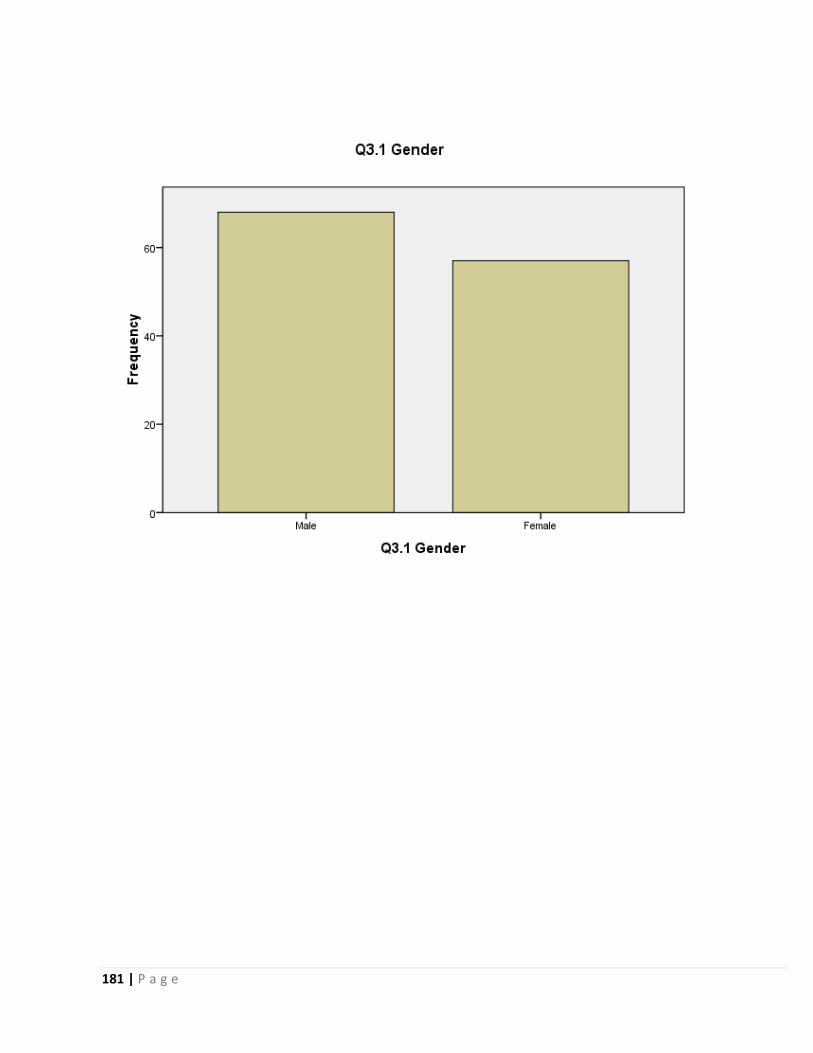
181 | P a g e
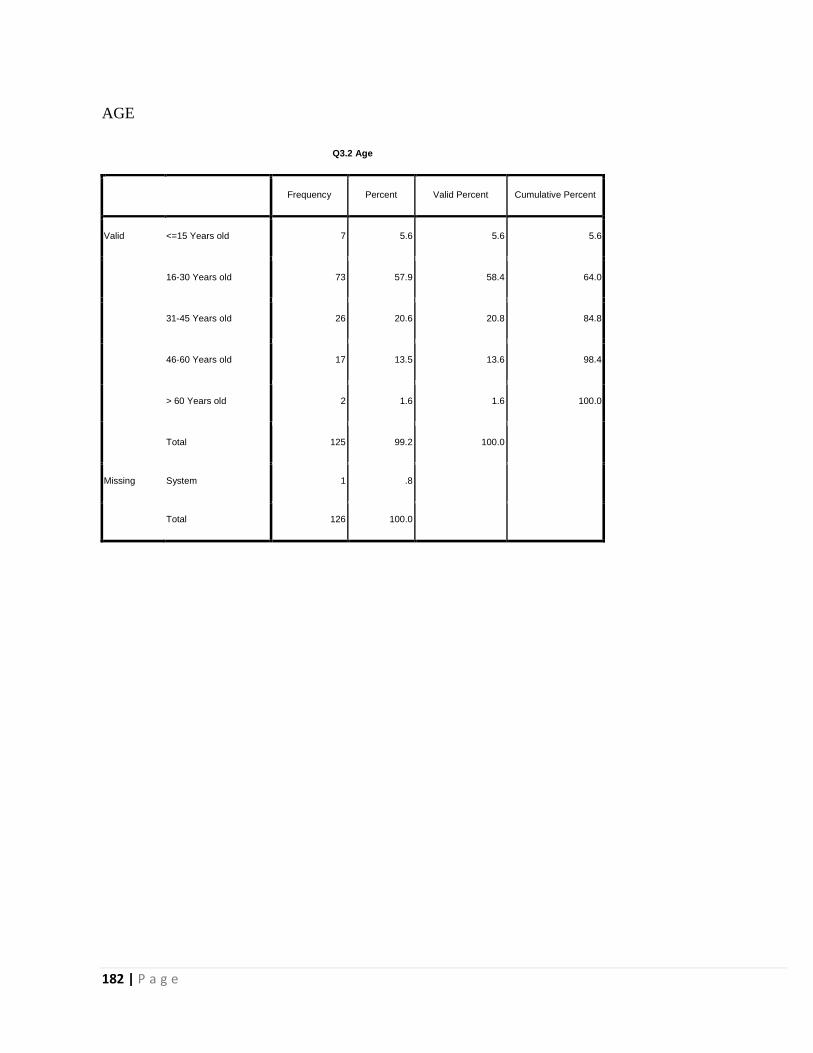
182 | P a g e
AGE
Q3.2 Age
Frequency Percent Valid Percent Cumulative Percent
Valid <=15 Years old 7 5.6 5.6 5.6
16-30 Years old 73 57.9 58.4 64.0
31-45 Years old 26 20.6 20.8 84.8
46-60 Years old 17 13.5 13.6 98.4
> 60 Years old 2 1.6 1.6 100.0
Total 125 99.2 100.0
Missing System 1 .8
Total 126 100.0
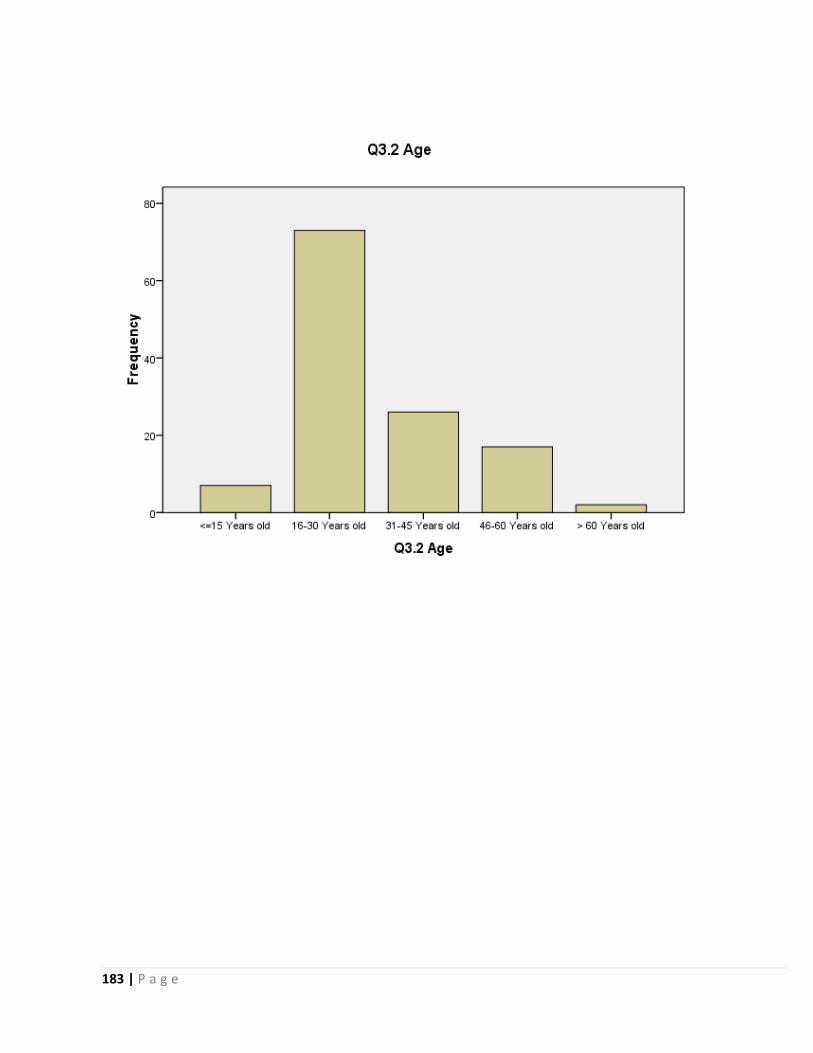
183 | P a g e
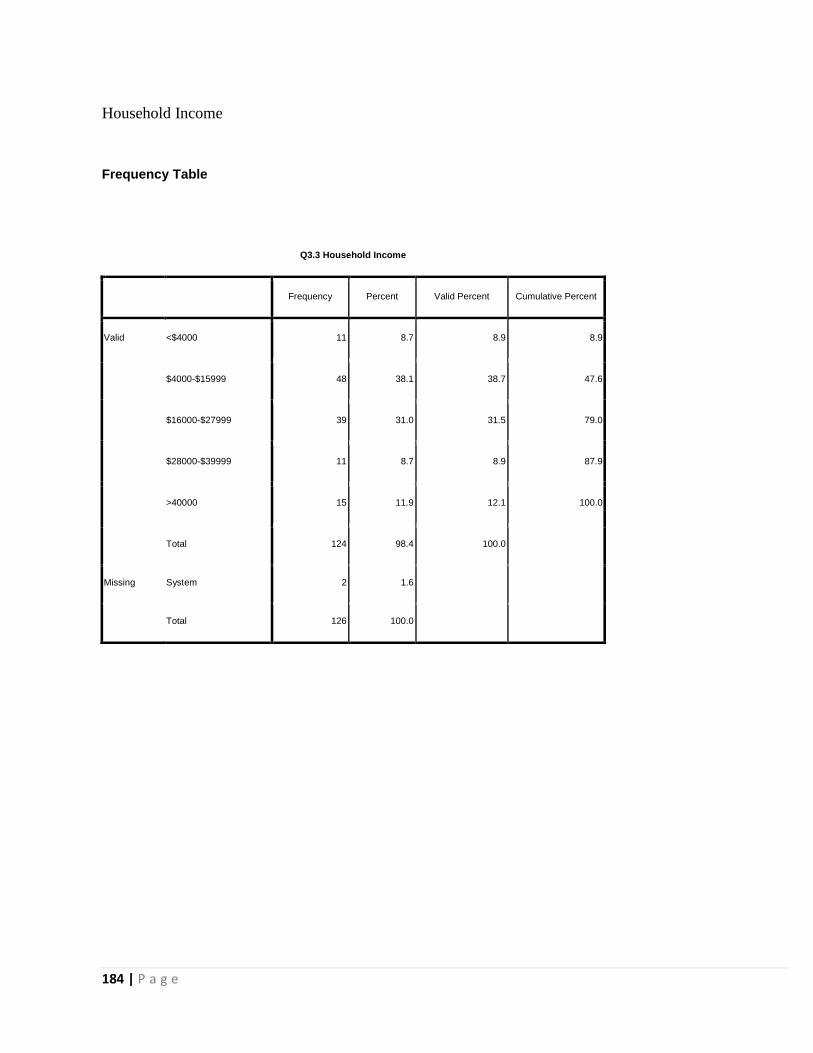
184 | P a g e
Household Income
Frequency Table
Q3.3 Household Income
Frequency Percent Valid Percent Cumulative Percent
Valid <$4000 11 8.7 8.9 8.9
$4000-$15999 48 38.1 38.7 47.6
$16000-$27999 39 31.0 31.5 79.0
$28000-$39999 11 8.7 8.9 87.9
>40000 15 11.9 12.1 100.0
Total 124 98.4 100.0
Missing System 2 1.6
Total 126 100.0
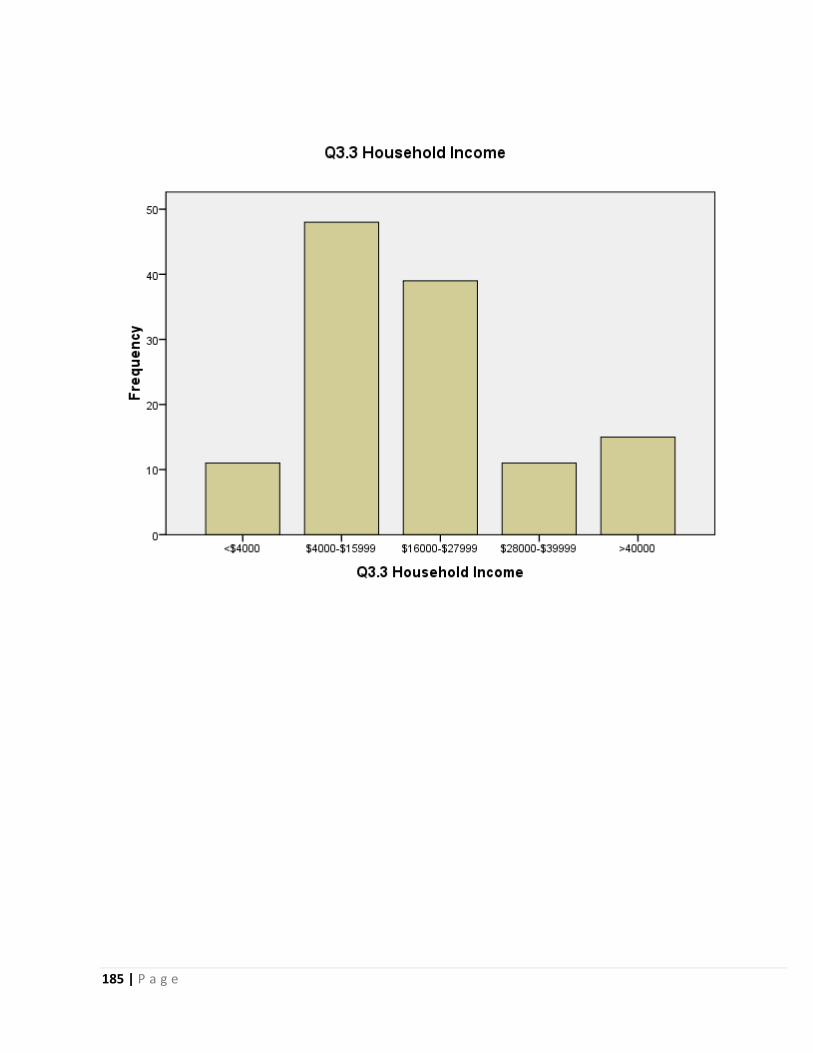
185 | P a g e
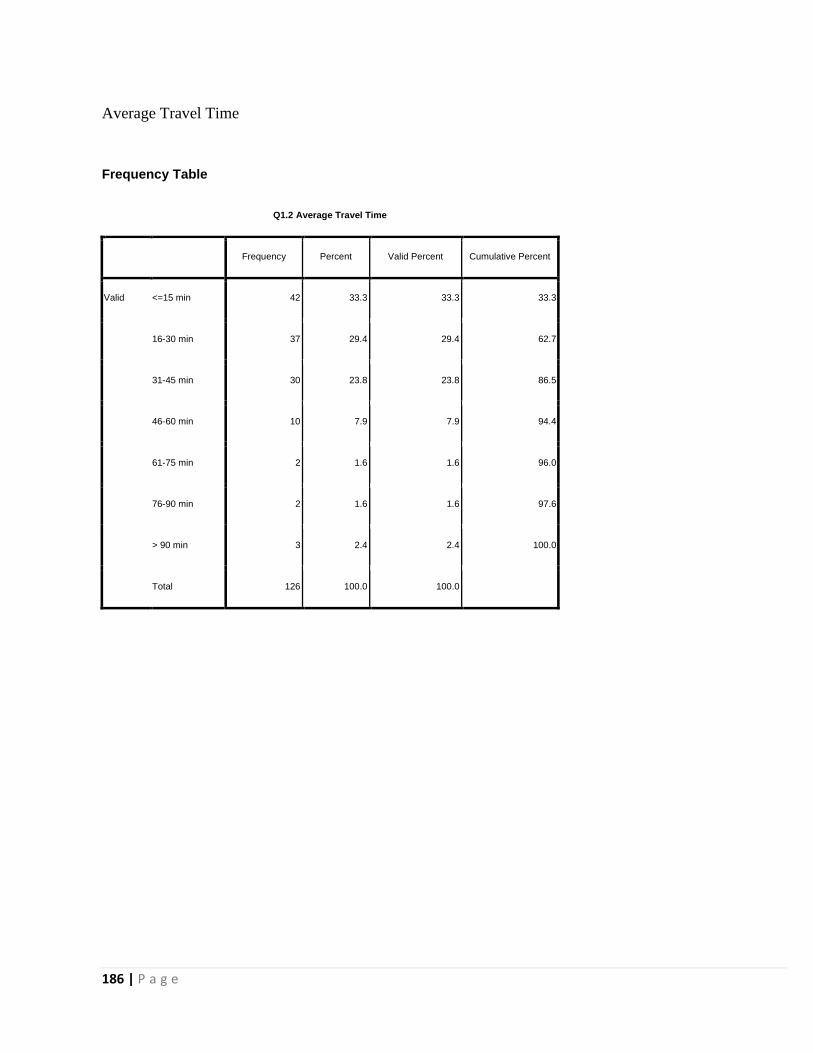
186 | P a g e
Average Travel Time
Frequency Table
Q1.2 Average Travel Time
Frequency Percent Valid Percent Cumulative Percent
Valid <=15 min 42 33.3 33.3 33.3
16-30 min 37 29.4 29.4 62.7
31-45 min 30 23.8 23.8 86.5
46-60 min 10 7.9 7.9 94.4
61-75 min 2 1.6 1.6 96.0
76-90 min 2 1.6 1.6 97.6
> 90 min 3 2.4 2.4 100.0
Total 126 100.0 100.0
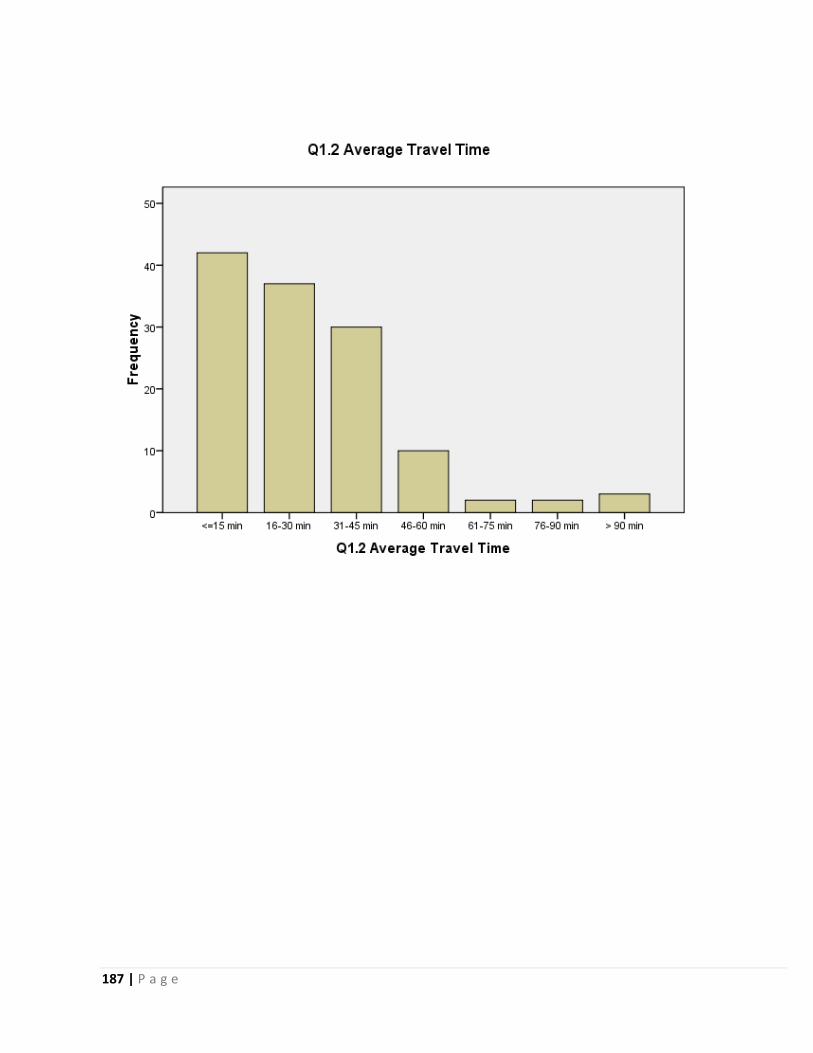
187 | P a g e
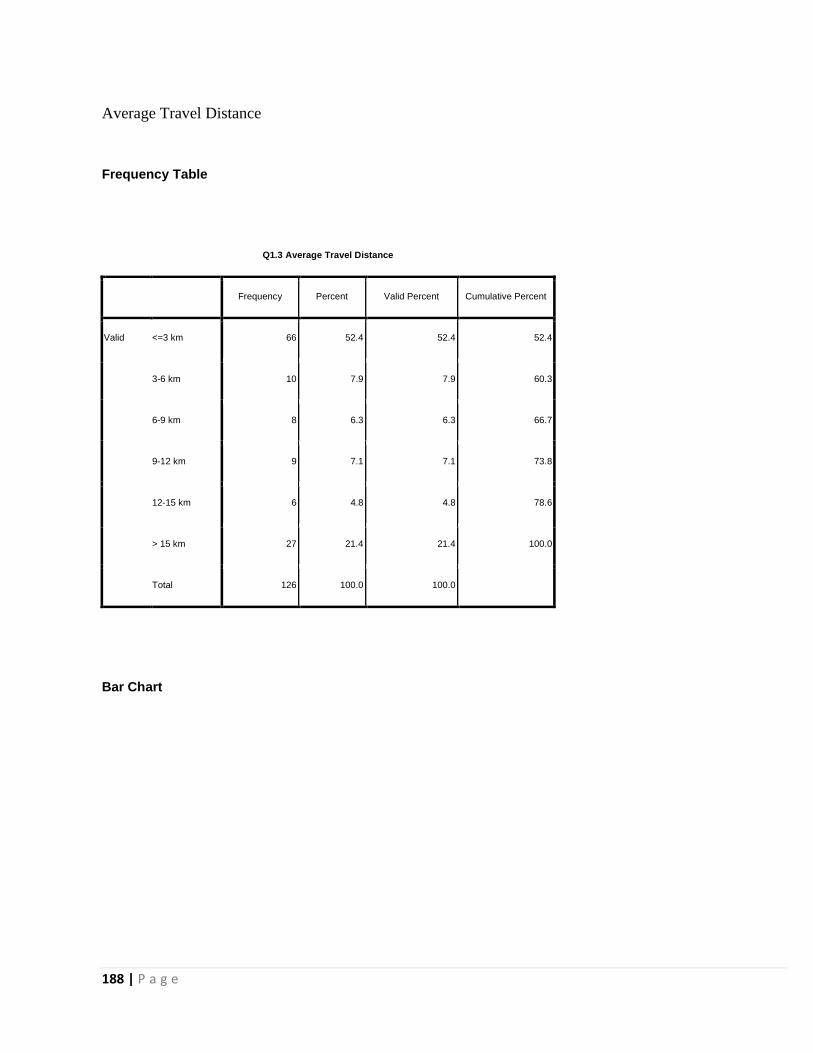
188 | P a g e
Average Travel Distance
Frequency Table
Q1.3 Average Travel Distance
Frequency Percent Valid Percent Cumulative Percent
Valid <=3 km 66 52.4 52.4 52.4
3-6 km 10 7.9 7.9 60.3
6-9 km 8 6.3 6.3 66.7
9-12 km 9 7.1 7.1 73.8
12-15 km 6 4.8 4.8 78.6
> 15 km 27 21.4 21.4 100.0
Total 126 100.0 100.0
Bar Chart
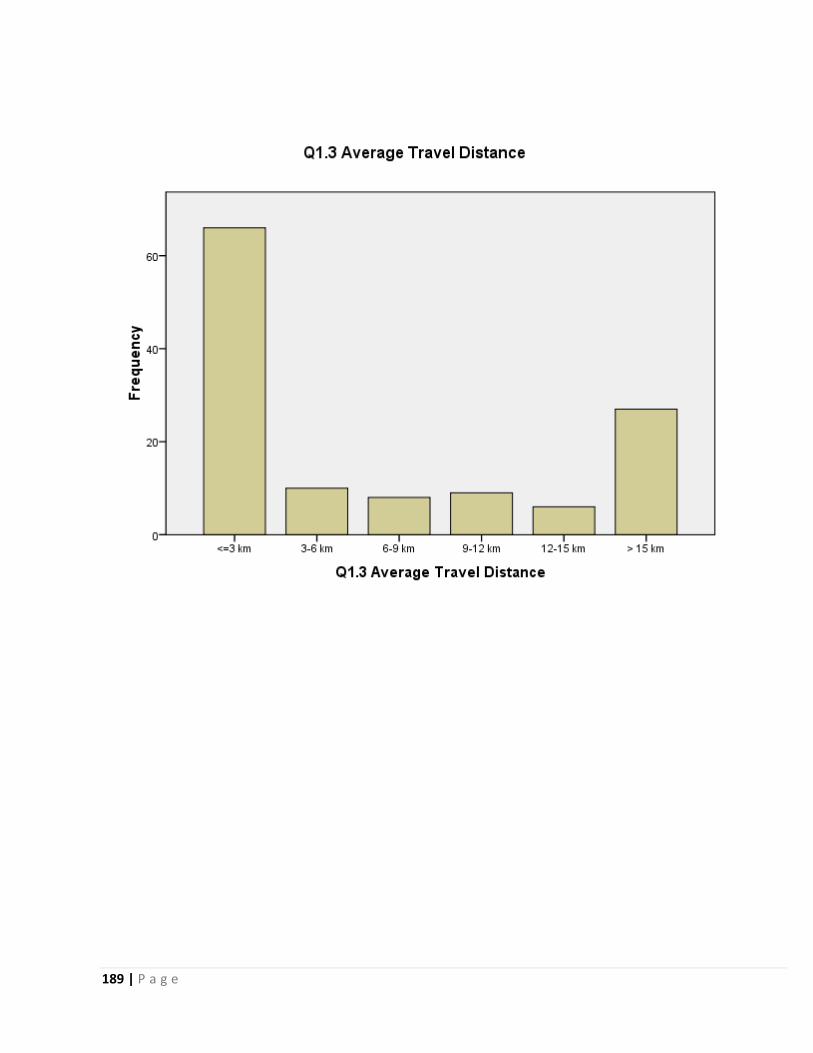
189 | P a g e
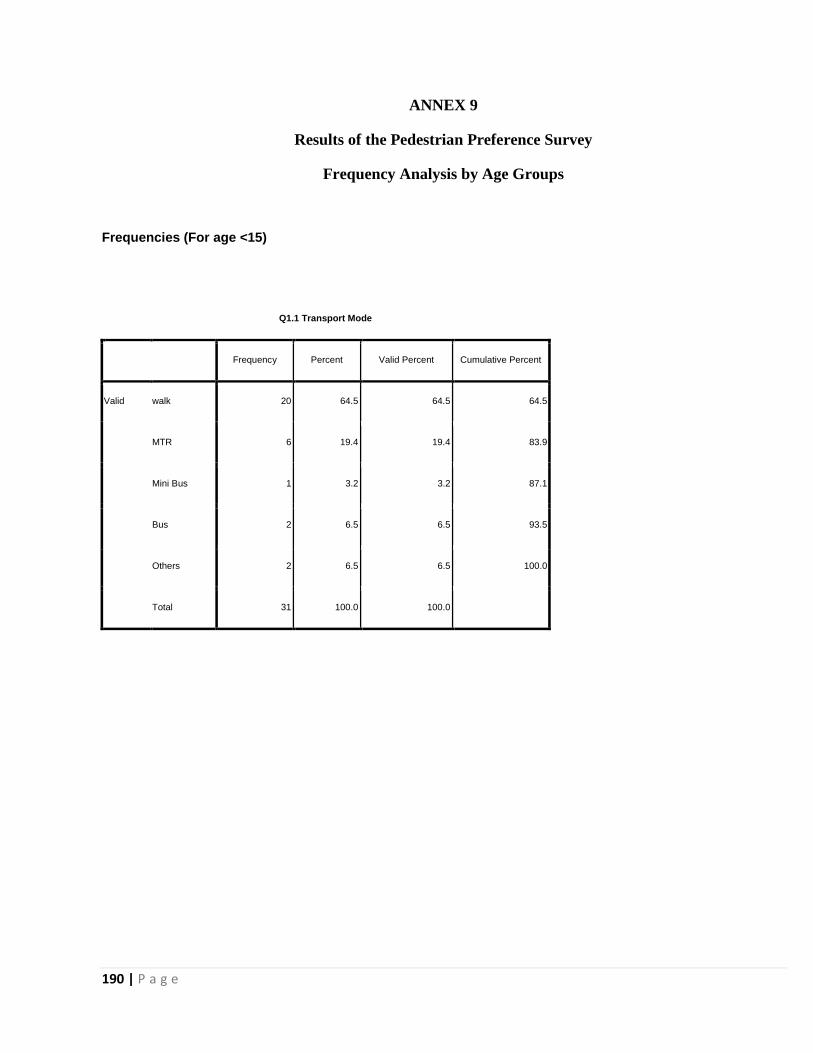
190 | P a g e
ANNEX 9
Results of the Pedestrian Preference Survey
Frequency Analysis by Age Groups
Frequencies (For age <15)
Q1.1 Transport Mode
Frequency Percent Valid Percent Cumulative Percent
Valid walk 20 64.5 64.5 64.5
MTR 6 19.4 19.4 83.9
Mini Bus 1 3.2 3.2 87.1
Bus 2 6.5 6.5 93.5
Others 2 6.5 6.5 100.0
Total 31 100.0 100.0
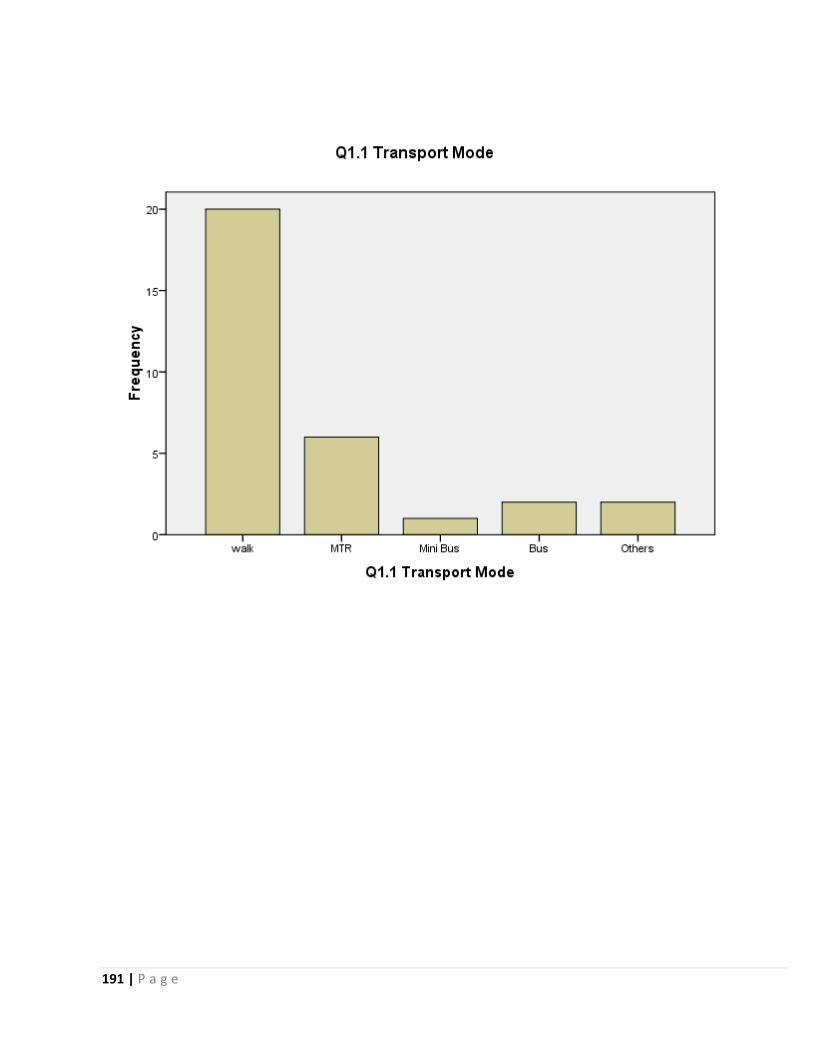
191 | P a g e
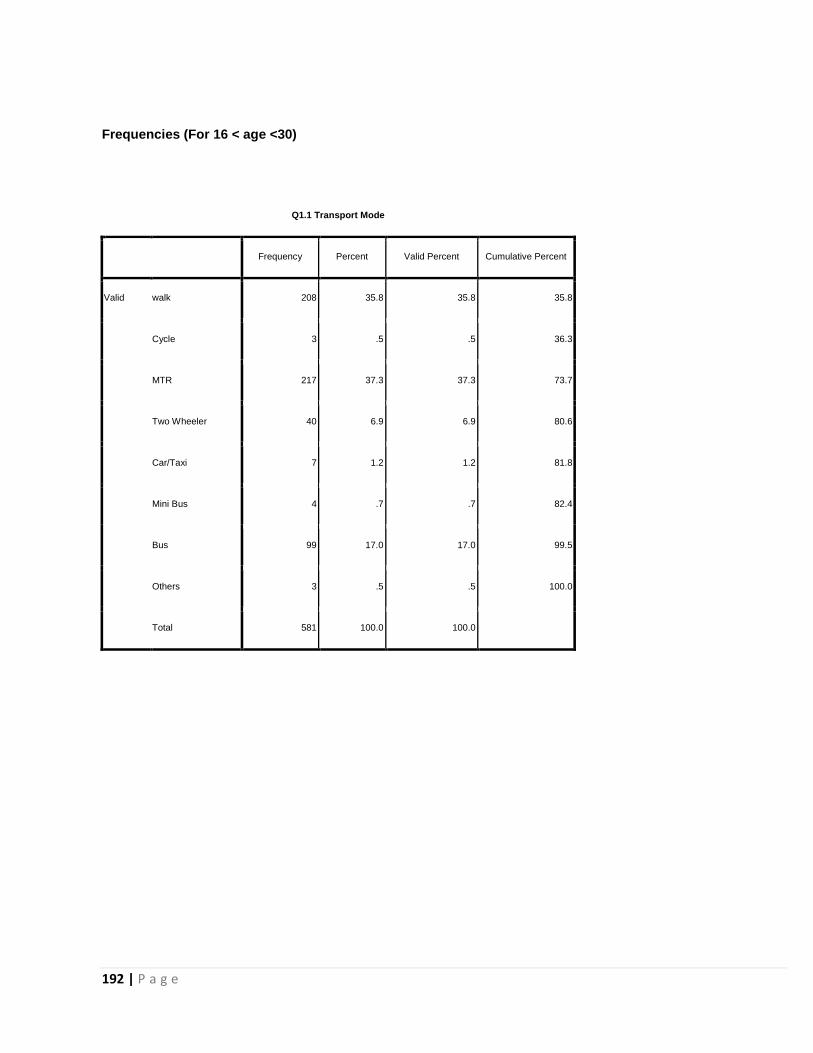
192 | P a g e
Frequencies (For 16 < age <30)
Q1.1 Transport Mode
Frequency Percent Valid Percent Cumulative Percent
Valid walk 208 35.8 35.8 35.8
Cycle 3 .5 .5 36.3
MTR 217 37.3 37.3 73.7
Two Wheeler 40 6.9 6.9 80.6
Car/Taxi 7 1.2 1.2 81.8
Mini Bus 4 .7 .7 82.4
Bus 99 17.0 17.0 99.5
Others 3 .5 .5 100.0
Total 581 100.0 100.0
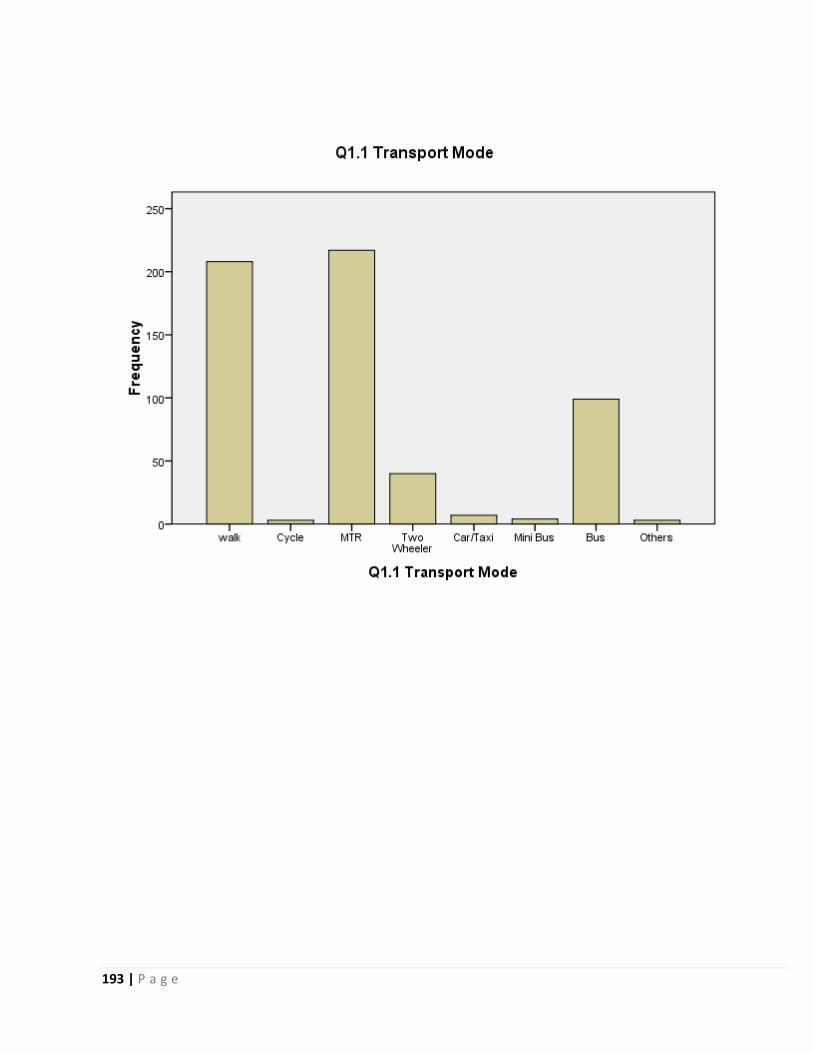
193 | P a g e
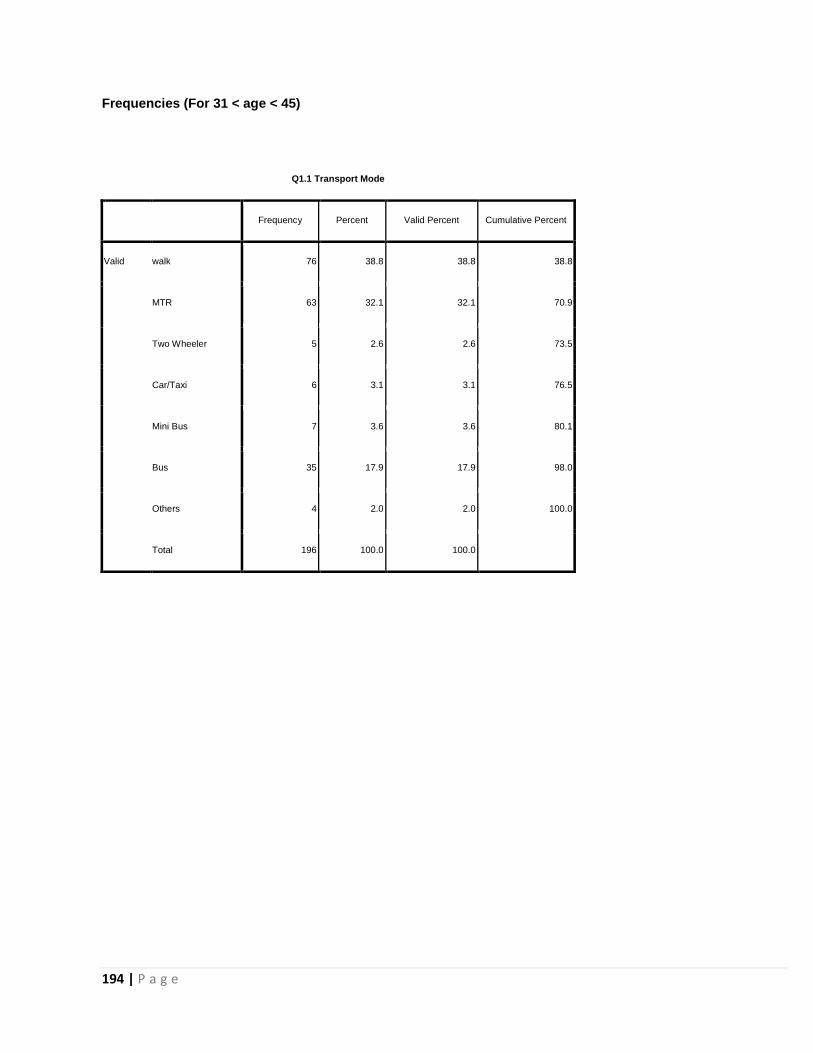
194 | P a g e
Frequencies (For 31 < age < 45)
Q1.1 Transport Mode
Frequency Percent Valid Percent Cumulative Percent
Valid walk 76 38.8 38.8 38.8
MTR 63 32.1 32.1 70.9
Two Wheeler 5 2.6 2.6 73.5
Car/Taxi 6 3.1 3.1 76.5
Mini Bus 7 3.6 3.6 80.1
Bus 35 17.9 17.9 98.0
Others 4 2.0 2.0 100.0
Total 196 100.0 100.0

195 | P a g e
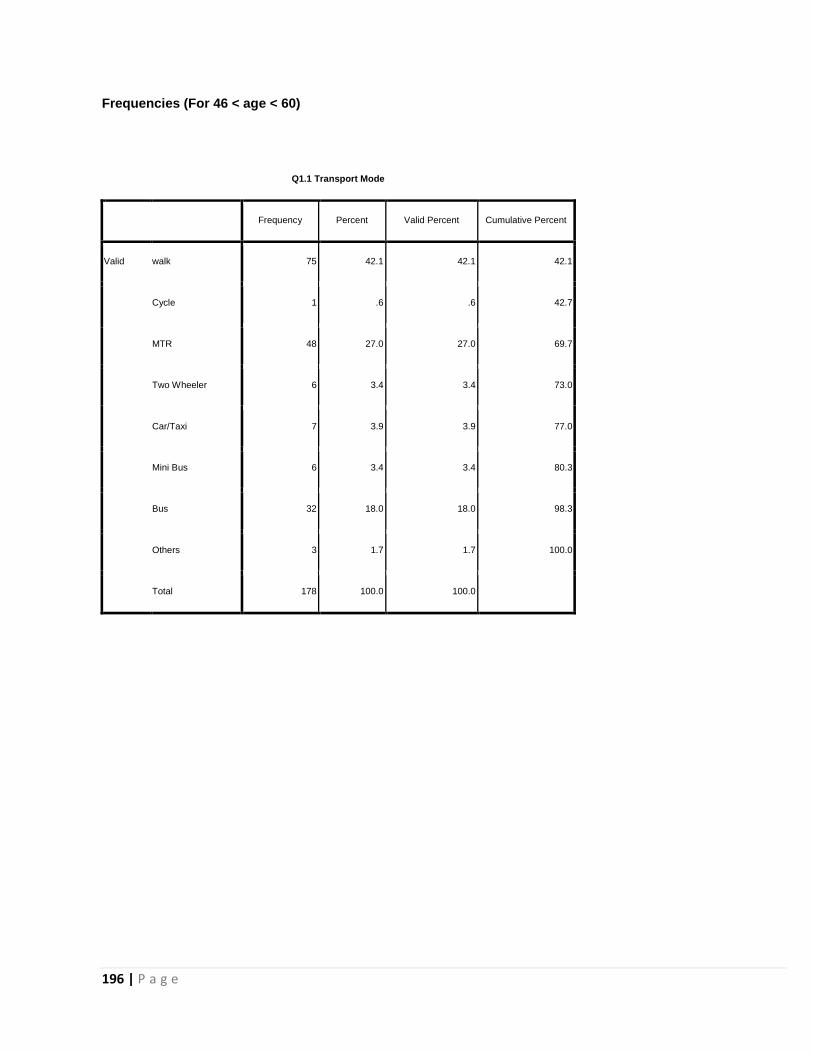
196 | P a g e
Frequencies (For 46 < age < 60)
Q1.1 Transport Mode
Frequency Percent Valid Percent Cumulative Percent
Valid walk 75 42.1 42.1 42.1
Cycle 1 .6 .6 42.7
MTR 48 27.0 27.0 69.7
Two Wheeler 6 3.4 3.4 73.0
Car/Taxi 7 3.9 3.9 77.0
Mini Bus 6 3.4 3.4 80.3
Bus 32 18.0 18.0 98.3
Others 3 1.7 1.7 100.0
Total 178 100.0 100.0
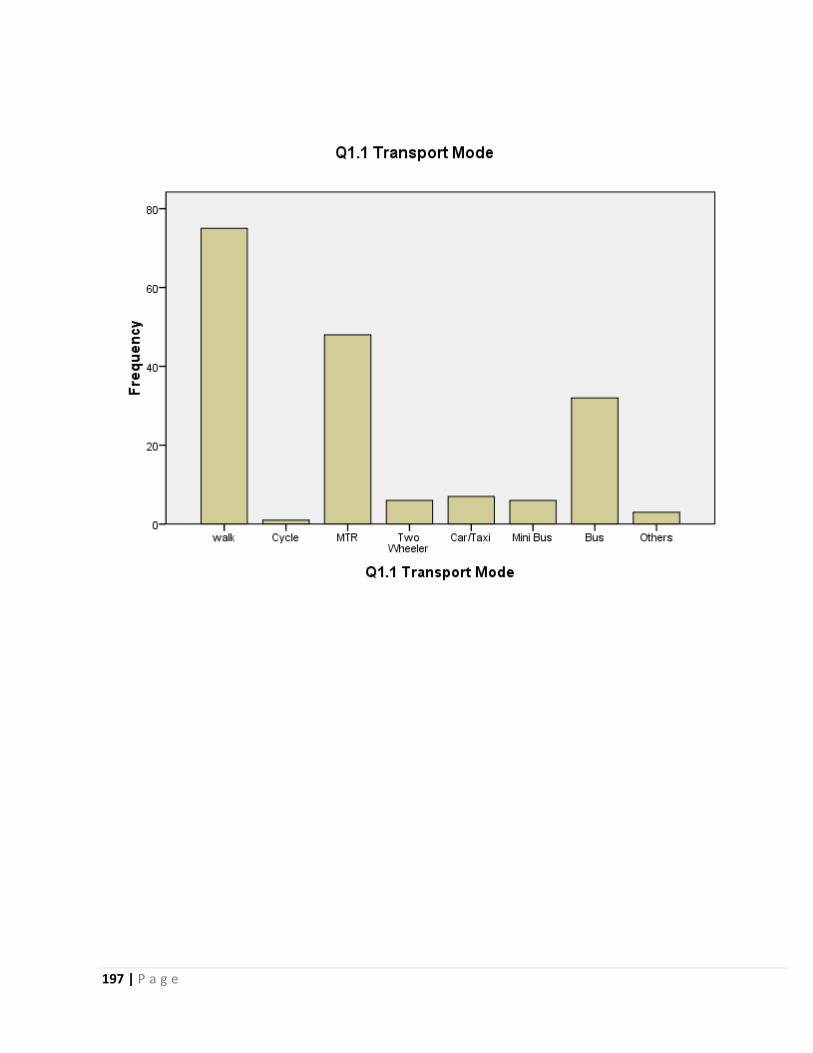
197 | P a g e
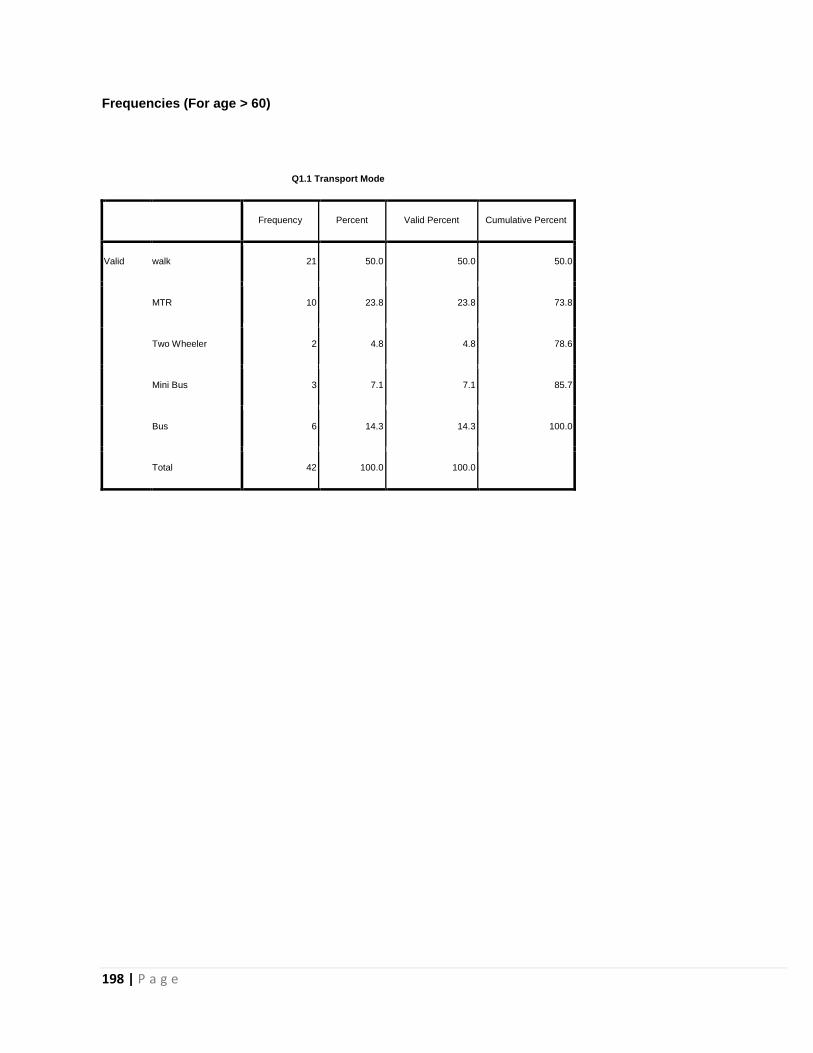
198 | P a g e
Frequencies (For age > 60)
Q1.1 Transport Mode
Frequency Percent Valid Percent Cumulative Percent
Valid walk 21 50.0 50.0 50.0
MTR 10 23.8 23.8 73.8
Two Wheeler 2 4.8 4.8 78.6
Mini Bus 3 7.1 7.1 85.7
Bus 6 14.3 14.3 100.0
Total 42 100.0 100.0

199 | P a g e
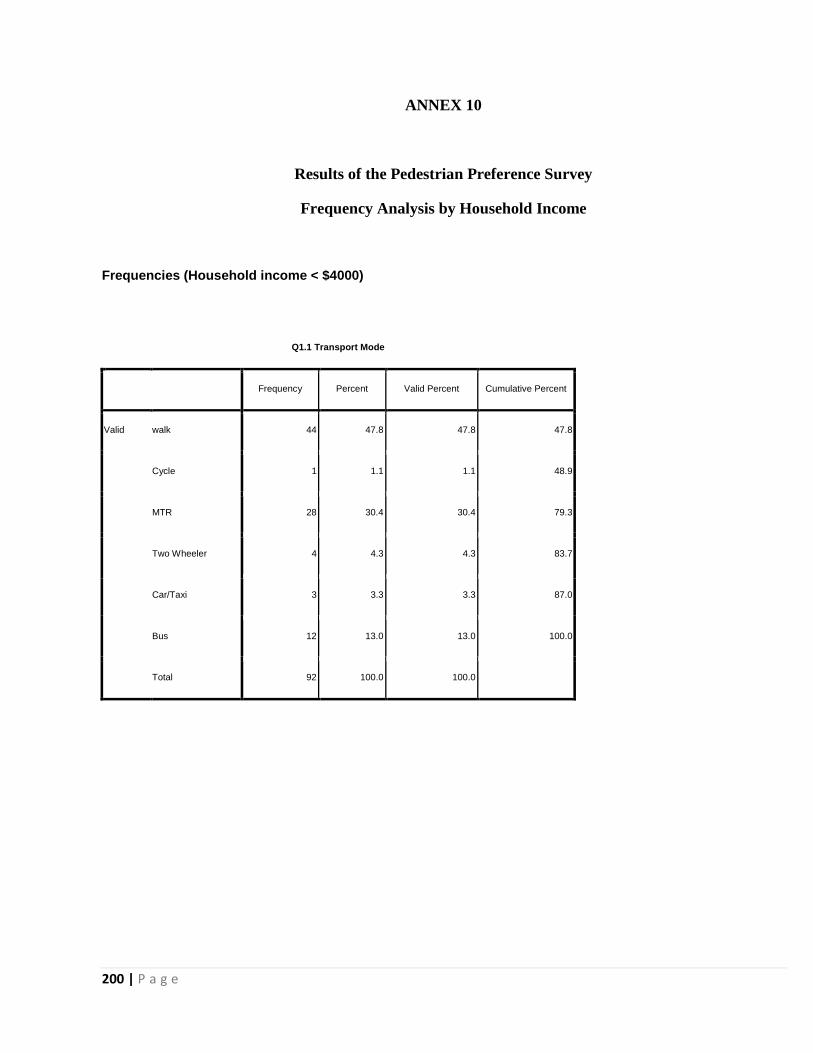
200 | P a g e
ANNEX 10
Results of the Pedestrian Preference Survey
Frequency Analysis by Household Income
Frequencies (Household income < $4000)
Q1.1 Transport Mode
Frequency Percent Valid Percent Cumulative Percent
Valid walk 44 47.8 47.8 47.8
Cycle 1 1.1 1.1 48.9
MTR 28 30.4 30.4 79.3
Two Wheeler 4 4.3 4.3 83.7
Car/Taxi 3 3.3 3.3 87.0
Bus 12 13.0 13.0 100.0
Total 92 100.0 100.0
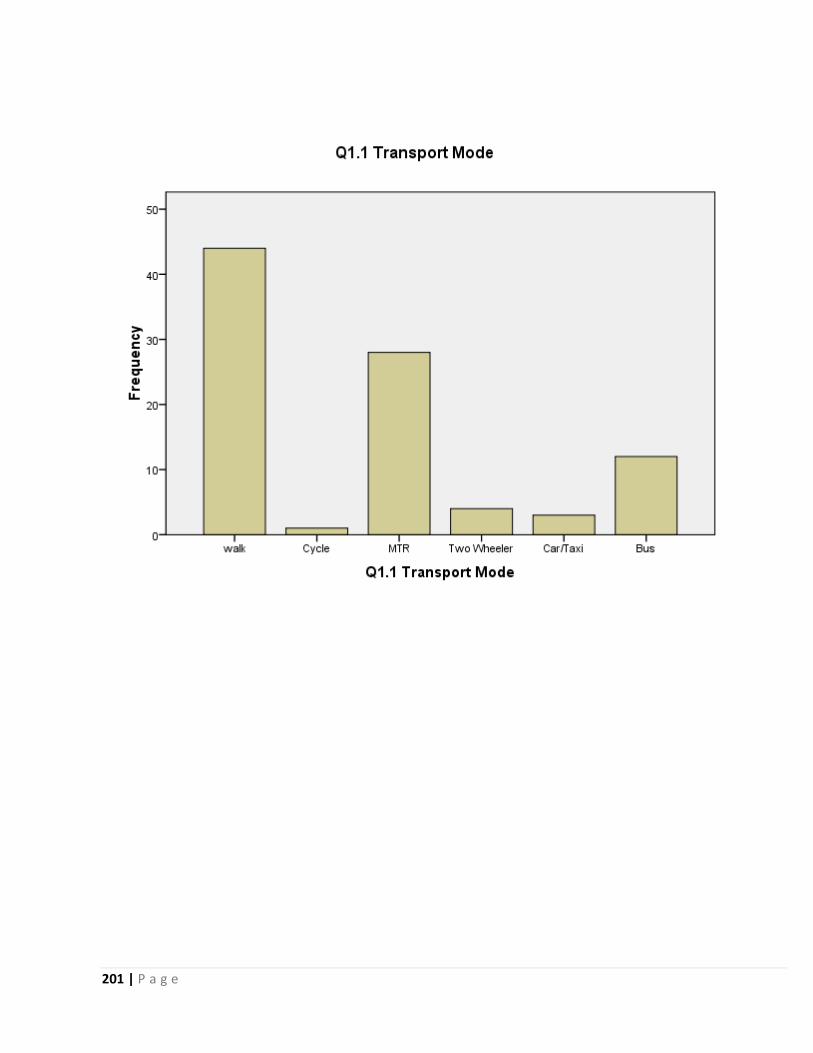
201 | P a g e
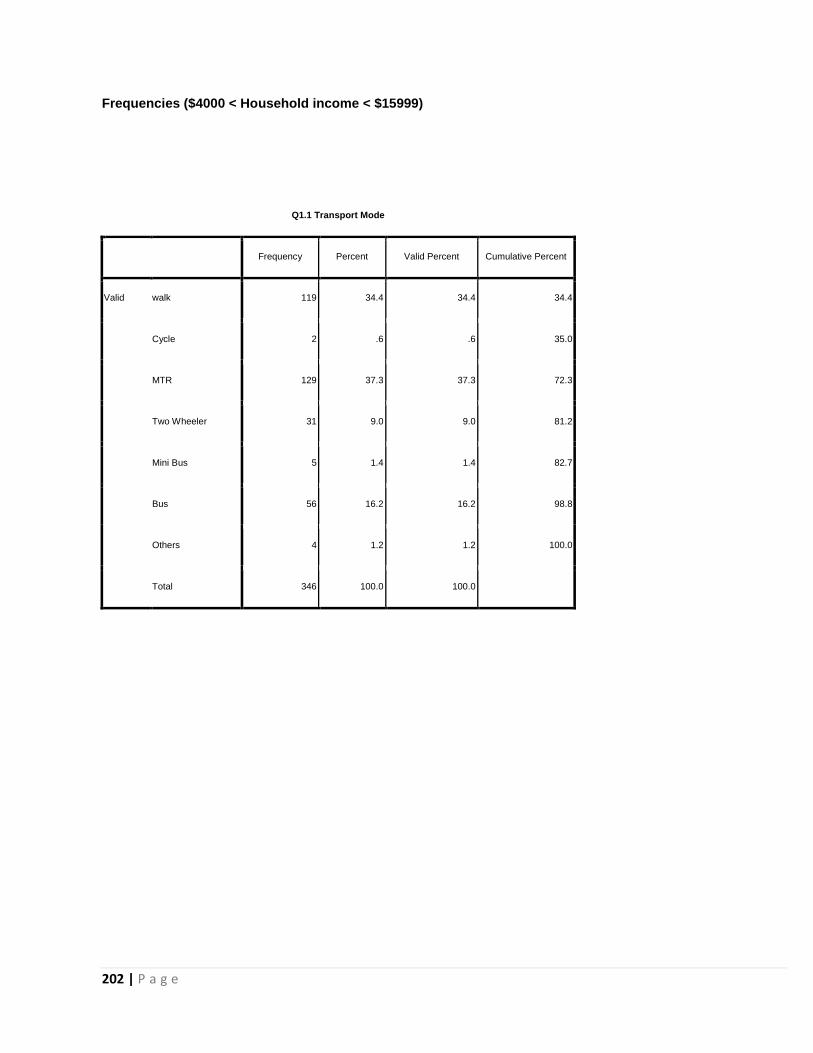
202 | P a g e
Frequencies ($4000 < Household income < $15999)
Q1.1 Transport Mode
Frequency Percent Valid Percent Cumulative Percent
Valid walk 119 34.4 34.4 34.4
Cycle 2 .6 .6 35.0
MTR 129 37.3 37.3 72.3
Two Wheeler 31 9.0 9.0 81.2
Mini Bus 5 1.4 1.4 82.7
Bus 56 16.2 16.2 98.8
Others 4 1.2 1.2 100.0
Total 346 100.0 100.0
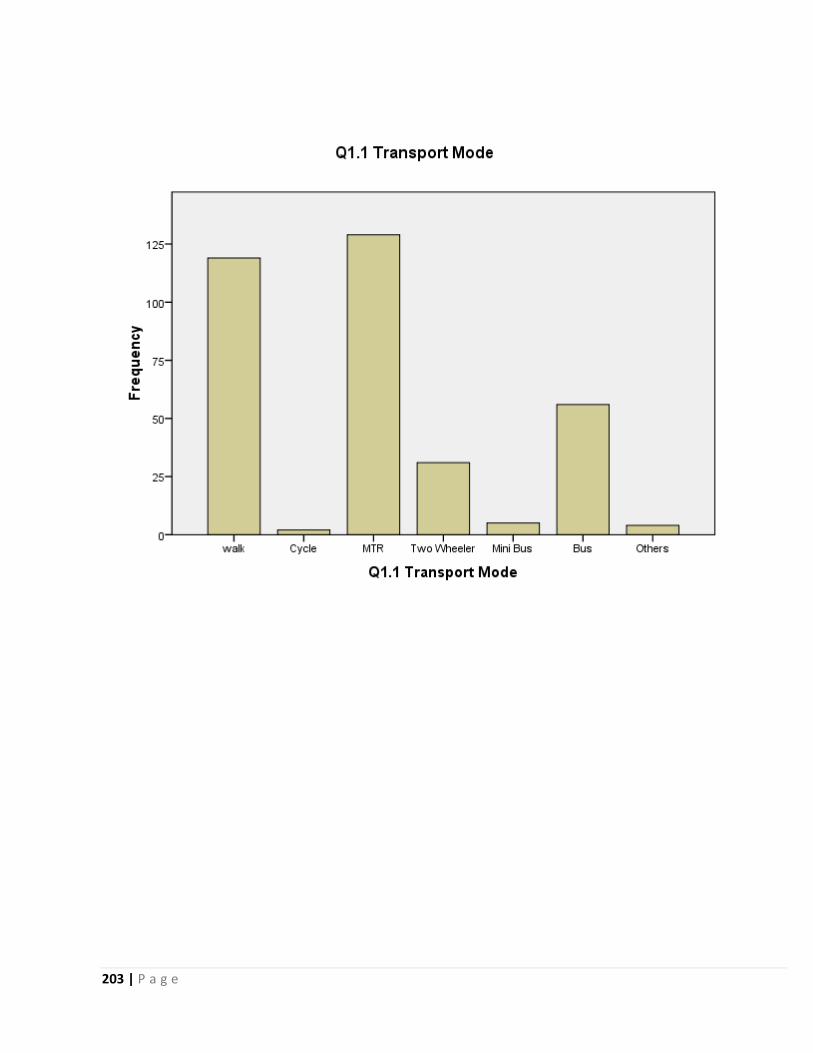
203 | P a g e
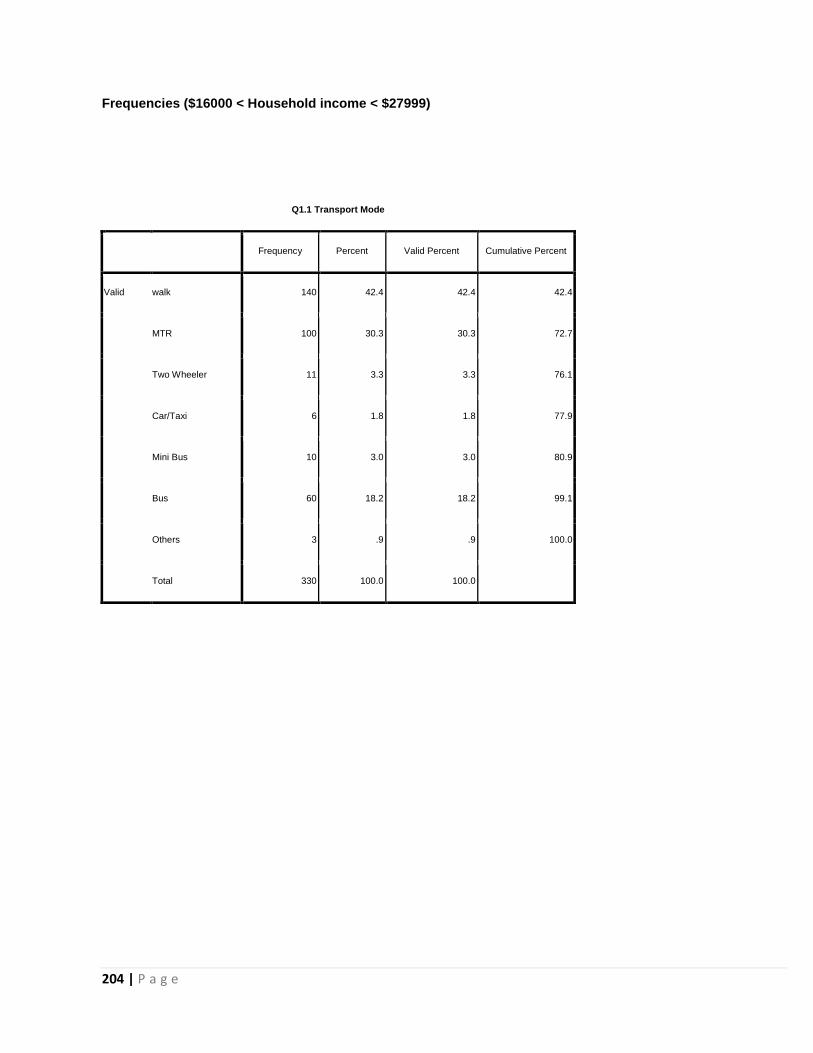
204 | P a g e
Frequencies ($16000 < Household income < $27999)
Q1.1 Transport Mode
Frequency Percent Valid Percent Cumulative Percent
Valid walk 140 42.4 42.4 42.4
MTR 100 30.3 30.3 72.7
Two Wheeler 11 3.3 3.3 76.1
Car/Taxi 6 1.8 1.8 77.9
Mini Bus 10 3.0 3.0 80.9
Bus 60 18.2 18.2 99.1
Others 3 .9 .9 100.0
Total 330 100.0 100.0
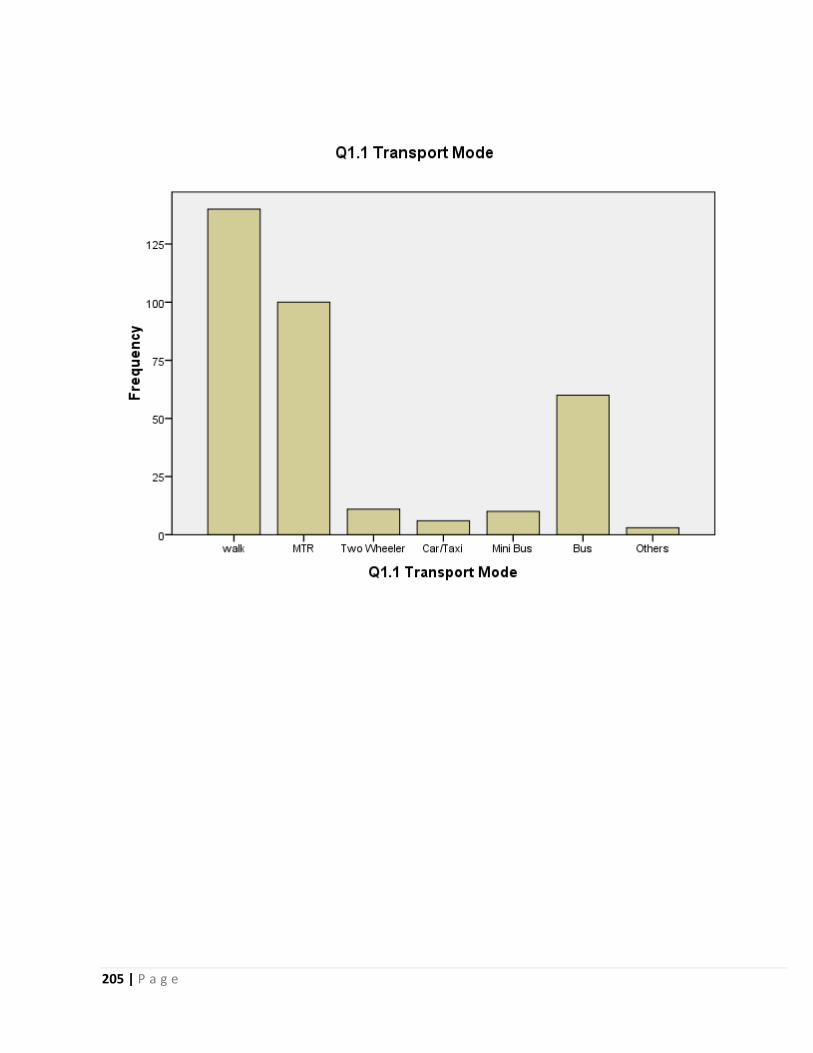
205 | P a g e
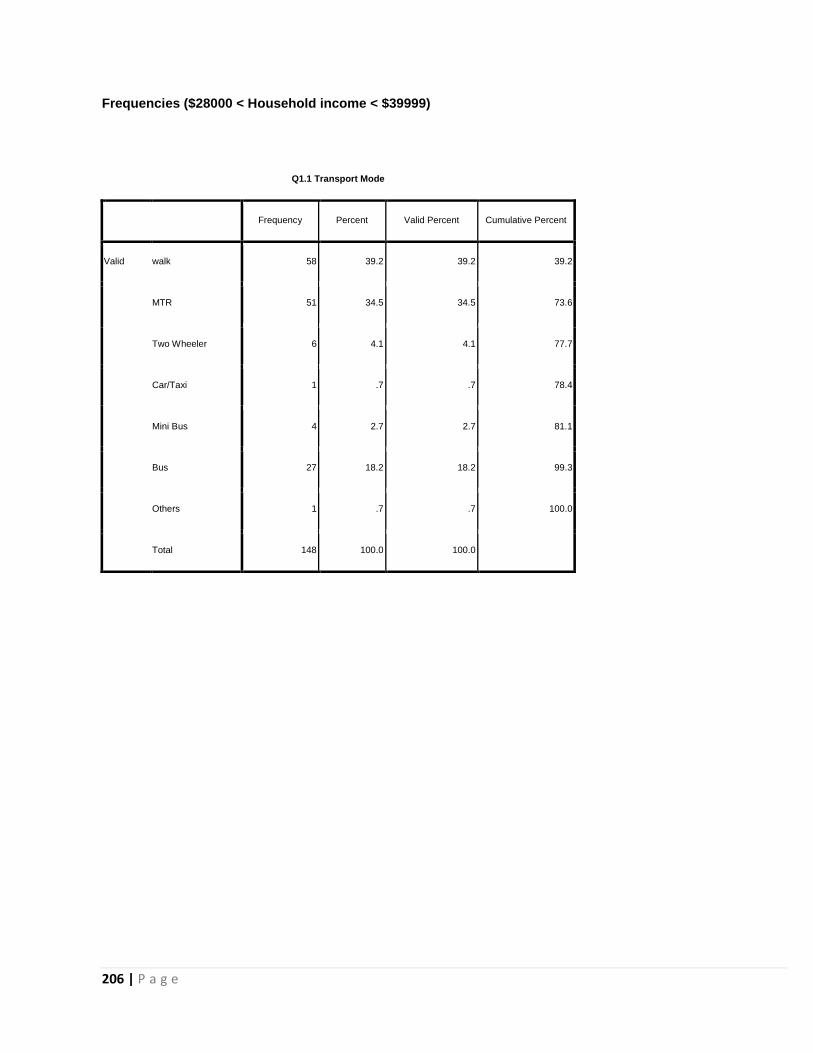
206 | P a g e
Frequencies ($28000 < Household income < $39999)
Q1.1 Transport Mode
Frequency Percent Valid Percent Cumulative Percent
Valid walk 58 39.2 39.2 39.2
MTR 51 34.5 34.5 73.6
Two Wheeler 6 4.1 4.1 77.7
Car/Taxi 1 .7 .7 78.4
Mini Bus 4 2.7 2.7 81.1
Bus 27 18.2 18.2 99.3
Others 1 .7 .7 100.0
Total 148 100.0 100.0

207 | P a g e
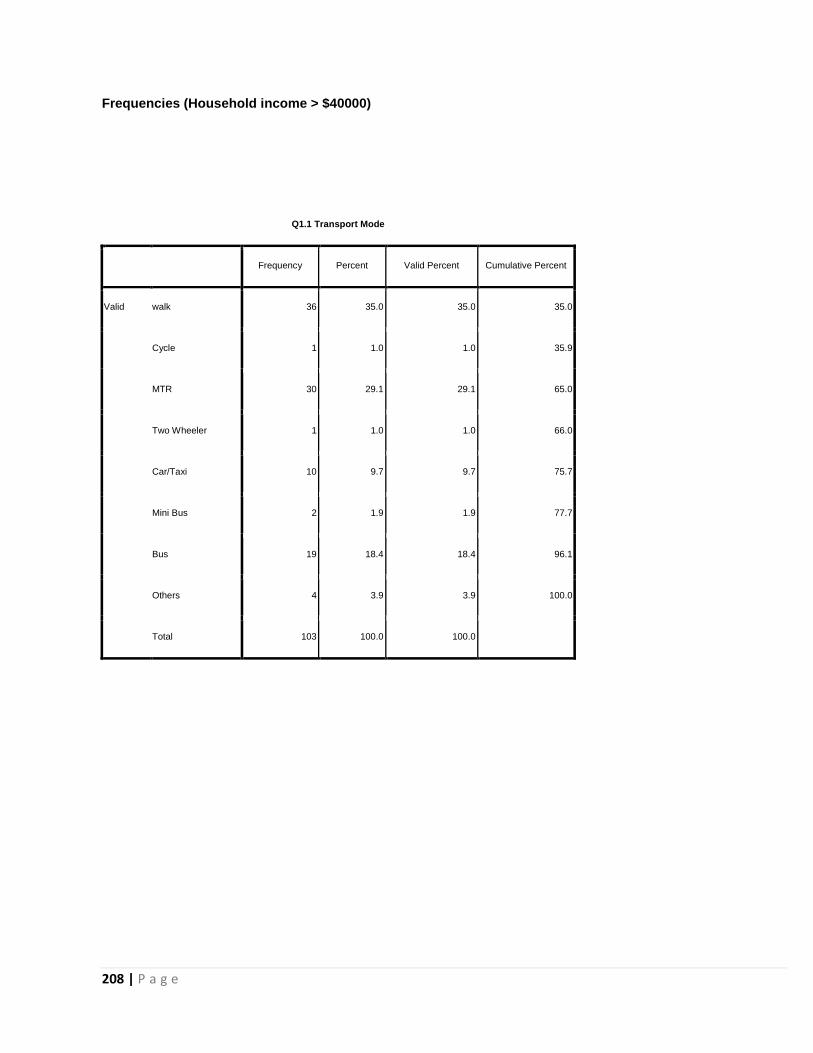
208 | P a g e
Frequencies (Household income > $40000)
Q1.1 Transport Mode
Frequency Percent Valid Percent Cumulative Percent
Valid walk 36 35.0 35.0 35.0
Cycle 1 1.0 1.0 35.9
MTR 30 29.1 29.1 65.0
Two Wheeler 1 1.0 1.0 66.0
Car/Taxi 10 9.7 9.7 75.7
Mini Bus 2 1.9 1.9 77.7
Bus 19 18.4 18.4 96.1
Others 4 3.9 3.9 100.0
Total 103 100.0 100.0
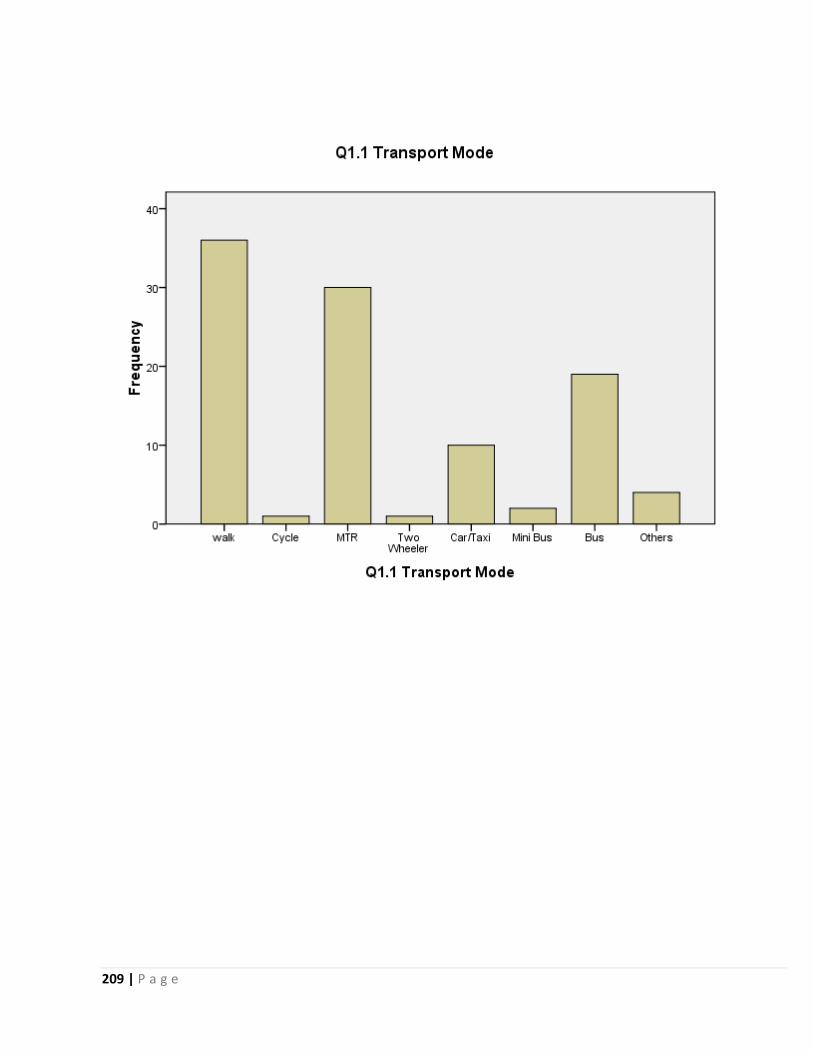
209 | P a g e