Embed Size (px)
Citation preview
Results of Hong Kong Carbon
Performance Survey
Shirlee Algire
Executive Manager, Sustainability
29 May, 2015
2
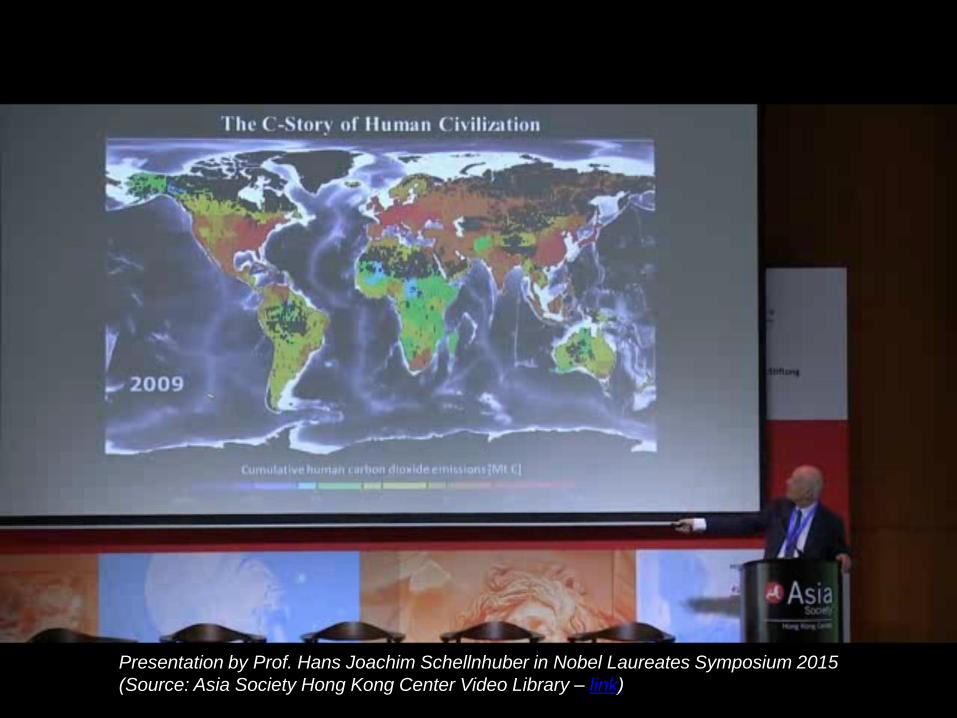
Presentation by Prof. Hans Joachim Schellnhuber in Nobel Laureates Symposium 2015
(Source: Asia Society Hong Kong Center Video Library – link)
3
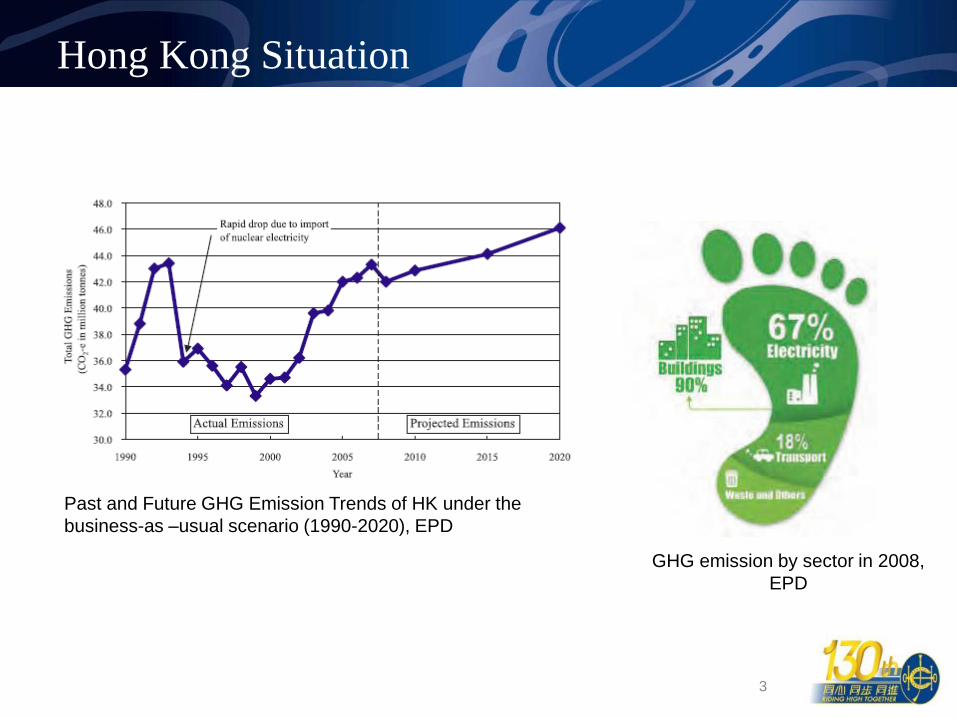
Hong Kong Situation
Past and Future GHG Emission Trends of HK under the
business-as –usual scenario (1990-2020), EPD
GHG emission by sector in 2008,
EPD
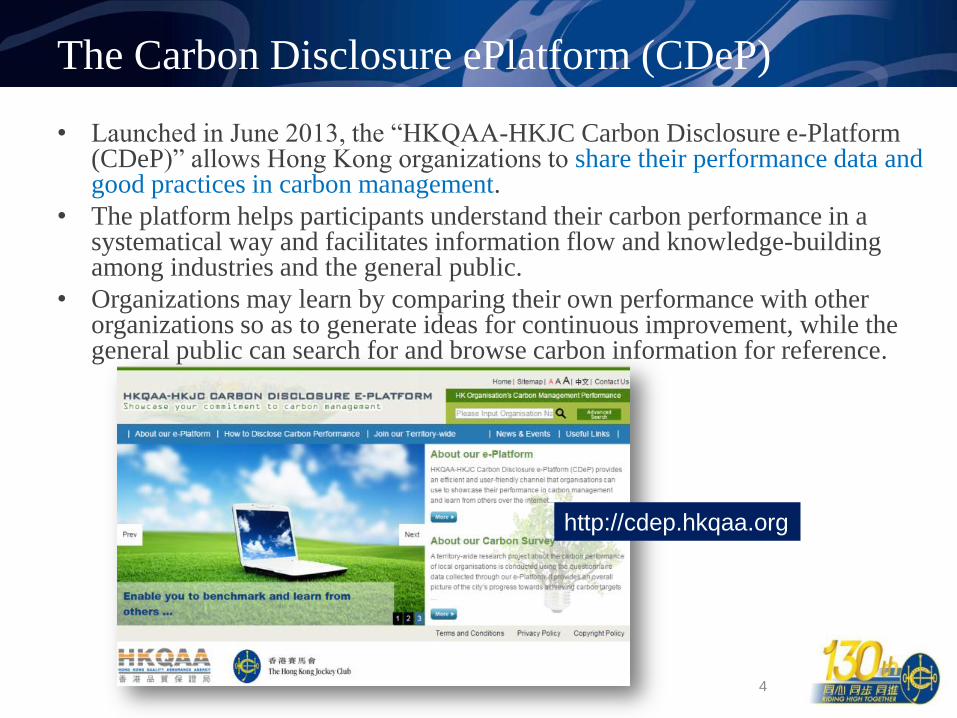
• Launched in June 2013, the “HKQAA-HKJC Carbon Disclosure e-Platform (CDeP)” allows Hong Kong organizations to share their performance data and good practices in carbon management.
• The platform helps participants understand their carbon performance in a systematical way and facilitates information flow and knowledge-building among industries and the general public.
• Organizations may learn by comparing their own performance with other organizations so as to generate ideas for continuous improvement, while the general public can search for and browse carbon information for reference.
4
The Carbon Disclosure ePlatform (CDeP)
http://cdep.hkqaa.org
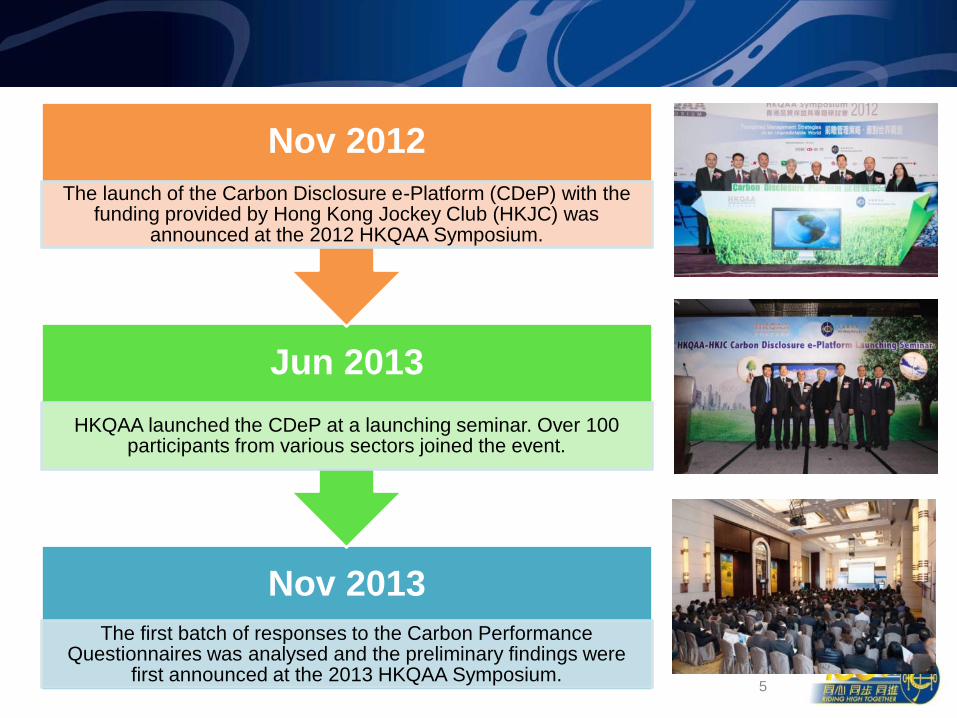
Milestones of CDeP
5
Nov 2013
The first batch of responses to the Carbon Performance Questionnaires was analysed and the preliminary findings were
first announced at the 2013 HKQAA Symposium.
Jun 2013
HKQAA launched the CDeP at a launching seminar. Over 100 participants from various sectors joined the event.
Nov 2012
The launch of the Carbon Disclosure e-Platform (CDeP) with the funding provided by Hong Kong Jockey Club (HKJC) was
announced at the 2012 HKQAA Symposium.
Milestones of CDeP
6
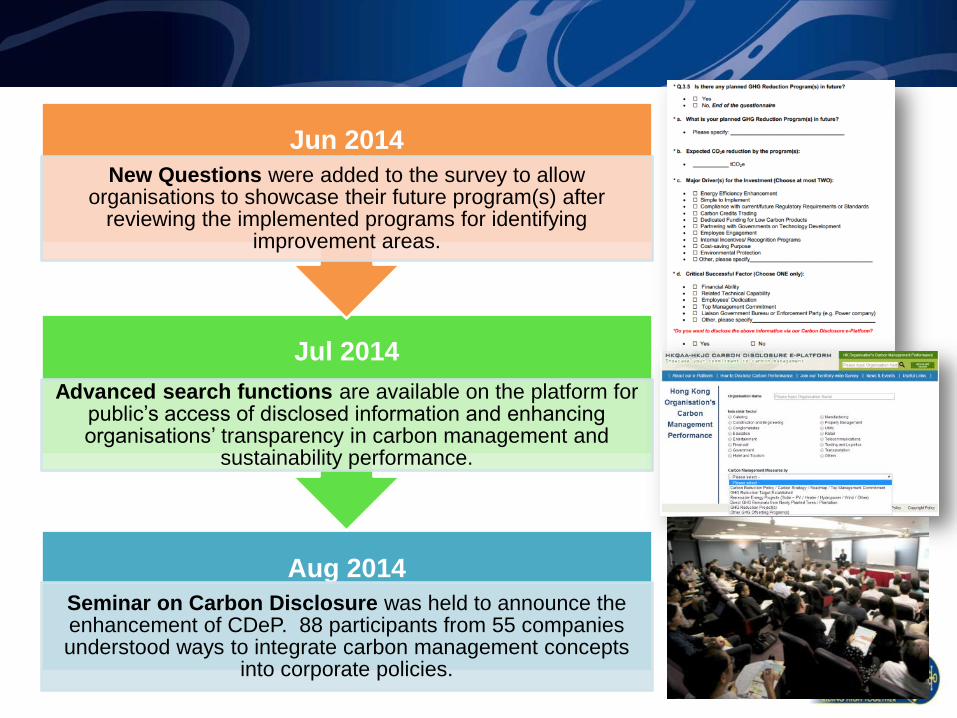
Aug 2014
Seminar on Carbon Disclosure was held to announce the enhancement of CDeP. 88 participants from 55 companies understood ways to integrate carbon management concepts
into corporate policies.
Jul 2014
Advanced search functions are available on the platform for public’s access of disclosed information and enhancing organisations’ transparency in carbon management and
sustainability performance.
Jun 2014
New Questions were added to the survey to allow organisations to showcase their future program(s) after
reviewing the implemented programs for identifying improvement areas.

Milestones of CDeP
7
Now
As of 30 Apr 2015, a total of 158 visits to the CDeP questionnaire were recorded.
31 submissions of the “Carbon Performance Questionnaire” were received through CDeP
reporting a total of 130,480,906 tCO2e emissions.
Mar & Apr 2015
CDeP was promoted at 3 sustainability and CSR-related seminars of HKQAA held on 16 Mar, 31 Mar
and 23 Apr reaching around 115 participants from over 80 companies.

Education 3%
Trading and Logistics 3% Government
7%
Transportation 6%
Financial 10%
Property Management
10%
Other 13%
Construction and Engineering
16%
Utility 32%
Respondents’ Industrial Sectors
8
Distribution of Submissions by
Industrial Sectors

Scope 1 7%
Scope 2 93%
Scope 3 0%
Overall Emissions
9
The Emissions Distribution
Scope 1 90%
Scope 2 1%
Scope 3 9%
(Excluding Utility & Transportation)
Scope 1 Emissions 117,449,705 tCO2e / year
Scope 2 Emissions 925,176 tCO2e / year
Scopes 1 & 2 Emissions 118,374,881 tCO2e / year
Scope 3 Emissions 12,107,190 tCO2e / year
Overall Emissions (Scopes 1, 2 & 3
Emissions) 130,480,906 tCO2e / year
GHG Reduction -102,535 tCO2e / year
Scopes 1 & 2 Emissions + GHG
Reduction 118,272,346 tCO2e / year
Scopes 1, 2 & 3 Emissions + GHG
Reduction 130,378,370 tCO2e / year
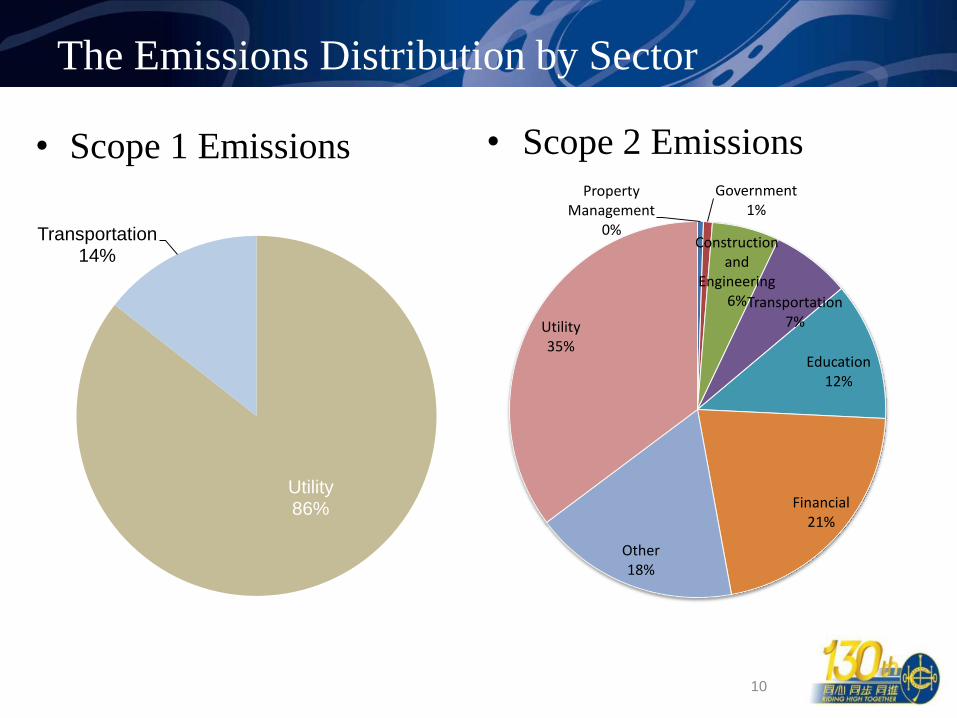
• Scope 1 Emissions
10
The Emissions Distribution by Sector
Utility 86%
Transportation 14%
• Scope 2 Emissions
Property Management
0%
Government 1%
Construction and
Engineering 6% Transportation
7%
Education 12%
Financial 21%
Other 18%
Utility 35%
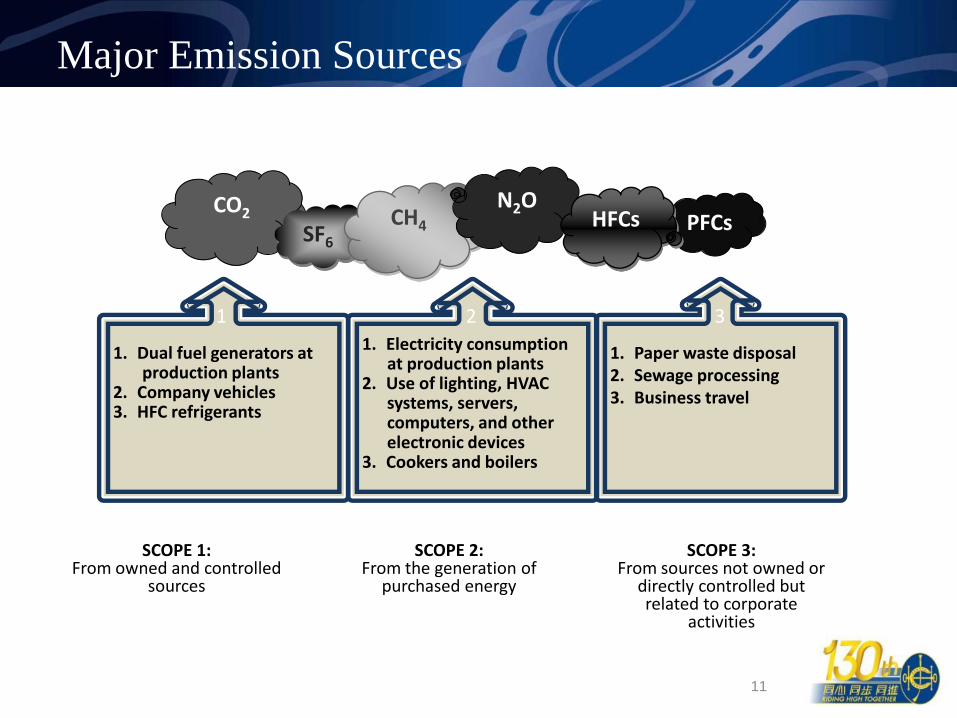
1. Dual fuel generators at production plants 2. Company vehicles 3. HFC refrigerants
1. Electricity consumption at production plants 2. Use of lighting, HVAC systems, servers, computers, and other electronic devices 3. Cookers and boilers
1. Paper waste disposal 2. Sewage processing 3. Business travel
Major Emission Sources
11
1 2 3
SCOPE 1: From owned and controlled
sources
SCOPE 2: From the generation of
purchased energy
SCOPE 3: From sources not owned or
directly controlled but related to corporate
activities
PFCs CO2
SF6 CH4
N2O HFCs
Commitments to Reduce Emissions
• 48% Carbon Reduction Policies
• Around 90% provided GHG reduction targets.
• The GHG reduction targets range from 2 – 31% to be
achieved in 3-9 years
• 60% of the submissions provided the programs in support of
emission reduction
12
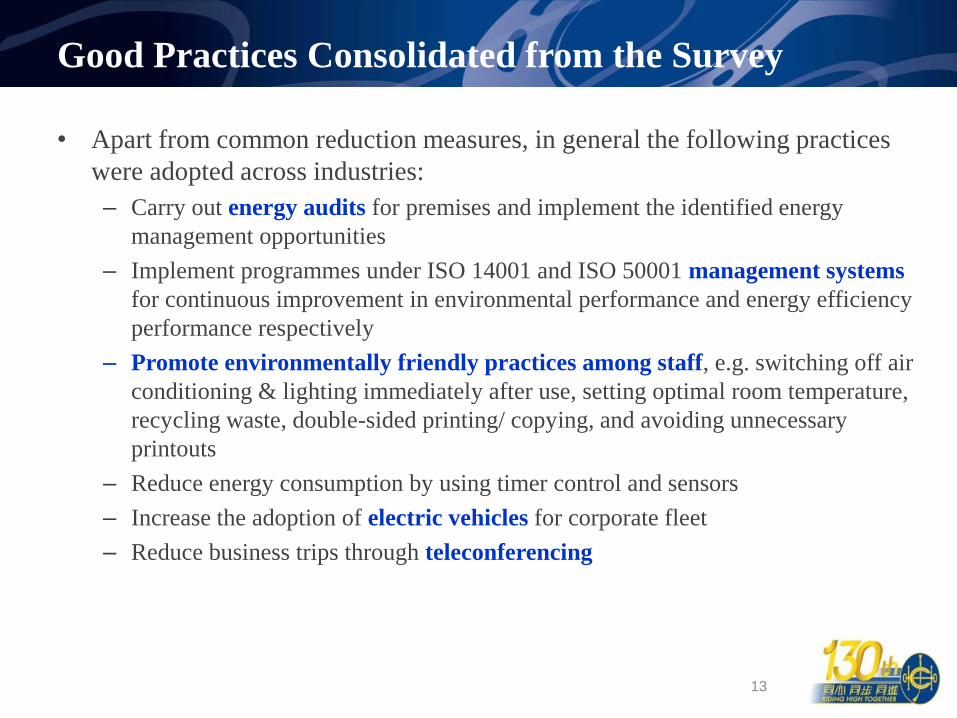
• Apart from common reduction measures, in general the following practices
were adopted across industries:
– Carry out energy audits for premises and implement the identified energy
management opportunities
– Implement programmes under ISO 14001 and ISO 50001 management systems
for continuous improvement in environmental performance and energy efficiency
performance respectively
– Promote environmentally friendly practices among staff, e.g. switching off air
conditioning & lighting immediately after use, setting optimal room temperature,
recycling waste, double-sided printing/ copying, and avoiding unnecessary
printouts
– Reduce energy consumption by using timer control and sensors
– Increase the adoption of electric vehicles for corporate fleet
– Reduce business trips through teleconferencing
13
Good Practices Consolidated from the Survey
14
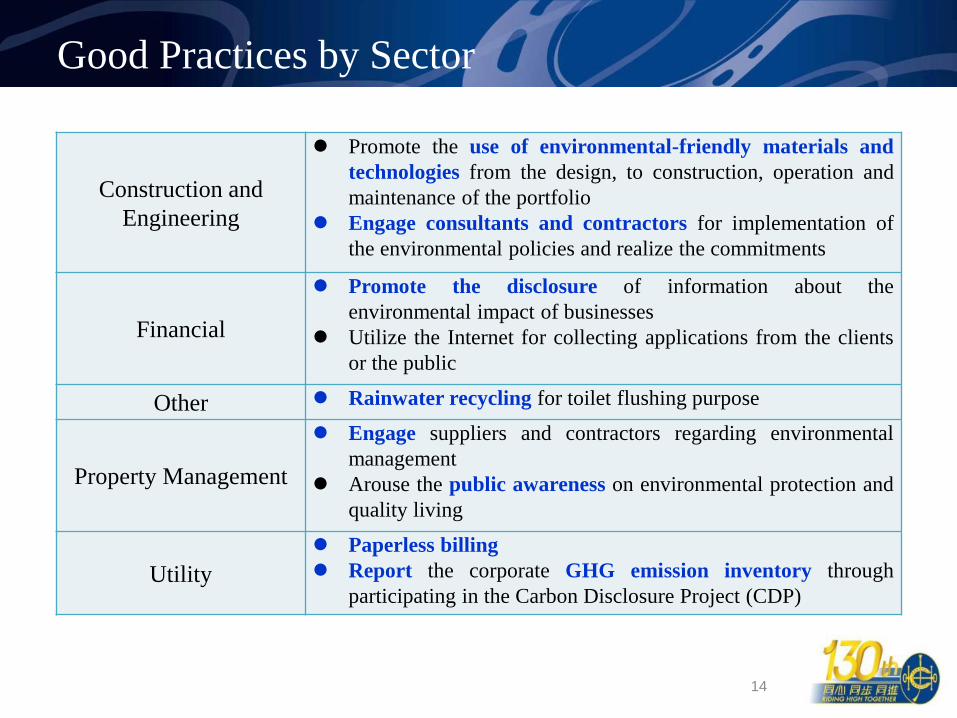
Good Practices by Sector
Construction and
Engineering
Promote the use of environmental-friendly materials and
technologies from the design, to construction, operation and
maintenance of the portfolio
Engage consultants and contractors for implementation of
the environmental policies and realize the commitments
Financial
Promote the disclosure of information about the
environmental impact of businesses
Utilize the Internet for collecting applications from the clients
or the public
Other Rainwater recycling for toilet flushing purpose
Property Management
Engage suppliers and contractors regarding environmental
management
Arouse the public awareness on environmental protection and
quality living
Utility
Paperless billing
Report the corporate GHG emission inventory through
participating in the Carbon Disclosure Project (CDP)
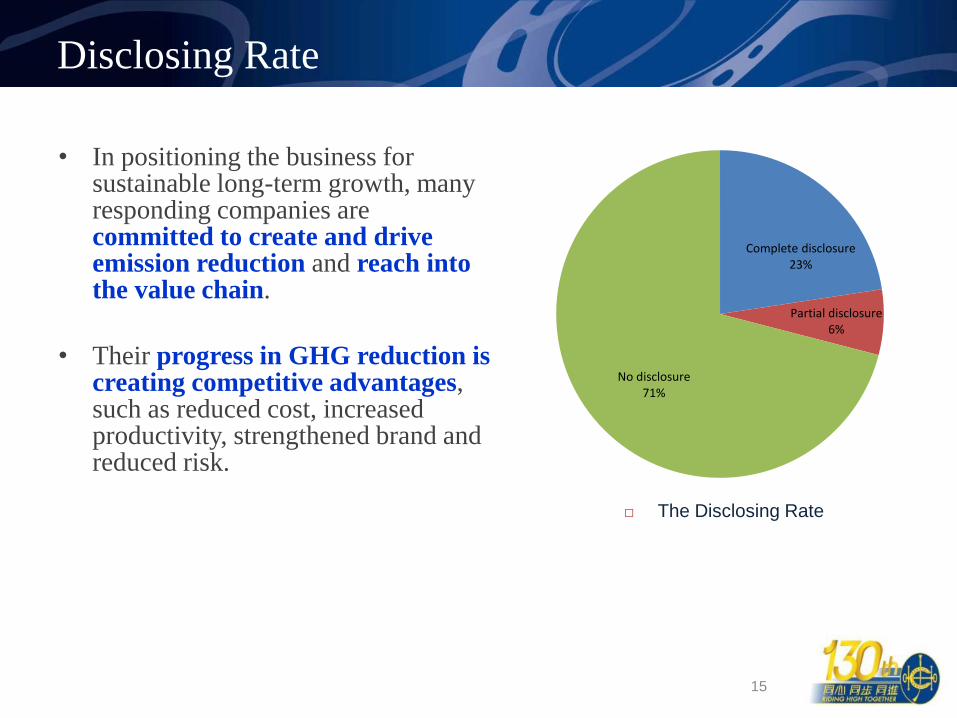
Disclosing Rate
• In positioning the business for sustainable long-term growth, many responding companies are committed to create and drive emission reduction and reach into the value chain.
• Their progress in GHG reduction is creating competitive advantages, such as reduced cost, increased productivity, strengthened brand and reduced risk.
15
The Disclosing Rate
Complete disclosure 23%
Partial disclosure 6%
No disclosure 71%
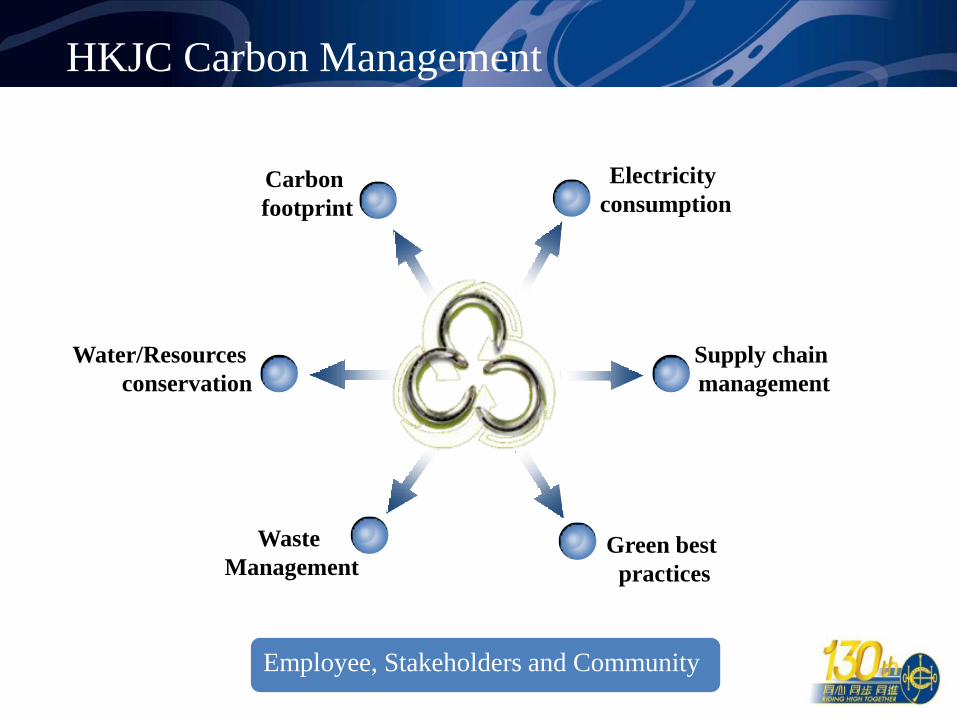
Electricity
consumption Carbon
footprint
Supply chain
management
Green best
practices
Water/Resources
conservation
Waste
Management
HKJC Carbon Management
Employee, Stakeholders and Community

Charities Trust Environmental Projects
• HK$54 million donation on a five-year community engagement
programme - CUHK Jockey Club Initiative Gaia
• Jockey Club Museum of Climate Change
• Go Green Community
• Public education
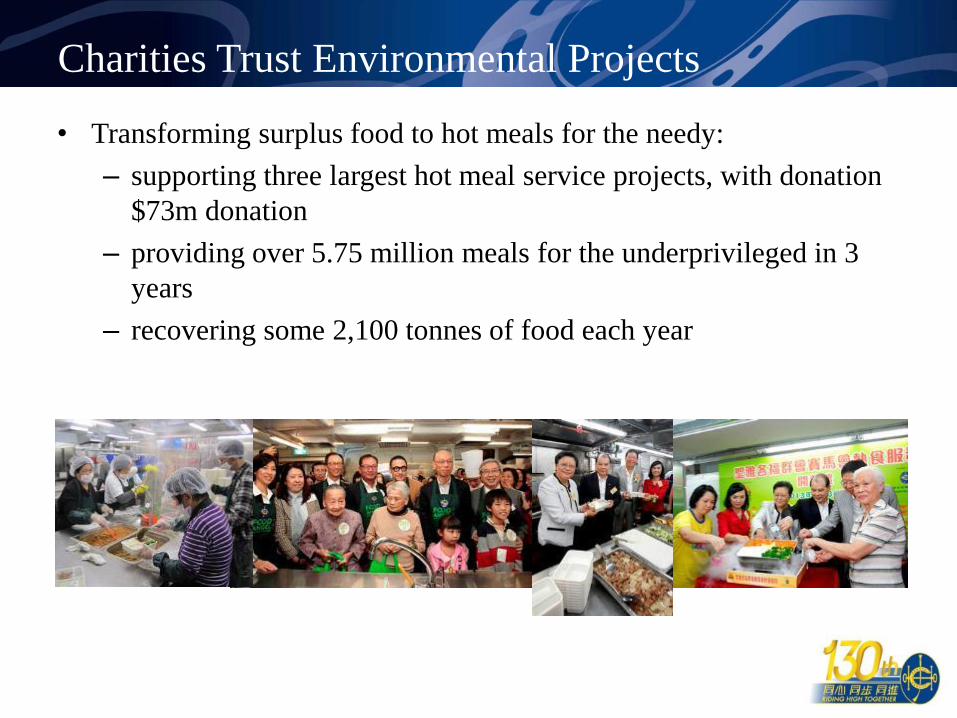
Charities Trust Environmental Projects
• Transforming surplus food to hot meals for the needy:
– supporting three largest hot meal service projects, with donation
$73m donation
– providing over 5.75 million meals for the underprivileged in 3
years
– recovering some 2,100 tonnes of food each year

Sha Tin Communications and Technology Centre
• The 1st Club building to have its entire lifecycle cost over its
projected lifetime of 50 years
• BEAM Plus, LEED & German DGNB sustainability guidelines
• Received confirmation of BEAM Plus Gold rating
• Finalist in Green Building Award 2014

Electricity Saving Projects
• Invested over HK$500million in energy-efficient technology
and management systems in recent years, examples are:
– Water-cooled chillers and Stable’s district cooling system
– Retail branches retrofitting (LED lighting)
– Calibration of exhaust fans to optimise efficiency
– Virtual servers deployed to replace some physical servers
– Office renovations adopting energy efficient technologies
– Building Information Modelling
• Reduce 6% annual electricity consumption from base year
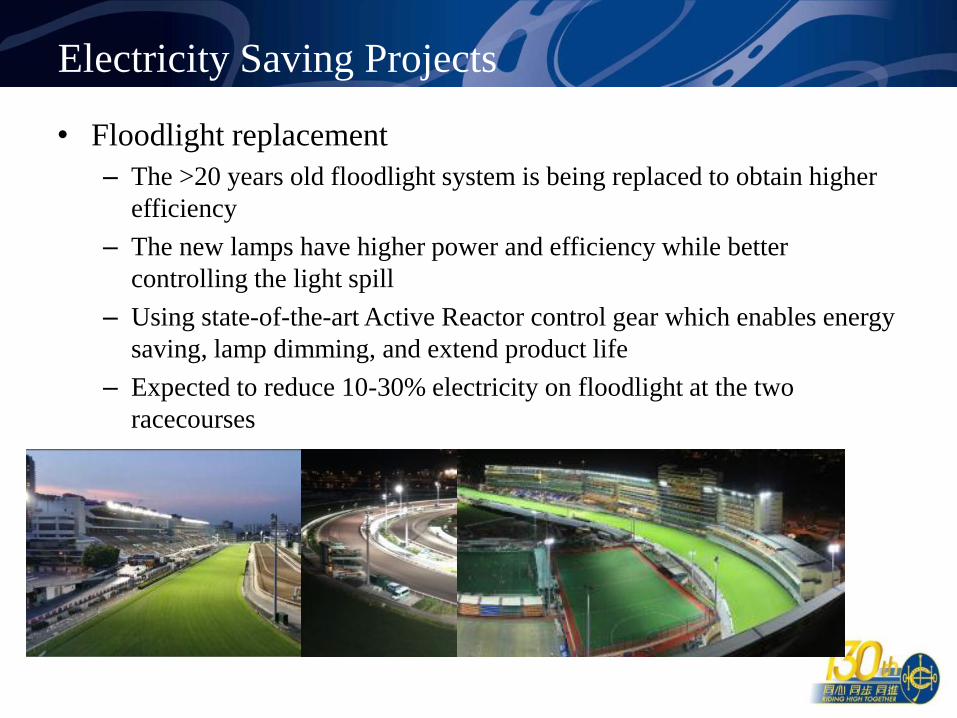
Electricity Saving Projects
• Floodlight replacement
– The >20 years old floodlight system is being replaced to obtain higher
efficiency
– The new lamps have higher power and efficiency while better
controlling the light spill
– Using state-of-the-art Active Reactor control gear which enables energy
saving, lamp dimming, and extend product life
– Expected to reduce 10-30% electricity on floodlight at the two
racecourses
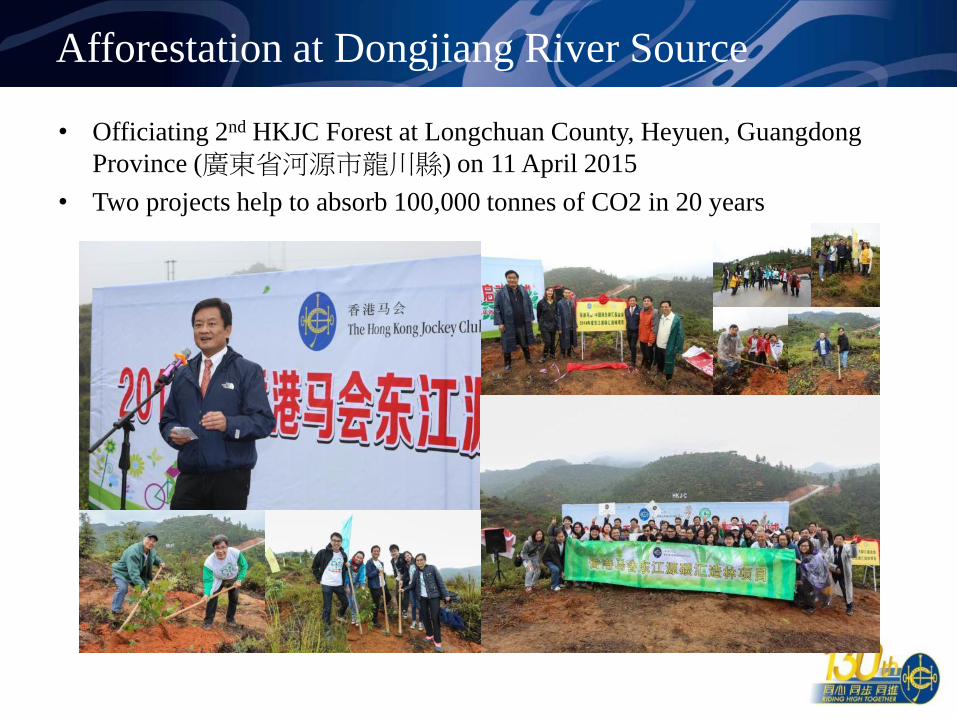
Afforestation at Dongjiang River Source
• Officiating 2nd HKJC Forest at Longchuan County, Heyuen, Guangdong
Province (廣東省河源市龍川縣) on 11 April 2015
• Two projects help to absorb 100,000 tonnes of CO2 in 20 years
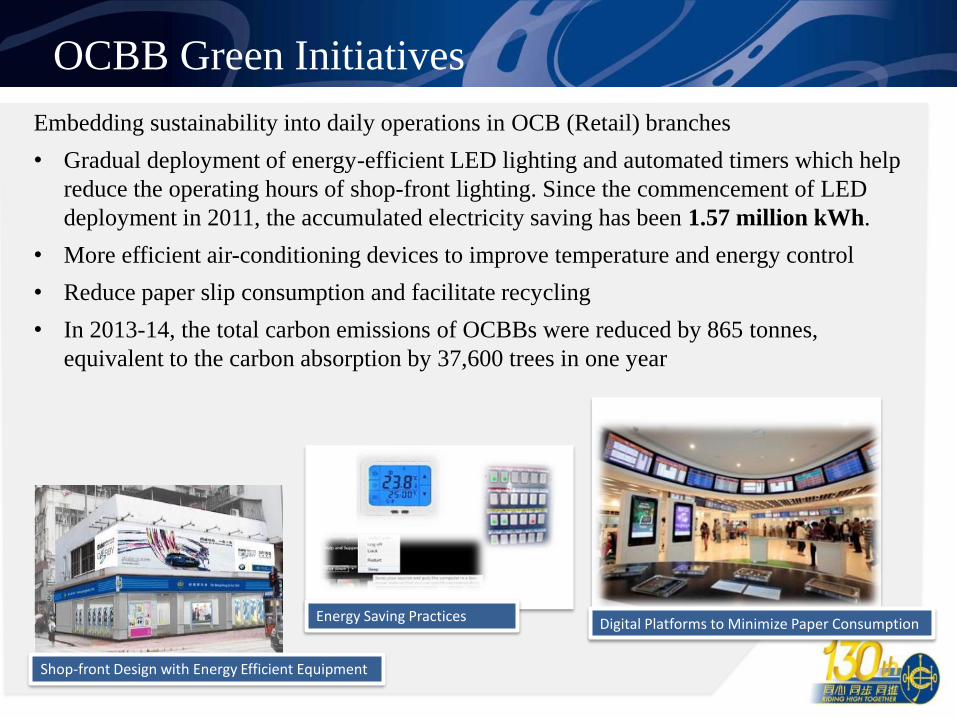
OCBB Green Initiatives
Shop-front Design with Energy Efficient Equipment
Embedding sustainability into daily operations in OCB (Retail) branches
• Gradual deployment of energy-efficient LED lighting and automated timers which help
reduce the operating hours of shop-front lighting. Since the commencement of LED
deployment in 2011, the accumulated electricity saving has been 1.57 million kWh.
• More efficient air-conditioning devices to improve temperature and energy control
• Reduce paper slip consumption and facilitate recycling
• In 2013-14, the total carbon emissions of OCBBs were reduced by 865 tonnes,
equivalent to the carbon absorption by 37,600 trees in one year
Energy Saving Practices Digital Platforms to Minimize Paper Consumption
OCBB Green Initiatives
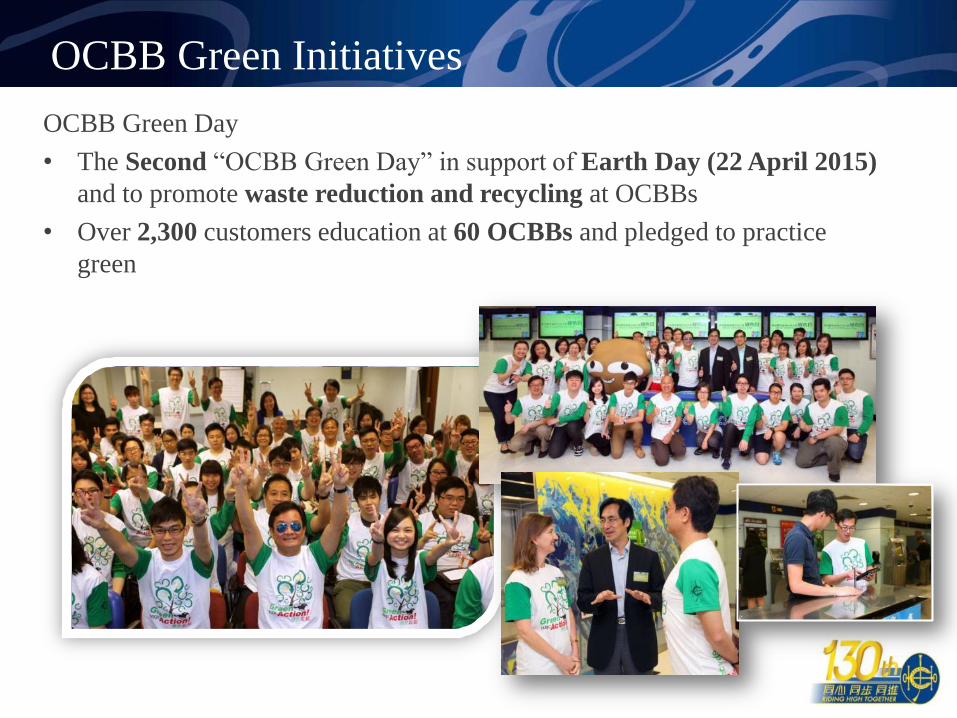
OCBB Green Day
• The Second “OCBB Green Day” in support of Earth Day (22 April 2015)
and to promote waste reduction and recycling at OCBBs
• Over 2,300 customers education at 60 OCBBs and pledged to practice
green
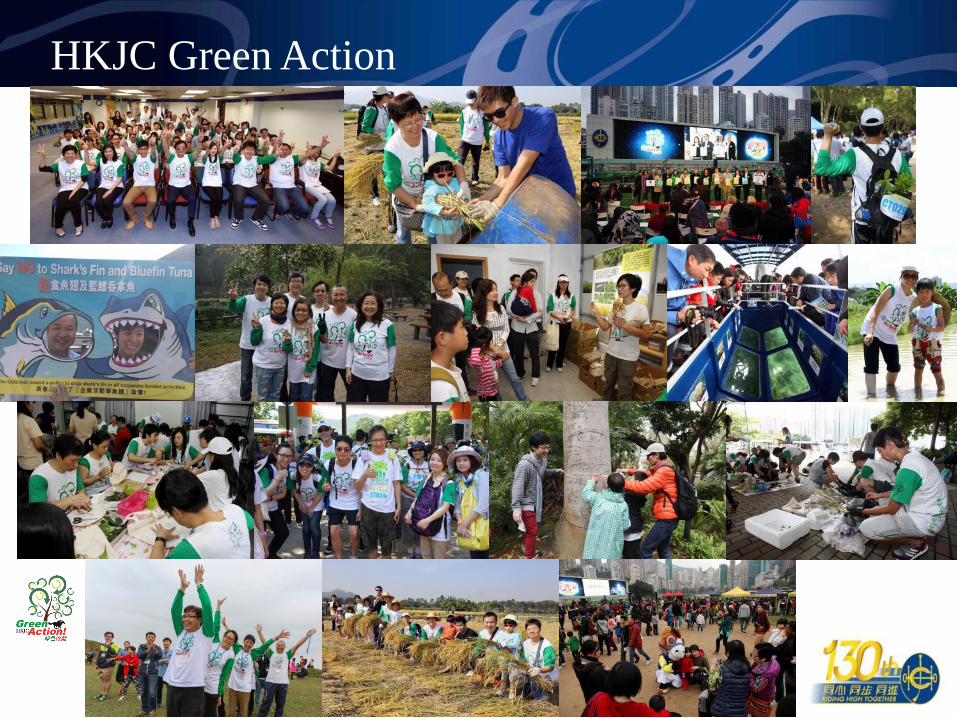
HKJC Green Action
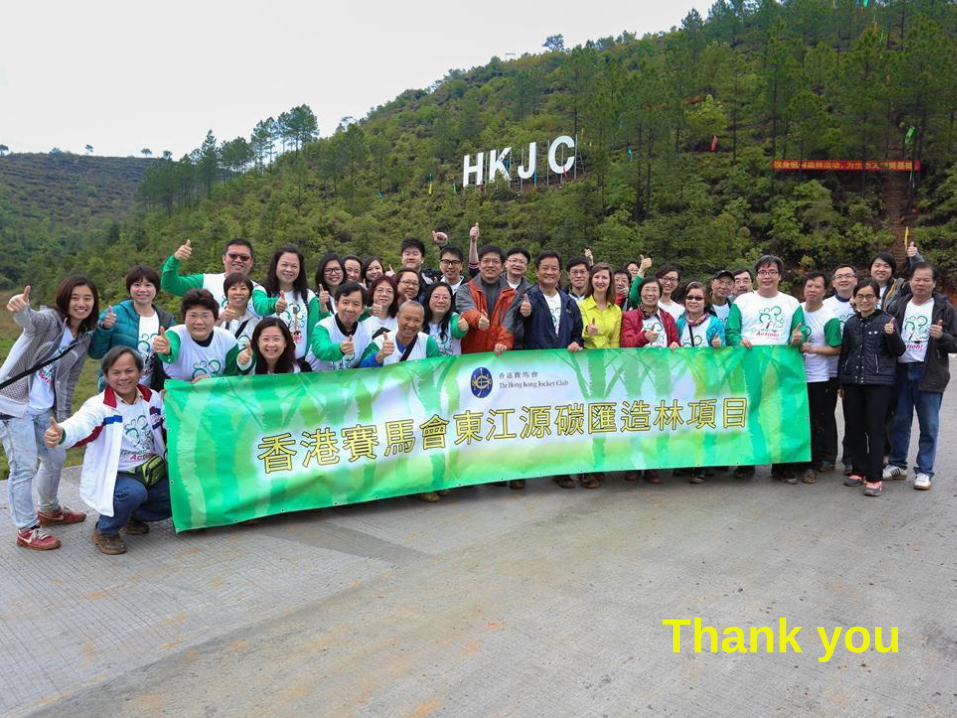
Thank you