Embed Size (px)
Citation preview

i
A User Study of GIS Infused Genealogy with Dynamic Thematic
Representation and Spatiotemporal Control
by
James T Ray
A Thesis Presented to the Faculty of the USC Graduate School
University of Southern California In Partial Fulfillment of the
Requirements for the Degree Master of Science
(Geographic Information Science and Technology)
May 2016

ii
Copyright ® 2015 by James T Ray

iii
For Stephanie, Erin, Rayleigh, and Jack. Forever family.

iv
Table of Contents
List of Figures ............................................................................................................................... vii
List of Tables ................................................................................................................................. ix
Acknowledgements ......................................................................................................................... x
List of Abbreviations ..................................................................................................................... xi
Abstract ......................................................................................................................................... xii
Chapter 1 Introduction .................................................................................................................... 1
1.1 Motivations behind genealogic research ..............................................................................3
1.1.1. Socioeconomic motivation.........................................................................................3 1.1.2. Medical motivation ....................................................................................................4 1.1.3. Religious motivation ..................................................................................................5
1.1.4. Recreation and personal fulfillment ...........................................................................6
1.2 The application and objectives .............................................................................................7
1.3 Four case study maps ...........................................................................................................8 1.4 Thesis structure ....................................................................................................................9
1.4.1. Background ................................................................................................................9 1.4.2. Data and methods .......................................................................................................9
1.4.3. Results ......................................................................................................................10 1.4.4. Conclusion and future research ................................................................................10
Chapter 2 Background .................................................................................................................. 11
2.1 Levels of Genealogical Interest..........................................................................................11 2.2 Web Resources ...................................................................................................................12
2.2.1. Genealogical sources ...............................................................................................13 2.2.2. Existing options for mapping family history ...........................................................14
2.2.3. Online GIS Resources ..............................................................................................18
2.3 User experience and technology trends .............................................................................24
Chapter 3 Data and methods ......................................................................................................... 27
3.1 Survey of FamilySearch Data ............................................................................................28
3.1.1. Content .....................................................................................................................28

v
3.1.2. Data extracted ..........................................................................................................30
3.2 Survey of Newberry Library Data .....................................................................................32
3.2.1. Detailed Content of Newberry’s Changeable County Data .....................................33 3.2.2. Functional elements of the data ...............................................................................36
3.3 Extraction of FamilySearch Data .......................................................................................39
3.3.1. Method of extraction ................................................................................................39 3.3.2. Encoding Hyperlinks in KML .................................................................................43 3.3.3. Tracking record extraction .......................................................................................43 3.3.4. Post extraction quality control .................................................................................46
3.4 Extraction of County and State Data..................................................................................47
3.4.1. Targeted data ............................................................................................................47 3.4.2. Manual method of manipulating KML for FamilEarth ...........................................48
3.4.3. Rules of FamilEarth feature ontology ......................................................................50 3.4.4. Post extraction quality control .................................................................................52
3.5 Supplemental Historic Spatial Data ...................................................................................52
3.6 Spatial Data Visualization ..................................................................................................54 3.7 Temporal Data Visualization .............................................................................................55
3.7.1. Visual emphasis of data ...........................................................................................57
3.8 Map User Participants ........................................................................................................58
3.8.1. Potential user pool....................................................................................................59 3.8.2. Genealogical Interest and experience ......................................................................59
3.8.3. Geospatial interest and experience ...........................................................................59
3.9 User Experience Survey .....................................................................................................60
Chapter 4 Results .......................................................................................................................... 61
4.1 Map Users and Participation ..............................................................................................61
4.1.1. The functional map ..................................................................................................62
4.1.2. Navigating the data in the table of contents .............................................................62 4.1.3. Linking the data to FamilySearch.org ......................................................................66
4.2 Initial Pool of Invitees to Test the Dynamic and Interactive Map .....................................69
4.2.1. Invitees response ......................................................................................................70
4.2.2. Survey results ...........................................................................................................74 4.2.3. Improvements suggested by the survey results ........................................................75 4.2.4. Result successes .......................................................................................................77

vi
Chapter 5 Conclusion and Future Development ........................................................................... 79
5.1 Motivation to Fuse Genealogy with GIS ...........................................................................79
5.1.1. Optimizing Leverage with GIS Tools for other Disciplines. ...................................79 5.1.2. Delivering the Greatest Impact of GIS for a New-to-GIS User Community ..........80
5.2 The Dynamic and Interactive Family Map ........................................................................80
5.2.1. Tools and Techniques ..............................................................................................81 5.2.2. Regarding the Animation Debate.............................................................................81 5.2.3. Program Successes and Pitfalls ................................................................................82
5.3 Potential for Further Development ....................................................................................83
5.3.1. Potential to Automate ..............................................................................................84
5.3.2. Potential to Distribute ..............................................................................................86 5.3.3. Potential to Educate .................................................................................................87
5.4 Lessons Learned .................................................................................................................88
REFERENCES ............................................................................................................................. 90
Appendix A: Biblical Genealogical Recordings ........................................................................... 94
Appendoix B: Territorial Growth in the United States ................................................................. 95
Appendix C: Cartographic Style Guide ...................................................................................... 102
Appendix D: FamilEarth Screencapture ..................................................................................... 105
Appendix E: Links to webcast .................................................................................................... 105
Appendix F: Extraction Code Output to .CSV ........................................................................... 106
Appendix G: FamilEarth Screencaptures for 3D Comparison ................................................... 107

vii
List of Figures
Figure 1 Levels of Genealogy Interest .......................................................................................... 11
Figure 2 Individual Record Display in FamilySearch .................................................................. 13
Figure 3 Ancestral Atlas ............................................................................................................... 15
Figure 4 Detail of Five Generation Ancestor Report to view the Continental United States ....... 16
Figure 5 Detail of Five Generation Ancestor Report; Ohio Valley and Tidewater US regions ... 17
Figure 6 County Level Detail of Historic Map of England and Wales 1851 ............................... 18
Figure 7 Junction of Campbell, Clairborne, Granger, Knox, and Anderson Counties prior to 1854 ............................................................................................................................................... 20
Figure 8 Insertion of Union County in the junction 1854 ............................................................. 21
Figure 9 Archived Excerpt from Keyhole Corp ........................................................................... 23
Figure 10 787 Dreamliner Flight Tracker ..................................................................................... 25
Figure 11 Thesis Development Flowchart .................................................................................... 27
Figure 12 FamilySearch API Response to XML Read Person Ancestry and Additional Person Details Request ...................................................................................................................... 30
Figure 13 Clear Creek and Gilpin Counties, CO planarized to tolerances of 0.001 and 0.05 ...... 33
Figure 14 KML Code Sample for Ashe County ........................................................................... 34
Figure 15 Data in SchemaData Folder from KML Code Sample ................................................. 34
Figure 16 Ashe County, North Carolina in Google Earth ............................................................ 36
Figure 17 SchemaData for Ashe County, North Carolina ............................................................ 37
Figure 18 Ashe County 1799, 1854, and 2000 ............................................................................. 38
Figure 19 Ashe County 1799 to 2000 ........................................................................................... 38
Figure 20 Couple Info and Individual Details in FamilySearch ................................................... 40
Figure 21 Process Description for Recording Births and Deaths in Tracking Sheet .................... 41
Figure 22 FSID Number in FamilySearch Ancestral Record ....................................................... 43
viii
Figure 23 Initial Array of Ancestors in FamilySearch Interface .................................................. 44
Figure 24 Expanded Array in FamilySearch User Interface with 12 Potential Records to be Extracted ................................................................................................................................ 44
Figure 25 Expanded Array in FamilySearch User Interface with Eight Additional Potential Lines to Extract ............................................................................................................................... 45
Figure 26 Flowchart illustrating KML Feature Extraction Process for Birth Records ................. 48
Figure 27 Modified <name> and <TimeSpan> KML Code in Notepad++ Interface ................... 49
Figure 28 Complete Sample of Changes to Feature KML in Notepad++ .................................... 49
Figure 29 File Structure of KML in FamilEarth ........................................................................... 50
Figure 30 Detail of KML Extraction Process ............................................................................... 51
Figure 31 Temporality of Lehigh County, PA for the Hanshew Family Line in FamilEarth....... 52
Figure 32 Detail of 1790 US Territorial Growth Map .................................................................. 54
Figure 33 Mean Center of Population in the United States over Time ......................................... 55
Figure 34 FamilEarth Initial View ................................................................................................ 62
Figure 35 Table of Contents and Timebar .................................................................................... 63
Figure 36 Detail Screens of FamilEarth Progression over Time .................................................. 65
Figure 37 Westward Expansion of Hanshew Family Line to 1879 .............................................. 66
Figure 38 Weber Metadata Detail ................................................................................................. 67
Figure 39 FamilySearch Secure Sign-in Interface ........................................................................ 68
Figure 40 FamilySearch Person Record ....................................................................................... 69
Figure 41 Table of Contents with Places Open and with Places Closed ...................................... 73
Figure 42 Description of Administrative Place Name Type for Python Script ............................ 85
ix
List of Tables
Table 1 Variable Name Description from Person Search Resource ............................................. 29
Table 2 Features Extracted from FamilySearch to Tracking Sheet .............................................. 31
Table 3 Sample Records from Tracking Sheet ............................................................................. 42

x
Acknowledgements
Only, with the help of Dr. Robert Vos, Jennifer Swift, Yao-Yi Chiang of USC Spatial Sciences
Institute, the Mikes (Ray and Dr. Clark Ph.D.) for technical consulting; and Stephanie Ray (my
wife and collaborator, who helped me extract family records and painstakingly reviewed my
manuscript countless times) could I have written this thesis. The best parts are due to them. The
shortcomings are all my own.

xi
List of Abbreviations
AFIT Air Force Institute of Technology
API Application Programming Interface
APP Application
CSV Comma Separated Value
FSHL FamilySearch Hyperlink
FSID FamilySearch Identification
GIS Geographic information system
GNIS Geographic Names Information System
GPS Global Positioning System
IRB Institutional Review Board
JPG Joint Photographic Experts Group
KML Keyhole Markup Language
LDS The Church of Jesus Christ of Latter Day Saints
OS Operating System
PID Person Identifier
SDK Software Developers KIT
SQL Structured Query Language
USC University of Southern California
USGS United States Geologic Survey
URL Uniform Resource Locator
UT University of Texas (Austin)
XML Extensible Markup Language

xii
Abstract
The purpose of this thesis is to demonstrate how thematic mapping and GIS technology can
enhance genealogical research for family history records in the United States of America from
the 17th to the 21st century, using online resources from FamilySearch.org, the Newberry
Library, and Google. Many genealogists have not had significant exposure to GIS and web GIS.
The research focuses on the potential to infuse dynamic web GIS technology with online family
history resources in a single application. To this end, an electronic, dynamic, and interactive map
was designed that illustrates a more complete picture of family history with regard to data
quality, cartography, and history than existing web resources provide. As a proof of concept for
the potential to integrate web GIS and genealogy four electronic maps were developed on behalf
of four ancestral lineage records. The maps were embedded in Google Earth’s user interface and
distributed to users. The GIS application map is a conglomerate of several hundred maps that can
be manipulated in different ways. The maps are animated and controlled with inputs making
them dynamic and interactive. Users were invited to take part in a survey regarding their
experience with the application. User feedback indicated positive results regarding the impact of
GIS infused genealogical activities with measurable increases in user knowledge and interest.
Program successes indicate the potential for future development in the online web-enabled
environment.
1
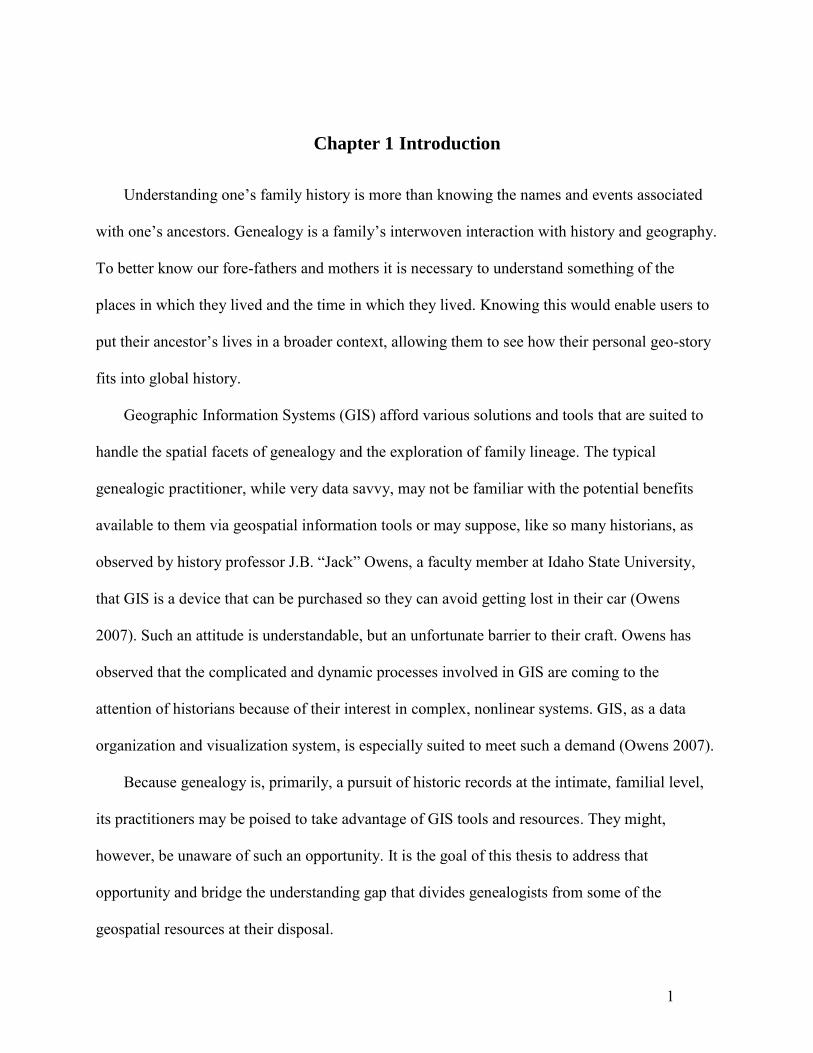
Chapter 1 Introduction
Understanding one’s family history is more than knowing the names and events associated
with one’s ancestors. Genealogy is a family’s interwoven interaction with history and geography.
To better know our fore-fathers and mothers it is necessary to understand something of the
places in which they lived and the time in which they lived. Knowing this would enable users to
put their ancestor’s lives in a broader context, allowing them to see how their personal geo-story
fits into global history.
Geographic Information Systems (GIS) afford various solutions and tools that are suited to
handle the spatial facets of genealogy and the exploration of family lineage. The typical
genealogic practitioner, while very data savvy, may not be familiar with the potential benefits
available to them via geospatial information tools or may suppose, like so many historians, as
observed by history professor J.B. “Jack” Owens, a faculty member at Idaho State University,
that GIS is a device that can be purchased so they can avoid getting lost in their car (Owens
2007). Such an attitude is understandable, but an unfortunate barrier to their craft. Owens has
observed that the complicated and dynamic processes involved in GIS are coming to the
attention of historians because of their interest in complex, nonlinear systems. GIS, as a data
organization and visualization system, is especially suited to meet such a demand (Owens 2007).
Because genealogy is, primarily, a pursuit of historic records at the intimate, familial level,
its practitioners may be poised to take advantage of GIS tools and resources. They might,
however, be unaware of such an opportunity. It is the goal of this thesis to address that
opportunity and bridge the understanding gap that divides genealogists from some of the
geospatial resources at their disposal.

2
An individual might presume that they understand their family history comprehensively as
per the data they have collected. This same supposition is made erroneously by world leaders and
policy makers with regard to their understanding of the charted world, while, as Wood (1997)
states: “In reality, it is a myth that the foundation of earth science data collection today is
accurate, comprehensive, accessible, and consistent” (Wood 1997, 81). This is not to suggest that
attempts to describe our world geospatially are futile, but that we have much to do.
Mapping and surveying inevitably lead to an enhanced understanding of the region or
subject to be charted. This assertion was tested in 1803 when Meriwether Lewis was
commissioned by President Thomas Jefferson’s administration to survey the territory between St.
Louis and the Pacific Northwest coast. While the expedition was financed largely in anticipation
of the opportunity to exploit newly acquired land resources, the mandate, charged to Lewis was,
in fact, to understand the territory and not merely to map the wilderness (Wood 1997).
Thomas Jefferson was a cartographer’s son, and he understood that such an expedition
would pay dividends in terms of global commerce, geopolitics, and scientific discovery to future
generations (Wood 1997). To this end, the author of this thesis developed an electronic, dynamic,
and interactive user map that illustrates a more complete picture of the application user’s family
history, with regard to data quality, cartography, and history, than existing web resources
provide. Such an application will not only survey the user’s family history but empower the user
with a Jeffersonian view of their charted genealogy.
Mapmaking and geography continue to be intense pursuits of study because the world we
live in is so complex. One’s family history, while being a singular complexity that makes up our
real world, is itself, an intricate network of places and dates that could potentially be presented in
3
a coffee table sized atlas. The dynamic and interactive family maps created through the process
described in this thesis serve to illustrate this concept.
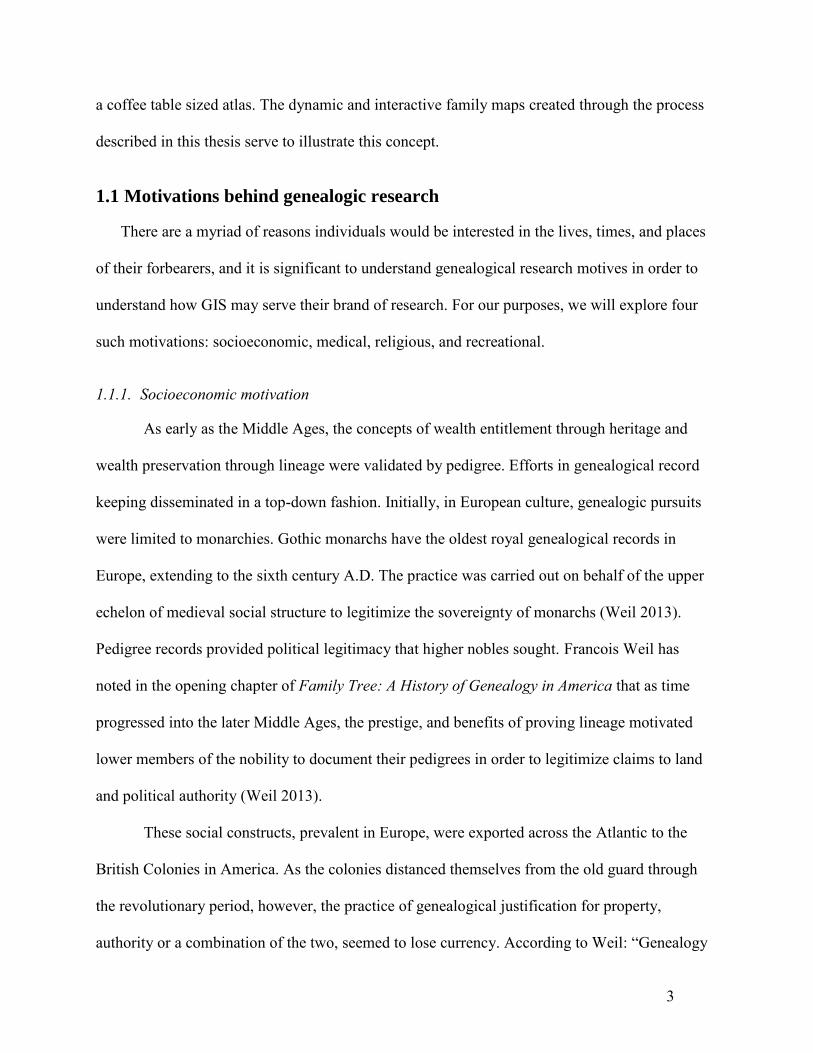
1.1 Motivations behind genealogic research
There are a myriad of reasons individuals would be interested in the lives, times, and places
of their forbearers, and it is significant to understand genealogical research motives in order to
understand how GIS may serve their brand of research. For our purposes, we will explore four
such motivations: socioeconomic, medical, religious, and recreational.
1.1.1. Socioeconomic motivation
As early as the Middle Ages, the concepts of wealth entitlement through heritage and
wealth preservation through lineage were validated by pedigree. Efforts in genealogical record
keeping disseminated in a top-down fashion. Initially, in European culture, genealogic pursuits
were limited to monarchies. Gothic monarchs have the oldest royal genealogical records in
Europe, extending to the sixth century A.D. The practice was carried out on behalf of the upper
echelon of medieval social structure to legitimize the sovereignty of monarchs (Weil 2013).
Pedigree records provided political legitimacy that higher nobles sought. Francois Weil has
noted in the opening chapter of Family Tree: A History of Genealogy in America that as time
progressed into the later Middle Ages, the prestige, and benefits of proving lineage motivated
lower members of the nobility to document their pedigrees in order to legitimize claims to land
and political authority (Weil 2013).
These social constructs, prevalent in Europe, were exported across the Atlantic to the
British Colonies in America. As the colonies distanced themselves from the old guard through
the revolutionary period, however, the practice of genealogical justification for property,
authority or a combination of the two, seemed to lose currency. According to Weil: “Genealogy
4
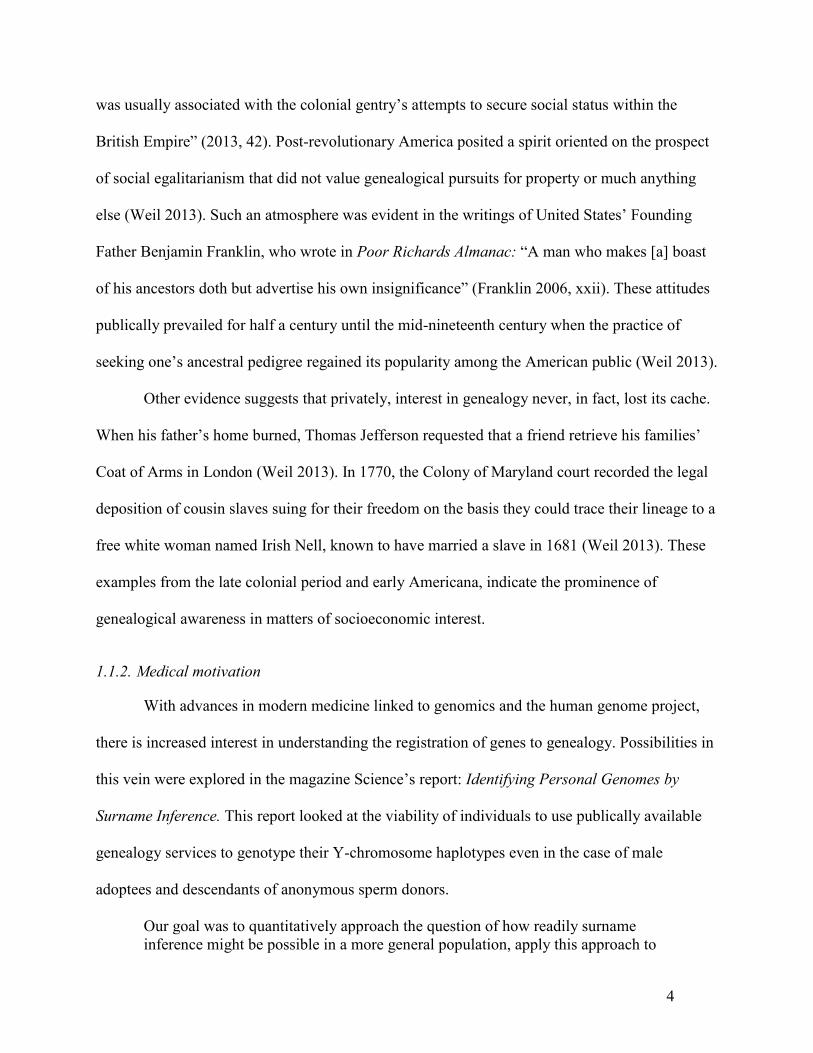
was usually associated with the colonial gentry’s attempts to secure social status within the
British Empire” (2013, 42). Post-revolutionary America posited a spirit oriented on the prospect
of social egalitarianism that did not value genealogical pursuits for property or much anything
else (Weil 2013). Such an atmosphere was evident in the writings of United States’ Founding
Father Benjamin Franklin, who wrote in Poor Richards Almanac: “A man who makes [a] boast
of his ancestors doth but advertise his own insignificance” (Franklin 2006, xxii). These attitudes
publically prevailed for half a century until the mid-nineteenth century when the practice of
seeking one’s ancestral pedigree regained its popularity among the American public (Weil 2013).
Other evidence suggests that privately, interest in genealogy never, in fact, lost its cache.
When his father’s home burned, Thomas Jefferson requested that a friend retrieve his families’
Coat of Arms in London (Weil 2013). In 1770, the Colony of Maryland court recorded the legal
deposition of cousin slaves suing for their freedom on the basis they could trace their lineage to a
free white woman named Irish Nell, known to have married a slave in 1681 (Weil 2013). These
examples from the late colonial period and early Americana, indicate the prominence of
genealogical awareness in matters of socioeconomic interest.
1.1.2. Medical motivation
With advances in modern medicine linked to genomics and the human genome project,
there is increased interest in understanding the registration of genes to genealogy. Possibilities in
this vein were explored in the magazine Science’s report: Identifying Personal Genomes by
Surname Inference. This report looked at the viability of individuals to use publically available
genealogy services to genotype their Y-chromosome haplotypes even in the case of male
adoptees and descendants of anonymous sperm donors.
Our goal was to quantitatively approach the question of how readily surname inference might be possible in a more general population, apply this approach to

5
personal genome data sets, and demonstrate end-to-end identification of individuals with only public information. (Gymrek et al. 2013, 321)
This report indicated that it was possible to successfully identify individuals if the
publically available records were robust enough. The study showed that populations with
established habits of genealogical record keeping fared better than the general public. As
Gymrek writes:
Searching the genetic genealogy databases returned top-matching records with Mormon ancestry in 8 of the 10 individuals for whom the top hit had at least 12 comparable markers. (Gymrek et al. 2013, 323)
It is evident from this research that enhanced genealogical records and genealogical literacy, in
general, have a potential benefit within the public sphere to contribute to better health knowledge
in the medical community.
1.1.3. Religious motivation
This begs the question; why would a religious community be poised to benefit vis-à-vis a
metric dependent on genealogical record keeping? While the reasons for any single member of a
community to engage in a practice are rarely simple, we explore a few possible sources of this
particular practice in the Judeo-Christian community as found in the Authorized King James
Version of the Holy Bible (Corporation of the President of The Church of Jesus Christ of Latter
Day Saints 1979).
Many adherents to sacred text believe Scripture sets a pattern to be emulated, and the Old
and New Testaments have ten examples of recorded genealogies (Corporation of the President of
The Church of Jesus Christ of Latter Day Saints 1979, see Appendix A). In addition to the
pattern of record keeping established in sacred writ, there is also the injunction of the minor
prophet Malachi that Elijah would return to “turn the heart of the fathers to the children, and the
heart of the children to their fathers” (Malachi 4:5 – 6 KJV). This is widely interpreted in The

6
Church of Jesus Christ of Latter Day Saint community (LDS or Mormon) to mean that the desire
to understand their parents (and grandparents etc.) is supernaturally implanted and should be
cultivated. The effect of this interpretation has been a sustained genealogical interest in the LDS
community, and the allocation of resources dedicated to gathering, preserving, and availing
ancestral records as far into the past as possible (The Church of Jesus Christ of Latter Day Saints
2015a).
1.1.4. Recreation and personal fulfillment
There is also a community of genealogical researchers who are motivated by recreational
pursuit or reasons of personal fulfillment, independent of any motivation discussed further in
sections 2.1.1 – 2.1.3. This is not to suggest their drive is trivial; quite the contrary, it satisfies in
individuals, a deep seeded personal desire to understand their past.
Most of us live in a family or social unit where the most recent connection to our kinship
network, ethnic group, socio-economic class, and citizenry is our parents (Timothy et al. 2008).
This is not true for everyone, but is borne out by the exceptions. Adoptees or orphaned refugees,
who are deprived of this basic connection to their biological parents, are often highly motivated
to perform the work necessary to restore those connections that have become obscured or
difficult to uncover. This is dramatically shown in the experiences described by Alex Haley, a
descendant of slaves kidnapped from Africa, in his 1976 bestseller, Roots (Timothy et al. 2008).
There is an element of challenge to the task of cataloging ancestors, owing to the sheer
volume of ancestors as the generations extend into history (Jacobus 1968). Whether in a pedigree
chart or a family book of remembrance, the process becomes an amusing game of sorts, to
extract and record the accurate names and event dates of progenitors. Uncovering ancestral

7
connections with historic events, whether major or minor, invoke a sense of pleasure and even
validation (Jacobus 1968).
According to Donald Lines Jacobus, author of the 20th century book Genealogy as
Pastime and Profession genealogy provides insight into “the motives, the customs, [and] the
daily manner of life, of people who lived in a different epoch” (Jacobus 1968, 3). Such insight
shows the family researcher the different circumstances governing the lives of their relatives,
even if they are removed by a mere two or three hundred years (Jacobus 1968).
1.2 The application and objectives
The mapping application developed in the course of this thesis functions as a spatiotemporal
search engine that provides relevant family history facts and data. The application map is a
conglomerate of several hundred maps, consolidated using web 2.0 structures and techniques that
can be manipulated in different ways. It can be viewed as a sequenced motion picture or
incrementally adjusted feature class by feature class. Each era can be viewed as a single atlas in a
treasury collection crafted around the users genealogical subjects of research.
The aim, in developing this electronic map, was to make an accessible and geospatially
enlightening tool for the lay genealogist. The mapping product serves as a proof of concept for
the further development of standalone applications that could be disseminated among the general
population, accessible to serious genealogists as well as casual family history enthusiasts.
The user experience was designed using the Google Earth platform, leveraging an
environment with which users are likely to be familiar. The Google suite of geospatial products
enables users to leverage GIS navigation tools that, while similar to other GIS based user suites
such as Esri Online or CartoDB, offers particularly fluid map presentations. Google Earth
supports an intuitive and crucially important time bar tool that enables the user to visualize the

8
complex choreography of the intermittent ancestral activity over the space and time visualized.
Comparable visualization tools can be simulated in similar Web-GIS packages. CartoDB, for
example allows the user to manipulate a SQL query to change their ancestral map, but the user
experience did not provide the sort of dynamic control sought for this project.
1.3 Four case study maps
The proof of concept was carried out by the development of four electronic dynamic, and
interactive maps using Google Earth’s user interface. The maps were constrained by data
available with the developers login to the family history website FamilySearch, and the maps
included visual polygonal representation, at the county level, of births and deaths in the United
States from 1600 A.D. to 2011 A.D. Lineage representations were generated on behalf of four
family lines: the Ray, Harmon, Patrick, and Hanshew lines with more than 1,000 individual
records processed as dynamic map features.
Once the family lines were processed into the Google Earth interface, the application was
packaged and distributed to first degree (parents, full siblings, or children), second-degree
(grandparents, grandchildren, aunts, uncles, nephews, nieces or half-siblings), and third-degree
relatives (first-cousins, great-grandparents or great grandchildren). The relational degrees are
defined by Blue Cross Blue Shield Tennessee (2015) to identify individuals who share common
ancestry within their respective lines. After having the opportunity to explore the digital
genealogical map, users were invited to take part in an Institutional Review Board (IRB)
approved survey regarding their experience with the GIS elements of the application. The
feedback was then analyzed to determine the program success and future opportunities.

9
1.4 Thesis structure
This thesis is divided into five chapters. Following this introduction, chapters cover
background on GIS and genealogy, data and methods for the proof of concept, results of the
project, and a conclusion.
1.4.1. Background
The next chapter in this piece explores literature and resources available on GIS and
genealogy and their potential synthesis. This chapter explores why genealogy has been selected
as a test venue to explore the application of GIS for a broad, un-initiated audience.
This section also explores existing resources on the web with regard to genealogy,
primarily FamilySearch, and GIS resources, such as the Newberry Library Atlas of Historical
County Boundaries from 1629 A.D. through 2000 A.D., and Google Earth’s development of the
Keyhole Markup Language (KML). Chapter 2 provides an overview regarding those resources
that combine mapping elements with genealogic resources and illustrate the potential opportunity
to improve thereupon. Chapter 2 familiarizes the reader with research applicable to dynamic
visualization in GIS and the potential to use GIS as a means to understand family history data.
1.4.2. Data and methods
The third chapter examines the data that were selected and leveraged in the development
of the electronic map. This chapter discusses the selected GIS and genealogic datasets and the
rationale behind their selection. In the Data and methods section, we examines attempts to
generate mapping products that proved less effective but, yielded important method
improvements, applied to the final user map. Chapter 3, additionally, explores how the data were
processed and refined appropriately to the cartographic task at hand.
10
1.4.3. Results
Chapter 4 discusses the map participants and how they were recruited. This section
addresses participant’s topical familiarity with either genealogy, GIS, or both. The results
chapter discusses the users experience with the map. In this chapter we evaluates the user map
comprehensively, with regard to its stated goals, to determine where it met those goals and
elements that require improvement.
1.4.4. Conclusion and future research
The final chapter reviews the background material, data and methods employed and
results in sections in a conclusive analysis. The chapter addresses the potential for future
improvements and how the lessons learned in this thesis can influence the development of GIS
web applications
11
Chapter 2 Background
This thesis intends to shed light on the potential GIS technology has to improve spatial
studies in disciplines not assumed to be spatial like the study of one’s family history, also termed
genealogy. The goal of this chapter is to provide some context with regard to the genealogical
audience associated with this study, and the genealogical resources commonly used by that
community. This chapter also discusses applicable GIS resources available for this study.
2.1 Levels of Genealogical Interest
As with most research pursuits, genealogical interest is not binary, and it is helpful to
consider the levels of interest exhibited by practitioners of the discipline. The online magazine
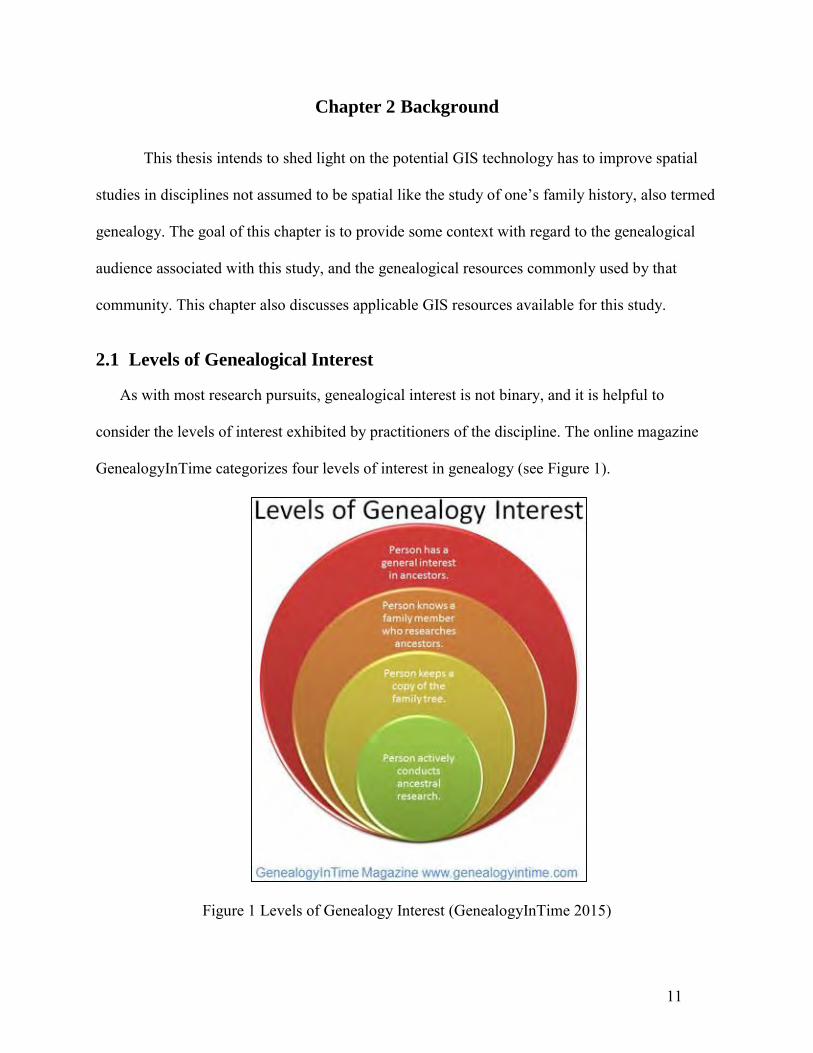
GenealogyInTime categorizes four levels of interest in genealogy (see Figure 1).
Figure 1 Levels of Genealogy Interest (GenealogyInTime 2015)

12
This hierarchy of interest is presented as a multi layered diagram of concentric circles as seen in
Figure 1. The broadest subset of people is defined as individuals with a general interest in
genealogy. This subset of the diagram represents the broadest portion of the general populous. In
this context, GenealogyInTime online magazine indicates that genealogy is on par with
gardening in popularity (GenealogyInTime 2015).
The second subset in the hierarchy includes people who know a family member who
researches ancestors. This group of people would be poised to find out more about their family
history by contacting a relative who would likely be willing to oblige their curiosity.
The third subset represents individuals that exhibit more curiosity than a casual interest in
genealogy (GenealogyInTime 2015). By obtaining a pedigree chart or other representation of
their family tree, they recognize that “ancestors are important, and they want to know more about
them” (GenealogyInTime 2015). This subset of the interior circles have not contributed to the
record but probably obtained the record from a family member. Those that have actively
participated in ancestral research make up the core interest group, and while, being the smallest
subset of genealogical interest, create the content used by the other groups in their network
(GenealogyInTime 2015).
The levels of interest exhibited in our need to satisfy a range of social and personal
motivations, to better understand our familial past, establish the demand in today’s information
age, for better information processing tools. We will explore how Geographic Information
Systems (GIS), specifically online GIS, can be applied to satisfy this demand.
2.2 Web Resources
The internet avails a variety of family history resources including ancestral records,
genealogical services, software, search engines, blogs, and forums. Genealogical information is

13
usually presented online to the user as an array of data. The array is enabled by clicking
expansion tabs to view additional generations and hyperlinked name records with specific vital
information such as dates of birth and death along with siblings and children’s names (see Figure
2).
Figure 2 Individual Record Display in FamilySearch (FamilySearch 2015d)
2.2.1. Genealogical sources
Online genealogical services vary widely in terms of quality, availability, and scope of
services provided. An online mapping service would require data integration with at least one
online genealogic data service. For this proof of concept, a single genealogical online service
was selected after an exhaustive search for databases containing reliable information including
14
dates of birth and death, locations of the birth and death, census records, and burial locations.
This study used the FamilySearch service via FamilySearch.org maintained by The Church of
Jesus Christ of Latter Day Saints (LDS) (The Church of Jesus Christ of Latter Day Saints 2015
a). FamilySearch.org requires a login which connects the user to unique information associated
with an individual user identification number, maintained by the LDS church. This data service
is free for members of the church or other interested parties who obtain an individual
identification number. FamilySearch maintains an application programming interface (API) that
will allow future researchers to automatically extract data for a variety of uses, including data-
driven mapping services (FamilySearch 2015c).
2.2.2. Existing options for mapping family history
Google searches conducted in 2014 and then again in 2015 of “family history mapping”
yielded 34.3 and 18.9 million results respectively. In the 2014 search, the first page of results
contained just two relevant websites, and a third application was referenced in a bulletin board
discussion linked on the fourth page of results. An assessment of these three applications (with
regard to pertinence of data, historic framework, and spatial sense) indicated a range of
functionality and limitations from spatial thematic mapping, to feature location services.
2.2.2.1. Ancestral Atlas
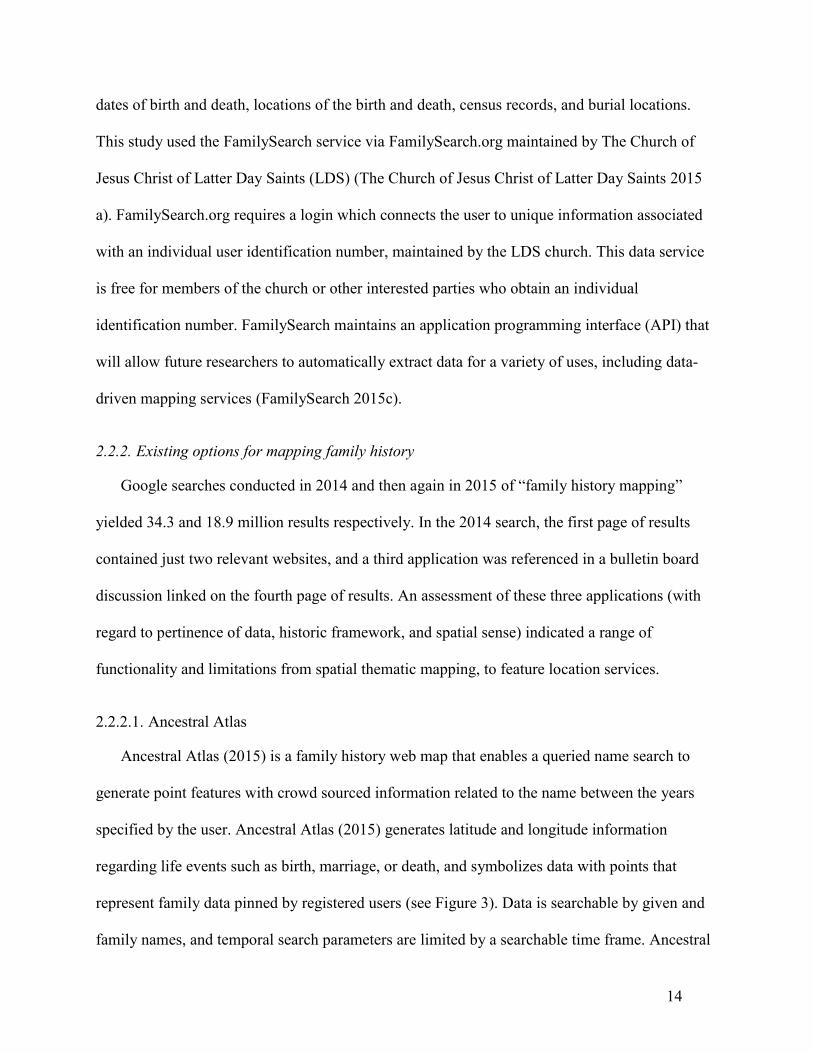
Ancestral Atlas (2015) is a family history web map that enables a queried name search to
generate point features with crowd sourced information related to the name between the years
specified by the user. Ancestral Atlas (2015) generates latitude and longitude information
regarding life events such as birth, marriage, or death, and symbolizes data with points that
represent family data pinned by registered users (see Figure 3). Data is searchable by given and
family names, and temporal search parameters are limited by a searchable time frame. Ancestral
15
Atlas (2015) data is populated manually by users, but the resulting information is not linked to
any verifiable data, associated with the user, and needs to be validated from an outside source.
Figure 3 Ancestral Atlas (Ancestral Atlas 2015)
2.2.2.2. Roots Mapper
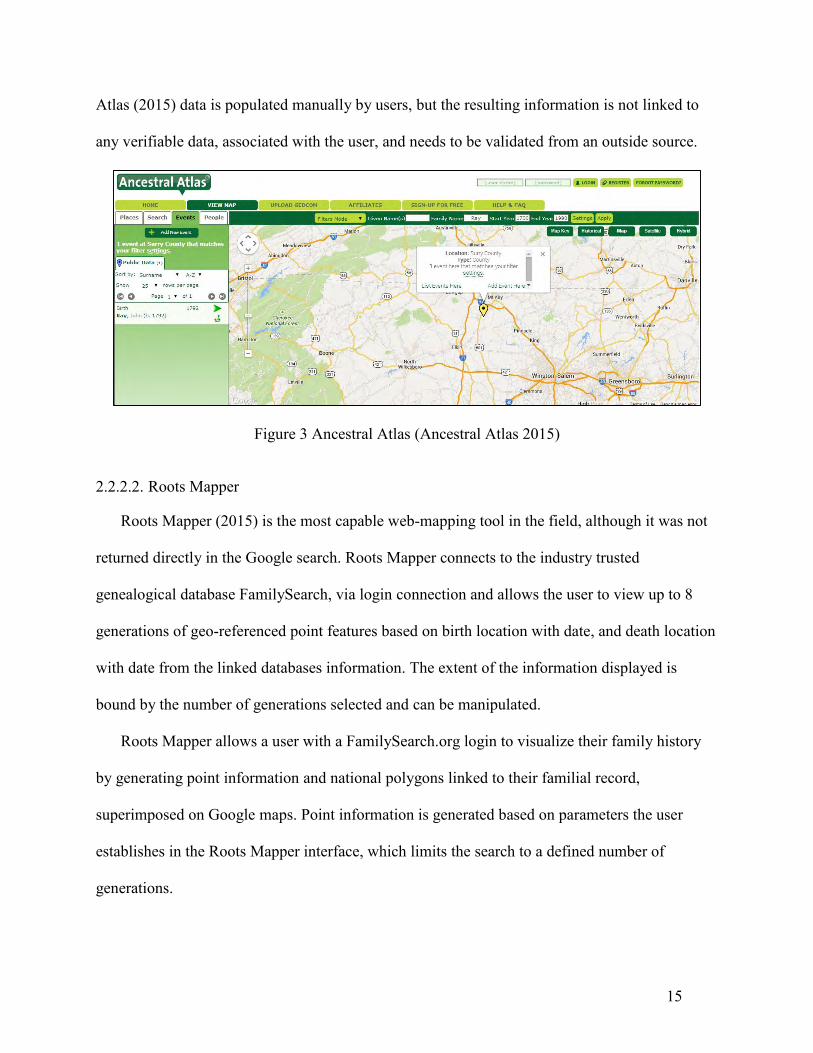
Roots Mapper (2015) is the most capable web-mapping tool in the field, although it was not
returned directly in the Google search. Roots Mapper connects to the industry trusted
genealogical database FamilySearch, via login connection and allows the user to view up to 8
generations of geo-referenced point features based on birth location with date, and death location
with date from the linked databases information. The extent of the information displayed is
bound by the number of generations selected and can be manipulated.
Roots Mapper allows a user with a FamilySearch.org login to visualize their family history
by generating point information and national polygons linked to their familial record,
superimposed on Google maps. Point information is generated based on parameters the user
establishes in the Roots Mapper interface, which limits the search to a defined number of
generations.

16
There are drawbacks to this program’s visualization schema, primarily involving data
overload when viewing multiple generations at small scales (see Figure 4) and the cumbersome
single generation viewer with its inability to change the number of generations in a single
iteration.
Figure 4 Detail of Five Generation Ancestor Report to view the Continental United States
(RootsMapper.org 2015)
The zoom function in the map allows the user to explore data at a larger scale, but the point
method for location symbolization can lead to spatial confusion with no reference to larger scale
political boundaries (see Figure 5).

17
Figure 5 Detail of Five Generation Ancestor Report; Ohio Valley and Tidewater US regions
(RootsMapper.org 2015)
Point data visualization by both Roots Mapper and Ancestral Atlas are problematic
because they can be misleading in terms of precision since a single point may simply represent
the centroid of a county or even an entire country. This might be misinterpreted to mean the life
event that generated the point occurred at precisely that latitude and longitude. Even more
limiting than the symbology used by these services, is the static maps in which their data is
presented. While search parameters may be bound or changed by date or generation, the visual
output is static and requires a refreshed data iteration each time a new view is requested.
2.2.2.3. Maps.FamilySearch.org (FamilySearch 2015e)
Maps.FamilySearch.org displays an historic map of England and Wales from 1851. It is
fixed in its temporal extent, but its spatial representation is robust, enabling the user to explore
multiple levels of administrative boundaries including parish, county, and province. However,
users must link their family history to this map manually. The website does not function as an
automated visualization tool for the genealogical records.
18
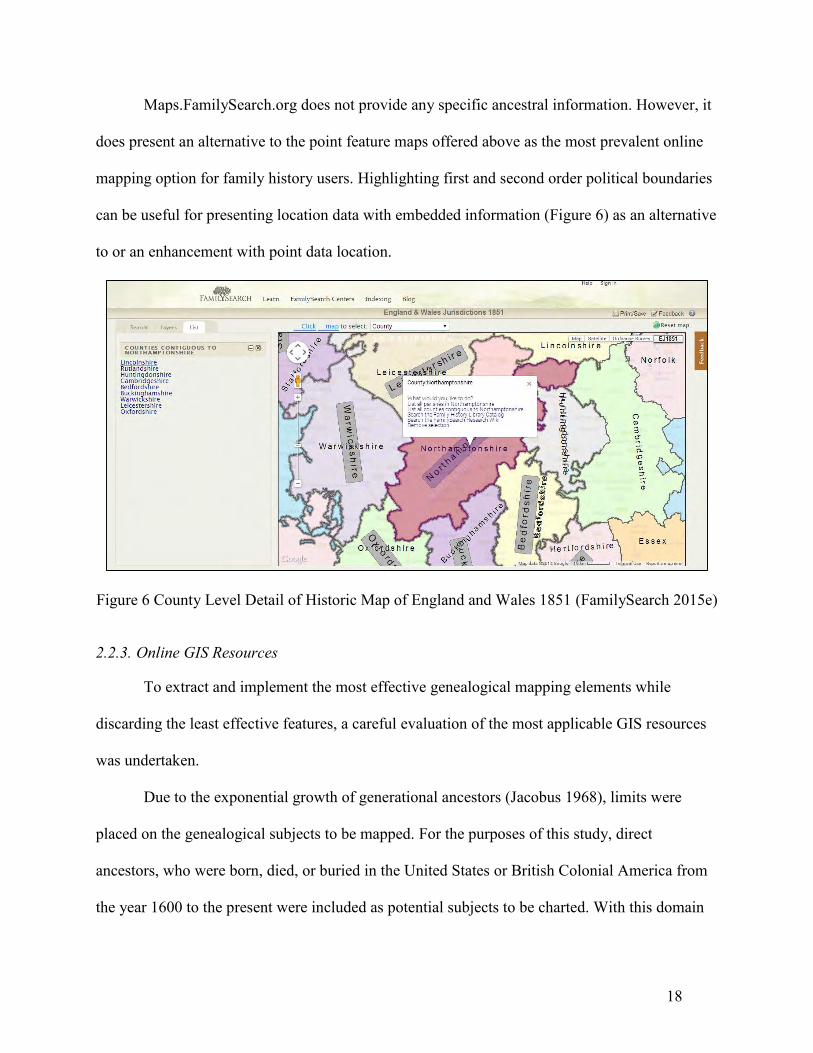
Maps.FamilySearch.org does not provide any specific ancestral information. However, it
does present an alternative to the point feature maps offered above as the most prevalent online
mapping option for family history users. Highlighting first and second order political boundaries
can be useful for presenting location data with embedded information (Figure 6) as an alternative
to or an enhancement with point data location.
Figure 6 County Level Detail of Historic Map of England and Wales 1851 (FamilySearch 2015e)
2.2.3. Online GIS Resources
To extract and implement the most effective genealogical mapping elements while
discarding the least effective features, a careful evaluation of the most applicable GIS resources
was undertaken.
Due to the exponential growth of generational ancestors (Jacobus 1968), limits were
placed on the genealogical subjects to be mapped. For the purposes of this study, direct
ancestors, who were born, died, or buried in the United States or British Colonial America from
the year 1600 to the present were included as potential subjects to be charted. With this domain
19
in mind, we will review the data and capabilities of the United States Geologic Survey (USGS)
Geographic Names Information System (GNIS), Newberry Library, and Google Earth.
2.2.3.1. Geographic Names Information System and FamilySearch
The USGS has been engaged in the task of collecting and standardizing place-names
since its national mapping mandate in 1879 (Timothy 2008). In accordance with this mandate,
the USGS has maintained place name records in paper, microform, and now, on the internet
(U.S. Board on Geographic Names 2015). The GNIS is accessible at http://geonames.usgs.gov,
where the catalog enables the researcher, geographer, or genealogist, to query any place
domestically in the United States, U.S. territories, or Antarctica (Timothy 2008).
FamilySearch takes stewardship for its own place authority to be applied in application
development and user-initiated searches:
The Place resource is used to read a place. It is a representation of the logical place and will have one or more Place Descriptions associated with it. For example, the city of Provo exists in the county of Utah, in the state of Utah, in the United States. However, when Provo was first established, the state of Utah did not exist. Utah County existed in the Utah Territory. So, Provo has two Place Descriptions but only one Place resource: Provo, Utah, Utah Territory, United States (1850-1896) [and] Provo, Utah, Utah, United States (1896-present) (FamilySearch 2015h)
FamilySearch recognizes the usefulness of the GNIS and has built a template for its API to link
the Name databases (FamilySearch 2015j)
2.2.3.2. Newberry Library county map
Researchers have observed county and state boundaries that have changed and shifted
throughout the United States as history has progressed. Observers have also recognized the
potential challenge those changes pose to genealogists (Timothy 2008). Records are often
located at the county level, and county geometries are highly malleable over time. According to
20
Dallen J Timothy, author of Geography and Genealogy: Locating Personal Pasts, borders can be
altered through items like additions, splits, mergers, and occasional extinction’s (Timothy 2008,
38). Understanding when these changes occur can be crucial in the process of researching
ancestral records.
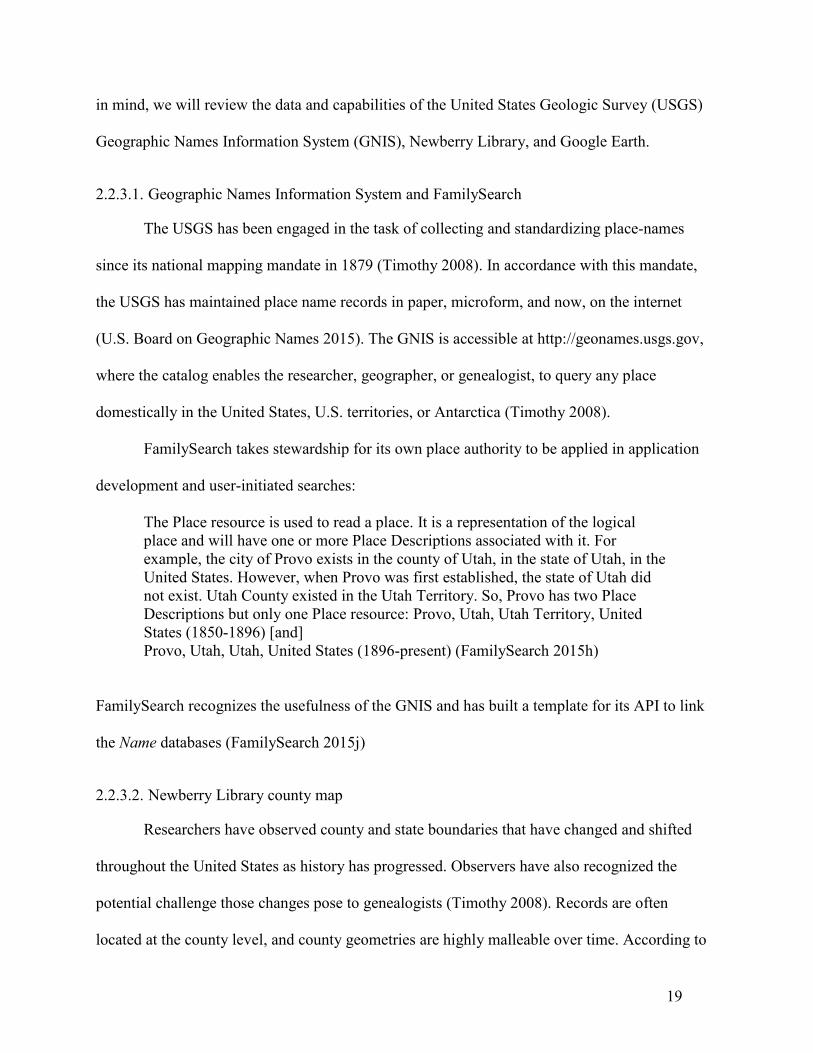
An example in county topological complexity is illustrated below by, using the Atlas of
Historical County Boundaries, in antebellum eastern Tennessee (Siczewicz et al. 2011). Figure 7
frames a five county juncture near Maynardville, north of Knoxville, TN. This screenshot shows
the topological relationship between Campbell, Clairborne, Granger, Knox, and Anderson prior
to 1854.
Fig 7 Junction of Campbell, Clairborne, Granger, Knox, and Anderson Counties prior to 1854
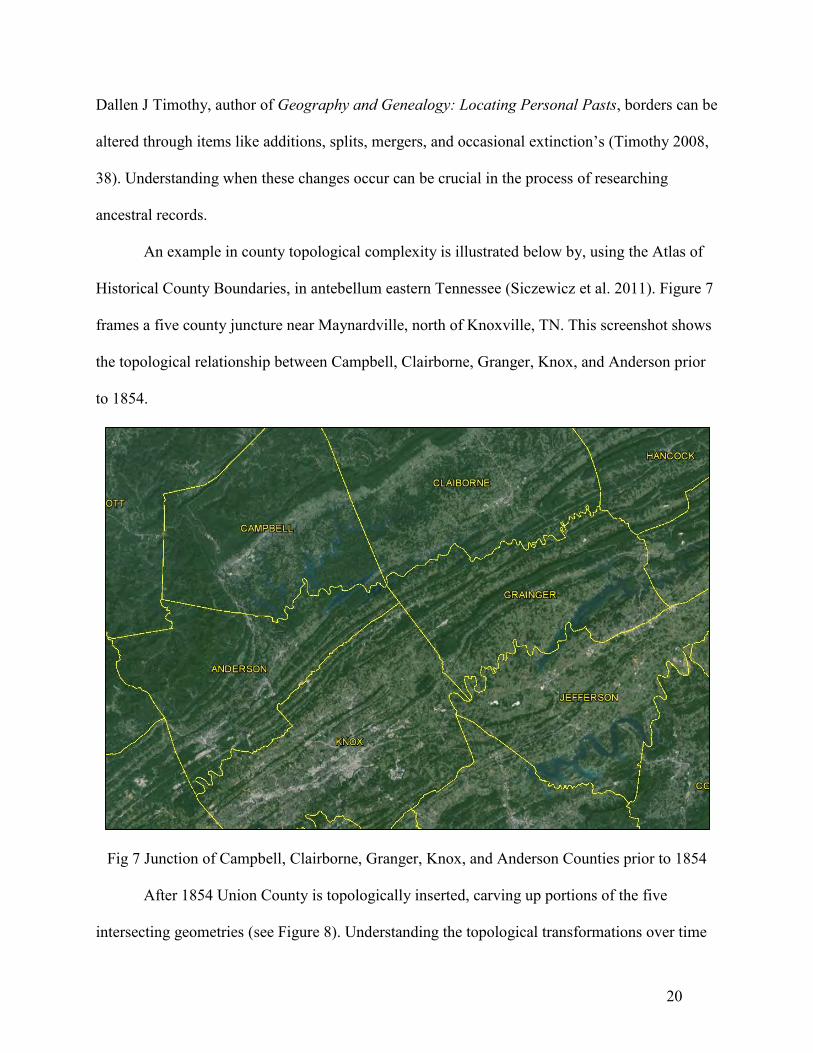
After 1854 Union County is topologically inserted, carving up portions of the five
intersecting geometries (see Figure 8). Understanding the topological transformations over time
21
is key to a proper application of genealogical record research. Identifying the precise point in
time each county boundary change occurred may suggest what jurisdiction holds the appropriate
family records. “The ‘parent county’ often retained records created during the time period prior
to the split” (Timothy 2008, 38). Timothy cites inattention to such details as a frequent cause of
error in genealogical research.
Fig 8 Insertion of Union County in the junction 1854
The William M. Scholl Center for Family and Community History at the Newberry
Library in Chicago sponsors The Atlas of Historical County Boundaries Project (Timothy 2008).
In an effort to track changes like those exemplified in the figures above, the project documents
every boundary change, as they occurred, in “each county, unorganized territory, and non-county
areas (that were attached to organized counties for administration purposes)” (Timothy 2008 38).
Changes are represented topologically in the map and documented in data tables to make a

22
comprehensive list of each name and geometry change that occurred in counties over time
(Timothy 2008).
Since 2001, the project has changed from a printing operation, responsible for volumes of
published documents regarding boundary changes, to the development of digital cartographic
files, suitable for GIS (Timothy 2008). The project has produced digital datasets for counties and
states (including states and territories) in the United States. The files are available in .SHP format
for ArcGIS users and KML for users who work in Google Earth. (Atlas of Historical County
Boundaries 2015).
2.2.3.3. Google Earth, Esri and dynamic mapping
In late 2004, Google Inc. purchased Keyhole Corp. Keyhole’s mapping software, known
as Earth Viewer. This software was engineered to make large amounts of data (muli-terabyte)
available in a user-friendly and intuitive interface (Langdon 2004). Langdon (2004) describes the
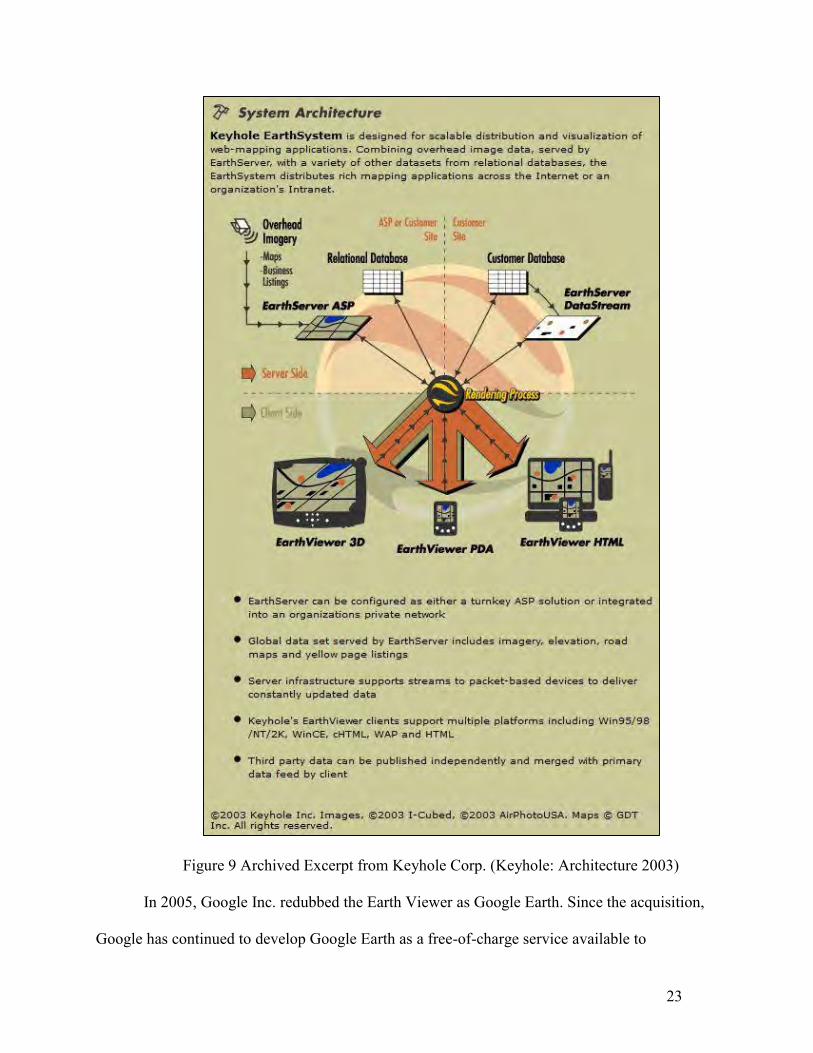
visual power of this software as follows:
With Keyhole [Earth Viewer], you can fly like a superhero from your computer at home to a street corner somewhere else in the world … [The] acquisition gives Google users a powerful new search tool, enabling users to view 3D images of any place on earth as well as tap a rich database of roads, businesses and many other points of interest. Keyhole is a valuable addition to Google's efforts to organize the world's information and make it universally accessible and useful.
An illustration of Keyhole’s EarthViewer architecture outlines the program’s capability to
distribute and visualize web-mapping data (see Figure 9).
23
Figure 9 Archived Excerpt from Keyhole Corp. (Keyhole: Architecture 2003)
In 2005, Google Inc. redubbed the Earth Viewer as Google Earth. Since the acquisition,
Google has continued to develop Google Earth as a free-of-charge service available to

24
individuals with a personal computer running MS Windows 2000 or XP, Mac OS X 10.3.9 or
later, and Linux Kernel 2.4 or later (operating systems as they were current in 2004) (Stefanakis
2008).
Google Earth has been crafted into a powerful user platform that enables users to access a
variety of data and sources including the county change file discussed previously. A Directions
Magazine report in February 2015 suggests that the future of Google Earth as a development tool
is in flux. Google is in the midst of a transition as it “deprecates” its API, but other service
providers including CartoDB, Mapbox, Esri, and other geospatial providers are looking for new
customers (Sinton 2015). This is borne out by Esri’s announcement webpage for ArcGIS Earth,
touting launch details.
ArcGIS Earth is a new lightweight app that supports the Google Earth use case for high performance visualization. In coordination with Google, Esri is providing no-cost software and training to help ensure Google users' transitions are successful. Depending on the particular use case, Google users will also take advantage of ArcGIS Pro and Esri’s WebGL 3D viewer to help in their transition. Review the Esri special offer for Google customers and partners. (ArcGIS Earth 2015)
The application map designed to correspond with the research carried out in this thesis was
developed using Google Earth prior to the changes on the horizon in late 2015.
Alternatives to Google Earth were explored including CartoDB and the Esri Story Map.
Both CartoDB and Esri could process the changeable county map in shapefile (SHP) format, but
they could not match Google’s intuitive interface, or the ability to customize code to register the
county data with FamilySearch data in Keyhole Markup Language (KML).
2.3 User experience and technology trends
To conclude the background for this project, it is important to summarize major trends in
user experience and technology applied to genealogical mapping. By adopting the KML format,

25
the user will be able to explore the family history spatially and temporally. Early attempts were
made to embed the information in a website as exemplified by a Boeing Corporation tool for
visualizing flight tracks of its 787 Dreamliner aircraft within the Google Earth user environment
(Figure 10). However, recent actions taken by Google to deprecate the Google Earth plugin and
issues involving data security with the plugin encouraged a different path (Sinton 2015).
Figure 10 787 Dreamliner Flight Tracker (Boeing 2015)
As discussed in detail in Chapter 3, to create an electronic user map, family history data
was extracted from FamilySearch’s verified database. Specifically, records for names, dates
(birth date and death date), and locations (birth place, and death place), as well as hyperlinks to
individual family records with life event and census information were extracted. This
information was rendered spatially with data written in KML, which allowed for an animated
and interactive mapping interface.

26
With the acceleration of web GIS and geo-visualization technologies, animated and
interactive maps are an important trend in geographic information science and technology. This
project explores that trend in the area of genealogical mapping. By using the Google Earth
application downloaded directly from https://www.google.com/earth/, the mapping program is
enabled with full functionality and user control. This is crucial with regard to the user’s potential
interaction with the county change map from Newberry Library. The changing county KML is a
motion map and carries with it elements of animated maps.
However, animated maps are inherently problematic with regards to research and analysis
because of their tendency to induce split attention (Harrower et al. 2008). Harrower and
Fabrikant argue that while static maps present all of their information simultaneously, animated
maps present information over time and are an effective technique to depict geographic change
and processes. The challenge is to represent the geographic changes over time while not
overwhelming the user with visual information. The process of balancing the visual and
informational elements will be addressed in further detail in chapter 3.
27
Chapter 3 Data and methods
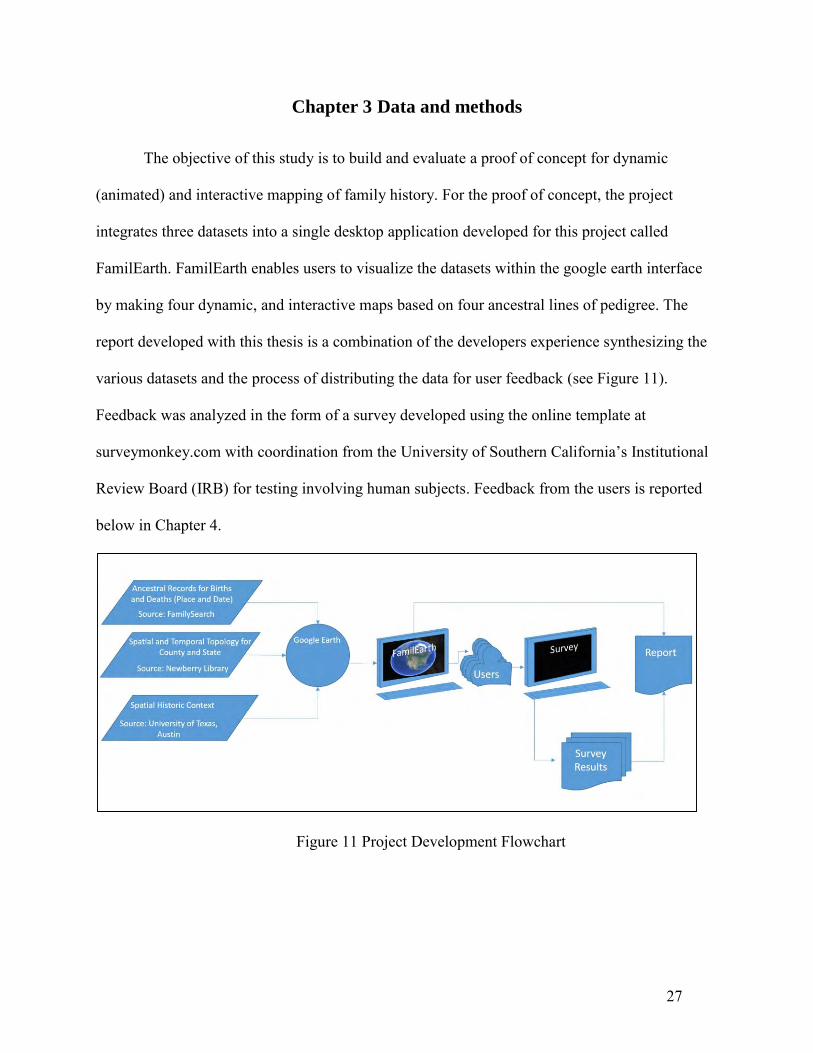
The objective of this study is to build and evaluate a proof of concept for dynamic
(animated) and interactive mapping of family history. For the proof of concept, the project
integrates three datasets into a single desktop application developed for this project called
FamilEarth. FamilEarth enables users to visualize the datasets within the google earth interface
by making four dynamic, and interactive maps based on four ancestral lines of pedigree. The
report developed with this thesis is a combination of the developers experience synthesizing the
various datasets and the process of distributing the data for user feedback (see Figure 11).
Feedback was analyzed in the form of a survey developed using the online template at
surveymonkey.com with coordination from the University of Southern California’s Institutional
Review Board (IRB) for testing involving human subjects. Feedback from the users is reported
below in Chapter 4.
Figure 11 Project Development Flowchart
28
3.1 Survey of FamilySearch Data
According to the FamilySearch website: “FamilySearch is a nonprofit family history
organization dedicated to connecting families across generations” (FamilySearch 2015a).
FamilySearch grew out of the Genealogical Society of Utah, which was founded in 1894 to help
people connect with their ancestors through easy access to historical records (FamilySearch
2015a).
FamilySearch enables this mission through a multistage process of document imaging,
converting, preserving, indexing, and finally making records accessible. Imaging is what
FamilySearch dubs Image Capture. This can mean either obtaining quality images through
microfilm (which has been the historic standard) or by using digital photographic preservation
methods (which are becoming more common). The records are then digitized and stored in a
long-term repository designed to preserve family records. The process of transcribing the
digitized documents is known as indexing, and it makes thousands of records searchable.
Documents that are transcribed and searchable are accessible on FamilySearch, enabling
individuals with the source material to populate the FamilySearch database with a lineage to
which others may connect (FamilySearch 2015b).
3.1.1. Content
The dynamic and interactive map was developed using the names and dates that represent
ancestors of a given user. This information was available by tapping into the Person Search data
structure represented in Table 1, with the name column representing searchable items that could
be assigned as variables in a program, and the description column provides a definition for those
variables.

29
Table 1 Variable Name Description from Person Search Resource (FamilySearch 2015g)
name Description
name: The full name of the person being searched. givenName: The given name of the person being searched. surname: The family name of the person being searched. gender: The gender of the person being searched. Valid values are "male" and
"female". birthDate: The birth date of the person being searched. Date ranges are supported by
placing a "-" between two dates. birthPlace: The birth place of the person being searched. christeningDate: The christening date of the person being searched. Date ranges are
supported by placing a "-" between two dates. christeningPlace: The christening place of the person being searched. birthLikeDate:
The date of the birth-like event of the person being searched. Date ranges are supported by placing a "-" between two dates.
birthLikePlace: The place of the birth-like event of the person being searched. deathDate:
The death date of the person being searched. Date ranges are supported by placing a "-" between two dates.
deathPlace: The death place of the person being searched. burialDate: The burial date of the person being searched. deathLikeDate: The date of the death-like event of the person being searched. Date ranges
are supported by placing a "-" between two dates. deathLikePlace: The place of the death-like event of the person being searched. marriageDate:
The marriage date of the person being searched. Date ranges are supported by placing a "-" between two dates.
marriagePlace: The marriage place of the person being searched.
Using the parameter from the API Person Search, developers can code functions that will
seek out family members and data based on the users credentials (username and login) from this
information, a profile is built, and complete records or portions of a complete record can be
extracted as exemplified by the response to an XML request to Read Person Ancestry and
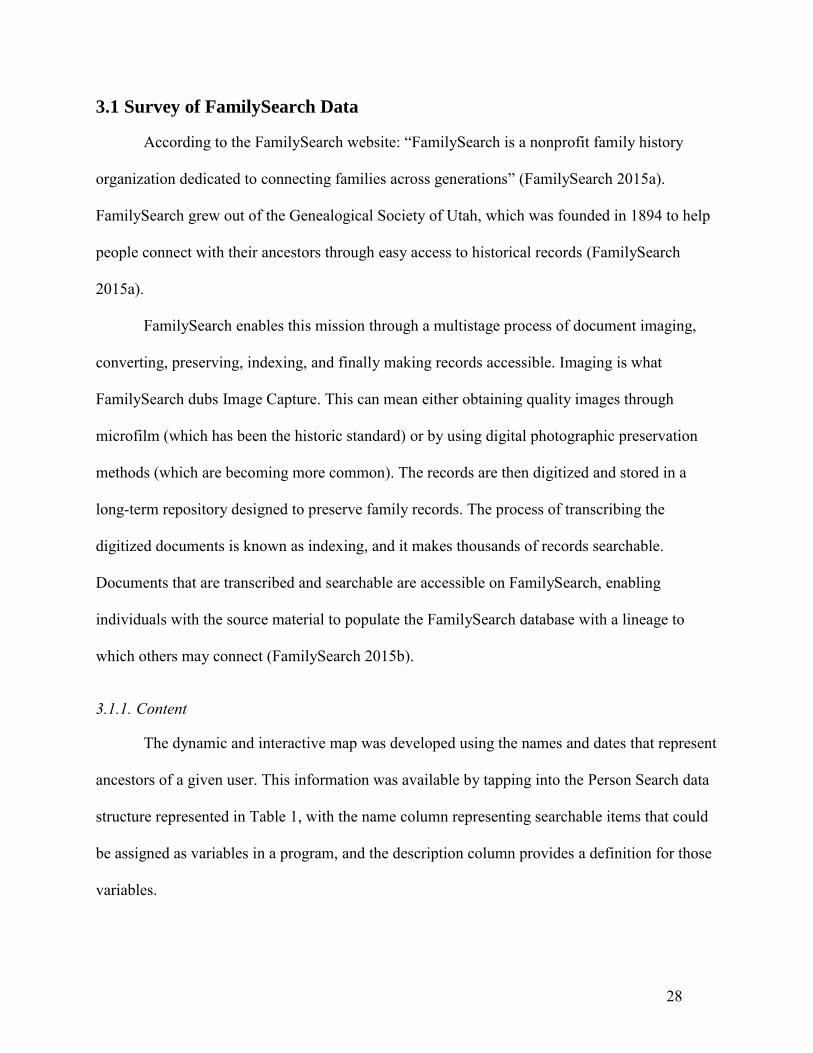
additional person details from FamilySearch’s API (see Figure 12).
30
Figure 12 FamilySearch API response to XML Read Person Ancestry and Additional Person
Details Request (FamilySearch 2015i)
According to the FamilySearch API, the ascendancy number is interpreted as an ahnen number
that determines the position of each person in the pedigree. The term ahnen comes from
Ahnentafel derived from two German words, “ahnen” meaning ancestors, and “tafel,” meaning
table, hence table of ancestors (Williams 1960, 16).
3.1.2. Data extracted
Data from FamilySearch was extracted manually and then transcribed into a Microsoft
Excel spreadsheet with the following seven columns, Name, Date of Birth, Birth County, Date of
Death, Death County, Comments, and the FamilySearch Hyperlink (FSHL) encoded with the
ancestor’s individual record identification (FSID). The following table describes the collection
methodology applied when extracting names, dates, and locations from the FamilySearch
database (see Table 2). It is important to note that an eighth column was added to the table to
process the FSHL with the FSID (see section 3.3.1).
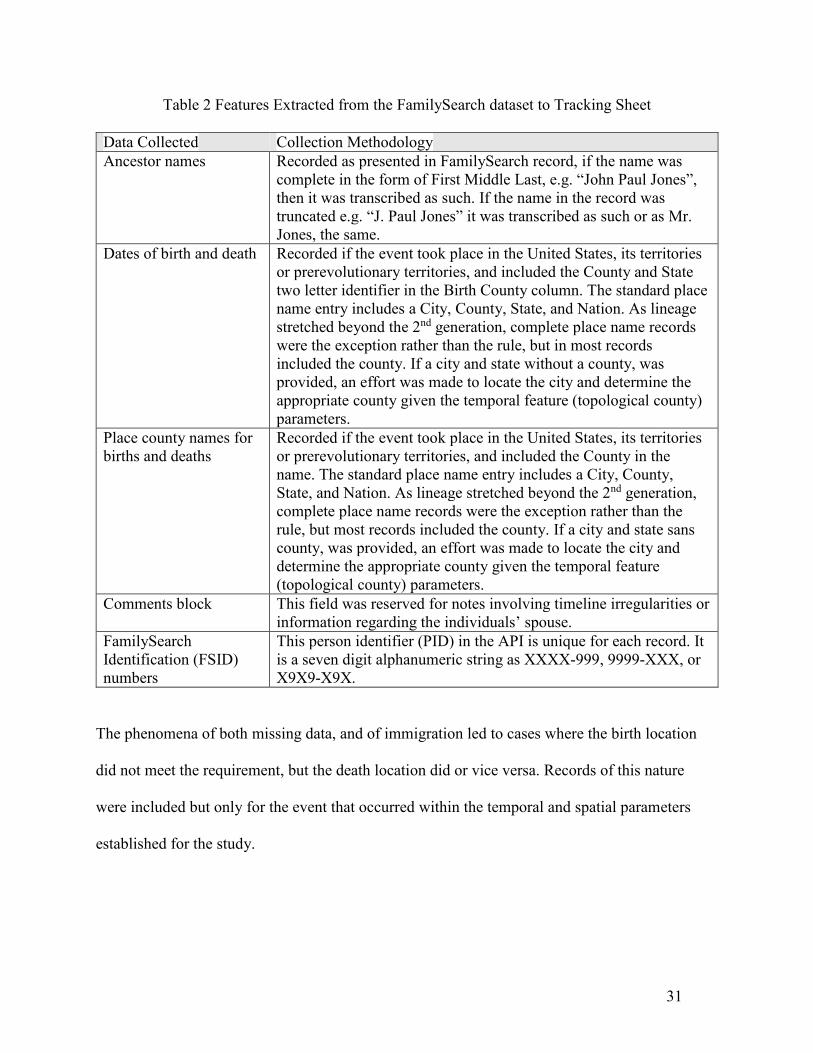
31
Table 2 Features Extracted from the FamilySearch dataset to Tracking Sheet
Data Collected Collection Methodology Ancestor names Recorded as presented in FamilySearch record, if the name was
complete in the form of First Middle Last, e.g. “John Paul Jones”, then it was transcribed as such. If the name in the record was truncated e.g. “J. Paul Jones” it was transcribed as such or as Mr. Jones, the same.
Dates of birth and death Recorded if the event took place in the United States, its territories or prerevolutionary territories, and included the County and State two letter identifier in the Birth County column. The standard place name entry includes a City, County, State, and Nation. As lineage stretched beyond the 2nd generation, complete place name records were the exception rather than the rule, but in most records included the county. If a city and state without a county, was provided, an effort was made to locate the city and determine the appropriate county given the temporal feature (topological county) parameters.
Place county names for births and deaths
Recorded if the event took place in the United States, its territories or prerevolutionary territories, and included the County in the name. The standard place name entry includes a City, County, State, and Nation. As lineage stretched beyond the 2nd generation, complete place name records were the exception rather than the rule, but most records included the county. If a city and state sans county, was provided, an effort was made to locate the city and determine the appropriate county given the temporal feature (topological county) parameters.
Comments block This field was reserved for notes involving timeline irregularities or information regarding the individuals’ spouse.
FamilySearch Identification (FSID) numbers
This person identifier (PID) in the API is unique for each record. It is a seven digit alphanumeric string as XXXX-999, 9999-XXX, or X9X9-X9X.
The phenomena of both missing data, and of immigration led to cases where the birth location
did not meet the requirement, but the death location did or vice versa. Records of this nature
were included but only for the event that occurred within the temporal and spatial parameters
established for the study.

32
3.2 Survey of Newberry Library Data
With the names, dates, and places extracted, the genealogical data was paired with its
topology contained in the changeable county file. The Newberry Library Atlas of Historical
County Boundaries is a generalized version of the U.S. Historical Counties shapefile, based on a
0.001-degree tolerance. This dataset portrays the different configurations of every county or
county equivalent in the United States, exhaustively, from March 4, 1629 through December 31,
2000 (Siczewicz et al. 2011).
The atlas is designed to be completely comprehensive with the exception of non-county
areas in western Virginia, New York, and the New England states during much of the
seventeenth century. Owing to technical and political dysfunction in London and the other
imperial capitals of Europe, officials often had incomplete or inaccurate data about the colonial
interior and asserted limits too extreme to be plotted, such as boundaries extending to the Pacific
Ocean or what is termed South Sea regions (Siczewicz et al. 2011)
The Newberry dataset is engineered to enable GIS integration for analysis and display of
county-related historical data (Siczewicz et al. 2011). With the exception of the region in time,
noted above, the integrity of the geometric data is designed to be complete including regions
purposely set aside for future settlement. Regions that have been established and geographically
defined but are not named are assigned a non-county area with a number, such as NCA1
(Siczewicz et al. 2011).
Feature topological integrity in the Newberry dataset was ensured through a multi-step
process. First, the United States dataset was converted to a polygon feature class in an Esri
geodatabase. Polygon boundary lines were planarized in ArcMap to generate non-overlapping

33
polygons. Finally, the Esri topology function was applied to find and snap geometry features that
create gaps or overlaps (Siczewicz et al. 2011).
The generalization process was carried out as a component of the topology processing
tools. ArcGIS was utilized to convert the component polygon borders to lines. After the lines
were planarized and smoothed, based on the selected tolerance, the new component polygon was
matched to its original component polygon (Siczewicz et al. 2011). The degree tolerance
determines the polygon features geometric complexity and may affect the features accuracy.
Newberry Library supports three degree tolerances for Google Earth (0.001, 0.01, and 0.05). For
the FamilEarth project, the 0.001-degree tolerance was selected because the precision enhanced
the user’s spatial sense with no adverse impact to the processing time in the FamilEarth user
interface. The selected degree tolerance makes the KML features in the map an effective
1:250,000 scale (Newberry 2015).
Figure 13 Clear Creek and Gilpin Counties, CO planarized to tolerances of 0.001 and 0.05
3.2.1. Detailed Content of Newberry’s Changeable County Data
The Newberry Library’s changeable county file attribution is ordered by name, timespan,
and SchemaData. Locations of places indicated in the place names come from modern federal
base maps, secondary publications (e.g., gazetteers, county histories, articles in historical
34
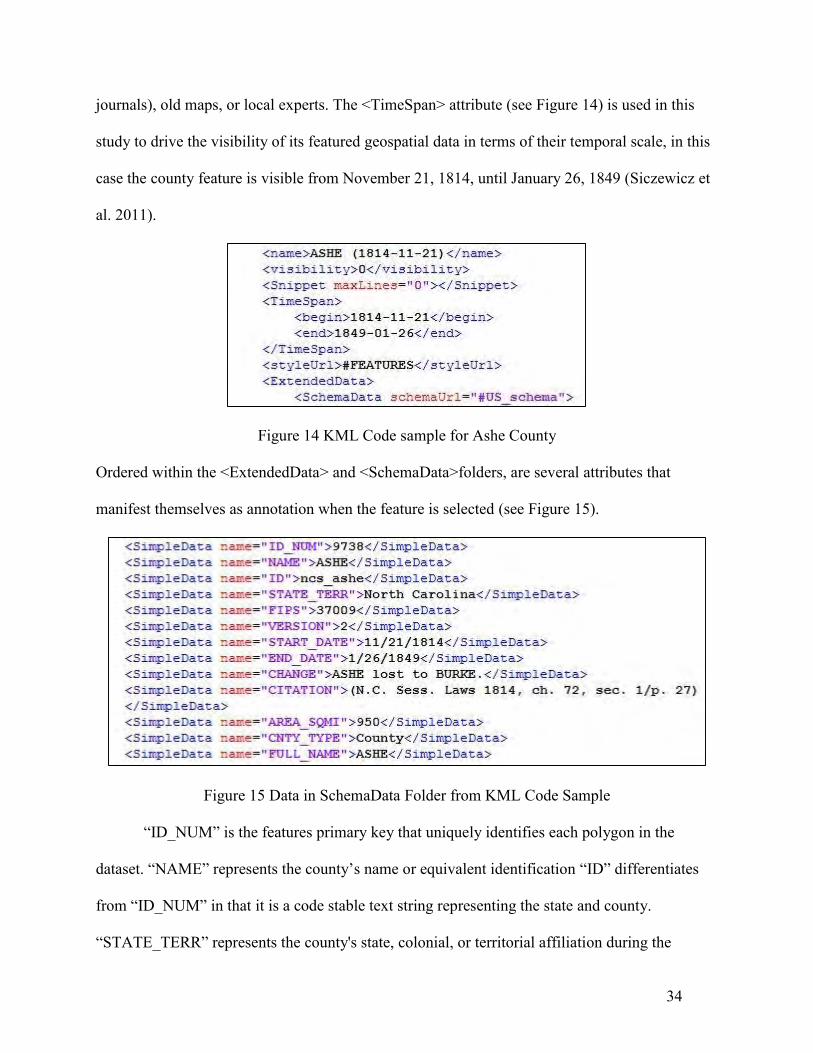
journals), old maps, or local experts. The <TimeSpan> attribute (see Figure 14) is used in this
study to drive the visibility of its featured geospatial data in terms of their temporal scale, in this
case the county feature is visible from November 21, 1814, until January 26, 1849 (Siczewicz et
al. 2011).
Figure 14 KML Code sample for Ashe County
Ordered within the <ExtendedData> and <SchemaData>folders, are several attributes that
manifest themselves as annotation when the feature is selected (see Figure 15).
Figure 15 Data in SchemaData Folder from KML Code Sample
“ID_NUM” is the features primary key that uniquely identifies each polygon in the
dataset. “NAME” represents the county’s name or equivalent identification “ID” differentiates
from “ID_NUM” in that it is a code stable text string representing the state and county.
“STATE_TERR” represents the county's state, colonial, or territorial affiliation during the

35
county version's temporal existence. “FIPS” is the Federal Information Processing Standard. It is
a convenient alternate to the numeric primary key for researchers already working with other
data numerically designated. “VERSION” represents the chronologically ordered changes to the
county’s name, geometric configuration, or alterations to the county’s state or territorial
confederation. “START_DATE” is the initial date for the county’s iteration. “END_DATE” is
the last date for the county’s existence in that version or event. “CHANGE” describes the
creation and changes for each county and the date on which it occurred. “CITATION” references
the source of the data for the event described by “CHANGE”.
“AREA_SQMI” is the area of a county or county equivalent in square miles, based on the
appropriate Albers Equal Area projection. “CNTY_TYPE” differentiates three categories of
county:
(1) District: judicial districts, a county equivalent that at one time served as a basic unit
of government in South Carolina.
(2) Parish: a county equivalent that at one time served as a basic unit of government in
South Carolina, and which is currently the primary unit of government in Louisiana.
(3) County: all remaining counties and county equivalents included in this dataset.
“FULL_NAME” is the name or other identification of a county or its equivalent (Siczewicz et al.
2011).
Following the SimpleData, the KML code describes the feature geometry with
coordinates in decimal degree longitude, latitude, and altitude (altitude value is always set at 0).

36
3.2.2. Functional elements of the data
The result of the KML code is a geometric feature overlaid on the Google Earth surface
as shown in the example in Figure 16. The feature defaults determine the line color and fill
properties, and the feature geometry is dependent on the position of the timescale as determined
by the TimeSpan element of the KML script.
Figure 16 Ashe County, North Carolina in Google Earth
The user interacts with the KML geometry by selecting the geometry with a mouse click. The
click event initiates a window displaying the SchemaData as described above. The user activity
makes the data available to the user (see Figure 17).

37
Figure 17 SchemaData for Ashe County, North Carolina
The complete county feature is visible in the KML when each iteration of that county is
activated in Google Earth’s table of contents. Ashe County has seven iterations or versions with
contiguous start and end dates. Each version is dictated by the KML script and is progressively
changeable as the Google Earth time bar is manipulated. Version 1 of Ashe County is visible
from December 23, 1799, through November 11, 1814 (see Figure 18). The center image in
Figure 18 represents Ashe County between January 27, 1849, and January 31, 1859. The
temporal scale is set to October 1854. The final version of Ashe County North Carolina is
displayed in the last image in the series. It is visible when the timescale tab is moved to the far
right.
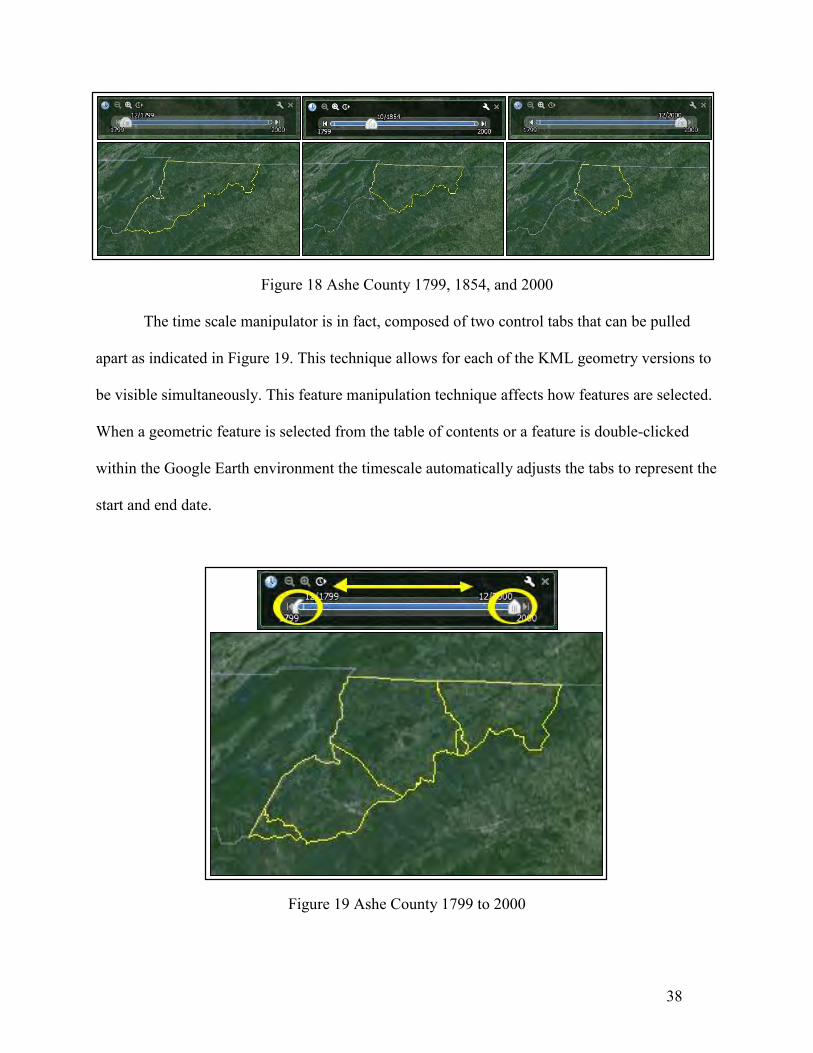
38
Figure 18 Ashe County 1799, 1854, and 2000
The time scale manipulator is in fact, composed of two control tabs that can be pulled
apart as indicated in Figure 19. This technique allows for each of the KML geometry versions to
be visible simultaneously. This feature manipulation technique affects how features are selected.
When a geometric feature is selected from the table of contents or a feature is double-clicked
within the Google Earth environment the timescale automatically adjusts the tabs to represent the
start and end date.
Figure 19 Ashe County 1799 to 2000

39
3.3 Extraction of FamilySearch Data
FamilySearch presents its data in an array from which the developer can extract the
requisite information needed to develop the map. The growth of ancestors from which to extract
data is approximately consistent with the following equation:
2x + (2x – 1) = y
Here x is the number of generations being extracted and y is the total number of records returned.
The equation result is only an estimate and assumes an even distribution of ancestors over time,
and such an assumption is not likely found in nature (Eriksson et al. 2010). However, following
this assumption, the number of ancestors after ten linear generations would be 2,047. Despite the
large pool of data to be extracted, records had to be extracted manually, as early attempts to
automate the process proved fruitless. The manual process required precise organization and
meticulous attention to detail.
3.3.1. Method of extraction
When the array of ancestors initially presents itself in the FamilSearch interface, only the
names and dates are visible (as seen in the top half of Figure 20). Selecting the records enabled
the extractor to expand the ancestral data and access the requisite date and locational information
(see Figure 20).

40
Figure 20 Couple Info and Individual Details in FamilySearch (FamilySearch 2015d)
The extracted information was manually entered into the tracking sheet. (At this stage in the
process the table was for reference, the data was not normalized). The process for recording birth
and death records from FamilySearch is outlined in the flowchart in the following page. If a
death date was not provided, a burial date and location was used, where available (see Figure
21).

41
Figure 21 Process Description for Recording Births and Deaths in Tracking Sheet
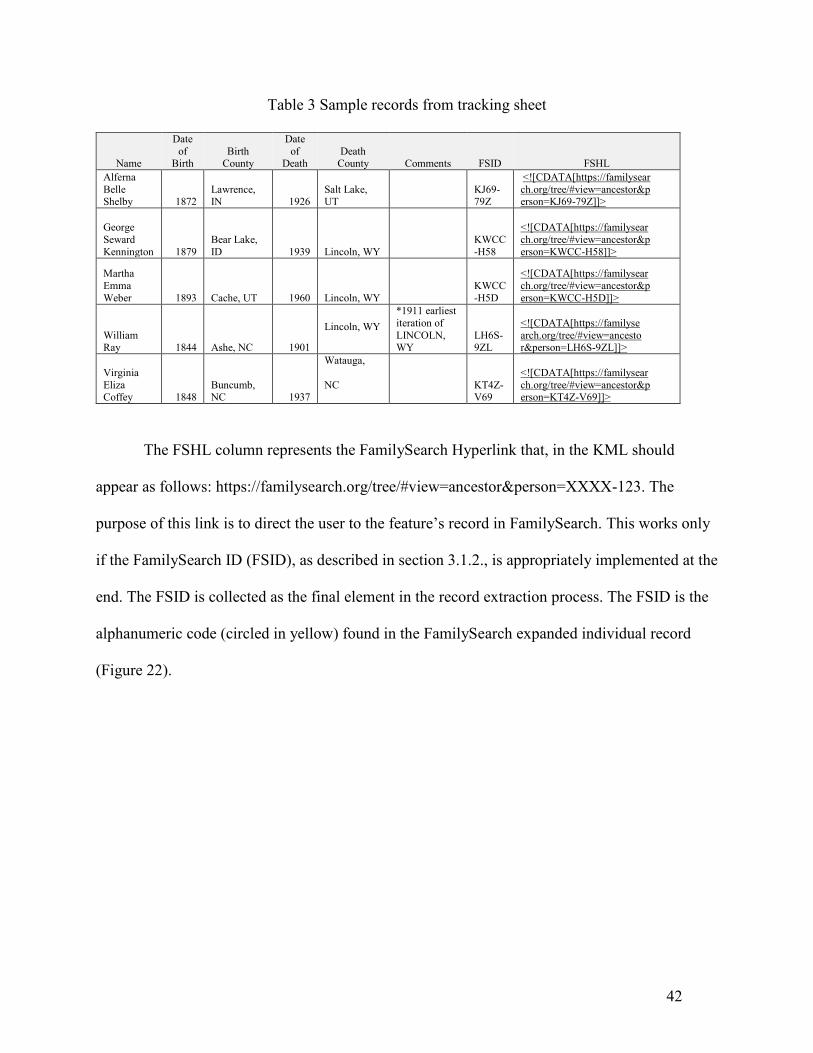
The tracking sheet is a table composed of 8 columns. Each of the vital data points extracted, as
described earlier in this chapter, (see section 3.1.2.) represent a column in the table. Table 3 has a
sample of information collected in the tracking sheet.
42
Table 3 Sample records from tracking sheet
Name
Date of
Birth Birth
County
Date of
Death Death
County Comments FSID FSHL Alferna Belle Shelby 1872
Lawrence, IN 1926
Salt Lake, UT
KJ69-79Z
<![CDATA[https://familysearch.org/tree/#view=ancestor&person=KJ69-79Z]]>
George Seward Kennington 1879
Bear Lake, ID 1939 Lincoln, WY
KWCC-H58
<![CDATA[https://familysearch.org/tree/#view=ancestor&person=KWCC-H58]]>
Martha Emma Weber 1893 Cache, UT 1960 Lincoln, WY
KWCC-H5D
<![CDATA[https://familysearch.org/tree/#view=ancestor&person=KWCC-H5D]]>
William Ray 1844 Ashe, NC 1901
Lincoln, WY *1911 earliest iteration of LINCOLN, WY
LH6S-9ZL
<![CDATA[https://familysearch.org/tree/#view=ancestor&person=LH6S-9ZL]]>
Virginia Eliza Coffey 1848
Buncumb, NC 1937
Watauga,
NC
KT4Z-V69
<![CDATA[https://familysearch.org/tree/#view=ancestor&person=KT4Z-V69]]>
The FSHL column represents the FamilySearch Hyperlink that, in the KML should
appear as follows: https://familysearch.org/tree/#view=ancestor&person=XXXX-123. The
purpose of this link is to direct the user to the feature’s record in FamilySearch. This works only
if the FamilySearch ID (FSID), as described in section 3.1.2., is appropriately implemented at the
end. The FSID is collected as the final element in the record extraction process. The FSID is the
alphanumeric code (circled in yellow) found in the FamilySearch expanded individual record
(Figure 22).

43
Figure 22 FSID Number in FamilySearch Ancestral Record (FamilySearch 2015d)
3.3.2. Encoding Hyperlinks in KML
Hyperlinks in the KML code must be encased in a bracket of the following structure:
<![CDATA[https://website_url]]>. The process for collecting the FamilySearch ID was semi-
automated by plugging an equation into the Excel table as follows:
="<![CDATA[https://familysearch.org/tree/#view=ancestor&person="&G13&"]]>"
This equation integrates the FSID into the KML. Note the selection of the G column (in this case
G13) encased by ampersand symbols at the end of the equation. This cell captures the code
including the ID number making for a complete hyperlink ready for the KML format. By
employing this excel equation format, the extraction process required the mere population of the
ID number and not the complete Uniform Resource Locator URL hyperlink each time.
3.3.3. Tracking record extraction
Although the extraction process was manual, systematic practices had to be employed to
ensure completeness without creating redundant information. Data sets were broken down by
family expansion units or couple sets (see Figure 23).

44
Figure 23 Initial Array of Ancestors in FamilySearch Interface (FamilySearch 2015d)
Couple sets expand into two generations consisting of 12 potential records (see Figure 24).
Figure 24 Expanded Array in FamilySearch User Interface with 12 Potential Records to be
Extracted (FamilySearch 2015d)

45
The 12 records result in eight potential lines of extraction (see Figure 25). At that point, the lines
were vetted to ensure they met the minimum qualifications for collection, as per the scope of the
project.
Figure 25 Expanded Array in FamilySearch User Interface with Eight Additional Potential Lines
to Extract (FamilySearch 2015d)
The subject ancestor must have had a recorded birth date, death date, or both birth and death
dates that have been recorded in the United States or British Colonies in the region that would
become the United States, after 1600. This process was carried out on each of the qualifying
eligible names until the records no longer met the minimum eligibility standards for collection.
If the subjects met these basic qualifications, their information was included in the
spreadsheet reference file for further extraction. Using these parameters, four reference
spreadsheets were developed. The developer had access to four Genealogic lines stemming from
his login credentials with FamilySearch, and these four lineage sets were separated into the
different reference spread sheets. The amount of data gleaned from each of these datasets varied
depending on the points at which ancestors immigrated to the British Colonies or the United
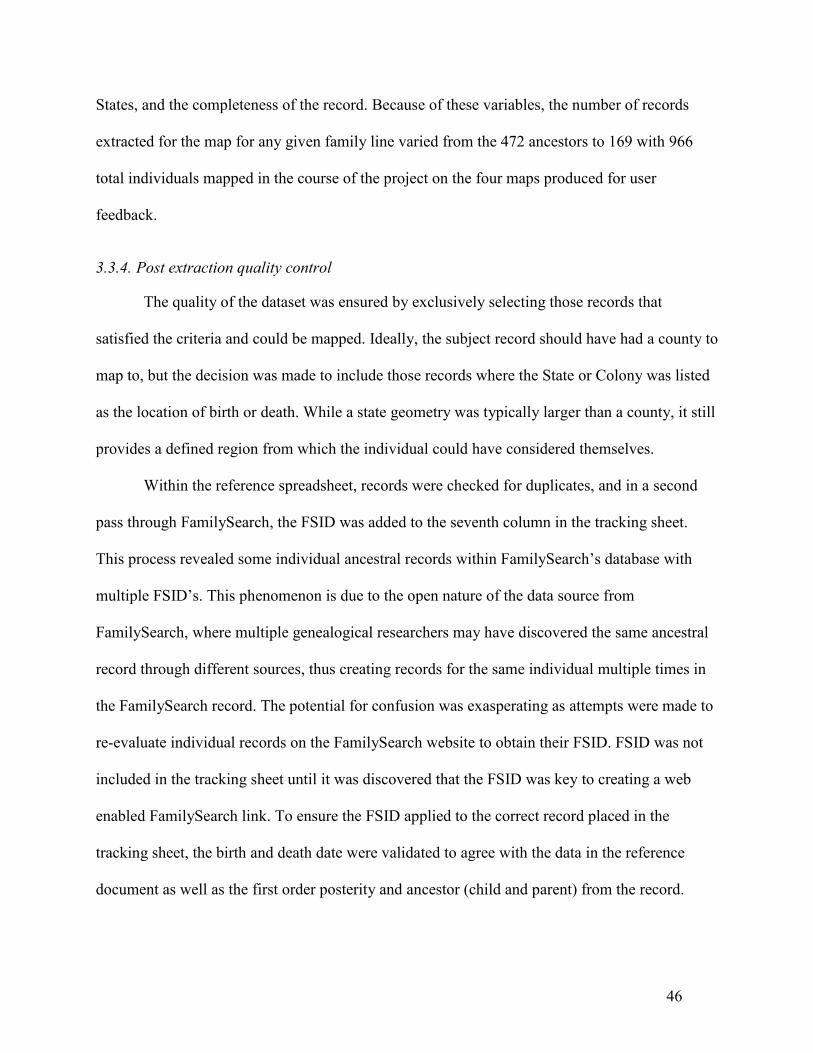
46
States, and the completeness of the record. Because of these variables, the number of records
extracted for the map for any given family line varied from the 472 ancestors to 169 with 966
total individuals mapped in the course of the project on the four maps produced for user
feedback.
3.3.4. Post extraction quality control
The quality of the dataset was ensured by exclusively selecting those records that
satisfied the criteria and could be mapped. Ideally, the subject record should have had a county to
map to, but the decision was made to include those records where the State or Colony was listed
as the location of birth or death. While a state geometry was typically larger than a county, it still
provides a defined region from which the individual could have considered themselves.
Within the reference spreadsheet, records were checked for duplicates, and in a second
pass through FamilySearch, the FSID was added to the seventh column in the tracking sheet.
This process revealed some individual ancestral records within FamilySearch’s database with
multiple FSID’s. This phenomenon is due to the open nature of the data source from
FamilySearch, where multiple genealogical researchers may have discovered the same ancestral
record through different sources, thus creating records for the same individual multiple times in
the FamilySearch record. The potential for confusion was exasperating as attempts were made to
re-evaluate individual records on the FamilySearch website to obtain their FSID. FSID was not
included in the tracking sheet until it was discovered that the FSID was key to creating a web
enabled FamilySearch link. To ensure the FSID applied to the correct record placed in the
tracking sheet, the birth and death date were validated to agree with the data in the reference
document as well as the first order posterity and ancestor (child and parent) from the record.
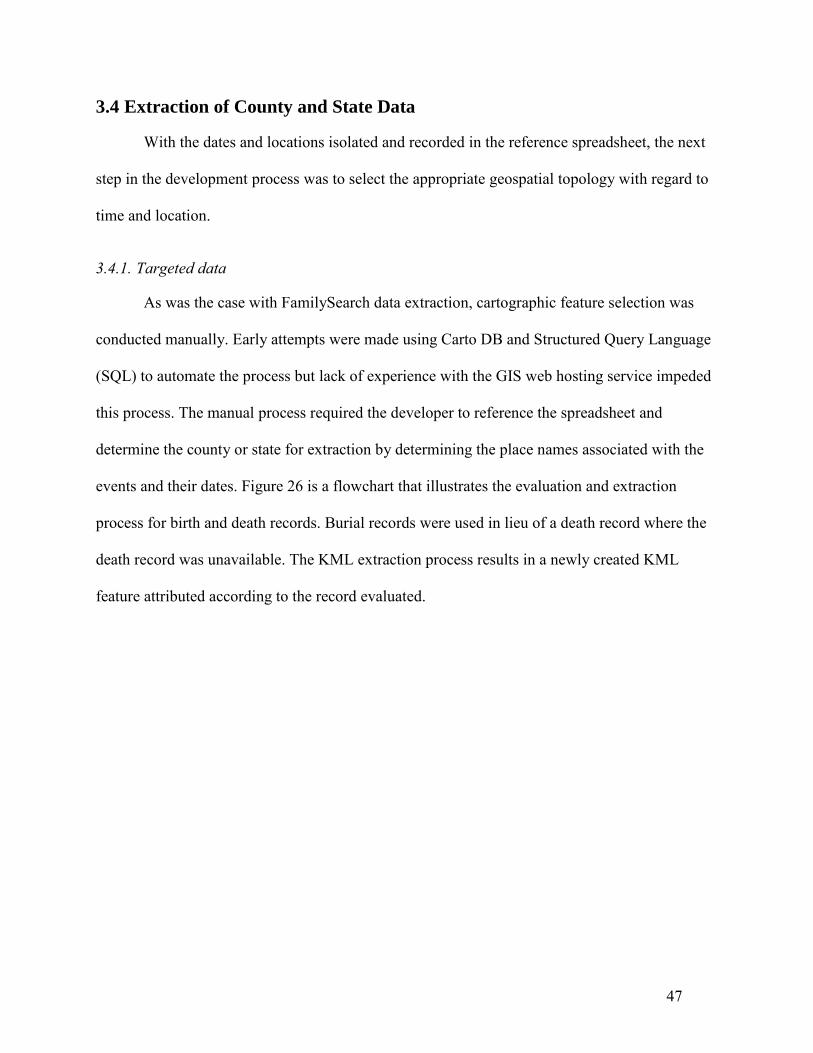
47
3.4 Extraction of County and State Data
With the dates and locations isolated and recorded in the reference spreadsheet, the next
step in the development process was to select the appropriate geospatial topology with regard to
time and location.
3.4.1. Targeted data
As was the case with FamilySearch data extraction, cartographic feature selection was
conducted manually. Early attempts were made using Carto DB and Structured Query Language
(SQL) to automate the process but lack of experience with the GIS web hosting service impeded
this process. The manual process required the developer to reference the spreadsheet and
determine the county or state for extraction by determining the place names associated with the
events and their dates. Figure 26 is a flowchart that illustrates the evaluation and extraction
process for birth and death records. Burial records were used in lieu of a death record where the
death record was unavailable. The KML extraction process results in a newly created KML
feature attributed according to the record evaluated.

48
Figure 26 Flowchart illustrating KML Feature Extraction Process for Birth Records
3.4.2. Manual method of manipulating KML for FamilEarth
A new feature was generated from an existing one by selecting a KML element with a
right click and then selecting “Save Place As…” in Google Earth. This action served to generate
a new KML element initially named after the original element from which it was created. The
KML was renamed to reflect the ancestor it represents and saved in a folder named for the
extracted family line. With the KML elements consolidated into a single folder, the code was
accessed with notepad++, a free source code editor that supports KML (Notepad 2015). In the
notepad++ interface, the name property was changed to the ancestor name as it appears in the
FamilySearch record (see Figure 27). The TimeSpan property was also modified according to the
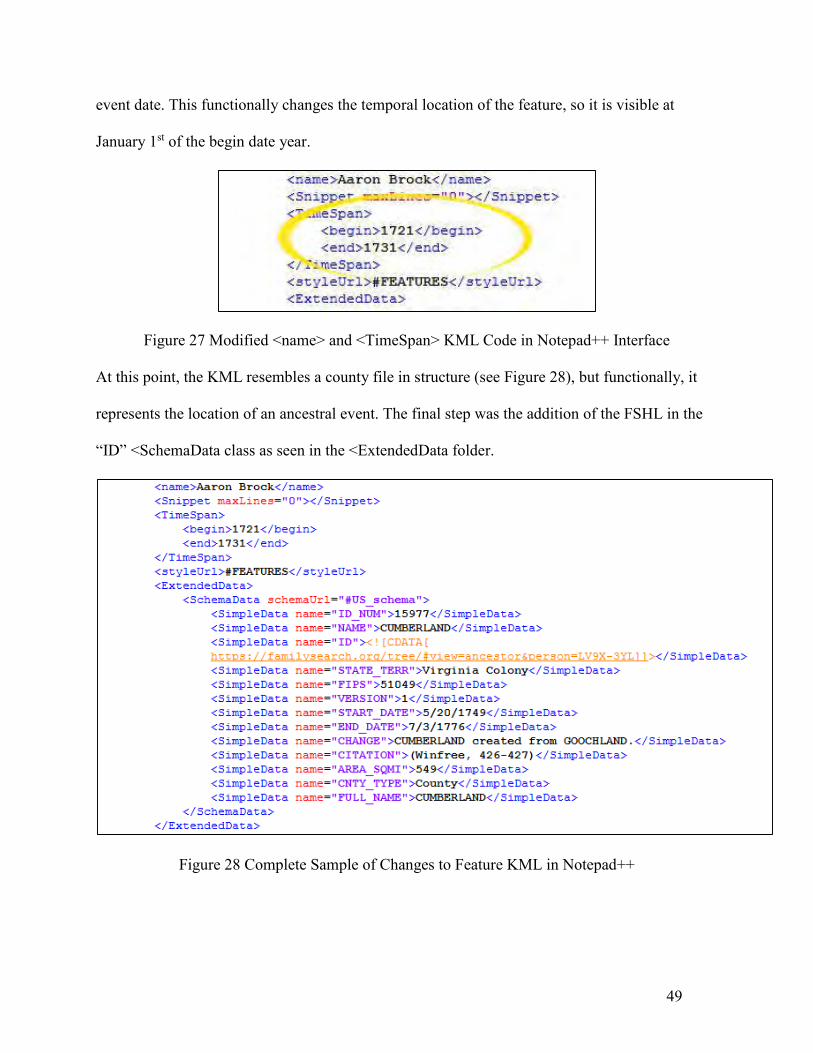
49
event date. This functionally changes the temporal location of the feature, so it is visible at
January 1st of the begin date year.
Figure 27 Modified <name> and <TimeSpan> KML Code in Notepad++ Interface
At this point, the KML resembles a county file in structure (see Figure 28), but functionally, it
represents the location of an ancestral event. The final step was the addition of the FSHL in the
“ID” <SchemaData class as seen in the <ExtendedData folder.
Figure 28 Complete Sample of Changes to Feature KML in Notepad++

50
Once these changes have been affected, the KML is saved and entitled with the ancestors first
and last name, their lifespan in years, and the name of the event represented by the feature (see
Figure 29).
Figure 29 File Structure of KML in FamilEarth
After all the records from the reference document are represented by geometric features,
and those KML elements are saved in a folder, the developer opened all of the KML elements at
once in the Google Earth environment. At this point, the steps for saving the KML element were
repeated, except at this time all of the new elements were selected and saved into a single KML
file named for the entire family line.
3.4.3. Rules of FamilEarth feature ontology
KML county and state features were extracted based on their spatial and temporal
relevance to the FamilySearch record. Under ideal conditions, the record presented in
FamilySearch’s dataset registers perfectly with the historic county dataset’s timeline for its
corresponding county. In reality, as records extend beyond the 19th and into the 18th century, the
likelihood of encountering incongruent data increases.
It became more common, as the feature selection and KML refinement phases of
development progressed, to encounter individual records with an associated birth corresponding
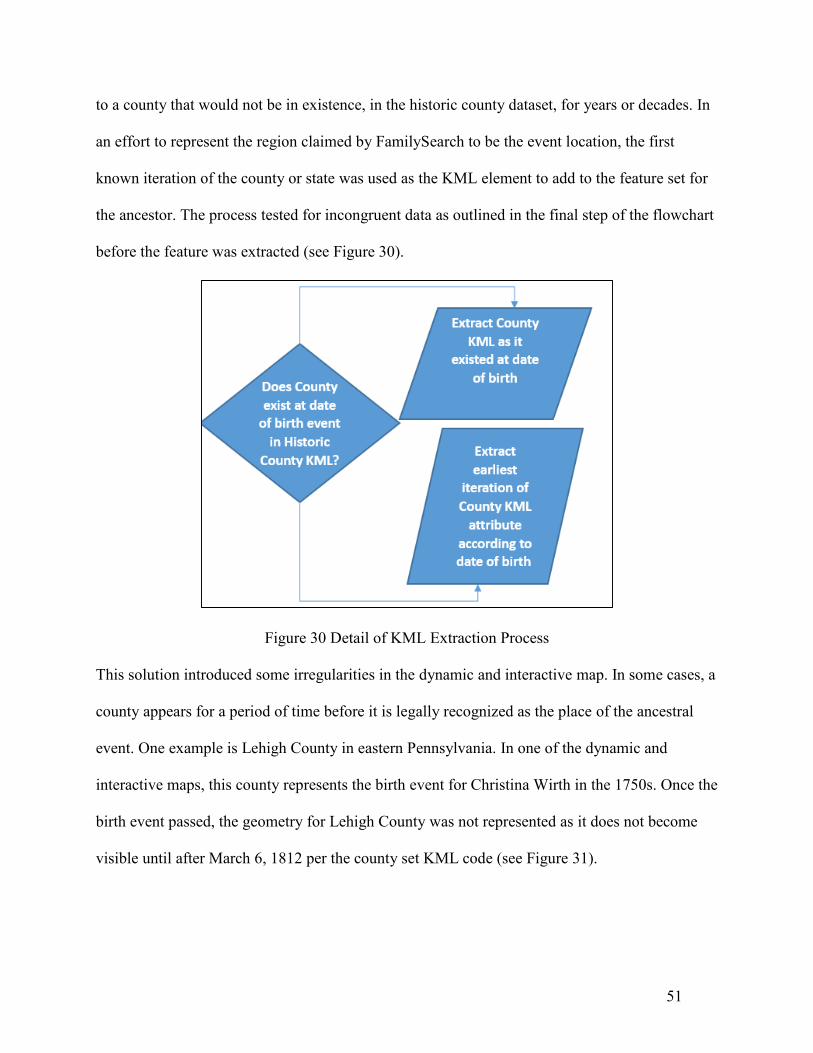
51
to a county that would not be in existence, in the historic county dataset, for years or decades. In
an effort to represent the region claimed by FamilySearch to be the event location, the first
known iteration of the county or state was used as the KML element to add to the feature set for
the ancestor. The process tested for incongruent data as outlined in the final step of the flowchart
before the feature was extracted (see Figure 30).
Figure 30 Detail of KML Extraction Process
This solution introduced some irregularities in the dynamic and interactive map. In some cases, a
county appears for a period of time before it is legally recognized as the place of the ancestral
event. One example is Lehigh County in eastern Pennsylvania. In one of the dynamic and
interactive maps, this county represents the birth event for Christina Wirth in the 1750s. Once the
birth event passed, the geometry for Lehigh County was not represented as it does not become
visible until after March 6, 1812 per the county set KML code (see Figure 31).
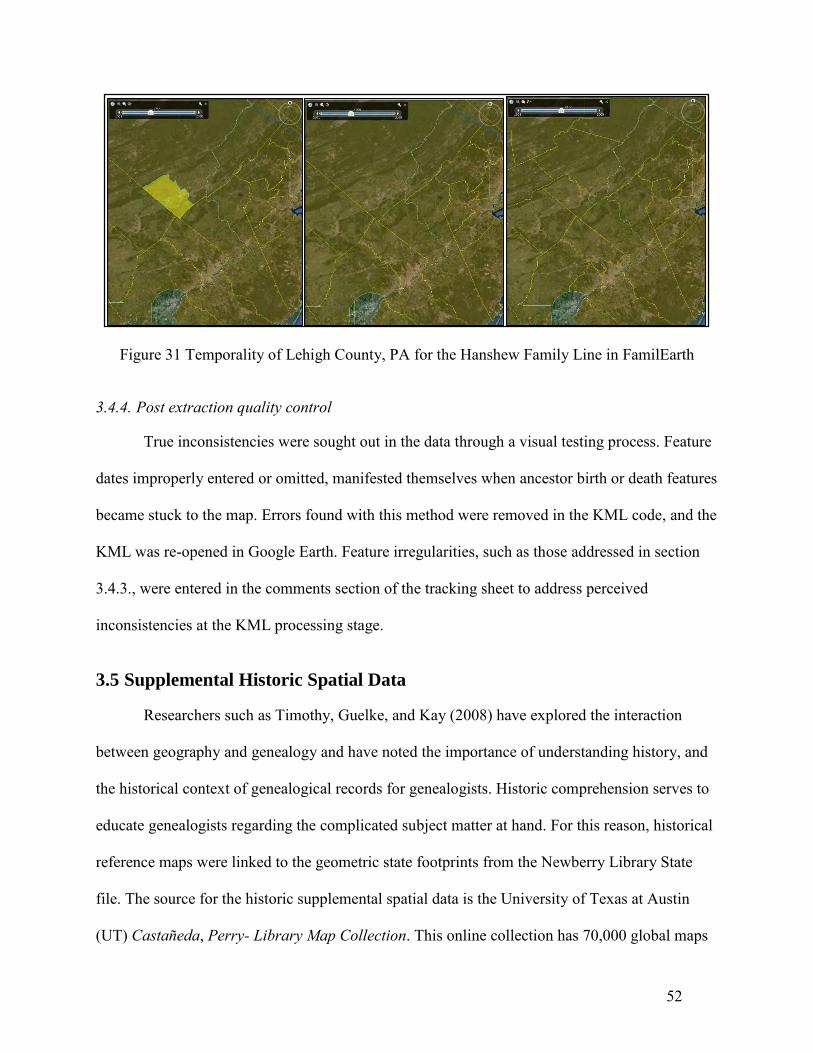
52
Figure 31 Temporality of Lehigh County, PA for the Hanshew Family Line in FamilEarth
3.4.4. Post extraction quality control
True inconsistencies were sought out in the data through a visual testing process. Feature
dates improperly entered or omitted, manifested themselves when ancestor birth or death features
became stuck to the map. Errors found with this method were removed in the KML code, and the
KML was re-opened in Google Earth. Feature irregularities, such as those addressed in section
3.4.3., were entered in the comments section of the tracking sheet to address perceived
inconsistencies at the KML processing stage.
3.5 Supplemental Historic Spatial Data
Researchers such as Timothy, Guelke, and Kay (2008) have explored the interaction
between geography and genealogy and have noted the importance of understanding history, and
the historical context of genealogical records for genealogists. Historic comprehension serves to
educate genealogists regarding the complicated subject matter at hand. For this reason, historical
reference maps were linked to the geometric state footprints from the Newberry Library State
file. The source for the historic supplemental spatial data is the University of Texas at Austin
(UT) Castañeda, Perry- Library Map Collection. This online collection has 70,000 global maps

53
including a series of historic national maps under the U.S. Territorial Growth section (University
of Texas Austin 2015). The territorial expansion maps are in Joint Photographic Experts Group
(jpg) format. Hyperlinks to the jpg extensions were added as a selectable attribute of the state
layer. This layer was added from the Newberry Library State file provide spatial context within
the FamilEarth environment.
Historic reference maps were applied to states that had not assumed their modern
geometric properties, as a way of providing additional historic context to the user. Information in
U.S. territorial growth maps annotates historical boundary features, such as the Proclamation
Line of 1763, the Erie Triangle, and the Louisiana Purchase (1803). Annotated dates are printed
with their associated borders when state or territory boundaries are established (see Figure 32).
For a complete list of all the U.S. Territorial Growth jpg maps hyperlinked to the KML state
features see Appendix B.
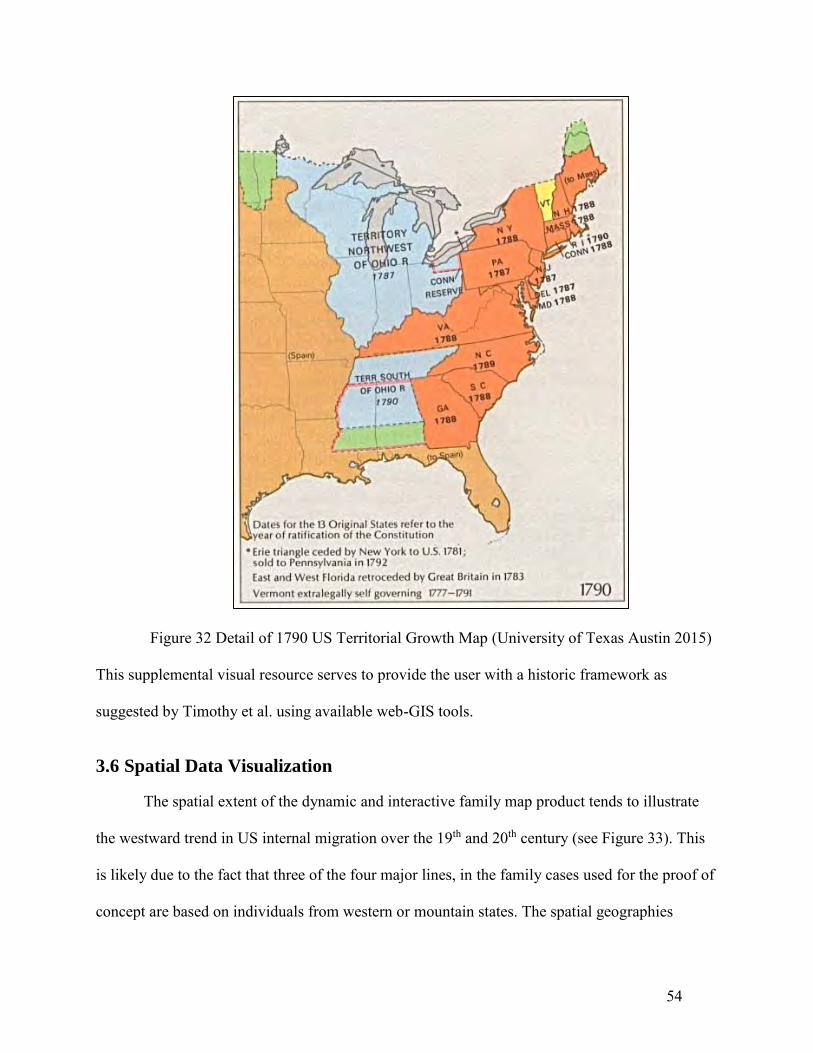
54
Figure 32 Detail of 1790 US Territorial Growth Map (University of Texas Austin 2015)
This supplemental visual resource serves to provide the user with a historic framework as
suggested by Timothy et al. using available web-GIS tools.
3.6 Spatial Data Visualization
The spatial extent of the dynamic and interactive family map product tends to illustrate
the westward trend in US internal migration over the 19th and 20th century (see Figure 33). This
is likely due to the fact that three of the four major lines, in the family cases used for the proof of
concept are based on individuals from western or mountain states. The spatial geographies
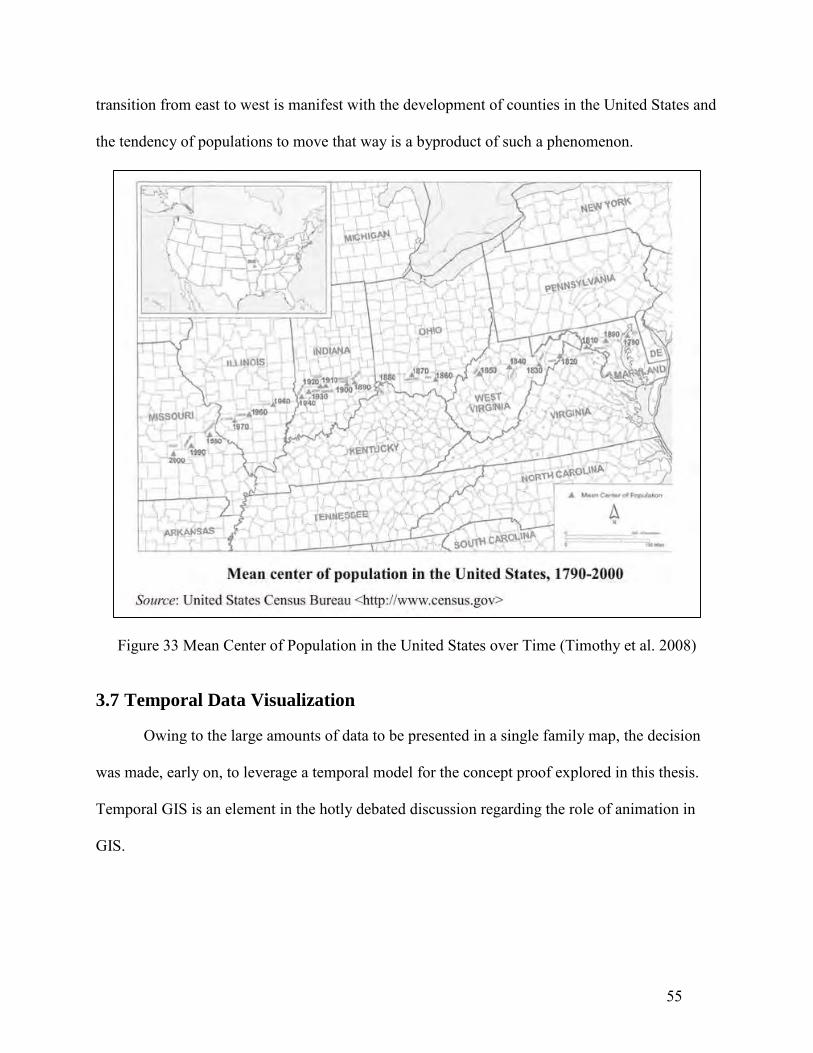
55
transition from east to west is manifest with the development of counties in the United States and
the tendency of populations to move that way is a byproduct of such a phenomenon.
Figure 33 Mean Center of Population in the United States over Time (Timothy et al. 2008)
3.7 Temporal Data Visualization
Owing to the large amounts of data to be presented in a single family map, the decision
was made, early on, to leverage a temporal model for the concept proof explored in this thesis.
Temporal GIS is an element in the hotly debated discussion regarding the role of animation in
GIS.

56
The dynamic elements of this study’s interactive GIS map required both temporal, and
non-temporal animation. Temporal animation is the dynamic depiction of changing events in
chronological order (Fabrikant et al. 2008).
This definition applies to the extracted features representing the location of birth and
death events in family history. The dynamic infrastructure was set by the historic county and
state datasets. While temporal animation represents time passing in our environment, non-
temporal animation depicts attribute changes, or changes to the subject vantage, not related to the
passing of time (Fabrikant et al. 2008). The fly-through functionality built in the Google Earth
interface, that enables the user to transition to selected features, like individual ancestor’s birth or
death location and the historical context of their surrounding geographies, qualifies as non-
temporal animation.
Critics of geospatial animation cite Lowe’s (2008) impact study that evaluates
animation’s potential as a learning tool (Fabrikant et al. 2008). Lowe illustrates animations two-
fold dilemma; to over-stimulate the user, also referred to as split attention (Anderson 2015) while
depriving them of the active learning experience, through passive observations (Lowe 2008)
In an effort to avoid the pitfalls of overloading the user with information, while
constraining their active learning experience, active user controls were employed to enrich the
user’s experience. Lowe emphasizes a judicious approach to the application of user controls to
avoid inappropriate and unproductive user interaction with the map. As Lowe explains it, user
controls may be effective if the control element matches the user’s background and skill with
regard to the controls offered (Lowe 2008). For this reason dynamic, but un-familiar mapping
applications such as the SQL interface in Carto DB were rejected and the Google Earth temporal
57
time scale bar was selected for development in FamilEarth because of its relatively intuitive pull
and drag function.
Lowe warns that user control loses its effective learning advantage when the animated
tools over-reach in subject matter complexity, beyond the users interest or capacity (Lowe 2008).
With this in mind, invitations to test the product were sent out to first, second, and third degree
relatives as defined by Blue Cross Blue Shield of Tennessee (2015), who have a general interest
in their ancestors and know of at least one person in the family engaged in family history
research, satisfying the first two tiers of genealogical interest as defined by Genealogy In Time
Magazine (see Figure 1). This ensured the user audience would be composed of an engaged
audience that would not be overwhelmed by the animated content.
3.7.1. Visual emphasis of data
With the county and state geometries consolidated in a single KML file and named for
the family line extracted, the file was opened and made visible in the table of contents section of
the Google Earth interface. At this point, the data was standardized according to a style sheet
developed to dictate the line and fill properties so that the features would have appropriate visual
weight (see Appendix C). Event features for births and deaths were coded yellow at 50% opacity
with a bright blue outline.
By rule, each event represented by an ancestor’s state our county feature was given a
temporal weight of ten years so the associated feature would stay visible for a sufficient time
period to catch the user’s attention as they employ the temporal controls. State and Territory data
was added and calibrated in the KML code to leave a state footprint any time the time controls
are set beyond the date at which an event occurs or a state footprint appears. The state feature
was designed to remain, as the time scale control moves beyond the ten year temporal period for

58
the event, so users could track where their family has been by state even if events in that state
had stopped occurring. The state footprint was coded to be filled in burnt orange and outlined
with dark blue. The state feature is filled with an opacity of 35% subduing it relative to the
brighter features that represent events (see Appendix C).
Finally, the county change KML was added to the Google Earth interface. The feature fill
properties remained hollow, and the line properties were drastically subdued to 15% transparent.
This feature functions as a visual reference, allowing the user to see the development of counties
around their family event locations, but it was subdued so it would not carry the same visual
weight as the event feature KML.
The color schema and style guide was developed for aesthetic affect and visual impact.
The final mapping product was saved in a KML package that could be opened by the user in a
single command function. The final map is, in fact, a collection of several hundred maps that the
user can view as a moving picture (classic, temporal animation) or step through a single feature
at a time to view each era as one atlas in a treasury collection designed around their family
history (see Appendix D).
3.8 Map User Participants
The crux of this study is the evaluation of the electronic map to test its efficacy to illustrate a
more complete picture of the map user’s family history, with regard to its ability to process
genealogical volume, data quality, cartography, and history. The evaluation in this process was
carried out through the dissemination of the electronic GIS application to interested parties and
an evaluation of their responses through an online survey.

59
3.8.1. Potential user pool
The data domain for the genealogically infused GIS application was set by the
developer’s access to FamilySearch.org. Registered FamilySearch users have access to their
own, and if they are married, to their spouses lineage. This access enabled the development of
four mapping products based on the developer’s natural parents and in-laws by marriage.
Given the user data available, the potential user population consisted of 1st degree
relatives or “parents, full siblings, or children,” 2nd degree relatives defined as “grandparents,
grandchildren, aunts, uncles, nephews, nieces or half-siblings,” and 3rd degree relatives,
including “first-cousins, great-grandparents or great-grandchildren,” (Blue Cross Blue Shield of
Tennessee 2015) Each relative was included if they are older than 18 and related by birth or
marriage.
3.8.2. Genealogical Interest and experience
The potential user pool was made up of 45 individuals from the Hanshew, Harmon,
Patrick, and Ray family lines. They represent a diverse background in genealogic interest. Less
than nine percent of the pool self-identified as members of the innermost level of genealogy
interest, having participated in ancestral research (see Figure 1). As a group, they have logged
more than 500 hours of ancestral research (according to candid answers from email inquiry).
3.8.3. Geospatial interest and experience
User experience with geospatial applications was not assessed prior to the map test or
survey evaluation. It was assumed that a majority of the individuals invited to participate had a
reasonable exposure to common online mapping applications such as Google Maps, and GPS-
enabled phones for turn by turn directions, and no further experience would be required. In

60
hindsight, some of the issues users encountered, in the course of their interaction with the family
map, may have been better understood if the developer had enquired regarding this subject.
In an effort to accurately gauge the users experience and consolidate feedback for this
report, and possible future development regarding the application, a survey was developed using
the survey web-hosting service surveymonkey.com. The survey was created to assess the user’s
functional experience with regard to map features and the learning experience gleaned by the end
user with some questions to test relevant spatiotemporal information regarding their ancestors.
3.9 User Experience Survey
The survey was composed of 10 questions. The first two questions were concerned with
the program’s impact on the users understanding and interest regarding the temporal ontology of
their ancestral record. The next two questions address the user’s spatial understanding and
interest after their interaction with the map application. Question 5 gauged the impact of
FamilEarth on the users spatial interest regarding locations associated with their ancestral record.
Question 6 asked how likely the user would be to travel to ancestral locations. Question 7 asked
the user to apply their visual experience in FamilEarth to assign a region from which most of
their ancestors were from. The follow-up question (Question 8) asked if their result in the
previous question surprised to the user. Question 9 asked the participants to identify the place of
birth for their mother’s paternal grandfather. Question 10 asked users to suggest features that
were not included in FamilEarth that they would like to see in future versions of similar
applications.

61
Chapter 4 Results
With the GIS and genealogy data integrated, and the application developed, potential
users were recruited to test and evaluate the dynamic and interactive map. Users were provided
technical instructions via web-cast to guide them through the process of downloading and
opening the mapping program. The program was designed to be engaging and visually
stimulating, applying user control and visualization techniques suggested by industry experts
such as Fabrikant et al. (2008), and Lowe (2008). Users who tested the program were invited to
take part in the survey described in Chapter 3. Survey outcomes indicated users experienced
increases in both knowledge and interest regarding their family history subjects. Reaction to the
web-enabled features was less impressive and most participants who filled out the survey
expressed a desire to see data links associated with their particular family history interests.
Altogether, FamilEarth succeeds as a program that connects the user with their ancestor’s spatial
experience.
4.1 Map Users and Participation
Two requirements were necessary to access FamilEarth. First, the user needed to operate
on a desktop or laptop environment. Second, the user had to have the Google Earth application
downloaded on their machine. Familearth was distributed to potential test candidates who met, or
could, by downloading the free Google Earth application, meet these requirements and their
experience was gauged with regard to the user’s family history knowledge and interest after
using FamilEarth.

62
4.1.1. The functional map
With the application downloaded on the user’s machine, they have access to FamilEarth.
The program is initiated when the user opens the family KML appropriate to their lineage within
the Google Earth application or by accessing the KML from the windows explorer environment,
by which action, Google Earth is opened. Once the data is loaded, it becomes visible in the table
of contents, then the timebar becomes operable, and the program is ready to function (see Figure
34).
Figure 34 FamilEarth Initial View
4.1.2. Navigating the data in the table of contents
There are three key data navigation elements in the user interface: the main viewer
window, the table of contents and the timebar (see Figure 35). The table of contents enables the
user to see which ancestors are in the map by expanding the Family folder. Users searched
records in the table of contents by selecting the record entitled for an ancestor name and
associated event (birth or death) and double clicking on the feature in the table of contents.

63
Figure 35 Table of Contents and Timebar
The click event triggers a simultaneous temporal transition and non-temporal animation.
The temporal transition automatically adjusts the time bar and moves both control tabs to register
to the event ten year buffer described in Chapter 3. The parallel, non-temporal animation changes
the camera view with a fly-over event. The sequence stops centered on the selected features
spatial extent.
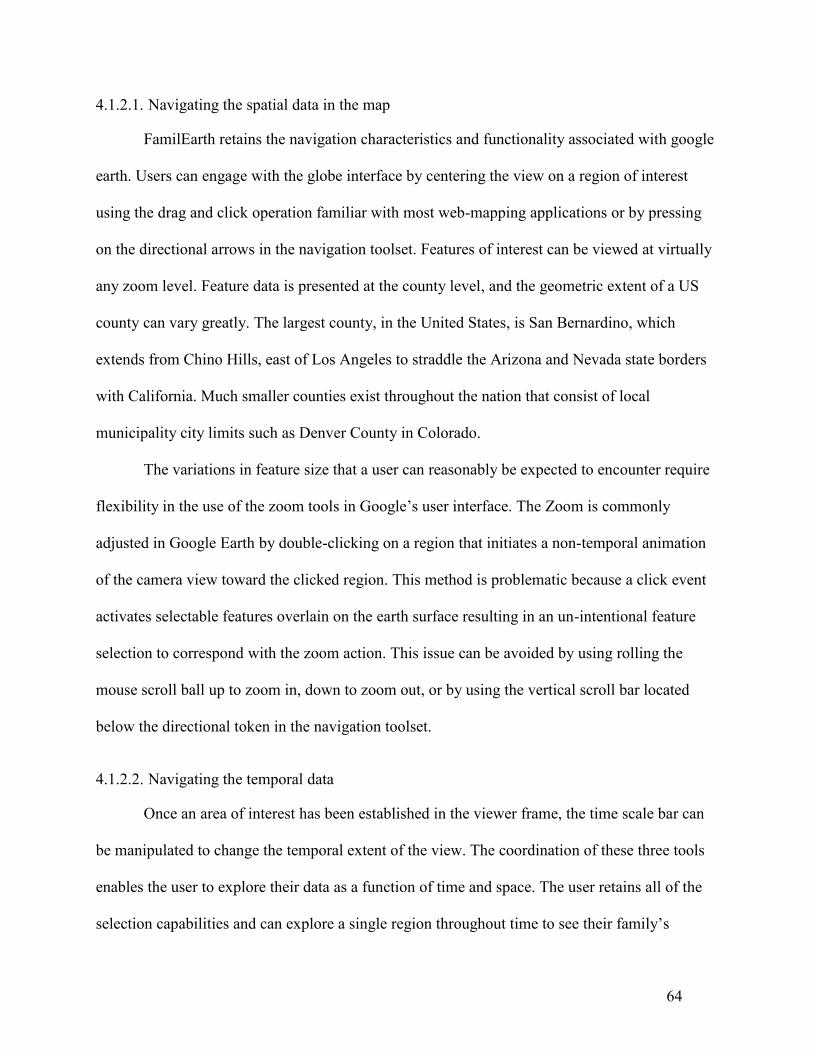
64
4.1.2.1. Navigating the spatial data in the map
FamilEarth retains the navigation characteristics and functionality associated with google
earth. Users can engage with the globe interface by centering the view on a region of interest
using the drag and click operation familiar with most web-mapping applications or by pressing
on the directional arrows in the navigation toolset. Features of interest can be viewed at virtually
any zoom level. Feature data is presented at the county level, and the geometric extent of a US
county can vary greatly. The largest county, in the United States, is San Bernardino, which
extends from Chino Hills, east of Los Angeles to straddle the Arizona and Nevada state borders
with California. Much smaller counties exist throughout the nation that consist of local
municipality city limits such as Denver County in Colorado.
The variations in feature size that a user can reasonably be expected to encounter require
flexibility in the use of the zoom tools in Google’s user interface. The Zoom is commonly
adjusted in Google Earth by double-clicking on a region that initiates a non-temporal animation
of the camera view toward the clicked region. This method is problematic because a click event
activates selectable features overlain on the earth surface resulting in an un-intentional feature
selection to correspond with the zoom action. This issue can be avoided by using rolling the
mouse scroll ball up to zoom in, down to zoom out, or by using the vertical scroll bar located
below the directional token in the navigation toolset.
4.1.2.2. Navigating the temporal data
Once an area of interest has been established in the viewer frame, the time scale bar can
be manipulated to change the temporal extent of the view. The coordination of these three tools
enables the user to explore their data as a function of time and space. The user retains all of the
selection capabilities and can explore a single region throughout time to see their family’s
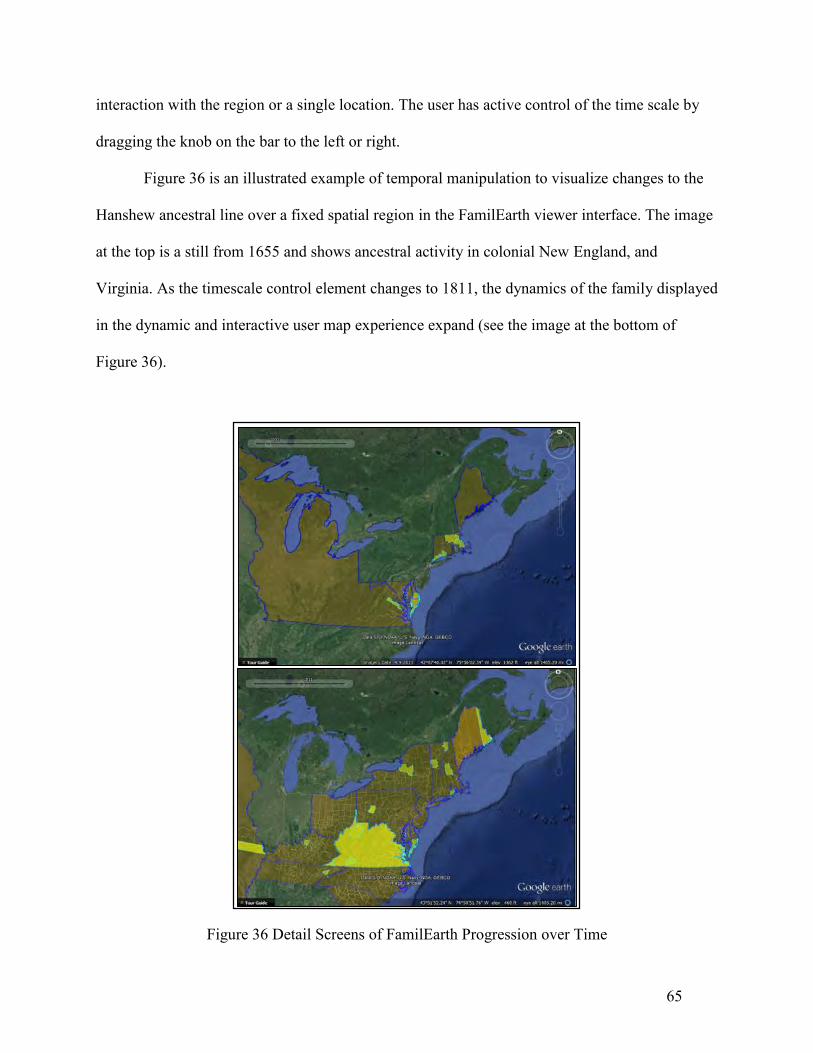
65
interaction with the region or a single location. The user has active control of the time scale by
dragging the knob on the bar to the left or right.
Figure 36 is an illustrated example of temporal manipulation to visualize changes to the
Hanshew ancestral line over a fixed spatial region in the FamilEarth viewer interface. The image
at the top is a still from 1655 and shows ancestral activity in colonial New England, and
Virginia. As the timescale control element changes to 1811, the dynamics of the family displayed
in the dynamic and interactive user map experience expand (see the image at the bottom of
Figure 36).
Figure 36 Detail Screens of FamilEarth Progression over Time
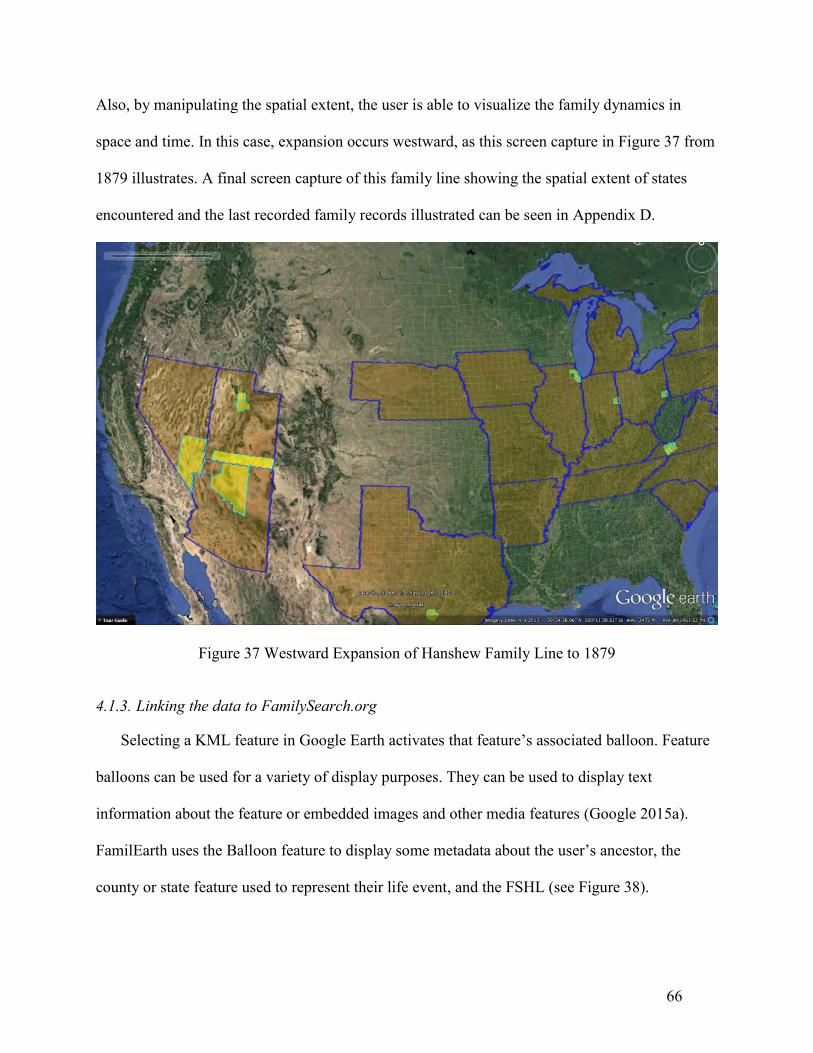
66
Also, by manipulating the spatial extent, the user is able to visualize the family dynamics in
space and time. In this case, expansion occurs westward, as this screen capture in Figure 37 from
1879 illustrates. A final screen capture of this family line showing the spatial extent of states
encountered and the last recorded family records illustrated can be seen in Appendix D.
Figure 37 Westward Expansion of Hanshew Family Line to 1879
4.1.3. Linking the data to FamilySearch.org
Selecting a KML feature in Google Earth activates that feature’s associated balloon. Feature
balloons can be used for a variety of display purposes. They can be used to display text
information about the feature or embedded images and other media features (Google 2015a).
FamilEarth uses the Balloon feature to display some metadata about the user’s ancestor, the
county or state feature used to represent their life event, and the FSHL (see Figure 38).
67
Figure 38 Weber Metadata Detail
The FSHL is the electronic link to FamilySearch’s data regarding the ancestor represented in
the feature balloon. By selecting the link, the user is redirected to the FamilySearch.org login
page (see Figure 39). This enables the FamilEarth user with access to FamilySearch as long as
they have a valid username and password.
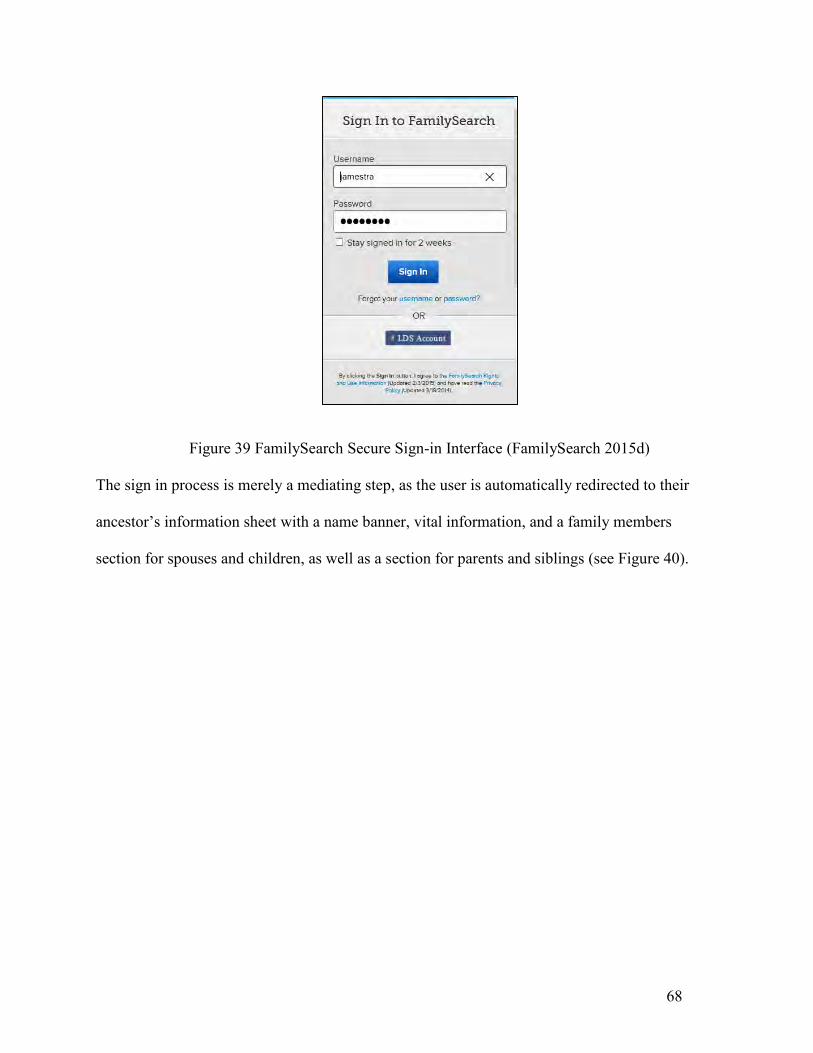
68
Figure 39 FamilySearch Secure Sign-in Interface (FamilySearch 2015d)
The sign in process is merely a mediating step, as the user is automatically redirected to their
ancestor’s information sheet with a name banner, vital information, and a family members
section for spouses and children, as well as a section for parents and siblings (see Figure 40).
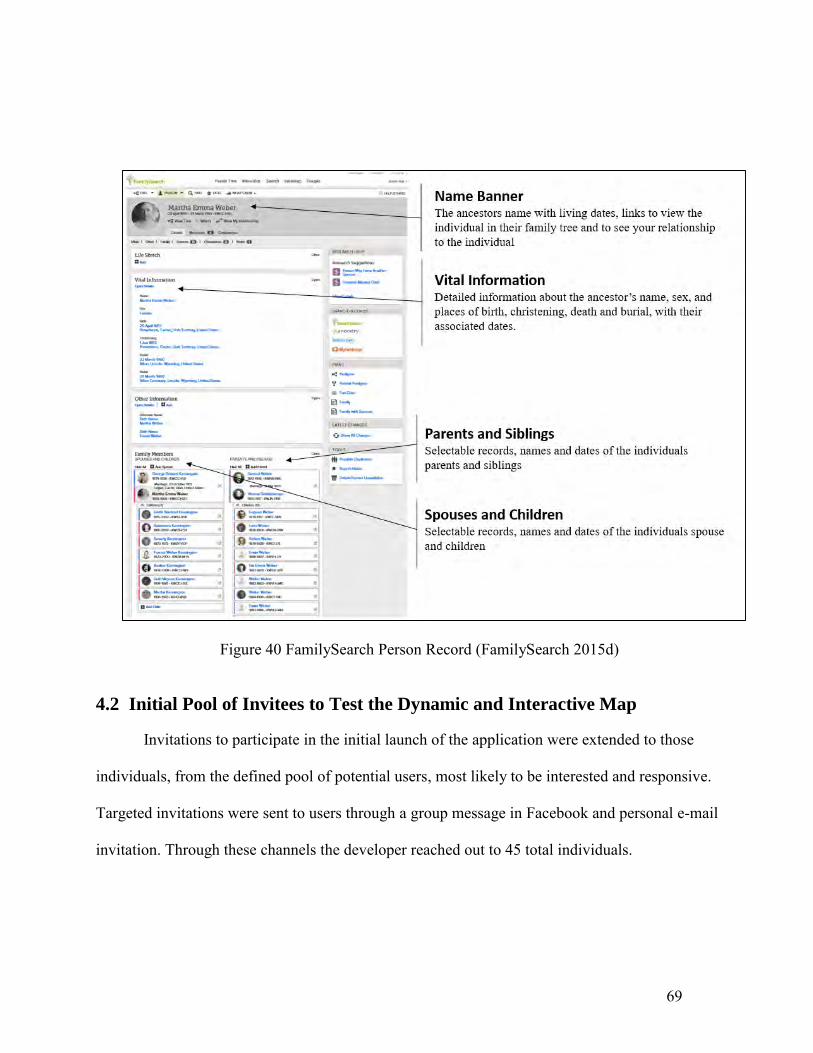
69
Figure 40 FamilySearch Person Record (FamilySearch 2015d)
4.2 Initial Pool of Invitees to Test the Dynamic and Interactive Map
Invitations to participate in the initial launch of the application were extended to those
individuals, from the defined pool of potential users, most likely to be interested and responsive.
Targeted invitations were sent to users through a group message in Facebook and personal e-mail
invitation. Through these channels the developer reached out to 45 total individuals.
70
4.2.1. Invitees response
Of those initial 45 invitees, 18 individuals responded requesting to participate in the
study. Working in coordination with the University of Southern California’s Institutional Review
Board (IRB), the volunteers were notified of the purpose of the application test and survey
evaluation. Those who wished to continue with the process provided the developer with contact
information and were sent the KML file, relevant to their family line, and given downloading
instructions in brief webcasts prepared for the users.
4.2.1.1. Technical support
It was assumed that most of the users would be comfortable with the Google mapping
technology offered because a majority of them likely would have been exposed to Google
mapping tools. Exposure to Google Maps is quite common. The 2014 US Mobile App Report
recorded that Google Maps logged 64.5M users. (US Mobile App Report 2014). Also, an
October 2014 report indicates Google Maps enjoyed a 44.5% market share for the smartphone
app in 2014 (Lella 2014).
Even with this assumption, some user guidance was provided in a webcast recorded using
the digital recording program Jing, developed by TechSmith. Two webcasts were designed and
distributed. The screencasts were brief, between one and four minutes and provided the user with
guidance for anticipated technical issues. The first screencast served to guide the user with
download instructions regarding the stand-alone Google Earth application. These instructions
included the process for licensing and activating the application and launching it from the
desktop. The first screencast continued to demonstrate how the files would be sent through
Google drive (although it gave them the option to contact the developer if they preferred an
alternative file sharing method), and how to download the files from the file sharing service.

71
Instructions for accessing compressed files were provided in the screencast and the instructional
video concluded with a demonstration of the KML opening in Google Earth. The URLs to the
web-casts are available in Appendix E.
The second screencast demonstrated the most effective data exploration methods offered
by the application, as described in sections 4.1.2.1 and 4.1.2.2, in an effort to prepare the user for
their initial experience testing the application. The screencast concluded by inviting the user to
contact the developer with questions they may have. Beyond the initial support provided by the
instructional screencasts, additional support was provided on a case by case basis.
4.2.1.2. Technical issues
Throughout the invitation, distribution, and testing phases, invitees, and testing agents
experienced several challenges. Some of those challenges were expected, and mitigated, by the
technical support provided. But other challenges were not as effectively anticipated. These
challenges ranged from operating system incompatibility with Google Earth to user inexperience
with Google Drive, and other file sharing technologies. Because technical issues were anticipated
prior to the program launch, communication was maintained with the users by including contact
information with the notification email, and through group chats on Facebook.
Several users reported the application crashed in the Apple OS environment due to
incompatibility with the operating system. A phone conversation with an Apple OS X user
illustrated successful download and launch in the Apple version of Google Earth. With the
program running, the user could access ancestral information from the table of contents, but the
program crashed when the user attempted to open feature balloons from the map interface. This
crash error, involving the Apple Operating System (OS) (the exact version of OS is unknown),
was reported independently by a different user in the Facebook discussion group.

72
Other users were inexperienced with the practice of sharing large files over the cloud. This
resulted with issues downloading the application’s files. Attempts to encourage the users to use
alternatives to Google drive proved confusing for the potential user pool. The developer
contacted individuals who reported issues receiving the downloaded KML directly and obtained
permission by the user to access their machine remotely with TeamViewer, and the KML was
downloaded using the developer’s Gmail account.
Issues with the table of content feature in the program came to light during the survey
analysis. In the suggestion bloc, one participant asked “How to find the names list[?] [M]ine
disappeared.” This could have resulted from the OS bug (the developer was unaware of the
operating system used by this particular user), or the user could have inadvertently hidden their
table of contents tab by clicking the places tab that functions in Google’s user interface to hide
toolbar elements, such as the table of contents (see Figure 41). Proper interaction with Google’s
user interface and table of contents were not included in the instructions for the user in the
guidance webcasts provided during the deployment of the project.
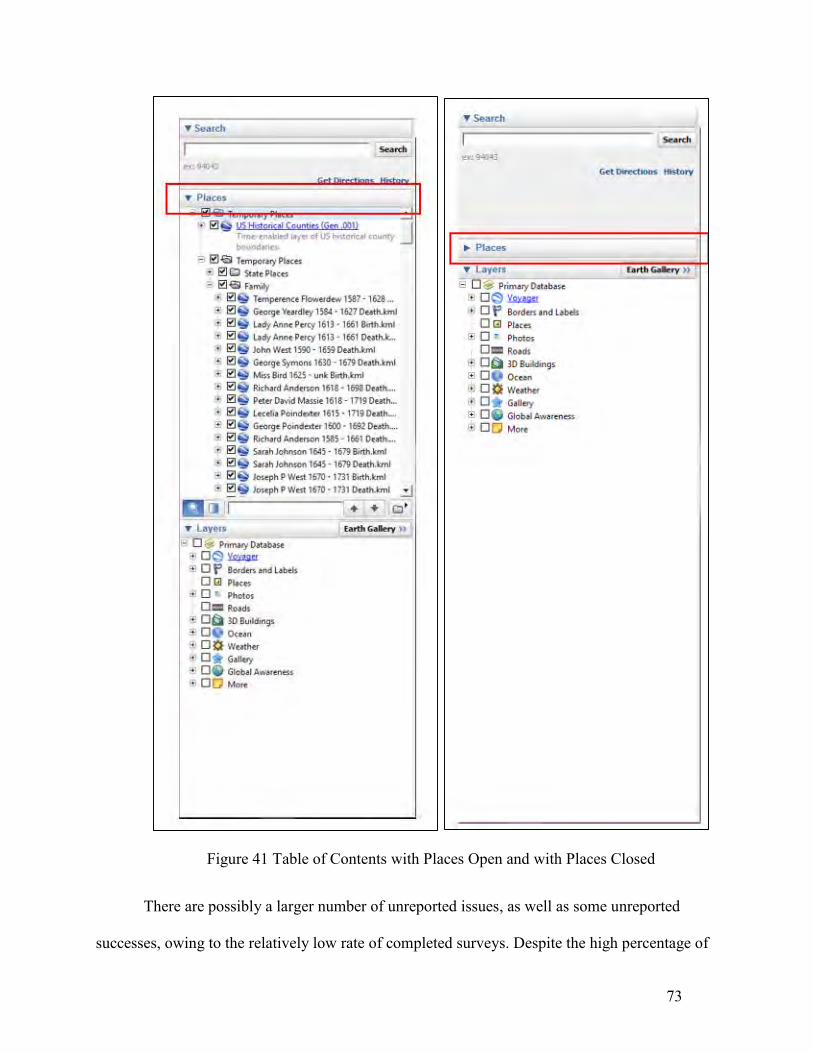
73
Figure 41 Table of Contents with Places Open and with Places Closed
There are possibly a larger number of unreported issues, as well as some unreported
successes, owing to the relatively low rate of completed surveys. Despite the high percentage of

74
individuals from the pool of invitees who expressed interest in testing the software, a relatively
small percentage returned to take the survey. It is possible that some individuals who
successfully used the program were unable to partake in the survey, but it also suggests that
some who attempted, were hampered by issues that were not reported to the developer.
4.2.2. Survey results
Individuals from the Patrick, Ray, Harmon, and Hanshew family lines, invited to
participate, returned the survey at a rate of 33.3%. The survey was composed of 10 questions.
The first two questions were concerned with the program’s impact on the users understanding
and interest of the temporal ontology of their ancestral record. Both questions were answered by
100 percent of respondents and recorded an average score of 3.67 out of 4.00.
The next two questions address the user’s spatial understanding and interest after their
map application experience. Both questions were answered by all participants. The first question
regarding user spatial understanding recorded an average score of 3.83 out of 4.00 while the
question regarding their interest averaged 3.67, consistent with the averages recorded regarding
temporal ontological understanding and interest.
Question 5 gauged the impact of FamilEarth on the users spatial interest regarding
locations associated with their ancestral record. One hundred percent of respondents reported
they learned of connections to states, or counties, that they were unaware of, prior to using
FamilEarth. The sixth question asked how likely the user would be to tour the associated
ancestral locations, and it returned an average rating of 3.00 out of 4.00. This result was evenly
fractured into thirds, with a third of respondents reporting unlikely, a third reporting likely, and
the final third reporting very likely to visit ancestral locations.

75
Question 7 asked the user to apply their visual experience in FamilEarth to assign a
region from which most of their ancestors originated. The follow-up question (Question 8) asked
if their result in the previous answer was a surprise. All participants answered the questions, but
only one respondent (16.67 % of the field) reported their perceived answer a surprise.
Question 9 asked the participants to identify the place of birth for their mother’s paternal
grandfather. All participants self-reported their ability to perform this identification exercise.
Question 10 asked users to suggest features that were not included in FamilEarth that they would
like to see in future versions of similar applications. Fifty percent of the participants had
suggestions, reflecting each individual’s experiences and interests.
One user suggested an easier downloading experience and one requested access through a
mobile version. This reflects the reported technical and access issues encountered in the course
of the study. Some users also had suggestions that reflect their particular interests. One user
requested access to images (pictures, paintings, drawings) of places from the time period where
their ancestor’s lived. One user requested links to famous people from their ancestral eras and
locations. Another requested links to regional and historic recipes associated with their ancestors.
These requests and suggestions reflect the various interests and motives of the user community
involved in this study.
4.2.3. Improvements suggested by the survey results
Many proofs of concepts and beta testing ventures encounter issues and struggles as part
of the process. One of the prominent issues at hand in this thesis evaluation was the limited
number of eligible participation candidates. Because the potential user pool was limited to four
family lines, the percentage of invitees that were unable to participate due to outside influences
or technical issues created a situation where the fraction of users who were able to progress from
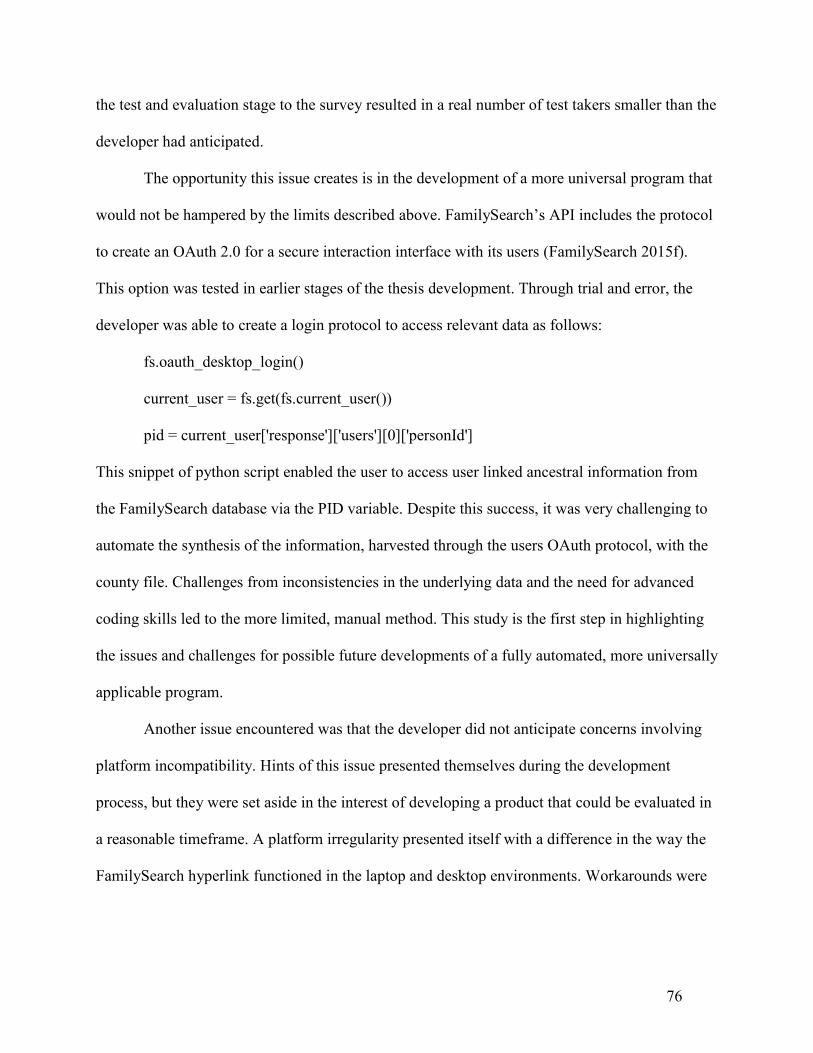
76
the test and evaluation stage to the survey resulted in a real number of test takers smaller than the
developer had anticipated.
The opportunity this issue creates is in the development of a more universal program that
would not be hampered by the limits described above. FamilySearch’s API includes the protocol
to create an OAuth 2.0 for a secure interaction interface with its users (FamilySearch 2015f).
This option was tested in earlier stages of the thesis development. Through trial and error, the
developer was able to create a login protocol to access relevant data as follows:
fs.oauth_desktop_login()
current_user = fs.get(fs.current_user())
pid = current_user['response']['users'][0]['personId']
This snippet of python script enabled the user to access user linked ancestral information from
the FamilySearch database via the PID variable. Despite this success, it was very challenging to
automate the synthesis of the information, harvested through the users OAuth protocol, with the
county file. Challenges from inconsistencies in the underlying data and the need for advanced
coding skills led to the more limited, manual method. This study is the first step in highlighting
the issues and challenges for possible future developments of a fully automated, more universally
applicable program.
Another issue encountered was that the developer did not anticipate concerns involving
platform incompatibility. Hints of this issue presented themselves during the development
process, but they were set aside in the interest of developing a product that could be evaluated in
a reasonable timeframe. A platform irregularity presented itself with a difference in the way the
FamilySearch hyperlink functioned in the laptop and desktop environments. Workarounds were

77
developed as a consequence of the irregularity, but no further testing was performed to find
potential platform differences between operating systems.
4.2.4. Result successes
Even with the challenges encountered, the test, and evaluation process yielded important
results. Survey feedback indicated that a user’s experience with FamilEarth increased the historic
and spatial understanding of their family’s history. Significant enhancement in understanding
was evident, with 83% of respondents reporting strong agreement with the statement that
FamilEarth increased their understanding of where their ancestors lived.
FamilEarth also served to enhance participant’s interest with regard to the user’s ancestral
places of origin. The survey indicated that 66 % of individuals who participated, strongly agreed
that the dynamic and interactive map increased their interest in the places their ancestors were
from. Participants who filled out the survey reported universally that they learned of connections
to states or counties that they were unaware of prior to using FamilEarth. When asked in the
survey if the participant would be likely to travel to a location associated with their family
history, two-thirds of the respondents reported “likely” or “very likely”.
These positive data points, indicate that a dynamic and interactive family map, enabled
with GIS, can significantly enhance a family historians experience studying their family and
where ancestors were born and died in conjunction with the historical context. By connecting an
appropriate geospatial dataset that conveys a spatial reality, the ancestral subject is made aware
of his or her ancestor’s spatial experience.

78
The learning experience is enabled with positive control tools and judicious temporal and
non-temporal animation that enable the user with the ability to navigate the dataset without being
overwhelmed by its content. This study supports the possibility of appropriately applied, user
managed animation in a GIS interface that can be applied to future projects in genealogy and
beyond.

79
Chapter 5 Conclusion and Future Development
An individual’s genealogical record is the story of their ancestor’s unique and complex
interaction with history and geographic space. Understanding a subject’s spatial dimension
means thoroughly charting its features and mapping its multifaceted intricacies in a way that can
be interpreted by the interested party. This is true whether the interested party are geologists in
mines or genealogists in libraries. This thesis was borne out of the interest to develop a better
synthesis between GIS and genealogy, as a way to facilitate greater understanding of one’s
family history.
5.1 Motivation to Fuse Genealogy with GIS
GIS is a budding technology, and there are a myriad of practitioners from various
disciplines who could be advantaged by implementing elements of GIS to their arts and sciences.
The developer of this thesis applied GIS to a user pool within the genealogical community.
Genealogists and family history enthusiasts are subsets of a broader group of historians who
could likewise be benefited by the development of a dynamic and interactive user map with both
spatial and temporal dimensions.
5.1.1. Optimizing Leverage with GIS Tools for other Disciplines.
Jack Owens, of Idaho State University, has highlighted GIS as a technology that can
convey complex, multifaceted histories (2007). This thesis illustrates how GIS was employed
toward that end. By leveraging temporally registered polygonal county level data in the United
States (from early Territories and British American Colonies to present day boundaries) and
synthesizing those features with non-linear, complex data taken from a database of genealogical

80
records, GIS was used to distill a complex spatiotemporal, historical, and cultural amalgam into
an ordered, flowing, and user engaging map.
5.1.2. Delivering the Greatest Impact of GIS for a New-to-GIS User Community
The GIS-based interactive and dynamic map was made available to individuals who have
an interest in the practice of family history in an effort to illustrate the means by which the
system can be effectively used by those who are new or unfamiliar with geospatial technology
and tools. Genealogy has a broad base of interested practitioners who may find it advantageous
to us GIS in their pursuits.
Potential users of the technology, who may not be aware of its benefits, include
individuals who want to understand their socio-economic heritage, people who research the past
to understand their familial pedigree with regard to health and genetics, and genealogical
enthusiasts who derive satisfaction by solving the family history puzzle for themselves and
others.
5.2 The Dynamic and Interactive Family Map
The study was executed through the development and distribution of FamilEarth, a
dynamic and interactive mapping application that uses information extracted from the industry
trusted family history data source: FamilySearch. The program was customized for the relatives
of the four major family lines and distributed to relatives interested in using the dynamic and
interactive map as an application. Users who received the application were invited to participate
in a survey about their experience, and this survey’s results provided the developer with
feedback to understand the impact of the map with regard to the user’s family history knowledge.

81
5.2.1. Tools and Techniques
The dynamic and interactive mapping application FamilEarth was developed using
Google’s relatively familiar Google Earth interface, overlain by temporally controlled county
and state level polygons from the Newberry Library Historic Counties dataset to represent events
as recorded in the FamilySearch database, such as an individual’s birth or passing. FamilEarth
controlled the volume of information presented, at any given time, to users, to minimize spatial
overlaps in data and keep the user engaged with a combined sense of control and dynamism.
Data that was extracted from FamilySearch was linked back to the database with a hyperlink,
built into the Google interface using the data balloon feature to avail links and select metadata to
the user. These features were ordered and orchestrated to work within the dynamic and
interactive mapping application to create a positive user experience in GIS.
5.2.2. Regarding the Animation Debate
The role of animation in GIS has been debated in recent years by researchers, such as
Lowe (2008), Fabrikant et al.(2008), and Anderson (2015), who have investigated the role
animation can play to inform and educate in GIS and other presented mediums. The results of the
research are mixed but suggest animation may be effective if applied properly to the learner. By
carefully balancing the elements of control and dynamism, FamilEarth was able to test the
theories posited by Lowe (2008), and Fabrikant et al. (2008), in animation and learning. By
employing best practices, with regard to user engagement and user-defined interest, it was
possible to successfully employ GIS as an effective tool to present family history information in
a dynamic spatio-temporal interface.
82
5.2.3. Program Successes and Pitfalls
The program succeeded in its aim, to enhance the users experience with GIS as a tool for
visualization and broad spatial understanding. This success is evident in the survey results from
individuals who participated. The survey indicated increases in interest and understanding with
regard to where a user’s ancestors were from and when they lived. The program also succeeded
in educating the users regarding regions associated with their family history, of which they were
unaware prior to engaging FamilEarth.
One of the chief roles 3D GIS may play in the users experience is the powerful
visualization component inherent in the user interface. GIS researchers have noted that
visualization and aesthetics are crucial elements of any maps design (Buttenfield et al. 2001).
This was leveraged, to a degree, by customizing the KML features as outlined in the graphic
style guide developed and included in Appendix C.
One of the study weaknesses encountered was the small number of individuals who were
able to carry the study through the survey stage. The primary reason for the small sample size
was the access limits imposed regarding available data from the developer’s login in
FamilySearch. The initial volunteer pool of 48 was distracted and in some cases incapacitated in
their participation by technical issues and even an unforeseen death in the family that affected
two of the four family lines presented. A future study should include a broader participation base
of initial volunteers as a buffer against those issues encountered.
Broader participation would also provide the developer with feedback from a variety of
family spatiotemporal dynamics. The four family lines examined in this study indicate a
westward migration pattern consistent with administrative boundary expansion in the United
States. Another family, from a broader user base, might be able to visualize different
spatiotemporal dynamics depending on the ethnic and cultural forces imposed on the user’s
83
ancestral background. For example, African American family lines would have seen a
predominantly Northward migration in the years following the Civil War, rather than the
Westward migration pattern seen in this study.
However, it is also important to point out that further testing with family lines that
contain a variety of ethnic groups might also reveal limitations in obtaining complete or accurate
data. Even within these four relatively well-understood family lines, geometric topological
challenges forced the developer to omit event data when a birth or death record is associated,
spatially with the United States of America or USA, but not associated with a County or State. In
this study, this situation was present in one family line. The Harmon line includes a record for
Mrs. Katherine Howard (FSID: 29YB-MM1) with a recorded death location of “United States.”
This particular record would not have been included because the date for the death event was
omitted in FamilySearch. However, had a date been included in the record, the feature geometry
would have been excluded because its visualization would have required a polygon
representation in the dataset for the complete administrative boundary for the United States of
America. More precisely, it would require a polygon representing the boundaries of the United
States of America at the time the event was recorded to have happened. In the case of Mrs.
Katherine Howard, who was born in 1730, had her record included a death date, and had that
death date occurred in the late 18th or early 19th centuries, then the representative polygon should
be a conglomerate of all the United States’ combined State features at that time, dissolved into a
single geometric feature.
5.3 Potential for Further Development
The initial development and distribution of the dynamic and interactive family history
map FamilEarth, as outlined in this thesis, suggests further developments may be warranted in

84
terms of GIS services to be developed on a larger scale. This development is based on the
potential for this application to be automated and distributed to a user community that could be
served from the application’s potential to educate.
5.3.1. Potential to Automate
Several hours were devoted early on in the process, to automate the extraction and
display parameters based on a user’s FamilySearch login. This was accomplished with the
assistance of Michael Clark, at the time, a doctoral candidate at the Air Force Institute of
Technology (AFIT) in software design, who collaborated with the developer to create a python
script to automate the extraction process. The script was developed using Python 2.7 and the
FamilySearch Python SDK developed by GitHub user elderamevans (Evans, 2015).
This program successfully integrated user data based on an OAuth 2.0 script introduced
above in Section 4.3.4. This code served to connect the user to available data on FamilySearch
via the user’s login. Information was extracted regarding ancestor names, events, and places
based on the user login. That extraction was accomplished using a ‘for’ loop conditioned on
whether a birthplace or a deathplace was known, and a birthdate, or a death date recorded. The
loop exploited the FamilySearch API structure for family data (fam_data) as follows:
for i in range(len(fam_data['response']['persons'])):
display = fam_data['response']['persons'][i]['display']
This segment of code delved into fam_data (a variable based an extensive database query for
detailed information regarding an individual’s ancestors, based on the user ID provided) to count
the [‘display’] element for the data evaluation regarding birth and death events. This was done by
testing the condition with an ‘if’ statement that discarded records without appropriate event
dates.

85
This process was followed up with evaluations on the place names to ensure they could
be read by FamilySearch (when places are manually entered they may not be standardized), and
so the different place elements could be categorized, as exemplified in Figure 42.
Figure 42 Description of Administrative Place Name Type for Python Script
The second step was to separate the place name elements to process records in the python code.
Acceptable records could take one of three forms:
[1] city, county, state
[2] county, state
[3] state (although this condition was not tested in the coding process)
Once the location features were processed, they were merged with the name and date records in
the format: name, county, state, and date into a coma separated value file (CSV) (see Appendix
F).
The process developed in the Python script proved that automated extraction could work.
During the course of this study, however, it became clear that scripting would not be viable at
this stage of development due to challenges with integrating the CSV file into the County KML
file, a process that was manually performed as described above in Figure 26. In the testing stage,
an SQL query merged the tables, in the web map hosting service Carto DB, but the process was
not automatic and required users to drag the CSV file into the Carto DB tabular interface. This

86
was not a practicable solution for a seamless user experience. Resolving these issues will require
additional time investment and advanced coding skills.
Scripting also poses possibilities in automating solutions to the topological challenges
posed in section 5.2.3. A script could potentially be developed that would combine disparate
features through a dissolve function. This technique would be applied where a FamilySearch
record’s only location is listed as the United States of America. The dissolve operator is a
function of the Data Management toolset (ArcGIS Resources 2015) and likely, could integrate
into the Esri ArcGIS Earth environment currently under development.
An automated, interactive, and dynamic GIS enabled user map would ideally be accessed
through a web service. Two possible services available for web-mapping are CartoDB and Esri
Online. Both CartoDB and Esri could process the changeable county map if it was integrated in
the shapefile (SHP) format. SHP files can be accessed from Newberry by selecting the links
under the GIS Files column from Newberry’s Atlas of Historical County Boundaries
downloading portal (Newberry Library, 2015). Additional research would be required to match
Google Earth’s intuitive feature navigation environment, and advanced scripting would be
required to register the county data with FamilySearch data, a process that was performed
manually in KML and is described above in Section 3.4.2. KML support is slated to continue in
the ArcGIS Earth environment making KML manipulation a possibility if the automated process
can be scripted appropriately (Esri 2015).
5.3.2. Potential to Distribute
The potential user pool for an application based on a FamilySearch user login is about 1
million according to FamilySearch.org. FamilySearch accounts are available to members of The
Church of Jesus Christ of Latter Day Saints with a computer or compatible mobile device

87
making the potential user pool closer to 15 million worldwide as computers and mobile devices
become available (The Church of Jesus Christ of Latter Day Saints 2015b). The distribution
process would be carried out through invitation on a broader scale to interested members of the
LDS community. Any FamilySearch user would be able to access their dynamic and interactive
family map by launching a fully automated FamilEarth application as outlined in Section 5.3.1.
Genealogy is a global endeavor and requires a global perspective. Expanding the
geographic domain of a mobile app beyond the boundaries of the United States would be crucial
for development both in terms of the users and the international extent of processed data from
FamilySearch. The database of Global Administrative Areas (GADM) is a repository of global
administrative boundaries, developed through a collaborative effort between colleagues at the
University of California, Berkeley and the University of California, Davis (Global
Administrative Areas 2015).
The GADM features are consolidated in geodatabases and downloadable by country into
multiple divisions, with level one equating to a nations state and level two equating to a county.
The data could potentially be temporally registered and calibrated to FamilySearch data within
an international version of FamilEarth. However, the spatial extent of international counties
would not accurately reflect the border changes over time. Rather they would merely show the
location and geometry of the geographic administrative unit as it is currently defined in the
GADM. A global genealogical mapping application could enhance the distribution potential for a
global audience.
5.3.3. Potential to Educate
The FamilEarth application, when fully automated and distributed, would enable around
1 million potential users with a data-driven GIS of their family map, providing the historical and
88
cultural context to enrich their research, without the burden of having to understand the elements
of geoprocessing and temporal topological registration driven by the GIS tools employed. The
application would be crafted using the best animation techniques and control technology
available to maximize the user’s learning experience.
Visualization is integral to the learning process. For this reason, a visually engaging GIS
has much to offer with regard to user education. Visualization enhancements can be made by
further leveraging the three-dimensional capabilities in a web enabled environment that would
work with a fully automated application as described above. The visual enhancement was
possible with the current version of FamilEarth (see Appendix G). 3D enhancement could be
used as an alternate method of displaying multiple records in the same county. FamilEarth
indicates concurrent records through its default interpretation property of multiple opaque
features. The effect is to make concurrent features brighter. This can be difficult for the user to
interpret. Stacking multiple three-dimensional County features for multiple records could be
easier to interpret as seen in Appendix G. These enhancements were not included in this version
of the application distributed to users as it would have complicated an already cumbersome
downloading process with additional data and further encumbered users with instructions that
could have detracted from the user’s experience.
5.4 Lessons Learned
FamilEarth was developed to illustrate the technical capabilities and advantages GIS
offers to members of the genealogical community. This was accomplished by distributing the
dynamic and interactive mapping program to volunteers and eliciting feedback to test our
hypothesis. User feedback indicated that the dynamic and interactive map that was developed
with advanced geospatial processing and multisource synthesis, effectively enhanced their

89
genealogical research experience, in terms of learning and topical interest. This study has also
opened the door to further application development that has the potential to improve the research
experience of millions of genealogists.

90
REFERENCES
Ancestral Atlas. 2015. "Ancestral Atlas - Family Tree Mapping - Family History Sharing." Ancestral Atlas. Accessed November 2, 2015. http://www.ancestralatlas.com/ancestral-atlas-genealogy-mapping-network.php.
Anderson, B. 2015. “Cartographic Approaches to the Visual Exploration of Violent
Crime Patterns in Space and Time: A User Performance Based Comparison of Methods.” Master’s Thesis, University of Southern California.
ArcGIS Resources. 2015. "ArcGIS Help 10.2, 10.2.1, and 10.2.2." Accessed December 5, 2015.
http://resources.arcgis.com/EN/HELP/MAIN/10.2/index.html#//00170000005n000000. Blue Cross Blue Shield of Tennessee. 2015. "First, Second and Third Degree Relative."
Accessed November 2, 2015. http://www.bcbst.com/mpmanual/First_and_Second_Degree_Relative.htm.
Boeing. 2015. "Boeing: Flight Tracker.” Accessed October 30, 2015.
http://www.boeing.com/commercial/flight-tracker/. Buczkowski, A. "The US Mobile App Report - Google Maps App 64.5M Users, Apple Maps
42M - Geoawesomeness." Geoawesomeness. October 17, 2014. Accessed November 2, 2015. http://geoawesomeness.com/the-us-mobile-app-report-google-maps-app-64-5m-users-apple-maps-42m/.
Buttenfield, B.P., and W.A. Mackaness 2001. Geographic information systems and science.
Chichester, NY: Wiley. 427 – 43 Corporation of the President of The Church of Jesus Christ of Latter Day Saints. 1979.
Authorized King James Version of the Holy Bible. Salt Lake City, UT: The Church of Jesus Christ of Latter Day Saints
Eriksson, A., B. Mehlig, M. Rafajlovic, and S. Sagitov. 2010. "The Total Branch Length of
Sample Genealogies in Populations of Variable Size." Genetics, 2010, 601-11. Evans, A. "Elderamevans." GitHub. Accessed December 19, 2015.
https://github.com/elderamevans. Esri. 2015. "ArcGIS Earth." ArcGIS Earth. Accessed October 31, 2015.
http://www.esri.com/landing-pages/arcgis-earth.
Fabrikant, S. and M. Harrower. 2008. “The Role of Map Animation for Geographic
Visualization.” Geographic Visualization: 49-65.

91
FamilySearch. 2015a. "About FamilySearch." FamilySearch.org. Accessed November 2, 2015. https://familysearch.org/about.
FamilySearch. 2015b. "Archives." FamilySearch.org. Accessed December 6, 2015.
https://familysearch.org/archives/. FamilySearch. 2015c. "FamilySearch Developer Center.” FamilySearch.org. Accessed
December 6, 2015. https://familysearch.org/developers/. FamilySearch. 2015d. "Free Family History and Genealogy Records." FamilySearch.org.
Accessed October 31, 2015. https://familysearch.org/. FamilySearch. 2015e. "Historical Maps." FamilySearch.org. Accessed November 2, 2015.
http://maps.familysearch.org/. FamilySearch. 2015f. "OAuth 2 - FamilySearch Developers - FamilySearch.org." Accessed
December 6, 2015. https://familysearch.org/developers/docs/guides/oauth2. FamilySearch. 2015g. "Person Search Resource - FamilySearch Developer Center –
FamilySearch.org." Accessed November 3, 2015. https://familysearch.org/developers/docs/api/tree/Person_Search_resource.
FamilySearch. 2015h. "Place Resource - FamilySearch Developer Center - FamilySearch.org."
Accessed October 31, 2015. https://familysearch.org/developers/docs/api/places/Place_resource.
FamilySearch. 2015i. "Read Person Ancestry and Additional Person Details Example Request –
FamilySearch Developer Center - FamilySearch.org." Accessed December 6, 2015. https://familysearch.org/developers/docs/api/tree/Read_Person_Ancestry_and_additional_person_details_usecase.
Family Search. 2015j. "Template:GNISEdit This Page." Template:GNIS. Accessed October 31,
2015. https://familysearch.org/learn/wiki/en/Template:GNIS. Franklin, B. 2006. The Completed Autobiography, comp. M. Skousen. Washington,
DC: Regnery Pub. GenealogyInTime Magazine. 2015. “How Popular Is Genealogy?”. Accessed October 31, 2015.
http://www.genealogyintime.com/articles/how-popular-is-genealogy-page02.html. 2 Google. 2015a. "Balloons." Google Developers. Accessed November 17, 2015.
https://developers.google.com/earth/documentation/balloons?hl=en. Google. 2015b. "Earth." Google. Accessed November 3, 2015. http://earth.google.com/.

92
Global Administrative Areas "About." Global Administrative Areas. Accessed December 12, 2015. http://www.gadm.org/about.
Gymrek, M., A. L. Mcguire, D. Golan, E. Halperin, and Y. Erlich. 2013. "Identifying Personal Genomes by Surname Inference." Science, 2013, 321-24.
Jacobus, D. L. 1968. Genealogy as Pastime and Profession. 2d ed. Baltimore:
Genealogical Pub. Keyhole. 2003. "Keyhole: Architecture." Keyhole: Architecture. July 30, 2003. Accessed
October 31, 2015. http://web.archive.org/web/20030730222424/http://www.keyhole.com/system_architecture/index.html.
Langdon, S. 2004. "Google Acquires Keyhole Corp – News Announcements – News from
Google – Google." Accessed November 1, 2015. http://googlepress.blogspot.com/2004/10/google-acquires-keyhole-corp.html.
Lella, A. 2014. "ComScore Reports October 2014 U.S. Smartphone Subscriber Market
Share." ComScore, Inc. Accessed November 2, 2015. http://www.comscore.com/Insights/Market-Rankings/comScore-Reports-October-2014-US-Smartphone-Subscriber-Market-Share.
Lowe, R. 2008. "Searching User-Controllable Animations During Learning."
Understanding Multimedia Documents, 149-67. Newberry Library. 2015. "Atlas of Historical County Boundaries." Download U.S. Files.
Accessed November 7, 2015. http://publications.newberry.org/ahcbp/downloads/united_states.html.
Notepad plus plus. 2015. "Notepad." Home. Accessed November 2, 2015. https://notepad-plus-
plus.org/. Owens, J.B. 2007. “What Historians Want from GIS.” Accessed October 9, 2015.
http://www.esri.com/news/arcnews/summer07articles/what-historians-want.html RootsMapper. 2015. "RootsMapper." RootsMapper. Accessed October 31, 2015.
https://rootsmapper.com/. Siczewicz, P., E. Kelley, and J. H. Long. 2011. "U.S. Historical Counties (Generalized
.001 Deg)." Atlas of Historical County Boundaries-Digital.” Metadata. Sinton, D. S. 2015. "Google's Recent Deprecations 'not Cataclysmic'" Directions Magazine.
Accessed October 31, 2015. http://www.directionsmag.com/entry/googles-recent-deprecations-not-cataclysmic/435055.
93
Stefanakis, E. 2008. "Google Earth." In Encyclopedia of Geographic Information Science, edited by Karen K. Kemp, 217-18. Thousand Oaks, CA: SAGE Publications, Inc. doi: http://dx.doi.org.libproxy2.usc.edu/10.4135/9781412953962.n96.
The Church of Jesus Christ of Latter Day Saints. 2015a. "Family History-Ancestry or
Genealogy” Mormon.org. Accessed November 2, 2015. https://www.mormon.org/values/family-history.
The Church of Jesus Christ of Latter Day Saints. 2015b. "LDS Statistics and Church Facts | Total
Church Membership." www.mormonnewsroom.org. Accessed November 27, 20Sai15. http://www.mormonnewsroom.org/facts-and-statistics.
Timothy, D. J., and J. K. Guelke, eds. 2008. Geography and Genealogy: Locating
Personal Pasts. Abingdon, Oxon, GBR: Ashgate Publishing Group. Accessed October 12, 2015. ProQuest ebrary
University of Texas Austin. 2015 "University of Texas Libraries." Perry-Castañeda Library Map
Collection. Accessed November 3, 2015. http://www.lib.utexas.edu/maps/. U.S. Board on Geographic Names. 2015. "Search Domestic Names -- Download Domestic
Names -- Search Foreign Names -- Search Antarctic Names." U.S. Board on Geographic Names (BGN). Accessed October 31, 2015. http://geonames.usgs.gov.
Weil, F. 2013. Family Trees: A History of Genealogy in America. Cumberland, RI, USA:
Harvard University Press. Accessed October 13, 2015. ProQuest ebrary Williams, E. W. 1960. Know Your Ancestors: A Guide to Genealogical Research. Rutland,
Vt.: C.E. Tuttle. Wood, W. B. 1997 "A Jeffersonian Vision for Mapping the World." Issues in Science and
Technology XIV, no. 1. Accessed October 10, 2015. http://issues.org/14-1/wood

94
Appendix A: Biblical Genealogical Recordings
1 the pedigrees of the antediluvian patriarchs (Genesis 5:1, 1 Chronicles 1:1-4)
2 the genealogy of Noah (Genesis 10)
2 the genealogy of Shem (Genesis 11:10-32, 1 Chronicles 1:17-28)
3 the genealogy of Ham (1 Chronicles 1:8-16)
4 the genealogy of Abraham’s children by Keturah (Genesis 25:1-4, 1 Chronicles 1:32)
5 the genealogy of Ishmeal (Genesis 25:12-16, 1 Chronicles 1:29 – 31)
6 the genealogy of Esau (Genesis 36, 1 Chronicles 1:35-54)
7 the genealogy of Jacob (Genesis 46, Exodus 6:14-25, Numbers 26, 1 Chronicles 2:2)
8 various other genealogies in the Old Testament ( 1 Chronicles 3 – 9, Ezra 2:62, Nehemiah)
9 the genealogy of Jesus (Matthew 1:1-17, Luke 3:23 – 38)
Source: Authorized King James Version of the Holy Bible

95
Appendoix B: Territorial Growth in the United States
Territorial Growth 1775
Territorial Growth 1790

96
Territorial Growth 1800
Territorial Growth 1810

97
Territorial Growth 1820
Territorial Growth 1830
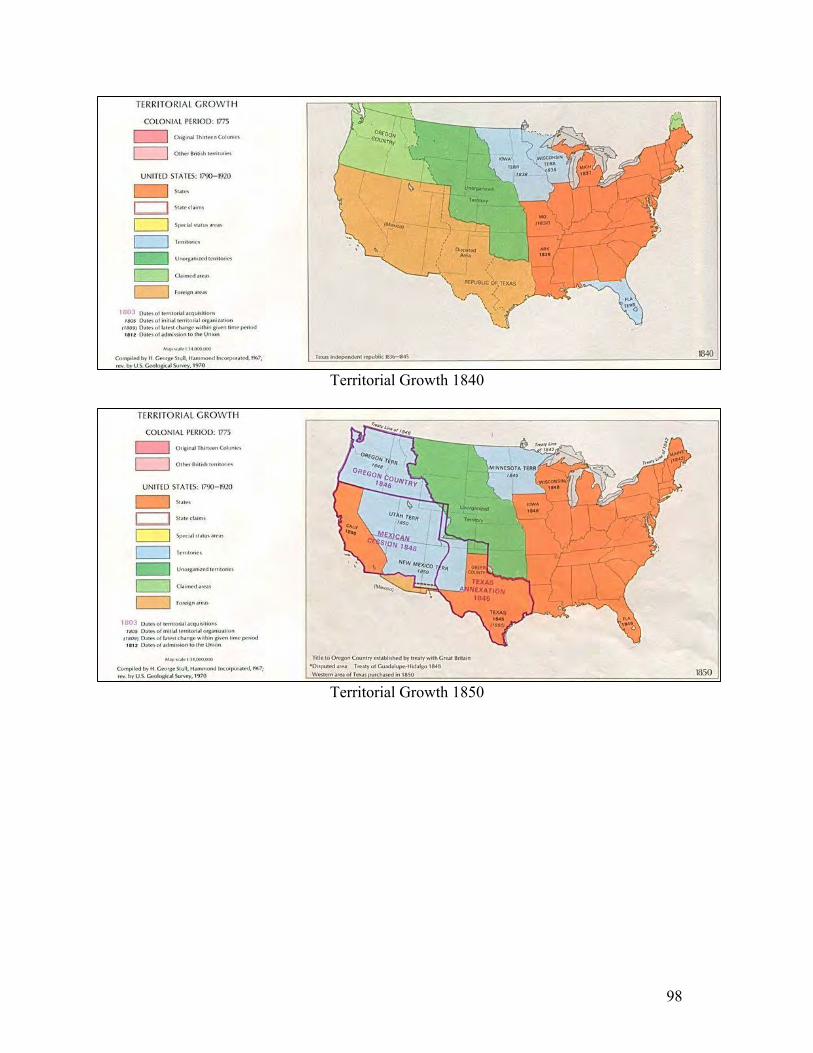
98
Territorial Growth 1840
Territorial Growth 1850

99
Territorial Growth 1860
Territorial Growth 1870

100
Territorial Growth 1880
Territorial Growth 1900

101
Territorial Growth 1920
Territorial Growth 1970
Source: University of Texas Libraries (2015)
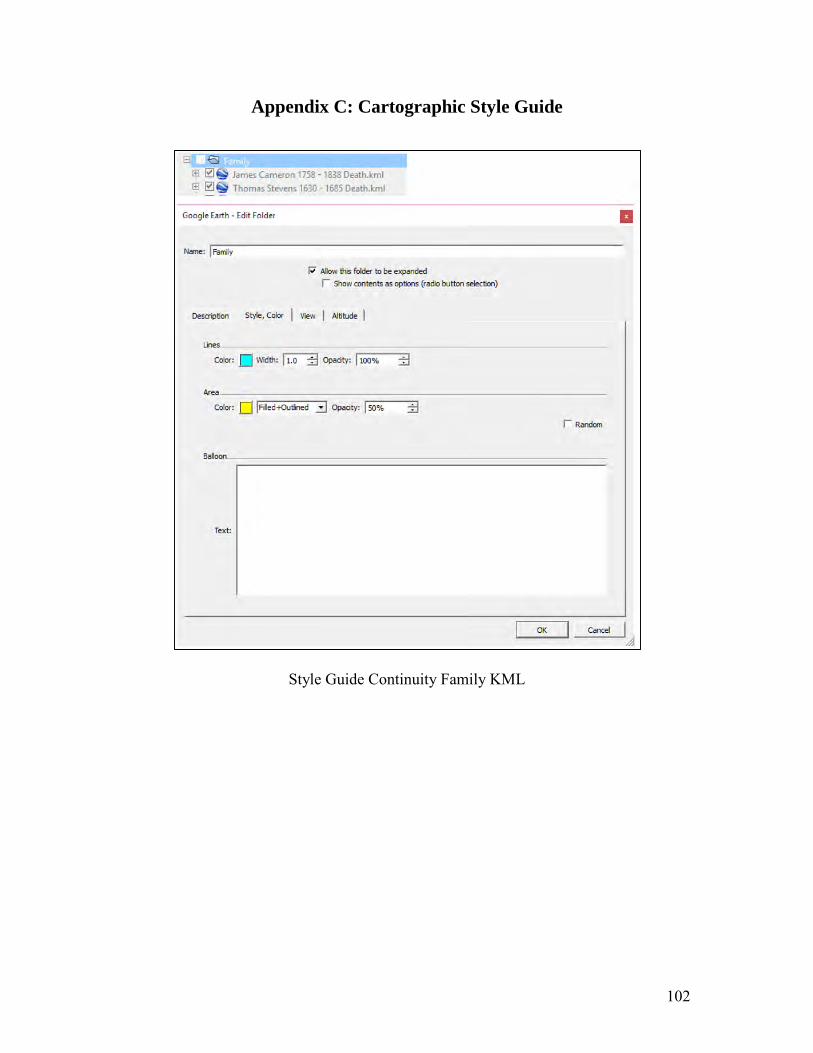
102
Appendix C: Cartographic Style Guide
Style Guide Continuity Family KML
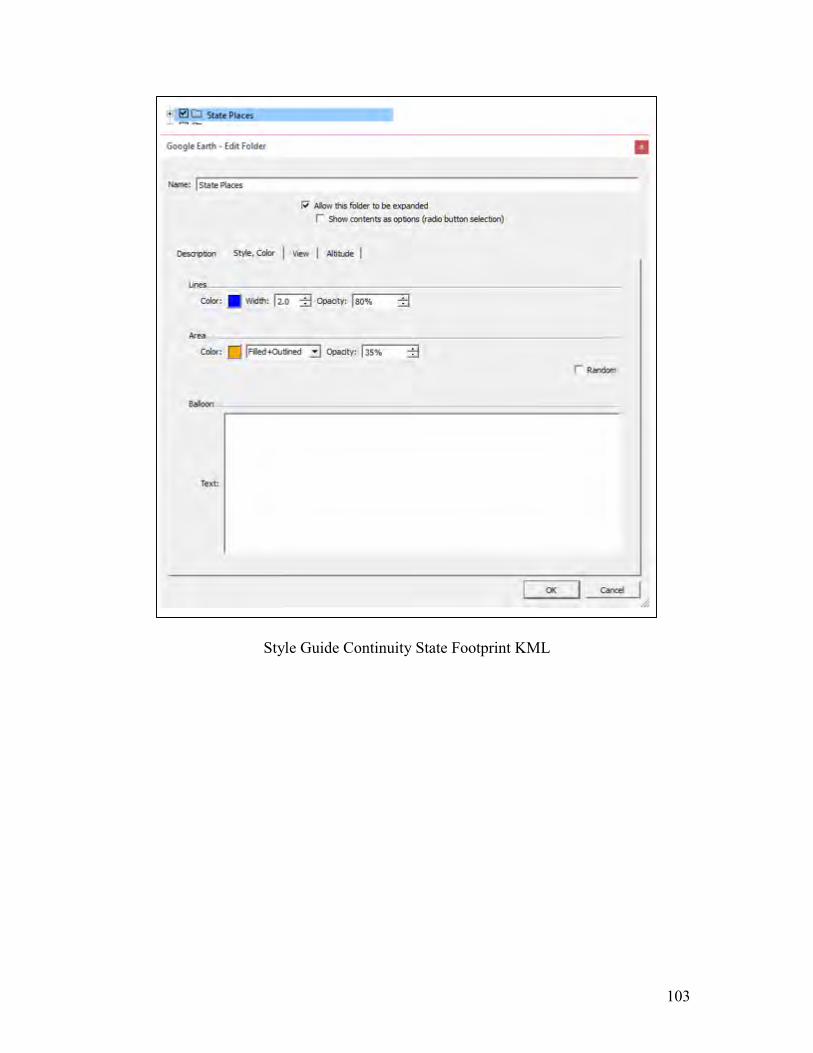
103
Style Guide Continuity State Footprint KML

104
Style Guide Continuity County KML
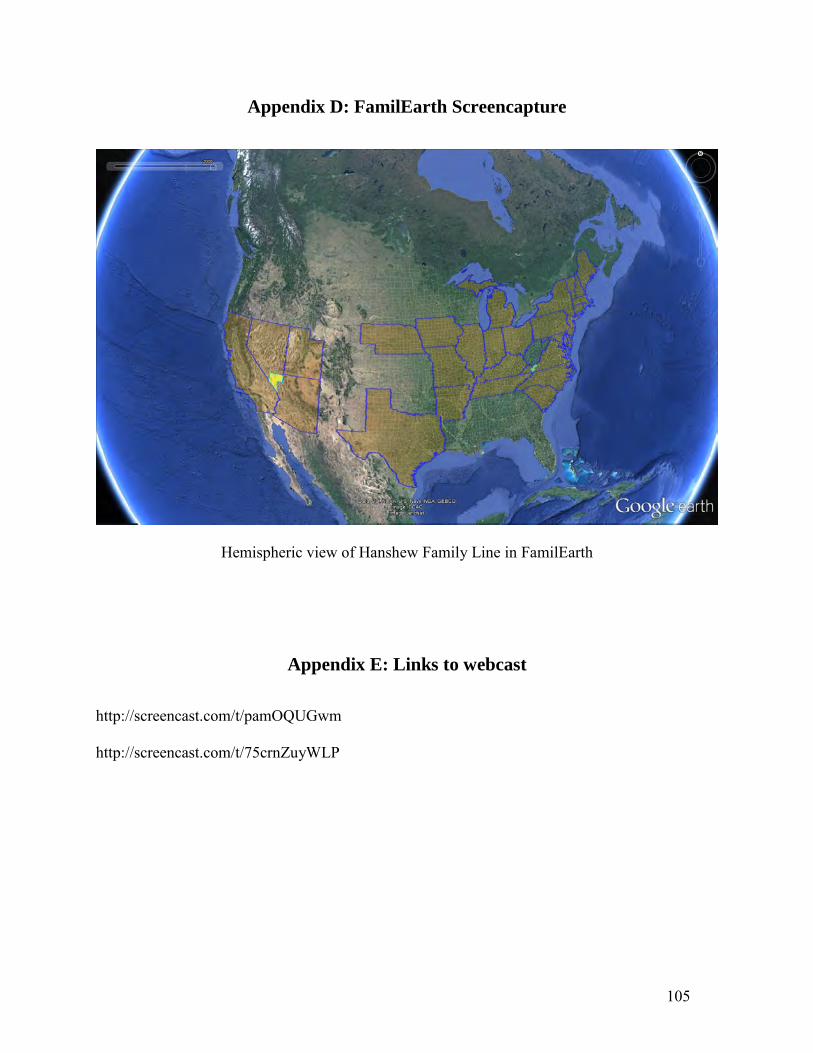
105
Appendix D: FamilEarth Screencapture
Hemispheric view of Hanshew Family Line in FamilEarth
Appendix E: Links to webcast
http://screencast.com/t/pamOQUGwm
http://screencast.com/t/75crnZuyWLP

106
Appendix F: Extraction Code Output to .CSV
person_name birth_county birth_state birth_date
John Ray Audubon Iowa 18670101
Alferna Shelby Sanilac Michigan 18720101
James Ernest Ray Monroe Michigan 19100101
Gilroy Godfrey Seward Kansas 18790101
Martha Weber Seward Kansas 18930101
Guinevere Kennington Greene Ohio 19140101
James Ray Salt Lake Utah 19420101
Asher Harmon Towns Georgia 18630101
Julia Scott Ashe North Carolina 18660101
Clement Roscoe Harmon Hawaii Hawaii 18880101
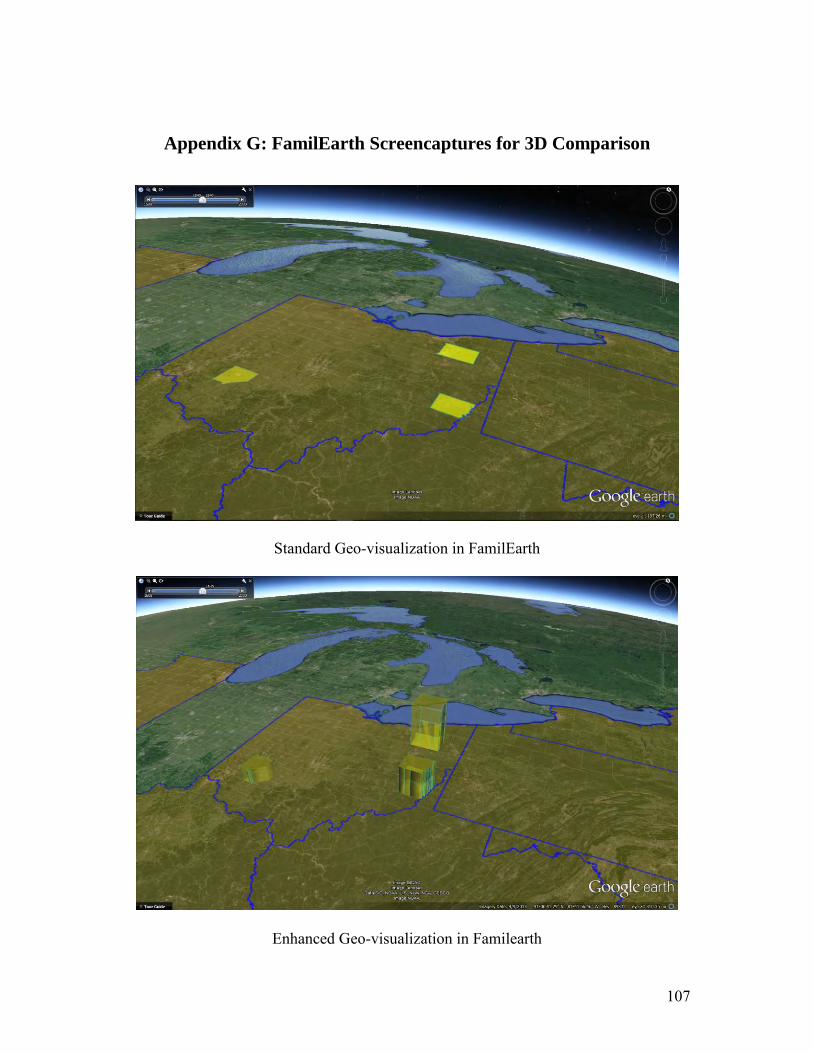
107
Appendix G: FamilEarth Screencaptures for 3D Comparison
Standard Geo-visualization in FamilEarth
Enhanced Geo-visualization in Familearth