Embed Size (px)
Citation preview
A U S T R A L I A N
R E P O R T
FARMSURVEYS
FARMSURVEYS
F I N A N C I A L P E R F O R M A N C EO F AU S T R A L I A N FA R M S
1996-97 to 1998-99
19991999

© Commonwealth of Australia 1999
This work is copyright. The Copyright Act 1968 permits fair dealing for study, research,news reporting, criticism or review. Selected passages, tables or diagrams may bereproduced for such purposes provided acknowledgment of the source is included. Majorextracts or the entire document may not be reproduced by any process without the writtenpermission of the Executive Director, ABARE.
ISSN 1325-8885
ABARE 1999, Australian Farm Surveys Report 1999, Canberra.
Australian Bureau of Agricultural and Resource EconomicsGPO Box 1563 Canberra 2601
Telephone 02 6272 2000 Facsimile 02 6272 2001Internet www.abare.gov.au
ABARE is a professionally independent government economic research agency.
ABARE project 1137

iiiAustralian Farm Surveys Report 1999
◆ABARE’s annual surveys of the broadacreand dairy industries provide a uniqueresearch database which integrates detailedfinancial, physical and socioeconomicinformation for over 70 per cent of Aus-tralian farm business units.
Farm surveys conducted by ABARE havebeen a prime source of information for theAustralian farm sector for the past fiftyyears. This information has been collectedthrough close cooperation between ABAREand industry research funding organ-isations.
Surveys undertaken for 1997-98 were the:• Australian agricultural and grazing indus-
tries survey, which covers broadacre agri-culture,
• Australian dairy industry survey,• national wool production survey and• adoption of dairy technology survey.
Questions in addition to the standard setwere included in the 1997-98 surveys. Theseincluded questions on best practices in thesheep and beef industries, pasture manage-ment on grain growing farms and vege-tation management on broadacre farms inQueensland. Summary results for some ofthese supplementary surveys are presentedin this report.
The data presented in this report rep-resent only a small proportion of the totalamount of detailed data available. Infor-mation on how to obtain more detailedsurvey data and specialised tabulations isgiven at the end of this report.
ABARE’s survey data make a significantcontribution to knowledge of the ruralsector, providing vital information to bothprivate and public decision makers. Surveydata are also used in other ABARE’s pub-lications including outlook conferencepapers, research and consultancy reports.While preserving the confidentiality ofindividual survey cooperators’ informa-tion, the data are also made available toindustry bodies, researchers and the public.
ABARE has a commitment to providingthe best possible farm survey data and toensuring continued improvement inservicing the information needs of industryand government.
BRIAN S. FISHERExecutive Director
May 1999
Foreword

◆
iv Australian Farm Surveys Report 1999
IndustryParticipation in ABARE farm surveys isvoluntary. The success of the surveysdepends on the cooperation of farmers,their accountants and marketing organ-isations in providing data and informationon farm operations.
ABARE staff• The survey information presented in this
report was compiled by the Survey DataAnalysis Section, managed by MillyLubulwa, and the Data Management andCollection Section, managed by CarolKeil.
• Design of the survey questionnaire,management of survey operations andtabulation and release of data wereundertaken by Carol Keil, Laurie Cannon,Bruce McConnell and Paul Phillips.
• Training of interviewers and data col-lection, entry and editing were under-taken by Peter Beath, Lorraine Crowe,Fiona Fitzsimmons, Ron Godenzi, IanMilthorpe, Damo Nambiar, Lou Sissian,Robin Stafford, Richard Paton, Bob Hilland Tony Wain. Assistance was alsoprovided by a number of economic re-search assistants, and casual andtemporary staff.
• Programming and computer systemssupport was provided by Ken Colbert,Alistair Peat and Keron Beath of theInformation Services Section.
• Sample design, sample weights, surveymapping and data handling assistancewas provided by Peter Martin, RayLindsay, Greg Griffiths, Walter Shafron,Veronica Rodriguez, Caroline Rasheed,Cid Riley and Sepideh Helali of theSurvey Data Analysis Section.
Acknowledgments
ABARE thanks the following organisations for their assistance in the 1996-97 Australian agricultural and grazing industries survey and
Australian dairy industry survey:
Funding

23Australian Farm Surveys Report 1999
BEEF INDUSTRY
◆
Australian beef industryFarmers’ attitudes and practices
Duane Riley
In 1997-98 owner managers in the beef industry had an average of25 years experience in farm business
management.
◆
In both the pastoral andwheat–sheep zone more beef
specialists focused on increasingoutput than reducing costs.
◆
About three-quarters of specialistbeef producers believe that there isscope to improve profitability at
current market prices.
◆
There are notable differences betweenthe top and bottom 25 per cent of
beef specialists in participation inthe practices surveyed.
Beef farm performanceThe beef industry has the largest number ofproducers of the broadacre industries inAustralia. It also has one of the largestranges in enterprise size, geographiclocation and financial performance.
Performance of beef farms is not onlyaffected by seasonal conditions and com-modity prices but also by personal factorsincluding attitudes and experiences thatinfluence the ways that producers managetheir business.
The surveyIn 1997-98, owner managers and keydecision makers in the agriculture andgrazing industry survey who ran livestockwere asked a range of questions aimed atdetermining management practices for theproperty’s financial and physical resources.The survey included questions on formaltraining, management focus, barriers toinvestment, sources of technical informa-tion and participation in group activities.
Funded by the Woolmark Company(formerly the International Wool Sec-retariat) and Meat and Livestock Australia(MLA), the information is to be used toidentify operational and business practicesof the ‘high achievers’ that will enable thecreation of best practice benchmarks.
Preliminary results are presented here for439 producers who identified themselves asbeing primarily focused on beef pro-duction. These producers represent some22 000 properties and are referred to in thisreport as beef specialists. Three maincategories of responses are addressed:people, training and workplace safety; farmmanagement practices; and businessmanagement attitudes.

24 Australian Farm Surveys Report 1999
BEEF INDUSTRY
People, training andworkplace safetyManagerial experience is important to theperformance of any business. In 1997-98owner managers in the beef industry had anaverage of 25 years experience in farmbusiness management.
At the national level 42 per cent ofspecialist beef owner managers assumedfinancial management responsibility fortheir farm when they were less than thirtyyears of age, with the average age being 32years (table 1). This excludes years wherethe transition of the farm business is takingplace and the incoming owner manager islearning about the responsibilities of theposition.
The owner manager of beef specialistproperties worked an average of 48 hours aweek on the property in 1997-98. The resultswere 5 hours higher on average in thepastoral zone, partly reflecting the longhours worked during the annual muster.The type of work carried out by the ownermanager was dominated by physical tasks;however, the percentage of physical work tototal hours worked varied considerablybetween zones and states. For example inVictoria, 90 per cent of work carried out bythe principal decision maker was physicalcompared with only 69 per cent in WesternAustralia (table 2).
The percentage of time dedicated tooffice administration and management alsovaried considerably between states andzones. Many farmers commented thatdecision making and farm planning is notnecessarily exclusive work as they oftenthink about management issues while theyare undertaking physical work. Timeworked was not double counted in thesecircumstance and consequently it may bethat time spent in consideration of manage-ment related issues including planning ismuch higher.
Better outcomes result when people usetheir knowledge and skills as well as theknowledge and skills of others (Kilpatrick1999). In the farming business where im-provements in productivity are fundamen-tal to improving farm performance, it isbecoming increasingly important to shareexperiences, skills and new ideas.
In 1997-98, 43 per cent of specialist beefproducers at the national level stated thatinteraction with family and other farmerswas the first or second most importantsource of technical information on themanagement of the farm. This was onlyexceeded by rural media (50 per cent) andfield days (44 per cent). These results areconsistent with other studies. Mues,Chapman and Van Hilst (1998) reportingthe results of an ABARE Landcare surveycarried out in 1995-96, indicated that thethree most widely used sources of farmmanagement information in broadacreindustries were the media, friends orrelations and field days.
The use of state government agriculturalextension officers is also an importantsource of technical information, althoughresults vary considerably across Australia.In the pastoral zone, 37 per cent of beefspecialists stated that state governmentextension officers were the first or secondmost important source of technical infor-mation on the management of the farm,compared with 10 per cent in the wheat–sheep zone.
State results range from over 30 per centof beef specialists in New South Wales andthe Northern Territory to less than 5 per centin Victoria and Tasmania.
Results from the 1998 survey indicatethat in all zones of Australia over 50 per centof beef specialists participated in groupactivities during 1997-98. Group activitieswere defined to include land managementgroups, marketing groups and productionand financial groups involved in analysingand comparing the physical and financial
◆
Results from the 1998 surveyindicate that in all zones of
Australia over 50 per cent ofbeef specialists participatedin group activities during
1997-98◆

25Australian Farm Surveys Report 1999
BEEF INDUSTRY
1 People, training and workplace safety, by zone, 1997-98Specialist beef producers
Wheat–sheep High rainfallPastoral zone zone zone Australia
Average age of current operator manager yrs 51 (7) 57 (2) 58 (2) 57 (1)
Age at which current operator manager assumed prime financial responsibility
Under 25 years % 22 (30) 23 (20) 21 (27) 21 (17)25 to 30 years % 28 (22) 32 (25) 14 (33) 21 (18)30 to 39 years % 43 (13) 31 (23) 41 (16) 38 (12)40 to 49 years % 6 (36) 11 (34) 13 (29) 12 (22)50 to 59 years % 2 (49) 4 (62) 10 (39) 8 (33)60 years and older % 0 1 (210) 0 (129) 0 (125)Average yrs 30 (3) 31 (3) 33 (4) 32 (3)
Hours worked per week by the owner managerPhysical work hrs 41 (7) 43 (5) 38 (6) 40 (4)Office administration
(eg book keeping) hrs 7 (12) 3 (13) 3 (16) 3 (10)Management related
(eg business planning) hrs 5 (24) 3 (9) 6 (19) 5 (13)Total farm related work hrs 53 (6) 49 (5) 47 (6) 48 (4)
Proportion of farms undertaking training by any farm worker related to enterprise a
Undertaking formal training % 41 (13) 29 (26) 36 (16) 34 (12)Undertaking 7 days or more
formal training % 26 (15) 8 (36) 15 (25) 14 (18)
Most valuable source of technical information in the management of the property b
Field days % 43 (24) 42 (18) 45 (16) 44 (11)Other farmers/family % 48 (23) 37 (15) 46 (11) 43 (8)Rural media % 35 (27) 61 (8) 46 (14) 50 (8)Subscriptions, technical reports % 14 (20) 17 (26) 19 (23) 18 (17)Consultants % 7 (31) 2 (119) 1 (84) 2 (98)Rural agents/company representatives % 10 (27) 22 (29) 15 (26) 17 (19)Government extension services % 37 (29) 10 (51) 20 (24) 18 (19)Other % 4 (42) 7 (38) 8 (35) 8 (26)
Participate in group activities % 54 (14) 54 (11) 59 (9) 57 (7)Moderate involvement % 31 (20) 35 (16) 28 (19) 31 (12)Considerable involvement % 24 (18) 19 (25) 30 (16) 26 (12)
InjuriesAverage time lost during the year days 5.1 (40) 4.3 (68) 4.7 (54) 4.6 (39)Percentage of farms with– no days lost % 68 (15) 90 (6) 87 (4) 86 (4)– more than 5 days lost % 22 (44) 9 (66) 8 (38) 9 (29)
Extent to which practices and procedures are implemented to avoid health and safety hazards related to farm work
Not at all % 2 (73) 2 (51) 2 (107) 2 (62)Somewhat % 39 (14) 53 (11) 52 (12) 51 (8)To a great extent % 59 (9) 45 (13) 46 (13) 47 (9)
Estimated population no. 1 725 7 404 13 101 22 230
a Includes formal training in business skills, leadership and people management, computer skills and technical and farmssystems. b Totals do not add up to 100 as owner managers were asked to specify their two most valuable sources of technicalinformation on the property.

26 Australian Farm Surveys Report 1999
BEEF INDUSTRY
2 People, training and workplace safety, by state, 1997-98 Percentage of farms
Specialist beef producers
New South Queens- South Western NorthernWales Victoria land Australia Australia Tasmania Territory Australia
Average age of current operatormanager yrs 59 (2) 60 (5) 54 (3) 55 (4) 65 (1) 55 (3) 46 (5) 57 (2)
Age at which current operator manager assumed prime financial responsibility
Under 25 years % 15 (33) 24 (34) 28 (23) 34 (53) 9 (42) 5 (83) 30 (31) 21 (15)25 to 30 years % 21 (41) 10 (70) 29 (23) 17 (53) 11 (30) 31 (39) 14 (63) 21 (18)30 to 39 years % 33 (30) 40 (28) 33 (21) 46 (36) 74 (42) 35 (46) 41 (28) 38 (13)40 to 49 years % 19 (34) 9 (57) 8 (34) 1 (147) 5 (625) 29 (45) 6 (66) 12 (26)50 to 59 years % 11 (51) 17 (50) 1 (69) 0 2 (95) 0 10 (56) 8 (33)60 years and older % 1 (207) 0 0 3 (80) 0 0 0 0 (113)Average yrs 35 (5) 34 (7) 29 (3) 27 (10) 34 (10) 34 (6) 32 (7) 32 (3)
Hours worked per week by the owner managerPhysical work hrs 43 (7) 38 (8) 41 (7) 36 (18) 35 (23) 37 (13) 33 (19) 40 (4)Office administration (eg book
keeping) hrs 4 (18) 2 (14) 3 (11) 4 (20) 1 (17) 2 (33) 7 (38) 3 (8)Management related (eg business
planning) hrs 5 (13) 2 (13) 4 (19) 5 (15) 15 (56) 5 (10) 13 (18) 5 (13)Total farm related
work hrs 51 (8) 42 (8) 49 (6) 45 (14) 51 (31) 44 (13) 52 (10) 48 (4)
Proportion of farms undertaking training by any farm worker related to enterprise a
Undertaking formal training % 33 (30) 41 (23) 36 (17) 38 (46) 5 (54) 18 (24) 48 (15) 34 (13)
Undertaking 7 days or more formal training % 18 (39) 16 (49) 12 (30) 11 (46) 1 (111) 2 (98) 29 (27) 14 (22)
Most valuable source of technical information in the management of the property b
Field days % 60 (17) 46 (24) 39 (17) 20 (83) 22 (149) 7 (54) 31 (33) 44 (11)Other farmers/
family % 24 (26) 30 (29) 64 (7) 36 (53) 72 (42) 67 (15) 37 (25) 43 (8)Rural media % 36 (15) 62 (18) 54 (12) 56 (37) 62 (57) 41 (34) 34 (23) 50 (8)Subscriptions, technical
reports % 25 (29) 12 (54) 11 (31) 47 (42) 11 (20) 24 (35) 27 (21) 18 (17)Consultants % 1 (500) 0 3 (41) 3 (104) 5 (130) 4 (88) 1 (50) 2 (98)Rural agents/company
representatives % 14 (51) 37 (26) 8 (32) 3 (161) 6 (49) 45 (32) 22 (40) 17 (19)Government extension
services % 32 (19) 4 (60) 14 (23) 21 (92) 23 (137) 0 41 (18) 18 (19)Other % 9 (50) 8 (61) 6 (42) 13 (49) 0 (128) 12 (66) 7 (23) 8 (26)
Participate in group activities % 59 (12) 67 (17) 53 (11) 60 (40) 21 (151) 48 (21) 75 (11) 57 (8)
Moderate involvement % 25 (26) 30 (26) 36 (14) 46 (52) 10 (306) 43 (23) 33 (17) 31 (12)
Considerable involvement % 35 (24) 38 (22) 17 (20) 15 (32) 10 (35) 5 (40) 42 (21) 26 (13)
Continued ➮

27Australian Farm Surveys Report 1999
BEEF INDUSTRY
performance of member producers. Statefigures of participation in group activitiesvary considerably with over two-thirds ofVictorian and Northern Territory beefspecialists involving themselves in groupactivities compared with only 21 per cent inWestern Australia.
People working in agriculture are morelikely to be injured and/or die on the jobthan those in most other industries. Onlymining and transport industries havehigher rates of work related deaths (Driscollet al. 1998). In 1997-98 an average 4.6 days(including all farm workers) were lostthrough farm related injuries on specialistbeef properties. This figure is influenced byserious motorbike and horse ridingaccidents during mustering and other yardwork accidents.
Northern Territory properties lost anaverage of 10.6 days to farm related injuries,with more than one in five of the propertiesin the pastoral zone losing more than 5 workdays in 1997-98, at least double the per-centage in the other zones. Approximatelyone in three properties in the pastoral zonerecorded a farm related accident during1997-98 involving injury and time off work,compared with around one in ten producersin the wheat–sheep and high rainfall zones.
Farm management practicesThe second category dealt with in thesurvey was management of the farm’sphysical resources. Few of these practicescan ever be independent of business man-agement but are nevertheless reported hereas a separate category (tables 3 and 4).
In today’s farm business environment ithas become increasingly difficult to makeadvances without setting goals. In the beefindustry, production goals often includeturnoff numbers, calving rates, carcasscondition and animal growth rates. A thirdof beef specialist properties in 1997-98
2 People, training and workplace safety, by state, 1997-98 Percentage of farms ContinuedSpecialist beef producers
New South Queens- South Western NorthernWales Victoria land Australia Australia Tasmania Territory Australia
InjuriesAverage time lost
in 1997-98 days 4.5 (104) 0.8 (61) 6.4 (48) 11.3 (62) 1.5 (555) 3.0 (106) 10.6 (24) 4.6 (41)Percentage of farms with– no days lost % 88 (8) 93 (3) 80 (6) 80 (22) 94 (33) 92 (6) 76 (10) 86 (4)– more than
5 days lost % 9 (81) 2 (59) 12 (31) 20 (89) 6 (487) 3 (117) 21 (33) 9 (35)
Extent to which practices and procedures are implemented to avoid health and safety hazards related to farm work
Not at all % 0 8 (70) 1 (51) 0 0 0 0 2 (57)Somewhat % 53 (16) 70 (12) 44 (16) 42 (17) 31 (47) 55 (27) 43 (22) 51 (8)To a great extent % 47 (18) 22 (30) 55 (13) 58 (12) 69 (21) 45 (34) 57 (17) 47 (8)
Estimated population no. 6 957 4 487 7 481 1 192 1 221 689 203 22 230
a Includes formal training in business skills, leadership and people management, computer skills and technical and farmssystems. b Totals do not add up to 100 as owner managers were asked to specify their two most valuable sources of technicalinformation on the property.Note: Figures in parentheses are relative standard errors that are expressed as percentages of the estimates.
◆
Approximately one in threeproperties in the pastoral
zone recorded a farm relatedaccident during 1997-98
involving injury and time off work
◆
28 Australian Farm Surveys Report 1999
BEEF INDUSTRY
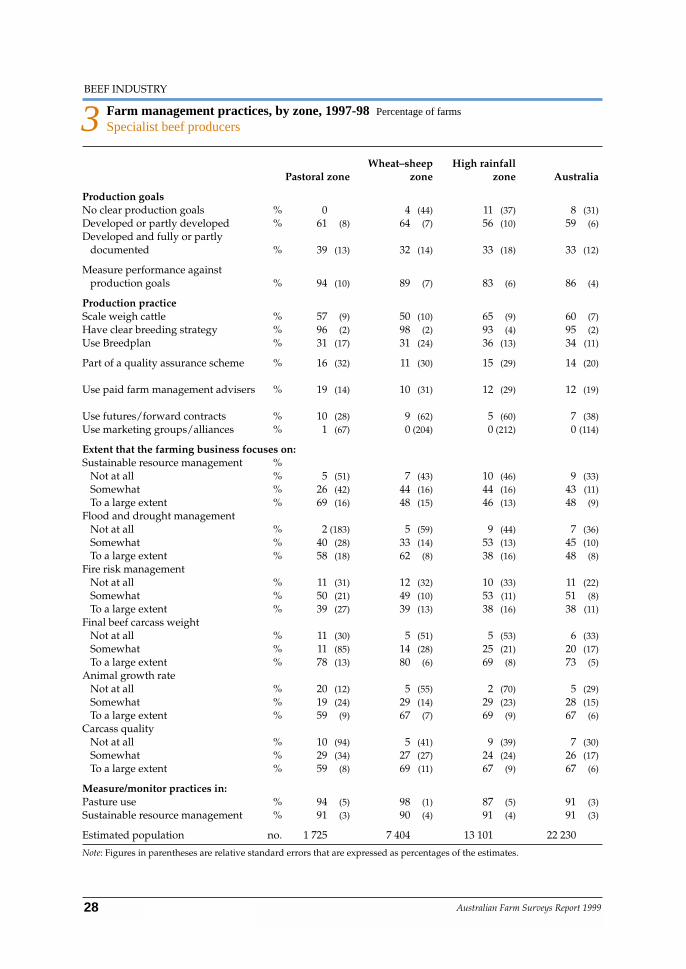
3 Farm management practices, by zone, 1997-98 Percentage of farms
Specialist beef producers
Wheat–sheep High rainfallPastoral zone zone zone Australia
Production goalsNo clear production goals % 0 4 (44) 11 (37) 8 (31)Developed or partly developed % 61 (8) 64 (7) 56 (10) 59 (6)Developed and fully or partly
documented % 39 (13) 32 (14) 33 (18) 33 (12)
Measure performance against production goals % 94 (10) 89 (7) 83 (6) 86 (4)
Production practiceScale weigh cattle % 57 (9) 50 (10) 65 (9) 60 (7)Have clear breeding strategy % 96 (2) 98 (2) 93 (4) 95 (2)Use Breedplan % 31 (17) 31 (24) 36 (13) 34 (11)
Part of a quality assurance scheme % 16 (32) 11 (30) 15 (29) 14 (20)
Use paid farm management advisers % 19 (14) 10 (31) 12 (29) 12 (19)
Use futures/forward contracts % 10 (28) 9 (62) 5 (60) 7 (38)Use marketing groups/alliances % 1 (67) 0 (204) 0 (212) 0 (114)
Extent that the farming business focuses on:Sustainable resource management %
Not at all % 5 (51) 7 (43) 10 (46) 9 (33)Somewhat % 26 (42) 44 (16) 44 (16) 43 (11)To a large extent % 69 (16) 48 (15) 46 (13) 48 (9)
Flood and drought managementNot at all % 2 (183) 5 (59) 9 (44) 7 (36)Somewhat % 40 (28) 33 (14) 53 (13) 45 (10)To a large extent % 58 (18) 62 (8) 38 (16) 48 (8)
Fire risk managementNot at all % 11 (31) 12 (32) 10 (33) 11 (22)Somewhat % 50 (21) 49 (10) 53 (11) 51 (8)To a large extent % 39 (27) 39 (13) 38 (16) 38 (11)
Final beef carcass weightNot at all % 11 (30) 5 (51) 5 (53) 6 (33)Somewhat % 11 (85) 14 (28) 25 (21) 20 (17)To a large extent % 78 (13) 80 (6) 69 (8) 73 (5)
Animal growth rateNot at all % 20 (12) 5 (55) 2 (70) 5 (29)Somewhat % 19 (24) 29 (14) 29 (23) 28 (15)To a large extent % 59 (9) 67 (7) 69 (9) 67 (6)
Carcass qualityNot at all % 10 (94) 5 (41) 9 (39) 7 (30)Somewhat % 29 (34) 27 (27) 24 (24) 26 (17)To a large extent % 59 (8) 69 (11) 67 (9) 67 (6)
Measure/monitor practices in:Pasture use % 94 (5) 98 (1) 87 (5) 91 (3)Sustainable resource management % 91 (3) 90 (4) 91 (4) 91 (3)
Estimated population no. 1 725 7 404 13 101 22 230
Note: Figures in parentheses are relative standard errors that are expressed as percentages of the estimates.

29Australian Farm Surveys Report 1999
BEEF INDUSTRY
reported that they had developed pro-duction goals that were fully or partlydocumented. The proportion of propertieswas highest in the pastoral zone (39 percent), and in the Northern Territory (65 percent) and South Australia (56 per cent).
The most common production factor thatspecialist beef producers focused on wasfinal beef carcass weight. Over two-thirds ofbeef specialists stated that they focused onboth final beef carcass weight and animalgrowth rate to a large extent. Given that aconsiderable number of these producersdid not have documented production goals,this implies that there are many farmswhere focusing on such items is routine orthey are in the stage of formalising theirgoals.
At the national level 93 per cent ofspecialist beef producers reported that they
focused on carcass quality (two-thirds to alarge extent) even though only 14 per centwere part of a quality assurance scheme in1997-98. Membership in quality assuranceschemes ranges from 22 per cent ofproperties in Queensland down to 4 percent in Western Australia. While someproducers perceived few benefits frommembership of voluntary quality assuranceschemes, and have dropped out, resultsfrom this survey suggest that specialistproducers within the industry acknow-ledge the importance of a top qualityproduct to the future of their industry andare managing the beef enterprise accord-ingly.
The use of private consultants has in-creased substantially in the 1990s (Martin etal. 1998). In the beef industry there is a widerange between states and zones in both the
4 Farm management practices, by state, 1997-98 Percentage of farms
Specialist beef producers
New South Queens- South Western NorthernWales Victoria land Australia Australia Tasmania Territory Australia
Production goalsNo clear production
goals % 17 (41) 8 (74) 2 (56) 0 0 0 0 8 (33)Developed or partly
developed % 60 (13) 64 (15) 59 (9) 44 (56) 46 (67) 85 (10) 35 (18) 59 (7)Developed and
fully or partly documented % 23 (28) 28 (38) 39 (13) 56 (44) 54 (58) 15 (57) 65 (10) 33 (12)
Measure performance against production goals % 75 (13) 92 (4) 88 (5) 94 (8) 100 (0) 94 (8) 99 (1) 86 (4)
Production practiceScale weigh cattle % 62 (12) 37 (23) 64 (9) 78 (21) 71 (20) 72 (19) 71 (13) 60 (6)Have clear breeding
strategy % 99 (1) 97 (2) 97 (1) 98 (4) 57 (54) 76 (12) 100 (0) 95 (2)Use Breedplan % 36 (27) 37 (25) 31 (18) 37 (66) 20 (72) 37 (29) 52 (21) 34 (13)
Part of a quality assurance scheme % 12 (48) 7 (53) 22 (23) 13 (43) 4 (79) 13 (57) 14 (16) 14 (19)
Use paid farm management advisers % 16 (40) 4 (60) 14 (19) 7 (43) 7 (47) 9 (63) 19 (24) 12 (20)
Use futures/forward contractsto sell product % 8 (80) 1 (100) 7 (35) 3 (97) 18 (78) 18 (52) 13 (39) 7 (35)
Use marketing groups/alliancesto sell product % 0 1 (100) 0 (95) 0 0 0 2 (109) 0 (66)
Continued ➮

30 Australian Farm Surveys Report 1999
BEEF INDUSTRY
percentage of farms using consultants andthe extent to which their services areemployed. Use of paid managementadvisers is highest in the areas dominatedby large grazing properties — use byspecialist beef producers in NorthernTerritory, Queensland, New South Walesand the pastoral zone are above theAustralian average of 12 per cent.
Business managementattitudesBusiness management, including financialplanning and strategic business decision
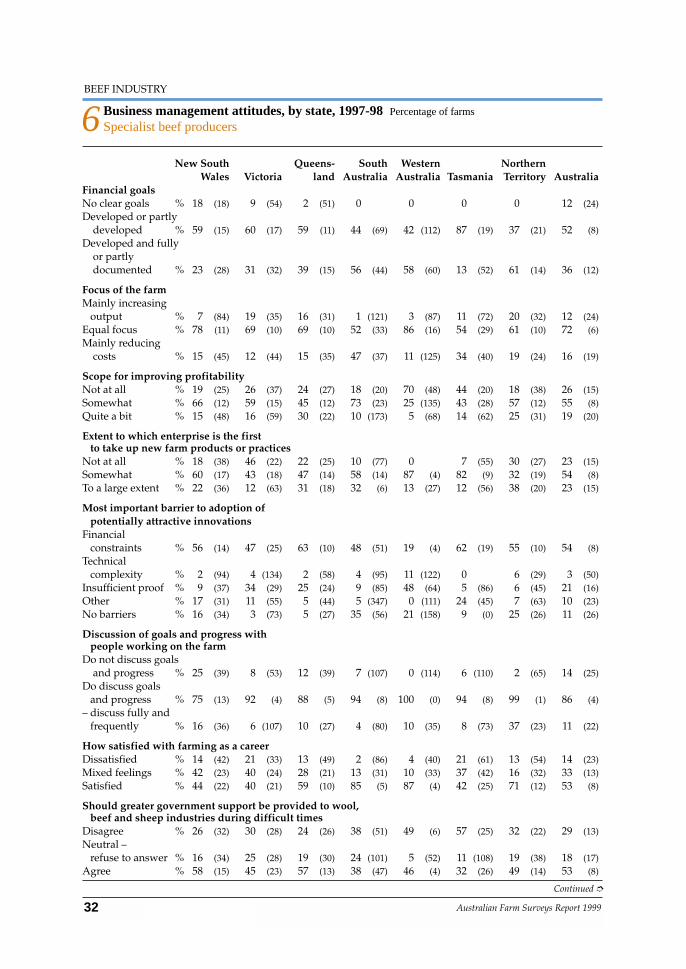
making, differs substantially acrossgeographic regions in the specialist beefindustry. Almost three-quarters of beefspecialists in Australia stated that they hadan equal focus on reducing costs and in-creasing output when making farm man-agement decisions (tables 5 and 6).
In both the pastoral and wheat–sheepzone more beef specialists focused onincreasing output than reducing costs. Incontrast twice as many beef specialists inthe high rainfall zone focused on reducingcosts as opposed to increasing output. Anumber of factors may account for thisdifference in focus. In the high rainfall zone
4 Farm management practices, by state, 1997-98 Percentage of farms ContinuedSpecialist beef producers
New South Queens- South Western NorthernWales Victoria land Australia Australia Tasmania Territory Australia
Extent that the farming business focuses on:Sustainable resource management
Not at all % 4 (78) 12 (56) 5 (47) 8 (93) 49 (6) 2 (85) 0 9 (23)Somewhat % 40 (23) 49 (21) 40 (15) 56 (35) 41 (11) 57 (18) 18 (38) 43 (10)To a large extent % 56 (16) 39 (20) 55 (12) 37 (50) 10 (38) 41 (25) 82 (8) 48 (8)
Flood and drought managementNot at all % 5 (64) 4 (95) 3 (54) 20 (89) 43 (71) 13 (39) 9 (59) 7 (32)Somewhat % 46 (18) 52 (21) 40 (15) 51 (36) 27 (54) 66 (17) 30 (27) 45 (9)To a large extent % 49 (17) 44 (24) 57 (11) 30 (14) 30 (112) 21 (52) 61 (13) 48 (9)
Fire risk managementNot at all % 12 (37) 3 (67) 8 (33) 30 (64) 4 (48) 57 (27) 18 (26) 11 (19)Somewhat % 52 (14) 54 (17) 52 (10) 24 (76) 69 (49) 43 (36) 12 (52) 51 (8)To a large extent % 37 (19) 44 (21) 40 (14) 47 (52) 27 (125) 0 70 (8) 38 (11)
Final beef carcass weightNot at all % 5 (84) 9 (72) 4 (36) 7 (107) 1 (146) 11 (88) 13 (55) 6 (36)Somewhat % 17 (38) 48 (20) 7 (33) 5 (313) 23 (62) 47 (28) 25 (29) 20 (15)To a large extent % 78 (8) 40 (20) 90 (3) 88 (20) 76 (19) 42 (22) 62 (10) 73 (4)
Animal growth rateNot at all % 0 9 (64) 6 (44) 15 (4) 0 0 5 (77) 5 (31)Somewhat % 34 (20) 47 (26) 13 (33) 5 (313) 25 (57) 55 (23) 13 (43) 28 (14)To a large extent % 66 (11) 43 (26) 81 (6) 80 (20) 72 (20) 45 (28) 81 (8) 67 (6)
Carcass qualityNot at all % 6 (65) 17 (45) 4 (37) 7 (107) 4 (28) 8 (117) 2 (143) 7 (28)Somewhat % 27 (29) 36 (30) 19 (31) 5 (347) 24 (139) 49 (23) 28 (27) 26 (17)To a large extent % 67 (13) 46 (19) 77 (8) 89 (20) 72 (47) 43 (13) 71 (11) 67 (6)
Measure/monitor practices in:Pasture use % 91 (4) 83 (12) 94 (4) 100 (1) 99 (2) 90 (9) 94 (5) 91 (3)Sustainable resource
management % 91 (4) 90 (7) 90 (4) 92 (8) 94 (2) 92 (8) 98 (3) 91 (2)
Estimated population no. 6 957 4 487 7 481 1 192 1 221 689 203 22 230
Note: Figures in parentheses are relative standard errors that are expressed as percentages of the estimates.

31Australian Farm Surveys Report 1999
BEEF INDUSTRY
5 Business management attitudes, by zone, 1997-98 Percentage of farms
Specialist beef producers
Wheat–sheep High rainfallPastoral zone zone zone Australia
Financial goalsNo clear goals % 2 (104) 13 (35) 12 (34) 11 (24)Developed or partly developed % 51 (12) 60 (8) 45 (13) 50 (8)Developed and fully or partly
documented % 33 (13) 31 (16) 34 (17) 32 (12)
Focus of the farmMainly increasing output % 17 (26) 16 (38) 9 (30) 12 (22)Equal focus % 75 (6) 75 (10) 69 (9) 72 (6)Mainly reducing costs % 8 (38) 10 (42) 22 (26) 16 (22)
Scope for improving profitabilityNot at all % 31 (18) 18 (24) 29 (18) 26 (13)Somewhat % 55 (10) 62 (12) 51 (10) 55 (7)Quite a bit % 14 (19) 20 (34) 20 (23) 19 (18)
Extent to which enterprise is the first to take up new farm products or practices
Not at all % 22 (47) 21 (30) 25 (20) 23 (16)Somewhat % 52 (21) 56 (13) 53 (10) 54 (8)To a large extent % 26 (12) 24 (22) 22 (21) 23 (14)
Most important barrier to adoption of potentially attractive innovations
Financial constraints % 48 (14) 54 (9) 56 (11) 54 (7)Technical complexity % 8 (128) 1 (46) 4 (69) 3 (53)Insufficient proof % 29 (36) 26 (20) 18 (28) 21 (16)Other % 4 (34) 13 (20) 10 (33) 10 (21)No barriers % 12 (25) 7 (33) 13 (33) 11 (25)
Discussion of goals and progress with people working on the farm
Do not discuss goals and progress % 6 (159) 12 (53) 17 (29) 14 (26)Do discuss goals and progress % 94 (10) 89 (7) 83 (6) 86 (4)– discuss fully and frequently % 15 (17) 10 (32) 11 (31) 11 (21)
How satisfied with farming as a careerDissatisfied % 12 (32) 12 (27) 15 (29) 14 (21)Mixed feelings % 40 (28) 29 (27) 35 (14) 33 (12)Satisfied % 49 (23) 60 (13) 50 (9) 53 (7)
Should greater government support be provided to wool, beef and sheep industries during difficult times?
Disagree % 22 (23) 25 (27) 33 (20) 29 (16)Neutral – refuse to answer % 13 (25) 18 (27) 19 (27) 18 (19)Agree % 65 (7) 57 (14) 48 (15) 53 (9)
Succession planDo have well formed plan % 39 (13) 44 (18) 53 (11) 49 (9)Do not have well formed plan % 28 (19) 39 (18) 33 (16) 35 (11)Uncertain about existence of plan % 21 (15) 15 (30) 12 (27) 14 (18)na (includes managed properties) % 12 (19) 1 (102) 2 (82) 3 (42)
Estimated population no. 1 725 7 404 13 101 22 230
Note: Figures in parentheses are relative standard errors that are expressed as percentages of the estimates.
32 Australian Farm Surveys Report 1999
BEEF INDUSTRY
6 Business management attitudes, by state, 1997-98 Percentage of farms
Specialist beef producers
New South Queens- South Western NorthernWales Victoria land Australia Australia Tasmania Territory Australia
Financial goalsNo clear goals % 18 (18) 9 (54) 2 (51) 0 0 0 0 12 (24)Developed or partly
developed % 59 (15) 60 (17) 59 (11) 44 (69) 42 (112) 87 (19) 37 (21) 52 (8)Developed and fully
or partlydocumented % 23 (28) 31 (32) 39 (15) 56 (44) 58 (60) 13 (52) 61 (14) 36 (12)
Focus of the farmMainly increasing
output % 7 (84) 19 (35) 16 (31) 1 (121) 3 (87) 11 (72) 20 (32) 12 (24)Equal focus % 78 (11) 69 (10) 69 (10) 52 (33) 86 (16) 54 (29) 61 (10) 72 (6)Mainly reducing
costs % 15 (45) 12 (44) 15 (35) 47 (37) 11 (125) 34 (40) 19 (24) 16 (19)
Scope for improving profitabilityNot at all % 19 (25) 26 (37) 24 (27) 18 (20) 70 (48) 44 (20) 18 (38) 26 (15)Somewhat % 66 (12) 59 (15) 45 (12) 73 (23) 25 (135) 43 (28) 57 (12) 55 (8)Quite a bit % 15 (48) 16 (59) 30 (22) 10 (173) 5 (68) 14 (62) 25 (31) 19 (20)
Extent to which enterprise is the first to take up new farm products or practices
Not at all % 18 (38) 46 (22) 22 (25) 10 (77) 0 7 (55) 30 (27) 23 (15)Somewhat % 60 (17) 43 (18) 47 (14) 58 (14) 87 (4) 82 (9) 32 (19) 54 (8)To a large extent % 22 (36) 12 (63) 31 (18) 32 (6) 13 (27) 12 (56) 38 (20) 23 (15)
Most important barrier to adoption of potentially attractive innovations
Financialconstraints % 56 (14) 47 (25) 63 (10) 48 (51) 19 (4) 62 (19) 55 (10) 54 (8)
Technical complexity % 2 (94) 4 (134) 2 (58) 4 (95) 11 (122) 0 6 (29) 3 (50)
Insufficient proof % 9 (37) 34 (29) 25 (24) 9 (85) 48 (64) 5 (86) 6 (45) 21 (16)Other % 17 (31) 11 (55) 5 (44) 5 (347) 0 (111) 24 (45) 7 (63) 10 (23)No barriers % 16 (34) 3 (73) 5 (27) 35 (56) 21 (158) 9 (0) 25 (26) 11 (26)
Discussion of goals and progress with people working on the farm
Do not discuss goalsand progress % 25 (39) 8 (53) 12 (39) 7 (107) 0 (114) 6 (110) 2 (65) 14 (25)
Do discuss goals and progress % 75 (13) 92 (4) 88 (5) 94 (8) 100 (0) 94 (8) 99 (1) 86 (4)
– discuss fully and frequently % 16 (36) 6 (107) 10 (27) 4 (80) 10 (35) 8 (73) 37 (23) 11 (22)
How satisfied with farming as a careerDissatisfied % 14 (42) 21 (33) 13 (49) 2 (86) 4 (40) 21 (61) 13 (54) 14 (23)Mixed feelings % 42 (23) 40 (24) 28 (21) 13 (31) 10 (33) 37 (42) 16 (32) 33 (13)Satisfied % 44 (22) 40 (21) 59 (10) 85 (5) 87 (4) 42 (25) 71 (12) 53 (8)
Should greater government support be provided to wool, beef and sheep industries during difficult times
Disagree % 26 (32) 30 (28) 24 (26) 38 (51) 49 (6) 57 (25) 32 (22) 29 (13)Neutral –
refuse to answer % 16 (34) 25 (28) 19 (30) 24 (101) 5 (52) 11 (108) 19 (38) 18 (17)Agree % 58 (15) 45 (23) 57 (13) 38 (47) 46 (4) 32 (26) 49 (14) 53 (8)
Continued ➮

33Australian Farm Surveys Report 1999
BEEF INDUSTRY
a higher than average number of beefspecialists indicated that financial con-straints were the main barrier to adoptingpotentially attractive innovations. Resultsshow that these farms also have sub-stantially higher off-farm wages on averagethan the other zones and spend less hoursworking on the farm. Time and financialconstraints may mean that cost reduction inthe short term is the most appropriate wayto increase farm incomes in this zone.
Approximately three-quarters ofspecialist beef properties in Australiabelieve that there is scope to improve theprofitability of their enterprise givencurrent market prices. The beef specialists
6 Business management attitudes, by state, 1997-98 Percentage of farms ContinuedSpecialist beef producers
New South Queens- South Western NorthernWales Victoria land Australia Australia Tasmania Territory Australia
Succession planDo have well
formed plan % 54 (16) 48 (19) 40 (18) 58 (31) 87 (3) 26 (35) 44 (23) 49 (9)Do not have well
formed plan % 30 (26) 34 (27) 43 (13) 38 (48) 5 (53) 56 (15) 11 (56) 35 (11)Uncertain regarding
existence of plan % 13 (30) 18 (41) 16 (30) 3 (76) 0 16 (57) 11 (60) 14 (18)na (includes managed
properties) % 4 (72) 0 1 (47) 1 (88) 8 (44) 2 (103) 34 (18) 3 (36)
Estimated population no. 6 957 4 487 7 481 1 192 1 221 689 203 22 230
Note: Figures in parentheses are relative standard errors that are expressed as percentages of the estimates.
A
High rainfall zone 65%
Wheat–sheep zone28%
Pastoral zone7%
Location of beef specialists who are dissatisfied with
farming as a career
◆
Approximately a third of beef specialists indicated they
had mixed feelings aboutfarming as a career
◆
in the wheat–sheep zone tend to be the mostoptimistic about the potential to improvereturns. In contrast only 30 per cent ofWestern Australia beef specialists and 56per cent in Tasmania believe that they canimprove their underlying profitability.These two states also had the largestproportion of farms that believed livestockindustries should not receive governmentassistance during difficult times.
Overall only 14 per cent of beef specialistproperties were dissatisfied with farming asa career, while over 50 per cent satisfied tovery satisfied. Around two-thirds of beefspecialist properties that are dissatisfiedwith farming are located in the high rainfallzone (figure A) where farms are smaller andoff-farm wages and salaries considerablyhigher than the Australian average.
Approximately a third of beef specialistsindicated they had mixed feelings aboutfarming as a career, including owner man-agers that do not call farming a career as

34 Australian Farm Surveys Report 1999
BEEF INDUSTRY
7 Attitudes and practices, by performance group, 1997-98 a Percentage of farms
Specialist beef producers
Pastoral zone Wheat–sheep zone High rainfall zone Australia
Bottom Top Bottom Top Bottom Top Bottom Top25% 25% 25% 25% 25% 25% 25% 25%
Hours worked per week by the owner manager Physical work hrs 35 (14) 37 (14) 43 (12) 46 (7) 37 (14) 47 (12) 39 (9) 46 (8)Office
administration hrs 7 (11) 9 (27) 1 (22) 3 (19) 3 (31) 5 (26) 3 (20) 5 (17)Management
related hrs 5 (89) 6 (15) 3 (20) 5 (17) 3 (29) 7 (21) 3 (21) 6 (14)Total farm related
work hrs 46 (16) 52 (10) 47 (12) 55 (6) 43 (14) 59 (12) 44 (9) 57 (7)
Participate in group activities % 25 (44) 80 (21) 45 (34) 74 (9) 69 (18) 59 (10) 58 (15) 66 (7)
Moderate involvement % 9 (69) 52 (31) 27 (41) 36 (20) 33 (34) 23 (36) 29 (26) 30 (19)
Considerable involvement % 16 (54) 27 (25) 18 (59) 38 (24) 36 (29) 36 (29) 29 (25) 36 (19)
Production practiceScale weigh cattle % 27 (32) 71 (11) 19 (50) 88 (5) 44 (25) 66 (18) 34 (21) 74 (10)Use Breedplan % 7 (131) 45 (16) 11 (79) 49 (16) 35 (21) 31 (30) 25 (22) 39 (16)Use paid farm management
advisers % 23 (25) 26 (14) 8 (96) 27 (28) 10 (77) 28 (34) 10 (49) 28 (22)Use futures/forward
contracts % 3 (312) 22 (15) 4 (72) 21 (26) 2 (84) 6 (113) 3 (58) 13 (37)Member quality
assurance scheme% 4 (218) 21 (71) 4 (72) 11 (47) 12 (75) 24 (54) 9 (63) 19 (41)
Focus of the farmMainly increasing
output % 12 (64) 14 (19) 4 (141) 30 (20) 11 (74) 7 (51) 9 (59) 15 (19)Equal focus % 80 (11) 74 (11) 88 (10) 63 (11) 76 (14) 59 (23) 80 (9) 62 (13)Mainly reducing
costs % 8 (60) 12 (69) 9 (79) 8 (52) 13 (62) 34 (40) 11 (47) 23 (34)
Scope for improving profitabilityNot at all % 25 (40) 30 (22) 29 (39) 6 (54) 30 (34) 20 (51) 29 (24) 16 (38)Somewhat % 71 (14) 58 (9) 56 (26) 58 (16) 38 (32) 63 (15) 47 (18) 61 (11)Quite a bit % 5 (78) 12 (46) 16 (57) 36 (24) 32 (35) 17 (53) 24 (30) 23 (26)
Level of satisfaction with farming as a careerDissatisfied % 22 (44) 7 (33) 21 (38) 8 (49) 10 (65) 20 (44) 15 (32) 15 (35)Mixed feelings % 58 (55) 31 (49) 36 (33) 23 (27) 43 (22) 26 (28) 42 (18) 26 (19)Satisfied % 19 (171) 62 (25) 44 (20) 69 (11) 47 (20) 54 (10) 43 (16) 59 (7)
Should greater government support be provided to wool, beef and sheep industries during difficult times?
Disagree % 3 (290) 25 (35) 36 (32) 29 (20) 19 (51) 19 (45) 23 (30) 23 (24)Neutral– refuse to answer % 2 (153) 17 (20) 7 (84) 19 (33) 36 (34) 22 (42) 24 (32) 20 (28)Agree % 95 (10) 59 (15) 57 (23) 52 (15) 45 (30) 60 (21) 53 (17) 57 (13)
Continued ➮

35Australian Farm Surveys Report 1999
BEEF INDUSTRY
7 Attitudes and practices, by performance group, 1997-98 a Percentage of farms ContinuedSpecialist beef producers
Pastoral zone Wheat–sheep zone
Bottom 25% Top 25% Bottom 25% Top 25%
Financial performance indicatorsEnterprise size in
sheep equivalents no. 10 478 (87) 61 362 (10) 2 795 (13) 14 175 (10)
Total cash receipts $ 112 310 (149) 975 792 (12) 86 871 (26) 319 550 (11)Total cash costs $ 143 466 (211) 712 912 (18) 84 007 (33) 227 951 (13)Farm cash income $ –31 156 (469) 262 880 (21) 2 864 (248) 91 599 (11)Farm business profit $ –137 151 (69) 410 294 (12) –54 782 (12) 57 630 (21)Profit at full equity $ –132 016 (72) 449 479 (10) –50 487 (13) 82 539 (15)
Farm debt at 30 June b $ 29 969 (32) 386 883 (24) 47 466 (35) 271 091 (15)Off-farm wages and
salaries b $ 28 630 (64) 5 466 (50) 10 403 (48) 3 644 (34)Total off-farm income b $ 44 483 (58) 16 691 (54) 22 251 (25) 11 305 (36))
Estimated population no. 505 428 1 940 1 813
High rainfall zone Australia
Bottom 25% Top 25% Bottom 25% Top 25%
Financial performance indicatorsEnterprise size in
sheep equivalents no. 2 068 (18) 8 603 (15) 3 022 (27) 14 649 (7)
Total cash receipts $ 38 871 (23) 193 901 (24) 60 843 (28) 297 943 (11)Total cash costs $ 47 323 (22) 136 642 (28) 67 525 (41) 212 888 (12)Farm cash income $ –8 452 (57) 57 259 (19) –6 682 (194) 85 055 (10)Farm business profit $ –53 991 (13) 18 004 (34) –61 337 (15) 62 351 (11)Profit at full equity $ –48 174 (9) 30 250 (23) –56 076 (16) 80 977 (8)
Farm debt at 30 June b $ 32 467 (76) 118 693 (19) 37 164 (42) 191 035 (11)Off-farm wages
and salaries b $ 15 854 (66) 12 296 (63) 14 992 (45) 8 866 (51)Total off-farm income b $ 40 426 (37) 18 446 (44) 34 810 (27) 15 850 (32)
Estimated population no. 3 481 3 165 5 926 5 406
a Farmers ranked according to rate of return on capital excluding capital appreciation. b Responding farms only.Note: Figures in parentheses are relative standard errors that are expressed as percentages of the estimates.
they are more reliant on off-farm income. Itwould be expected that feelings aboutfarming would have a strong correlationwith both the financial performance of theenterprise and the value that owner man-agers place on the farming lifestyle.
Farm cash income is considerably higherfor producers that are satisfied or verysatisfied with farming as a career (figure B)and both the percentage of farms with off-farm income and the average amountearned off-farm is markedly lower.
◆
Links between financialperformance and attitudesand practicesPreliminary results presented in table 7compare several responses of beefspecialists ranked according to rate ofreturn on capital. Future analysis of thesurvey data will expand on this work byexamining how best practice and attitudevariables drive productivity and profit-ability.
Across all zones the top 25 per cent ofowner managers in the beef industrydedicate more hours to physical, manage-

36 Australian Farm Surveys Report 1999
BEEF INDUSTRY
high rainfall zone has a large influence onnational results as almost 60 per cent of beefspecialists are located there.
Future work assessing the possibleimpact of best practice and attitudevariables on performance will need toacknowledge important differences innumber of producers, land quality, stockingrates and seasonal conditions between thebroadacre zones.
ReferencesDriscoll, T., Mitchell, R., Mandryk, J., Healey, S.
and Hendrie, L. 1998, Work-related TraumaticFatalities in Australia 1989–1992, NationalOccupation Health and Safety Commission,Sydney.
Kilpatrick, S. 1999, ‘Social capital and grouplearning’, in Outlook 99, Proceedings of theNational Agricultural and Resource OutlookConference, Canberra, 17–18 March, vol. 2,Agriculture, ABARE, Canberra, pp. 137–43.
Martin, P., Riley, D., Ashton, D., Delforce J. andLoggia, D. 1998, Australian Grains Industry1998, ABARE, Canberra.
Mues, C., Chapman, L. and Van Hilst, R. 1998,Promoting Improved Land Management Practiceson Australian Farms: A Survey of Landcare andLand Management Related Programs, ABAREResearch Report 98.4, Canberra.
◆
ment and office administration work thanthe bottom 25 per cent of producers (table 7).They also receive considerably less in off-farm wages and salaries consistently acrosszones (approximately 41 per cent less at thenational level) implying less time isavailable to work off the property.
The output and cost focus of beefspecialists varies considerably betweenperformance groups and zones. In generala higher percentage of better performingbeef specialists are focused on eitherreducing costs or increasing output, asopposed to an equal focus on both. Only 16per cent of the top 25 per cent of beefspecialists at the national level believe thatthere is no scope to improve profitabilitygiven current market prices compared with29 per cent of the poorer performers.
There are notable differences between thetop and bottom 25 per cent of beefspecialists at the national level in partici-pation in group activities, membership inquality assurance schemes and use of farmmanagement advisers, Breedplan, scaleweighing and futures/forward contracts.Results are consistent between zones exceptin the high rainfall zone where a higherpercentage of the poorer performingproducers use breedplan and participate ingroup activities. It should be noted that the
Farm debt ($)Off-farm wagesand salaries ($)
Enterprise sizein sheep
equivalents (no.)
Farm cashincome ($)
0
20 000
40 000
60 000
80 000
100 000
120 000
Performance indicators, by level of satisfactionwith farming, 1997-98
B
Mixed feelingsDissatisfied
Satisfied