Embed Size (px)
Citation preview
LCLS-TN-00-12
A Transverse RF Deflecting Structure forBunch Length and Phase Space Diagnostics
Paul Emma, Josef Frisch, Patrick KrejcikSLAC
August 29, 2000
ABSTRACT
A traveling wave transverse rf deflecting structure is discussed as a tool for bunch lengthmeasurement and as an aid to detailed phase space diagnostics in future FEL and linearcollider projects. The idea is an old one [1], [2], but the applications are new. The highfrequency time variation of the deflecting fields is used to ‘pitch’ or ‘yaw’ the electronbunch where the resulting transverse beam width measured on a simple profile monitorrepresents a reliable, single-shot measure of the absolute bunch length. A small rf phaseshift, from the zero-crossing, adds a net centroid kick so that the bunch may intercept anoff-axis screen. The deflecting rf is then pulsed at a much lower rate than the machinerate, and a pulse-stealing process is used to monitor the bunch length continuously.Multiple screens at appropriate phase advance locations might also be used to monitor the‘slice’ (i.e. time-correlated) transverse emittance [3]. A screen placed at a point ofsignificant momentum dispersion can also be used to reveal how longitudinal phase spaceis populated. Suitable S-band structures were built and tested in the 1960’s at SLAC [4]and are available today. Simulations of these schemes are presented for the LinacCoherent Light Source [5], the existing SLAC linac, and the Next Linear Collider [6].
LCLS-TN-00-12
1 Introduction
One of the many technical challenges for future free-electron lasers (FEL) and linearcolliders is the measurement and diagnosis of their extremely short electron bunches.The rms bunch length in the Linac Coherent Light Source (LCLS) [5] is 80 fsec (24 m)and that of the Next Linear Collider (NLC) [6] is 300 fsec (90 m). This is well beyondthe range of streak cameras, but a similar concept can be applied by directly ‘streaking’the electron beam using an rf deflecting field. This idea has been used in the past [1], [2]and has been suggested again recently [7]. The high frequency time variation of thedeflecting fields is used to ‘pitch’ or ‘yaw’ the electron bunch, where the resultingtransverse beam width measured on a simple profile monitor represents a reliable, single-shot measure of the absolute bunch length. Since the method effectively converts one ofthe profile monitor’s transverse dimensions into time, the bunch can be analyzed indetail, revealing important time-correlations in the other phase space dimensions andallowing the ‘time-sliced’ rms dimensions of the beam to be measured. This can be anessential diagnostic in future FEL’s where the time-sliced beam widths are offundamental importance, and the long-term stability of these parameters needscontinuous monitoring.
Suitable S-band traveling wave structures were built and tested in the 1960’s at SLAC [4]and are still available today. These are 8-foot and 12-foot long structures capable of 25-30 MW of peak input power and up to 32 MV of peak deflecting voltage. Such structurescan be utilized for future machines and even as a basic diagnostic in the existing SLAClinac. The following describes the relative effectiveness of the structures for anyparticular electron beam.
2 The Deflecting Structure
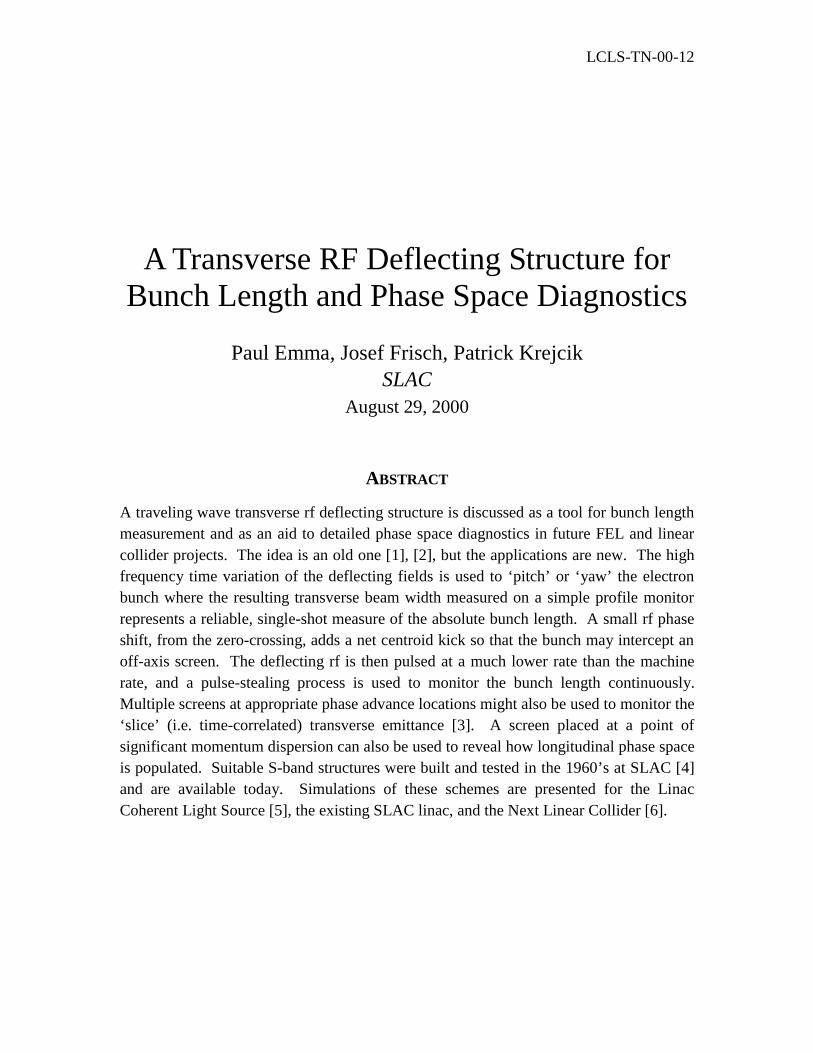
The existing S-band deflecting structures are described in references [1] and [4]. Thedisk-loaded waveguide structure is fabricated from brazed stacks of machined coppercylinders with a period of 3.5 cm. The iris radius is 2.24 cm, which is almost twice thatof the accelerating structures. A cut-away view of the deflecting structure is shown inFigure 1. The polarization plane of the TM11 mode is determined by the orientation ofthe input coupler. Since minor imperfections in the structure could cause the mode torotate, two additional holes are provided on either side of each iris to stabilize the modeand prevent rotations.
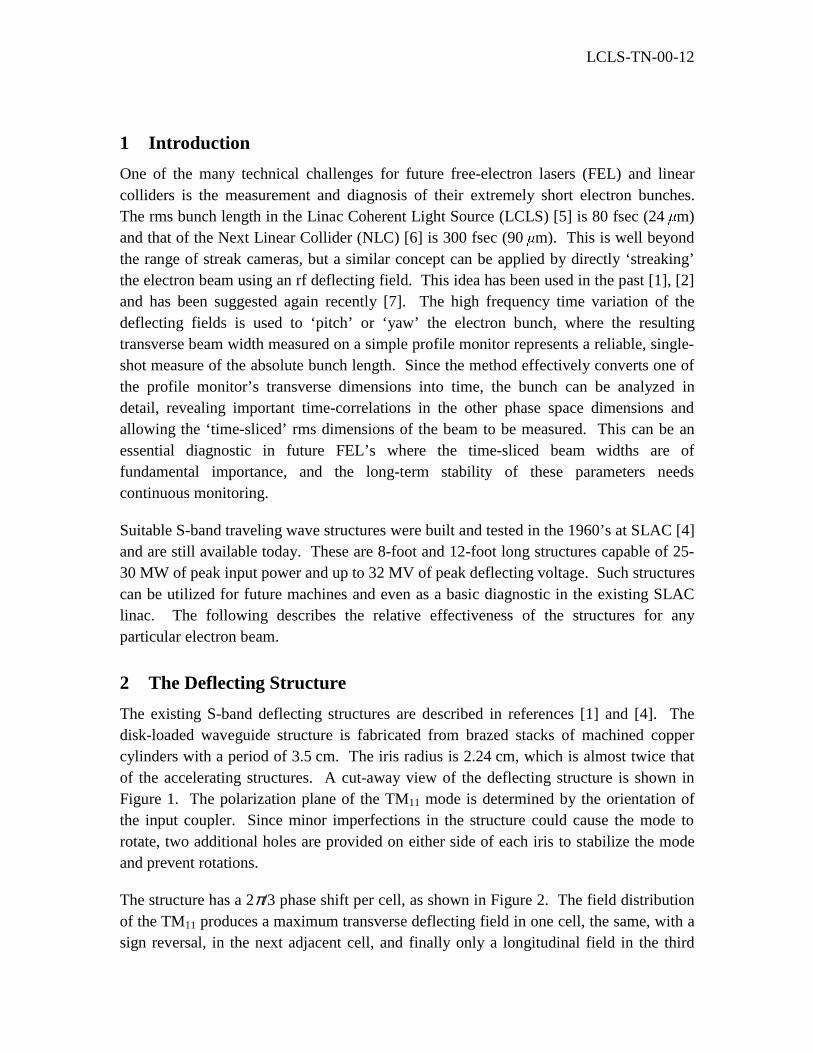
The structure has a 2π/3 phase shift per cell, as shown in Figure 2. The field distributionof the TM11 produces a maximum transverse deflecting field in one cell, the same, with asign reversal, in the next adjacent cell, and finally only a longitudinal field in the third
LCLS-TN-00-12
cell (see Figure 2). Note that the longitudinal field component is proportional todisplacement from the axis and changes sign, passing through zero as one crosses the axis[see Eq. (2)].
RF InputCoupler
BeamDeflection
Irises withmode-lockingholes
Figure 1. Schematic of a SLAC S-band transverse deflecting structure. The kick is vertical in this drawing.
Figure 2. Time snap-shot of the field distribution of the TM11 mode with a 2π/3 cell length.
At SLAC, there exists both 8-foot (2.44 m) and 12-foot (3.64 m) long structures, althoughwe confine our consideration here to the 8-foot structures. Measurements [8] andcalculations [9] of the deflection versus power indicate a power to voltage relationship of
( )0 01 21.6 MV/m/MWV L P≈ , (1)
where L is the structure length and P0 is the peak input power.
LCLS-TN-00-12
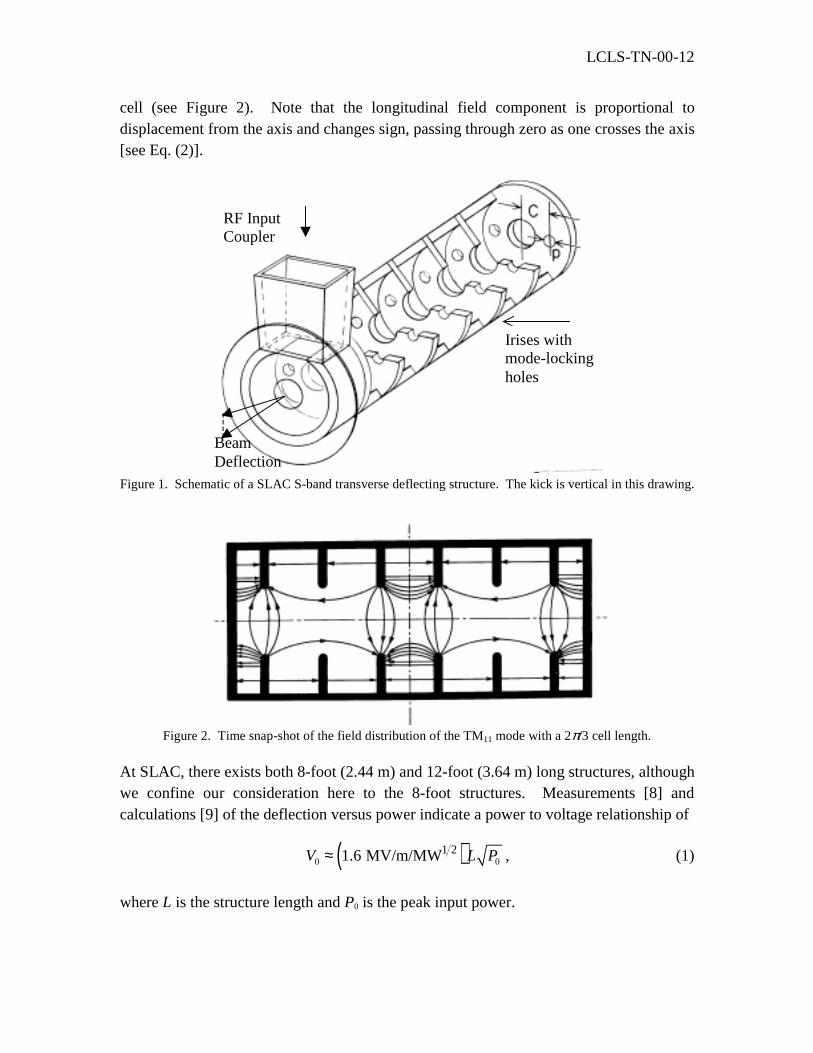
Reference [4] describes the fields in the structures and makes an important point aboutthe net forces, which we repeat here. The first-order solution for the lowest-orderdeflecting mode, in cylindrical coordinates, is given by
( ) ( )
( ) ( )
( ) ( )
( ) ( )
1 10 2 2
1 10 2 2
0
1 10 0 2 2
1 10 0 2 2
0 0
2 2
2 2
2 2
2 2
cos
sin
cos
1 sin
1 cos
sin
r
z
r
z
E E kr ka
E E kr ka
E iE kr
Z H E kr ka
Z H E kr ka
Z H iE kr
θ
θ
θ
θ
θ
θ
θ
θ
= +
= − =
= − − +
= + − = −
(2)
where k = 2 / is the free-space wave number, a is the radius of the iris, Z0 is free-spaceimpedance, 1i = − , E0 = |E0|e
ik(z í ct) represents a traveling wave, and c is the speed oflight. From the Lorentz force on a particle of charge e, one obtains the forces inrectangular coordinates.
0
0
0
cos
x
y
z
F eE
F
F ieE kr θ
=
=
=
(3)
The transverse deflecting feld is uniform in magnitude and direction over the aperture,which implies an aberration-free deflection from this mode. The longitudinal force is 90Ûout of phase and depends linearly on radius, r. It is typically insignificant, even forvalues of r approaching a few millimeters.
The time averaged power transmitted through the structure is given by the real part of theintegral over the aperture surface, S, of one-half of the normal component of the complexPoynting vector E×H*.
{ }*1Re
2 SP d= × ⋅∫ E H S¶ (4)
Using the divergence theorem and the solution for the deflecting mode in equations (2)one obtains
LCLS-TN-00-12
0
0
2 2 22 41
2 2 3 2zEa ka ka
PZ
π = − . (5)
For the SLAC deflecting structure with a = 2.24 cm, the term in the square bracket isnegative, indicating a backward wave mode. Consequently the rf power is fed in at thecoupler at the downstream end of the structure.
3 Description of the Method
The aberration-free deflecting force imparts a transverse momentum on the bunch whichYDULHV� LQ� WLPH� RYHU� WKH� SDVVDJH� RI� WKH� EXQFK�� � 7KH� VPDOO� NLFN� DQJOH�� x (<< 1), as afunction of longitudinal position along the bunch, z, is given approximately by
( ) ( )0 0 2sin cos sin
z
eV eVx z kz z
pc p c
πϕ ϕ ϕλ
′∆ = + ≈ + , (6)
where V0 is the peak voltage, p is the beam’s longitudinal momentum in the structure, andϕ is the rf phase (= 0 at zero-crossing). The approximation is made that |z| << /2 , soonly the linear term in z is retained. We have ignored the fact that the electric fieldactually increases the total beam momentum by accelerating in the transverse direction.7KH�W\SLFDO�HIIHFW�RQ�WKH�PRPHQWXP�LV�WLQ\�DQG�LV�HVWLPDWHG�E\� p/p §� x
2/2.
From Eq. (6) it is clear that a centroid deflection occurs for sinϕ ≠ 0 and an angular‘yaw’ (or ‘pitch’ for a vertical deflector) is generated along the bunch which is linear in z.A spatial ‘pitch’ arises at a screen placed downstream of the deflector, where the beamhas been transported through a transfer matrix with angular-to-spatial elementR12 = ( d s)
1/2VLQ . Here, d is the beta function at the deflector, s is the beta functionDW� WKH� VFUHHQ�� DQG� is the betatron phase advance from deflector to screen. Thetransverse position of each ultra-relativistic electron on the screen is then given by
( ) 0 2sin cos sind s
eVx z z
pc
πβ β ψ ϕ ϕλ
∆ ≈ ∆ + . (7)
Taking the mean value over the ensemble of particles, for the nominal case with ⟨z⟩ = 0,gives the transverse centroid offset at the screen.
0 sin sind seV
xpc
β β ψ ϕ∆ = ∆ (8)
Similarly, the rms beam size on the screen is
LCLS-TN-00-12
( ) 00
21 22 2 2 2sin cosx x z d s
eVx x
pc
πσ σ σ β β ψ ϕλ
− ≡ = + ∆
, (9)
where σx0 is the nominal beam size on the screen (i.e. in the absence of a deflectingvoltage), and σz (= ⟨z2⟩1/2) is the rms bunch length.
If the rf voltage is adequate, the beam size associated with the bunch length will dominatethe nominal beam size, and the quadrature addition in Eq. (9) becomes a small correction.This requires that the rf deflecting voltage be large compared to the scaled nominal beamsize, or
021
sin cosN
z deV pc mc
ελπσ ψ ϕ β
⋅∆
‰ , (10)
which, when Eq. (10) is in equality, results in a quadrature correction of just 12.5 %.Here we have used, for the screen’s nominal spot size,
0 Nx sσ β ε γ= , (11)
where (= pc/mc2) is the Lorentz energy factor, mc2 is the electron rest energy, and N isthe normalized transverse rms emittance (in the deflection plane). Eq. (10) indicates thatthe required voltage scales weakly with the square-root of beam momentum and inverselywith bunch length. The required voltage also decreases with smaller emittance anddecreases for larger values of the beta function in the deflector. The beta function at thescreen does not effect the ‘signal-to-noise’ relationship of Eq. (10), but it does scale themeasured spot size in Eq. (9). Similarly, a phase advance near /2 and an rf phase nearzero-crossing are advantageous. Finally, a shorter rf wavelength also reduces the voltagerequired. For S-band ( § 10.5 cm) and example LCLS parameters (pc § 5 GeV,σz § 24 m, N § 1 m, d § 50 m), the deflector voltage should be |V0| � 10 MV.
The possibility of acceleration between the deflecting structure and the screen should alsobe incorporated into these relationships. This is included by everywhere replacing thebeta function product with
d s d s d sE Eβ β β β→ , (12)
where Ed (§ pc) is the beam energy in the deflector and Es is the energy at the screen.Including acceleration, the measured bunch length is calculated using Eq. (9).
( )0
0
2 2
2 sin cos
x xd sz
d s
E E
eV
σ σλσπ ψ ϕ β β
−=
∆(13)
LCLS-TN-00-12
4 Wakefields and Second-Order Effects
An x-z (or y-z) correlation along the bunch is influenced by three main effects. The firstof these is the transverse rf deflections described in Eq. (7). The second is the transversewakefields of the accelerating structures induced upstream of the deflector, and especially(with an off-axis kick) between the deflector and the screen. Finally, the exactcorrelation induced by the deflecting structure depends on the precise momentum profilealong the bunch. If the momentum variation along the bunch is linearly correlated intime (as is typical before and frequently after a magnetic bunch compressor), the final x-zcorrelation will be dependent on the sign of the slope of the rf deflecting voltage (i.e.dV/dz). This dependence is implicit in Eq. (7) and is made explicit by substituting:p = p0(1 +� p/p0), where we ignore the beta function and phase advance dependence onmomentum. If the relative momentum deviation is linearly correlated in time along theEXQFK� �L�H�� p/p0 = ], where is the correlation factor), and a centroid deflection isincluded (i.e. ϕ � 0), the measured beam size is dependent on the sign of the momentum-time correlation. This is made explicit from Eq. (7), with the approximate momentumsubstitution, 1/p § (1 í ])/p0, and again forming the rms from the expectation values.
( ) 0
1 2222 4
sin cos 1 tan2 5x z d s
z
eV
pcδ
δ δσπ λσ σ σ β β ψ ϕ ϕ σ
λ σ π
≈ ∆ − + (14)
Here the (linearly correlated) rms relative momentum spread in the deflector is indicatedby σ , and (insignificantly) a uniform temporal distribution is assumed, which always hasmoments given by: ⟨z⟩ = ⟨z3⟩ = 0 and ⟨z4⟩ = 9σz
4/5. The correlation factor is replaced by § σ /σz, assuming linearity, and that the uncorrelated component of momentum spread
is insignificant. Finally, we have ignored σx0, assuming, for simplicity, Eq. (10) is wellsatisfied.
Eq. (14), for typical parameters, can be reduced to a simpler form by ignoring the small4σ 2/5 correction term at far right. Ignoring this term also makes the next resultindependent of the type of temporal distribution.
( ) 02sin cos 1 tan
2x z d sz
eV
pcδ
δσπ λσ σ σ β β ψ ϕ ϕ
λ σ π
≈ ∆ −
(15)
Eq. (15) looks identical to Eq. (9), for small σx0, except for the tanϕ momentum spreadcorrection term. It shows that, for a linearly correlated momentum spread, the measuredbeam size is dependent on the sign of the rf slope (i.e. tanϕ; see simulations for numericalexamples). This appears to be a problem for the accurate determination of the bunchlength, but can be mitigated in either of two ways. The first is to set ϕ = 0 or , which
LCLS-TN-00-12
requires an on-axis screen, but eliminates the momentum spread dependent term. Thesecond is to measure the spot size for two phases: ϕ = ϕ0 and ϕ = í ϕ0, and average thetwo. The average spot size, along with the nominal spot size, is then used in Eq. (13) tocalculate the bunch length, σz. The validity of this averaging is seen in Eq. (15) byreplacing the function of the absolute value brackets with two separate equations for σx;one for ϕ = ϕ0 and one for ϕ = í ϕ0. The mean value of σx is then equal to Eq. (9).
This same problem, and same solution, apply to the biasing effects of transversewakefields. The wakefields install a fairly linear x-z correlation along the bunch, verysimilar to the momentum spread effect, which can also be cancelled by using the two-phase measurement and averaging. These wakefield and momentum spread effects areincluded in the detailed tracking simulations described below.
5 Application in the LCLS
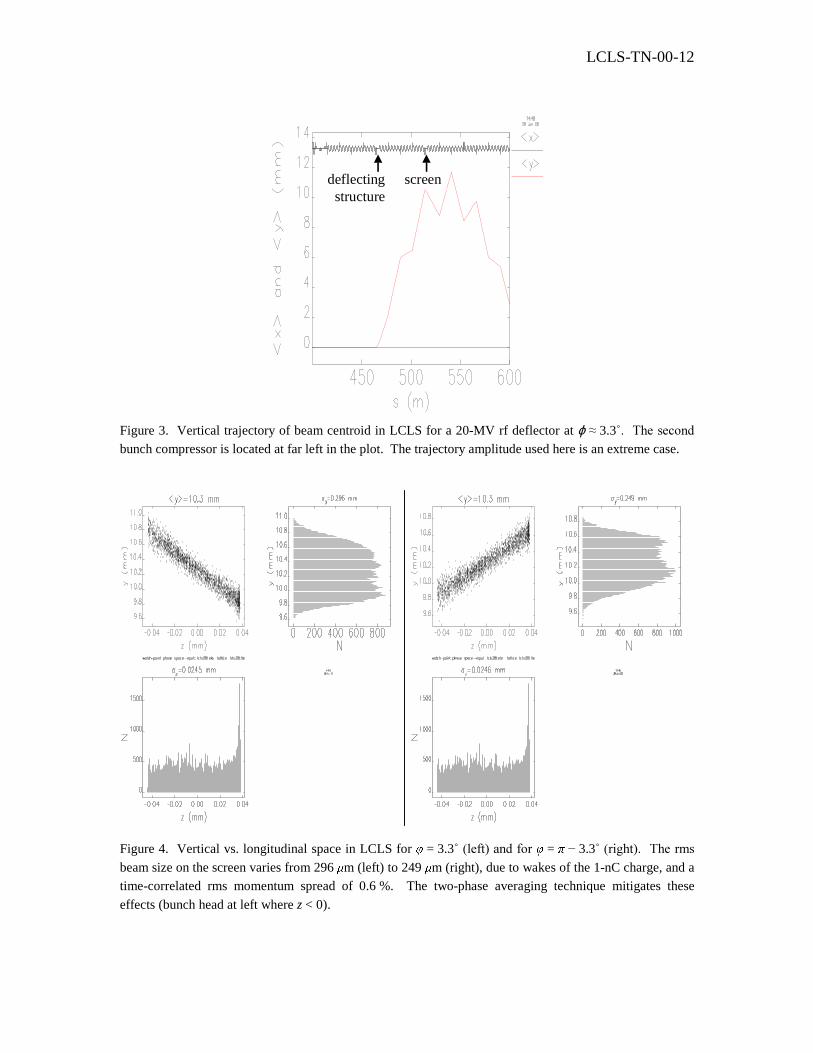
The best location for an 8-foot long deflecting structure in the LCLS is downstream ofthe second bunch compressor where the bunch length is shortest, but not far downstreamso that the beam momentum is still relatively low. Since we would also like to diagnosethe effects of coherent synchrotron radiation (CSR) in the second compressor, it is best toinstall the structure as a vertical deflector so that CSR-induced correlations betweenhorizontal position and time might be measured (the compressor is composed ofhorizontal bends). A similar idea for measuring the CSR-induced time-correlations usingvertical momentum dispersion has also been suggested [10]. We should place thedeflector near a defocusing quadrupole magnet where the vertical beta function is large.Since there is some available space at the end of ‘linac-sector-25’ where a screen can beinstalled, we locate the deflector approximately 60Û� LQ� YHUWLFDO� EHWDWURQ� SKDVH� DGYDQFHupstream of this screen location. The choice of 60Û�UDWKHU�WKDQ���Û�LV�XVHG�WR�UHGXFH�WKHeffects of transverse wakefields on the bunch as it moves off-axis from deflector toscreen. This argument is best understood by examining Figure 3, which shows thevertical trajectory after a 20-MV rf deflector at ϕ § 3.3Û�
The deflector and screen locations are indicated. This arrangement leaves a phaseDGYDQFH�RI� § 60Û���7KLV�FDQ�EH�LQFUHDVHG�WR���Û�E\�PRYLQJ�WKH�VFUHHQ�GRZQVWUHDP�WRthe point where the trajectory is a maximum. The gain in deflector efficiency, however,is only ~10 % and the bunch stays well off-axis for an additional 25 meters, whichamplifies the transverse wakefields induced in the accelerating structures. For thisreason, the 60Û�ORFDWLRQ�RI�µ����$¶�LV�FKRVHQ�IRU�WKH�deflector and ‘25-902’ for the screen(these are the locations indicated in the figure). The existing 3-meter long acceleratingstructure at ‘25-5A’ will be removed and the ‘25-5’ klystron used to power the deflector.
LCLS-TN-00-12
deflectingstructure
screen
Figure 3. Vertical trajectory of beam centroid in LCLS for a 20-MV rf deflector at ϕ § 3.3Û���7KH�VHFRQGbunch compressor is located at far left in the plot. The trajectory amplitude used here is an extreme case.
Figure 4. Vertical vs. longitudinal space in LCLS for = 3.3Û��OHIW��DQG�IRU� = í 3.3Û��ULJKW����7KH�UPVbeam size on the screen varies from 296 m (left) to 249 m (right), due to wakes of the 1-nC charge, and a
time-correlated rms momentum spread of 0.6 %. The two-phase averaging technique mitigates these
effects (bunch head at left where z < 0).
LCLS-TN-00-12
Figure 4 shows the effect of the 20-MV vertical deflector for the case with ϕ § 3.3Û�DQGfor ϕ § í 3.3Û�� �7KH�SDUDPHWHUV�DUH�WKRVH�JLYHQ�LQ�Table 1. The figure is split in twoparts and shows three plots per side. At upper left is the bunch population in y-z space.At upper right and lower left are the vertical and temporal (z) projected distributions,respectively (note the 24 m rms bunch length). The particle tracking is performed usingthe computer code Elegant, written by Michael Borland at ANL [11], and includeswakefields, second-order optical effects of momentum deviations, and the sinusoidal timevariation of the accelerating and deflecting rf fields.
Table 1. LCLS simulation parameters with an 8-foot long S-band deflecting structure.
Parameter symbol value unit
RF deflector voltage V0 20 MV
Peak input power P0 25 MW
RF deflector phase (crest at 90°) 3.3 deg
Nominal beam size σx0 80 m
Beam size with deflector on (two-phase mean) σx 272 m
Beta function at deflector d 58 m
Beta function at screen s 63 m
Betatron phase from deflector to screen 60 deg
Normalized rms emittance N 1 m
Beam energy at deflector Ed 5.4 GeV
Beam energy at screen Es 6.2 GeV
RMS bunch length σz 24 m
The sign of the induced y-z correlation is flipped, and the measured beam size is changedby switching phases (as in Eq. (15), but also including wakefields), but the centroid kickis not changed [see Eq. (8)]. The time-correlated rms momentum spread used here is0.6 % (bunch head lower energy than tail). By averaging the two beam sizemeasurements, the bunch length can be accurately calculated without any significant biasform the wakefield or momentum spread effects shown here. The accuracy of thisaveraging technique can also be cross-checked by moving the screen on-axis and settingthe rf phase to zero. A remotely moveable screen is therefore a desirable feature.
The rms bunch length of 24 m is accurately calculated from this simulation using theaverage of the beam sizes in Figure 4, the parameters of Table 1, and Eq. (13), whereEd § 5.4 GeV and Es § 6.2 GeV. With the nominal spot size also measured on the samescreen (by switching off the rf deflector and moving the screen on-axis, or by setting thephase on rf crest at reduced voltage), the nominal distribution can be deconvolved fromthe vertical distributions in Figure 4, and the temporal distribution can be reconstructed
LCLS-TN-00-12
with significant precision at scales approaching 20 fsec. Even without the deconvolution,some of the temporal distribution is already evident in the measured vertical distribution.
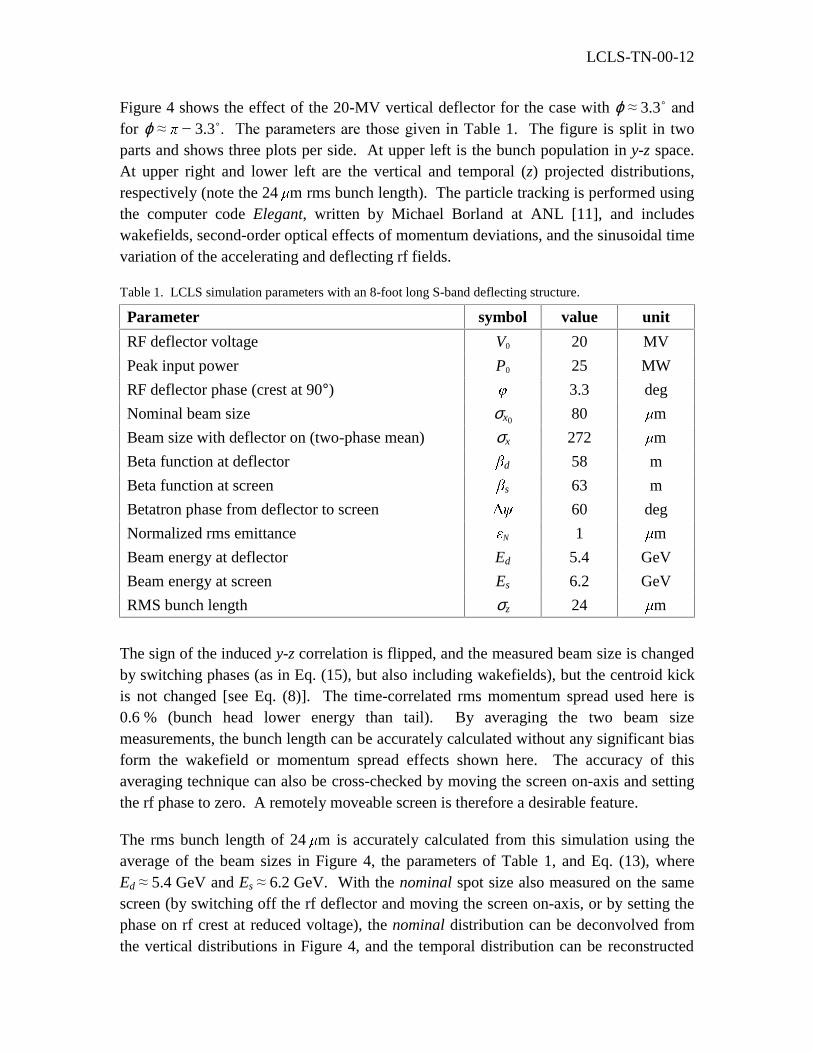
Figure 5 shows a simulation of the screen’s x-y images with deflector off and on. Theeffect of the deflector is very clear. In this case, there are no misalignments upstream ofthe deflector, so the horizontal and vertical emittances are the nominal value of 1 m.
Figure 5. Vertical vs. horizontal space on LCLS screen for V0 = 0 (left) and for V0 = 20 MV (right). The
rms vertical beam size on the screen is 80 m (left) and 296 m (right). The are no misalignments here.
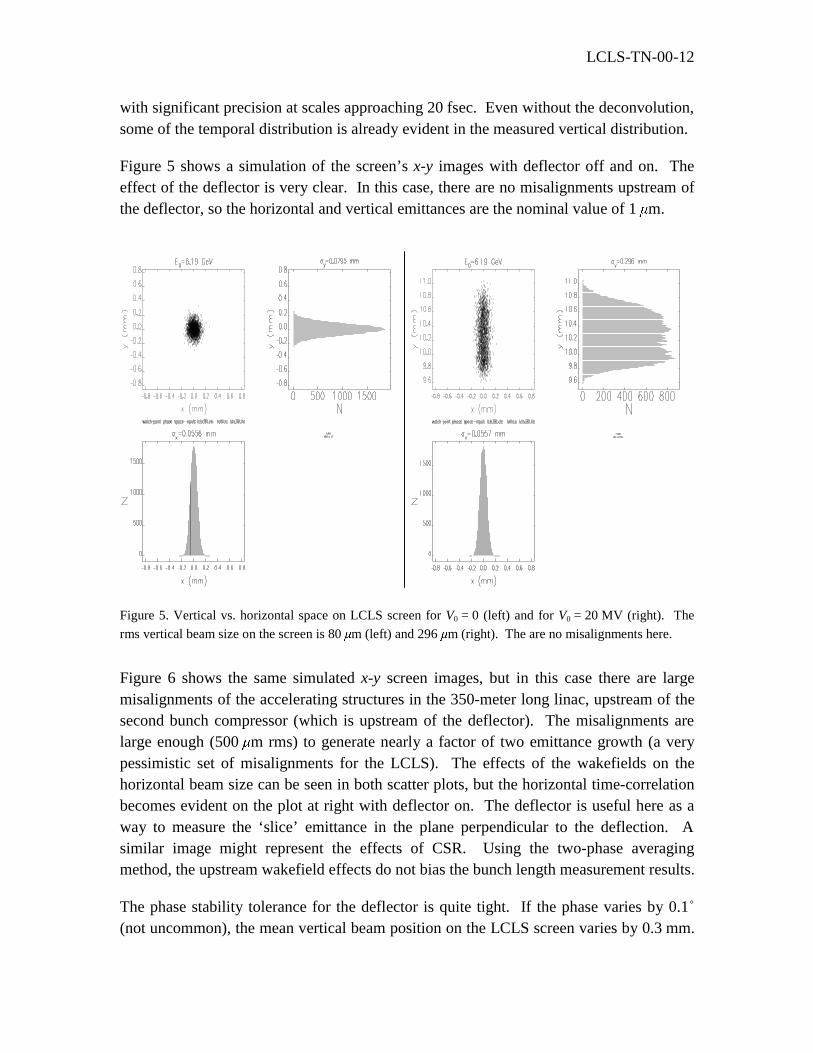
Figure 6 shows the same simulated x-y screen images, but in this case there are largemisalignments of the accelerating structures in the 350-meter long linac, upstream of thesecond bunch compressor (which is upstream of the deflector). The misalignments arelarge enough (500 m rms) to generate nearly a factor of two emittance growth (a verypessimistic set of misalignments for the LCLS). The effects of the wakefields on thehorizontal beam size can be seen in both scatter plots, but the horizontal time-correlationbecomes evident on the plot at right with deflector on. The deflector is useful here as away to measure the ‘slice’ emittance in the plane perpendicular to the deflection. Asimilar image might represent the effects of CSR. Using the two-phase averagingmethod, the upstream wakefield effects do not bias the bunch length measurement results.
The phase stability tolerance for the deflector is quite tight. If the phase varies by 0.1Û(not uncommon), the mean vertical beam position on the LCLS screen varies by 0.3 mm.
LCLS-TN-00-12
For a single-shot measurement, however, good stability of the mean position is notcritically required, and in addition, the calculated bunch length in Eq. (13) is veryinsensitive to the precise phase near the zero-crossing. In fact, with sufficient phasestability or with independent phase measurement, the variation of the mean position onthe screen (from shot to shot, or by varying some interesting upstream parameter) can beused to diagnose the variation in beam arrival time at the deflector. Such a timingmeasurement can, for example, be used to measure the value of the R56 in the upstreamchicane(s).
Figure 6. Vertical vs. horizontal space on LCLS screen for V0 = 0 (left) and for V0 = 20 MV (right). The
rms vertical beam size on the screen is 102 m (left) and 304 m (right). In this case, there are large
misalignments included upstream of the deflector which generate nearly a factor of two emittance increase.
6 Application in the SLAC Linac with Damping Ring
The same deflecting structure can also be applied to the existing SLAC linac. With abunch length of 600 m (in its shortest configuration) and a vertical emittance from theuncoupled damping ring of 5 m, an S-band deflector can be very efficient. Table 2 listssome possible parameters for an 8-foot vertical deflector in the SLAC linac.
The deflector is located in linac-sector-29 at ‘29-4D’ and the screen is located at ‘29-902’. This is ideal, since no accelerator section is presently located at ‘29-4D’ and aremotely moveable screen, and associated controls, already exist at ‘29-902’.
LCLS-TN-00-12
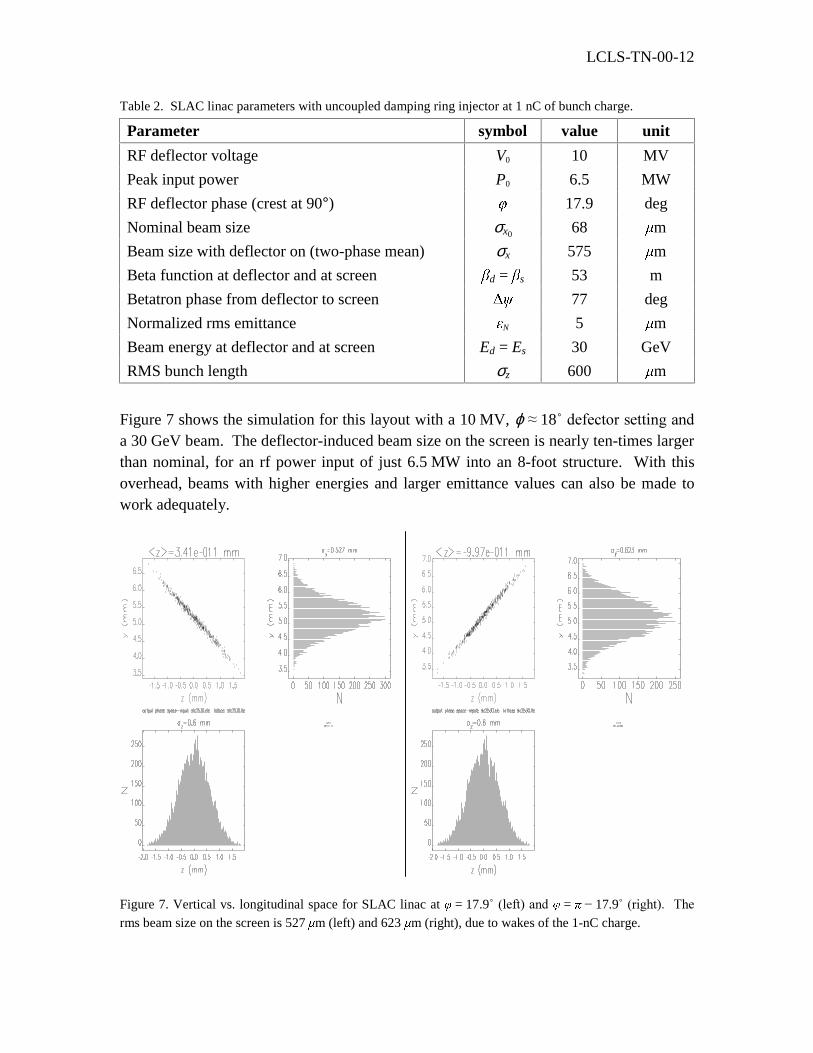
Table 2. SLAC linac parameters with uncoupled damping ring injector at 1 nC of bunch charge.
Parameter symbol value unit
RF deflector voltage V0 10 MV
Peak input power P0 6.5 MW
RF deflector phase (crest at 90°) 17.9 deg
Nominal beam size σx0 68 m
Beam size with deflector on (two-phase mean) σx 575 m
Beta function at deflector and at screen d = s 53 m
Betatron phase from deflector to screen 77 deg
Normalized rms emittance N 5 m
Beam energy at deflector and at screen Ed = Es 30 GeV
RMS bunch length σz 600 m
Figure 7 shows the simulation for this layout with a 10 MV, ϕ § 18Û�GHIHFWRU�VHWWLQJ�DQGa 30 GeV beam. The deflector-induced beam size on the screen is nearly ten-times largerthan nominal, for an rf power input of just 6.5 MW into an 8-foot structure. With thisoverhead, beams with higher energies and larger emittance values can also be made towork adequately.
Figure 7. Vertical vs. longitudinal space for SLAC linac at = 17.9Û��OHIW��DQG� = í 17.9Û��ULJKW��� �7KHrms beam size on the screen is 527 m (left) and 623 m (right), due to wakes of the 1-nC charge.
LCLS-TN-00-12
With the long bunch, care should be taken that the transverse wakefields generatedbetween deflector and screen do not greatly bias the bunch length measurement results.The wakes are included in the simulation shown here, and are not a significant problem at1 nC (6.2×10⁹ ppb). At a much higher bunch charge the centroid offset might best beremoved (ϕ § 0) and the screen moved on axis in order to alleviate the wakefield effect.The rms momentum spread used in this simulation is 0.6 % with a fairly linear correlationalong the beam core (bunch head is at higher energy than tail).
It may also be interesting to use the existing vertical collimator at the ‘29-903’ location(downstream of the deflector) to ‘cut’ the vertical spot size and therefore ‘cut-down’ thebunch length. Of course, the vertical pitch (i.e. the y-z correlation) will still be intact afterthe cut, so a second deflector would be needed downstream to remove this.
7 Application in the NLC
The same deflecting structure can also be applied to the NLC. With a bunch length of90 m (in the shortest NLC configuration) and an extremely small vertical emittance, anS-band deflector can be very efficient. Table 3 lists some possible parameters for theNLC solution.
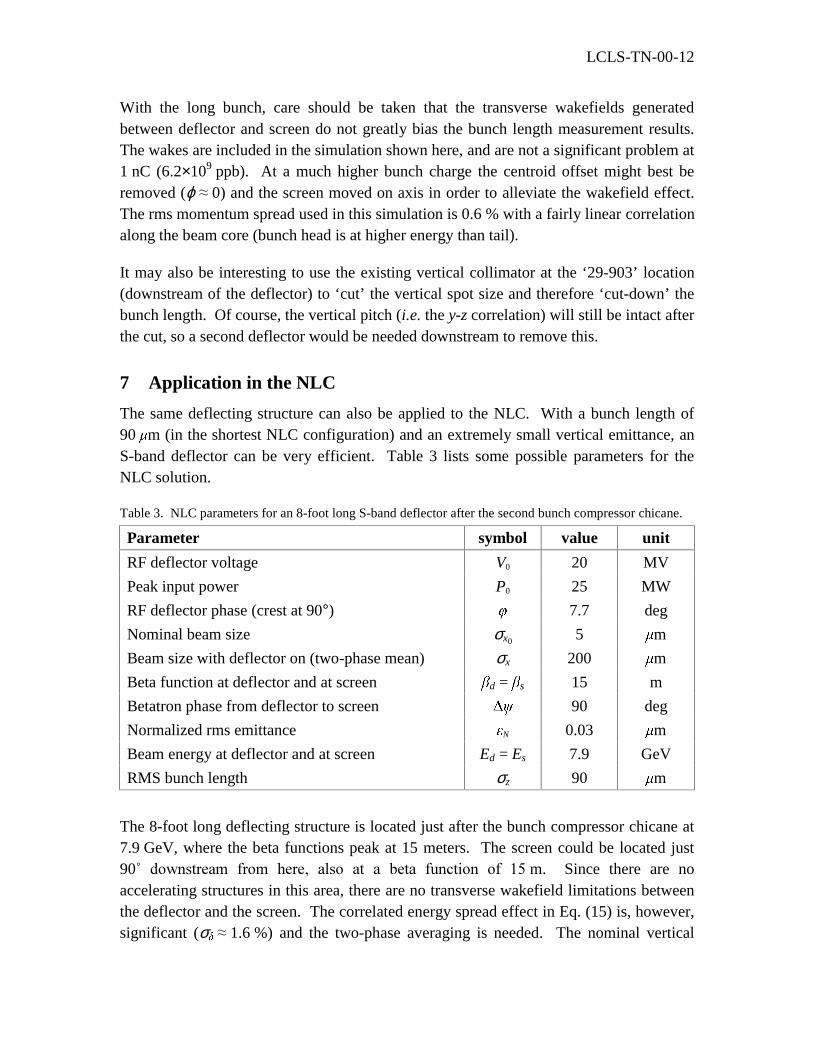
Table 3. NLC parameters for an 8-foot long S-band deflector after the second bunch compressor chicane.
Parameter symbol value unit
RF deflector voltage V0 20 MV
Peak input power P0 25 MW
RF deflector phase (crest at 90°) 7.7 deg
Nominal beam size σx0 5 m
Beam size with deflector on (two-phase mean) σx 200 m
Beta function at deflector and at screen d = s 15 m
Betatron phase from deflector to screen 90 deg
Normalized rms emittance N 0.03 m
Beam energy at deflector and at screen Ed = Es 7.9 GeV
RMS bunch length σz 90 m
The 8-foot long deflecting structure is located just after the bunch compressor chicane at7.9 GeV, where the beta functions peak at 15 meters. The screen could be located just90Û� GRZQVWUHDP� IURP� KHUH�� DOVR� DW� D� EHWD� IXQFWLRQ� RI� �� m. Since there are noaccelerating structures in this area, there are no transverse wakefield limitations betweenthe deflector and the screen. The correlated energy spread effect in Eq. (15) is, however,significant (σ § 1.6 %) and the two-phase averaging is needed. The nominal vertical
LCLS-TN-00-12
beam size is 5 m, while the average beam size measured with a 20 MV deflectingvoltage is 200 m. In this case, the nominal beam size is insignificant and nodeconvolution is needed to resolve the temporal distribution.
8 Phase Space Diagnostic
As shown in Figure 6, the temporal structure of the horizontal emittance can be viewedusing the vertical deflector. If at least two additional screens are added with appropriatehorizontal phase advance, the horizontal slice emittance might also be measured. Thevertical slice emittance could be measured by adding a second structure, as a horizontaldeflector, where the horizontal beta functions are large.
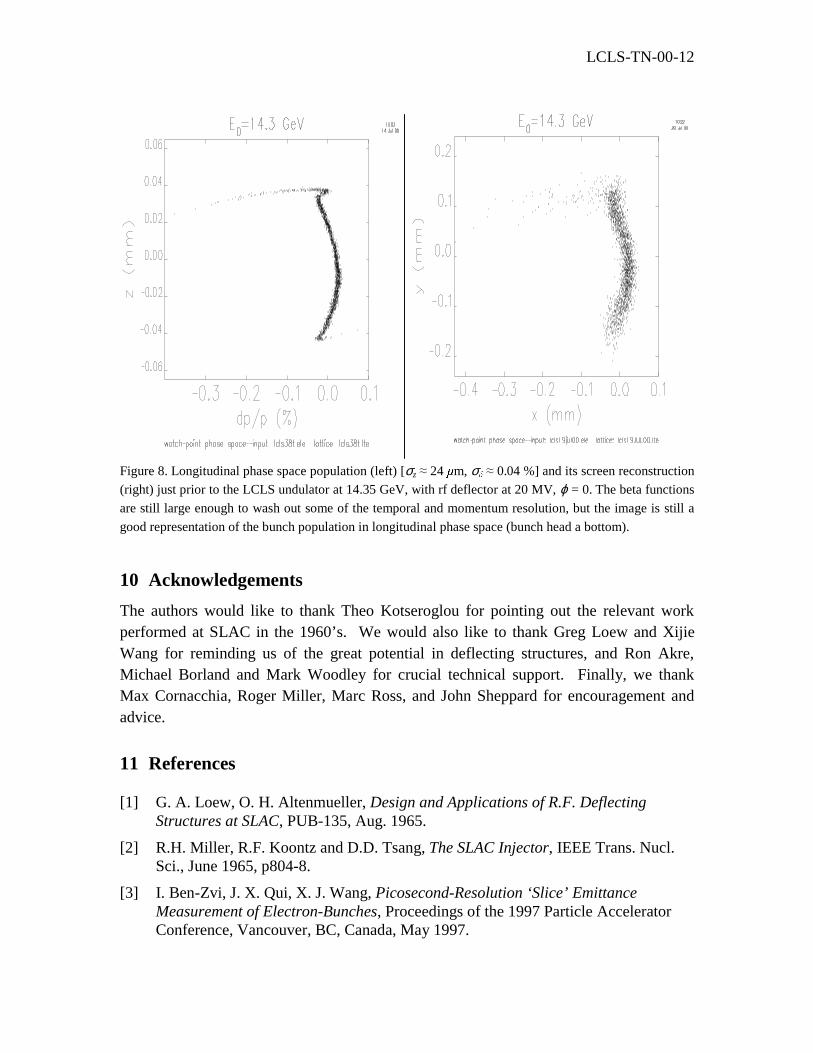
The rf deflector can also be used to make a direct measurement of the details of theelectron bunch population in longitudinal phase space. This is done by installing anotherscreen, downstream of the deflector, at a location of large horizontal momentumdispersion. If the horizontal beta function is small enough, then the horizontal beamextent across the screen represents the momentum spread in the beam. By switching onthe transverse rf as a vertical deflector and allowing the ‘pitched’ bunch to propagate tothis new screen, the vertical extent across the screen represents the time axis along thebunch. This may require a zero-crossing rf phase (i.e. ϕ = 0 or ϕ = ) so that little or notrajectory kick is induced over the potentially long distance to the new screen. This alsorequires the vertical phase advance between deflector and dispersion screen to beapproximately /2 + Q . Figure 8 shows a simulation of this process through the LCLS,where the deflector is at the ‘25-5A’ location, as described previously, and the screen islocated 760-meters downstream at a location with momentum dispersion § 10 cm andbeta functions of x § 1.8 m, and y § 10.7 m. The beta functions are still large enoughto wash out some of the temporal and momentum resolution, but the image is still a fairlygood representation of the bunch population in longitudinal phase space.
9 Summary
The use of transverse deflecting structures to measure micro-bunch lengths in future FELand linear collider projects looks quite promising. The measurements are absolute,require one or two beam pulses, and are based on measuring the electron beam size withan intercepting screen. Off-axis pulse-stealing schemes can be imagined whichcontinually monitor the fine time structure of the bunch. More detailed phase spacediagnostics can be arranged by adding additional screens at various betatron phasesand/or locations of significant momentum dispersion. The immediate availability ofseveral traveling wave S-band deflecting structures at SLAC makes their use ofimmediate interest for the LCLS, the NLC, and the present SLAC linac.
LCLS-TN-00-12
Figure 8. Longitudinal phase space population (left) [σz § 24 m, σ § 0.04 %] and its screen reconstruction
(right) just prior to the LCLS undulator at 14.35 GeV, with rf deflector at 20 MV, ϕ = 0. The beta functions
are still large enough to wash out some of the temporal and momentum resolution, but the image is still a
good representation of the bunch population in longitudinal phase space (bunch head a bottom).
10 Acknowledgements
The authors would like to thank Theo Kotseroglou for pointing out the relevant workperformed at SLAC in the 1960’s. We would also like to thank Greg Loew and XijieWang for reminding us of the great potential in deflecting structures, and Ron Akre,Michael Borland and Mark Woodley for crucial technical support. Finally, we thankMax Cornacchia, Roger Miller, Marc Ross, and John Sheppard for encouragement andadvice.
11 References
[1] G. A. Loew, O. H. Altenmueller, Design and Applications of R.F. DeflectingStructures at SLAC, PUB-135, Aug. 1965.
[2] R.H. Miller, R.F. Koontz and D.D. Tsang, The SLAC Injector, IEEE Trans. Nucl.Sci., June 1965, p804-8.
[3] I. Ben-Zvi, J. X. Qui, X. J. Wang, Picosecond-Resolution ‘Slice’ EmittanceMeasurement of Electron-Bunches, Proceedings of the 1997 Particle AcceleratorConference, Vancouver, BC, Canada, May 1997.
LCLS-TN-00-12
[4] O. H. Altenmueller, R. R. Larsen, and G. A. Loew, Investigations of Traveling-Wave Separators for the Stanford Two-Mile Linear Accelerator, The Review ofScientific Instruments, Vol. 35, Number 4, April 1964.
[5] LCLS Design Study Report, SLAC-R-521, (1998).
[6] Zeroth-order Design Report for the Next Linear Collider, SLAC-REP-474, May1996.
[7] X.-J. Wang, Producing and Measuring Small Electron Bunches, Proceedings of the1999 Particle Accelerator Conference, New York, NY, March 1999.
[8] G. A. Loew, private communication.
[9] H. Hahn and H. J. Halama, Design of the Deflector for the R.F. Beam Separator atthe Brookhaven AGS, BNL-9306, 1965.
[10] D. Dowell, private communication.
[11] M. Borland, private communication.


![Wake Fields Generated by the LOLA-IV · Pisarenko method [7]. 2 LONGITUDINAL WAKE FUNCTION OF LOLA-IV STRUCTURE The LOLA-IV transverse deflecting cavity has to be used as a diagnostic](https://img.pdfslide.us/doc/110x75/5e4eb8515c4a476d74598301/wake-fields-generated-by-the-lola-iv-pisarenko-method-7-2-longitudinal-wake-function.jpg)